Embed Size (px)
Citation preview

~ 1 ~
The University Journal Volume 1 Issue 3 2019 ISSN: 2519 – 0997 (Print)
Consumer Ethnocentrism and Attitudes towards Local Products: A Case of Kenyan Consumers
Peter N. Kiriri
Chandaria School of Business, United States international University – Africa, Nairobi, Kenya; Email: [email protected]
Abstract This paper entails a study that was conducted to investigate the existence of consumer ethnocentrism and the attitudes towards locally made products among Kenyan consumers. The study is founded on the different perspectives of consumer attitudes towards domestic and foreign made products. The sample for this study was drawn from adult customers who live in Nairobi. Altogether, the study sampled 385 respondents to whom questionnaires were distributed and, 315 completed and returned for analysis. The consumer ethnocentric tendency was measured using the consumer ethnocentrism scale developed by Shimp and Sharma in 1987 while consumer attitude was measured using a scale derived from the literature. Cronbach’s Alpha values of each construct confirmed that a good reliability existed, hence appropriate to make inferences. Principle component analysis was employed to determine the important factors affecting consumer attitudes. Four components were identified through confirmatory factor analyses which were labelled as: Patriotism; Economic Impact; Foreign Products; and, Made in Kenya Attitude. A structural equation model was developed showing the relationships between consumer ethnocentrism components and attitude towards made in Kenya products. Consistent with other African studies, it was found that the Kenyan consumers were not ethnocentric. They were however concerned with the impact of foreign products to the economy and especially on employment. On the other hand, Kenyans were found to be xenocentric (preference for foreign made products).
Keywords: Consumer Ethnocentrism, Xenocentric, Consumer Behaviour, Attitude, CETSCALE, Kenya
Introduction The marketing environment has witnessed drastic changes over the years (Kotler & Keller, 2012). This has been driven largely by globalization and technological changes. As a result, physical boundaries have either become inconsequential to business or barriers previously hampering business eliminated. Due to this there has been more flow of foreign manufactured products into domestic markets. The foreign manufacture products have not only provided competition to domestic products but have also afforded consumers a platform of comparison and choice (Pentz, 2011). Local manufacturers have had to deal with the influx of foreign based products which in some cases have a price, quality and perception advantage over local ones.
Consumers being faced with an increased choice of both domestic and imported products have to make a decision (Makanyeza & du Toit, 2016). This decision is highly influenced by consumer attitudes towards such products. Differently, consumers may perceive domestic products as either superior or inferior compared to imported products. Consumers also relate different product usage to status and thus would prefer products that confer them an elevated status (Schiman & Kanuk, 2004). It is therefore important for marketers to understand consumer’s attitudes and preferences towards foreign products as well as domestic products.
Cite: Kiriri, P. N. (2019). Consumer Ethnocentrism and Attitudes towards Local Products: A Case of Kenyan Consumers. The University Journal, 1(3), 1-18.
~ 2 ~
Kiriri Consumer Ethnocentrism and Attitudes …
Kenya, a developing country in Eastern Africa is the largest economy in the region and has witnessed a relatively stable economic growth in the recent past (African Development Bank, 2018). As a result, there have been improved standards of living of the citizens. This has led to the flooding of foreign products in the market. The foreign products have led to some domestic manufacturers scaling down production while others have either stopped producing goods altogether or have opted to import finished products (KIPPRA, 2017). This study intends to understand the ethnocentric tendencies of Kenyans and their attitudes towards products made in Kenya.
Background to the Study
Consumer Behavior Schiffman and Kanuk (2007) defined consumer behaviour as being the behaviour that consumers display in searching for, purchasing, using, evaluation, and disposing of products and services that expect will satisfy their needs. Consumer behaviour involves the actions or inactions emanating from a consumer in a product buying process. Such actions can be positive or negative depending on the product evaluation process a consumer goes through. As such, this behaviour refers to the act of buying a product or service that may involve a search of information relevant to a purchase decision, selection of buy outlet or product provider, and other actions performed prior to, and in the process of, a purchase (Ajzen, 2008). Bennett (1995) defined consumer behaviour as the dynamic interaction of affect and cognition, behaviour, and environmental events by which human beings conduct the exchange aspects of their lives. According to Solomon et al. (2006), consumer behaviour is the processes involved when individuals or groups select, purchase, use, or dispose of products, services, idea or experiences to satisfy their perceived needs and desire.
According to Kotler and Keller (2012), consumer behaviour involves the understanding of how individuals, groups, and organizations select, buy, use, and dispose of goods, services, ideas, or experiences to satisfy their needs and wants. In the decision-making process, the consumer’s buying behavior is influenced by many factors including cultural, social, and personal factors with cultural factors being the most dominant in influencing the purchase decision. It is an individual’s culture that influences the dominant beliefs that in turn direct behavior. Different countries exhibit different cultural orientations that affect the decisions made by consumers in that country. It is therefore imperative for marketers to closely attend to cultural values in every country they are in so as to understand how to best market their existing products and find opportunities for new products (Kotler & Keller, 2012). In terms of social factors, consumer buying behaviour is influenced by factors such as reference groups, family, and social roles and statuses in the society. On personal factors, consumers are influenced by age and stage in the life cycle, their occupation, income levels, personality and self-concept, and lifestyle and values.
Attitude Attitude has been researched over a period of time by both theorists and psychologist in order to understand what drives behavior. Researchers have established a connection between attitude and behaviour. Jansson (2010) and, Ajzen and Fishbein (2000) assert that attitude explains behaviour in a way that no other variable does. Attitude can be described as a person’s enduring favourable or unfavourable evaluations, emotional feelings, and action tendencies toward some object or idea (Kotler & Keller, 2012). Attitudes are an expression of an individual’s inner feelings that reflect whether a person is favorably or unfavorably predisposed to some object such as a brand, a service, or a retail establishment (Schiffman & Kanuk, 2004). Fishbein and Ajzen (1975) defines attitude as a concept that guides or influences behaviour and therefore are critical predictors to human behaviour. They also note that in the paradigm of attitudes, beliefs play a crucial role as they are the best measure of a person’s attitudes. Attitudes have also been defined as learned

~ 3 ~
The University Journal Volume 1 Issue 3 2019 ISSN: 2519 – 0997 (Print)
predispositions to respond to an object or class of objects in a consistently favourable or unfavourable manner. Hogg and Vaughn (2005) describe attitude as an organization of personal beliefs, feelings and behavioural tendencies that they have towards groups, objects, events or symbols that are of social significance.
Attitude has three components. According to McLoed (2018), the three components include: Cognitive component involving beliefs, knowledge, understanding and thinking about an object; Affective component which involves a person’s feelings, emotions and motivations about an object; and Behavioural component which describes the visible component of attitude in form of actions and behaviour towards an object (Sharma, 2015). Based on the three components, an individual’s actions to buy or not to buy are influenced by the beliefs and knowledge they have towards a particular product (cognitive) and their feelings or emotions either positive or negative about the product (affection). The combination of the three components as a result has an effect on consumer behaviour and attitudes towards domestic versus foreign based products.
Critical to the discussion of attitude is how it’s measured. According to Fishbein & Ajzen (1975) the two main attitude measurements are a person's preference for a given object (e.g., like-dislike) or his/her favorability with respect to the object (e.g., favorable-unfavorable, approve-disapprove). The key driver to the buying decision is the attitude the consumer has towards the product, the manufacturer or even the provider. When consumers have to make a decision between competing alternative products, they are more likely to choose a product to which they have a positive attitude and shun that which they have a negative attitude (Ajzen, 2008). In the current study, attitude is measured in line with the perception Kenyans have towards those products made in Kenya.
Literature Review Consumer Attitude Consumer attitude can be defined as a favourable or unfavourable tendency toward the characteristics of a particular object, which will affect the tendency of consumers to behave predictably in relation to that object (Anchor & Kouřilová, 2009). According to Kotler and Keller (2012), Consumer decisions are also influenced by their core values which are the belief systems that underlie attitudes and behaviors and that core values go much deeper than behaviour or attitude and determine, at a basic level, people’s choices and desires over the long term.
Consumer attitudes are a composite of a consumer’s beliefs about, feelings about, and behavioral intentions toward a brand or marketing organisation and its facilities. Based on the components of attitude identified, in relation to beliefs, consumers develop either positive and negative beliefs about products or at times a belief of indifference/neutral. A belief is a descriptive thought that a person holds about something or phenomenon. The beliefs differ among customers based on their level of knowledge and past experience or learning about the products. The belief system in a consumer dictates how to perceive a situation.
On the other hand, the affective component of attitude means consumers hold certain feelings towards products. Research has identified emotional connections between products and customers. Product like or dislike is highly influenced by the nature of emotions consumers develop towards products. This influences their decision-making process. Having developed some beliefs and feelings/emotions towards products, consumers act in line with the beliefs and emotions. The beliefs and emotions drive the consumer’s behavioral intentions and this dictates the action that the consumer takes in relation to the products being evaluated.

~ 4 ~
Kiriri Consumer Ethnocentrism and Attitudes …
In terms of a global perspective, consumers exhibit three types of attitudes that can be used to categorize their identity and behaviour. According to Prince, Davies, Cleveland and Palihawadana (2016), the three types correspond to home country preference (consumer ethnocentrism), foreign country preference (consumer xenocentrism) and global identity (consumer cosmopolitanism). Such identities influence the final decision made by a consumer in the purchase situation. Whether to purchase domestic products, foreign products or a more rational decision based on objective product selection criteria and not being influenced by the country of origin effects. Consumers thus exhibit different attitudes towards domestic and foreign products. While some consumers have a preference for domestically made products, others develop a preference for foreign products. Such preferences are determined by the consumer attitudes towards the products.
Attitudes towards Foreign Made Products
Product attitude is defined as consumers overall evaluative judgment of products’ attributes such as a brand and quality (Erdogan & Uzkurt, 2010). According to Wanninayake and Miloslava (2012), most brand characteristics are normally associated with its country of origin. During the consumer decision making process, consumers have to evaluate different products to make a choice. In most situations, the decision making is subjected to both rational and irrational evaluative criteria. Country of origin could be described as a subjective criterion that highly influences consumer choice regardless of other elements including quality and pricing. Yarpak and Baughan (1991) found that CE significantly influences the preferences of consumers, during the product purchase process by affecting the formation of positive or negative purchasing intentions.
Authors such as Lantz & Loeb (1996) indicated that country of origin was more important than the products characteristics such as the brand name, price and quality in influencing the purchase decision making process. This may be contrary to other findings that indicate the contrary where consumer prefer domestic product as opposed to the foreign products based on quality, pricing and patriotic tendencies. In most cases, consumers in the developing countries prefer imported products as a result of the perception that products manufactured in the developed world are of high quality and confer a status element as a result. In developed countries research has consistently found that there is a preference for products manufactured in the home country compared to those produced in a foreign country (Ibrahim & Gomez, 2018). Consumers in developing markets are increasingly faced with a choice between older local brands and newer nonlocal or foreign brands (Batra et al., 2000). Attitude helps predict how and why consumers in developing markets choose between older, local brands and newer, foreign or nonlocal brands.
According to Chryssochoidis, Athanassios and Panagiotis (2007), the impact of CE depends on the level of development of consumers’ home country. Researchers such as Wang and Chen (2004), Chryssochoidis et al. (2007) have indicated that consumers from a developed country tend to appreciate more favourably domestic products over imported ones with the reverse being observed in developing countries, where consumers perceive foreign products (especially those originating to prestigious countries) as superior compared to their domestic counterparts. Consumers in developing countries often seek to emulate the apparently glamorous Western consumption practices and lifestyles and purchase the brands they are exposed to through different media, movies Western tourists, and when the citizens of a country travel abroad. Some consumers view foreign products as presenting them with a high status while local products may be seen to confer a diminished status, whereas some have strong negative feelings about foreign products based on their perception of the country of origin.

~ 5 ~
The University Journal Volume 1 Issue 3 2019 ISSN: 2519 – 0997 (Print)
Consumers’ attitudes toward imports from various countries can vary significantly from one country to another. Even consumers in the same country can have significantly different perceptions of the country-of-origin. Studies in Africa have also found different levels of attitudes towards local products. In West Africa, Nigeria specifically, Okechuku and Onyemah (1999) found that Nigerian consumers have a negative image of the “Made in Nigeria” label, rating it much lower than labels from more economically developed countries. Other studies that found Nigerians to prefer imported brands include Agbonifoh and Elimimian (1999), Festervand and Sokoya (1994), Lysonski and Durvasula, (2013). In Ghana, Saffu and Walker (2006) found that Ghanians were moderately ethnocentric with lower preference for products made in Ghana. Another study in Ghana by Opoku and Akorli (2009) found that the country of origin was more important than price and other product attributes and at least as important as brand name, in the Ghanaian consumer choice; the Ghanaian consumer holds the 'Made in Ghana' label in low regard relative to foreign labels; and superior quality and consumer taste are the two most important reasons for the Ghanaian consumer preference for foreign products. John and Brady (2011) found a preference for foreign products over local products amongst Mozambicans. However, consumers in Zimbabwe had a preference for domestic products (Makanyeza & du Toit, 2016) as had consumers in South Africa (Pentz, 2011). In Tanzania, Kisawike (2015) found that Tanzania consumers were less ethnocentric and as such preferred foreign products as opposed to domestic products.
In Kenya, Maina, Kibera and Munyoki (2015) found that most Kenyans had a high preference for local commercial bank services as opposed to those from foreign owned commercial banks. However, there is a dearth of studies that focused on the attitudes of Kenyans in relation to foreign products, leading to the current study which will address the ethnocentrism and attitudes of consumers towards local products in the Kenyan market. The study is drawn upon the hypothesis that:
H1: Kenya consumers have high ethnocentric tendencies.
Attitudes towards Domestic Products (Xenocentrism)
Consumers can possess either positive or negative attitudes towards domestic products. Where foreign products are preferred over domestic products, consumers then have a low level of ethnocentrism. According to Prince et al. (2016), preference for foreign products is as a result of high xenophobic tendencies (xenocentrism). Xenocentrism involves the tendency of a person to view their home culture as being inferior and therefore want to adopt a foreign culture seen to be superior (Lawrence, 2012; Mueller et al., 2010). Therefore, xenocentrism is about the preference and adaptation of another group’s perspective as opposed to your own (Prince et al., 2016) as a result of viewing one’s home culture as being inferior leading to idealizing other cultures (Lawrence, 2012; Prince et al., 2016). Xenocentrism tendencies among consumers result in favouring foreign products over domestic products, even if the domestic products are of high quality compared to foreign products (Mueller & Broderick, 2009).
Oberecker, Riefler, and Diamantopoulos (2008) identified xenophilia as a possible antecedent of the consumer affinity construct. The consumer affinity construct could lead to an emotional attraction to the goods of a specific foreign country (Lawrence, 2012). In terms of the marketing then, consumer xenocentrism can be defined as individuals who prefer the products or services of a society other than their own (Lawrence, 2012). Consumers are attracted to foreign products because of underlying socio-psychological factors that automatically accord a status of prestige to foreign countries and, by association, their products (Howes, 1996).
~ 6 ~
Kiriri Consumer Ethnocentrism and Attitudes …
Among consumer groups, younger consumers tend to be more xenocentric compared to older consumers (Batra et al., 2000); wealthier consumers compared to those not economically well off also tend to be have more xenocentric tendencies (Belk, 2000). Similarly, Shultz et al. (1994) found that urban consumers were more xenocentric as opposed to rural based consumers. This could be attributed to the level of affluence, product availability and availability of information about foreign countries’ products and lifestyles. In Tanzania, a study by Kisawike (2015) found that older, less educated and rural based consumers were less xenocentric in purchasing anti-malarial remedies as compared to younger, educated and urban based consumers. The differences were as a result of peer influences, quality perceptions, information availability, pricing as well as trust in the country of origin (Kisawike, 2015). From the foregoing argument, the author drew a hypothesis that:
H2: Kenya consumers have high xenocentric tendencies.
Consumer Ethnocentrism
Consumer ethnocentrism was described as early as 1987 by Shimp and Sharma as beliefs held by consumers about the appropriateness, indeed morality, of purchasing foreign made products. In view of this, Schiman and Kanuk (2004) recognized the importance of consumer ethnocentrism as a trait that shapes consumers’ preferences toward foreign products. Consumer ethnocentrism presents as a barrier to the success of businesses in foreign markets (John & Brady, 2011; Tong & Li, 2013).
Ethnocentrism is defined as judging another culture solely by the values and standards of one's own culture (Quang et al., 2017). LeVine & Campbell (1972) cited by Quang et al. (2017) defined consumer ethnocentrism as being the symbols and values of one’s own ethnic or national group which become objects of pride and attachment, whereas symbols of other groups may become objects of contempt. Shimp & Sharma (1987) identify three key aspects of consumer ethnocentrism. These include consumers developing a sense of identity; instilling a sense of belongingness; and, ensuring that individuals appreciate a purchase behaviour that is acceptable or unacceptable within the group (Makanyeza & du Toit, 2016).
Various factors drive ethnocentric tendencies among different consumers. Primarily, the nationalistic factors which are more affective/emotional than cognitive; would make customers perceive themselves as being less patriotic when they purchase foreign based products as opposed to local products. On the other hand, some economic factors would lead to higher ethnocentric tendencies. Such factors include the perception that foreign made products hurts the domestic economy by driving domestic industries to close and thereby leading to citizens losing their jobs. When such a perception exists, then it makes the consumers develop negative attitudes towards products made in other countries.
According to Sau, Walker, & Mazurek (2010), ethnocentric consumers pay attention to country-of-origin information and are more likely to evaluate foreign products negatively than less ethnocentric consumers are. Klein et al. (1998) aver that preference by ethnocentric consumers for local products may be based on moral beliefs, as well as on belief that their own country produces the best products. It is also noted that ethnocentrism can lead to consumer preferring domestic to foreign products in the absence of any obvious reason for such a preference (Saffu, Walker, & Mazurek, 2010). According to Shimp and Sharma (1987), non-ethnocentric individuals evaluate foreign products mainly on the products merits without consideration of whether they are made locally or imported from abroad. Such consumers have been deemed to have ‘cosmopolitan’ orientation.

~ 7 ~
The University Journal Volume 1 Issue 3 2019 ISSN: 2519 – 0997 (Print)
Due to the importance of consumer ethnocentrism in international trade, measuring of its levels is of interest to marketers. Such would facilitate strategic marketing responses, such as product positioning and advertising strategies (Saffu and Walker, 2005). The CETSCALE has been the undisputed measurement tool since its development in 1987. It has been tested and modified in different countries both developed and developing.
Methodology The target population of this study comprised adult consumers above 18 years of age who in one way or the other made a purchase decision. This was important in order to ensure that the respondents had the experience of domestic and imported products. The sample for this study was drawn from adult customers who lived in Nairobi County, Kenya. Altogether, 385 questionnaires were randomly distributed to the target respondents. A structured questionnaire with three sections was developed to collect primary data. Section one collected demographic data which included age and gender while part two collected data on consumer ethnocentrism using the consumer ethnocentrism scale which is commonly known as the “CETSCALE” developed by Shimp and Sharma (1987). The CETSCALE has been validated in different cultures as well as in different contexts by previous researchers. The scale focused on attitudes of respondents towards locally made products.
The scale’s internal consistency was tested by using reliability analysis with Cronbach’s alpha (a minimum of 0.7 was deemed acceptable) (Mugenda & Mugenda, 2003) while the construct validity was tested by employing confirmatory factor analysis (CFA) which was performed using the structural equation modeling (SEM). CFA in structural equations modeling generate measures of overall fit of a given measurement model and provides useful information indicating how well convergent and discriminant validity are achieved (Hooper, Coughlan and Mullen, 2008; Karakaya – Ozyer & Aksu-Dunya, 2018).
Factor analysis was used to explore the data and its structure. To determine the number of factors to extract, the principal component analysis was used as the extraction method while the rotation method was oblique rotation, specifically Promax (Tabachnick & Fiddell, 2007) with Kaiser Normalization. After the factor analysis, confirmatory factor analysis (CFA) was performed to test the fit of the model used. Structure equation modelling (SEM) was then used to analyze structural relationships between measured variables and latent constructs.
According to Byrne (2010), SEM is considered as the most popular methodology for non-experimental researches due to its inherent characteristics over the conventional multivariate procedures and is a good technique in data analysis for inferential purposes. SEM also has the ability to assess or to correct the measurement errors in the variables. According to Hair et.al. (2010), SEM facilitates measuring the extent to which, the theory is associated with the reality represented by the empirical data.
Results and Discussion Demographic Profile
From the distributed questionnaires, 315 were returned and used in the final analysis, representing a response rate of 81.8%. From the responses, 54% of the respondents were males while 46% were females. In terms of the distribution of the respondent’s age, 2% were below 20 years; 55% between 20 – 30 years; 30% between 31 – 40 years; and, 13% over 40 years. In this study, the nature of the sample profile was adequate for analysis. The required sample size for scale validation as recommended by Tabachnick & Fidell (2007) and Hair et al. (2010) is a minimum of 200 respondents. This study surpassed the requirement and therefore was fit for analysis.

~ 8 ~
Kiriri Consumer Ethnocentrism and Attitudes …
Assessment of CETSCALE
According to Sekaran and Bougie (2011), reliability ensures consistent measurement across time and across various items in the instrument. Therefore, it is an indication of stability and consistency of measures. Sekaran and Bougie (2011) proposed the use of Cronbach’s alpha, being the most popular measurement of testing internal consistency and reliability of multi-point scale items. As an initial analysis, reliability analysis was done to measure internal consistency of the scale through the use of Cronbach Alpha Coefficients. The findings indicate adequate reliability of the scale by achieving a Cronbach Alpha of 0.80 against the set value of 9. A Cronbach alpha of 0.70 is considered acceptable (Mugenda & Mugenda, 2003).
The adequacy and suitability of the sample for factor analysis was checked using the Kaiser-Meyer-Olkin (KMO) measure. In this study KMO test was 0.820 fulfilling the requirements for adequacy of data for factor analysis which is above the 0.50 statistic recommended by Field (2009). The Bartlett's test of sphericity was also used. For factor analysis to be recommended, the Bartlett’s test of sphericity must be less than 0.05. In this study, data were suitable for performing EFA as indicated by the Bartlett’s test of sphericity yielding significance (p < 0.001, Approximate Chi-square of 1,705.88, with 153 degrees of freedom).
Factor Analysis
Based on the analysis, four factors emerged after satisfying the two required tests including the Kaiser criterion (eigen values greater than 1) and a scree plot. These four factors accounted for 56.3% of the total variance. In identifying the items loading on each component, 6 items were found not to satisfy the requirements for inclusion as their factor loadings were below the recommended 0.5. The items omitted were item B8 (we should purchase products manufactured in Kenya instead of letting other countries get rich off us); item B10 (there should be very little trading or purchasing of goods from other countries unless out of necessity); item B12 (restrictions should be put on all imports); itemC1 (I buy Kenyan brands/products whenever possible; item C2 (I enjoy buying Kenyan brands/products); and, item C3 (It is important to buy Kenyan brands/products). From the analysis, and based on the highest factor loadings of the remaining items, the first factor was composed of six items (3, 4, 2, 1, 9 and 13), the second factor was composed of five items (6, 11, 5, 17 and 7), the third factor was composed of four items (6, 4, 5 and 7), and the fourth factor had 3 items (15, 16, and 14).
In evaluating the items in each component, some themes arise. Factor 1 had items related to issues of patriotic feelings. This factor was named “Patriotism”. Factor 2 items related more to the issues of economic growth and the effects of imports on employment. This factor was as such named “Economic”. Factor 3 items were more about attitudes towards Kenyan products. This factor was named “Made in Kenya Attitude”. The fourth factor was more about circumstances under which foreign products should be availed. This factor was named “Foreign Products”. The table below provides the various items and their factor loadings.

~ 9 ~
The University Journal Volume 1 Issue 3 2019 ISSN: 2519 – 0997 (Print)
Table 1: Factor Analysis Component Loadings
Item Statement Factors 1 2 3 4
B3 Buy Kenyan-made products, keep Kenya working. .671 B4 Kenyan products, first, last and foremost. .665 B2 Only those products that are unavailable in Kenya should be
imported. .627
B1 Kenyan people should always buy Kenyan-made products instead of imports. .598
B9 It is always best to purchase Kenyan products. .577 B13 It may cost me in the long run but I prefer to support Kenyan
products. .535
B6 It is not right to purchase foreign products because it puts Kenyans out of jobs. .807
B11 Kenyans should not buy foreign products because it hurts Kenyan businesses and causes unemployment .776
B5 Purchasing foreign made products is un-Kenyan. .711 B17 Kenyan consumers who purchase products made in other
countries are responsible for putting their fellow Kenyan out of work.
.617
B7 A real Kenyan should always buy Kenyan-made products. .503 C6 Products made in Kenya are usually quite reliable and seem to
last the desired length of time .878
C4 Products made in Kenya are of high quality. .804 C5 Products made in Kenya show a very high degree of
technological advancement. .798
C7 Products made in Kenya are usually a good value for my money .695 B15 Foreign products should be taxed heavily to reduce their entry
into Kenya. .749
B16 We should obtain from foreign countries only those products that we cannot obtain within our own country .720
B14 Foreigners should not be allowed to put their products on our markets .566
The descriptive analysis indicated a mean score for consumer ethnocentrism as 2.01. The highest mean score for the factors was posted by economic factors (2.96), followed by made in Kenya attitude (2.63), foreign products (2.53) and lastly patriotism (2.49). Accordingly, on the overall, Kenyan consumers can be considered not to be ethnocentric. Amongst the 3 ethnocentric issues, the effect of foreign products on the economy was of the highest concern by Kenyans. In terms of attitudes towards products made in Kenya, it was prevalent that Kenyans did not have a positive attitude and could be considered to be more xenocentric as indicated in the Table 2.
Table 2: Descriptive Statistics
Mean Std. Deviation Skewness Kurtosis Consumer Ethnocentrism 2.0071 .42588 .257 -.458 Foreign Products 2.5320 .64474 .236 .665 Economic Impact 2.9606 .86217 .628 -.184 Patriotism 2.4917 .53104 .085 -.690 Made in Kenya Attitude 2.6297 .71881 -.091 .036

~ 10 ~
Kiriri Consumer Ethnocentrism and Attitudes …
Confirmatory Factor Analysis (CFA)
After the factor analysis, confirmatory factor analysis (CFA) was performed to test the fit of the scales. The scales’ construct validity was tested by employing CFA which was performed using the structural equation modeling (SEM). As mentioned above, the data set of the present study fulfills the basic assumptions to perform SEM in order to identify the structural relations of proposed model. According to Byrne (2009) CFA can be used to determine whether the sample data is compatible with the hypothesized model of the study. Maximum likelihood estimation procedure was selected as the best method to conduct CFA as normality is assured in the data set.
Several fit indices were used to test the model fit. According to Hair et al. (2010), there is no absolute value for the various fit indices to suggest a good fit. The values associated with acceptable models vary from situation to situation and depend considerably on the sample size, number of measured variables, and the communalities of the factors. The chi-square, degrees of freedom, the root mean square error of approximation (RMSEA), goodness of fit index (GFI), comparative fit index (CFI) were determined as recommended by Hair et al. (2010). The Chi-Square (χ2) value is the traditional measure for evaluating overall model fit (Hooper, Coughlan and Mullen, 2008) and assesses the magnitude of discrepancy between the sample and fitted covariances matrices’ (Hu & Bentler, 1999). A good model fit provides an insignificant result at a 0.05 threshold (Barrett, 2007). In assessing goodness of fit, the ratio of chi-square to degree of freedom (χ2/df) is used. According to Hooper et al. (2008), χ2/df should be less than 3 to indicate acceptable fit (Schreider, 2008). In this study, χ2/df was 2.675 indicating an acceptable fit for this model as it was less than the 3.
RMSEA has been regarded as one of the most informative fit indices by various scholars Diamantopoulos and Siguaw (2000) due to its sensitivity to the number of estimated parameters in the model. For the RMSEA, MacCallum, Browne, and Sugawara (1996) suggest that a RMSEA value of between 0.00 and 0.05 indicates a close model fit, a value of between 0.05 and 0.08 a reasonable fit, and a value of more than 0.08 a poor model fit. In the current study a RMSEA of 0.047 was achieved indicating a reasonable model fit.
The Goodness-of-Fit statistic (GFI) calculates the proportion of variance that is accounted for by the estimated population covariance (Tabachnick & Fidell, 2007). This statistic ranges from 0 to 1 with larger samples increasing its value (Hooper et al., 2008). In this study, a GFI of .941 was achieved, which was below 1.0 indicating a model fit.
The Comparative Fit Index (CFI) is an index which takes into account sample size (Byrne, 2009) and performs well even when sample size is small (Tabachnick & Fidell, 2007). Its values range between 0.0 and 1.0 with values closer to 1.0 indicating a good fit (Hooper et al., 2008). The CFI of this study was .944 indicating a good model fit. The various indices are provided in Table 3 below.
Table 3. Goodness of Fit Indices – revised table
Measurement Index Chi- square (χ2) 345.121 Degree of freedom 129 χ2/df 2.675 RMSEA .047 GFI .941 CFI .944

~ 11 ~
The University Journal Volume 1 Issue 3 2019 ISSN: 2519 – 0997 (Print)
Assessing Validity of CETSCALE Measures
After EFA, it has been recommended that scale validity is undertaken and specifically construct validity. In order to assess a scale measures, Confirmatory Factor Analysis (CFA) is recommended. CFA is appropriate to test both discriminant and convergent validity of factors (Jöreskog, 1969). CFA analysis was undertaken using SPSS AMOS software.
Convergent Validity Fornell and Larcker (1981) developed a criterion that is used in assessing the degree of shared variance among variables. Accordingly, the convergent validity of the measurement model can be assessed by the Average Variance Extracted (AVE) and Composite Reliability (CR) (Alarcon & Sanchez, 2015). On the other hand, AVE measures the level of variance captured by a construct versus the level due to measurement error. The recommended values of AVE should be above 0.7 even though some authors have said the level of 0.5 is also acceptable. In this paper, the AVE for each construct was determined and assessed against its correlation with the others. In this case, in order to ensure convergent validity, the AVE had to be above the construct’s correlation with other constructs (Gefen et al., 2000). In testing of CETSCALE, the AVE scores obtained were: 0.53 (Economic Impact), 0.46 (Patriotism), 0.52 (Made in Kenya Attitude) and 0.52 (Foreign Products). All the loadings were significant. On the other hand, all the factors recorded a CR of above 0.7. These results indicate that the CETSCALE had achieved convergent validity.
Table 4: Convergent and Discriminant Validity Measures
Factors CR AVE MSV Economic Impact 0.740 0.526 0.442 Patriotism 0.805 0.456 0.442 Made in Kenya Attitude 0.813 0.522 0.102 Foreign Products 0.803 0.520 0.143
Discriminant Validity According to Fornell and Larcker (1981), discriminant validity can be assessed by comparing the amount of the variance captured by the construct (AVE) and the shared variance with other constructs (maximum shared variance – MSV). Discriminant validity is established if a latent variable account for more variance in its associated indicator variables than it shares with other constructs in the same model (Henseler, Ringle, & Sarstedt, 2015). Henseler et al. state that, to satisfy this requirement, each construct’s average variance extracted (AVE) must be compared with its squared correlations with other constructs in the model.
According to Hair et al. (2010), for discriminant validity, MSV must be lower when compared to AVE for all the constructs. In the testing the CETSCALE, and as indicated in the table below, all the 3 factors MSV were lower than the AVE and thus achieving the required thresholds for discriminant validity. In this paper, as presented in Table 5 and Figure 1 below, all the 4 factors were significantly correlated at p˂ 0.05 level.
~ 12 ~
Kiriri Consumer Ethnocentrism and Attitudes …
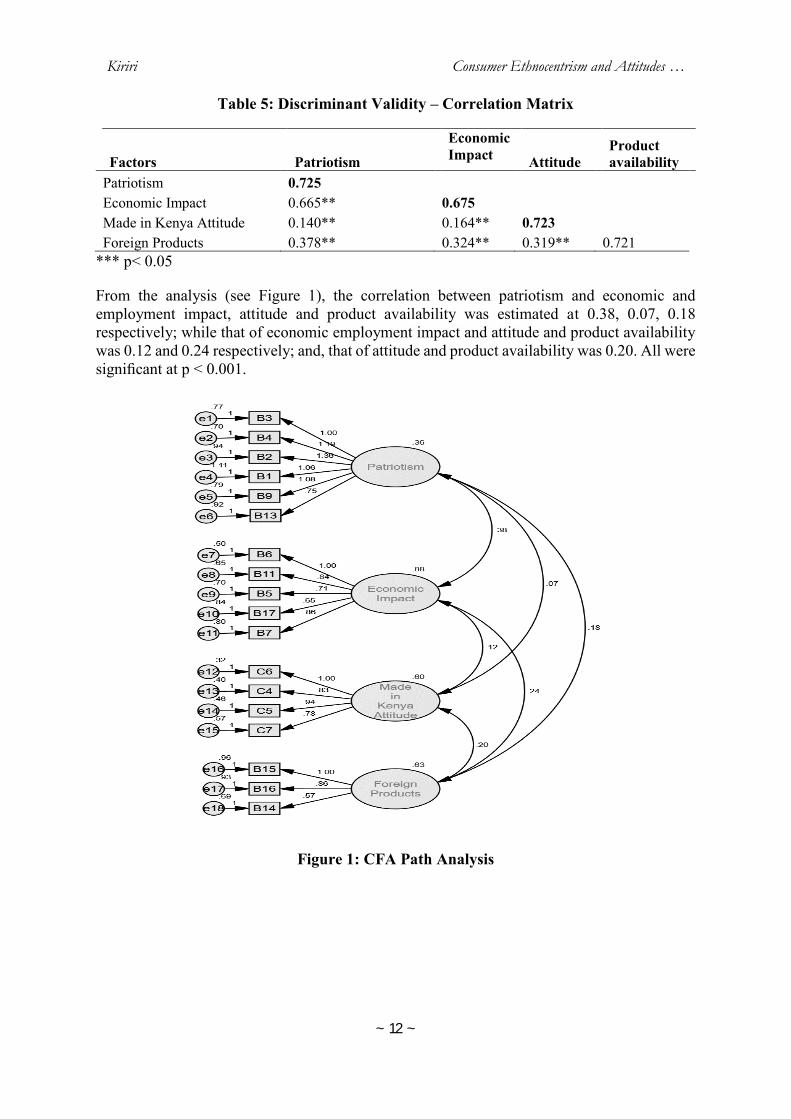
Table 5: Discriminant Validity – Correlation Matrix
Factors Patriotism
Economic Impact Attitude
Product availability
Patriotism 0.725 Economic Impact 0.665** 0.675 Made in Kenya Attitude 0.140** 0.164** 0.723 Foreign Products 0.378** 0.324** 0.319** 0.721
*** p˂ 0.05
From the analysis (see Figure 1), the correlation between patriotism and economic and employment impact, attitude and product availability was estimated at 0.38, 0.07, 0.18 respectively; while that of economic employment impact and attitude and product availability was 0.12 and 0.24 respectively; and, that of attitude and product availability was 0.20. All were significant at p ˂ 0.001.
Figure 1: CFA Path Analysis

~ 13 ~
The University Journal Volume 1 Issue 3 2019 ISSN: 2519 – 0997 (Print)
Assessing Model Fit with Structural Equation Modelling (SEM)
In the full SEM, the estimated results of the structural model are presented in the table below. The various fit indices used to test the model fit were found to satisfy requirements (Hair et al., 2010) as follows: Chi-square/Df (<5) = 2.709; GFI (>.90) = .948; CFI (> .90) = .959; and, RMSEA (< 0.1) = 0.54.
Table 6: Goodness of Fit Indices
Measurement Index Chi- square (χ2) 354.857 Degree of freedom 131 χ2/df 2.709 RMSEA .054 GFI .948 CFI .959
The p value was used to assess the significance of the relationship between attitude and consumer ethnocentrism. From the model estimates, all item loadings were significant at p ˂ 0.05. The p-value was less than 0.05 denoting that the hypothesized path between attitude and consumer ethnocentrism was statistically significant at .05 level of significance. The critical ratio (CR) for the regression path exceeded the threshold values required. When the critical ratio (CR) is > 1.96 for a regression weight, that path is significant at the .05 level. The results show that attitude has a significant and positive impact on consumer ethnocentrism factor, with unstandardized coefficient of 0.337. Based on the regression coefficients, a change in attitude will have a corresponding change in consumer ethnocentrism. The results of SEM analysis are presented in the table below and Figure 2.
Table 7: The Regression Path Coefficient and its Significance
Path B Beta S.E. C.R. P
Patriotism <- Consumer Ethnocentrism 0.697 0.849 0.135 5.162 ***
Economic Impact <- Consumer Ethnocentrism 1.434 0.775 0.319 4.490 ***
Foreign Product <- Consumer Ethnocentrism 0.716 0.446 0.183 3.907 ***
Made in Kenya Attitude <- Consumer
Ethnocentrism 0.337 0.217 0.125 2.697 0.007

~ 14 ~
Kiriri Consumer Ethnocentrism and Attitudes …
Figure 2: Attitude and Consumer Ethnocentrism SEM Path Analysis
Conclusions This study was driven by two broad hypotheses. The first was to evaluate if there were ethnocentric tendencies prevalent among Kenyans while the second was to assess of Kenyan consumers possessed xenocentric tendencies. On the first hypothesis, even though Kenyans exhibited some ethnocentric tendencies, the same can be considered as mild. Kenyans were not highly predisposed to having negative feelings about foreign made products and their effects. From the analysis, it is evident that Kenyans did not have a high level of patriotism when it came to supporting products that were manufactured in Kenya by avoiding the consumption of foreign made products. On the other hand, it was evident that Kenyans did not support restrictions on the availability of foreign made products in the Kenyan Market. However, there was some concern on the effects of the effects of foreign products on the economy and especially the effects on employment.
The low level of ethnocentrism found among Kenyans was similarly established in other studies in different parts of Africa including Nigeria, Ghana, Tanzania, and Mozambique among others. However, consumers in Zimbabwe had a moderately high level of ethnocentrism as had consumers in South Africa. Different from the previous studies that were not product specific, these two studies in Zimbabwe and South Africa were more focused to specific products of interest (poultry products and Chinese clothing respectively). On the overall, this study concludes that Kenyans are not ethnocentric and levels of animosity towards foreign products is minimal.
~ 15 ~
The University Journal Volume 1 Issue 3 2019 ISSN: 2519 – 0997 (Print)
Second, Kenyans had no special preference for locally made products as compared to imported ones and hence displaying a level of xenocentrism. The respondents did not think highly of Kenyan made products in terms of durability, quality, technological advancement and value for money. As indicated before the feeling of superiority of foreign products over domestic products lead to ethnocentric tendencies. These findings amongst Kenyans were largely similar to other studies in African countries.
For example, studies in Nigeria found that Nigerian consumers had a negative image of the “Made in Nigeria” label preferred imported brands. In Ghana, it was established that Ghanaian consumers had a low perception of products made in Ghana relative to foreign products. In Mozambique there is a preference for foreign products over local products just like among Tanzania consumers. Interestingly, In Kenya, another study found that most Kenyans had a high preference for local commercial bank services as opposed to those from foreign owned commercial banks.
References African Development Bank (2018). East Africa Economic Outlook 2018. African Development Bank.
Agbonifoh, B. & Elimimian, J. (1999). Attitudes of developing countries towards ‘country-of-origin’ products in an era of multiple brands. Journal of International Consumer Marketing, 11 (4), 97-116.
Ajzen, I., & Fishbein, M., (2000). Attitudes and the Attitude-Behavior Relation: Reasoned and Automatic Processes, In W. Stroebe& M. Hewstone (Eds.), European Review of Social Psychology (pp. 1-33). John Wiley & Sons.
Ajzen, I., (2008). Consumer attitudes and behavior. In C. P. Haugtvedt, P. M. Herr & F. R. Cardes (Eds.), Handbook of Consumer Psychology, (pp.525-548). New York: Lawrence Erlbaum Associates.
Alarcón, D., & Sánchez, J.A. (2015). Assessing convergent and discriminant validity in the ADHD-R IV rating scale. Spanish STATA Meeting, October 22, 2015, University of Pablo de Olavide, Seville, Spain.
Anchor, J. R. & Kourilova, T. (2009). Consumer perceptions of own brands: international differences. Journal of Consumer Marketing, Vol. 26 (6), pp. 437-449.
Barrett, P. (2007). Structural Equation Modelling: Adjudging Model Fit. Personality and Individual Differences, 42 (5), 815-24
Batra, R., Venkatram, R. Alden, D.L., Steenkamp, J.E.M., &Ramachander, S. (2000). “Effects of brand local and nonlocal origin on consumer attitudes in developing countries”. Journal of Consumer Psychology, Vol.9, No.2:83-5.
Belk, R. (2000). Collecting in a Consumer Society, London: Routledge
Bilkey, W. & Nes, E. (1982). Country of Origin Effects on Product Evaluations. Journal of International Business Studies, 8, 89-99
Byrne, B. M., (2009). Structural equation modeling with AMOS: Basic concepts, applications, and programming. New Jersey: Lawrence Erlbaum, Byrne, B.M., (2010). Structural education modelling with AMOS, 2ed. New York: Routledge.
Chryssochoidis, G., Krystallis, A., & Perreas, P. (2007). Ethnocentric beliefs and country‐of‐origin (COO) effect: Impact of country, product and product attributes on Greek consumers' evaluation of food products", European Journal of Marketing, 41, 1518-1544.
Diamantopoulos, and Siguaw, J. A. (2000). Introducing LISREL. SAGE: London.

~ 16 ~
Kiriri Consumer Ethnocentrism and Attitudes …
Erdogan, B. Z. & Uzkurt, C., (2010). Effects of ethnocentric tendency on consumers' perception of product attitudes for foreign and domestic products. Cross Cultural Management: An International Journal, Vol. 17 Iss: 4, pp.393 – 406
Festervand, T. & Sokoya, S. (1994). Consumer ethnocentrism in a developing economy: a preliminary investigation. The International Executive, 36 (1), 95-105.
Field, A. (2009). Discovering statistics using SPSS (3rd ed). London: Sage.
Fishbein, M., & Ajzen, I. (1975). Belief, Attitude, Intention, and Behavior: An Introduction to Theory and Research. Reading. MA: Addison-Wesley.
Fornell, C. G., & Larcker, D. F. (1981). Evaluating structural equation models with unobservable variables and measurement error. Journal of Marketing Research, 18 (1), 39 – 50.
Gefen, D., Straub, D., & Boudreau, M. C. (2000). Structural equation modeling and regression: guidelines for research practice pp4:1–78. Communications of the AIS.
Hair J., Black W., Babin B., &Anderson R. (2010). Multivariate Data Analysis. Upper Saddle River, NJ, USA: Prentice-Hall, Inc.
Henseler, J., Ringle, C. M., & Sarstedt, M. (2015). A new criterion for assessing discriminant validity in variance-based structural equation modeling. Journal of the Academy of Marketing Science.
Hooper, D., Coughlan, J., & Mullen M. R. (2008). Structural Equation Modelling: Guidelines for Determining Model Fit. Electronic Journal of Business Research Methods, 6 (1) 2008 (53-60).
Howes, D. (1996). Cross-cultural Consumption: Global Markets Local Realities. New York: Routledge.
Hu, L.T. & Bentler, P.M. (1999). Cutoff Criteria for Fit Indexes in Covariance Structure Analysis: Conventional Criteria Versus New Alternatives. Structural Equation Modeling, 6 (1), 1-55.
Ibrahim, E. & Gomez, K. (2018) Consumer Choice and Preference of Global versus Local Restaurant Brands in Philippine: An Empirical Study. In: 51st Academy of Marketing Conference (AM2018), Stirling, UK, 2-5 July 2018
Jansson, J., Marell, A., & Nordlund, A., (2010). Green consumer behavior: determinants of curtailment and eco-innovation adoption, Journal of Consumer Marketing, 27/4, pp. 358-370
John, A. V., & Brady, M. P. (2011a). Consumer ethnocentrism and attitudes toward South African consumables in Mozambique.African Journal of Economic and Management Studies, 2(1), 72–93.
John, A. V., & Brady, M. P. (2011b). Exploration of the dimensionality of the consumer ethnocentric tendencies scale in Mozambique. Journal of African Business, 12(1), 114–132.
Karakaya - Ozyer, K. & Aksu-Dunya, B. (2018). A review of structural equation modeling applications in Turkish educational science literature, 2010 - 2015.International Journal of Research in Education and Science (IJRES), 4 (1), 279 - 291. DOI:10.21890/ijres.383177
KIPPRA (2017). Kenya Economic Report 2017. Kenya Institute for Public Policy Research and Analysis (KIPPRA).
Kisawike B. (2015). How Country of Origin, Consumer Ethnocentrism and Consumer Xenocentrism Impact upon Risk and Involvement in the Malaria Medication Decision Making Process in Tanzania. (Doctor of Philosophy Thesis). University of Hull.
Klein, J. G., Ettenson, R., & Krishnan, B. C. (2006). Extending the construct of consumer ethnocentrism: When foreign products are preferred. International Marketing Review, 23(3), 304–321.
Kotler, P., & Keller, K. L. (2012). Marketing Management, Global Edition 14e, London: Pearson Education Limited.

~ 17 ~
The University Journal Volume 1 Issue 3 2019 ISSN: 2519 – 0997 (Print)
Lawrence, S. J. (2012). Consumer Xenocentrism and Consumer Cosmopolitanism: The Development and Validation of Scales of Constructs Influencing Attitudes Towards Foreign Product Consumption, Proquest LLC, Ann Arbor, MI.
LeVine, R.A., & Campbell, D.T. (1972). Ethnocentrism: Theories of Conflict, Ethnic Attitudes, and Group Behaviour. New York: John Wiley & Sons Inc
Lysonski, S., & Durvasula, S. (2013). Nigeria in transition: acculturation to global consumer culture. Journal of Consumer Marketing, 30 (6), 493-508.
MacCallum, R. C., Browne, M. W., & Sugawara, H. M. (1996). Power analysis and determination of sample size for covariance structure modeling. Psychological Methods, 1, 130-149.
Maina, S. M., Kibera, F. N., & Munyoki, J. M. (2015). Influence of Perceived Value on the Relationship between consumer National ethnocentrism and Willingness to buy commercial Banking services in Kenya. European Scientific Journal, 11(19).
Makanyeza C. & du Toit F. (2016). Measuring Consumer Ethnocentrism: An Assessment of Reliability, Validity and Dimensionality of the CETSCALE in a Developing Market. Journal of African Business, 17(2), 188-208, DOI:10.1080/15228916.2016.1138270
McLeod, S. A. (2018). Attitudes and behavior. Retrieved from https://www.simplypsychology.org/attitudes.html
Mueller, R. D., Broderick, A.J. &Kipnis, E. (2010). “Consumer xenocentrism: an alternative explanation for foreign product bias”, in Hoqq, Z. (Ed.), Proceedings of Annual Hawaii International Business Research Conference, World Business Institute, Honolulu, pp. 27-28
Mugenda, O. M. & Mugenda, A. G. (2003). Research Methods: Quantitative Approaches. Nairobi: African Center for Technological Studies Press.
Okechuku, C. & Onyemah, V. (1999). Nigerian consumer attitudes toward foreign and domestic products. Journal of International Business Studies, 30(3), 611-622.
Opoku R. A. &Akorli P. A. (2009). The preference gap: Ghanaian consumers’ attitudes toward local and imported products. African Journal of Business Management 3 (8), 350-357
Oberecker, E. M., Riefler, P., & Diamantopoulos, A. (2008). The consumer affinity construct: conceptualization, qualitative investigation, and research agenda. Journal of International Marketing, 16(3), 23–56.
Pentz, C., Terblanche, N. S., & Boshoff, C. (2014). Demographics and consumer ethnocentrism in a developing country context: A South African Study. Journal of Transnational Management, 18(3), 204–218.
Pentz, C., Terblanche, N. S., & Boshoff, C. (2013). Measuring consumer ethnocentrism in a developing context: An assessment of the reliability, validity and dimensionality of the CETSCALE.
Pentz, C., (2011). Consumer ethnocentrism and attitudes towards domestic and foreign products: A South African study. A Dissertation presented for the degree Doctor of Philosophy (PhD), Stellenbosch University, South Africa.
Prince, M., Davies, A. P., Cleveland, M., & Palihawadana, D. (2016). Here, there and everywhere: a study of consumer centrism", International Marketing Review, 33 (5), 715-754.
Quang N N., DinhChien T, & Long N. H. (2017). The Effects of Consumer Ethnocentrism and Consumer Animosity on the Willingness to Buy with the Mediating Role of Products Judgments: Children's Food Case. Advances in Economics and Business 5(8), 466-475, 2017. DOI: 10.13189/aeb.2017.050805
Saffu, K., & Walker, J. (2006). An assessment of the CETSCALE in a developing country. Journal of African Business, 7(1/2), 167–181.

~ 18 ~
Kiriri Consumer Ethnocentrism and Attitudes …
Saffu K, & Walker, J. (2006). The Country-of-Origin effects and consumer attitudes to “buy local campaign: The Ghanaian Case. African Journal of Business Management 7(1/2), 183-199
Saffu, K., Walker, J. H., &Mazurek, M. (2010). The role of consumer ethnocentrism in a buy national campaign in a transitioning country: Some evidence from Slovakia. International Journal of Emerging Markets, 5(2), 203–226. https://doi.org/10.1108/17468801011031829
Schiffman, L. G., & Kanuk, L. L. (2004). Consumer behavior (8thed.). Upper Saddle River, NJ: Pearson Prentice Hall.
Sharma, S., Shimp, T., & Shin, J., (1995). Consumer Ethnocentrism: A Test Antecedents and Moderators.Journal of the Academy of Marketing Science, 23(1): 26-37.
Sharma, P., (2015). Consumer Ethnocentrism: Reconceptualization and Cross-cultural Validation. Journal of International Business Studies, 23(1): 1-18.
Shimp, T. A., & Sharma, S. (1987). Consumer ethnocentrism: Construction and validation of the CETSCALE. Journal of Marketing Research, 24(3), 280–289.
Solomon, M., Bamossy, G., Askegaard, S., & Hogg, M. (2010). Consumer Behavior: Buying: A European Perspective (4th edn.). Financial Times Press.
Tabachnick, B. G., & Fidell, L. S. (2007). Using multivariate statistics (5thed.). Upper Saddle River, NJ: Pearson Allyn& Bacon.
Thurstone, L. L. (1947). Multiple factor analysis: A development and expansion of vectors of the mind. Chicago: University of Chicago.
Tong, X., & Li, C. (2013). Impact of brand personality and consumer ethnocentrism in China’s sportswear market. Asia Pacific Journal of Marketing and Logistics, 25(3), 491–509.
Wang, C. L., & Chen, Z. X. (2004). Consumer ethnocentrism and willingness to buy domestic products in a developing country setting: Testing moderating effects. Journal of Consumer Marketing, 21(6), 391–400.