Embed Size (px)
Citation preview
Consumer Demand for Election News: The Horserace Sells*
Kyu Hahn and Shanto Iyengar, Stanford University Helmut Norpoth, State University of New York – Stony Brook
*Prepared for Presentation at the Annual Meeting of the American Political Science
Association, Boston, August 30, 2002. We acknowledge the generous financial support
of the Pew Charitable Trusts, the Hoover Institution, and the Stanford Institute for the
Quantitative Study of Society.
Abstract
Reports on the state of the horserace and analysis of the candidates’ strategies are pervasive themes in news coverage of campaigns. Various explanations have been suggested for the dominance of strategy-oriented over hard news. The most frequently identified factors are the length of the modern campaign, the built-in conflict between journalists and campaign operatives, and the pressures of the marketplace. This paper provides a test of the market hypothesis. Given access to a wide variety of news reports about the presidential campaign in the weeks immediately preceding the 2000 election, we find that voters were drawn to reports on the horserace and strategy. Strategy reports proved far more popular than reports about the issues. Although media organizations stand to profit, the overproduction of horserace news takes a toll on the political commons. Our results indicate that exposure to this genre of campaign news contributed to increased cynicism about the candidates and the electoral process itself.
1
It would come as no surprise to even the most casual follower of the news that
media coverage of political campaigns focuses predominantly on “horserace” aspects and
gives much less attention to coverage of substantive issues, policy platforms or the
credentials of the candidates. Scholars who have analyzed the content and form of
election news are in agreement: the evidence is consistent and unequivocal that the
media invariably highlight the horserace and strategic aspects of campaigns at the
expense of providing meaningful information about policy and governance. Reports on
the latest polls or behind-the-scenes-efforts to improve the candidates’ electoral prospects
far outnumber reports on the candidates’ worldviews, policy pledges, or previous records
of decision-making.1
What may come as a surprise, however, even to the politically sophisticated, is
that this was not always so. The emergence of the horserace as the dominant story in
media campaign coverage is actually a fairly recent phenomenon, postdating the arrival
of the television-based media regime. Thirty years ago, news reports concerning matters
of policy and governance held their own with reports on the conduct of the campaign
(Patterson, 1993, pp. 66-70; Anderson and Thorson, 1989). But by 1992, the ratio of
“strategic” to policy-oriented news reports was 8 to 1 (Patterson, 1993, p.74). As
Cappella and Jamieson point out, the Seventies and Eighties were a time of
“fundamental change in the distribution of media coverage from issue-based stories to
ones that emphasize who is ahead and behind, and the strategies and tactics of
1The extensive literature on campaign news encompasses major national (although mainly presidential) campaigns since 1960 and represents a wide variety of news sources from wire services to network news. Major contributions would include Hofstetter, 1976; Clarke and Evans, 1983; Robinson and Sheehan, 1983; Hallin, 1983; Brady and Johnston, 1987; Andersen and Thorson, 1989; Patterson, 1993).
2
campaigning necessary to position a candidate to get ahead or stay ahead” (1997, p. 33).
Today, by any standard, reports on the state of the horserace and analysis of the
candidates’ strategies are pervasive themes in news coverage of campaigns.
Various explanations have been suggested for the trend in the direction of
strategy-oriented news. The most frequently identified factors are the length of the
modern campaign, the built-in conflict between journalists and campaign operatives, and
the pressures of the marketplace. This paper provides the first test of the market
hypothesis. Given access to a wide variety of news reports about the presidential
campaign in the weeks immediately preceding the 2000 election, we find that voters were
drawn to reports on the horserace and strategy. Although media organizations stand to
profit, the overproduction of horserace news takes a toll on the political commons. Our
results indicate that exposure to this genre of campaign news contributed to increased
cynicism about the candidates and the electoral process itself.
This paper will proceed by first summarizing the major explanations that have
been offered for the rise of horserace-based journalism. Then we will single out the
market explanation for analysis and describe our method for examining consumer
demand. Second, we present evidence showing that people are attracted to news about
the horserace. Third, we describe the audience profile for horserace and other genres of
campaign news. Finally, we demonstrate that by catering to consumer preferences, the
media are contributing to increased political cynicism. In closing, we consider the
implications of these findings for the practice of campaign journalism.
3
Rampaging “Horseracism”
The dominance of “horseracism” in election news is not just a question of
broadcast minutes devoted to polling. Rather, the journalistic reliance on the “strategy
frame” (Patterson, 1993) now encompasses an overarching theory of the candidates as
strategic gamesmen, each trying to neutralize or overcome the opponent’s moves. The
burning question for the media today is not merely “who’s ahead” but “why”?
In addressing the latter question, the tenor of campaign news has shifted away
from its traditional, essentially descriptive mode toward a more interpretive and analytic
approach. The older, descriptive mode consisted in significant part of reporting the
events of the day, often including verbatim reports of significant amounts of candidate
speech. The newer, analytic journalism also reports on daily events, but in a much
different way. The focus is less on presenting the position or message that a candidate
has staked out and more on using the event as a means of divining the candidates’
motives and tactics. The content of news reports has changed greatly: because the focus
is no longer genuinely on the candidates’ positions, it is increasingly rare for reporting to
include excerpts of the candidates in their own words. A corollary is that the major news
sources are no longer the candidates themselves, but a coterie of “experts” who provide
the necessary analysis of such questions as why Al Gore went to his opponent’s home
state and appeared before a predominantly Hispanic audience. The disappearance of
candidates’ voices from daily news coverage of the campaign is striking; in 1968, a
viewer of network news could listen to the opposing candidates for a total of nearly two
minutes minute each day. By 2000, the daily (total) sound bite was twelve seconds
(Hess, 2000; Hallin, 1983; Media Monitor, 2000). In the case of network news, the time
4
devoted to analysts’ voices outweighed time devoted to the candidates’ voices by a factor
of 7 to 1 (Lichter, 2001).
What accounts for the near-demise of descriptive journalism? Whose interests are
being served by the shift in approach?
Why Interpretive Journalism?
The rise of interpretive journalism has been attributed variously to the length of
modern campaigns, in which “current” information is perceived as more interesting than
reaffirmation of old policy stands; the logistical practicalities of publishing news;
professional aspirations of journalists to serve the public better; and the pressures of a
competitive marketplace (which is the focus of this paper).
In the context of a yearlong campaign, a candidate articulates his position on
many important issues at the outset. Afterwards, unless the candidate undergoes a
conversion, these positions lack newsworthiness on a daily basis. But there is a daily
need for new material. The latest trial heat poll is new news, unlike the candidates’
position papers on national defense or the environment. Analysis of the horserace
provides reporters with the key ingredients of newsworthiness -- currency and novelty --
whereas analysis of the candidates’ competing policy visions is stale and repetitive.
Unlike most aspects of the campaign, which are stage-managed and predictable, the
horserace story often strays from the script, thus providing additional daily news value.
Another practical incentive favoring interpretive news content is the proliferation
of polling through telephone interviewing (Traugott and Lavrakas 2000). The networks
and most other major news outlets either maintain an independent polling operation or
work closely with an established polling organization. That allows them to cover the
5
state of the horserace quickly and efficiently. Journalists have become fluent in the use
of survey data. They are also quite adept at using such data to analyze the strategic
moves of candidates during the campaign. Plus, a poll-based story on the campaign has a
more scientific touch than a story relying on self-serving observations of campaign
operatives.
At a more lofty level, interpretive journalism is a direct outgrowth of the
inherently adversarial relationship between reporters and campaigns (see Ansolabehere,
Behr and Iyengar, 1994; Zaller, 2002). More specifically, the horserace story -- and
related analysis -- has evolved as a journalistic response to candidate manipulation of the
news. In every election the candidates compete to present a compelling “story line,” with
each campaign attempting to use news outlets for partisan gain. A reporter who accepts a
candidate’s account at face value is probably being manipulated. A classic example is
the Republican-sponsored “Willie Horton” ad, which became front-page news across the
country in 1988, inextricably linking Michael Dukakis with prison furlough programs.
Journalists have subsequently learned to resist candidates’ attempts at impression
management by injecting their own accounts of candidate behavior into the news. Thus,
they respond to campaign ads more combatively; scrutinizing the content for evidence of
inaccuracy or exaggeration. In fact, the development of an entirely new genre of
journalism -- the “ad-watch” (see Jamieson, 1992) -- is symptomatic of journalists’ drive
for autonomy and objectivity in the face of the candidates’ efforts at media management.
Finally, market forces, which inexorably demand that news organizations view
their product as just another means of obtaining advertising revenue, require that the
news be presented in a format that has significant entertainment and interest value -- even
6
though these stories may have doubtful civic or educational relevance (Kalb, 1998).
Although we know of no relevant evidence concerning consumer demand for campaign
news in general or particular genres of campaign news, the conventional wisdom among
industry insiders is that the uncertainty and suspense associated with the depiction of the
candidates as strategic players attempting to manipulate voters is more likely to catch and
hold the audience’s attention than other, more “substantive” aspects of the campaign (see
Patterson, 1993).2 If sporting events attract huge audiences, why not frame elections as
contests between political athletes? Given the intensely competitive marketplace, it is
axiomatic that news organizations produce ever-increasing amounts of horserace news;
nothing less than their survival is at stake.
Is the conventional wisdom valid? Given the choice between issue-based and
strategy-based news, do people typically turn to the latter? In this paper we test the
market-based explanation for the rise of horserace and strategy news by assessing voters’
consumption of news during the 2000 presidential campaign. We compiled a broad
selection of news reports about the campaign on a multimedia CD Rom, which was made
available (free of cost) to a representative sample of voters shortly before the election.
We then tracked these voters’ actual use of the CD. Based on this behavioral evidence,
we find that strategy stories do in fact elicit greater public attention than policy stories.
Above and beyond standard attributes of news consumers (e.g. their education and level
of interest in politics), the reputation of the news source, or the particular format of
presentation (broadcast versus print), we find that campaign strategy sells.
2 Of course, this assumes a reasonably competitive race between the major candidates.
7
After documenting the demand for campaign news, we explore the question of
how the satisfaction of that demand affects some key political attitudes. We merge the
CD usage data with survey measures of political attitudes and find that higher rates of
exposure to horserace and strategy news contribute to greater levels of political cynicism.
While increased production of strategy-oriented news may strengthen a news
organization’s market share, it seems to diminish public confidence in the electoral
process.
Design and Layout of the Media CD
The 530 page CD was organized into four thematic chapters. Each chapter was
preceded by a subject matter index, with clickable headings (e.g. “Gore Family
Background” in the chapter on the candidates). The index page provided an overview
and navigational guide to the entire chapter, enabling readers to proceed directly to news
reports of interest without having to scroll through other material. CD users could also
search for information on their own initiative, using a keyword-based search process.3
The 206 news reports included in the CD covered the period from the Iowa
caucuses through mid-October. The great majority of reports (184) were drawn from
newspapers ranging from high prestige sources including the New York Times and
Washington Post, to the less prestigious New York Post. Twenty-two of the reports were
3 The CD reader software, which was designed by Nightkitchen.com, required no technical expertise to install (apart from the ability to place the CD in the appropriate drive). In addition to providing audio and video material, the software included several user-friendly “interactive” features. Users could highlight text, post sticky notes in the margins, and dog-ear pages of particular interest.
8
taken from broadcast outlets including CNN, Fox News, and CNBC.4 These reports
could be played directly from their location (by simply clicking the “play” button), or
could be “detached” from the page so as to make it possible to scroll through other pages
of the CD while listening to the audio or video.
The subject matter coverage provided by the news reports was organized into four
chapters.5 The opening chapter (pp. 5-97) introduced readers to the two major
candidates, providing reports on their family background, career experience and, in the
closing section, their contrasting personas. This “character” section featured reports on
Gore’s efforts to inoculate himself from the Lewinsky scandal and Bush’s attempts to
repudiate allegations of drug use.
Chapter 2 (pp. 99-245) was designed to represent “substantive” news coverage
and consisted of reports on the candidates’ issue agendas and policy preferences.
Beginning with a general comparison of the candidates on a left-right continuum, the
chapter then proceeded on an issue-by-issue basis with most of the reports focusing on
the economy, education, social security, healthcare, crime, and foreign policy.
Chapter 3 (pp. 247-355) provided a brief history of each candidate’s “road to the
nomination.” It included reports on the Bradley and McCain primary challenges and
their eventual withdrawal from the race. Other stories identified the key policy and
campaign advisors (e.g. “the cult of Condi,” “Daley to lead Gore campaign”) on either
side. Finally, the modal report in this chapter described events at the nominating
conventions (e.g. “Bush taps Cheney to join ticket,” “When a kiss isn’t just a kiss”).
4 Of these, six were taken from televised reports and 16 from radio news programs. In the case of these reports, CD users were also provided with the transcript of the soundtrack. 5 The CD is available online at http://pcl.stanford.edu/
9
The fourth and final chapter (pp. 357-534) represented the mix of strategy and
horserace stories that has come to so dominate campaign news. The principal themes
included the campaigns’ efforts to raise funds and win endorsements, analysis of each
candidate’s strategy including the selection of advertising material (e.g. “RATS Trap
Snags Bush”), advertising tone (who would “go negative” and why), and efforts to target
particular states or blocs of voters. The chapter ended with a series of reports on “Who’s
leading in the polls” including recent trial heats, public evaluations of the candidates’
personal qualities (e.g. “Voters Rate Bush, Gore Even on Honesty”) and their positions
on the issues (e.g. “Education Voters Pose a Tough Test”).
All told, the horserace and strategy chapter accounted for 27 percent of the
compilation, as did the chapter covering the issues. Reports about the conventions and
earlier campaign events represented 20 percent of the material, and the candidate-oriented
opening chapter provided the remaining 16 percent. This distribution of news content,
which features parity between “substantive” (issue-oriented) and strategy-oriented
coverage, clearly underestimates the prominence of the latter in most news outlets. In the
case of network news coverage of the 2000 campaign, for example, viewers would have
encountered more reports featuring the horserace than the issues by a margin of nearly
2:1 (Lichter, 2001, p. 11). On the other hand, our CD was not nearly as substantive in
focus as PBS’ Newshour, which airs issue-oriented reports over horserace reports by a
factor of more than 2:1 (Lichter, 2001, p. 24). Thus, placed in the context of mainstream
news sources, the media CD offered a modestly substantive menu of news about the 2000
campaign.
10
The relative equality of coverage across the candidates, issues, road to the
nomination, and horserace/strategy chapters was accomplished by design. In order to
gauge consumer preference accurately, it was important to create an “equal opportunity”
information environment in which CD users could just as easily encounter news about
different aspects of the campaign. Thus, we attempted to equalize (at least roughly) the
probability that someone opening a page of the CD at random would encounter news
about the horserace, the candidates, or the issues.
It is important to note also that the sequence of chapters and particular reports
within each chapter was fixed for all respondents, raising the possibility of placement
effects. The fact that the candidate chapter was placed at the beginning of the CD, for
instance, may have substantially boosted user attention to this subject matter while topics
featured later on may have been overlooked. The analysis described below controls for
effects arising from the order of presentation.
Research Design
Our study was designed to assess consumers’ news preferences in the context of
the 2000 presidential campaign. Using a multimedia CD as the medium, we provided a
probability sample of “online” American voters with large quantities of news reports
about the campaign two weeks before the election. The CD was programmed to enable
“usage tracking;” that is, the specific pages that participants accessed, the number of
times they used the CD, as well as the length of their CD sessions was recorded on the
11
user’s PC. Participants returned this data to the researchers immediately following the
election, along with their responses to a survey of political attitudes.6
The CD usage data provide behavioral measures of news consumption. The
advantages of behavioral indicators over standard survey self-reports are well known.
Errors of memory and self-presentation biases tend to inflate recall of exposure to news
sources or particular news stories (see Ansolabehere and Iyengar, 1996 for illustrative
evidence). Not only are usage indicators more accurate, their inclusion imposed no
methodological tradeoffs. The recording process was non-reactive as respondents used
the CD at their own discretion, when they chose to, and in the privacy of their home or
office. Of course, the design also featured a high level of mundane realism; the stimulus
materials were real news reports and exposure occurred at a time when participants
would find the information useful -- during the closing stages of the campaign.
The Sample
The research firm of Knowledge Networks delivered the CD to a randomly
chosen sample of adult Americans with home Internet access. Knowledge Networks has
solved the thorny problem of selection bias inherent to conventional online surveys
(which reach only that proportion of the population that is online) by recruiting a
nationwide panel through random-digit telephone sampling. Each member of this panel,
which comprises over 150,000 Americans between the ages of 16 and 85, is provided free
access to WebTV. In exchange, panelists agree to participate (on a rotation basis) in
market and research studies (for further details concerning their sampling framework and
5 Of course, we obtained informed consent from the participants concerning our access to the tracking data. We also requested that they not share the CD with other members of the family.
12
survey methodology see Krosnick & Chang, 2001; Dennis, 2001). Because our study
required a greater time commitment than a typical consumer survey, we offered
participants an additional incentive of $10.00.
We drew the sample for the CD study from the Knowledge Networks panel after
first screening panelists for home Internet access. We sampled from “online” adults for
two reasons. First, we wished to approximate the group of voters who consume news
online. Second, Internet access was necessary for electronic transmission of the CD
usage data back to Knowledge Networks.
466 members of the Knowledge Networks panel with Internet access, selected at
random, were mailed the media CD on October 23rd, approximately two weeks before the
election. Respondents were informed that the CD was an educational initiative of
Stanford University, that they were free to use the CD as they saw fit, and that their usage
was to be recorded. They then read and signed the informed consent form.
Over the next two weeks participants used the CD. Immediately following the
election, Knowledge Networks administered our posttest survey and provided
instructions concerning the return of the CD usage data. We received 207 completed
surveys, but a few respondents were either unable to locate their CD usage data, or
mistakenly transmitted some other file. Our analysis is limited to the 187 participants
who returned the tracking data.
Analysis and Results
The analysis proceeds in three stages. First, we test the market hypothesis, which
predicts that horserace or strategy new stories elicit greater interest than issue, event, or
candidate-centered reports, using aggregate, time-series methods. Our indicator of
13
interest is the total number of clicks aimed at particular pages, i.e. page visits. After
detrending the page visit series and correcting for serial dependence (using a logarithmic
function with first-order autoregression), we examine page visits in relation to news
content. Each page was coded according to chapter topic, subchapter topic, and a variety
of other attributes (type of source, multimedia vs. text, etc.) After accounting for the
trend, we find that horserace and strategy reports received much higher levels of attention
than reports on other aspects of the election.
The next phase of the analysis considers the demand for campaign news at the
individual level. We identify specific audiences in terms of their socio-economic
background,7 self-reported use of conventional and online news sources,8 political
affiliation and engagement,9 and finally, their enthusiasm for media-based campaigns. In
7 These include gender, ethnicity, education, income, urban-rural residence, region, and religion. 8 We constructed indices of exposure to print (daily newspapers and weekly news magazines) and broadcast (local and network) news. Frequency of exposure ranged from “almost every day” to “hardly ever.” In addition, we asked respondents whether they had encountered campaign information on the Web, their frequency of exposure to news organizations’ websites, and their general use of the WWW. These three responses were combined into an index of Web access. We also assessed perceptions of the news media as credible by asking participants to rate news reports they had encountered about the 2000 election as “informative,” “trustworthy,” “irrelevant,” and “trivial.” After reflecting the negatively valenced items, responses were summed to form an index of credibility (Coefficient Alpha = .566). 9 We asked participants about their party identification (Did they generally consider themselves Democrats, Republicans, Independents, or something else?) and ideology (Generally speaking, do you describe yourself as a liberal or conservative on political issues?) As a measure of participation, we counted the number of affirmative responses to questions asking whether they had displayed a campaign sticker/button, talked to someone about registering to vote, attended a political meeting or rally, or worked for one of the parties/candidates. We also asked if they belonged to any civic or social organizations. Last, we created an index of interest in the campaign reflecting how often respondents followed public affairs, how often they discussed politics, and how much
14
particular, we consider political cynicism (trust in politicians) and both facets of political
efficacy -- assessments of the self as capable of wielding electoral influence (“internal”
efficacy) and evaluations of the responsiveness of electoral institutions to popular will
(“external” efficacy) -- as key attitudinal antecedents of the demand for campaign news.10
In essence, we anticipate greater interest in campaign news among those who see media
politics as a game worth playing. In addition to these generic or process-oriented
attitudes, we considered respondents’ evaluations of the two major candidates as a
potential motive for news consumption. Perhaps voters with particularly strong feelings
about Al Gore and George W. Bush -- either pro or con -- found the news more
engaging.11
they cared about the outcome of the election. This index ranged from 0 to 3 (Coefficient Alpha = .691). 10 The component items for the index of political cynicism were as follows: (1) In your opinion, how many of the people running the government are crooked (quite a few-hardly any)? (2) How much tax money do you think the people in government waste (a lot-don’t waste very much)? (3) How often would you say candidates running for Congress and the presidency make promises they have no intention of keeping (always-never)? Responses were summed and the resulting scale ranged from 0 to 5 (Coefficient Alpha = .539). In the case of external efficacy, we used four items. (1) Some people say it makes a difference who is in power. Others say that it doesn’t make a difference who is in power. What do you think (makes a difference-doesn’t make a difference)? (2) Some people say that no matter who people vote for, it won’t make any difference to what happens. What do you think (won’t make a difference-can make a difference)? (3) Generally speaking, those we elect to Congress in Washington lose touch with the people pretty quickly. What do you think (agree-disagree)? (4) Parties are only interested in people’s votes but not their opinions (agree-disagree). Index scores (the sum of the individual responses) ranged from 0 to 2 and Coefficient Alpha was .601. Finally, three items were used to measure internal efficacy. (1) People like me don’t have any say about what the government does (agree-disagree). (2) Public officials don't care much what people like me think (agree-disagree). (3) Sometimes politics and government seem so complicated that a person like me can’t really understand what’s going on (agree-disagree). The index ranged from 0 to 4 with an Alpha value of .664. 11 We asked participants to rate the applicability of the terms “sincere,” “strong leader,” and “likable” to each candidate. After summing the three ratings, we then created a
15
It is worth noting that our analysis of audience characteristics controls for the
number of discrete CD sessions. Most participants used the CD only once or twice, but
some were sufficiently motivated to use it on six different days.12 By taking into account
the number of sessions, our analysis identifies differences in per session patterns of
usage. Finally, we also controlled for subjective evaluations of the CD; participants who
rated the CD as personally useful were generally more active users.
In the next step of the individual-level analysis, we disaggregated overall CD use
into individual chapter constituents in order to compare the composition of the news
audience across content categories. Naturally, we are especially interested in the make-
up of the audience for horserace and strategy-oriented news. We find that the audiences
for substantive and horserace news are dissimilar. Of particular interest, whereas
horserace news draws the more cynical quarters of the public, news about the candidates
is more appealing to the less cynical minded.
Finally, we attempt to tease out the effects of exposure to horserace and strategy-
oriented news on public evaluations of campaigns. Because horserace news sells well
among the cynical, we treat use of the horserace chapter as endogenous to political
cynicism. The results of this two-stage analysis confirm that greater exposure to strategy
measure of opinion extremity or intensity by collapsing respondents with extreme ratings (respondents with scores of 0 or 3 were assigned a score of 1, all others were scored as 0). This dichotomy was then summed across the candidates. A score of 0 would indicate ambivalence toward both candidates, while a score of two would indicate the opposite. 12 The relationship between the number of sessions and page visits was weakly positive (r = .3), reflecting considerable variation in the length and extent of individual sessions. We suspect that the session variable reflects differences in participants’ time availability or opportunity costs of CD use.
16
and horserace news boosts political cynicism and weakens confidence in the electoral
process.
Aggregate Time Series Analysis of CD Use
We begin by presenting the aggregate-level popularity of individual pages.
Figure 1 plots the number of visits to each page. The most popular pages were those at
the very beginning of the CD. From the initial peak, the trend moved sharply downward.
The level of visits leveled off towards the end of Chapter 1, remained more-or less
consistent through Chapters 2 and 3 and then reversed direction by moving upward at
Chapter 4.
(Figure 1 here)
The pattern in Figure 1 suggests strong similarities between CD and web
browsing behavior. Studies of web browsing also demonstrate sharply diminishing
trends (Huberman and Adamanic, 2000; Huberman et al. 1998, Montgomery and
Faloutsos 2000); the frequency of visits to websites exhibits a power law, y=xa, with a
slope of close to –1.0. In other words, small values of X vary with extremely high
occurrences of Y, and vice-versa. Few browsers visit the great majority of websites,
most of them congregating at relatively few sites.
The CD visits fit the web browsing model in the sense that the first few pages
attracted the most visits. The layout of the CD, with its chronological chapter structure
and page numbering, encouraged users to commence browsing at the beginning, just if
they were reading a book. They continued until they lost interest or became fatigued.
Given their general disinterest in politics, many stopped sooner rather than later. Very
few read all the way to the final page. Hence the order of placement within the CD
17
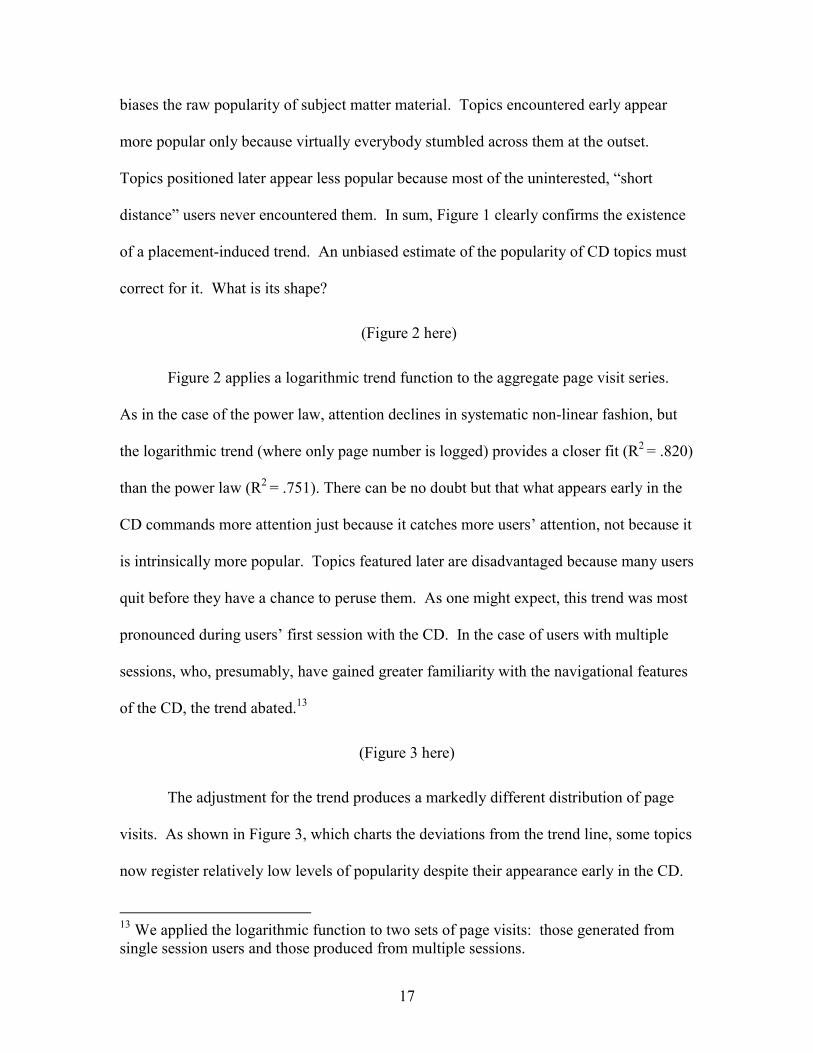
biases the raw popularity of subject matter material. Topics encountered early appear
more popular only because virtually everybody stumbled across them at the outset.
Topics positioned later appear less popular because most of the uninterested, “short
distance” users never encountered them. In sum, Figure 1 clearly confirms the existence
of a placement-induced trend. An unbiased estimate of the popularity of CD topics must
correct for it. What is its shape?
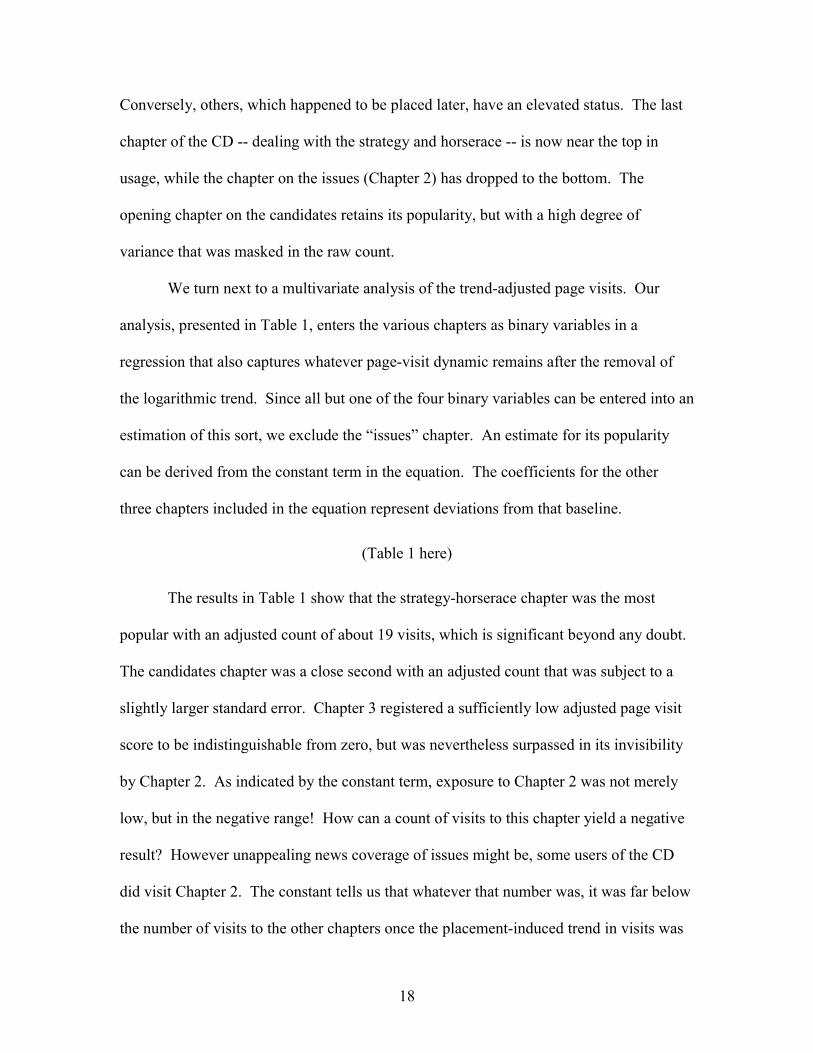
(Figure 2 here)
Figure 2 applies a logarithmic trend function to the aggregate page visit series.
As in the case of the power law, attention declines in systematic non-linear fashion, but
the logarithmic trend (where only page number is logged) provides a closer fit (R2 = .820)
than the power law (R2 = .751). There can be no doubt but that what appears early in the
CD commands more attention just because it catches more users’ attention, not because it
is intrinsically more popular. Topics featured later are disadvantaged because many users
quit before they have a chance to peruse them. As one might expect, this trend was most
pronounced during users’ first session with the CD. In the case of users with multiple
sessions, who, presumably, have gained greater familiarity with the navigational features
of the CD, the trend abated.13
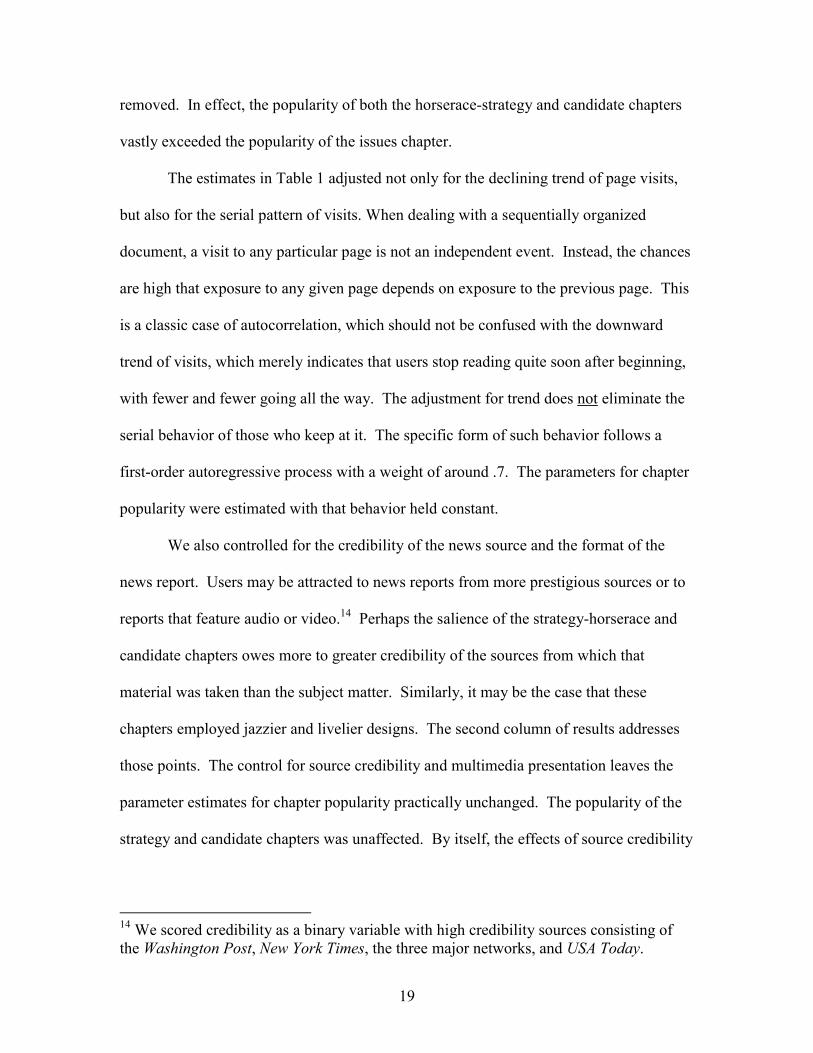
(Figure 3 here)
The adjustment for the trend produces a markedly different distribution of page
visits. As shown in Figure 3, which charts the deviations from the trend line, some topics
now register relatively low levels of popularity despite their appearance early in the CD.
13 We applied the logarithmic function to two sets of page visits: those generated from single session users and those produced from multiple sessions.
18
Conversely, others, which happened to be placed later, have an elevated status. The last
chapter of the CD -- dealing with the strategy and horserace -- is now near the top in
usage, while the chapter on the issues (Chapter 2) has dropped to the bottom. The
opening chapter on the candidates retains its popularity, but with a high degree of
variance that was masked in the raw count.
We turn next to a multivariate analysis of the trend-adjusted page visits. Our
analysis, presented in Table 1, enters the various chapters as binary variables in a
regression that also captures whatever page-visit dynamic remains after the removal of
the logarithmic trend. Since all but one of the four binary variables can be entered into an
estimation of this sort, we exclude the “issues” chapter. An estimate for its popularity
can be derived from the constant term in the equation. The coefficients for the other
three chapters included in the equation represent deviations from that baseline.
(Table 1 here)
The results in Table 1 show that the strategy-horserace chapter was the most
popular with an adjusted count of about 19 visits, which is significant beyond any doubt.
The candidates chapter was a close second with an adjusted count that was subject to a
slightly larger standard error. Chapter 3 registered a sufficiently low adjusted page visit
score to be indistinguishable from zero, but was nevertheless surpassed in its invisibility
by Chapter 2. As indicated by the constant term, exposure to Chapter 2 was not merely
low, but in the negative range! How can a count of visits to this chapter yield a negative
result? However unappealing news coverage of issues might be, some users of the CD
did visit Chapter 2. The constant tells us that whatever that number was, it was far below
the number of visits to the other chapters once the placement-induced trend in visits was
19
removed. In effect, the popularity of both the horserace-strategy and candidate chapters
vastly exceeded the popularity of the issues chapter.
The estimates in Table 1 adjusted not only for the declining trend of page visits,
but also for the serial pattern of visits. When dealing with a sequentially organized
document, a visit to any particular page is not an independent event. Instead, the chances
are high that exposure to any given page depends on exposure to the previous page. This
is a classic case of autocorrelation, which should not be confused with the downward
trend of visits, which merely indicates that users stop reading quite soon after beginning,
with fewer and fewer going all the way. The adjustment for trend does not eliminate the
serial behavior of those who keep at it. The specific form of such behavior follows a
first-order autoregressive process with a weight of around .7. The parameters for chapter
popularity were estimated with that behavior held constant.
We also controlled for the credibility of the news source and the format of the
news report. Users may be attracted to news reports from more prestigious sources or to
reports that feature audio or video.14 Perhaps the salience of the strategy-horserace and
candidate chapters owes more to greater credibility of the sources from which that
material was taken than the subject matter. Similarly, it may be the case that these
chapters employed jazzier and livelier designs. The second column of results addresses
those points. The control for source credibility and multimedia presentation leaves the
parameter estimates for chapter popularity practically unchanged. The popularity of the
strategy and candidate chapters was unaffected. By itself, the effects of source credibility
14 We scored credibility as a binary variable with high credibility sources consisting of the Washington Post, New York Times, the three major networks, and USA Today.
20
proved negligible. That may be less surprising than it seems. After all, users of the CD
did not have advance notice of the credibility of a particular news report before visiting it.
The “sound and light” associated with the presentation did make a substantial
difference to page popularity. Multimedia pages dominated text-only pages in attention.
However, controlling for the number of multimedia pages did little to affect the high
standing of the horserace-strategy and candidate chapters.
To this point we have examined use of the CD in relation to the general themes of
each chapter. Analysis at the chapter level, however, may mask important differences in
attention within each chapter. Which sections of the horserace chapter proved especially
appealing? Perhaps news coverage of some particular issue did attract users, who then
ignored everything else in that chapter. We focused our attention on the fourteen
subchapters, entering them as binary variables into an equation predicting page visits.15
These results are presented in Table 2.
(Table 2 here)
Once again, we have adjusted the tally of visits for both the logarithmic trend and
the serial dynamic in CD browsing. The first column in Table 2 confirms the hypothesis
that the horserace aspect of media coverage commanded the highest attention. The trend-
adjusted popularity score for this subchapter (41.5) vastly surpassed all others. Next
highest was “character” (25.0), followed by another aspect of the candidate chapter,
namely, “career highlights” (20.3). The two remaining subchapters in Chapter 4 --
dealing with campaign strategy (16.0) and money (10.7) -- also attracted significant
attention.
15 The excluded subchapter was from Chapter 2 and focused on “other domestic issues”.
21
Except for the horserace, campaign strategy, and the candidates’ personal and
career resumes, little else caught the eye. The remaining subchapters were generally
ignored. Issue-oriented coverage consistently failed to capture viewer interest, whether it
addressed the economy, education, or foreign policy. The solitary issues subchapter to
register a borderline significant response consisted of news reports that contrasted the
general ideological posture of the two candidates. None of the elements of Chapter 3,
whether they pertained to the campaign teams, the vice presidential nominees, or the
national conventions elicited more than a smattering of clicks. Adding the control for
source credibility and audiovisual presentation, as can be seen in the second column of
results in Table 2, left these findings practically unchanged. All told, the popularity of
horserace and candidate-oriented news proved independent of either the credibility of the
news source or the liveliness of the presentation.
To summarize the analysis of page visits, once we corrected the page visit data for
the appearance of the page within the CD, the most highly rated news reports were those
focusing on the strategy-horserace aspects of the campaign, followed by biographical
reports on the candidates. News reports on the issues and the nomination process were
altogether ignored.
Individual-Level Analysis of CD Use
We turn next to identifying the most active users of the CD. Table 3 provides
results based on two separate indicators of CD use -- the number of subchapters visited
and the logarithm of total page visits.16 The former measures breadth rather than quantity
16 The average number of subchapters visited was 6 with a range of 0 to 14. Total page visits ranged from 0 to 865. We opted for the logarithmic transformation of page visits [ln(1+page visits)] because the distribution exhibited considerable positive skewness
22
of exposure (as in the case of a respondent who looked at one page in all fourteen
subchapters), while the latter taps the sheer number of news reports accessed by the CD
user.
(Table 3 here)
Except for involvement in the campaign, CD use was generally uniform across
the indicators of socio-economic and political background. Breadth of exposure and the
total number of page visits increased significantly among voters with polarized views
about Gore and Bush. Political participation and Web activity further encouraged use of
the CD. Finally, younger CD users sampled from a greater variety of topical areas and
registered greater overall CD use. Greater exposure to the news reports among the young
suggests that technological “literacy” provides a sufficient impetus to overcome their
distaste for political affairs.
The evidence suggests two patterns in CD use. First, those more engaged by the
campaign were more apt to use the CD. In this respect at least, “new” and “old” media
converge. Second, new media use is contingent on technological proficiency. In the case
of younger voters, new media may entice them to pay attention to the political world.
We turn next to a chapter-by-chapter analysis. The fact that overall exposure to
the CD was generally unconstrained by attributes of the audience suggests that the
demand for campaign news may be more topical or subject matter-specific. Rather than
attempting to read the CD from beginning to end, respondents may have followed their
interests to news reports about particular aspects of the campaign. Perhaps people who
(median=101, mean=166) and heteroskedasticity. Logging the page visits improved the fit of the linear prediction model substantially.
23
were especially interested in the candidates’ personal background spent more time with
the news reports in Chapter 1, while others with a more policy bent were drawn instead to
Chapter 2. The suspicion that the demand for news is domain-specific was generally
confirmed.
We examined the total number of pages visited within each chapter, after first
controlling for the total number of page visits in the remaining chapters. In the case of
news reports focusing on the personal side of the candidates, for instance, we identified
people who looked at these reports more or less extensively, given their exposure to the
material presented in the remaining chapters. In considering use of Chapter 1, for
example, exposure to Chapters 2-4 provides the baseline. Our analytic strategy was to
begin with a ‘saturated” equation consisting of the full set of demographic, political, and
attitudinal predictors from which we eliminated those that did not meet an inclusion
criterion of p < .15.17 The resulting best-fitting prediction models for each chapter are
shown in Table 4.
(Table 4 here)
The results in Table 4 suggest considerable variability in exposure to Chapter 1.
Men and residents of metropolitan areas used Chapter 1 to a lesser degree, as did
infrequent Web users. Surprisingly, the effects of partisanship and ideology diverged:
while those who identified as liberals or conservatives visited Chapter 1 less frequently,
partisans did exactly the opposite. We can only speculate that ideologues found the
information about the candidates redundant, whereas partisans, even though they found
17 We used the “backwards elimination” stepwise regression procedure in SPSS.
24
the information just as old, may have scanned the reports nevertheless because of their
affect for the candidates.
Enthusiasm for the electoral process provided a further basis for self-selection
into the Chapter 1 audience. Attention to candidate-oriented news decreased significantly
among those expressing more cynical views about politicians. Apparently, information
about the candidates’ personas, family background and prior experience turned off the
more cynical.
Chapter 2 consisted of news reports detailing the candidates’ policy positions.
Naturally, we expected that attention to these reports would be heightened among the
politically engaged. Several of the observed differences did fit this gradient. The
audience for Chapter 2 was disproportionately male, older, partisan and more affluent.
On the other hand, issue-oriented news also attracted readers not known for their political
zest -- moderates, city dwellers, and people who rely on print media less frequently.
Finally, “techies” were conspicuously absent from the audience for issue-oriented news.
Chapter 3, devoted to the earlier stages of the campaign, was accessed least
frequently. Perhaps this material was redundant because most respondents had already
encountered sufficient information about the nominating conventions and the vice-
presidential candidates. The only individuals who deviated from this general indifference
were less frequent Web users and those who evaluated news media credibility
unfavorably.
Finally, who were the most avid followers of the horserace? As we have already
seen, Chapter 4 elicited considerable attention despite its adverse location, especially the
very last subchapter on the candidates’ standing in the polls. We had expected that the
25
horserace would attract a mix of sophisticated and naïve voters. Voters with the most at
stake in the race -- strong partisans, ideologues, and the politically active -- would be
especially drawn to this genre of news with its “insider” accounts of each campaign’s
tactics and the candidates’ prospects. But for the typical disengaged voter, news about
the state of the race and each candidate’s attempts to outdo the other is akin to the sports
section: it satisfies basic curiosity about the eventual outcome and is easily understood
without any prior familiarity with the candidates or their positions on the issues. In fact,
one of the explanations for the dominance of horserace news may be that it cuts across
the spectrum in appeal.
We identified five groups whose use of Chapter 4 exceeded their general CD use.
Three represented the more engaged strata of the electorate -- political activists, those
who self-identified as liberals or conservatives, and regular users of the print media.
Note that these same groups were “underachievers” in the case of Chapters 1 and 2. The
effects of cynicism were also reversed; while Chapter 1 attracted the more trusting,
Chapter 4 was substantially more popular among the cynics. Clearly, the consumption of
strategy-oriented news is endogenous to political cynicism. Finally, urban residents were
particularly attentive to the horserace. We are hard pressed to account for this effect, but
note once again, that the advantage of urban residents in the case of Chapter 4
corresponds to a significant disadvantage in the consumption of candidate and issue-
oriented news.
In general, the analysis of the individual chapters points to distinct audiences for
horserace and non-horserace news. Symptomatic of the fluctuating audience for different
areas of news coverage is the fact that gender, print media use, Web access, ideology,
26
partisanship, age and political trust all exerted opposite effects across chapters.
Horserace news, while attracting widespread interest from most quarters, proved
especially appealing to a mix of political enthusiasts and cynics.
Does Horserace News Contribute to Voter Cynicism?
A growing body of research (see Cappella and Jamieson, 1997; Patterson, 2000;
Valentino et al., 2001) attributes widespread public cynicism about governmental and
electoral institutions to the explosive growth in news reports that depict the candidates as
strategic actors, whose every action “is reduced to a single, simple human motivation --
the desire to win and to take the power that elected office provides” (Cappella and
Jamieson, 1997, p. 34). Although it is plausible that repeated exposure to this message
has the effect of encouraging cynicism, estimation of any such effects must adjust for the
reciprocal effects of cynicism on attention to horserace and non-horserace news.
We examined the effects of exposure to the strategy-horserace reports contained
in Chapter 4 on our measures of electoral enthusiasm after controlling for exposure to
hard news (combined page visits to Chapters 1-3). Exposure to hard news was treated as
exogenous to cynicism and efficacy,18 but exposure to the horserace was considered
endogenous. Not only was the index of cynicism a significant predictor of visits to
Chapter 4, both measures of efficacy also affected exposure to Chapter 4 inversely, even
though their contributions proved statistically non-significant.19 The results of the two-
18 The Hausman test for endogeneity (see Wooldridge, 2000, pp. 483-84) indicated that the sum of page visits to Chapters 1, 2 and 3 could be treated as exogenous to all three attitude measures. 19 We also computed the Hausman test comparing the ols and 2sls estimates of visits to Chapter 4 on the indices of cynicism, internal efficacy and external efficacy. The p values of the test statistics were sufficiently low (p < .25) to warrant the use of two-stage methods.
27
stage analyses are given in Table 5. For purposes of comparison, we provide both the
ordinary least squares and two-stage least squares estimates of the effects of exposure to
the horserace chapter.20
(Table 5 here)
In all three instances, the effects of exposure to horserace and non-horserace news
on electoral attitudes diverged. More frequent use of hard news bolstered confidence in
the motives of public officials, the responsiveness of electoral institutions, and even one’s
own capacity to make a difference. Greater consumption of horserace and strategy news
exerted precisely the opposite effect encouraging respondents to malign the motives of
public officials, question the value of elections, and deny their own political competence.
Note that in all three cases, the effects of exposure to Chapter 4 survived the more
stringent specification, in which we took into account the reciprocal influence of
cynicism and efficacy. In fact, the two-stage coefficients were only marginally weaker
than the ols versions. Overall, these results indicate unequivocally that the content of
horserace-strategy news is unflattering to the process; for every additional 50 page visits
to Chapter 4, cynicism scores increased by one quarter of a point (representing five
percent of the scale width). The magnitude of the effect proved just as large for ratings of
internal efficacy, but was weaker in the case of the index of external efficacy.
20 As instrumental variables for use of Chapter 4, we took advantage of the layout of the CD. Given the sequential nature of CD use, people who visited the last section of Chapter 3 were also especially likely to use Chapter 4. Our first stage equation for Chapter 4 page visits, accordingly, used visits to Subchapter 3.3, the number of CD sessions and urban residence as predictors. These instruments accounted for 48 percent of the variance in exposure to Chapter 4, but less than one percent of the variance in the cynicism, internal and external efficacy indices.
28
Given the number of articles and the variety of topics included in Chapter 4, we
cannot precisely specify the message underlying these effects. We can say, however, that
exposure to reports about the horserace (Subchapter 4-3) accounted for most of the
effects noted above. In fact, when we examined trust and efficacy in relation to visits to
the individual subchapters, the effects of Chapter 4 were almost entirely attributable to
the last subchapter (“Who’s leading in the polls?”).21 Exposure to poll-related news
coverage weakens confidence in the process, but exposure to strategy-related coverage
does not.
Conclusion
Horserace news is widely available for the simple reason that it attracts readers
and viewers. Our evidence shows that substantial numbers of readers sought out the
news reports on the horserace, even though these reports were located at the end of the
CD. After taking into account the longitudinal trend in page visits, horserace stories
attracted the most traffic within the CD, even more than “scandal” stories.
The public’s fascination with the horserace aspects of the election does not
necessarily mean that people are also taken by media accounts of the latest twists and
turns in campaign strategies. Our time series results show that demand for horserace
news was more than double that for news reports on campaign strategy. Voters are
interested in the question of who will win, but they are much less curious about
journalists’ analyses of the fundraising, advertising, and other elements of campaign
21 The ols and two-stage coefficients estimating the effects of the “Who’s Leading in the Polls?” subchapter on political cynicism, for example, were -.016 (.006) and -.026 (.014) respectively.
29
tactics. Nonetheless, voters find news reports on any aspect of campaign strategy more
interesting than news coverage of the issues.
Our analysis also indicates that it is news about the horserace per se rather than
interpretive accounts of candidate strategies that generates cynicism about the electoral
process. This result was surprising since the news reports in the horserace section were
primarily descriptive: they provided information about public support or opposition to
different elements of the two candidacies and did not reflect in any way on the
candidates’ motives. One might have expected that interpretive accounts, which tend to
insinuate or suggest insincerity, would be more likely to fuel voter cynicism. The
examples below illustrate the distinction between reports that are primarily descriptive
and those that are primarily interpretive:
Primarily descriptive: (L.A. Times) “Bush's opposition to abortion appeared more likely to help his candidacy than Gore's support of abortion rights will help his. When told that Bush opposes abortion, 27% of respondents say that makes them more likely to vote for him. But only 18% of respondents say Gore's support for legal abortion would make them more likely to vote for him.”
Primarily interpretive: (Washington Post) “The sudden escalation in rhetoric, both
on and off the airwaves, signaled a harsh new phase as the campaign heads into Labor Day weekend. The GOP ad indicates that the Bush campaign has grown sufficiently concerned about Gore pulling even or ahead in the polls to risk criticism with a frontal attack -- despite the obvious contrast to Bush's repeated call for a gentler tone in politics. Just yesterday, Bush said in Louisville that he wanted "to remind the young of America that politics doesn't have to be ugly and mean. It doesn't have to be a system that downgrades people to bring somebody up,” Bush said.
As these examples indicate, the report that we have categorized as “primarily
descriptive” was written not in an attempt to debunk or question the official
pronouncements of the two campaigns, but rather, to provide some context for the poll
results. In contrast, the “primarily interpretive” report (most of which were in the
strategy subchapter) explicitly cited poll results as the causes of each candidate’s
30
behavior. Thus, the Washington Post attributed the willingness of Governor Bush to
break his pledge of a positive campaign to Gore’s rising poll numbers. Our point here is
that in both manifest content and implication, the reports in the strategy section were
much more critical of the candidates than reports on the state of the horserace. Yet, our
results show that exposure to horserace news was more apt to generate cynicism than
exposure to strategy news.
We are in no position to specify the psychological processing of these different
news reports, but will speculate that the often-dismissive tone of the strategy frame
invites readers to perceive the news as biased, thus weakening the credibility of the
message. On the other hand, the “objectivity” of the horserace reports, coupled with
some “chronic” or built-in association between opinion polls and images of politicians
and political parties as insincere and self-interested actors, triggers the release of
cynicism in the audience for horserace news.
In closing, we consider the implications of our results for the practice of
journalism. Horserace news sells, but leaves voters unsold on the campaign and the
electoral process. Horserace news also prevents the candidates from promoting their
credentials and platforms. Hard news, on the other hand, is more relevant and
informative to voters, provides candidates greater “quality time” with the voters, and also
provides ample opportunities for journalists to inject their own interpretations and
analyses into the news. In addition to serving the instrumental needs of voters, journalists
and candidates, hard news bolsters public confidence in the process.
On purely civic grounds, the choice between hard news and horserace news is
obvious. On purely commercial grounds, the choice is equally obvious. Or is it? We
31
leave for another day consideration of arguments that a civic obligation arises from
commercial benefits (e.g., “subsidies” conferred on the broadcast media in the form of
free use of the airwaves) and focus instead on the prospect of actual economic returns
from circulation or viewership. Perhaps surprisingly, our results suggest that there should
be a market for one particular genre of hard news. News reports that focused on the
candidates’ personalities and their track records as public officials performed quite well
as attention-getters. Therefore, it should be possible to increase the share of news that
focuses on the candidates without substantially diminishing market share.
The “candidates as people” theme does attract readers, but news reports on the
issues furnish no equivalent “hook.” The general disutility of issue-oriented news thus
presents a profound disconnect between the theory and practice of election journalism.
Few scholars would disagree that issue-oriented news is an essential ingredient of serious
journalism. However, our results suggest that an “all issues” news outlet is unlikely to
survive past the first issue. Even allowing for the fact that the 2000 campaign lacked a
signature issue, CD users showed considerable aversion for issue-oriented news. What
can journalists do to make stories about the issues more relevant or marketable? One
approach might be to piggyback information about issue positions onto stories dealing
with the personal side of the candidates. Alternatively, polling on the issues allows
reporters to file policy-oriented horserace stories. The page visit data also suggest that
painting the candidates’ issue agendas in broad, ideological strokes is more likely to
attract attention than reporting on specific issues. Although these suggestions may strike
purists as a dilution of journalistic standards, some innovation seems essential if issue
reporting is to survive at all.
32
References
Anderson, Kristi, and Stuart J. Thorson. 1989. Public discourse or strategic game?
Changes in our conception of elections. Studies in American Political Development 3:
263-78.
Ansolabehere, Stephen, and Shanto Iyengar. 1995. Going Negative: How Political
Advertisements Shrink and Polarize the Electorate. New York: Free Press.
___. 1996. Messages forgotten: Misreporting in surveys and the bias toward minimal
effects. Unpublished paper, Department of Political Science, MIT.
Ansolabehere, Stephen, Behr, Roy, and Shanto Iyengar. 1994. The Media Game:
American Politics in the Television Age. New York: Macmillan.
Brady, Henry E., and Richard Johnston. 1987. What’s the primary message: Horserace
or issue journalism? Pp. 127-86 in Gary Orren and Nelson Polsby eds., Media and
Momentum. Chatham, N.J.: Chatham House.
Cappella, Joseph N., and Kathleen H. Jamieson. 1997. Spiral of Cynicism. New York:
Oxford University Press.
Clarke, Peter, and Susan Evans. 1983. Covering Campaigns: Journalism in
Congressional Elections. Stanford: Stanford University Press.
Dennis, M. J. 2001. Response Timing and Coverage of Non-Internet Households: Data
Quality in an Internet-Enabled Panel, Presented at the Annual Meeting of the American
Association for Public Opinion Research.
Hallin, D.R. 1992. Sound bite news. Journal of Communication, 42, 5-24.
Hess, S. J. 2000. Dwindling TV coverage fell to new low. USA Today, November 7.
33
Hofstetter, Richard C. 1976. Bias in the News: Network Television Coverage of the
1972 Campaign. Columbus: Ohio State University Press.
Huberman, Bernardo A., Pirolli, Peter L., Pitkow, James E., and Rajan M. Lukose. 1998.
Strong regularities in World Wide Web surfing. Science 280 (April): 95-97.
Huberman, Bernardo A., and Lada A. Adamic. 2000. Power-law distribution of the
WWW. Science 287(March): 2115a.
Jamieson, Kathleen H. 1992. Dirty Politics: Distraction, Deception and Democracy.
New York: Oxford University Press.
Kalb, Marvin. 1998. The rise of the “new news:” A case study of two root causes of
modern scandal coverage. Occasional Paper, The Joan Shorenstein Center, Kennedy
School of Government, Harvard University.
Krosnick, J. A., and L. Chang. 2001. A comparison of the random digit dialing
telephone survey methodology with Internet survey methodology as implemented by
Knowledge Networks and Harris Interactive, Presented at the Annual Meeting of the
American Association for Public Opinion Research.
Lichter, Robert S. 2001. A plague on both parties: Substance and fairness in TV election
news. Harvard International Journal of Press/Politics 6(Summer): 8-30.
Media Monitor, 2000. Journalists monopolize TV election news, Press Release, October
30.
Montgomery, Alan L. and Christos Faloutsos. 2000. Trends and patterns of WWW
browsing behavior. Unpublished paper, Carnegie Mellon University.
Patterson, T. E. 2000. Doing well and doing good: How soft news and critical
journalism are shrinking the news audience and weakening democracy. Occasional
34
Paper, The Joan Shorenstein Center, Kennedy School of Government, Harvard
University.
___. 1993. Out of Order. New York: Knopf.
Robinson, Michael J., and Margaret A. Sheehan. 1983. Over the Wire and on TV. New
York: Russell Sage Foundation.
Traugott, Michael W., and Paul J. Lavrakas. 2000. The Voter’s Guide to Election Polls,
2nd ed. New York: Chatham House Publishers.
Valentino, Nicholas A., Matthew Beckmann and Tami Buhr. 2001. A Spiral of
Cynicism for Some: The Contingent Effects of Campaign News Frames on Participation
and Confidence in Government. Political Communication 18 (Oct-Dec).
Wooldridge, Jeffrey M. 2000. Introductory Econometrics: A Modern Approach.
Stamford, CT: Southwestern College Publishing Co.
Zaller, John. 2002. A Theory of Media Politics. Chicago: University of Chicago Press.
Figure 1: Frequency of Page Visits
3.2 Camp. Org.
2.5 Other
Issue
s
2.4 Forei
gn Polic
y
2.3 Social Is
sues
2.2 E
conomy
2.1 Ideo
logy
1.3 Persona
lity
1.2 Career
3.1 Primarie
s
1.1 Family
Backgro
und
3.3 Conventi
on & VP
4.1 Mon
ey4.2 Stra
tegy 4.3 Horserac
e
0
50
100
150
200
250
1 101 201 301 401 501
Page Number in Media CD
Freq
uenc
y of
Vis
its
Figure 2: Page Visits with Trend
Note: The trend is based on a logarithmic time function.
Page Number in Media CD
6005004003002001000
Freq
uenc
y of
Vis
its300
250
200
150
100
50
0
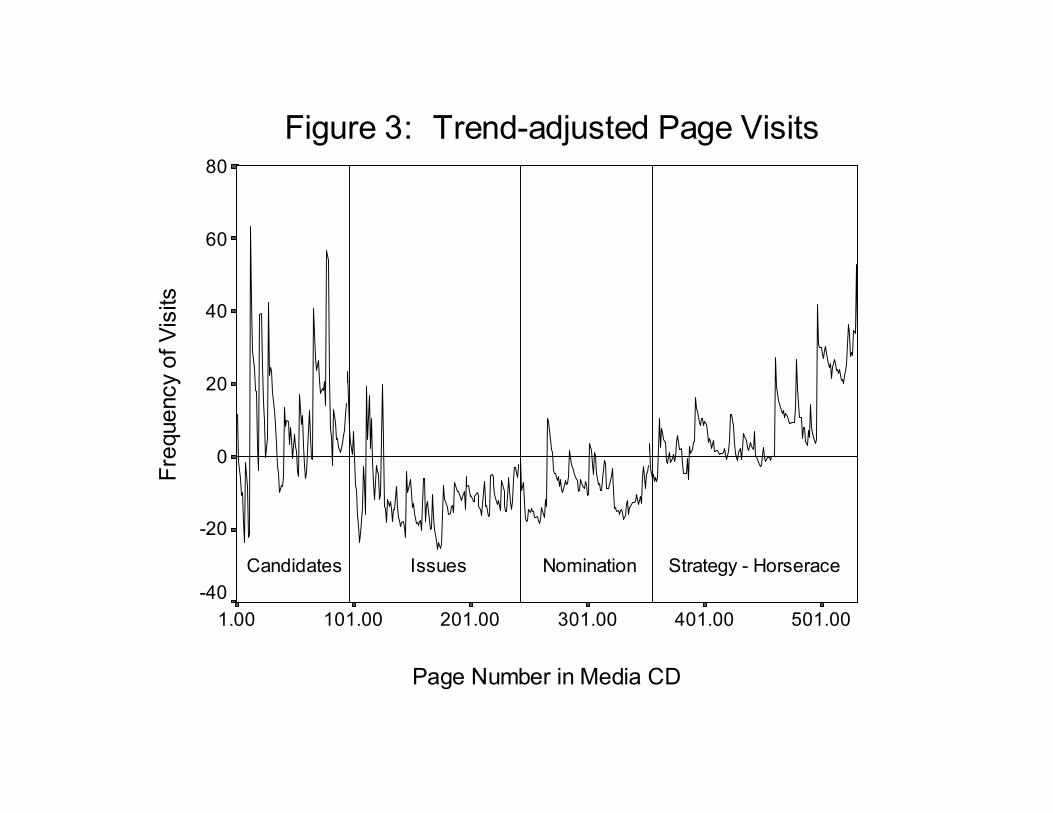
Figure 3: Trend-adjusted Page Visits
Page Number in Media CD
501.00401.00301.00201.00101.001.00
Freq
uenc
y of
Vis
its80
60
40
20
0
-20
-40Candidates Issues Nomination Strategy - Horserace
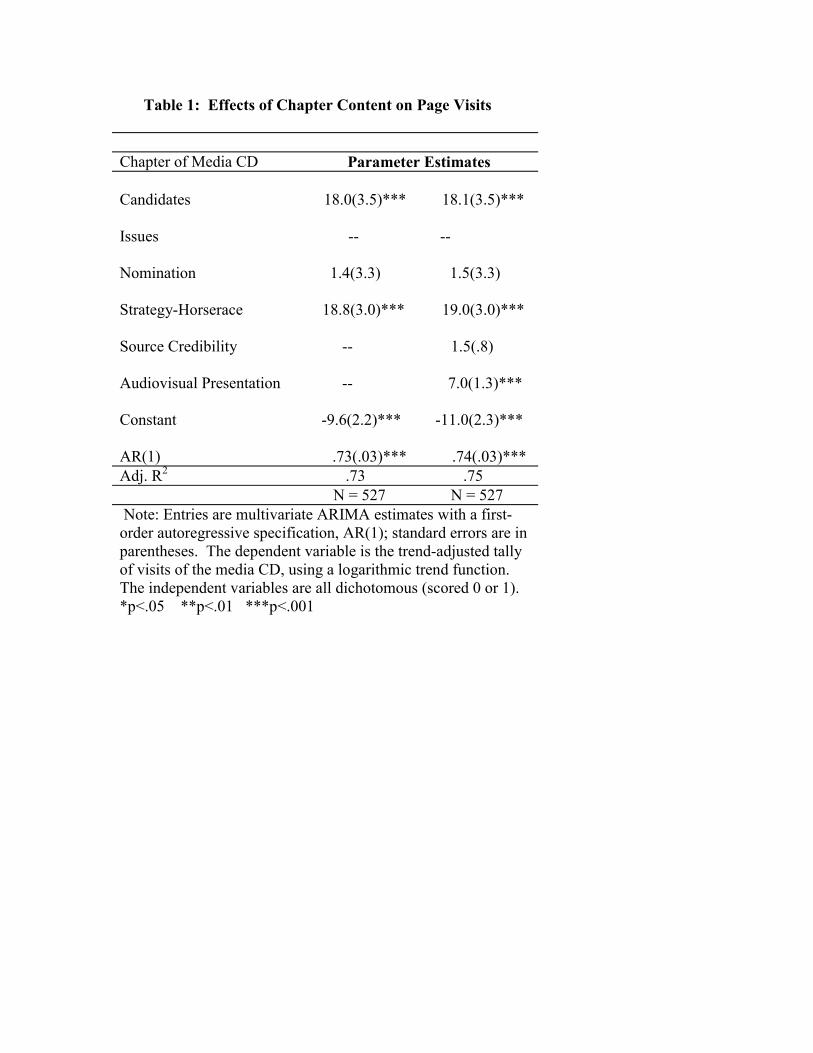
Table 1: Effects of Chapter Content on Page Visits
Chapter of Media CD Parameter Estimates Candidates 18.0(3.5)*** 18.1(3.5)*** Issues -- -- Nomination 1.4(3.3) 1.5(3.3) Strategy-Horserace 18.8(3.0)*** 19.0(3.0)*** Source Credibility -- 1.5(.8) Audiovisual Presentation -- 7.0(1.3)*** Constant -9.6(2.2)*** -11.0(2.3)*** AR(1) .73(.03)*** .74(.03)*** Adj. R2 .73 .75 N = 527 N = 527 Note: Entries are multivariate ARIMA estimates with a first-order autoregressive specification, AR(1); standard errors are in parentheses. The dependent variable is the trend-adjusted tally of visits of the media CD, using a logarithmic trend function. The independent variables are all dichotomous (scored 0 or 1). *p<.05 **p<.01 ***p<.001
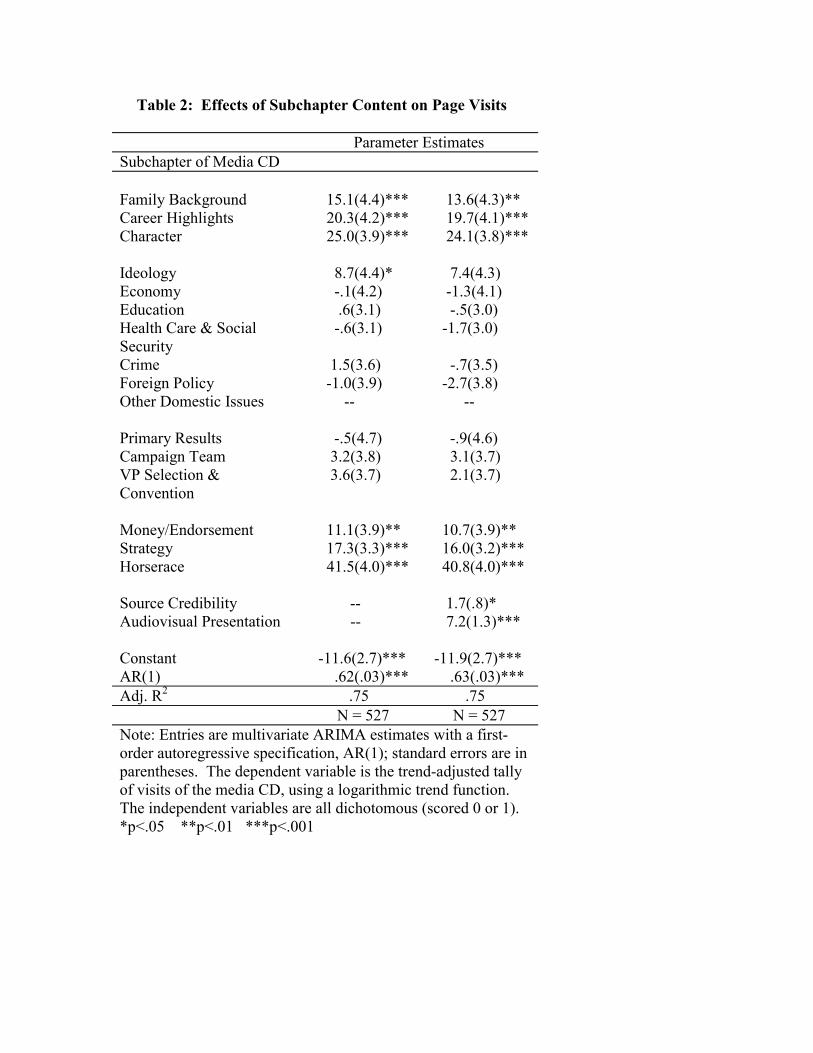
Table 2: Effects of Subchapter Content on Page Visits
Parameter Estimates Subchapter of Media CD Family Background 15.1(4.4)*** 13.6(4.3)** Career Highlights 20.3(4.2)*** 19.7(4.1)*** Character 25.0(3.9)*** 24.1(3.8)*** Ideology 8.7(4.4)* 7.4(4.3) Economy -.1(4.2) -1.3(4.1) Education .6(3.1) -.5(3.0) Health Care & Social Security
-.6(3.1) -1.7(3.0)
Crime 1.5(3.6) -.7(3.5) Foreign Policy -1.0(3.9) -2.7(3.8) Other Domestic Issues -- -- Primary Results -.5(4.7) -.9(4.6) Campaign Team 3.2(3.8) 3.1(3.7) VP Selection & Convention
3.6(3.7) 2.1(3.7)
Money/Endorsement 11.1(3.9)** 10.7(3.9)** Strategy 17.3(3.3)*** 16.0(3.2)*** Horserace 41.5(4.0)*** 40.8(4.0)*** Source Credibility -- 1.7(.8)* Audiovisual Presentation -- 7.2(1.3)*** Constant -11.6(2.7)*** -11.9(2.7)*** AR(1) .62(.03)*** .63(.03)*** Adj. R2 .75 .75 N = 527 N = 527 Note: Entries are multivariate ARIMA estimates with a first-order autoregressive specification, AR(1); standard errors are in parentheses. The dependent variable is the trend-adjusted tally of visits of the media CD, using a logarithmic trend function. The independent variables are all dichotomous (scored 0 or 1). *p<.05 **p<.01 ***p<.001
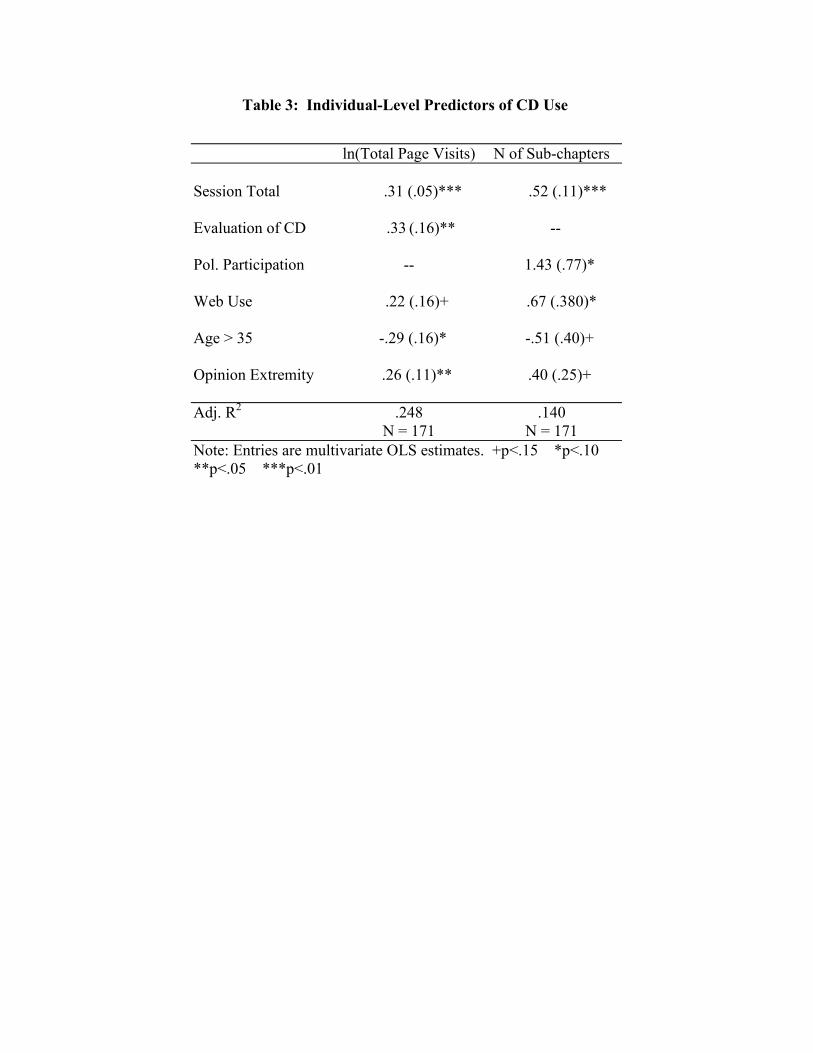
Table 3: Individual-Level Predictors of CD Use
ln(Total Page Visits) N of Sub-chapters Session Total
.31 (.05)***
.52 (.11)***
Evaluation of CD .33 (.16)** -- Pol. Participation
--
1.43 (.77)*
Web Use
.22 (.16)+
.67 (.380)*
Age > 35
-.29 (.16)*
-.51 (.40)+
Opinion Extremity
.26 (.11)**
.40 (.25)+
Adj. R2 .248 .140 N = 171 N = 171 Note: Entries are multivariate OLS estimates. +p<.15 *p<.10 **p<.05 ***p<.01
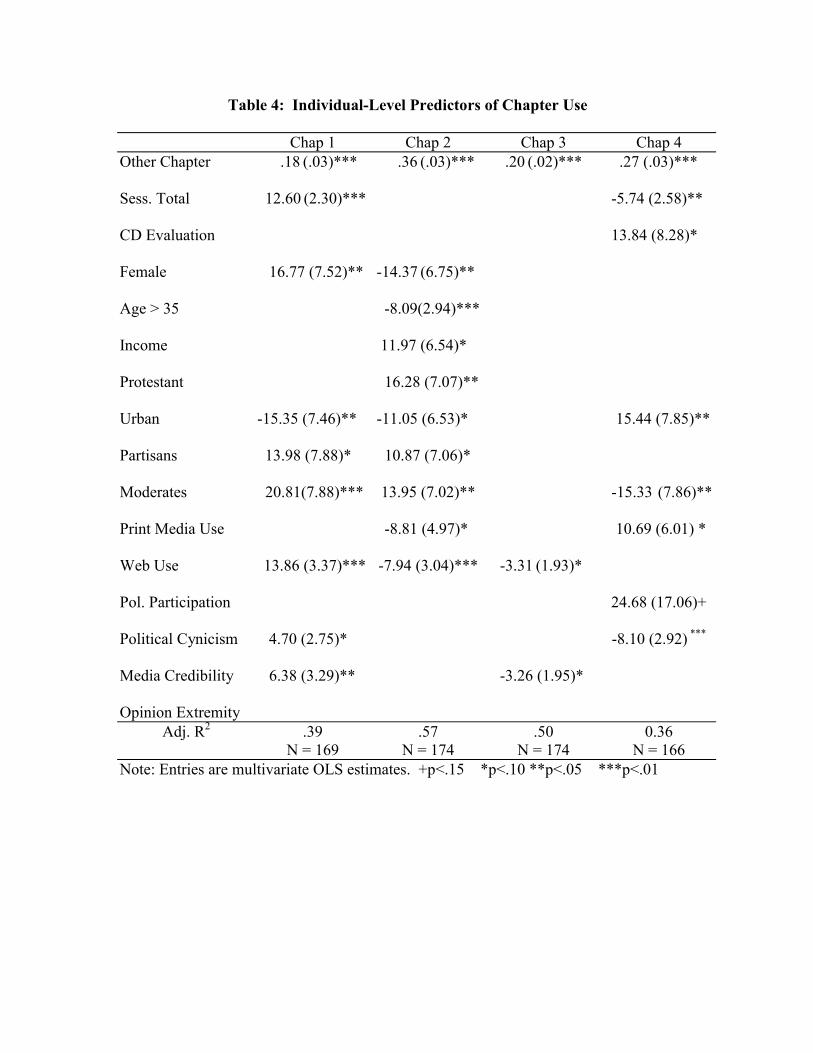
Table 4: Individual-Level Predictors of Chapter Use
Chap 1 Chap 2 Chap 3 Chap 4 Other Chapter .18 (.03)*** .36 (.03)*** .20 (.02)*** .27 (.03)*** Sess. Total 12.60 (2.30)*** -5.74 (2.58)** CD Evaluation 13.84 (8.28)* Female 16.77 (7.52)** -14.37 (6.75)** Age > 35 -8.09(2.94)*** Income 11.97 (6.54)* Protestant 16.28 (7.07)** Urban -15.35 (7.46)** -11.05 (6.53)* 15.44 (7.85)** Partisans 13.98 (7.88)* 10.87 (7.06)* Moderates 20.81(7.88)*** 13.95 (7.02)** -15.33 (7.86)** Print Media Use -8.81 (4.97)* 10.69 (6.01) * Web Use 13.86 (3.37)*** -7.94 (3.04)*** -3.31 (1.93)* Pol. Participation 24.68 (17.06)+ Political Cynicism 4.70 (2.75)* -8.10 (2.92) *** Media Credibility 6.38 (3.29)** -3.26 (1.95)* Opinion Extremity
Adj. R2 .39 .57 .50 0.36 N = 169 N = 174 N = 174 N = 166
Note: Entries are multivariate OLS estimates. +p<.15 *p<.10 **p<.05 ***p<.01
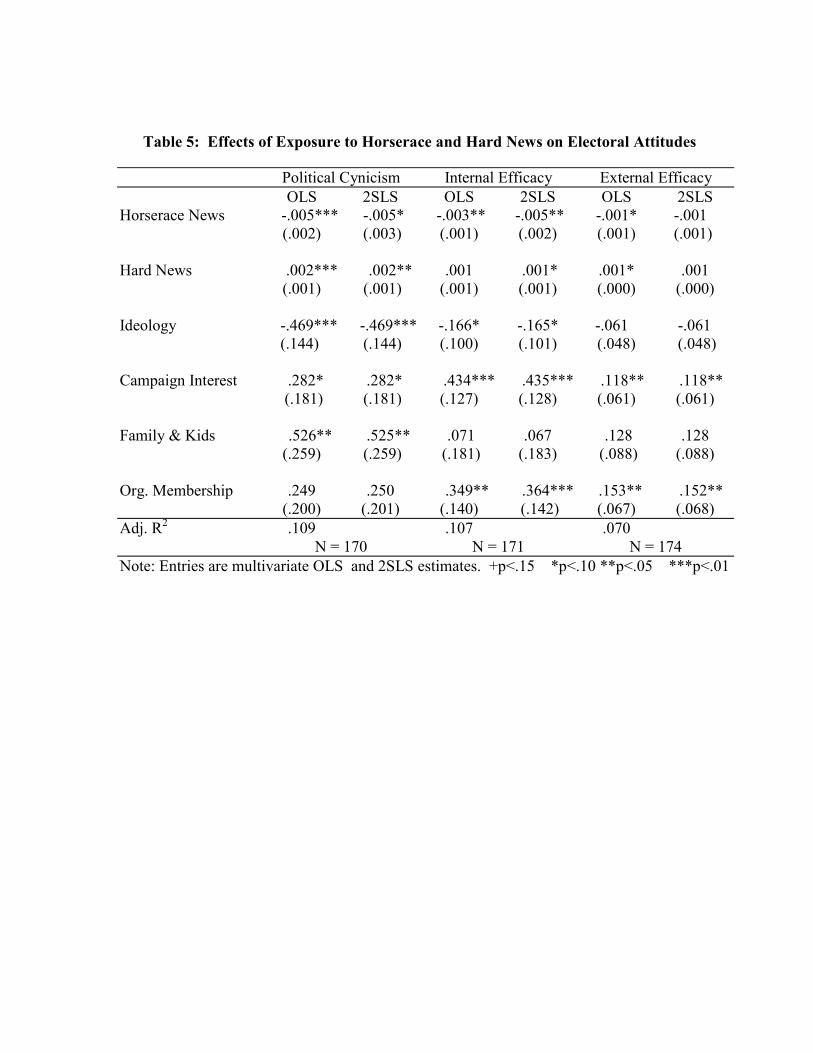
Table 5: Effects of Exposure to Horserace and Hard News on Electoral Attitudes
Political Cynicism Internal Efficacy External Efficacy OLS 2SLS OLS 2SLS OLS 2SLS
Horserace News -.005*** (.002)
-.005*
(.003) -.003** (.001)
-.005** (.002)
-.001* (.001)
-.001 (.001)
Hard News .002*** (.001)
.002** (.001)
.001 (.001)
.001* (.001)
.001* (.000)
.001 (.000)
Ideology -.469*** (.144)
-.469*** (.144)
-.166* (.100)
-.165* (.101)
-.061 (.048)
-.061 (.048)
Campaign Interest .282* (.181)
.282* (.181)
.434*** (.127)
.435*** (.128)
.118** (.061)
.118** (.061)
Family & Kids .526** (.259)
.525** (.259)
.071 (.181)
.067 (.183)
.128 (.088)
.128 (.088)
Org. Membership .249 (.200)
.250 (.201)
.349** (.140)
.364*** (.142)
.153** (.067)
.152** (.068)
Adj. R2 .109 .107 .070 N = 170 N = 171 N = 174 Note: Entries are multivariate OLS and 2SLS estimates. +p<.15 *p<.10 **p<.05 ***p<.01