Embed Size (px)
Citation preview

Monetary Authority of Singapore
Consultative Paper Credit Stress-Testing
31 January 2002

PREFACE
The last decade saw an increase in the number of shocks that financial markets were subjected to. These shocks have also shown a greater tendency to spread to other financial markets, aided by improved financial infrastructure and lower barriers to international capital flows. The anticipation and management of these financial crises are among the most pressing problems faced by financial institutions. Stress-testing offers financial institutions a systematic methodology to prepare for financial crises. In this regard, MAS has prepared a consultative paper that aims to provide risk managers with some guidance in constructing and conducting credit stress tests. Although banks that possess counter-party risk rating and credit portfolio risk management tools can take better advantage of the techniques outlined in this paper, the principles contained therein are equally applicable to banks that have yet to build quantitative credit risk management systems. The guidelines are neither prescriptive nor are they the minimum requirements that banks adopting the Internal Ratings Based (IRB) approach under the New Basel Capital Accord are required to meet in respect of stress testing. They do, however, reflect market best practices that banks should aspire towards. A working draft of this paper is available at www.mas.gov.sg/. We welcome your feedback and comments and would appreciate receiving them by 1 May 2002. Please write to us at: Financial Risk Management Division Market Infrastructure and Risk Advisory Department Monetary Authority of Singapore #17-00, MAS Building, 10 Shenton Way, Singapore 079117 Alternatively, you can submit your comments via electronic mail to [email protected] Enoch Ch’ng Executive Director 31Jan2002
iii
Contents
Section A: Stress-Testing - What & Why...................................................................... 1
1.0 Introduction................................................................................................................ 1
1.1 Two-pronged approach to Credit Risk management ................................ 2
1.2 What is Stress-testing ........................................................................................ 4
1.3 Features of Previous Stress Events ............................................................... 5
1.3.1 Correlation Breakdowns............................................................................. 5
1.3.2 Illiquidity.......................................................................................................... 5
1.3.3 Hedging Techniques Fail........................................................................... 6
1.3.4 Speed in Spread of Shocks ...................................................................... 6
1.4 Relevance of Stress-tests to Emerging Markets ........................................ 6
1.5 Why Publish Stress-testing Guidelines......................................................... 8
1.5.1 Introduce Stress-testing ............................................................................. 8
1.5.2 Asian Markets Volatility.............................................................................. 8
1.5.3 IRB Approach to Capital Adequacy........................................................ 8
Section B: Stress-Testing - How ...................................................................................10
2.0 What are the Elements of a Good Credit Stress-testing Programme ....10
2.1 Large Moves........................................................................................................10
2.2 Re lated to Portfolio and Economic environment ......................................10
2.3 Includes all Related Risk Factors ..................................................................11
2.4 Top management Buy-in / Plausibility.........................................................11
2.5 Report few Stress-Test Results .....................................................................11
2.6 Remedial Measures/ Granularity ..................................................................11
2.7 Update Stress-Tests Regularly ......................................................................12
2.8 Documented Policy...........................................................................................12
3.0 Credit Stress-testing for the Loan Book - Tools ............................................13
3.1 Counterparty Rating System..........................................................................13
3.1.1 Quantitative Rating models .....................................................................13
3.1.2 Qualitative Rating Scales ........................................................................14
3.2 Credit Portfolio Risk Management System (CPRMS)............................15

iv
4.0 Constructing a Stress-testing Programme......................................................17
4.1 Ensure Reliability of Data ................................................................................18
4.1.1 Credit Position Data – Trading Book....................................................18
4.1.2 Credit Position Data – Loan Book.........................................................18
4.1.3 Market Data .................................................................................................19
4.1.4 Risk Analytics ..............................................................................................19
4.2 Survey...................................................................................................................20
4.2.1 Portfolio .........................................................................................................20
4.2.2 Environment................................................................................................20
4.2.3 Widespread Consultation ........................................................................21
4.3 Types of Risk Factors.......................................................................................21
4.3.1 Credit Risk Factors – Loan Book ..........................................................22
4.3.2 Credit Risk Factors – Trading Book .....................................................24
4.3.3 Model Risk Factors....................................................................................25
4.3.4 Other Risk Factors .....................................................................................26
4.4 Magnitude of Factor Shock .............................................................................28
4.5 Constructing Stress-Tests...............................................................................29
4.5.1 Single Factor Stress-Tests ......................................................................29
4.5.2 Multi-factor Stress-Tests ..........................................................................33
Historical Scenarios .............................................................................................33
Hypothetical Scenarios.......................................................................................35
4.6 Conducting S tress-tests...................................................................................37
4.7 Reporting Stress-Test Results.......................................................................38
4.8 Systematically reassessing appropriateness of Stress-Tests ..............38
Section C –Stress-Testing - Applications ...................................................................39
5.1 Identifying Risk Concentrations .....................................................................39
5.2 Restructuring Positions / Hedging ................................................................39
5.3 Monitoring Stress Loss Limits ........................................................................39
5.4 Spur Discussion .................................................................................................40
6.0 Conclusions ..............................................................................................................41
7.0 Technical Annexure...............................................................................................42

v
7.1 Correlation Matrix ..............................................................................................42
7.2 Monte Carlo Simulations .................................................................................43
7.3 Extreme Value Theory......................................................................................43
8.0 Glossary....................................................................................................................45
9.0 List of Abbreviations ..............................................................................................46
10.0 References.............................................................................................................47
1
SECTION A: STRESS-TESTING - WHAT & WHY
1.0 INTRODUCTION
In finance, risk is defined as uncertainty of returns from a portfolio1. The
uncertainty is gauged by the volatility of a portfolio’s returns, with higher
volatility indicating higher risk. The volatility of returns is directly or indirectly
influenced by numerous variables, which are called risk factors. For example,
an equity index is one of the risk factors that influences the value of an equity
portfolio while the prime rate is one of the risk factors that affects the value of
a loan or bond portfolio. Even simple portfolios made up of a few basic
financial instruments are influenced by numerous risk factors.
One of the risk manager’s primary objectives is to measure the influence of
each risk factor on the volatility of portfolio returns and to manage the
composition of the portfolio so that the volatility of its returns is reduced.
Further, the risk manager must also measure the influence of the risk factors
on each other2. Disentangling the effects of multiple risk factors and
quantifying the influence of each is a fairly complicated undertaking.
There is a distinct difference in the behaviour of risk factors during normal
business conditions and during stressful conditions such as financial crises. In
ordinary business conditions the behaviour of risk factors is relatively less
difficult to predict because their behaviour does not significantly change in the
short to medium term. Therefore, future behaviour can be predicted, to an
extent, from past performance. However, during stressful conditions the
behaviour of risk factors becomes far more unpredictable and past behaviour
offe rs little help in predicting future behaviour.
1 A portfolio could be made up of just one security. 2 The statistical measure of which is the 'Covariance'.

2
This is why risk managers are well-advised to adopt a two-pronged approach
to risk management, where on the one hand they use various qualitative and
quantitative techniques to measure risk in ordinary business conditions, while
on the other, they use stress-tests to quantify likely losses under stress
conditions. We examine more closely below, the two-pronged approach that
may be adopted for comprehensive credit risk management.
1.1 Two-pronged approach to Credit Risk management
Figure 1: The two-pronged approach
Normal Business Conditions
Most banks manage Credit Risk* in ordinary business conditions at two levels,
the counterparty level and the portfolio level. Qualitative credit risk
assessment at the counterparty level is one of the oldest functions of banking
and is a mature discipline, but quantitative management of credit risk at the
counterparty and portfolio levels is still in a nascent stage.
A quantitative credit risk model enables a bank to arrive at a numeric measure
of the likelihood that a counterparty will default. This numeric measure is
called the Probability of Default (PD).
* Please refer to the Glossary
Stress Conditions Credit Stress-testing
Normal Conditions Credit Portfolio Risk Mgt.
Counterparty Risk Assessment

3
A Credit Portfolio Risk Management System (CPRMS) uses the PDs and
several other factors, including the correlation between the risk factors, to
arrive at the Credit Value at Risk (Credit VaR). This process is illustrated in
Figure 2 below.
Figure 2: The Credit Risk Management Process
Stress Conditions
Most risk monitoring systems, whether quantitative or qualitative, are best
suited for normal business conditions because they use the past behaviour of
risk factors to predict future behaviour.
Further, quantitative portfolio management systems like Credit VaR models,
predict the maximum loss of a portfolio, at a specific probability level, over a
given time interval, in normal business conditions. For example, a 1-day VaR
of SGD1million at a 99% probability level indicates that expected losses would
not be greater than SGD1million in 99 days out of every 100. However, VaR
Counterparty
Credit Risk
Model
Financial
Industry
Economy
Market data
PDs Credit
Portfolio
Risk Model
Credit
VaR
Correlations
Positions

4
does not specify the magnitude of loss that could be incurred on the remaining
1 day. That 1 bad day is all that may be required to break a bank.
This is why banks should consider adopting a two-pronged approach to credit
risk management whereby day-to-day risk is managed with quantitative and
qualitative counterparty and portfolio risk management systems, while
exceptional risk is managed through stress-testing.
1.2 What is Stress-testing
The BIS committee on the global financial system (BCGFS) (2000) defines
'Stress-testing' as – "a generic term describing various techniques used by
financial firms to gauge their potential vulnerability to exceptional but plausible
events".
The techniques that determine the effects of stress events on the Credit Risk
borne by an institution are called Credit Stress-Tests.
The two key words used to define a stress event are 'exceptional' and
'plausible'. Stress-testing assesses effects of only exceptional (that is, low
probability) events rather than of ordinary 'bad news'. However, while stress
events must be low-probability incidents, they should not be so far-fetched as
to stretch the limits of plausibility. This is because implausible stress-tests do
not provide meaningful results on the strength of which risk managers can
plan corrective action.
Recently however, stressful events have been occurring with alarming
regularity and while they are no longer ‘low probability’ their impact is still
severe. In the last 10 years alone there have been about 10 stress events,
some examples of which are the Gulf War, the Asian Crisis and the Russian
5
Default3. The most recent of these crises were the terrorist attacks of
September 11 th and the Argentine default.
1.3 Features of Previous Stress Events
A review of some features of previous stress events will help to underscore
the importance of credit stress-testing and illustrate the need for the two-
pronged approach.
1.3.1 Correlation Breakdowns
One of the main objectives of risk management is to diversify portfolios (make
sure that all eggs are not in one basket) so as to reduce portfolio volatility.
This objective is met by trying to ensure that securities with the least
correlation (or where possible, negative correlation) are chosen for the
portfolio. However, the most significant effect of stress events is that the
correlations that prevail in ordinary conditions cease to exist and risk
managers are confronted with new correlations that lead to unexpected
concentrations of risk. Likewise, banks may have diversified their loan
portfolios by giving loans to different industries/currencies etc. However,
during a stressful event, all these industries may register higher likelihood of
default, thus nullifying the objective of diversification.
1.3.2 I lliquidity
To make matters worse, in a stress event, once a risk manager recognises
that there is a concentration of risk, he is unable to unwind positions because
many crises are characterised by an abrupt lack of liquidity in financial
markets. Thus even if risk managers want to sell their securities to rebalance
their portfolios, they are unable to find buyers. The predicament of loan
portfolios is even worse because even in ordinary business conditions these
portfolios are relatively less liquid than market portfolios.
3 For details see 4.5.2 – Historical Scenarios.

6
1.3.3 Hedging Techniques Fail
Most risk managers hedge their portfolios to alleviate risk. However, hedging
instruments may be rendered invalid during stress events because key
assumptions built into their pricing models may cease to be applicable.
1.3.4 Speed in Spread of Shocks
Globalisation and the introduction of state -of-the-art technology in financial
markets have helped to improve efficiency of markets. However, they have
also helped to spread shocks rapidly across all markets. Therefore, when a
stress event strikes even a related market, it spreads rapidly, giving the risk
manager very little time to react. This is why stress-tests and risk mitigating
mechanisms need to be well-entrenched to facilitate prompt remedial action.
1.4 Relevance of Stress-tests to Emerging Markets
Recent history shows us that stressful events occur with higher frequency in
emerging markets as compared to developed financial markets because these
markets are not only susceptible to financial risk factors, but also to
macroeconomic, sociological and political factors. The recent economic crisis
in Asia was a good example of this phenomenon when plunging exchange
rates, in a vicious cycle, destabilised political regimes leading to still steeper
falls in exchange rates which in turn led to even more political uncertainty.
The BCGFS (Feb 2001) survey points out that stress-tests are more relevant
for banks with exposure to emerging markets because these markets are less
liquid and have re latively lower quality data to allow for proper calculation of
PDs. According to the survey, among the various regional scenarios stress-
tested by banks, emerging market scenarios are the most widely used.
Many banks with Asian exposures paid a heavy price for the lack of a two-
pronged approach during the Asian Economic crisis of 1997 -98. Prior to the

7
crisis, banks deemed the credit worthiness of most of their borrowers to be
satisfactory, using their traditional expertise in counterparty risk assessment.
However, this assessment was applicable only to normal business conditions.
As soon as the exceptional event – the crisis – struck, the entire foundation on
the basis of which the counterparties were adjudged to have been credit-
worthy changed, resulting in extreme losses. Rating agencies also assigned
high corporate and sovereign ratings to counterparties in Southeast Asia
before the crisis, on the basis of their excellent export performance and
macroeconomic and political stability. However, once the crisis struck, even
ratings of corporates with sound business prospects were downgraded
because of the deterioration in macroeconomic and socio-political conditions.
The credit quality of portfolios was also severely eroded by extreme
movements in the equity and FX markets that had, hitherto, not received much
importance in counterparty credit assessment procedures.
This illustrates the importance of a two -pronged approach to credit risk
management. If banks had had sound qualitative and quantitative
counterparty credit risk assessment systems, a CPRMS and a credit stress-
testing programme, they may have been able to estimate likely losses in a
crisis and make appropriate contingency plans.
Since the most significant proportion of the total risk of most banks is
engendered by credit risk4, it is cause for concern that many banks neither
quantitatively measure credit risk at the counterparty and portfolio levels nor
conduct credit stress-tests.
4 For example, a leading well-diversified global bank calculates that 60% of its total risk is due to
credit risk – 1999 Annual Report
8
1.5 Why Publish Stress-testing Guidelines
1.5.1 Introduce Stress-testing
Our objective in publishing these guidelines is to help credit risk managers
appreciate the importance of credit stress-tests and to provide them a
guideline with which to construct and conduct credit stress-tests. A bank's
credit risk management efforts are incomplete if they do not include a
comprehensive stress-testing programme.
1.5.2 Asian Markets Volatility
As mentioned in 1.4, a stress-testing programme assumes more importance
for banks operating in Singapore because Asian financial markets are more
volatile than those of developed markets and are more susceptible to stressful
events. Financial market volatility not only directly affects the credit risk of a
trading portfolio but also the credit risk of the loan book. For example, a good
credit stress-test for Argentinean banks would have been a breakdown of the
Peso-USD peg. Likewise, any risk manager who has been through the
turbulent Asian economic crisis ('97-'98) needs no convincing about the
importance of credit stress-testing.
1.5.3 IRB Approach to Capital Adequacy
The Basel Committee on Banking Supervision (BCBS) also recognises the
importance of credit stress-testing.
Regulators require banks to set aside adequate capital to buffer expected
losses. Since banks are more likely to become insolvent during times of stress
rather than in ordinary business conditions, regulators seek to ensure that
banks have a comprehensive stress-testing programme, besides a good
internal risk rating methodology. BCBS (1995) had used the same line of
reasoning to insist that banks that use the internal models approach for
market risk capital requirements have in place a rigorous and comprehensive
stress-testing programme.

9
The second consultative document issued by the BCBS on the new Basel
Capital Accord (2001), also specifically mentions that banks that adopt the
IRB approach for calculating capital requirements must undertake stress-
testing. To quote: - (c) Stress-tests used in assessment of capital adequacy 297. A bank must have in place sound stress-testing processes…Stress-testing should
involve identifying possible events or future changes in economic conditions that could have unfavorable effects on a bank’s credit exposures and assessment of the bank’s ability to withstand such changes….
Thus, as regulators move towards setting internal rating based capital
adequacy norms, financial institutions may be obliged to conduct credit stress-
tests. This guideline seeks to assist risk managers to prepare for such a
prospect.
The rest of this report is structured as follows. In 2.0 we examine the features
of good credit stress-tests and in 3.0 the tools that would help risk mangers
conduct more precise stress tests. Section 4.0 examines the procedure by
which to construct and conduct stress-tests and 5 .0 its applications.
10
SECTION B: STRESS-TESTING - HOW
2.0 WHAT ARE THE ELEMENTS OF A GOOD CREDIT STRESS -TESTING PROGRAMME
Before discussing the procedure by which a bank can construct credit stress-
tests, we examine the features of good stress-tests.
2.1 Large Moves
A stress-test should measure the effect of only large moves in risk factors
because day-to-day risk management takes care of small moves. One must
bear in mind BIS' definition of stress-testing that specifies that stress events
should be ‘exceptional’.
2.2 Related to Portfolio and Economic environment
The most important test of the suitability of a stress-test is its appropriateness
to the securities in the portfolio as well as to prevailing economic and political
factors. Good stress-tests take into account current positions and probe for
portfolio -specific weaknesses.
To take an example, if a fixed income trading book contains linear positions
then a stress-test involving a straight increase or decrease of a given number
of basis points in interest rates would make a sufficient stress-test. However,
the same stress-test for a non-linear book may be inappropriate.
Also, risk managers are more likely to enhance the appropriateness and
plausibility of their stress-tests if they survey as many experts as possible,
including front line managers, economists, external industry experts and
academics.

11
2.3 Includes all Related Risk Factors
While at the trading desk or relationship manager level a stress-test involving
a large move in one risk factor may be appropriate, comprehensive stress-
testing programmes should include scenarios that stress several factors at the
same time because when stress events occur in the real world, they are more
likely to involve collective adverse moves in several risk factors.
2.4 Top management Buy-in / Plausibility
The BIS definition of stress-testing specifies that stress-tests should be
plausible. The lack of plausibility causes the biggest problem in 'selling' stress-
test results to senior management. Top management should have active
knowledge of, and where possible, involvement in the process of designing
stress-tests, stress limits and in drawing up plans for remedial action.
2.5 Report few Stress-Test Results
Most risk managers have found that formal reporting of only a few stress-test
results, helps top management digest the results quickly and take remedial
action promptly. Off the stress-tests reported, at least a few must be of tests
that are regularly conducted, so as to allow management to understand the
changing risk profile of the portfolio.
2.6 Remedial Measures/ Granularity
Each stress-test should be accompanied by a clear set of pre -agreed plans of
remedial action. These remedial measures could include unwinding or
restructuring of positions or portfolios, entering into hedging transactions etc.
Such actions will be possible only if stress-test results are granular and can
pinpoint the causes for the stress losses.
12
2.7 Update Stress-Tests Regularly
Stress-tests should also be updated regularly because new financial
instruments are being introduced all the time. For example, if a bank begins to
use credit derivatives including options, it can consider using new stress-tests
that incorporate stressing volatilities. Further, regulatory changes as well as
macroeconomic policy decisions may change the assumptions that lie behind
existing stress-tests. For example, if Hong Kong were to scrap the Hong Kong
dollar’s peg to the US dollar, then portfolios where the Hong Kong dollar is a
risk factor would be seriously affected. Therefore, existing stress-tests would
have to be re-designed to take into account a free float of the Hong Kong
dollar5.
2.8 Documented Policy
Lastly, the objectives, procedures, authorities, responsibilities and all other
aspects of the stress testing programme should be drafted as a policy paper
and authorised at the highest levels of the bank, so that the stress-testing
programme is institutionalised.
5 Lifting of the Hong Kong dollar’s peg to the US dollar would, per se, make a good stress-test.

13
3.0 CREDIT STRESS-TESTING FOR THE LOAN BOOK* - TOOLS
Banks that possess the following tools will be able to conduct stress-tests
more easily. Those that do not do so can also conduct stress-tests, though
they may face some obstacles.
3.1 Counterparty Rating System
For a bank to conduct credit stress-tests, the primary requirement is a
consistent rating system to rate the credit-worthiness of counterparties. A
credit rating/credit grade is the banks' assessment of the likelihood of default
by the counterparty, which not only takes into account the ability and the
willingness of the counterparty to pay its dues, but also the type of facility,
collateral etc. The most important feature of a rating system is consistency.
That is, all counterparties assigned the same risk grade must have a similar
likelihood of default. Only a consistent rating system will enable a bank to
group counterparties by risk grades, for further analysis.
3.1.1 Quantitative Rating models
A quantitative credit rating system allows a bank to arrive at a numerical
measure of the probability of default (PD) of each rating. The PD enables a
bank to estimate the probability that a counterparty will default. For example, if
Standard & Poors rates a counterparty AAA, then the probability that it will
default is 0.05%6.
Internal Ratings
Some banks construct their own rating scale and calculate PD for each rating.
Such a task presupposes the existence of a vast body of credit histories at the
banks’ end, because only a sufficiently large volume of data will give accurate
estimates of the PD for each risk grade. Further, the data must cover several
* Please refer to the Glossary 6 Standard & Poor's (1999)

14
economic/industry cycles so that consistency and validation of ratings over
time is ensured.
Once a bank has built its own rating scale, it must check whether the
counterparties that have been assigned various ratings, do in fact default in a
manner consistent with the predicted PD, by periodically back-testing the
output of the model. If they do not default as per the predicted PD, then the
rating process should be amended to ensure that rating is being done in a
manner consistent with the predicted PDs.
External Ratings
Banks that do not have the vast body of counterparty data required to predict
PDs may use the ratings and PDs calculated by rating agencies. One method
of using external PD data is to map the bank's internal rating scale to that of
an external rating agency, with some adjustments if necessary. Once such a
mapping is done, the bank can use the external rating agencies' PD data for
its own portfolio. However, the bank should ensure that in future, it continues
to grade its counterparties in the same manner as when the mapping was
originally done. Using a rating agency’s PD data may be advantageous
because the agency is likely to use a larger pool of counterparties than a
bank, leading to more precise estimates of PD. While using external data,
banks must ensure that the data used by the rating agencies is similar to the
bank’s own portfolio.
3.1.2 Qualitative Rating Scales
Many banks have not yet adopted quantitative credit risk models that can
calculate PD of counterparties. The qualitative rating systems that they use
depend on the subjective judgement and expertise of their credit analysis
team. In light of the fact that quantitative credit risk models are still fairly new,
almost all banks prefer to depend heavily on the skills of their credit analysts.
Quantitative risk models are used as aids in deciding the final risk grade,
which is as it should be.

15
3.2 Credit Portfolio Risk Management System (CPRMS)
Once a bank is able to generate consistent credit ratings and calculate PDs, it
can then use them as the main input into a CPRMS. A CPRMS calculates the
credit value-at-risk (VaR) of a Credit Portfolio * after taking into account PDs of
individual counterparties, market factors like exchange interest rate etc., as
well as the correlation between risk factors. Since CPRMS’ engage almost all
the risk factors that affect the value of the credit portfolio, they provide the
leverage with which to collectively stress all risk factors.
CPRMS enable banks to not only conduct credit stress-tests but also to
calculate Credit VaR, allocate Risk Capital7, calculate Risk-adjusted return on
capital (RAROC), identify concentrations and facilitate trading of credit risk
through credit derivatives, securitisation etc. Credit VaR models, like Market
VaR models, build a probability distribution of all the likely changes in the
value of the credit portfolio. A probability distribution of likely portfolio values is
shown in figure 3.
Figure 3: Probability distribution of likely changes in value of credit portfolios
* Please refer to the Glossary 7 Also known as Economic Capital.
1%
-x% 0% Profit Loss
Change in Portfolio Value
Probability
99th %ile
16
Unlike the probability distribution of a market portfolio that is bell-shaped
(normal distribution), the distribution of a credit portfolio is highly skewed. This
is because the returns of a credit product, say a loan, has a limited upside in
terms of the interest that the bank is likely to earn on the loan, but the
downside is that the entire principal amount of the loan can be lost. Using the
probability distribution, it is easy to calculate the likely lo ss at any level of
probability. All one has to do is to decide the probability, say the 99th%ile level,
and then use the probability distribution to calculate the maximum likely loss of
the portfolio at that probability. In this case, the 99 th%ile loss represents a –x%
change in the value of the credit portfolio, therefore the loss is the negative
change.
Banks that have yet to install quantitative risk rating and credit risk portfolio
models can also conduct credit stress tests. The only caveat is that the
qualitative rating systems should rate counterparties in a consistent manner.
The only impediment to using qualitative risk rating systems is that stress-
tests are time-consuming to conduct because loan analysts have to re-rate
and calculate stress loss for every counterparty, given a particular stress
scenario and then tot up the stress loss for the entire portfolio. If a quantitative
risk model were used, it would be easier to calculate stress loss after
changing a few input variables. The bigger handicap of using only a qualitative
risk rating system is that the correlation between various loans/securities in
the portfolio is ignored.
Despite these problems, banks that use only qualitative rating systems still
have a lot to gain from conducting stress-tests.

17
4.0 CONSTRUCTING A STRESS -TESTING PROGRAMME
Having seen the importance of stress-testing in risk management and the
features of a good stress-test, we suggest below the procedure for
constructing a sound stress-testing programme.
Figure 4: Flowc hart for building a Stress-Testing programme
Report Results
Take Corrective Action, if reqd.
Reassess Stress-tests for appropriateness
Calculate Stress Loss
No Yes
Construct Stress-tests
Run Stress-tests using counterparty and
portfolio risk models
Ensure reliable data
Survey Portfolio & Environment
Identify Risk Factors
Does the bank possess quantitative risk measurement
systems?
Estimate bottomline of counterparties under stressful conditions
18
The bank must document the above process in detail, in the form of a stress-
testing policy. The top management of the bank must approve this policy.
Each step of this process is explained below.
4.1 Ensure Reliability of Data
One of the most important steps in credit stress testing is to ensure that the
data being used in risk management is accurate and timely. The data includes
all aspects of the bank's credit portfolio, market data relating to the risk factors
as well as risk analytics that are used by risk models.
4.1.1 Credit Position Data – Trading Book
Some instruments in the trading book such as bonds and swaps engender
credit risk. Since trading acti vity in a bank’s treasury department is rapid, the
data system should be capable of promptly capturing trades, processing them
and then transferring the data to the risk management system where
calculation of VaR and other analytics can take place.
The more advanced banks have been able to perform this entire procedure
real-time so that as soon as a trade takes place it is automatically processed
and transmitted to the risk model where VaR and other risk analytics are
calculated8. Some banks include stress-tests in their risk models and can
compute losses under pre-specified stress conditions along with the VaR
numbers. This facility enables banks to institute stress-test limits that traders
must adhere to.
4.1.2 Credit Position Data – Loan Book
The speed of transactions in credit portfolios (of the loan book) is far slower
than that of market portfolios. However, timeliness of data is very important
8 This is called Straight-Through Processing.
19
here as well. The bank should ensure that reliable data is being captured for
all particulars of every credit exposure, such as the principal, amounts repaid,
interest rates, fees, collateral details etc. The bank must also be able to
measure credit risk of each exposure by means of a consistent rating system
and/or an accurate PD for each rating. Further, the bank should consider
obtaining a sound CPRMS to calculate portfolio credit risk.
4.1.3 Market Data
The bank should also have access to accurate and timely market data about
various risk factors such as interest rates, exchange rates, equity indices,
swap rates etc. Accurate data for each of these risk factors is required to
estimate the value of each investment in the bank’s credit portfolios especially
those in the trading book.
4.1.4 Risk Analytics
Apart from the position and market data, risk analytics that are crucial for
calculating the risk of credit portfolios should also be available to the bank.
The most important are price volatilities of each financial instrument and the
correlation between the prices of each pair of financial instruments. Volatility
and correlation data are among the most important inputs into any credit VaR
model.
Most vendors of VaR models supply both market data as well as risk
analytics. If VaR vendors do not supply such data, banks can easily access
the same from data vendors. The key here is to ensure that the data used by
the data vendors is appropriate, considering the nature of the bank’s portfolio.
20
4.2 Survey
4.2.1 Portfolio
As mentioned earlier, a stress-test should be related to the specific features of
the bank’s credit portfolios. A list of the various financial instruments present in
these portfolios, as well as likely future inclusions, must first be prepared. An
exhaustive list of all the risk factors that influence each financial instrument
should also be d rawn up.
Once the risk factors influencing each financial instrument have been
identified, they should be ordered by importance and grouped on the basis of
similarity. That is, each group should consist of risk factors that significantly
influence one another in ordinary or in stress conditions. When stress-tests
are designed, such groups will ensure that when individual risk factors are
shocked, other relevant stress factors are not left unstressed. For example, if
interest rates are stressed, we can refer to the group of risk factors that
interest rates belong to (such a group may include exchange rates) and then
ensure that the stress-test stresses exchange rates as well. This process of
ordering and grouping risk factors helps to ensure that the most important risk
factors, as well as those related to them, are stressed.
4.2.2 Environment
Having surveyed the portfolio the next step is to survey the social, industrial,
economic and political environment to spot potential stressful events9. This is
a very important part of the stress-testing programme. Experts from inside and
outside the bank will have to be consulted at this stage. Although it is
impossible to predict the exact nature of potential stressful events10, every
effort must nevertheless be made to identify as many scenarios as possible.
9 Considering the damage that natural disasters can bring about, the geological (earthquakes) and
meteorological (typhoons and hurricanes) environment should also be surveyed. 10 After all, no one could have predicted September 11 th.

21
4.2.3 Widespread Consultation
During the process of identifying risk factors and likely stress scenarios, risk
managers should involve other experts in the bank such as relationship
managers, economists and traders.
During the course of trading in bonds and swaps, traders usually develop
good instincts about the effects of changes in risk factors on the prices of
these financial instruments. They will thus be able to spot implausible stress-
tests and give valuable inputs in grouping risk factors.
Relationship managers are also good sources of information as they deal
directly with customers on a daily basis and have their ear to the ground.
Top management must also be consulted at every stage of the development
of stress-tests to ensure that they buy-in into the process. Involving
relationship managers and traders in building stress-tests will ensure that
there is less opposition when the time comes to take remedial measures on
the basis of stress-tests, especially when such remedial measures involve
unwinding profitable positions. Further, top management buy-in will rule out
internal disagreements and ensure that remedial actions are implemented
even when traders or relationship managers oppose such actions.
4.3 Types of Risk Factors
Some of the main risk factors that risk managers can use to build stress-tests
are as follows: -

22
Figure 5: Types of Risk Factors
4.3.1 Credit Risk Factors – Loan Book
Most quantitative models that measure credit risk calculate likely credit loss
using the following formula: -
EAD stands for Exposure at Default, which is the amount that stands to be lost
if a counterparty defaults. LGD, that is Loss Given Default, stands for the
percentage of the EAD that is likely to be lost if default were to take place. The
LGD takes into account the guarantees that may have been procured when
the loan was given as well as the value of any collateral that was taken from
the counterparty. PD is the probability of default and is related to the credit risk
rating assigned to the counterparty.
Counterparty specific factors
Stress-tests can be conducted by stressing any of the counterparty specific
factors mentioned above, namely, LGD and PD. Thus if the risk manager
suspects that there will be a deterioration in the ability or willingness of any
counterparty to service its debts, all he has to do is to reduce the
counterparty’s credit rating (PD) or increase its LGD to arrive at the new credit
loss of the exposure.
Credit Loss per exposure = EAD x LGD X PD
Counterparty Analytics Environmental Model
Deterioration in ability and / or willingness to pay. • PDs • LGDs • Credit
Spreads
• Financial Market factors
• Industry • Economic • Regulatory • Political • Sociological • Ecological
• Assumptions• Holding
period
• Correlation • Transition
Matrices • Volatility

23
Industry factors
CPRMS’ take into account the correlations between the industries to which
counterparties belong, while calculating the risk of the credit portfolio. Risk
managers can stress the industry risk factors by grouping all the
counterparties that belong to the industry and then reducing the credit rating of
all these counterparties by the desired number of credit grade notches.
Take the example of a risk manager who suspects that counterparties
belonging to the electronics sector are likely to face problems due to industry-
specific cyclical factors. He estimates that these factors cause deterioration in
such counterparties' PD. He also estimates that such deterioration is the
equivalent of reduction by a single credit grade. Thus he reduces all electronic
sector counterparties graded AAA to AA, AA to A and so on. Once this has
been done the portfolio can be re -valued to calculate stress loss. Some
CRPMS’ give the risk manager the flexibility of reducing the industry rating
directly and this new input is automatically fed into the rating of each
counterparty belonging to that particular industry.
If the risk manager wants to stress for higher correlations between industries,
most CPRMS provide the flexibility to manually insert new correlation figures,
after which the portfolio can be re-valued.
Geographical factors
Similarly, if a risk manager believes that counterparties belonging to a
particular country or a region will be adversely affected by geo-political factors
such as war, then he may downgrade the risk ratings of all counterparties
exposed to that region and re-value the portfolio.
Some CPRMS provides the risk manager the flexibility to change sovereign
ratings and these are automatically fed into the risk rating of each customer.
Most CPRMS also provide the flexibility of manually inserting new correlation
24
figures which is very useful because some stress events are characterised by
‘contagion’, which is the spread of panic from one country's market to
another's, as was the case during the recent Asian economic crisis. During
periods of contagion the correlation between risk factors increases.
Macroeconomic factors
Some quantitative credit risk models calculate the counterparties' PD using
macroeconomic variables. These macroeconomic factors could include
interest rates, foreign exchange rates etc. Where such models are used to
calculate the PD, new estimates of macroeconomic factors can be directly
input into the model and the credit portfolio re-valued. If such a facility is not
available, the risk manager can estimate the effect of a move in
macroeconomic variables on credit ratings, change the ratings of
counterparties likely to be influenced by such a move and then re -value the
credit portfolio. Macroeconomic effects on correlations can likewise be
estimated and manually inserted into the correlation matrix.
Political factors
The effect of political factors on credit portfolios is especially relevant to
emerging markets. While shocks to macroeconomic risk factors such as
foreign exchange rates and interest rates can easily be stressed, political
factors represent a bigger challenge. To stress political factors risk managers
must get advice from political analysts and other relevant professionals on
likely political scenarios. They must then get further inputs from economists on
the likely impact of political scenarios on financial and/or macroeconomic risk
factors.
4.3.2 Credit Risk Factors – Trading Book
Fixed income instruments like bonds and swaps* are amenable to both credit
and market stress-tests because these instruments have credit risk (risk of
* Please refer to the Glossary

25
default by the issuer of the bond) and market risk (risk arising from change in
market prices of fixed income instruments).
The effects of external events on the market and credit risk of a bond are at
times indistinguishable. For example, if the price of a bond shows an increase
in volatility following a downgrade in its credit rating, then the risk downgrade
results in an increase in credit risk while the increase in volatility results in
higher market risk. Combined market and credit stress-tests represent a new
area of stress-testing and efforts are on to integrate the two. Banks that have
the capability to conduct combined stress-tests will be able to ascertain the
effects of stressfu l events far more accurately than they can from separate
market and credit stress-tests.
Credit risk of fixed income instruments can be stress-tested by changing the
rating of the issuers of the fixed income instruments in the CPRMS. The
portfolio can also be re-valued after changing the credit spread of Yield and
Swap curves*. The credit spread is the difference between the yield or swap
curves for a particular rating class and the benchmark curve (usually the
government curve). It indicates the credit quality of the rating class to which
the yield curve belongs. For example, if the benchmark yield for a 1-year
maturity is 5% and the yield on a corporate bond is 8%, then the credit spread
is 3%. If the company that issues the corporate bond enjoys very high credit
worthiness then the credit spread is very small but if the company is close to
default, the credit spread is large. Figure 8 under section 4.5.1 shows the
various methods of stressing the credit spread.
4.3.3 Model Risk Factors
Model related stress-tests are those that specifically test the modelling
assumptions that lie behind the VaR or Pricing models. For example, some
banks use pricing and hedging strategy models appropriate for developed
26
markets, in emerging markets. These models make assumptions about
liquidity etc., which may not be relevant to emerging markets but which are
masked in normal business conditions. Stress-tests must explicitly ascertain
the nature of these assumptions and check whether the assumptions would
hold true in a stress event.
Holding period
A common model related stress-test relates to increasing the holding period
by a fixed number of days. When a VaR is described as a ‘n’-day VaR, the ‘n’
refers to holding period of the asset involved11. A suitable stress-test may be
to increase the number of holding period days in calculating VaR. Such a
stress-test is appropriate because credit portfolios are less liquid than market
portfolios and it is well-known that crises are characterised by illiquidity.
4.3.4 Other Risk Factors
Correlation
As mentioned earlier, many CPRMS give the risk manager the facility to
stress-test the correlation structure between risk factors by manually inserting
correlations into the correlation matrix, in lieu of those calculated by data
vendors. Some of the types of changes in correlation structure that can be
tested are correlation breakdowns and reversal of correlations.
Breakdowns in correlation refer to situations when historical correlations
collapse during stressful events. The causes could be non-economic factors
such as political disruptions and natural disasters.
Reversal of correlation is another phenomenon that has been observed during
stress events. To take an example, during ordinary business conditions all
* Please refer to the Glossary 11 In Market Risk VaR calculations, a 1-day VaR is usually the norm.
27
bond prices, whether high quality (Treasury securities) or low quality (junk
bonds) usually respond in a broadly similar manner to a change in interest
rates, i.e., the correlation between them is quite high. However, during a crisis
there may be a ‘flight-to -quality’ where investors shun all but the most high
quality bonds leading to a rise in demand for high-quality bonds but a sharp
drop in the demand for low-quality bonds, resulting in inverse correlation.
Transition Matrices
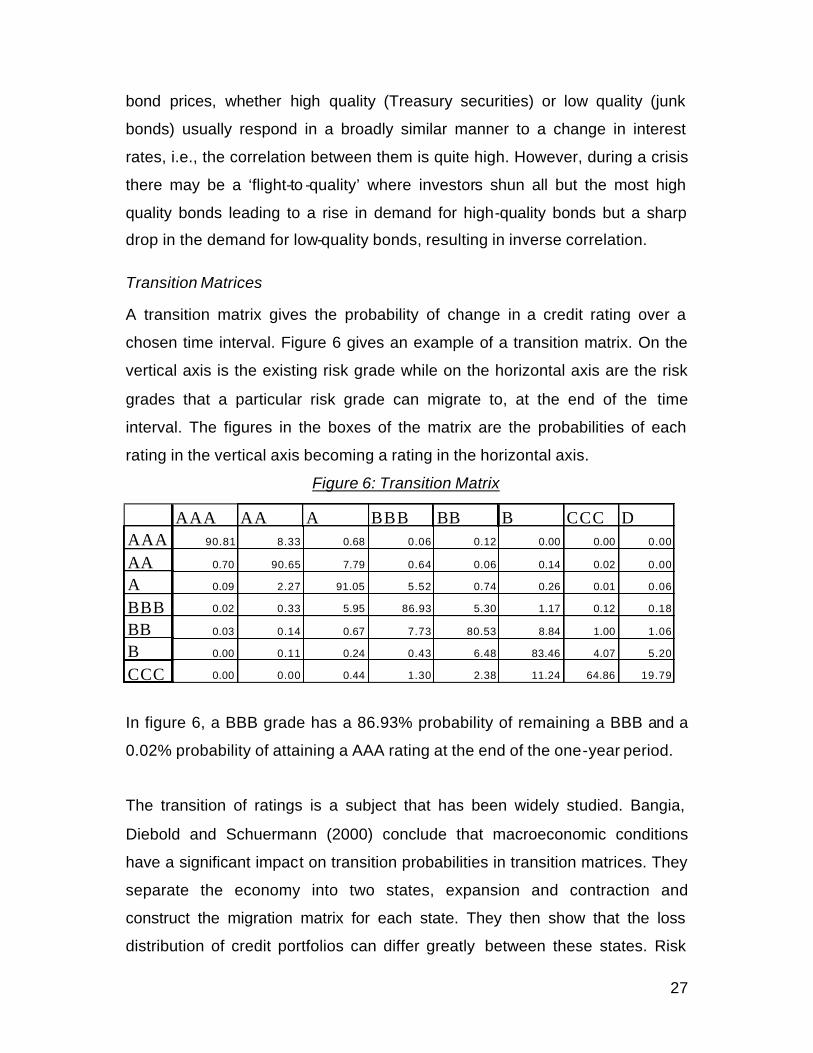
A transition matrix gives the probability of change in a credit rating over a
chosen time interval. Figure 6 gives an example of a transition matrix. On the
vertical axis is the existing risk grade while on the horizontal axis are the risk
grades that a particular risk grade can migrate to, at the end of the time
interval. The figures in the boxes of the matrix are the probabilities of each
rating in the vertical axis becoming a rating in the horizontal axis.
Figure 6: Transition Matrix
In figure 6, a BBB grade has a 86.93% probability of remaining a BBB and a
0.02% probability of attaining a AAA rating at the end of the one-year period.
The transition of ratings is a subject that has been widely studied. Bangia,
Diebold and Schuermann (2000) conclude that macroeconomic conditions
have a significant impact on transition probabilities in transition matrices. They
separate the economy into two states, expansion and contraction and
construct the migration matrix for each state. They then show that the loss
distribution of credit portfolios can differ greatly between these states. Risk
AAA AA A BBB BB B CCC DAAA 90.81 8.33 0.68 0.06 0.12 0.00 0.00 0.00
AA 0.70 90.65 7.79 0.64 0.06 0.14 0.02 0.00
A 0.09 2.27 91.05 5.52 0.74 0.26 0.01 0.06
BBB 0.02 0.33 5.95 86.93 5.30 1.17 0.12 0.18
BB 0.03 0.14 0.67 7.73 80.53 8.84 1.00 1.06
B 0.00 0.11 0.24 0.43 6.48 83.46 4.07 5.20
CCC 0.00 0.00 0.44 1.30 2.38 11.24 64.86 19.79

28
managers can use this methodology to construct transition matrices under
different stress conditions and then re-value their portfolios.
Nickell, Perraudin and Varatto (2000) measure the dependence of transition
probabilities on the counterparty's industry, country and stage of business
cycle. The ordered Probit approach used in this paper can be adopted to
identify the incremental impact of each of these factors on transition
probabilities and in comparing the importance of different risk factors. Such a
test would also help in grouping risk factors as well as in constructing
plausible stress-tests.
Volatility
Shocks to volatility of various risk factors including FX rates, credit spreads
etc. are among the stress-tests that banks surveyed by BCGFS (Feb 2001)
use. These ‘volatility disruptions’ are appropriate to portfolios that include
options.
4.4 Magnitude of Factor Shock
Having examined the various types of risk factors the next question is to
decide the magnitude of the shock that should be administered to each risk
factor while conducting the stress test. One approach is to use the magnitude
of shocks that actually occurred during historical stress episodes, while
another is to use subjective judgement.
When using historical episodes, risk managers may settle on the size of the
factor shock by taking the most adverse movement in the risk factor during a
given time interval. The length of the time interval therefore assumes
importance. Several banks pick the worst movement in the previous one-year
period as the shock that is to be tested. This may not be optimal because the
previous one-year may not include any stressful events.

29
Banks must therefore choose a longer time interval that includes at least one
business cycle (appropriate to the portfolio) and as many stress events as
possible. Once the time interval is chosen, either the difference between the
start day value and the end of the period value of the risk factor or the
maximum movement between any two periods of time within the time interval
can be chosen as the magnitude of shock of the risk factor. The magnitude of
a shock can also be decided using the banks' expertise.
4.5 Constructing Stress-Tests
There are essentially two types of stress-tests, single -factor and multi -factor
stress-tests. As the name implies, only one risk factor is stressed in single-
factor stress-tests while several risk factors (if not all) are stressed in multi-
factor stress-test. The etymology of stress-tests is shown below in figure 7. Let
us first examine single factor stress-tests.
Figure 7: Types of Stress-Tests
Worst-Off Subjective Correlation Monte -Carlo Ext.Val.Theory
4.5.1 Single Factor Stress-Tests
Single factor shocks are appropriate at the desk or frontline level when a
trader or a relationship manager would like to know the effect of a large move
in a risk factor on his position or portfolio. However, when assessing a
portfolio’s exposure to stress events, a single facto r shock is rarely
Single Factor Multi-factor
Hypothetical Historical
Non-systematic Systematic

30
appropriate and would probably suffer from implausibility because when a
stressful event occurs, seldom does it affect one factor alone.
Standardised Single Shocks
Standardised single-factor stress-tests have been issued by various
organisations and can be adopted off-the-shelf.
DPG's Standardised Shocks
One example of standardised single -shock stress-tests are those prescribed
by the Derivatives Policy Group (1995). Only some of these apply to credit risk
arising from the trading book. The standard tests recommended by DPG are: -
i. Parallel yield curve shifts of 100 basis points up and down
ii. Steepening and flattening of the yield curves (for maturities of 2 to 10
years) by 25 basis points
iii. Each of the four permutations of a parallel yield curve shift of 100 basis
points concurrent with a tilting of the yield curve (for maturities of 2 to 10
years) by 25 basis points
iv. Increase and decrease in all 3-month yield volatilities by 20% of
prevailing levels
v. Increase and decrease in equity index values by 10%
vi. Increase and decrease in equity index volatilities by 20% of prevailing
levels.
vii. Increase and decrease in the exchange value (relative to the USD) of
foreign currencies by 6% in the case of major currencies and 20% of
prevailing levels
viii. Increase and decrease in foreign exchange rate volatilities by 20% of
prevailing levels and
ix. Increase and decrease in swap spreads by 20 basis points.
The advantage of using standardised stress-tests is that they have ready
acceptability among traders as well as senior management. However, the
31
problem with standardised stress-tests is that they sometimes lose their
relevance. Several of DPG’s tests have been ‘out-stressed’ by subsequent
episodes of extreme moves in the market.
Subjective Choice
Banks can also subjectively choose to stress-test any factor shock as well as
its magnitude. This, in fact, is the practice in many banks. When factors are
chosen subjectively, risk manager should try to ensure that the factors as well
as the magnitude of shocks are plausible and relevant to the portfolio.
Stress-testing the Trading book
Credit risk in the trading book arises primarily from such instruments as swaps
and bonds. The main risk factor affecting these instruments is the credit
spread, which was discussed in 4.3.2.
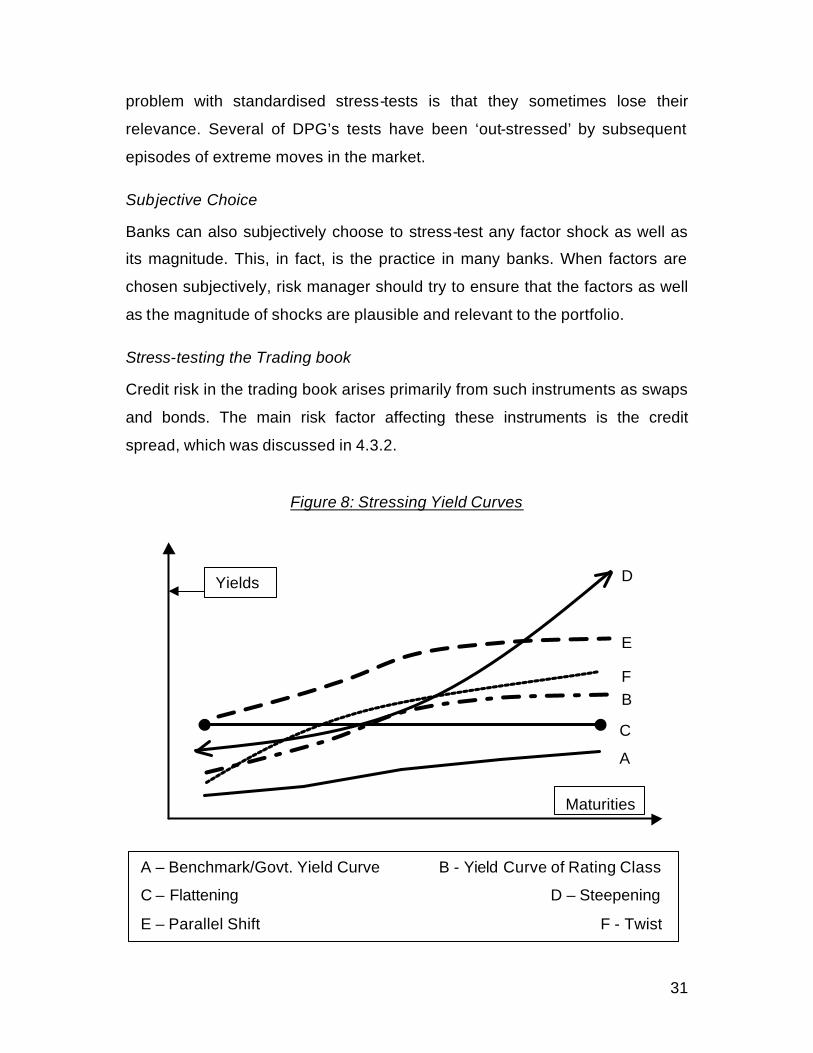
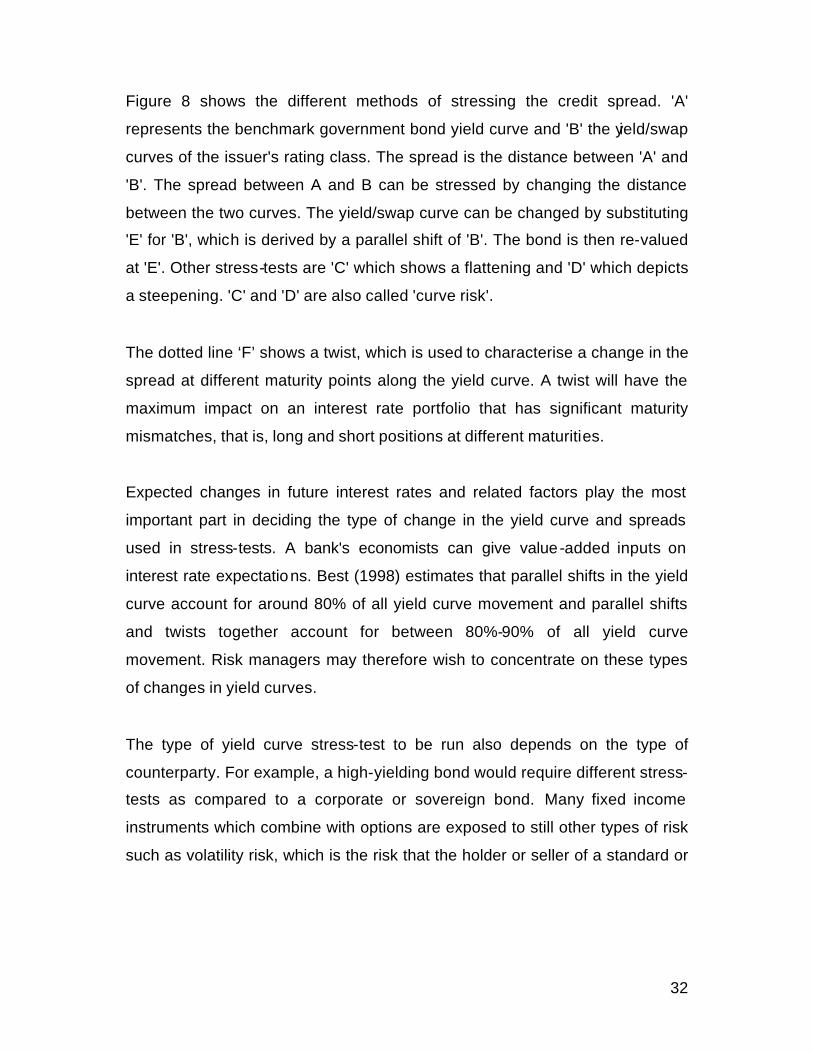
Figure 8: Stressing Yield Curves
E
D
B
Yields
Maturities
A
C
A – Benchmark/Govt. Yield Curve B - Yield Curve of Rating Class
C – Flattening D – Steepening
E – Parallel Shift F - Twist
F
32
Figure 8 shows the different methods of stressing the credit spread. 'A'
represents the benchmark government bond yield curve and 'B' the yield/swap
curves of the issuer's rating class. The spread is the distance between 'A' and
'B'. The spread between A and B can be stressed by changing the distance
between the two curves. The yield/swap curve can be changed by substituting
'E' for 'B', which is derived by a parallel shift of 'B'. The bond is then re-valued
at 'E'. Other stress-tests are 'C' which shows a flattening and 'D' which depicts
a steepening. 'C' and 'D' are also called 'curve risk'.
The dotted line ‘F’ shows a twist, which is used to characterise a change in the
spread at different maturity points along the yield curve. A twist will have the
maximum impact on an interest rate portfolio that has significant maturity
mismatches, that is, long and short positions at different maturities.
Expected changes in future interest rates and related factors play the most
important part in deciding the type of change in the yield curve and spreads
used in stress-tests. A bank's economists can give value-added inputs on
interest rate expectations. Best (1998) estimates that parallel shifts in the yield
curve account for around 80% of all yield curve movement and parallel shifts
and twists together account for between 80%-90% of all yield curve
movement. Risk managers may therefore wish to concentrate on these types
of changes in yield curves.
The type of yield curve stress-test to be run also depends on the type of
counterparty. For example, a high-yielding bond would require different stress-
tests as compared to a corporate or sovereign bond. Many fixed income
instruments which combine with options are exposed to still other types of risk
such as volatility risk, which is the risk that the holder or seller of a standard or
33
embedded option incurs, if actual volatility or the market's expectations for
future volatility changes12.
4.5.2 Multi -factor Stress-Tests
As the name suggests, multi-factor stress-tests involve stressing several risk
factors at the same time. As discussed previously, stressing one stress factor
at a time may be appropriate at the desk level but single factor shocks by
themselves, do not make for a comprehensive stress-testing programme
because seldom is one risk factor alone affected during actual stress events.
The BCGFS (Feb 2001) survey shows that internationally active banks have
recognised this fact; of the 215 types of stress-tests run by these banks, 138
were scenario tests while 77 were single factor stress-tests.
Stress-tests can be conducted by simulating historical stress episodes (such
as the Oct.13th 1987 drop in the Dow Jones Index) or by constructing
hypothetical events built by stressing one or a group of risk factors. Stressing
groups of risk factors together is also called Scenario Testing. Scenario
testing can be conducted top-down, i.e., hypothesising the occurrence of a
stressful event and then deciding the change in risk factors to mirror the event,
or bottom up, i.e., deciding the change in risk factors without hypothesising a
particular event.
Historical Scenarios
Historical scenarios can be conducted by re-valuing portfolios using values of
risk factors that existed during historical stress events. Historical stress events
have been occurring so often in the recent past that risk managers are likely to
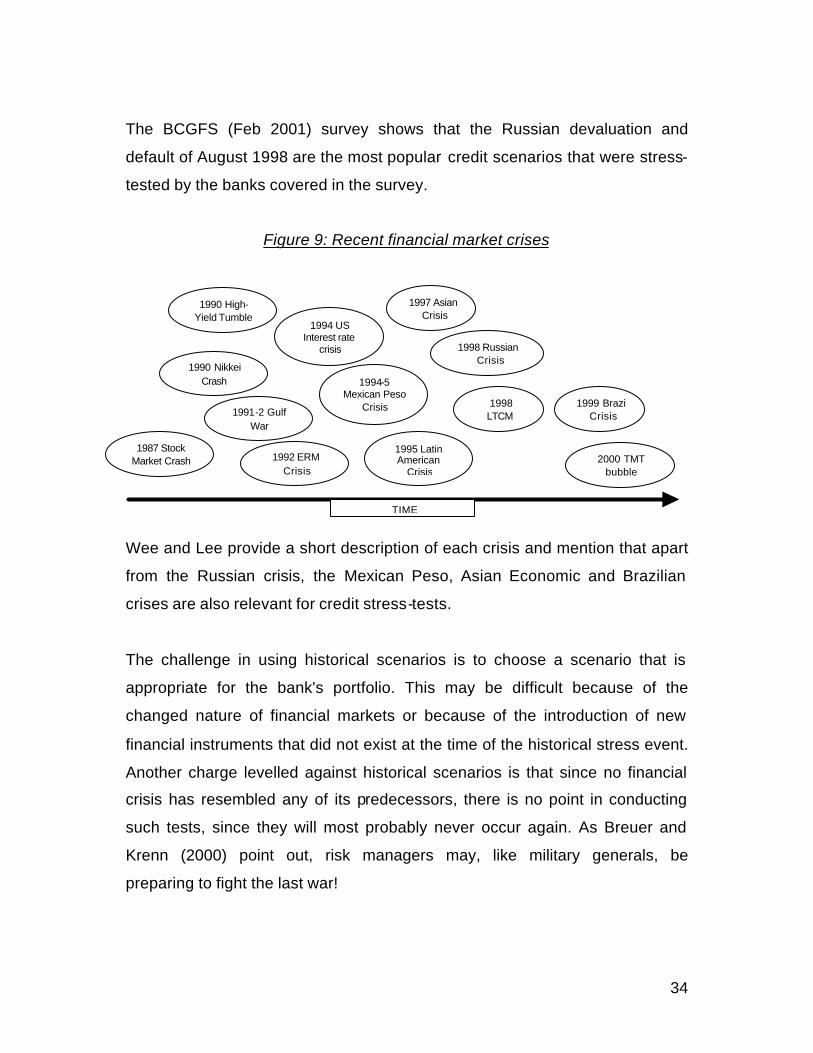
find at least a few episodes that have relevance to their portfolios. Given
below in figure 9, from Wee and Lee (1999), are some of the stress events to
hit financial markets in the last 15 years.
12 Some compound, barrier, and average rate options can provide protection from various types of
volatility risk.
34
The BCGFS (Feb 2001) survey shows that the Russian devaluation and
default of August 1998 are the most popular credit scenarios that were stress-
tested by the banks covered in the survey.
Figure 9: Recent financial market crises
Wee and Lee provide a short description of each crisis and mention that apart
from the Russian crisis, the Mexican Peso, Asian Economic and Brazilian
crises are also relevant for credit stress-tests.
The challenge in using historical scenarios is to choose a scenario that is
appropriate for the bank's portfolio. This may be difficult because of the
changed nature of financial markets or because of the introduction of new
financial instruments that did not exist at the time of the historical stress event.
Another charge levelled against historical scenarios is that since no financial
crisis has resembled any of its predecessors, there is no point in conducting
such tests, since they will most probably never occur again. As Breuer and
Krenn (2000) point out, risk managers may, like military generals, be
preparing to fight the last war!
1990 Nikkei Crash
1990 High-Yield Tumble
1992 ERM Crisis
1994 US Interest rate
crisis
1994-5 Mexican Peso
Crisis
1995 Latin American
Crisis
1998 Russian Crisis
1997 Asian Crisis
1998 LTCM
1999 Brazil Crisis
1987 Stock Market Crash
1991-2 Gulf War
TIME
2000 TMT bubble

35
Despite these deficiencies historical scenarios enjoy widespread usage mainly
because of the ready acceptance that they find. No questions on the
plausibility of historical scenarios can be raised because they have actually
taken place (though whether they might take place again is another question.)
Shaw (1997) has proposed an alternative methodology for computing stress
losses. The greatest loss of the portfolio is calculated and risk managers can
subsequently examine which scenarios produced these extreme losses. This
is similar to historical simulation in VaR models with the difference being that a
longer time period can be chosen instead of the 1-year horizon usually
selected for VaR computation.
An important question that arises while using historical scenarios is the
number of days to be considered while measuring the change in risk factors.
Historical stress events may take place over a matter of days or months, so
different time periods can give different changes in values of risk factors. As
Schachter (1998) points out – "there would be little argument in choosing
October 13 for the 1987 crash, but the start and end to the 1994 bond market
sell off is much less obvious. The ambiguity arises because not all affected
markets go from peak to trough on the same days and because the move
from peak to trough is not always smooth and uninterrupted." A useful rule of
thumb, suggested in the same paper, is to choose dates based on the risk
factors that represent the significant portfolio exposures to the event.
Hypothetical Scenarios
Risk managers can also construct hypothetical scenarios when no historical
scenarios match the special features of their portfolios or when they would like
to stress new combinations of risk factors.
When several risk factors are stressed at the same time, care must be taken
to ensure that no relevant risk factor is omitted and that the shocks applied to

36
combinations of risk factors, collectively make economic sense and are
plausible.
'Worst-off' Scenarios
One common method used to conduct a stress-test of multiple risk factors is
to combine the most adverse movement in different risk factors, in a certain
time interval and then re -value the portfolio. This is one of the least plausible
ways of conducting a stress-test because it completely ignores the correla tion
between risk factors and will most likely lead to implausible scenarios that do
not make economic sense. Unfortunately, this is one of the more common
scenario building methods adopted by banks.
Ignoring Peripheral risk factors
Some banks conduct stress-tests by changing a few risk factors and leaving
all the other relevant risk factors unchanged. Such stress-tests are likely to be
unreliable and are similar to the 'worst-off' scenarios. The only difference is
that in this case the risk manager chooses the magnitude of change in the
stress factors whereas for worst-case scenarios the magnitude is the same as
the worst historical change in a given time interval.
Subjective Scenarios
In a subjective search for scenarios, risk factors are first chosen in the same
manner as mentioned under 4.2. These risk factors are then stressed after
getting expert inputs from various people in and outside the bank including
traders, top-management, consultants etc.
The main problem with this approach is that despite the best efforts of experts,
such subjective stress-tests may omit some risk factors or mis-specify the
correlation. The number of risk factors in a well-diversified portfolio could
number in hundreds and it is quite impossible to subjectively configure a
correlation matrix for them.

37
Systematic Scenarios
A systematic search for stress scenarios tries to ameliorate the above
weaknesses by trying to ensure that all relevant risk factors, like liquidity etc.,
are appropriately changed in an economically consistent manner. Several new
methodologies (details in the technical annexure, 7.0) are being developed to
construct scenarios systematically. Risk managers can assess these
methodologies and adopt those that they think are most appropriate for their
portfolios.
4.6 Conducting Stress-tests
Once scenarios have been constructed and the magnitude of the shock on the
risk factors has been decided, the stress-tests should be run and the portfolios
re-valued. As discussed earlier, if the bank has quantitative counterparty and
portfolio risk management systems and models, the stress-tests can be run by
inputting the stressed values of the risk factors into the models. The new
portfolio values can then be easily recalculated given the new data.
Banks that do not possess quantitative tools can also conduct stress-tests.
However, the process is more laborious. Such banks could follow a three-step
procedure in conducting stress-tests.
In the first step they survey the portfolio and also identify likely stress events.
Then the credit analysts of the bank go through the financial statements of
each counterparty and using their judgement, estimate the bottom line of each
counterparty contingent on the stressful event occurring. Once the new bottom
line for each counterparty has been estimated, the total stress loss that the
bank is likely to incur, given the stressful event, is calculated.
The drawbacks of this procedure are that the correlation between
counterparties is ignored and the process of re-estimating the bottomline of
38
each counterparty is laborious and time-consuming. However, if a bank does
not possess a quantitative counterparty and portfolio risk measurement model,
it still stands to get substantial benefits from conducting stress-tests in the
above manner.
4.7 Reporting Stress-Test Results
Once scenarios have been constructed and portfolios re-valued, a brief
summary of results showing details of scenarios and likely losses for each
stress scenario should be reported to appropriate managers for action. As
mentioned in 2.5, as few stress-tests as possible should be reported, although
any number can be conducted. It is recommended that the set of reported
stress-test results include a few routine stress-tests and a few tests
appropriate for the prevailing environmental conditions. The stress-tests that
require action must show a high degree of granularity so that problem loans /
positions / portfolios / trading and hedging strategies can be identified and
appropriate pre-agreed risk mitigating actions taken.
4.8 Systematically reassessing appropriateness of Stress-Tests
Lastly, stress-tests must be systematically refreshed because financial
markets, instruments, regulatory policies and macroeconomic and political
environment are changing all the time. New stress-tests will help identify new
risks even as old stress-tests are rendered obsolete. Stress tests should be
reviewed at least half-yearly, or more frequently, if the portfolio or the
environment changes significantly.
39
SECTION C –STRESS-TESTING - APPLICATIONS
5.1 Identifying Risk Concentrations
Stress-tests help to identify concentrations in credit portfolios that may not be
apparent in normal business conditions. For example, during stressful events,
the exchange rate of a country may start falling due to the contagion effect,
despite there being no significant economic linkages between that country and
its neighbours. Regional currencies thus represent new concentration risks
that are triggered by contagion. These concentration risks do not exist in
ordinary business conditions.
5.2 Restructuring Positions / Hedging
Once risk concentrations are identified, stress-tests help plan risk mitigating
action including unwinding or hedging positions and re-balancing portfolios.
Credit exposures in the loan book cannot be unloaded as easily as those in
the trading book because most loans involve contractual relationships with
counterparties. Also, banks build relationships with customers over a long
period of time with great effort and are chary of recalling loans. However, new
financial instruments like credit derivatives and securitisation enable banks to
take problem loans off their balance sheets while still maintaining their
relationship with customers.
5.3 Monitoring Stress Loss Limits
Stress-tests help banks to limit their exposure to stress losses. Stress-test
results are monitored against stress limits. For example, in the example in 5.1,
if the bank has a stress loss limit on the currencies of its neighbours and if the
stress-test reveals a stress loss greater than the stress limit, then the bank
can dilute its positions or hedge its exposure. The bank will thus be protected
should a crisis involving contagion occur.

40
5.4 Spur Discussion
Perhaps the most important benefit of possessing a well-defined stress-testing
programme is to spur discussion about the nature of the portfolio among the
bank’s risk managers, account managers/traders and the top management.
The process of periodically surveying the bank’s portfolio, identifying the most
important risk factors, scanning the horizon for potential stressful events,
calculating their likely impact and taking corrective action leads to a lot of
debate in a bank and helps it to be much more aware of all aspects of its
portfolio. If such a stress-testing progra mme were not instituted then it is likely
that no one would be assigned the specific task of sizing up a portfolio and the
potential risks, and even elementary stress events may not be spotted and
prepared for.
This is the reason why banks stand to benefi t from having a stress-testing
programme no matter how simple and non-quantitative their risk measurement
systems might be.
41
6.0 CONCLUSIONS
Since credit risk engenders the largest proportion of the total risk of any well-
diversified bank, it is imperative that banks adopt a comprehensive approach
to managing it. Such a comprehensive approach involves managing credit risk
at the counterparty and portfolio levels as well as stress-testing credit risk.
While it is encouraging to note that many banks have made progress with
installing quantitative risk rating and portfolio models, they are still some
distance away from using these systems to allocate economic capital,
calculate RAROC and manage portfolio credit risk. They are also yet to
institute credit stress-tests.
We hope that this report encourages risk managers and the top management
at banks to start building a credit stress-testing programme. We have been
careful to avoid prescribing any off-the-shelf stress-tests because stress-tests
must be designed only after taking into account the idiosyncrasies of each
portfolio. Further, some of the most important benefits of constructing a stress-
testing programme come from the intense discussions that take place within a
bank, while analysing the features of the portfolio and while building scenarios
and setting limits.
As mentioned before, the lack of quantitative credit risk tools need not
constrain risk managers from conducting credit stress tests. The absence of
these tools may make the conduct of such tests cumbersome, but the benefits
from conducting even rudimentary stress tests are still substantial.
We hope that this report serves to give risk managers a broad overview of the
credit stress-testing process and enables them to build a comprehensive
credit stress-testing programme.

42
7.0 TECHNICAL ANNEXURE
Some of the new systematic scenario building techniques are described
below.
7.1 Correlation Matrix
Kupiec (1999) has introduced a methodology where a few risk factors (which
play "starring" roles) are stressed and all the others (peripheral factors) are
adjusted using historical volatilities and correlations. The stress loss (which he
calls StressVaR) is then calculated using the same methodology as that used
in variance-covariance VaR calculations. Although we have seen that using
historical data for stress events is inappropriate, Kupiec shows that for broad-
based portfolios, the standard VaR normality assumption and the use of
historical volatility and correlation patterns do not seem to introduce distortion
in stress event loss measures. While it is true that Kupiec’s paper addresses
market risk, it may be applied to credit portfolios as well to the extent that
historical volatilities and correlation can be used to construct more plausible
stress-tests.
However, several studies including Longin and Solnick (1999) have pointed
out that correlations breakdown during crisis periods, which means that use of
historical volatilities and correlations to adjust peripheral factors may not be
appropriate except under special conditions.
Kim and Finger (2000) assume that correlations breakdown in crises and deal
with this problem by first estimating correlation levels in volatile periods and
then applying these 'stressed' correlations to specify changes in peripheral
factors. The stress losses calculated using this method have the benefit of
introducing an element of probability into stress-testing.
43
7.2 Monte Carlo Simulations
In the methodologies that we have seen so far, a stress-test is first
constructed and the stress loss is then calculated. A different approach is to
specify the stress loss and then examine the scenarios that could cause such
losses.
Breuer and Krenn (2000) use Monte Carlo simulation to first calculate portfolio
values in different scenarios and then to identify those scenarios that result in
losses greater than a certain threshold. The scenarios where the threshold is
exceeded can then be examined to determine what movements in risk factors
caused the extreme losses and appropriate risk mitigation can be performed.
Breuer and Krenn also provide a methodology for explicitly measuring the
plausibility of the scenarios that are generated by the Monte Carlo process.
7.3 Extreme Value Theory
The last methodology that we consider for systematically constructing
scenarios is called EVT, that is, Extreme Value Theory. VaR models for
market risk, especially those that use variance-covariance methods assume
that the probability distribution of portfolio changes is well approximated by a
normal distribution. However, it has been found that actual returns
distributions display a higher level of probability for extreme events than that
supposed by the normal distribution. This is the reason why the actual
distributions are said to have 'fat tails'. EVT is a theory that models these fat
tails.
Univariate EVT deals with the issue of tail modelling while multivariate EVT
addresses the correlation or risk-aggregation of assets from different financial
instruments. Longin (1999) explains how one might apply EVT to stress-
testing.

44
All the above methods, as pointed out in Schachter (2000), incorporate
historical data in some way into the stress-test. This may make the stress-test
lose plausibility because it is probable that in an actual stressful event, the risk
factors will not behave as they did in the past.
Nevertheless, as Kupiec (1999) argues, stress scenarios that use historical
volatilities and correlations are more plausible than scenarios that ignore
correlations altogether.
45
8.0 GLOSSARY
Credit Risk The risk of default or deterioration in credit quality short of default, of a counterparty in a financial transaction.
Credit Portfolio The credit portfolio of a bank consists of all the financial
instruments that engender credit risk. The Credit portfolio consists of financial instruments from both the trading as well as the loan book.
Credit Spread The difference between the interest rate paid for funds of a
given maturity by a sovereign issuer and the rate required of a less creditworthy borrower.
Loan Book In this report, the loan book is defined as being made up of
all loans and off-balance sheet that engender credit risk to the bank.
Market Portfolio A bank's Trading book which is made up of all financial
instruments that are traded in fina ncial markets including equity shares, bonds, swaps etc.
Market Risk The risk arising from the change in the value of financial
instruments quoted in financial markets. Spread Curve The yield curve constructed by adding the credit spread
applying to the credit quality of the counterparty, to a fixed income instrument to the government yields, for different maturities.
Swap A contractual agreement to exchange a stream of periodic
payments with a counterparty. The traditional interest rate swap agreement is an exchange of fixed interest payments for floating rate payments. A generic currency swap is an agreement to exchange one currency for another at a forward exchange rate or at a sequence of forward rates.
Swap Curve A yield curve illustrating the rela tionship of swap rates at
various maturities. Based on the zero coupon yield curve. Swap Rate The market interest rate on the fixed rate side of a swap. At
the time the swap is initiated, the swap rate will typically be the same as the fixed rate payment (adjusted for any negotiated premium or discount). As rates move, the swap rate may differ materially from the fixed rate exchanged under a specific swap agreement.
46
Trading Book The trading book consists of all the financial instruments that
are traded in financial markets. This includes financial instruments that give rise to credit risk such as bonds as well as market risk such as equities.
Value at Risk Measures the worst expected loss, over a given time interval,
under normal conditions, at a given confidence interval. Risk-free A graph illustrating the level of interest rates as a function of Yield Curve time-obtained by plotting the yields of all default-free coupon
bonds in a given currency against maturity or, occasionally, duration.
9.0 LIST OF ABBREVIATIONS
BIS Bank of International Settlements – Basle, Switzerland
CPRMS Credit Portfolio Risk Management System
DPG Derivatives Policy Group
EVT Extreme Value Theory
EAD Exposure at Default
LGD Loss Given Default
PD Probability of default
RAROC Risk Adjusted Return on Capital
VaR Value at Risk

47
10.0 REFERENCES
Bangia, Anil, Francis X. Diebold and Till Schuermann, April 2000, Ratings Migration and the Business Cycle, With Application to Credit Portfolio Stress-testing, 00-26, Financial Institutions Centre, Wharton Bank for International Settlements, Basle Committee on Banking Supervision, 1995, An internal model-based approach to market risk capital requirements, proposal for consultation, Basle, Switzerland Bank for International Settlements, Committee on the Global Financial System, 2000, Stress-testing By Large Financial Institutions: Current Practice And Aggregation, Basle, Switzerland Bank for International Settlements, Basel Committee on Banking Supervision, Jan 2001, Consultative Document The New Basel Capital Accord, Basel, Switzerland Bank for International Settlements, Committee on the Global Financial System, Feb 2001, Consultative Document, A survey of stress-tests and current practice at major financial institutions, Basle, Switzerland Best, Phillip, 1998, Implementing Value at Risk, p.6, John Wiley & Sons Breuer, Thomas and Gerald Krenn, 2000, Identifying Stress-test Scenarios, Working paper Derivatives Policy Group, March 1995, Framework of Voluntary Oversight Kim, Jongwoo and Christopher Finger, May 2000, A stress-test to incorporate correlation breakdown , RiskMetrics Journal Kupiec, Paul, 1999, Stress-testing in a value at risk framework , v.24, Journal of Derivatives Longin, Francois, 1999, Stress-testing: a method based on Extreme Value Theory, Working Paper, BSI Gamma Foundation Longin, Francois and Bruno Solnick, July 1999, Correlation Structure on international equity markets during extremely volatile periods, Working Paper Nickell, Pamela, William Perraudin and Simone Varatto, 2000, Stability of ratings transitions, Journal of Banking and Finance Schachter, Barry, March 1998, The Value of stress-testing in risk management, Working Paper

48
Schachter, Barry, December 2000, Stringent Stress-tests, Risk Magazine Shaw, J., 1997, Beyond VaR and Stress-testing, In: VaR – Understanding and applying Value-at-Risk, KPMG/Risk Publications Standard and Poor's, 1999: Corporate Defaults rise sharply, Standard and Poor's Credit Week, pp.9 -16 Wee Lieng-Seng and Judy Lee, Spring 1999, Integrating Stress-testing with Risk Management, Bank Accounting and Finance