Embed Size (px)
Citation preview

European Money Markets Institute
56, Avenue des Arts 1000 Brussels | +32 (0) 2 431 52 08 | [email protected]
CONSULTATION PAPER ON
A NEW REFERENCE INDEX FOR THE EURO REPO MARKET
15 June 2017

A new reference index for the euro repo market June 2017
European Money Markets Institute Page 2
Acknowledgements. EMMI would like to thank the Chair of Finance and Systemic Risk at the University of St Gallen (Switzerland) for their support and commitment throughout the development phase of the methodology for the new repo index. Professors Angelo Ranaldo and Jan Wrampelmeyer collaborated with EMMI in the initial analysis of the transaction-level data contributed by BrokerTec, Eurex Repo, and MTS Repo in the fall of 2015. Angelo Ranaldo and his research group further assisted EMMI and the task force during the second half of 2016 in the development and back-testing of the methodology for the index. This consultation relies on the respective reports authored by them.

A new reference index for the euro repo market June 2017
European Money Markets Institute
Page 3
Contents
Introduction ............................................................................................................................... 7
Feasibility of the pan-European New Repo Index: data analysis ................................................... 9
1 Data characteristics ...........................................................................................................................9
2 Data analysis ................................................................................................................................... 10
a) Market share of ATSs ................................................................................................................. 10
b) Collateral type ............................................................................................................................ 10
c) Trades maturities ....................................................................................................................... 11
d) Country of collateral securities .................................................................................................. 12
e) Fixed rate vs floating rate ........................................................................................................... 13
Definition of the New Repo Index ............................................................................................. 20
3 The IOSCO Principles for Financial Benchmarks ............................................................................. 20
4 Components of the New Repo Index definition ............................................................................. 23
Methodology of the New Repo Index ........................................................................................ 25
5 Methodology of the New Repo Index ............................................................................................ 25
a) Outlier removal techniques ........................................................................................................ 25
b) Index calculation......................................................................................................................... 26
6 Event study analysis ....................................................................................................................... 28
a) Mario Draghi’s speech on July 2012: “whatever it takes” ......................................................... 28
b) Changes in haircut policies in LCH SA and CC&G ....................................................................... 28
c) Changes in the key ECB’s interest rates ..................................................................................... 29
7 Historical behavior ......................................................................................................................... 30
List of questions ....................................................................................................................... 32
A new reference index for the euro repo market June 2017
European Money Markets Institute Page 4
List of figures
Figure 1 // Repo market volume across ATSs, daily (EUR billion) 14
Figure 2 // Repo market volume across ATSs, standard deviation 14
Figure 3 // Distribution of repo implied market share across ATSs, daily 14
Figure 4 // GC and specific repo transactions volume, daily (EUR billion) 14
Figure 5 // GC and specific repo transactions volume, standard deviation 14
Figure 6 // GC and specific repo implied market share, daily 14
Figure 7 // GC repo volumes across ATSs, daily (EUR billion) 15
Figure 8 // Specific repo volumes across ATSs, daily (EUR billion) 15
Figure 9 // GC repo volumes across ATSs, implied share 15
Figure 10 // Specific repo volumes across ATSs, implied share 15
Figure 11 // Repos with maturity longer than one day, all transactions 16
Figure 12 // Repos with maturity longer than one day, all transactions, volume distribution 16
Figure 13 // Repos with maturity longer than one day, GC repos 16
Figure 14 // Repos with maturity longer than one day, GC repos, volume distribution 16
Figure 15 // Repos with maturity longer than one day, specific repos 16
Figure 16 // Repos with maturity longer than one day, specific repos, volume distribution 16
Figure 17 // One-day repo volumes, daily, EUR billion 17
Figure 18 // One-day repo volumes, implied share 17
Figure 19 // One-day repo volumes, implied share at BrokerTec 17
Figure 20 // One-day repo volumes, implied share at Eurex Repo 17
Figure 21 // One-day repo volumes, implied share at MTS 17
Figure 22 // Breakdown of collateral 17
Figure 23 // Repo volumes across geographies, daily, EUR billion 18
Figure 24 // Repo volumes across geographies, implied share 18
Figure 25 // Repo volumes across geographies at BrokerTec, daily, EUR billion 18
Figure 26 // Repo volumes across geographies at BrokerTec, implied share 18
Figure 27 // Repo volumes across geographies at Eurex Repo, daily, EUR billion 18
Figure 28 // Repo volumes across geographies at Eurex Repo, implied share 18
Figure 29 // Repo volumes across geographies at MTS Repo, daily, EUR billion 19
Figure 30 // Repo volumes across geographies at MTS Repo, implied share 19
Figure 31 // 26 July 2012, Draghi’s “whatever it takes” 28
Figure 32 // 9 November 2011, haircut change in LCH SA and CC&G 28
A new reference index for the euro repo market June 2017
European Money Markets Institute
Page 5
Figure 33 // 13 April 2011, increase by 25bps of ECB’s key rates 29
Figure 34 // 9 November 2011, decrease by 25bps of ECB’s key rates 29
Figure 35 // Baseline index and ECB policy corridor, from 2010 to 2015 30
Figure 36 // Baseline, Stoxx GCP, and RFR Euro indexes, from 2014 to 2015 30
Figure 37 // Baseline and Eonia indexes, from 2014 to 2015 30
Figure 38 // Baseline and Eonia indexes; aggregated daily volumes, from 2010 to 2015 31
List of tables
Table 1 // Number of days with no or few observations for different tenors (2010 – 2015) 15
Table 2 // Descriptive statistics (2010 – 2015) 26

A new reference index for the euro repo market June 2017
European Money Markets Institute Page 6
(This page is intentionally left blank)

A new reference index for the euro repo market June 2017
European Money Markets Institute
Page 7
Introduction
Over the last few years, a number of international regulatory bodies have expressed their concern on the excessive reliance, by market participants, on benchmark indices based on unsecured bank funding markets.1 These markets have experienced a decrease in activity following the financial crisis, and the dispersion of bank credit risk has increased since, making average rates for unsecured interbank funding a less good proxy for bank’s funding costs. The Financial Stability Board (FSB), among others, encouraged market participants and the official sector to cooperate and find suitable risk-free (or nearly risk-free) alternative rates based on robust and liquid underlying markets.2 In the words of Jerome H. Powell, Member of the Board of Governors of the U.S. Federal Reserve and co-chair of the Official Sector Steering Group, “encouraging alternatives that better reflect today’s funding markets would also allow for greater choice, would increase the resilience of the system, and would potentially make hedging of some risks less costly.”3
In line with the above-mentioned regulatory recommendation, the European Money Markets Institute (EMMI), as administrator of the Euribor® benchmark, engaged with the ICMA European Repo and Collateral Council (ERCC), given its significant role in the nurturing and development of the repo market in Europe, and established a joint task force to explore the feasibility of a transaction-based benchmark for the secured segment of the euro money market. The collaboration’s main goal was to provide the market with a credible and robust index, filling the gap left following the discontinuation of the Eurepo® benchmark.4
Four were the new index’s design principles set out by EMMI and the task force, all in line with regulatory best practice, such as the IOSCO Principles5 and the European Regulation on Benchmarks.6 Firstly, the new repo index should measure pan-European secured funding rates based on security-financed euro repo transactions; secondly, the new index must be an accurate representation of the underlying interest it seeks to measure; thirdly, the source data for the new index should be sufficient to reliably measure this underlying interest; and fourthly, the benchmark design should capture the majority of all eligible euro repo transactions. This document summarizes EMMI’s work toward the development of a new repo index fulfilling these principles.
In this initiative, EMMI counted with the high-level support of three of the leading European electronic trading venues for the fixed income markets—BrokerTec, Eurex Repo, and MTS Repo— and two
1 As an example, since 2013 the Financial Stability Oversight Council (FSOC) makes reference in their Annual Report to the potential emerging threat that an overreliance on benchmark indices based on unsecured bank funding markets, urging market participants to find suitable alternative reference rates (see, for example, the 2013 FSOC Annual Report and the 2014 FSOC Annual Report). 2 See Financial Stability Board, Reforming major interest rate benchmarks, 22 July 2014. 3 C.f. Governor Jerome H. Powell speech at the “Money Marketeers of New York University” meeting on 4 September 2014. 4 Eurepo® was defined as “the rate at which, at 11.00 a.m. Brussels time, one bank offered, in the euro-zone and worldwide, funds in euro to another bank if, in exchange, the former receives from the latter the best collateral within the most actively traded European repo market.” Eurepo® was discontinued on 2 January 2015, after the number of banks involved in the daily calculation of the benchmark decreased substantially during 2014, no longer allowing for a representative, robust, and reliable index determination. 5 The IOSCO Principles for Financial Benchmarks provide a framework of standards to promote reliability of benchmark determinations, see https://www.iosco.org/library/pubdocs/pdf/IOSCOPD415.pdf 6 In June 2016, the European Parliament and the Council adopted Regulation (EU) 2016/1011 on indices used as benchmarks in financial instruments and financial contracts (http://eur-lex.europa.eu/legal-content/EN/TXT/?uri=CELEX%3A32016R1011), introducing a common framework to ensure the accuracy and integrity of indices used as benchmarks. The Regulation will enter fully into application on 1 January 2018.

A new reference index for the euro repo market June 2017
European Money Markets Institute Page 8
existing repo index providers—NEX, as administrator of the RepoFundsRate indices and STOXX, as administrator of the GC Pooling family. During the fall of 2015, EMMI conducted a comprehensive analysis of the euro repo market based on the transaction-level data contributed by BrokerTec, Eurex Repo, and MTS Repo to assess whether the data are sufficient to support the determination of a new pan-European index, and which design considerations, on the basis of this analysis, were to be taken into account. Among the conclusions of the study, summarized below, was that a purely transaction-based benchmark would only be possible for one-day tenors.
This consultation paper sets out in more detail and seeks respondents’ views on EMMI’s proposal for a pan-European transaction-based repo benchmark. The main two points covered here are the new repo index’s calculation methodology and its definition. By providing further insight on the development work and choices, EMMI expects to get a reliable indication of the market’s interest and need of the proposed solution. Any other issue, such as those related to the governance, publication, or potential or future licensing of the new repo index are not the focus of this document.
The questions on which EMMI would welcome feedback from market participants, interested parties and stakeholders are placed throughout the text in the relevant sections. For the respondents’ convenience, they can also be found at the end of the document, in a separate section. Feedback may be submitted by e-mail to [email protected] specifying “Repo Index Consultation” on the subject line. More instructions can be found on page 32. EMMI welcomes any additional views or considerations regarding the use or need of the proposed new repo index that are not covered in the questions suggested by EMMI.
EMMI would be thankful if all responses reached the EMMI Secretariat by Friday, 14 July 2017. A summary of stakeholder feedback will be made public during the month of August 2017.

A new reference index for the euro repo market June 2017
European Money Markets Institute
Page 9
Feasibility of the pan-European New Repo Index: data analysis
1 Data characteristics
In 2015, EMMI received repo transaction data from the three most active Automatic Trading Systems (ATS) in Europe, namely BrokerTec, Eurex Repo, and MTS Repo.7 The sample period covered trades executed between 2006 and 2014 for BrokerTec and Eurex Repo, and between 2010 and 2014 for MTS Repo. In 2016, the data sample was extended to cover transactions until the end of December 2015 to capture the effect of the implementation of the European Central Bank’s (ECB) expanded asset purchase programme.8
The following transactions were excluded from the dataset:
› repos in currencies other than EUR; › transactions with open term, in which the repurchase date is initially not determined; › bilateral repos; › pre-arranged trades; › trades with extreme repo rates; and › incomplete or erroneous trades.
Finally, transactions with spreads9 larger than five or with rates larger than 10% are considered outliers and removed from the sample. In the case of observations with extreme negative rates corresponding to repo transactions with specific collateral, we do not apply this criterion, as in case of great demand for the collateral security, extreme negative rates may occur.10
The final data set contained 18,576,813 transactions with a total trading volume of EUR 510.04 trillion. These figures highlight the importance of the euro repo market—e.g. the total GDP of the euro area from 2006 to 2015 was less than EUR 100 trillion and the total Eonia volume from 2006 to 2015 was about EUR 85 trillion.
The volume in the dataset covers the majority of the CCP-based euro interbank repo market. While there exist other platforms that were not included in the analysis (e.g. SENAF/MEFFRepo), their volumes for CCP-based repo transactions do not represent a significant contribution. For instance, the total repo volume on MEFF Repo from 2011 to 2015 was less than EUR 5.2 trillion.11
7 Under MIFiD, BrokerTec and Eurex Repo are classified as Multilateral Trading Facilities (MTF), MTS Repo (officially MTS S.p.A) is a Regulated Market (RM) under the Italian Commissione Nazionale per le Società e la Borsa (Consob). 8 More information on the ECB’s extended asset purchase programme (APP) can be found on the ECB’s webpage. 9 Throughout the paper, the spread for a repo trade k executed on day t is defined as the difference between the repo rate of the contract and the ECB rate on the deposit facility on that day over the width of the ECB monetary policy corridor on that day. This definition standardizes repo spreads by looking at the position of repo rates with respect to the policy corridor:
𝑆𝑆𝑆𝑆𝑆𝑆𝑆𝑆𝑆𝑆𝑆𝑆𝑘𝑘,𝑡𝑡 =𝑅𝑅𝑆𝑆𝑆𝑆𝑅𝑅 𝑅𝑅𝑆𝑆𝑅𝑅𝑆𝑆𝑘𝑘,𝑡𝑡 − 𝐸𝐸𝐸𝐸𝐸𝐸 𝐷𝐷𝑆𝑆𝑆𝑆𝑅𝑅𝐷𝐷𝐷𝐷𝑅𝑅 𝑅𝑅𝑆𝑆𝑅𝑅𝑆𝑆𝑡𝑡
𝐸𝐸𝐸𝐸𝐸𝐸 𝐿𝐿𝑆𝑆𝐿𝐿𝑆𝑆𝐷𝐷𝐿𝐿𝐿𝐿 𝑅𝑅𝑆𝑆𝑅𝑅𝑆𝑆𝑡𝑡 − 𝐸𝐸𝐸𝐸𝐸𝐸 𝐷𝐷𝑆𝑆𝑆𝑆𝑅𝑅𝐷𝐷𝐷𝐷𝑅𝑅 𝑅𝑅𝑆𝑆𝑅𝑅𝑆𝑆𝑡𝑡.
10 Question number 12 in ICMA’s FAQ on Repo provides an explanation on the meaning and use of specifics and specials. 11 Volumes based on monthly statistics from the MEFF Repo website: http://www.meff.es/aspx/MeffREPO/EstadisticasMensuales.aspx?id=ing. The aggregate repo volumes displayed on the website correspond to transactions cleared at the Spanish CCP so, in particular, they may include types of repos excluded from the data set, such as pre-arranged trades.

A new reference index for the euro repo market June 2017
European Money Markets Institute Page 10
2 Data analysis
This Section provides details on some of the analyses performed by EMMI in order to:
(i) Get a better understanding of the market covered by the three participating ATSs; (ii) Assess, in broad terms, the feasibility of a fully transaction-based index; and
(iii) Decide on characteristics of the index, including trade eligibility and maturity eligibility, among others.
As part c) below describes, market activity for the electronically traded repo market is concentrated on the very short-term end of the curve (overnight, spot-next, and tomorrow-next).12 In light of this observation, and considering EMMI’s goal to build a pan-European repo index whose only input are real transactions, the development work is focused on the design of a one-day index, aggregating all overnight, spot-next, and tomorrow-next transactions. The aggregation of repo trade data is done by aligning transactions by their settlement date.
Q1
EMMI and the task force agreed on aligning trades by their settlement date. While an index calculated using this form of alignment would not include all repo transactions executed on day t, EMMI considers it as more representative, as all repos included in the calculation provide funding over the same period. Do you agree with EMMI’s approach? Please, provide a rationale for your answer.
All figures and charts corresponding to the data analysis can be found between pages 14 and 19 below.
a) Market share of ATSs
To analyze the time-series evolution of the trading activity over the 2006-2015 period, EMMI computed average and standard deviation of daily volumes for every month, as indicators of their level and variability. Figures 1 and 3 show the development of daily volume and market share for the three ATSs over time. BrokerTec is not only characterized by the largest trading volume, but also by the largest volatility of trading volume, see Figure 2. From 2010 until the end of 2014, the market share of BrokerTec decreased from 60% to 50%. In turn, Eurex’s market share increased from 12% to 20% over the same period, while MTS’ remained constant over time (from 28% in January 2010 to 30% in December 2014). The implementation of the extended APP by the ECB seems to reverse these respective trends, with and end of the year 2015 showing a decrease down to 12% for Eurex and increases in market shares of BrokerTec and MTS, with 55% and 33%, respectively.
b) Collateral type
EMMI’s analysis of the daily trading volume, its variation, and the implied market share for GC and specific repos reveal that specific repos represent the majority of trades in the sample, both in terms of number of transactions and trading volume (see Figures 4-6). Individual GC repo trades’ volumes are, however, typically larger.
12 Transactions with maturity beyond 1 day are typically undertaken in tri-party and voice-brokered repo trading, see the maturity analysis in ICMA’s European repo market survey.

A new reference index for the euro repo market June 2017
European Money Markets Institute
Page 11
Average contract sizes in the beginning of the sample (2006) tend to be larger than at the end of the sample (2015) and the contract size of GC was on average bigger than that of specific collateral. The average volume per trade is largest for GC repos at Eurex (EUR 232mn in December 2014), followed by BrokerTec (EUR 127mn) and MTS (EUR 41mn). Overall, both GC and specific repos represent a significant share of the market.
The analysis of the distribution of GC and specific repos by trading venue reveals that while Eurex has the largest market share for GC repos, BrokerTec and MTS host a significant portion of the market, see Figures 7 and 9. The majority of specific repos are traded at BrokerTec, with MTS covering the remaining market share (about 30%). The volume of specific repos at Eurex is negligible in comparison, see Figures 8 and 10. The effect of the ECB’s expanded APP is easily noticeable, as the volume of GC trades at Eurex decreases from almost EUR 60 billion in February 2015 to less than EUR 30 billion in December 2015, at the end of our sample.
c) Trades maturities
In order to assess the feasibility of the daily determination of a fully transaction based index, EMMI studied the availability of data for each of the points on the curve. The main conclusion was that the large majority of repos (around 95%) are traded with one-day maturities, with this share having remained relatively constant over time.
Figures 11-16 show some characteristics of repos with maturity above one day. Maturities with more than one week are rarely traded. To further highlight this issue, Table 1 gives insight on the number and share of days (over the period 2010-2015) for which repo trades were carried out for different tenors: for each tenor, the table indicates the number of days on which no repo trade exists in the data. As the first line reveals, only one-day repos are available for every day in the sample. One-week repos are also always available, but on a few days the number of transactions is very low (27 days with less than 30 transactions).
These patterns suggest that one-day tenors are sufficiently liquid for a reliable fully transaction-based index construction.
One-day tenors
To continue the analysis, we break down one-day maturities into four categories, depending on the length between the trade and the maturity dates: overnight, tomorrow-next, spot-next, and corporate-next. Repo trades categorized as “other” have a maturity of more than one-day or are one-day repos for which the purchase day is more than three business days later than the trading day. Figure 17 and 18 show the time-series evolution of volume and market share for different one-day term types. While over the whole sample spot-next repos are predominant, the volume contributed by overnight and tom-next contracts is not negligible.
When analyzing the distribution of different term types across the different ATSs (see Figures 19-21), EMMI observed that while spot-next repos are clearly predominant at BrokerTec and MTS, their share at Eurex is much smaller, but has grown from 14% in 2010 to 23% in 2015. At Eurex, overnight repos have the largest share. In line with the fact that most repos on BrokerTec and MTS are specific repos, about 86% of specific repos are spot-next. With regards to one-day GC repos, the overnight, tom-next,

A new reference index for the euro repo market June 2017
European Money Markets Institute Page 12
and spot-next tenors have a more homogeneous distribution on average. Corporate-next transactions are generally used much less frequently (less than 1%).
These differences are consistent with the fact that GC repos are considered cash driven. While sudden liquidity shortages may need to be satisfied immediately, favoring overnight repos, the term of specific repos tends to be aligned with the settlement times of the bond market in which the securities are traded. This relation also explains the increase of tom-next repos at the end of the sample, given that in October 2014 settlement times of bonds were changed from t+3 to t+2.
Overall, one-day repos, which are the focus of the benchmark construction, represent the vast majority of trading volume in the market. The volume for larger tenors is much lower and data availability may pose challenges for an eventual extension of a transaction-based index to longer tenors.
d) Country of collateral securities
In order to guarantee representativeness of the index, EMMI analyzed the country of origin of the securities used as collateral in the repo transactions. Figure 22 shows the shares of the six most traded countries (Germany, Italy, France, Belgium, Spain, and the Netherlands), a EU category, and a residual one. EU repos include all GC repos on collateral baskets which include securities from more than one country (e.g. GC Pooling, €GC, or European corporates), repos with European Investment Bank and EFSF securities, or ISINs starting with the prefix “XS” as collateral.13
Repos with collateral from the six biggest individual countries in addition to EU repos cover more than 90% of the volume in the sample. Germany, Italy, and France are important for both specific and GC repos, covering approximately 78% and 47% of the trading volume, respectively. Within specific repos, the joint share of Spain, Belgium, and Netherlands represents about 15% of the trading volume. Within GC repos, EU collateral covers about 44% of the trading volume.
There are not enough transactions in the data to create separate indices for o/n, t/n, and s/n repos for any of the countries, especially when looking at GC and specific repos separately.
Figures 23 and 24 show the time-series evolution of volume and market share by collateral country. The six main countries above together with the EU category have always dominated the euro repo market. Looking at individual patterns, German collateral follows a decreasing trend. Volume of Italian repos decreased in 2011 amid the Italian government crisis, but rebounded in 2012. This finding is consistent with the regression analysis in Mancini et al. (2015)14 showing that repo volume secured by riskier (safer) securities such as Italian (German) government bonds decreases (increases) with risk. Spanish collateral only started to gain market share in 2011.
When looking at the shares of different countries’ collaterals across the different ATSs, we observe that the only two categories with a meaningful share at Eurex are EU and German collateral. The share of the former has increased from about 89% in 2010 to more than 95% in 2015. At MTS, more than
13 See http://www.isin.net/xs-isin/. 14 L. Mancini, A. Ranaldo, and J. Wrampelmeyer, The Euro interbank repo market (July 30, 2015). Swiss Finance Institute Research Paper No. 13-71; University of St. Gallen, School of Finance Research Paper No. 2013/16.
A new reference index for the euro repo market June 2017
European Money Markets Institute
Page 13
95% of repos are collateralized with Italian securities. French repos constitute the second most important group at MTS with about 2.2%, followed by German repos with 1.3%. BrokerTec hosts the largest variety of individual countries. Overall, it is easy to observe that each ATS trades repos with collateral from a specific set of countries: namely Italian repos are mainly traded at MTS, Eurex is focused on EU collateral (broad baskets, including securities from various countries), and collateral from all other individual countries are represented at BrokerTec. (See Figures 25-30.)
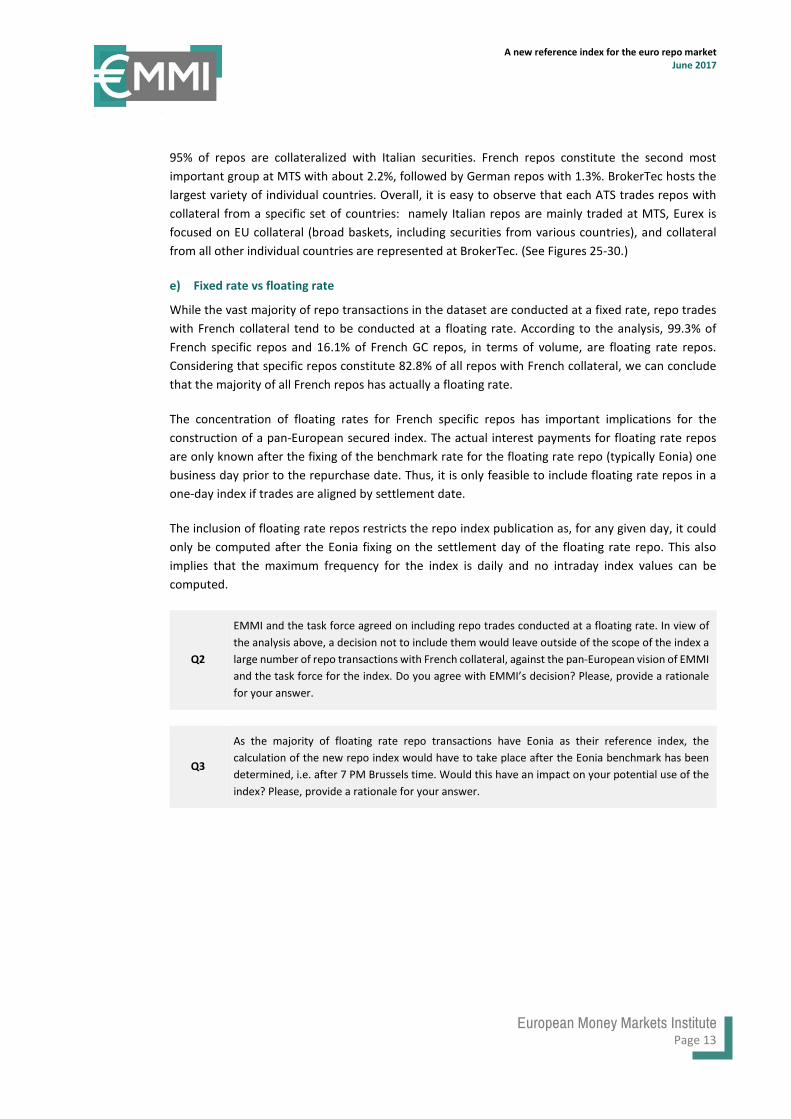
e) Fixed rate vs floating rate
While the vast majority of repo transactions in the dataset are conducted at a fixed rate, repo trades with French collateral tend to be conducted at a floating rate. According to the analysis, 99.3% of French specific repos and 16.1% of French GC repos, in terms of volume, are floating rate repos. Considering that specific repos constitute 82.8% of all repos with French collateral, we can conclude that the majority of all French repos has actually a floating rate.
The concentration of floating rates for French specific repos has important implications for the construction of a pan-European secured index. The actual interest payments for floating rate repos are only known after the fixing of the benchmark rate for the floating rate repo (typically Eonia) one business day prior to the repurchase date. Thus, it is only feasible to include floating rate repos in a one-day index if trades are aligned by settlement date.
The inclusion of floating rate repos restricts the repo index publication as, for any given day, it could only be computed after the Eonia fixing on the settlement day of the floating rate repo. This also implies that the maximum frequency for the index is daily and no intraday index values can be computed.
Q2
EMMI and the task force agreed on including repo trades conducted at a floating rate. In view of the analysis above, a decision not to include them would leave outside of the scope of the index a large number of repo transactions with French collateral, against the pan-European vision of EMMI and the task force for the index. Do you agree with EMMI’s decision? Please, provide a rationale for your answer.
Q3
As the majority of floating rate repo transactions have Eonia as their reference index, the calculation of the new repo index would have to take place after the Eonia benchmark has been determined, i.e. after 7 PM Brussels time. Would this have an impact on your potential use of the index? Please, provide a rationale for your answer.

A new reference index for the euro repo market June 2017
European Money Markets Institute Page 14
Figure 1 Repo market volume across ATSs, daily (EUR billion)
Figure 2 Repo market volume across ATSs, standard deviation
Source: BrokerTec, Eurex Repo, MTS Repo, and HSG calculations Source: BrokerTec, Eurex Repo, MTS Repo, and HSG calculations
Figure 3 Distribution of repo implied market share across ATSs, daily
Figure 4 GC and specific repo transactions volume, daily (EUR billion)
Source: BrokerTec, Eurex Repo, MTS Repo, and HSG calculations Source: BrokerTec, Eurex Repo, MTS Repo, and HSG calculations
Figure 5 GC and specific repo transactions volume, standard deviation
Figure 6 GC and specific repo implied market share, daily
Source: BrokerTec, Eurex Repo, MTS Repo, and HSG calculations Source: BrokerTec, Eurex Repo, MTS Repo, and HSG calculations
0
50
100
150
200
2010 2011 2012 2013 2014 2015
BrokerTec Eurex MTS
0
5
10
15
20
25
2010 2011 2012 2013 2014 2015
BrokerTec Eurex MTS
0%
10%
20%
30%
40%
50%
60%
70%
80%
90%
100%
2010 2011 2012 2013 2014 2015
BrokerTec Eurex MTS
0
50
100
150
200
250
2010 2011 2012 2013 2014 2015
GC Specific
0
5
10
15
20
25
30
2010 2011 2012 2013 2014 2015
GC Specific
0%
10%
20%
30%
40%
50%
60%
70%
80%
90%
100%
2010 2011 2012 2013 2014 2015
GC Specific

A new reference index for the euro repo market June 2017
European Money Markets Institute
Page 15
Figure 7 GC repo volumes across ATSs, daily (EUR billion)
Figure 8 Specific repo volumes across ATSs, daily (EUR billion)
Source: BrokerTec, Eurex Repo, MTS Repo, and HSG calculations Source: BrokerTec, Eurex Repo, MTS Repo, and HSG calculations
Figure 9 GC repo volumes across ATSs, implied share
Figure 10 Specific repo volumes across ATSs, implied share
Source: BrokerTec, Eurex Repo, MTS Repo, and HSG calculations Source: BrokerTec, Eurex Repo, MTS Repo, and HSG calculations
Table 1 Number of days with no or few observations for different tenors (2010 – 2015)
0 ≤ 10 ≤ 30 N in % N in % N in %
N 0 0.0 0 0 0 0
1W 0 0.0 4 0.2 27 17.6
2W 237 15.4 1260 82.0 1497 97.4
3W 1165 75.8 1510 98.2 1533 99.7
1M 90 58.6 1118 72.7 1528 99.4
2M 1176 76.6 1531 99.6 1537 100.0
3M 660 42.9 1521 99.0 1537 100.0
6M 1254 81.6 1537 100.0 1537 100.0
9M 1457 94.8 1537 100.0 1537 100.0
1Y 1232 80.2 1534 99.8 1537 100.0
Source: BrokerTec, Eurex Repo, MTS Repo, and HSG calculations
0
10
20
30
40
50
60
70
2010 2011 2012 2013 2014 2015
GC BrokerTec GC Eurex GC MTS
0
20
40
60
80
100
120
140
160
2010 2011 2012 2013 2014 2015
Specific BrokerTec Specific MTS Specific Eurex
0%
10%
20%
30%
40%
50%
60%
70%
80%
90%
100%
2010 2011 2012 2013 2014 2015
GC BrokerTec GC Eurex GC MTS
0%
10%
20%
30%
40%
50%
60%
70%
80%
90%
100%
2010 2011 2012 2013 2014 2015
Specific BrokerTec Specific Eurex Specific MTS

A new reference index for the euro repo market June 2017
European Money Markets Institute Page 16
Figure 11 Repos with maturity longer than one day, all transactions
Figure 12 Repos with maturity longer than one day, all transactions, volume distribution
Source: BrokerTec, Eurex Repo, MTS Repo, and HSG calculations Source: BrokerTec, Eurex Repo, MTS Repo, and HSG calculations
Figure 13 Repos with maturity longer than one day, GC repos
Figure 14 Repos with maturity longer than one day, GC repos, volume distribution
Source: BrokerTec, Eurex Repo, MTS Repo, and HSG calculations Source: BrokerTec, Eurex Repo, MTS Repo, and HSG calculations
Figure 15 Repos with maturity longer than one day, specific repos
Figure 16 Repos with maturity longer than one day, specific repos, volume distribution
Source: BrokerTec, Eurex Repo, MTS Repo, and HSG calculations Source: BrokerTec, Eurex Repo, MTS Repo, and HSG calculations
85.93%
10.36%
<=1W <=1M <=3M <=6M <=1Y >1Y
54.41%32.03%
9.97%
<=1W <=1M <=3M <=6M <=1Y >1Y
48.44%
35.36%
9.90%
<=1W <=1M <=3M <=6M <=1Y >1Y
50.77%
34.70%
10.51%
<=1W <=1M <=3M <=6M <=1Y >1Y
92.72%
5.83%
<=1W <=1M <=3M <=6M <=1Y >1Y
63.86%
25.10%
8.56%
<=1W <=1M <=3M <=6M <=1Y >1Y

A new reference index for the euro repo market June 2017
European Money Markets Institute
Page 17
Figure 17 One-day repo volumes, daily, EUR billion
Figure 18 One day repo volumes, implied share
Source: BrokerTec, Eurex Repo, MTS Repo, and HSG calculations Source: BrokerTec, Eurex Repo, MTS Repo, and HSG calculations
Figure 19 One-day repo volumes, implied share at BrokerTec
Figure 20 One-day repo volumes, implied share at Eurex Repo
Source: BrokerTec and HSG calculations Source: Eurex Repo and HSG calculations
Figure 21 One-day repo volumes, implied share at MTS
Figure 22 Breakdown of collateral
Source: MTS Repo and HSG calculations Source: BrokerTec, Eurex Repo, MTS Repo, and HSG calculations
0
50
100
150
200
250
2010 2011 2012 2013 2014 2015
o/n t/n s/n c/n other
0%
10%
20%
30%
40%
50%
60%
70%
80%
90%
100%
2010 2011 2012 2013 2014 2015
o/n t/n s/n c/n other
0%10%20%30%40%50%60%70%80%90%
100%
2010 2011 2012 2013 2014 2015
o/n t/n s/n c/n other
0%10%20%30%40%50%60%70%80%90%
100%
2010 2011 2012 2013 2014 2015
o/n t/n s/n c/n other
0%10%20%30%40%50%60%70%80%90%
100%
2010 2011 2012 2013 2014 2015
o/n t/n s/n c/n other
8.3%
26.5%35.0%
6.1%9.4%
17.3%
17.3%65.7%
29.7%
27.2%25.5%
6.4%6.0%7.0%6.0%17.7%
44.4%
10.3% 6.9%
0%
10%
20%
30%
40%
50%
60%
70%
80%
90%
100%
GC Transactions GC Volume Specific Transactions Specific Volume
Germany France Italy Spain Netherlands Belgium EU Other

A new reference index for the euro repo market June 2017
European Money Markets Institute Page 18
Figure 23 Repo volumes across geographies, daily, EUR billion
Figure 24 Repo volumes across geographies, implied share
Source: BrokerTec, Eurex Repo, MTS Repo, and HSG calculations Source: BrokerTec, Eurex Repo, MTS Repo, and HSG calculations
Figure 25 Repo volumes across geographies at BrokerTec, daily, EUR billion
Figure 26 Repo volumes across geographies at BrokerTec, implied share
Source: BrokerTec and HSG calculations Source: BrokerTec and HSG calculations
Figure 27 Repo volumes across geographies at Eurex Repo, daily, EUR billion
Figure 28 Repo volumes across geographies at Eurex Repo, implied share
Source: Eurex Repo and HSG calculations Source: Eurex Repo and HSG calculations
0
20
40
60
80
100
2010 2011 2012 2013 2014 2015
Germany France Italy BelgiumSpain Netherlands EU Other
0%10%20%30%40%50%60%70%80%90%
100%
2010 2011 2012 2013 2014 2015
Germany France Italy Belgium Spain Netherlands EU Other
0
10
20
30
40
50
60
70
80
90
2010 2011 2012 2013 2014 2015
Germany France Italy BelgiumSpain Netherlands EU Other
0%10%20%30%40%50%60%70%80%90%
100%
2010 2011 2012 2013 2014 2015
Germany France Italy Belgium Spain Netherlands EU Other
0
10
20
30
40
50
60
70
2010 2011 2012 2013 2014 2015
Germany France Italy BelgiumSpain Netherlands EU Other
0%10%20%30%40%50%60%70%80%90%
100%
2010 2011 2012 2013 2014 2015
Germany France Italy Belgium Spain Netherlands EU Other

A new reference index for the euro repo market June 2017
European Money Markets Institute
Page 19
Figure 29 Repo volumes across geographies at MTS Repo, daily, EUR billion
Figure 30 Repo volumes across geographies at MTS Repo, implied share
Source: MTS Repo and HSG calculations Source: MTS Repo and HSG calculations
0
20
40
60
80
100
2010 2011 2012 2013 2014 2015
Germany France Italy BelgiumSpain Netherlands EU Other
0%10%20%30%40%50%60%70%80%90%
100%
2010 2011 2012 2013 2014 2015
Germany France Italy Belgium Spain Netherlands EU Other

A new reference index for the euro repo market June 2017
European Money Markets Institute Page 20
Definition of the New Repo Index
3 The IOSCO Principles for Financial Benchmarks
In July 2013 the International Organization of Securities Commissions (IOSCO) published its final report on Principles for Financial Benchmarks15 with the intention of providing policy guidance and principles for benchmark-related activities that would address potential conflicts of interest in the benchmark-setting process, as well as establish guidelines as to how to offer further transparency and openness to all aspects related to benchmark determination.
The nineteen IOSCO Principles intend to promote the reliability of benchmark determinations and are grouped into four different categories: Principles 1 to 5 are focused on the governance arrangements for index administrators; Principles 6 through 10 are focused on index design considerations that promote the quality and integrity of benchmark determination; Principles 11 through 15 set out minimum information that should be addressed within a methodology to enhance its quality and integrity; and the last four principles establish processes intended to provide evidence of compliance by administrators with quality standards.
According to IOSCO, the Principles addressing aspects related to the quality of the benchmark (Principles 6 to 10) “are intended to promote the quality and integrity of benchmark determinations through the application of design factors that result in a benchmark that reflects a credible market for an interest measured by that benchmark. The Principles also clarify that a variety of data may be appropriately used to construct a benchmark, as long as the Data Sufficiency Principle is met (i.e. based on an active market).” EMMI set these Principles, in particular Principles 6 through 8, as a stepping stone over which to develop the new pan-European repo index.
Principle 6: Benchmark design
The following, non-exclusive, general characteristics of the benchmark should be considered at the time of its inception and design: the size of the market should inform the selection of an appropriate compilation mechanism and governance process that ensures sufficient underlying activity to provide an observable transparent pricing; the relative size of the underlying market in relation to the volume of trading in the market that references the benchmark, for in cases in which the latter is significantly higher than the former, the incentive for manipulation may increase; the distribution of trading among
15 FR07/13, Principles on Financial Benchmarks, Final Report, IOSCO, July 2013, http://www.iosco.org/library/pubdocs/pdf/IOSCOPD415.pdf
IOSCO Principle
Governance
1 Overall responsibility of the administrator
2 Oversight of third parties
3 Conflicts of interest for administrators
4 Control framework for administrators
5 Internal oversight
Quality of the benchmark
6 Benchmark design
7 Data sufficiency
8 Hierarchy of data inputs
9 Transparency of benchmark determinations
10 Periodic review
Quality of the methodology
11 Content of the methodology
12 Changes to the methodology
13 Transition
14 Code of conduct
15 Internal controls over data collection
Accountability
16 Complaints procedures
17 Audits
18 Audit trails
19 Cooperation with regulatory authorities
The design of a benchmark should take into account generic design factors that are intended to result in a reliable representation of the economic realities of the interest that the benchmark seeks to measure and to eliminate factors that might result in a distortion of the price, rate, index or value of that benchmark.

A new reference index for the euro repo market June 2017
European Money Markets Institute
Page 21
market participants, as the index methodology in a concentrated market should be different from that in a market with more homogeneous profiles of buyers and sellers; and market dynamics, the type of instruments underpinning the benchmark should be re-assessed on a regular basis to ensure the representativeness of the index.
As can be concluded from the analysis in Section 2, the following characteristics of the data enables EMMI to provide an appropriate and reliable representation of the underpinning market and its segments:
› Sufficient trading activity is concentrated on the one-day tenors supporting market liquidity and price efficiency (Section 2, part c) );
› All three ATSs represent important segments of the European repo market (e.g. specific vs. GC repos, government bonds used as collateral) (Section 2, part d) );
› The share of each country’s government bonds used as collateral is an adequate representation of important aspects of each country’s economic reality, such as GDP, outstanding total debt outstanding, and outstanding government debt;
› The suggested methodology has been tested in periods of market stress or at times of policy changes (see Section 6);
› All three ATSs operate trading infrastructures that are subject to requirements and obligations contained in the Markets in Financial Instruments Directive (MiFID) framework.16 In particular, they must have transparent rules for fair and orderly trading, objective criteria for the efficient execution of orders, transparent rules regarding the criteria for determining the financial instruments that can be traded under their systems, among others.
Principle 7: Data sufficiency
The new repo index will follow a purely transaction-based approach supported by executed trades, without any reliance on submitters’ discretion over what to report, allowing for a more thorough verification of submissions using actual historical data.
Principle 8: Hierarchy of data inputs
A well-defined hierarchy of data inputs—along with a number of other features of the index and its methodology, — help users understand what the benchmark is trying to represent, how the inputs are obtained, and the significance of the outputs. With this information, users are in a better position to decide on the suitability of the benchmark for their purposes. The methodology for the new repo index
16 In June 2014, the European Commission adopted the MiFID 2 directive and the MiFIR regulation. Both laws aim at making financial markets more efficient, resilient, and transparent.
The data used to construct a benchmark should be based on prices, rates, indices, or values that have been formed by the competitive forces of supply and demands, i.e. in an active market, and be anchored in observable transactions entered into at arm’s-length between buyers and sellers in the market for the interest the benchmark measures in order for it to function as a credible indicator.
The establishment of clear guidelines regarding the hierarchy of data inputs and the exercise of Expert Judgement used for the determination of the benchmarks. This Principle is intended to make transparent to users the manner in which data and Expert Judgement is used for the construction of the benchmark.

A new reference index for the euro repo market June 2017
European Money Markets Institute Page 22
relies solely on trades executed in participating ATSs and centrally cleared through qualifying CCPs, without any reliance on other sources of data.
As the analysis in the previous section shows, the sample used to develop and back-test the proposed benchmark determination methodology enables EMMI to provide an appropriate and reliable representation of the market underpinning the benchmark. Moreover, the data covers the majority of the pan-European repo market.

A new reference index for the euro repo market June 2017
European Money Markets Institute
Page 23
4 Components of the New Repo Index definition
International regulatory best practice places a duty on the benchmark administrator to have in place procedures for the potential need for evolution of a benchmark. In particular, IOSCO Principle 10 recommends benchmark administrators to regularly review conditions in the benchmark’s underlying market in order to determine whether changes to the design of the benchmark methodology might be necessary. The EU Regulation 2016/1011 on indices used as benchmarks also addresses this issue throughout the text: Article 11 (input data) and Article 28 (changes to and cessation of a benchmark) require benchmark administrators to maintain a procedure for actions to be taken in the event a material change to the benchmark occurs.
To this extent, and bearing in mind the potential need to evolve the index in the future without disruption to contracts referencing to it, EMMI considers it is helpful, and enhances the new repo index’s transparency, to distinguish between the following two aspects:17
(i) Its underlying interest, which defines the market or economic reality that the index seeks to measure; and
(ii) A statement of its determination methodology, which describes how the underlying interest is to be measured, describing the relevant data inputs and the method of calculation.
Q4 Do you agree with EMMI’s proposed structure for the definition of the new index, in line with other international initiatives? Please, provide a rationale for your answer.
EMMI defines the underlying interest of the new repo index as the average rate of return of secured wholesale one-business-day maturity transactions in euro.
EMMI measures the new repo index as the volume-weighted mean of the rates on secured wholesale one-business-day maturity transactions in euro settled on the same day of publication, made against ECB eligible collateral, executed anonymously in participating automatic trading systems and centrally cleared through a qualifying CCP., 18
Q5 Do you agree with EMMI’s proposed definition for the underlying interest of the new repo index? Please, provide a rationale for your answer.
17 This distinction has been made and used by other benchmark administrators in the context of other reforms and reviews; see, for example, EMMI’s Position Paper on the Evolution of Euribor (2015), the Bank of England’s definition of SONIA in their October 2016 public consultation on the reform of SONIA, and EMMI’s definition of EONIA in the recently published EONIA Governance Framework. 18 The term “qualifying CCP” was coined by the Basel Committee on Banking Supervision, and it was defined as “an entity that is licensed to operate as a CCP (including a license granted by way of confirming an exemption), and is permitted by the appropriate regulator/overseer to operate as such with respect to the products offered.” (See the July 2012 BIS report on Capital requirements for bank exposures to central counterparties.)

A new reference index for the euro repo market June 2017
European Money Markets Institute Page 24
The following section describes in detail EMMI’s choice of the determination methodology for the new repo index, as well as its features and characteristics.

A new reference index for the euro repo market June 2017
European Money Markets Institute
Page 25
Methodology of the New Repo Index
5 Methodology of the New Repo Index
For the sake of simplicity in the exposition, let us describe the determination methodology of the new repo index as a two-step process:
› Before calculation of the index, and in order to decide the pool of eligible transactions, it is necessary to make use of outlier removal techniques to minimize the impact of prices not considered as reflective of the underlying interest the benchmark seeks to measure;
› After outliers have been eliminated, and in order to determine the value of the index, it is necessary to select a method that appropriately measures the average interest rate of the transactions deemed eligible.
a) Outlier removal techniques
We give an account of the different outlier removal techniques explored by EMMI and the task force. The following considerations apply:
(i) Repo trades in currencies other than EUR; transactions with open term, in which the repurchase date is initially not determined; bilateral repos; pre-arranged trades; and incomplete or erroneous trades are excluded;
(ii) The index is calculated once a day on TARGET days after the EONIA fixing; (iii) Only one-day trades with same-day settlement (overnight transactions), one-day settlement
(tomorrow-next transactions), and two-day settlement (spot-next transactions) are considered;
(iv) On a given day, only one-day trades with common settlement day are considered for the calculation of the index (deferred rate calculation);
(v) A common outlier assessment and filtering is performed, removing transactions with spreads19 greater than five, or with rates larger than 10%.
The task force considered four outlier removal methodologies, to be applied after (v), each of them yielding a different index:
Baseline methodology
The baseline methodology is EMMI’s chosen methodology for the index. The baseline index is calculated using the full sample of eligible repo trades obtained after the common outlier assessment in (v) above (as mentioned in Section 1, pre-arranged, bilateral and triparty repos are excluded from the sample).
General Collateral (GC) methodology
Following the common outlier assessment in (v), all repo transactions categorized as specific are excluded.
19 See footnote 9: the spread for a repo trade k executed on day t is defined as the difference between the repo rate of the contract and the ECB rate on the deposit facility on that day over the width of the ECB monetary policy corridor on that day,
𝑆𝑆𝑆𝑆𝑆𝑆𝑆𝑆𝑆𝑆𝑆𝑆𝑘𝑘,𝑡𝑡 =𝑅𝑅𝑆𝑆𝑆𝑆𝑅𝑅 𝑅𝑅𝑆𝑆𝑅𝑅𝑆𝑆𝑘𝑘,𝑡𝑡 − 𝐸𝐸𝐸𝐸𝐸𝐸 𝐷𝐷𝑆𝑆𝑆𝑆𝑅𝑅𝐷𝐷𝐷𝐷𝑅𝑅 𝑅𝑅𝑆𝑆𝑅𝑅𝑆𝑆𝑡𝑡
𝐸𝐸𝐸𝐸𝐸𝐸 𝐿𝐿𝑆𝑆𝐿𝐿𝑆𝑆𝐷𝐷𝐿𝐿𝐿𝐿 𝑅𝑅𝑆𝑆𝑅𝑅𝑆𝑆𝑡𝑡 − 𝐸𝐸𝐸𝐸𝐸𝐸 𝐷𝐷𝑆𝑆𝑆𝑆𝑅𝑅𝐷𝐷𝐷𝐷𝑅𝑅 𝑅𝑅𝑆𝑆𝑅𝑅𝑆𝑆𝑡𝑡.
A new reference index for the euro repo market June 2017
European Money Markets Institute Page 26
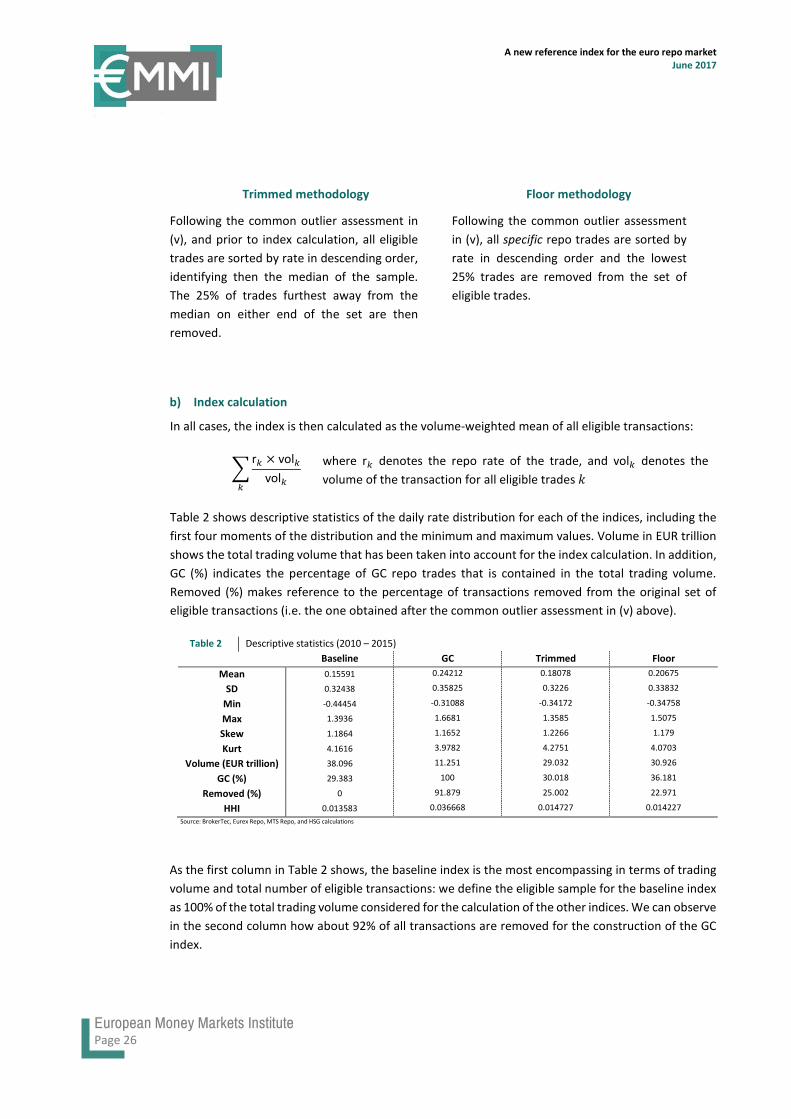
Trimmed methodology
Following the common outlier assessment in (v), and prior to index calculation, all eligible trades are sorted by rate in descending order, identifying then the median of the sample. The 25% of trades furthest away from the median on either end of the set are then removed.
Floor methodology
Following the common outlier assessment in (v), all specific repo trades are sorted by rate in descending order and the lowest 25% trades are removed from the set of eligible trades.
b) Index calculation
In all cases, the index is then calculated as the volume-weighted mean of all eligible transactions:
�r𝑘𝑘 × vol𝑘𝑘
vol𝑘𝑘𝑘𝑘
where r𝑘𝑘 denotes the repo rate of the trade, and vol𝑘𝑘 denotes the volume of the transaction for all eligible trades 𝑘𝑘
Table 2 shows descriptive statistics of the daily rate distribution for each of the indices, including the first four moments of the distribution and the minimum and maximum values. Volume in EUR trillion shows the total trading volume that has been taken into account for the index calculation. In addition, GC (%) indicates the percentage of GC repo trades that is contained in the total trading volume. Removed (%) makes reference to the percentage of transactions removed from the original set of eligible transactions (i.e. the one obtained after the common outlier assessment in (v) above).
Table 2 Descriptive statistics (2010 – 2015) Baseline GC Trimmed Floor
Mean 0.15591 0.24212 0.18078 0.20675
SD 0.32438 0.35825 0.3226 0.33832
Min -0.44454 -0.31088 -0.34172 -0.34758
Max 1.3936 1.6681 1.3585 1.5075
Skew 1.1864 1.1652 1.2266 1.179
Kurt 4.1616 3.9782 4.2751 4.0703
Volume (EUR trillion) 38.096 11.251 29.032 30.926
GC (%) 29.383 100 30.018 36.181
Removed (%) 0 91.879 25.002 22.971
HHI 0.013583 0.036668 0.014727 0.014227
Source: BrokerTec, Eurex Repo, MTS Repo, and HSG calculations
As the first column in Table 2 shows, the baseline index is the most encompassing in terms of trading volume and total number of eligible transactions: we define the eligible sample for the baseline index as 100% of the total trading volume considered for the calculation of the other indices. We can observe in the second column how about 92% of all transactions are removed for the construction of the GC index.

A new reference index for the euro repo market June 2017
European Money Markets Institute
Page 27
The main observations stemming from the descriptive analysis are three: First, we can observe the direct proportionality relationship between the number of trades removed from the sample and the average level of the rate over the period. Second, standard deviations are similar across indices, suggesting that all methods produce similar rate dispersion in spite of their different compositions. Third, low volumes of the Herfindahl–Hirschman Index (HHI),20 which is an indicator of market concentration, suggest that there is a high degree of competition among market participants.21
In its analysis, EMMI also assessed the behavior of the different indices in cases of market stress. For these tests, the European Central Bank’s Composite Index of Systemic Stress (CISS) was used as a risk indicator.
Q6 Do you agree with EMMI’s choice of the baseline determination methodology for the new repo index? Do you consider this methodology effectively measures the new repo index’s underlying interest, as defined in Section 4? Please, provide the rationale for your answer.
20 The Herfindahl–Hirschman Index (HHI) is defined as the sum of squares of the market shares of the firms within the industry. In the case at hand, it is calculated as the sum of squares of the shares of total trading volume within the one-day repo market. The HHI can take on values between 1/N (where N is the number of trading market participants) and 1, which indicates monopoly or the case where all trades are executed by the same trader. 21 Trader identification was removed from the data set by the contributing ATSs, making identification of traders across platforms impossible.
A new reference index for the euro repo market June 2017
European Money Markets Institute Page 28
6 Event study analysis
EMMI performed an event study analysis by observing the behavior of the different indices at the time of two representative events, namely the speech of the ECB President Mario Draghi at the height of the European sovereign crisis on 26 July 2012, and the change in the haircut policy of two major CCPs operating in the Italian market (LCH SA and CC&G). EMMI also analyzed the effect of the Eurosystem’s monetary policy decisions on the rates, in particular, changes in the ECB’s interest rate on the main refinancing operations (MRO). This Section summarizes the observed results.
a) Mario Draghi’s speech on July 2012: “whatever it takes”
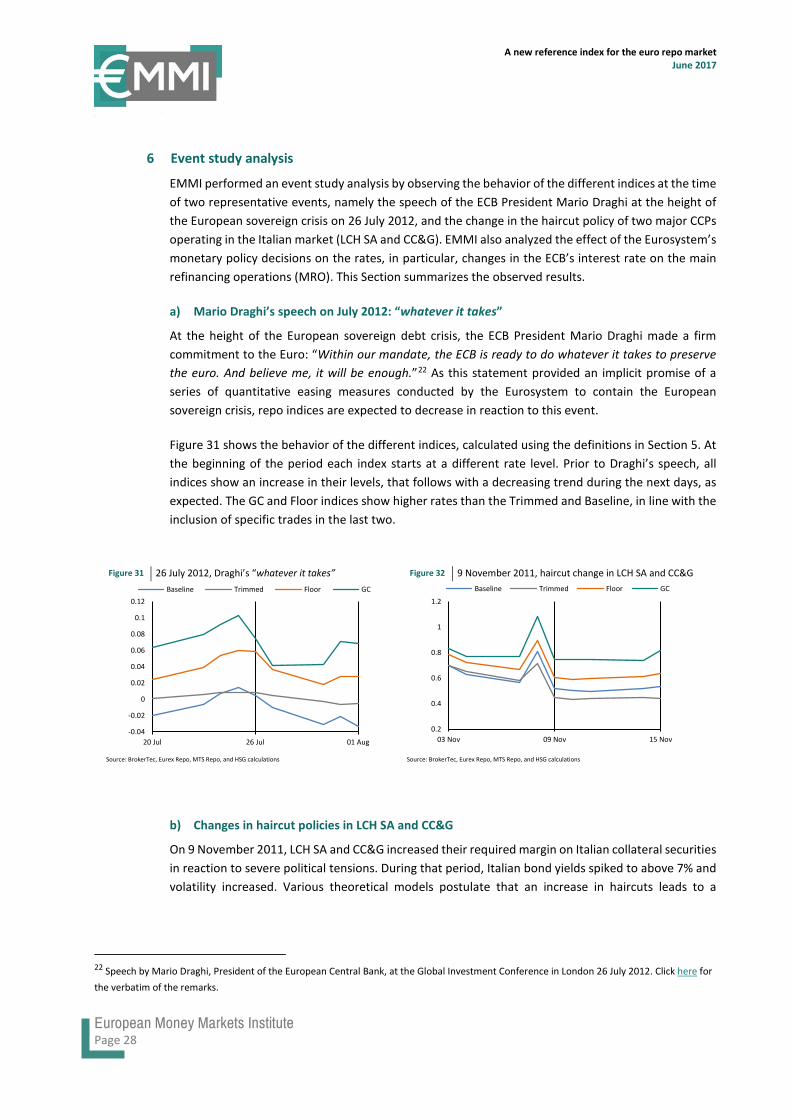
At the height of the European sovereign debt crisis, the ECB President Mario Draghi made a firm commitment to the Euro: “Within our mandate, the ECB is ready to do whatever it takes to preserve the euro. And believe me, it will be enough.”22 As this statement provided an implicit promise of a series of quantitative easing measures conducted by the Eurosystem to contain the European sovereign crisis, repo indices are expected to decrease in reaction to this event.
Figure 31 shows the behavior of the different indices, calculated using the definitions in Section 5. At the beginning of the period each index starts at a different rate level. Prior to Draghi’s speech, all indices show an increase in their levels, that follows with a decreasing trend during the next days, as expected. The GC and Floor indices show higher rates than the Trimmed and Baseline, in line with the inclusion of specific trades in the last two.
Figure 31 26 July 2012, Draghi’s “whatever it takes” Figure 32 9 November 2011, haircut change in LCH SA and CC&G
Source: BrokerTec, Eurex Repo, MTS Repo, and HSG calculations Source: BrokerTec, Eurex Repo, MTS Repo, and HSG calculations
b) Changes in haircut policies in LCH SA and CC&G
On 9 November 2011, LCH SA and CC&G increased their required margin on Italian collateral securities in reaction to severe political tensions. During that period, Italian bond yields spiked to above 7% and volatility increased. Various theoretical models postulate that an increase in haircuts leads to a
22 Speech by Mario Draghi, President of the European Central Bank, at the Global Investment Conference in London 26 July 2012. Click here for the verbatim of the remarks.
-0.04
-0.02
0
0.02
0.04
0.06
0.08
0.1
0.12
20 Jul 26 Jul 01 Aug
Baseline Trimmed Floor GC
0.2
0.4
0.6
0.8
1
1.2
03 Nov 09 Nov 15 Nov
Baseline Trimmed Floor GC

A new reference index for the euro repo market June 2017
European Money Markets Institute
Page 29
decrease (resp. increase) of asset price (resp. interest rate), see Gromb and Vayanos (2012)23 and Brunnermeier and Pedersen (2009).24 Using contract level data on the GC collateral segment of the Italian repo market between 2011 and 2014, Miglietta et al. (2015)25 find that higher margins increased cost of funding. Following this, we expect that in reaction to this event, all repo indices increase. As shown in Figure 32, all indices follow a short-lived spike.
c) Changes in the key ECB’s interest rates
To steer short-term interest rates, the Governing Council of the ECB has at its disposal a range of monetary policy tools. In particular, it sets the key interest rates for the euro area: the interest rate on the main refinancing operations, the rate on the deposit facility, and the rate on the marginal lending facility. The secured money market lending rate should remain responsive and react to changes in the key ECB’s interest rates.
The charts below show the behavior of each of the indices in a period of 10 business days around the date in which a change in the key rates was introduced (day D). The series represent the difference (spread) between the index on a given day and the index on day D. Figure 33 depicts the effect of the ECB’s 7 April 2011 decision to increase their key interest rates by 25 basis points with effect on 13 April 2011. Figure 34 illustrates the effect of the ECB’s 3 November 2011 decision to decrease all three key interest rates by 25 basis points, with effect on 9 November 2011.
Figure 33 13 April 2011, increase by 25bps of ECB’s key rates Figure 34 9 November 2011, decrease by 25 bps of ECB’s key rates
Source: BrokerTec, Eurex Repo, MTS Repo, and HSG calculations Source: BrokerTec, Eurex Repo, MTS Repo, and HSG calculations
The simple event analysis described in this Section makes EMMI conclude that the baseline index reacts to market conditions and policy actions as suggested by theoretical arguments or heuristically. We can also observe how the trimmed index follows more moderate and smooth patterns, partially explained by the exclusion of extremes on both ends of the rate spectrum.
23 D. Gromb and D. Vayanos, Equilibrium and welfare in markets with financially constrained arbitrageurs, Journal of Financial Economics 66, 361-407 (2012) 24 M. Brunnermeier and L.H. Pedersen, Market liquidity and funding liquidity, The Review of Financial Studies 22, 2201-2238 (2009) 25 A. Miglietta, C. Picillo, and M. Pietrunti, The impact of CCPs’ margin policies on repo markets, BIS Working Papers no. 515 (2015)
-0.7
-0.6
-0.5
-0.4
-0.3
-0.2
-0.1
0
0.1
06 Apr 11 13 Apr 11 20 Apr 11
Baseline Trimmed Floor
-0.1
0
0.1
0.2
0.3
02 Nov 11 09 Nov 11 16 Nov 11
Baseline Trimmed Floor
A new reference index for the euro repo market June 2017
European Money Markets Institute Page 30
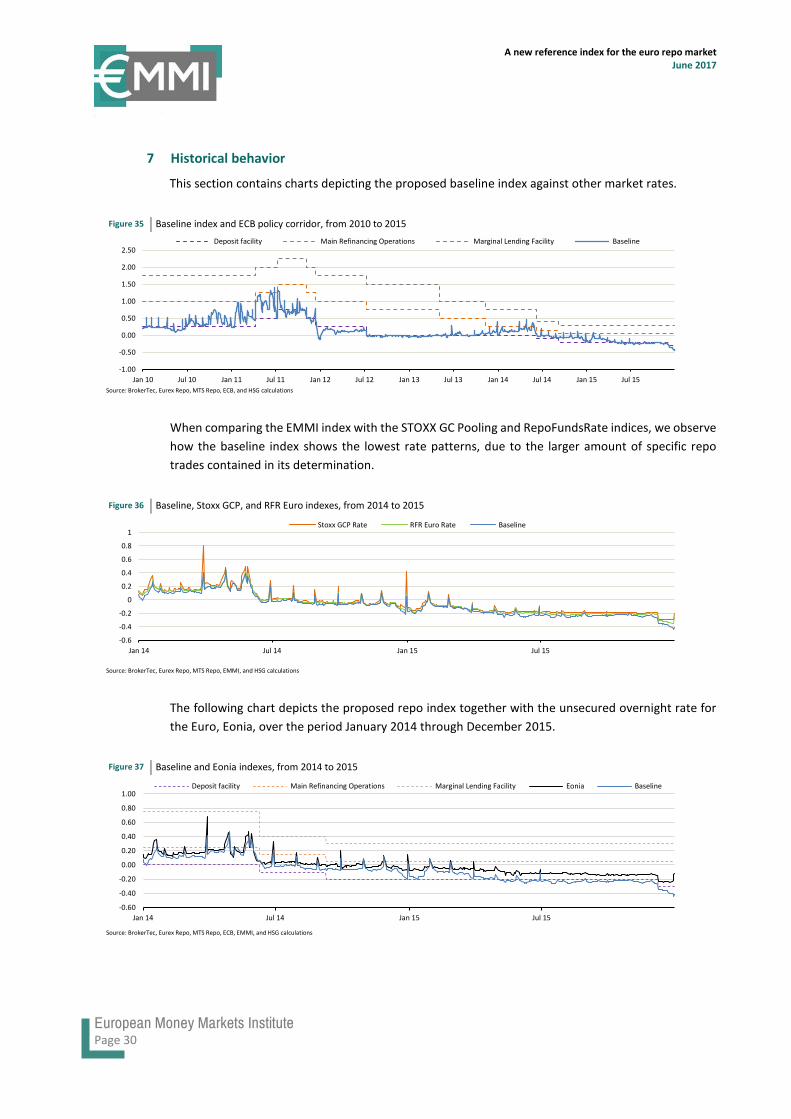
7 Historical behavior
This section contains charts depicting the proposed baseline index against other market rates.
Figure 35 Baseline index and ECB policy corridor, from 2010 to 2015
Source: BrokerTec, Eurex Repo, MTS Repo, ECB, and HSG calculations
When comparing the EMMI index with the STOXX GC Pooling and RepoFundsRate indices, we observe how the baseline index shows the lowest rate patterns, due to the larger amount of specific repo trades contained in its determination.
Figure 36 Baseline, Stoxx GCP, and RFR Euro indexes, from 2014 to 2015
Source: BrokerTec, Eurex Repo, MTS Repo, EMMI, and HSG calculations
The following chart depicts the proposed repo index together with the unsecured overnight rate for the Euro, Eonia, over the period January 2014 through December 2015.
Figure 37 Baseline and Eonia indexes, from 2014 to 2015
Source: BrokerTec, Eurex Repo, MTS Repo, ECB, EMMI, and HSG calculations
-1.00
-0.50
0.00
0.50
1.00
1.50
2.00
2.50
Jan 10 Jul 10 Jan 11 Jul 11 Jan 12 Jul 12 Jan 13 Jul 13 Jan 14 Jul 14 Jan 15 Jul 15
Deposit facility Main Refinancing Operations Marginal Lending Facility Baseline
-0.6
-0.4
-0.2
0
0.2
0.4
0.6
0.8
1
Jan 14 Jul 14 Jan 15 Jul 15
Stoxx GCP Rate RFR Euro Rate Baseline
-0.60
-0.40
-0.20
0.00
0.20
0.40
0.60
0.80
1.00
Jan 14 Jul 14 Jan 15 Jul 15
Deposit facility Main Refinancing Operations Marginal Lending Facility Eonia Baseline
A new reference index for the euro repo market June 2017
European Money Markets Institute
Page 31
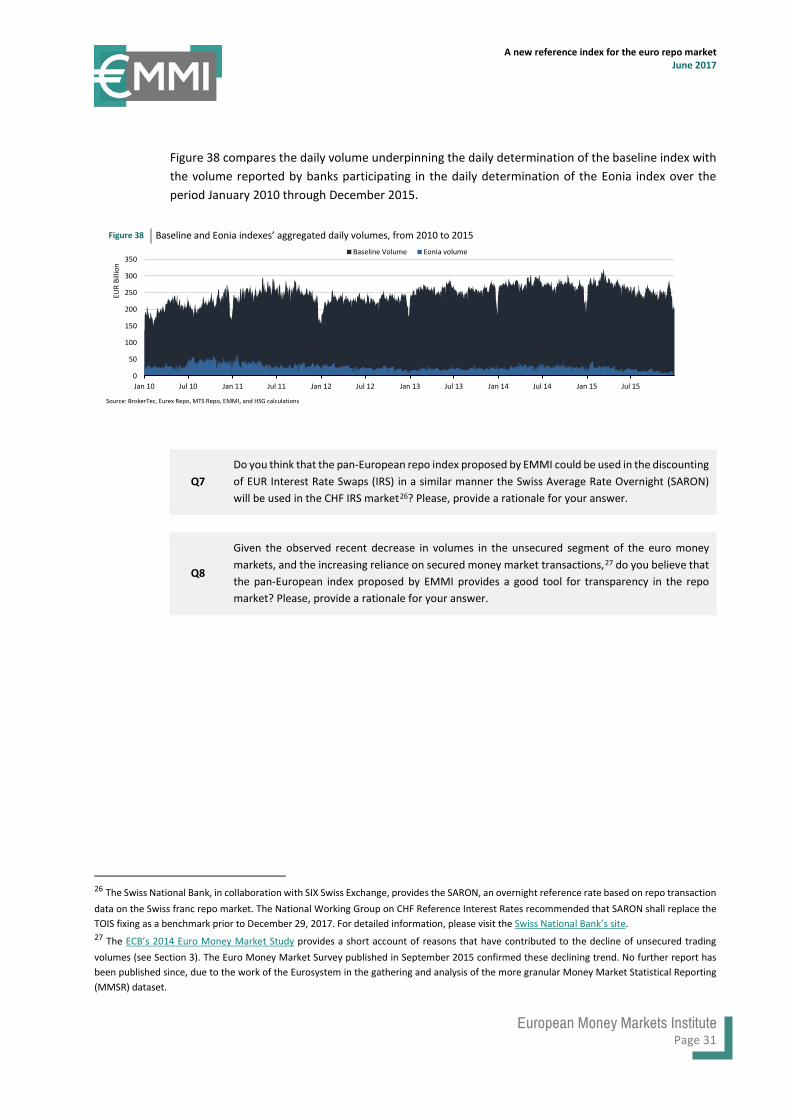
Figure 38 compares the daily volume underpinning the daily determination of the baseline index with the volume reported by banks participating in the daily determination of the Eonia index over the period January 2010 through December 2015.
Figure 38 Baseline and Eonia indexes’ aggregated daily volumes, from 2010 to 2015
Source: BrokerTec, Eurex Repo, MTS Repo, EMMI, and HSG calculations
Q7 Do you think that the pan-European repo index proposed by EMMI could be used in the discounting of EUR Interest Rate Swaps (IRS) in a similar manner the Swiss Average Rate Overnight (SARON) will be used in the CHF IRS market26? Please, provide a rationale for your answer.
Q8
Given the observed recent decrease in volumes in the unsecured segment of the euro money markets, and the increasing reliance on secured money market transactions,27 do you believe that the pan-European index proposed by EMMI provides a good tool for transparency in the repo market? Please, provide a rationale for your answer.
26 The Swiss National Bank, in collaboration with SIX Swiss Exchange, provides the SARON, an overnight reference rate based on repo transaction data on the Swiss franc repo market. The National Working Group on CHF Reference Interest Rates recommended that SARON shall replace the TOIS fixing as a benchmark prior to December 29, 2017. For detailed information, please visit the Swiss National Bank’s site. 27 The ECB’s 2014 Euro Money Market Study provides a short account of reasons that have contributed to the decline of unsecured trading volumes (see Section 3). The Euro Money Market Survey published in September 2015 confirmed these declining trend. No further report has been published since, due to the work of the Eurosystem in the gathering and analysis of the more granular Money Market Statistical Reporting (MMSR) dataset.
0
50
100
150
200
250
300
350
Jan 10 Jul 10 Jan 11 Jul 11 Jan 12 Jul 12 Jan 13 Jul 13 Jan 14 Jul 14 Jan 15 Jul 15
EUR
Billi
on
Baseline Volume Eonia volume
A new reference index for the euro repo market June 2017
European Money Markets Institute Page 32
List of questions
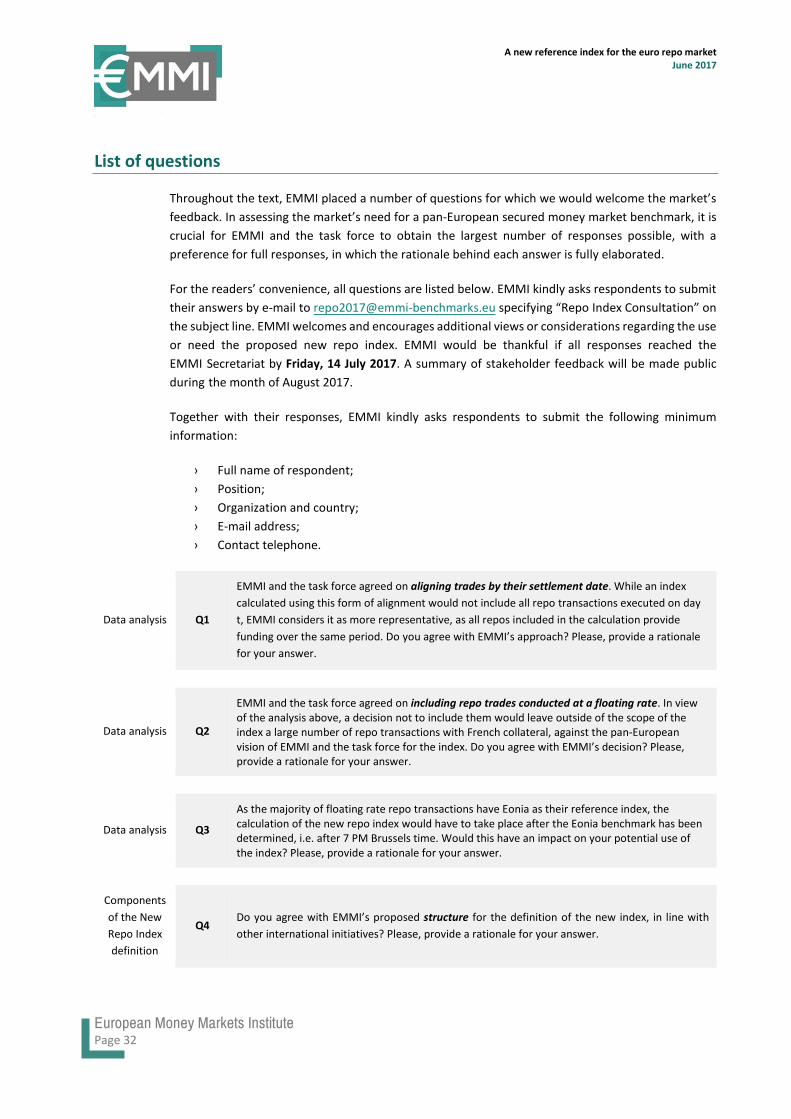
Throughout the text, EMMI placed a number of questions for which we would welcome the market’s feedback. In assessing the market’s need for a pan-European secured money market benchmark, it is crucial for EMMI and the task force to obtain the largest number of responses possible, with a preference for full responses, in which the rationale behind each answer is fully elaborated.
For the readers’ convenience, all questions are listed below. EMMI kindly asks respondents to submit their answers by e-mail to [email protected] specifying “Repo Index Consultation” on the subject line. EMMI welcomes and encourages additional views or considerations regarding the use or need the proposed new repo index. EMMI would be thankful if all responses reached the EMMI Secretariat by Friday, 14 July 2017. A summary of stakeholder feedback will be made public during the month of August 2017.
Together with their responses, EMMI kindly asks respondents to submit the following minimum information:
› Full name of respondent;› Position;› Organization and country;› E-mail address;› Contact telephone.
Data analysis Q1
EMMI and the task force agreed on aligning trades by their settlement date. While an index calculated using this form of alignment would not include all repo transactions executed on day t, EMMI considers it as more representative, as all repos included in the calculation provide funding over the same period. Do you agree with EMMI’s approach? Please, provide a rationale for your answer.
Data analysis Q2
EMMI and the task force agreed on including repo trades conducted at a floating rate. In view of the analysis above, a decision not to include them would leave outside of the scope of the index a large number of repo transactions with French collateral, against the pan-European vision of EMMI and the task force for the index. Do you agree with EMMI’s decision? Please, provide a rationale for your answer.
Data analysis Q3
As the majority of floating rate repo transactions have Eonia as their reference index, the calculation of the new repo index would have to take place after the Eonia benchmark has been determined, i.e. after 7 PM Brussels time. Would this have an impact on your potential use of the index? Please, provide a rationale for your answer.
Components of the New Repo Index definition
Q4 Do you agree with EMMI’s proposed structure for the definition of the new index, in line with other international initiatives? Please, provide a rationale for your answer.
A new reference index for the euro repo market June 2017
European Money Markets Institute
Page 33
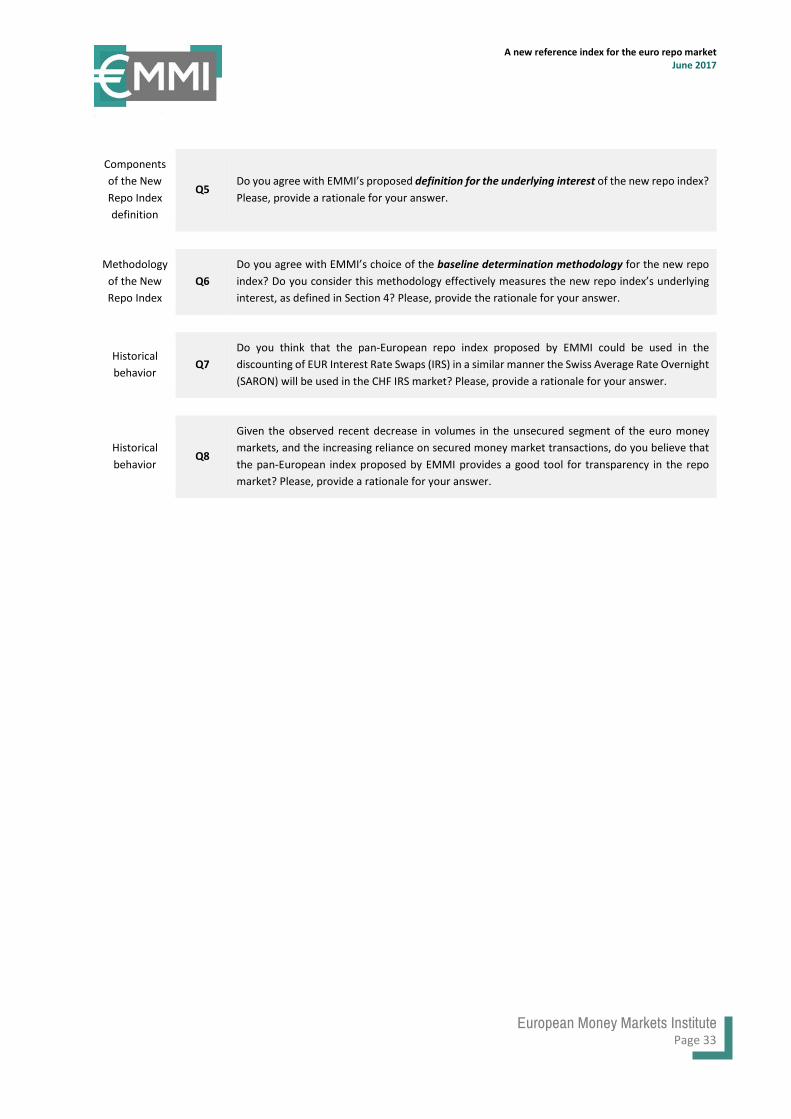
Components of the New Repo Index definition
Q5 Do you agree with EMMI’s proposed definition for the underlying interest of the new repo index? Please, provide a rationale for your answer.
Methodology
of the New Repo Index
Q6 Do you agree with EMMI’s choice of the baseline determination methodology for the new repo index? Do you consider this methodology effectively measures the new repo index’s underlying interest, as defined in Section 4? Please, provide the rationale for your answer.
Historical behavior
Q7 Do you think that the pan-European repo index proposed by EMMI could be used in the discounting of EUR Interest Rate Swaps (IRS) in a similar manner the Swiss Average Rate Overnight (SARON) will be used in the CHF IRS market? Please, provide a rationale for your answer.
Historical behavior
Q8
Given the observed recent decrease in volumes in the unsecured segment of the euro money markets, and the increasing reliance on secured money market transactions, do you believe that the pan-European index proposed by EMMI provides a good tool for transparency in the repo market? Please, provide a rationale for your answer.

European Money Markets Institute 56, Avenue des Arts 1000 Brussels | +32 (0) 2 431 52 08 | [email protected]