Embed Size (px)
Citation preview

Construction workforce in Victoria
1
Construction workforce in Victoria
Master Builders Association of Victoria December 2017

Commercial-in-confidence
Construction workforce in Victoria
Deloitte refers to one or more of Deloitte Touche Tohmatsu Limited, a UK private company limited by guarantee, and its network of member firms, each of which is a legally separate and independent entity. Please see www.deloitte.com/au/about for a detailed description of the legal structure of Deloitte Touche Tohmatsu Limited
and its member firms.
The entity named herein is a legally separate and independent entity. In providing this document, the author only acts in the named capacity and does not act in any
other capacity. Nothing in this document, nor any related attachments or communications or services, have any capacity to bind any other entity under the ‘Deloitte’
network of member firms (including those operating in Australia).
Liability limited by a scheme approved under Professional Standards Legislation.
© 2017 Deloitte Access Economics
Contents
Glossary i
Executive summary ii
1 Introduction 5
2 Future demand for construction workers 6
2.1 Outlook for construction in Victoria 6
2.1.1 Population 6 2.1.2 Housing 7
2.2 Outlook for employment in construction industry in
Victoria 9
2.2.2 Retirements 11 2.2.3 Outflow to other occupations 13 2.2.4 Total requirements 13
3 Gap in construction skills 15
3.1 Current availability of construction trades in Victoria 15
3.1.1 Skills shortages 15 3.1.2 Migration 15
3.2 Current number of people being trained in construction 18
3.2.1 Bricklayers and carpenters 18 3.2.2 Registered building surveyors 23
3.3 Expected supply of construction trades 24
3.3.1 Newly qualified workers 24
4 Women in construction 26
4.1 Women underemployed in Victoria 26 4.2 Women unemployed in Victoria 26 4.3 Women currently employed in the construction industry
in Victoria 27
4.3.2 Summary 29
5 Wages and building costs 30
5.1 Current wages for specific construction trades 30
5.1.1 ABS wage data 30 5.1.2 Information on wages from other sources 32 5.1.3 ABS liaison program 33
5.2 Impact of an increase in wages on the cost of housing 34

Commercial-in-confidence
Construction workforce in Victoria
Deloitte refers to one or more of Deloitte Touche Tohmatsu Limited, a UK private company limited by guarantee, and its network of member firms, each of which is a legally separate and independent entity. Please see www.deloitte.com/au/about for a detailed description of the legal structure of Deloitte Touche Tohmatsu Limited
and its member firms.
The entity named herein is a legally separate and independent entity. In providing this document, the author only acts in the named capacity and does not act in any
other capacity. Nothing in this document, nor any related attachments or communications or services, have any capacity to bind any other entity under the ‘Deloitte’
network of member firms (including those operating in Australia).
Liability limited by a scheme approved under Professional Standards Legislation.
© 2017 Deloitte Access Economics
References 36
Appendix A : Comparison of population projections 37
Limitation of our work 39
General use restriction 39

Charts
Chart 2.1 : Population growth in Victoria 7 Chart 2.2 : Housing starts in Victoria 8 Chart 2.3 : Dwelling investment in Victoria ($M, real) 8 Chart 2.4 : Victoria’s share of national population aged 25 to 39 and
national dwelling investment 9 Chart 2.5 : Employment in the construction industry in Victoria 10 Chart 2.6 : Age profile of bricklayers and carpenters in Victoria 12 Chart 2.7 : Retirement rate for carpenters and bricklayers in Victoria 13 Chart 3.1 : 457 visas granted with nominated position location in
Victoria 17 Chart 3.2 : 457 visas holders in Australia with nominated position
location in Victoria as at 30 June 17 Chart 3.3 Commencements in vocational courses, construction trades
(‘000) 18 Chart 3.4 In-training at 30 June by occupation, Victoria 1996–2016
(‘000) 19 Chart 3.5 : Enrolments and completions in Certificate III
qualifications related to Carpentry, Victoria 19 Chart 3.6 : Enrolments and completions in Certificate III
qualifications related to Bricklaying/Blocklaying, Victoria 20 Chart 3.7 : Change in carpentry workforce and training completions 22 Chart 3.8 Commencements, enrolments, and completions in Bachelor
of Building Surveying, Victoria 2001–2015 24 Chart 4.1 : Female underemployment in Victoria (% of employed) 26 Chart 4.2 : Female unemployment rate in Victoria 27 Chart 4.3 : Female employment in the construction industry in
Victoria 28 Chart 4.4 : Female share of employment in the construction industry
in Victoria 28 Chart 4.5 : Female share of total employment by industry, Victoria
(%) 29 Chart 5.1 : Annual growth in Wage Price Index, Victoria 30 Chart 5.2 : Annual growth in Wage Price Index for construction and
Annual growth in Housing Starts, Victoria 31 Chart 5.3 : Established house price in Melbourne and price of house
construction in Victoria 35
Tables
Table 2.1 : Carpenters, bricklayers, and surveyors employed in
Victoria 11 Table 3.1 : Combined list of eligible skilled occupations for
subclasses 457 and 186 16 Table 3.2 : Enrolments and completions in Certificate III
qualifications related to Carpentry and Bricklaying/Blocklaying, Total
VET activity, Victoria 21

Table 3.3 : Employment and training completions for carpenters and
joiners, and bricklayers and stonemasons, 2006-07 to 2015-16 21 Table 5.1 : Average Weekly Earnings for bricklayers and carpenters,
Australia ($ / week) 32 Table 5.2 : Average Tender (Costing) Rate for bricklayers and
carpenters, Melbourne ($ / Hour) 32 Table 5.3 : Hourly rates quoted, Melbourne ($ / Hour) 33 Table A.1 : Comparison of population projections 37

Commercial-in-confidence
Construction workforce in Victoria
i
Glossary
Acronym Full name
ABS Australian Bureau of Statistics
CSOL Consolidated Sponsored Occupation List
MBAV Master Builders Association of Victoria
MLTSSL Medium and Long-term Strategic Skills List
NCVER National Centre for Vocational Education Research
STSOL Short-term Skilled Occupations List
SOL Skilled Occupations List
TSS Temporary Skill Shortage
WPI Wage Price Index

Commercial-in-confidence
Construction workforce in Victoria
ii
Executive summary
Deloitte Access Economics has been commissioned by the Master Builders
Association of Victoria (MBAV) to undertake independent research across a
range of issues in relation to skill shortages in the Victorian building and
construction industry. The areas of focus include:
• The future demand for construction workers in Victoria;
• The gap in construction skills, especially for carpenters, bricklayers
and surveyors;
• A comparison of the number of women who are unemployed or
underemployed and the demand for construction workers in
Victoria;
• Any impact on wages that may result from the demand for and
supply of skilled construction workers. In addition, the impact this
may have on the cost of building.
Deloitte Access Economics has utilised a range of publicly available
information, as well as data obtained from the National Centre for
Vocational Education Research (NCVER) and the Commonwealth
Department of Education and Training, and our own analysis in compiling
this report.
Future demand for construction workers in Victoria
Victoria’s recent population growth has been particularly strong. The State’s
population growth of 2.4% over the year to March 2017 – or 149,000
people – is by far the strongest in the nation.
Deloitte Access Economics is projecting strong population gains to continue
over the next decade. Population growth is expected to average 1.6% per
annum over the decade to 2027. That is equivalent to an extra 1.1 million
people in Victoria over the decade to 2027.
Those additional people in Victoria will need somewhere to live, which will
underpin considerable demand for new housing in the State over the next
decade.
While the number of housing starts is expected to decline in the near term
– which is already evident to an extent in recent housing starts and building
approvals – activity is then expected to stabilise at a strong level.
An average of 54,400 housing starts each year over the next decade is
projected, which compares to an average 54,770 seen over the past
decade, and 41,460 over the decade prior. Shifts in the rate of population
growth explain these differences over time.
Reflecting this need, employment in the construction industry is expected to
increase at a solid rate.
Total employment in the construction industry is expected to increase by
1.2% per annum over the decade to 2026-27, or 33,700 over that period.
The total requirement of new entrants for bricklayers, carpenters and
registered building surveyors over the next decade will reflect new job
openings as a result of expansion of construction activity plus new job
openings to replace those leaving these occupations.

Commercial-in-confidence
Construction workforce in Victoria
iii
With around 21% of bricklayers and 17% of carpenters being aged 50 and
over, there are expected to be retirements of around 861 bricklayers and
stonemasons and 4,479 carpenters and joiners over the decade to 2026-27.
Retirements of registered building surveyors may number around 119 over
the next decade. Some workers in these occupations will also move into
other occupations over the next decade, which contributes further to the
training need.
In total, the number of new entrants required is estimated to amount to
1,980 for bricklayers and stonemasons, 10,507 for carpenters and joiners,
and 206 for registered surveyors over the next decade. For total
employment in the Victorian construction industry it is expected to amount
to 64,177 additional entrants over the next decade.
Gap in construction skills
There is evidence that carpenters and bricklayers are currently experiencing
skill shortages in Victoria.
The Commonwealth Department of Employment has assessed that there is
a shortage of skilled and experienced Carpenters and Joiners across
Victoria, while Bricklayers face a shortage in metropolitan Victoria.
One contributor to the skill shortage is a decline in the number of people
undertaking vocational training in Victoria in construction trades.
• Completions in Certificate III qualifications related to carpentry,
which involves the completion of an apprenticeship, declined to
1,432 in 2015, which represents a 22% decline from its level in
2013.
• Completions of Certificate III qualifications related to bricklaying
declined to 194 in 2015, down 71% from its level in 2013.
There has been an increase in enrolments for the Bachelor of Building
Surveying, but no increase has yet been seen for completions, with just
nine people completing the course in 2015 in Victoria.
Based on population growth, we would expect to see modest growth in
training rates, which will provide some support to skills in the sector.
However, there are question marks as to whether it will be enough to meet
demand requirements for the sector over the next decade, particularly from
the current point where skill shortages are starting to emerge.
Women in construction
At the same time, there are a significant number of women in the labour
force that are under-utilised. In particular, the female under-utilisation rate
is 16.9% of the female labour force in Victoria. There are around 265,000
under-utilised women in Victoria, comprising of 105,000 unemployed
women and 160,000 under-employed women.
Women therefore represent a potential source of relatively untapped labour
supply for the construction industry.
Women currently comprise only 9.5% of the construction sector workforce
in Victoria. That is the lowest of all industries in Victoria. And, the share of
women in the construction workforce has declined from around 11% a
decade ago.

Commercial-in-confidence
Construction workforce in Victoria
iv
Drawing more women into the construction workforce could help to alleviate
skill shortages in the construction industry over the next decade.
Wages and building costs
With the end of the mining construction boom, there has been a broader
easing of inflation and wage pressures across Australia and Victoria over
recent years.
This has also been reflected in broad measures of wage growth in the
construction industry in Victoria.
Data on wages for bricklayers and carpenters show a mixed picture. For
example:
• ABS data suggests an increase of 18.7% in the earnings of
carpenters between 2012 and 2016, and subdued earnings for
bricklayers at the national level;
• Rawlinsons data suggests an increase of 1.8% per annum in
bricklayer and carpenter charge out rates between 2014 and 2017.
Information from the ABS’ recent liaison with the housing construction
industry has indicated strong upward pressure on bricklayer wage rates in
recent years. This is consistent with information on bricklayer rates from
builders in Victoria received by MBAV.
Deloitte Access Economics
5
1 Introduction
Deloitte Access Economics has been commissioned by the Master Builders
Association of Victoria (MBAV) to undertake independent research across a
range of issues in relation to skill shortages in the Victorian building and
construction industry. The areas of focus include:
The future demand for construction workers in Victoria;
The gap in construction skills, especially for carpenters, bricklayers and
surveyors;
A comparison of the number of women who are unemployed or
underemployed and the demand for construction workers in Victoria;
Any impact on wages that may result from the demand for and supply
of skilled construction workers. In addition, the impact this may have
on the cost of building.
Deloitte Access Economics has utilised a range of publicly available
information, as well as data obtained from the National Centre for
Vocational Education Research (NCVER) and the Commonwealth
Department of Education and Training, and our own analysis in compiling
this report.

6
2 Future demand for construction
workers
This chapter provides an outlook for the construction industry in Victoria
and the associated demand for construction workers over the next decade.
2.1 Outlook for construction in Victoria
Victoria’s housing sector has been performing strongly in recent years,
supported by low interest rates and strong population growth.
2.1.1 Population
Victoria’s recent population growth has been particularly strong. The State’s
population growth of 2.4% over the year to March 2017 – or 149,000
people – is by far the strongest in the nation, and half as strong again as
the national average of 1.6%.
That huge strength in population growth is being driven by increases in
both net international migration as well as net interstate migration. Net
international migration is just about back to the record highs last reached in
2009, with a strong recovery in international student numbers – which are
continuing to show double digit growth over the past year – being another
supporting factor here. Meanwhile, the annual level of net interstate
migration to Victoria has risen to the highest level in at least 35 years.
Looking ahead, Deloitte Access Economics is projecting strong population
gains to continue over the next decade, despite some moderation from its
recent record highs. Population growth is expected to average 1.6% per
annum over the decade to 2027 (see Chart 2.1). That is equivalent to an
extra 1.1 million people in Victoria over the decade to 2027, or an average
of 110,000 extra people in Victoria each year.
Those additional people in Victoria will need somewhere to live, which will
underpin considerable demand for new housing in the State over the next
decade.
Appendix A provides a comparison between these population projections,
and the official population projections utilised by the Victorian government,
noting that the projected population level for Victoria in 2027 between the
two sets of forecasts is very similar. Deloitte Access Economics’ population
projections are more recent, and so pick up the recent strength in Victoria’s
population growth.
Chart 2.1 shows the strong rate of population growth in Victoria in recent
years. Assuming that the bipartisanship around Australia’s migration
program remains intact, Deloitte Access Economics expects that population
growth remain strong but gradually moderate over the next decade.

7
By way of comparison, Victoria in Future (2016) projections are also shown,
with Victoria in Future projecting weaker population growth in the near term
than Deloitte Access Economics, but slightly stronger population growth
than Deloitte Access Economics towards the end of the decade.
Chart 2.1: Population growth in Victoria
Source: Victoria in Future (2016), Deloitte Access Economics’ Business Outlook, September 2017
2.1.2 Housing
Growth in housing construction activity in Victoria is down from its peaks,
but housing construction activity remains at a high level and showed a solid
rise in the past year. A number of indicators are still indicating solid
conditions.
For example, finance commitments have kept lifting strongly over the past
year, while Melbourne house prices are also still rising. In the rental
market, vacancy rates have been trending down in recent months, while
growth in rents is starting to rise.
That said, the value of residential building approvals has levelled off in the
past year, suggesting that further big gains in housing construction activity
in the near term are less likely. And there remain risks around a potential
short term oversupply of apartments, the continuation of foreign demand
and high housing prices.
Even so, strong population growth will continue to underpin strong demand
for new housing over the next decade.
0.0%
0.5%
1.0%
1.5%
2.0%
2.5%
3.0%
2013 2015 2017 2019 2021 2023 2025 2027
Deloitte Access Economics Victoria in Future (2016)
% change on year earlier
8
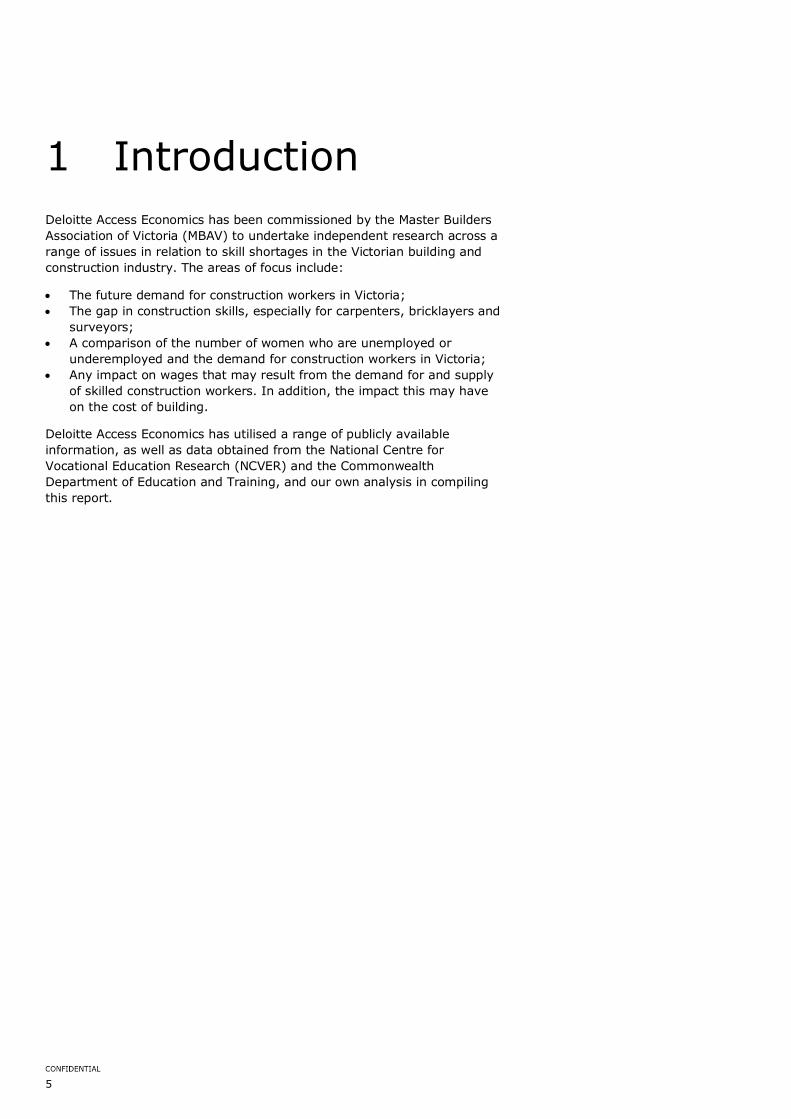
Chart 2.2: Housing starts in Victoria
Source: Deloitte Access Economics’ Business Outlook, September 2017
Chart 2.2 and Chart 2.3 show the outlook for the number of housing starts
and the value of dwelling investment (which includes renovation activity).
For the number of housing starts there is expected to be a decline in the
near term – which is already evident to an extent in recent housing starts
and building approvals – but activity is then expected to stabilise at a
strong level.
An average of 54,400 housing starts each year over the next decade is
projected, which compares to an average 54,770 seen over the past
decade, and 41,460 over the decade prior. Shifts in the rate of population
growth explain these differences over time.
Chart 2.3: Dwelling investment in Victoria ($M, real)
Source: Deloitte Access Economics’ Business Outlook, September 2017
20,000
30,000
40,000
50,000
60,000
70,000
80,000
2001-02 2006-07 2011-12 2016-17 2021-22 2026-27
Forecast
10,000
15,000
20,000
25,000
30,000
35,000
2001-02 2006-07 2011-12 2016-17 2021-22 2026-27
Forecast
9
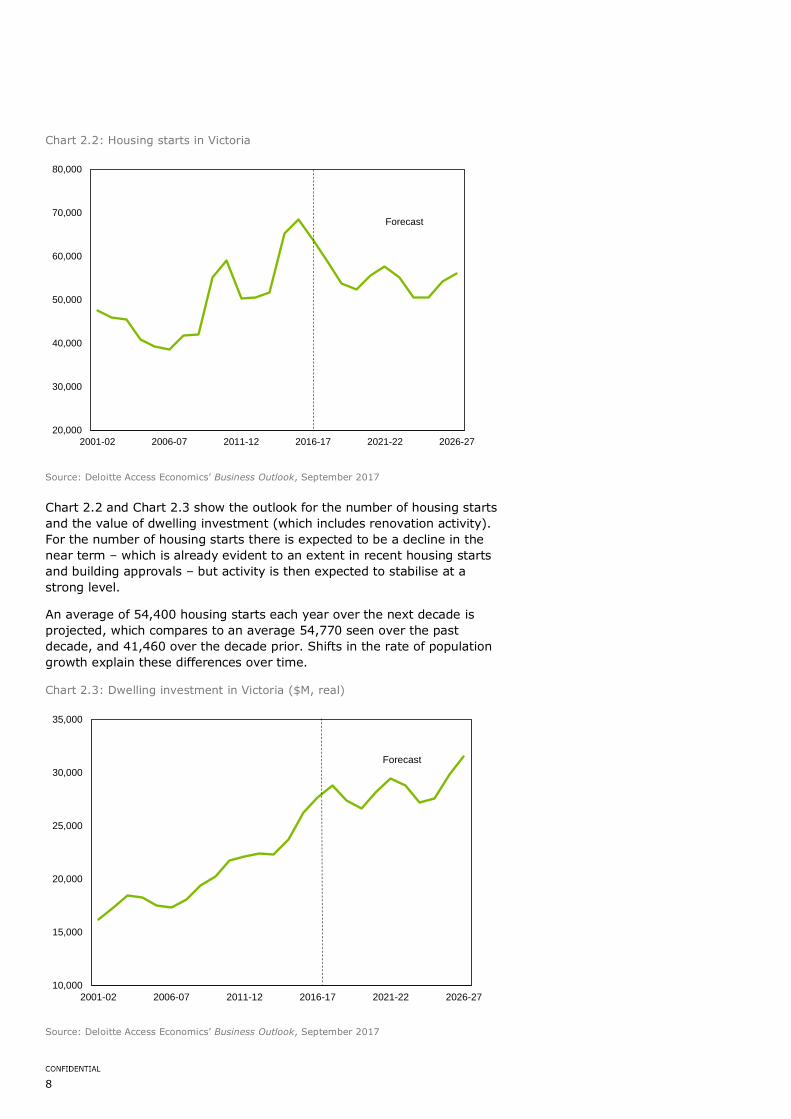
Chart 2.4 provides the outlook for Victoria’s population aged 25 to 39 and
dwelling investment within the national context. It shows the strong
performance of dwelling investment in Victoria over recent years relative to
the national performance. It also shows that Victoria’s share of national
dwelling investment has been higher than its share of the national
population aged 25 to 39 in recent years, which is an important age group
for the rate of household formation. Over the next decade, Victoria’s share
of national dwelling investment and national population aged 25 to 39 is
expected to move closer towards alignment.
Chart 2.4: Victoria’s share of national population aged 25 to 39 and national
dwelling investment
Source: Deloitte Access Economics
Strong population growth is also expected to underpin engineering
construction and non-residential building activity.
2.2 Outlook for employment in construction industry in Victoria
Chart 2.5 shows the outlook for employment in the construction industry in
Victoria.
0%
5%
10%
15%
20%
25%
30%
35%
40%
45%
50%
Population 25 to 39 Dwelling investment
Forecast

10
Chart 2.5: Employment in the construction industry in Victoria
Source: Deloitte Access Economics
Following an initial decline in the near term associated with the slowdown in
new housing activity, employment in the construction industry is expected
to increase at a solid rate.
Total employment in the construction industry is expected to increase by
1.2% per annum over the decade to 2026-27, or 33,729 over that period.
As shown in Table 2.1, carpenters and joiners are expected to see
employment increase by 3,363 persons over the decade to 2026-27, while
bricklayers and stonemasons are expected to see employment increase by
610 persons over that period.
Registered building surveyors are expected to see employment increase by
1.2% per annum over the decade to 2026-27, with registered building
surveyors (limited) seeing employment increase by 14 persons, and
registered building surveyors (unlimited) seeing employment increase by 73
persons.
These figures should be interpreted as forecasts of the construction
industry’s demand for workers consistent with the outlook for construction
activity – that is, the number of workers required to deliver the expected
level of construction activity.
0
50,000
100,000
150,000
200,000
250,000
300,000
350,000
Forecast

11
Table 2.1: Carpenters, bricklayers, and surveyors employed in Victoria
Occupation 2011-12 2015-16 2016-17 2021-22 2026-27 10-year
growth
(no.)
10-year
growth (%
p.a.)
Carpenters
and joiners 31,124 37,169 34,595 35,596 37,574 2,979 0.8%
Bricklayers
and
stonemasons
7,731 6,282 6,976 7,069 7,437 461 0.6%
Registered
Building
Surveyor
(limited)*
50 108 108 114 122 14 1.2%
Registered
Building
Surveyor
(unlimited)*
518 558 555 587 629 73 1.2%
Total
construction 244,192 269,535 256,041 270,693 289,770 33,729 1.2%
Source: Deloitte Access Economics
* Data for registered building surveyors in 2011-12 and 2015-16 is historical data as at 30 June
sourced from Victorian Building Authority. Data for 2016-17 has been estimated based on the
relative share of limited to unlimited registered building surveyors in 2015-16 and the total
number of registered building surveyors as at 5 October 2017.
2011 Census data indicates that 86% of the ‘bricklayers and stonemasons’ occupational group
comprised of ‘bricklayers’, while 14% were ‘stonemasons’. 2011 Census data also indicates that
91% of the ‘carpenters and joiners’ occupational group were ‘carpenters’, 4% were ‘joiners’, and
5% were combined ‘carpenters and joiners’.
It should also be noted that Table 2.1 shows employment figures for
‘carpenters and joiners’ and ‘bricklayers and stonemasons’ employed across
all industries. Although the vast majority are employed in the construction
industry, around 10% of ‘carpenters and joiners’ and ‘bricklayers and
stonemasons’ are employed in other industries, such as in the
manufacturing industry.
2.2.2 Retirements
Chart 2.6 shows that bricklayers and carpenters are comprised of a higher
proportion of younger workers than is the case across all occupations in
Victoria. This age profile likely reflects the more physically demanding
nature of the work in these types of occupations. The data show that 21%
of bricklayers and 17% of carpenters are aged 50 and over.

12
Chart 2.6: Age profile of bricklayers and carpenters in Victoria
Source: ABS 2011 Census, Deloitte Access Economics
Based on an analysis of the age profile of these occupations, as well as an
analysis of occupational data from the Australian Census Longitudinal
Database, and broader trends in population, migration and labour force
participation rates by age group, Deloitte Access Economics has developed
projections of retirements for these occupations.
Chart 2.7 shows that retirement rates for bricklayers and surveyors and
carpenters and joiners are expected to be similar over the next decade. The
annual retirement rate for bricklayers and stonemasons is expected to
average 1.2% per annum over the next decade, while the retirement rate
for carpenters and joiners is expected to average 1.3% per annum.1
That translates to a total number of expected retirements of 861 bricklayers
and stonemasons over the decade to 2026-27, as well as expected
retirements of 4,479 carpenters and joiners over the same period.
In the absence of detailed information on the age profile for registered
building surveyors, the average retirement rate for Victoria is used as a
proxy for this occupation. That would suggest around 19 retirements of
registered building surveyors (limited) and around 100 retirements of
registered building surveyors (unlimited) over the decade to 2026-27.
Importantly, these people retiring from the workforce will need to be
replaced with newly trained workers which is in addition to the need to train
workers to meet the growth in the construction workforce over time.
1 It should be noted that the methodology for estimating retirement rates is based on the number of workers who are aged 50 and over who leave the labour force each
year. Carpenters and bricklayers retiring earlier than 50 would not be picked up in the retirement modelling, but if they leave the occupation to eventually work in
another job, they should be picked up in estimates of net outflow to other occupations described in the next section.
0%
5%
10%
15%
20%
25%
15-19years
20-24years
25-29years
30-34years
35-39years
40-44years
45-49years
50-54years
55-59years
60-64years
65 andover
Bricklayers and Stonemasons Carpenters and Joiners All occupations
% of total employed

13
Chart 2.7: Retirement rate for carpenters and bricklayers in Victoria
Source: Deloitte Access Economics
2.2.3 Outflow to other occupations
In contrast to permanently retiring from the workforce, there will be some
younger carpenters and joiners, bricklayers and stonemasons, and
registered building surveyors who leave these occupations to move into a
different occupation. For example, some bricklayers and carpenters may
eventually become a builder, or may switch to do something else (which
would mean their skills are no longer available to their old occupation).
Similarly, there will be some people moving from other occupations and
becoming carpenters and joiners, bricklayers and stonemasons, and
registered building surveyors.
Analysis of data between 2006 and 2011 from the Australian Census
Longitudinal Database suggests that carpenters and joiners and bricklayers
and stonemasons both experience a net outflow of workers to other
occupations. For bricklayers and stonemasons the net outflow is around
0.9% per annum, while for carpenters and joiners the net outflow is around
0.8% per annum.
Based on these rates, we estimate that the net outflow of workers to other
occupations could be around 3,049 carpenters and joiners, and 659
bricklayers and stonemasons over the decade to 2026-27. In the absence of
data for registered building surveyors, we have not made an estimate for
this occupation.
2.2.4 Total requirements
The total requirement of new entrants for these occupations over the next
decade will reflect new job openings as a result of expansion of construction
activity plus new job openings to replace those leaving these occupations.
0.6%
0.8%
1.0%
1.2%
1.4%
1.6%
1.8%
2016-17 2018-19 2020-21 2022-23 2024-25 2026-27
Bricklayers and Stonemasons Carpenters and Joiners

14
Employers are expected to demand an extra 2,979 carpenters and joiners,
461 bricklayers and stonemasons and 87 registered surveyors to meet the
increased level of construction activity over the decade to 2026-27 (see
Table 2.1).
In addition, retirements of 861 bricklayers and stonemasons, as well as
4,479 carpenters and joiners, and 119 registered building surveyors can be
expected over the same period. A further 3,049 carpenters and joiners, and
659 bricklayers and stonemasons can be expected to move to other
occupations over the decade.
In total, the number of new entrants required amounts to 1,980 for
bricklayers and stonemasons, 10,507 for carpenters and joiners, and 206
for registered surveyors over the next decade.
For total employment in the Victorian construction industry it is expected to
amount to 64,177 additional entrants over the next decade.
Where will these workers come from?

15
3 Gap in construction skills
This chapter presents an overview of current indicators of availability of
construction trades, as well as current and future trends in training related
to specific construction occupations.
3.1 Current availability of construction trades in Victoria
3.1.1 Skills shortages
Based on data from the Survey of Employers who have Recently Advertised,
the Commonwealth Department of Employment has assessed that there is a
shortage of skilled and experienced Carpenters and Joiners across Victoria,
while Bricklayers face a shortage in metropolitan Victoria.
In 2016, 32% of Carpenter and Joiner vacancies were filled, a significant
decline from the 60% in 2015 and 95% in 2013. Notably, on average
employers considered only 1.5 applicants per vacancy to be suitable for the
role.
Bricklayers face a shortage in Metropolitan Victoria, where only 59% of
vacancies were filled in 2016, compared to 81% in regional areas. Across
the state, vacancies were filled from an average of 3.8 applicants, with an
average of 0.8 applicants considered suitable per vacancy.
3.1.2 Migration
Skilled migrants to Australia can help to ease the problem of skill shortages,
and the Federal Government maintains lists of eligible occupations for
migration to support this objective.
A number of changes to Australia’s temporary and permanent migration
programs were announced in early 2017. This included the abolition of the
Temporary Work (Skilled) visa (subclass 457 visa) its replacement with the
new Temporary Skill Shortage (TSS) visa in March 2018, as well as changes
to the list of eligible skilled occupations for migration.
In particular, the Consolidated Sponsored Occupation List (CSOL) has been
renamed as the Short-term Skilled Occupations List (STSOL), while the
Skilled Occupations List (SOL) has been renamed as the new Medium and
Long-term Strategic Skills List (MLTSSL). The STSOL is updated every six
months, while the MLTSSL contains occupations that have been assessed as
being of high value to the Australian economy and aligning to the
Government’s longer term training and workforce strategies.

16
As shown in Table 3.1, bricklayers and carpenters appear on the MLTSSL,
while building surveyors are included on the STSOL.2 This means that
building surveyors would be eligible for a short-term temporary visa (that
is, a maximum duration of two years for the 457 visa, or under the Short-
Term stream of the new TSS visa), while bricklayers and carpenters would
be eligible for a medium-term temporary visa (that is, a maximum duration
of four years for the 457 visa, or under the Medium-Term stream of the
new TSS visa).
Table 3.1: Combined list of eligible skilled occupations for subclasses 457 and
186
Occupation ANZSCO code List type
Carpenter 331212 MLTSSL
Carpenter & Joiner 331211 MLTSSL
Bricklayer 331111 MLTSSL
Building Inspector 312113 STSOL
Source: Department of Immigration and Border Protection. List accessed on 1 November 2017 at
http://www.border.gov.au/Trav/Work/Work/Skills-assessment-and-assessing-authorities/skilled-
occupations-lists/combined-stsol-mltssl
Chart 3.1 provides an overview of historical trends in the number of
temporary 457 visas to Victoria for bricklayers and carpenters. The number
of 457 visa granted for bricklayers and carpenters peaked in 2012-13, and
numbers have declined substantially since then. There were 65 grants of
457 visas for carpenters and joiners, and 24 for bricklayers and
stonemasons in 2016-17. There has been fewer than five 457 visa grants
for building inspectors each year over the past decade.
2 According to the ABS, an alternative title for ‘Building Inspector’ is ‘Building Surveyor’. The description of this occupation is: “Inspects buildings to ensure
compliance with laws and regulations and advises on building requirements. Registration or licensing may be required”.

17
Chart 3.1: 457 visas granted with nominated position location in Victoria
Source: Department of Immigration and Border Protection
Consistent with developments in 457 visa grants, the number of 457 visa
holders for carpenters and joiners and bricklayers and stonemasons in
Victoria peaked in 2012-13 and 2013-14 and have since declined. There
were 184 carpenters and joiners and 54 bricklayers and stonemasons on a
457 visa with a nominated location of Victoria as at 30 June 2017.
Chart 3.2: 457 visas holders in Australia with nominated position location in
Victoria as at 30 June
Source: Department of Immigration and Border Protection
0
50
100
150
200
250
Carpenters and joiners Bricklayers and stonemasons
0
50
100
150
200
250
300
350
400
450
2009 2010 2011 2012 2013 2014 2015 2016 2017
Carpenters and joiners Bricklayers and stonemasons

18
3.2 Current number of people being trained in construction
3.2.1 Bricklayers and carpenters
In 2016, there were around 815,325 VET program enrolments across all
levels, fields of study and provider types (i.e. TAFE, University, School,
private training provider, etc) where training was delivered in Victoria. 3
There were 40,395 VET program enrolments where the parent training
package was the Construction, Plumbing & Services Integrated Framework
and the training was delivered in Victoria. This included 16,810 program
enrolments for TAFE providers, and 18,645 program enrolments for private
training providers.4
In 2016, the number of program enrolments in Victoria undertaking a
Diploma in Building and Construction (Building) was 3,855 across all
provider types, up 13.4% from 2015, and comprising 2.7% of all students
undertaking Diploma and higher courses in Victoria5.
Commencements for apprentices and trainees in construction trades have
declined from 8,400 in 2015 to 6,600 in 2017.
Chart 3.3 Commencements in vocational courses, construction trades (‘000)
Source: NCVER, 2017, Apprentices and trainees 2017 - March quarter: Victoria
Note: Data shown are for the 12 months ending 31 March 2013 to 2017.
The Victorian building industry depends on the work of skilled trades such
as bricklayers and carpenters. There has been a decline in the number of
3 National Centre for Vocational Education Research, 2017, Total VET students and
courses 2016, https://www.ncver.edu.au/data/data/all-data/total-vet-students-and-courses-2016-data-slicer 4 National Centre for Vocational Education Research, 2017, Total VET students and courses 2016, https://www.ncver.edu.au/data/data/all-data/total-vet-students-and-
courses-2016-data-slicer 5 National Centre for Vocational Education Research, 2017, Total VET students and
courses 2016, https://www.ncver.edu.au/data/data/all-data/total-vet-students-and-courses-2016-data-slicer

19
people in training. Chart 3.4 shows the number of people undertaking an
apprenticeship or traineeship in Victoria in construction trades. Since 2011,
there has been an overall decline in the number of apprentices and trainees
in training that are in the construction and trades occupation.
Chart 3.4 In-training at 30 June by occupation, Victoria 1996–2016 (‘000)
Source: NCVER 2016, Historical time series of apprenticeships and traineeships in Australia
Chart 3.5 shows trends in enrolments and completions in Certificate III
qualifications related to carpentry, which involves the completion of an
apprenticeship. Enrolments peaked in 8,847 in 2011, and have not yet
recovered to that earlier level, with 8,495 enrolments in 2016. Completions
declined to 1,432 in 2015, which represents a 22% decline from the peak
level of 1,837 completions in 2013.
Chart 3.5: Enrolments and completions in Certificate III qualifications related to
Carpentry, Victoria
Source: National VET Provider Collection, National Centre for Vocational Education Research
Note: Qualifications included are Certificate III in Carpentry, Certificate III in Carpentry and
Joinery, Certificate III in Joinery, Certificate III in General Construction (Carpentry -
0
1000
2000
3000
4000
5000
6000
7000
8000
9000
10000
2006 2007 2008 2009 2010 2011 2012 2013 2014 2015 2016
Enrolments Completions
20
Framework/Formwork/Finishing), Certificate III in Off-Site Construction (Joinery-
Timber/Aluminium/Glass).
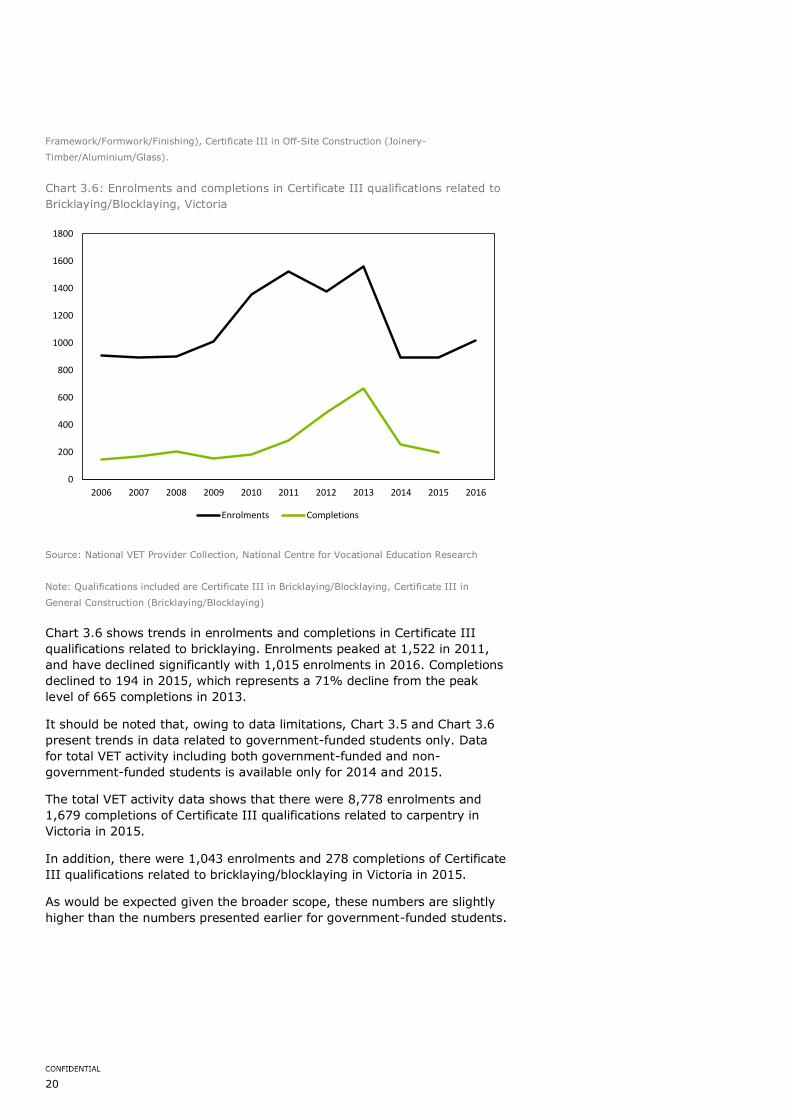
Chart 3.6: Enrolments and completions in Certificate III qualifications related to
Bricklaying/Blocklaying, Victoria
Source: National VET Provider Collection, National Centre for Vocational Education Research
Note: Qualifications included are Certificate III in Bricklaying/Blocklaying, Certificate III in
General Construction (Bricklaying/Blocklaying)
Chart 3.6 shows trends in enrolments and completions in Certificate III
qualifications related to bricklaying. Enrolments peaked at 1,522 in 2011,
and have declined significantly with 1,015 enrolments in 2016. Completions
declined to 194 in 2015, which represents a 71% decline from the peak
level of 665 completions in 2013.
It should be noted that, owing to data limitations, Chart 3.5 and Chart 3.6
present trends in data related to government-funded students only. Data
for total VET activity including both government-funded and non-
government-funded students is available only for 2014 and 2015.
The total VET activity data shows that there were 8,778 enrolments and
1,679 completions of Certificate III qualifications related to carpentry in
Victoria in 2015.
In addition, there were 1,043 enrolments and 278 completions of Certificate
III qualifications related to bricklaying/blocklaying in Victoria in 2015.
As would be expected given the broader scope, these numbers are slightly
higher than the numbers presented earlier for government-funded students.
0
200
400
600
800
1000
1200
1400
1600
1800
2006 2007 2008 2009 2010 2011 2012 2013 2014 2015 2016
Enrolments Completions

21
Table 3.2: Enrolments and completions in Certificate III qualifications related to
Carpentry and Bricklaying/Blocklaying, Total VET activity, Victoria
2014 2015
Enrolments
Carpentry 8,866 8,778
Bricklaying/Blocklaying 1,038 1,043
Completions
Carpentry 1,729 1,679
Bricklaying/Blocklaying 343 278
Source: VOCSTATS <http://www.ncver.edu.au/resources/vocstats.html>, extracted on 10/11/17
Note: Data based on state/territory of training organisation being Victoria
Table 3.3 provides a historical comparison of employment levels and
completions of relevant Certificate III courses for government-funded
students from 2006-07 to 2015-16.
Table 3.3: Employment and training completions for carpenters and joiners,
and bricklayers and stonemasons, 2006-07 to 2015-16
Employment Completions
Carpenters
and joiners
Bricklayers and
stonemasons
Carpenters and
joiners
Bricklayers and
stonemasons 2006-07 29,194 7,584 977 148
2007-08 32,182 8,693 1,231 168
2008-09 34,726 7,268 1,390 203 2009-10 29,102 6,657 1,413 156
2010-11 36,417 8,812 1,501 183 2011-12 31,124 7,731 1,703 285
2012-13 34,432 6,355 1,809 489
2013-14 36,078 6,366 1,837 665 2014-15 33,774 5,941 1,434 259
2015-16 37,169 6,282 1,432 194
2006-07 to 2015-16*
7,975 -1,302 13,295 2,556
Source: ABS, NCVER, Deloitte Access Economics
*Change in employment from 2006-07 to 2015-16, and sum of completions from 2006-07 to
2014-15. Assumes completion of training occurs at end of the year, with these workers available
to work in the following year.

22
The tables above show that completions of relevant qualifications were
much higher than the change in employment for both carpenters and
bricklayers over the 2006-07 to 2015-16 period.
However, this is not the end of the story in terms of assessing a supply-
demand balance, as a number of other factors need to be taken into
account. A certain proportion of those completing qualifications will not be
employed in these occupations for a variety of reasons (e.g. due to these
people moving overseas or interstate, choosing to work in other
occupations instead, or having characteristics that make them unattractive
to employers).
As an illustration, perhaps only 75% of the Certificate III graduates may be
available to be employed in the relevant occupations.
That still leaves an excess supply of 1,996 qualifications for
carpenters/joiners and 3,219 for bricklayers/stonemasons. In order to see a
shortage, the other factors must have contributed to a net outflow of
qualified workers of at least 1,996 carpenters/joiners, and 3,219
bricklayers/stonemasons. Given the level of employment shown in the table
above, that amounts to an annual net outflow rate of around 0.7% p.a. for
carpenters/joiners and 4.9% p.a. for bricklayers/stonemasons. This relates
to existing skilled workers in these occupations either retiring or moving to
other occupations, and net migration overseas/interstate.
This is further illustrated in Chart 3.7 which shows the annual change in
employment for carpenters and joiners, and the number of Certificate III
graduates over time. On an annual basis, there has not been a strong
relationship between the level of employment and training completions.
Chart 3.7: Change in carpentry workforce and training completions
Source: ABS, NCVER, Deloitte Access Economics
The supply of newly trained workers tends to be relatively stable over time,
while the level of employment can be quite volatile from year to year
depending on the level of construction activity. The difference represents
other factors such as the proportion of graduates moving into the
-8,000
-6,000
-4,000
-2,000
0
2,000
4,000
6,000
8,000
2007-08 2008-09 2009-10 2010-11 2011-12 2012-13 2013-14 2014-15 2015-16
Change in employment Number of Certificate III graduates

23
occupation, people moving to/from other occupations, retirements, as well
as international and interstate migration.
Given the indicators of current skill shortage, and the level of training
completion numbers over the past few years, then factors such as the
suitability and quality of the graduates may be an issue.
3.2.2 Registered building surveyors
Surveyors and building inspectors provide key oversight and quality control
in the building process. Registered Building Surveyors provide independent
oversight of buildings and building work throughout the construction
process. These occupations are registered in Victoria through the Victorian
Building Authority, which specifies the relevant training and skills required
for these occupations at the Bachelor level or above. These occupations
generally require a Bachelor degree or higher for professional registration.
Trends in commencements, enrolments and completions related to the
Bachelor of Building Surveying in Victoria are shown in Chart 3.8 below.
New commencements in the Bachelor Building Surveying course in Victoria
increased significantly in 2011 – from just 10 commencements in 2010 to
56 commencements in 2011. Given the multi-year nature of the course,
commencing students will typically remain enrolled in the course for several
years, and so the increase in commencements was also reflected in an
increase in enrolments during this period. However, both commencements
and enrolments in the Bachelor of Building Surveying in Victoria have
declined significantly in recent years from their peak levels of 66 in 2012 for
commencements and 107 in 2013 for enrolments. There were 48 students
commencing the Bachelor of Building Surveying in Victoria in 2015, and 94
students enrolled in the course.
Enrolments in the Bachelor of Building Surveying have not increased by as
much as commencements might suggest. For example, there were 139
students commencing the Bachelor of Building Surveying across 2013,
2014, and 2015, but only 94 students enrolled in the course in 2015. That
suggests a significant number of students that commence the course may
be dropping out.
Finally, the increase in commencements has yet to translate into an
increase in the number of students completing the course. Full-time
students commencing in 2011 should have completed by 2015, although
students enrolled part-time would take longer to complete the course.
There were only 9 completions of the Bachelor of Surveying in Victoria in
2015.
It remains to be seen whether the higher level of enrolments in the
Bachelor of Building Surveying in Victoria will translate into a higher level of
completions over the next few years.

24
Chart 3.8 Commencements, enrolments, and completions in Bachelor of Building
Surveying, Victoria 2001–2015
Source: Commonwealth Department of Education and Training, 2017
Note: Completions for 2004 to 2009 and commencements for 2005 were less than 5, but a
specific number was not published.
3.3 Expected supply of construction trades
3.3.1 Newly qualified workers
The key population age cohort for training of new construction trades
workers is that of young people.
The 15 to 24 year old age group in Victoria is projected to grow by 9.8%
over the decade to 2026-27 or 0.9% per annum over that period.
Based on current completion rates, and the expected growth in the
Victorian population aged 15 to 24 over the next decade:6
The completion of Certificate III qualifications related to Carpentry in
Victoria is expected to increase from an estimated 1,432 in 2015-16 to
1,603 in 2026-27;
The completion of Certificate III qualifications related to bricklaying in
Victoria is expected to increase from an estimated 194 in 2015-16 to
217 in 2026-27;
The completion of all Certificate III qualifications within the broad field
of study of ‘Architecture and Building’ is expected to increase from an
estimated 5,005 in 2015-16 to 5,604 in 2026-27;7
6 Latest completions data which is for 2015, has been used as an estimate for 2015-16. 7 There were 27 Certificate III qualifications in the broad field of study of ‘Architecture and Building’ with completions in 2015, with the largest being
carpentry, plumbing, concreting, wall and ceiling lining, painting and decorating, wall and floor tiling, and bricklaying/blocklaying.

25
The completion of Bachelor of Building Surveying in Victoria is expected
to increase from an estimated nine people in 2015-16 to 10 in 2026-27.
The above figures provide an illustration of future course completions if
current completion rates as a proportion of the population aged 15 to 24
remained the same over time. As such, the projections are driven by the
projected future growth of the population aged 15 to 24. The projections
do not take into account changes in other factors such as policy changes
which may influence completion rates.
This modest growth in training rates will provide some support, but there
are question marks as to whether it will be enough to meet demand
requirements for the sector over the next decade, particularly from the
current point where skill shortages are starting to emerge.
The forecasts of employment suggest that employment growth may slow
somewhat for carpenters, which may help to ease skill shortages, but the
opposite may be the case for bricklayers. Registered building surveyors are
expected to continue to see solid employment growth.
While the outlook for the demand and supply of carpenters, bricklayers, and
building surveyors will be influenced by the outlook for employment in these
occupations and the level of training completions, it will also be influenced
by a number of other factors. These include the proportion of graduates of
relevant training courses that move into the occupation, the level of
retirements and net outflow to other occupations, as well as international
and interstate migration.
The historical experience suggests that there has been enough completions
of relevant qualifications for carpenters and bricklayers over the past
decade to meet growth in employment. The reason that these
occupations appear to be in shortage is due to some combination of
newly trained workers not entering the occupation, or existing
skilled workers leaving the occupation.

26
4 Women in construction
This chapter provides an overview of women working in the construction
industry and in the broader labour force in Victoria.
4.1 Women underemployed in Victoria
Underemployment refers those in the employed population who are willing
and available to work more hours than they currently are. Combined with
unemployment, underemployment represents a level of slack and
underutilisation in the workforce.
Proportionally, underemployment is higher for women than men in Victoria.
After reaching a high of 12.4% in November 2016 (in trend terms), female
underemployment has fallen to 10.9% in August 2017. This is compared to
7.7% for men.
This means that 10.9% of women employed in Victoria, or 160,000 women,
are looking and available for more hours of work than they currently have.
Chart 4.1: Female underemployment in Victoria (% of employed)
Source: ABS Labour Force Survey, Cat. No. 6202.0
4.2 Women unemployed in Victoria
In trend terms, female unemployment in Victoria is at its highest rate since
August 2001. At 6.7%, this is much higher the male unemployment rate
(5.7%) for men in Victoria. In total, 105,000 women are unemployed are in
Victoria.
4
6
8
10
12
14
1997 1999 2001 2003 2005 2007 2009 2011 2013 2015 2017
%

27
Chart 4.2: Female unemployment rate in Victoria
Source: ABS Labour Force Survey, Cat. No. 6202.0
4.3 Women currently employed in the construction industry in
Victoria
The number of women working in the construction sector increased from
the late 1990s through to the turn of the most recent decade. However,
since 2011 the number of women in the construction sector has seen few
gains. This is despite increases in overall construction employment over this
time.
0
2
4
6
8
10
12
1997 1999 2001 2003 2005 2007 2009 2011 2013 2015 2017
%
28
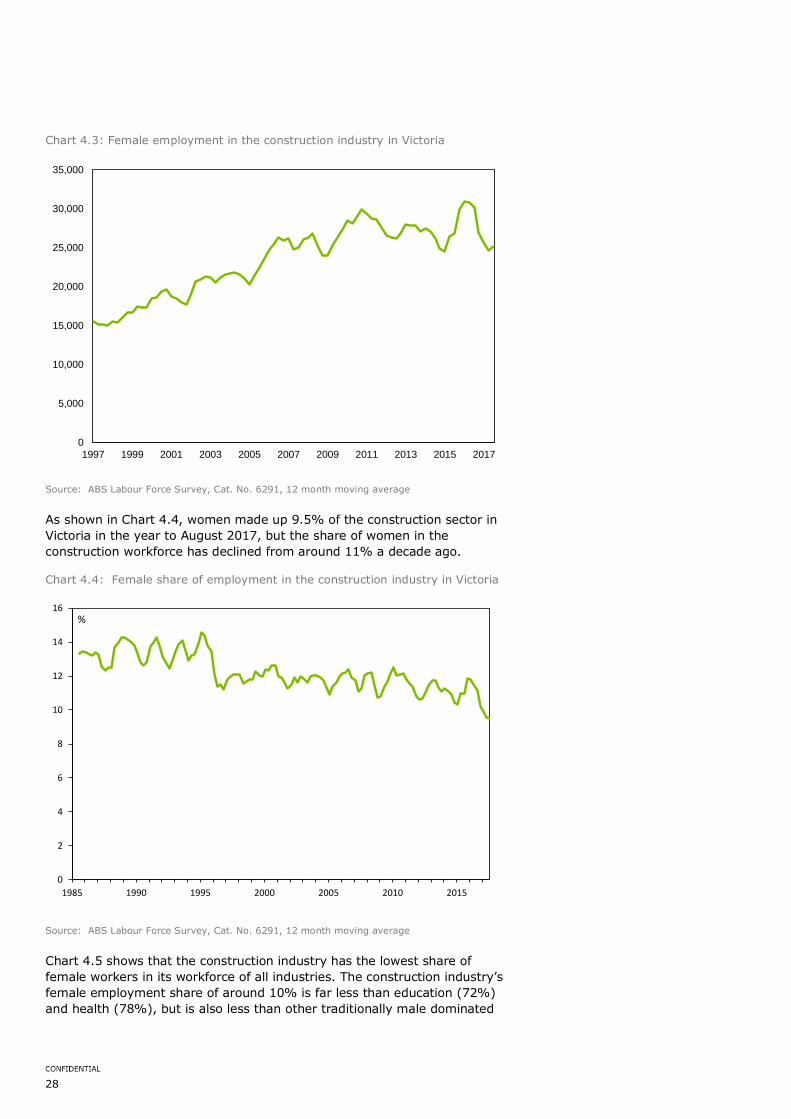
Chart 4.3: Female employment in the construction industry in Victoria
Source: ABS Labour Force Survey, Cat. No. 6291, 12 month moving average
As shown in Chart 4.4, women made up 9.5% of the construction sector in
Victoria in the year to August 2017, but the share of women in the
construction workforce has declined from around 11% a decade ago.
Chart 4.4: Female share of employment in the construction industry in Victoria
Source: ABS Labour Force Survey, Cat. No. 6291, 12 month moving average
Chart 4.5 shows that the construction industry has the lowest share of
female workers in its workforce of all industries. The construction industry’s
female employment share of around 10% is far less than education (72%)
and health (78%), but is also less than other traditionally male dominated
0
5,000
10,000
15,000
20,000
25,000
30,000
35,000
1997 1999 2001 2003 2005 2007 2009 2011 2013 2015 2017
0
2
4
6
8
10
12
14
16
1985 1990 1995 2000 2005 2010 2015
%

29
industries such as mining (22%), transport (24%), and manufacturing
(29%).
Chart 4.5: Female share of total employment by industry, Victoria (%)
Source: ABS Labour Force Survey, Cat. No. 6291, 12 months to August 2017
4.3.2 Summary
Given that the construction industry is expected to see solid growth in new
job openings over the next decade, female workers represent a potential
source of labour supply to fill those job openings and avoid potential skill
shortages.
This chapter has shown that there are a significant number of women in the
labour force that are under-utilised. In particular, the female under-
utilisation rate is 16.9% of the female labour force in Victoria. There are
around 265,000 under-utilised women in Victoria, comprising of 105,000
unemployed women and 160,000 under-employed women.
Women therefore represent a potential source of relatively untapped labour
supply for the construction industry. Drawing more women into the
construction workforce could help to alleviate skill shortages in the
construction industry over the next decade.
0%
10%
20%
30%
40%
50%
60%
70%
80%
90%

30
5 Wages and building costs
This chapter considers the implications of skill shortages for wages and
building costs.
5.1 Current wages for specific construction trades
The information presented in Section 3.1 suggested that skill shortages
have recently been evident for carpenters and bricklayers.
To what extent has this translated into upward pressure on wages?
Information on wages is examined from 1) ABS data, 2) data from other
sources, and 3) information from the ABS liaison program
5.1.1 ABS wage data
We first note that during the period of the mining boom, skill shortages and
wage pressures were being experienced across the economy, including in
construction. This was particularly evident in the mining states, but was
also seen in jurisdictions such as Victoria due to the strong competition for
labour from the mining jurisdictions during that time. Since the downturn in
mining-related construction commenced in 2012, inflation and wage
pressures have eased across the economy, both nationally and in Victoria.
Chart 5.1 shows wage growth in construction and the broader economy in
Victoria as measured by the Wage Price Index (WPI). The construction WPI
is a broad measure of wage growth across all sectors of this industry.
Chart 5.1: Annual growth in Wage Price Index, Victoria
Source: ABS Cat. No. 6345.0, Deloitte Access Economics
0%
1%
2%
3%
4%
5%
6%
2006-07 2008-09 2010-11 2012-13 2014-15 2016-17
All Industries Construction

31
According to the WPI measure, wage growth in Victoria has eased in recent
years, and is currently relatively subdued. Wage growth in construction is
also lower than in previous years, although did see a pick-up in 2016-17.
Wage growth in the construction industry has continued to be stronger than
across other industries in the Victorian economy.
Previous research has shown that wage growth under EBAs in the
commercial construction sector where union influence is stronger, has been
particularly strong in Victoria. Moreover, EBA wage growth has not been
particularly responsive to market conditions, with strong EBA wage growth
recorded during periods of both weaker and stronger market conditions.
That suggests that, although EBA wage growth is likely a factor keeping
construction WPI growth stronger in Victoria than it might be otherwise,
large swings in construction WPI growth from year to year are more likely
to be reflective of developments in the less unionised sectors of the
construction industry, particularly residential construction.
Chart 5.2: Annual growth in Wage Price Index for construction and Annual
growth in Housing Starts, Victoria
Source: ABS Cat. No. 6345.0, Deloitte Access Economics
Chart 5.2 shows growth in the construction WPI compared with growth in
housing starts in Victoria. There has historically been a relationship between
the two series – for example, wage growth picked up in 2009-10 when
there was a surge in housing starts, and subsequently eased again when
housing starts fell. Wage growth in construction picked up again in the early
stages of the most recent housing construction boom. However, wage
growth subsequently eased which may reflect both the peaking of housing
starts and also the broader easing in wage pressures noted earlier. That
said, a pick-up in construction wage growth was seen in 2016-17.
The ABS publishes wage data for detailed occupations on a bi-annual basis
(see Table 5.1).
A limitation of this data is that it is currently being published only at the
national level.
-20%
-10%
0%
10%
20%
30%
40%
0%
1%
2%
3%
4%
5%
6%
2006-07 2008-09 2010-11 2012-13 2014-15 2016-17
Construction WPI Housing starts (RHS)
32
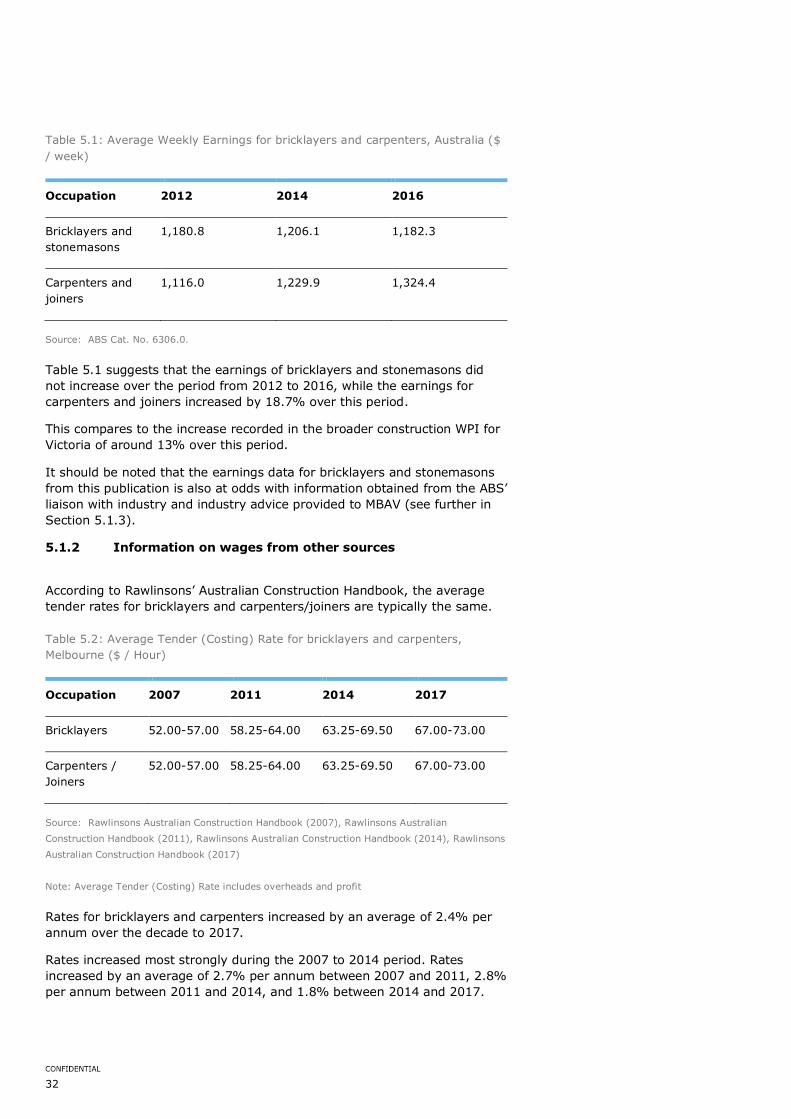
Table 5.1: Average Weekly Earnings for bricklayers and carpenters, Australia ($
/ week)
Occupation 2012 2014 2016
Bricklayers and
stonemasons
1,180.8 1,206.1 1,182.3
Carpenters and
joiners
1,116.0 1,229.9 1,324.4
Source: ABS Cat. No. 6306.0.
Table 5.1 suggests that the earnings of bricklayers and stonemasons did
not increase over the period from 2012 to 2016, while the earnings for
carpenters and joiners increased by 18.7% over this period.
This compares to the increase recorded in the broader construction WPI for
Victoria of around 13% over this period.
It should be noted that the earnings data for bricklayers and stonemasons
from this publication is also at odds with information obtained from the ABS’
liaison with industry and industry advice provided to MBAV (see further in
Section 5.1.3).
5.1.2 Information on wages from other sources
According to Rawlinsons’ Australian Construction Handbook, the average
tender rates for bricklayers and carpenters/joiners are typically the same.
Table 5.2: Average Tender (Costing) Rate for bricklayers and carpenters,
Melbourne ($ / Hour)
Occupation 2007 2011 2014 2017
Bricklayers 52.00-57.00 58.25-64.00 63.25-69.50 67.00-73.00
Carpenters /
Joiners
52.00-57.00 58.25-64.00 63.25-69.50 67.00-73.00
Source: Rawlinsons Australian Construction Handbook (2007), Rawlinsons Australian
Construction Handbook (2011), Rawlinsons Australian Construction Handbook (2014), Rawlinsons
Australian Construction Handbook (2017)
Note: Average Tender (Costing) Rate includes overheads and profit
Rates for bricklayers and carpenters increased by an average of 2.4% per
annum over the decade to 2017.
Rates increased most strongly during the 2007 to 2014 period. Rates
increased by an average of 2.7% per annum between 2007 and 2011, 2.8%
per annum between 2011 and 2014, and 1.8% between 2014 and 2017.

33
Table 5.3: Hourly rates quoted, Melbourne ($ / Hour)
Trade FY17Q4, $/hr FY16Q4, $/hr % Change
Plumber $76.20 $76.30 -0.1%
Electrician $72.30 $73.30 -1.4%
Carpenter $59.30 $53.20 11.5%
Builder $57.70 $59.30 -2.7%
Landscaper $49.50 $51.90 -4.6%
Tiler $47.10 $46.60 1.1%
Plasterer $46.60 $46.10 1.1%
Painter $38.80 $48.30 -19.7%
Average $55.90 $56.90 -1.8%
Source: serviceseeking.com.au
Note: Hourly rates are “gross” rates and aside from including the cost of labour, also cover the
cost of running the business such as insurance, tools, work vehicles and superannuation.
Table 5.3 shows hourly rates quoted on the online portal
serviceseeking.com.au and again suggests a strong increase in the rates
quoted for carpenters over the past year. A limitation of this data is that it
is limited to quotes made through the serviceseeking.com.au website and
may not necessarily be representative of broader trends in the industry.
5.1.3 ABS liaison program
The ABS indicated that it had recently conducted a liaison program in
relation to the residential construction industry with Project home builders,
Property developers and Quantity surveyors.8
The ABS liaison indicated that labour costs have been subdued, with one
factor being the degree of labour mobility. Tradespersons move from
regional to urban areas to undertake work, while the availability of
tradespersons previously employed on mining projects has increased labour
supply.
While the ABS liaison suggested that labour costs had been subdued, this
was not the case for bricklayers:
8 ABS (2017), Producer Price Index, Australia (Cat No. 6427.0), ‘ABS Liaison –
Residential Construction’. Accessed at: http://www.abs.gov.au/AUSSTATS/[email protected]/Previousproducts/6427.0Feature%20Art
icle1Dec%202016?opendocument&tabname=Summary&prodno=6427.0&issue=Dec%202016&num=&view=
34
… a common theme across all attached and detached respondents was the
shortage of skilled bricklayers. This has seen bricklayer rates increase
significantly over the recent past.
Consistent with the findings of the ABS’ liaison, industry advice provided
directly to MBAV has also suggested a significant shortage of bricklayers
which is producing cost pressure.
The ABS liaison program also suggested that residential construction
businesses use long term contracts and hedging to limit the flow through of
input cost increases to final prices. This meant that pass through of
increases to labour and other costs to final prices tended to take place
gradually over time.
5.2 Impact of an increase in wages on the cost of housing
An illustration is provided here of the potential impact of an increase in
labour costs on the cost of building a house.
We note that the labour cost component of the total cost of building a house
is considered to be around 33%.9
As a hypothetical scenario, consider an increase in wages of 10%.
An important initial consideration is whether any of that increase was
related to an increase in labour productivity. An increase in productivity
would allow the same output to be produced with fewer labour hours,
therefore reducing the impact of the increase in wages on labour costs to
the employer.
A second consideration is whether the employer may elect to reduce profit
margins, rather than pass the increased cost onto the customer.
If there was no increase in labour productivity and no change in profit
margins, then a 10% increase in labour costs would increase the cost of
building a house by 3.3%. This should be considered an upper bound of the
potential impact, since some of the increase in labour costs may reflect
changes in productivity or may be absorbed in profit margins.
We also note that there are a number of other costs such as site
development costs which would be additional to the total purchase price of
a new house.
In particular, the cost of land tends to be the major component of the final
purchase price of a house. Therefore, an increase in labour cost would have
a significantly smaller impact on the final purchase price of a house.
This is illustrated in Chart 5.3 which shows that established house prices in
Melbourne have increased much faster over the past 15 years than has the
price of house construction in Victoria.
9 This has been calculated based on a total house construction cost which does not include site development costs or the cost of land.

35
Chart 5.3: Established house price in Melbourne and price of house construction
in Victoria
Source: ABS Cat. No. 6427.0, ABS Cat. No. 6416.0, Deloitte Access Economics
0
50
100
150
200
250
300
350
2002 2005 2008 2011 2014 2017
Price of house construction Established house price index
Index, March 2002 = 100

36
References
Australian Bureau of Statistics 2017, 6427.0 - Producer Price Indexes,
Australia Dec 2016 (Feature Article: ABS Liaison – Residential
Construction).
Department of Employment 2016, Victoria individual occupational reports:
ANZSCO 3311-11 Bricklayer – VIC,
https://docs.employment.gov.au/system/files/doc/other/anzsco_3311-
11_bricklayer_-_vic_1.pdf (accessed 20 October 2017)
Department of Employment 2016, Victoria individual occupational reports:
ANZSCO 3312 Carpenters and Joiners - VIC,
https://docs.employment.gov.au/system/files/doc/other/anzsco_3312_carp
enters_and_joiners_-_vic_1.pdf (accessed 20 October 2017)
Department of Environment, Land, Water and Planning 2016, Victoria in
Future 2016
Department of Immigration and Border Protection 2017, Combined list of
eligible skilled occupations for subclasses 457 and 186,
http://www.border.gov.au/Trav/Work/Work/Skills-assessment-and-
assessing-authorities/skilled-occupations-lists/combined-stsol-mltssl
(accessed 1 November 2017)
Rawlinsons 2017, Australian Construction Handbook 2017
Rawlinsons 2014, Australian Construction Handbook 2014
Rawlinsons 2011, Australian Construction Handbook 2011
Rawlinsons 2007, Australian Construction Handbook 2007

37
Appendix A: Comparison of
population projections
A brief comparison of population projections produced by Deloitte Access
Economics and the Victorian Government’s Victoria in Future (2016) is
provided here.
Table A.1: Comparison of population projections
Deloitte Access Economics Victoria in Future (2016)
Year Population Change %Change Population Change %Change
Jun-16 6,179,249 146,281 2.4% 6,048,791 107,849 1.8%
Jun-17 6,319,470 140,221 2.3% 6,157,562 108,770 1.8%
Jun-18 6,448,697 129,227 2.0% 6,265,837 108,275 1.8%
Jun-19 6,572,591 123,894 1.9% 6,375,953 110,116 1.8%
Jun-20 6,689,162 116,571 1.8% 6,491,204 115,250 1.8%
Jun-21 6,802,359 113,198 1.7% 6,605,677 114,474 1.8%
Jun-22 6,911,783 109,424 1.6% 6,719,284 113,606 1.7%
Jun-23 7,019,373 107,590 1.6% 6,833,083 113,799 1.7%
Jun-24 7,123,589 104,215 1.5% 6,947,071 113,989 1.7%
Jun-25 7,224,878 101,289 1.4% 7,058,886 111,814 1.6%
Jun-26 7,323,055 98,177 1.4% 7,170,982 112,096 1.6%
Jun-27 7,420,466 97,411 1.3% 7,283,268 112,286 1.6%
Victoria in Future (2016) was based on population estimates as at 30 June
2015.
In contrast, Deloitte Access Economics’ population projections shown above
are based on the latest population data published by the ABS for March
2017. As such, there are significant differences in the early years of the

38
projection, with Victoria in Future (2016) underestimating the strength of
recent population growth in Victoria.
Deloitte Access Economics’ population projections assume that population
growth moderates slightly more than Victoria in Future (2016) towards the
end of the decade.
Overall, the two sets of population projections are similar when averaged
over the decade to June 2027. The average population change projected by
Deloitte Access Economics (110,100 per annum) is similar to that of Victoria
in Future (2016) (112,571 per annum).
The total change in Victoria’s population over the decade to June 2027 is
projected by Deloitte Access Economics to be 1,100,995 persons compared
with 1,125,706 persons as projected by Victoria in Future (2016).

39
Limitation of our work
General use restriction
This report is prepared solely for the internal use of Master Builders
Association of Victoria. This report is not intended to and should not be
used or relied upon by anyone else and we accept no duty of care to any
other person or entity. The report has been prepared for the purpose set
out in our engagement letter dated 17 October 2017. You should not refer
to or use our name or the advice for any other purpose

40
Deloitte Access Economics
ACN: 149 633 116
8 Brindabella Circuit
Brindabella Business Park
Canberra Airport ACT 2609
Tel: +61 2 6263 7000
Fax: +61 2 6263 7004
Deloitte Access Economics is Australia’s pre-eminent economics advisory practice and a member of Deloitte's global economics
group. For more information, please visit our website
www.deloitte.com/au/deloitte-access-economics
Deloitte refers to one or more of Deloitte Touche Tohmatsu Limited, a UK private company limited by guarantee, and its network
of member firms, each of which is a legally separate and independent entity. Please see www.deloitte.com/au/about for a
detailed description of the legal structure of Deloitte Touche Tohmatsu Limited and its member firms.
The entity named herein is a legally separate and independent entity. In providing this document, the author only acts in the
named capacity and does not act in any other capacity. Nothing in this document, nor any related attachments or
communications or services, have any capacity to bind any other entity under the ‘Deloitte’ network of member firms (including
those operating in Australia).
About Deloitte
Deloitte provides audit, tax, consulting, and financial advisory services to public and private clients spanning multiple industries.
With a globally connected network of member firms in more than 150 countries, Deloitte brings world-class capabilities and high-
quality service to clients, delivering the insights they need to address their most complex business challenges. Deloitte's
approximately 244,000 professionals are committed to becoming the standard of excellence.
About Deloitte Australia
In Australia, the member firm is the Australian partnership of Deloitte Touche Tohmatsu. As one of Australia’s leading
professional services firms. Deloitte Touche Tohmatsu and its affiliates provide audit, tax, consulting, and financial advisory
services through approximately 7,000 people across the country. Focused on the creation of value and growth, and known as an
employer of choice for innovative human resources programs, we are dedicated to helping our clients and our people excel. For
more information, please visit our web site at www.deloitte.com.au.
Liability limited by a scheme approved under Professional Standards Legislation.
Member of Deloitte Touche Tohmatsu Limited
© 2017 Deloitte Access Economics Pty Ltd