Embed Size (px)
Citation preview
HELSINKI UNIVERSITY OF TECHNOLOGY Faculty of Chemistry and Materials Sciences Degree Programme of Forest Products Technology
Juuso Rantanen
CONSTRUCTION OF A SINGLE BAR REFINER
Master’s Thesis for the degree of Master of Science in Technology submitted for inspection, Espoo, 22 December 2009.
Supervisor Professor Hannu Paulapuro
Instructor Eero Hiltunen, D.Sc. (Tech)
HELSINKI UNIVERSITY OF TECHNOLOGY Faculty of Chemistry and Materials SciencesDegree Programme: Forest Products Technology
ABSTRACT OF MASTER’S THESIS
Author Juuso Rantanen Title of Thesis
Construction of a Single Bar Refiner Abstract
The target of this thesis work was to construct a laboratory scale low-consistency refiner by modi-fying an existing design to enable more realistic refining conditions. The aim of the modification was to be able to study refining energy and forces affecting fibres more closely, particularly ena-bling the determination of bar coverage and pulp consistency in the gap by image analysis. The de-signing and construction of a pulp flow system for the refiner unit was also an important part of the thesis. Setup and testing of a system for imaging fibres in the refining gap was realized. The modification of the original design was made by designing a new stator bar with dimensions similar to the rotor bar. The purpose of this design was to create more realistic conditions during refining. This design was first tested with the original stator bar by machining it with a groove similar to the one in the rotor bar, and later constructing two additional bars to reach the desired smaller gap size. The pulp flow system was designed and constructed to enable even flow condi-tions for the refiner unit. The installing and setup of the laser illuminated imaging system was con-ducted to enable image capture of the refining phenomena. Some problems were encountered during the course of this work. The errors in measuring the original gap size resulted in wrong dimensioning of the new stator parts. For this reason some modifications had to be made afterwards to reach the targeted gap sizes. The pulp flow system was constructed without any major issues, but problems with the refiner unit clogging when operating with pulp consistencies > 2 % left some room for improvement. The imaging system installation and preliminary trials were successful, resulting in some good images from the gap between the rotor and stator bars. Images showed e.g. that bar coverage is clearly not 100 % at 2 % pulp consis-tency with 150 μm gap size, and that there is potential in developing the image analysis method aiming to determine bar coverage and pulp consistency in the gap. The target of the thesis to con-struct a research tool for refining studies was achieved.
Supervisor Instructor
Hannu Paulapuro Eero Hiltunen, D.Sc. (Tech) Chair Chair code
Paper Technology Puu-21 Pages Language 70 + 9 English Keywords Date
Refiner, construction, image analysis, pulp fi-bres
22 December 2009
TEKNILLINEN KORKEAKOULU Kemian ja materiaalitieteiden tiedekunta Koulutus-/tutkinto-ohjelma: Puunjalostustekniikka
DIPLOMITYÖN TIIVISTELMÄ
Tekijä Juuso Rantanen Diplomityön nimi Yksiteräjauhimen rakentaminen Tiivistelmä
Tämän diplomityön tavoitteena oli rakentaa laboratoriomittakaavan jauhin matalasakeusjauhatuk-sen ilmiöiden tutkimista varten muokkaamalla jo olemassa olevan jauhimen terärakennetta vas-taamaan todenmukaisemmin oikeita teräolosuhteita. Muokkauksen tavoite oli kyetä tutkimaan jau-hatusenergiaa ja kuituihin vaikuttavia voimia. Erityisesti tavoitteena oli mahdollistaa parametrien, kuten massan terävälisakeus ja terän peittävyys, määrittäminen kuva-analyysin avulla. Jauhimen massakierron suunnittelu ja rakentaminen, sekä kuvauslaitteiston asennus ja testaus olivat myös osa työtä. Alkuperäistä terärakennetta muokattiin siten, että staattoriterän dimensiot saatiin identtisiksi root-toriterän kanssa. Tämän rakenteen tavoitteena oli saada jauhatusolosuhteet vastaamaan enemmän todellisia jauhatusolosuhteita. Uutta rakennetta testattiin ensin koneistamalla vanha staattoriterä, ja myöhemmin suunnittelemalla kaksi uutta terää, jotta teräväli saatiin pienemmäksi ja näin vastaa-maan paremmin todellista jauhatustilannetta. Massakierron suunnittelun ja rakentamisen tavoittee-na oli luoda jauhimelle tasaiset virtausolosuhteet, ja laservalaistun kuvauslaitteiston asennuksen tarkoituksena oli mahdollistaa jauhatustapahtumien kuvaus terävälistä. Staattoriterien suunnittelussa ja valmistamisessa esiintyi joitakin ongelmia, erityisesti virhe alkupe-räisen terävälin mittaamisessa johti siihen, että uusien terien mitoitukseen tuli virhe. Tämä onnis-tuttiin kuitenkin korjaamaan pienillä muutoksilla terien rakenteeseen. Massakierron rakentamisessa ei esiintynyt suuria ongelmia, mutta sakeuden nostaminen yli 2 %:iin johti usein jauhimen tukkeu-tumiseen, joten sitä korkeampiin sakeuksiin ei toistaiseksi päästy. Kuvauslaitteiston asentaminen ja alustavat kokeet olivat menestyksekkäitä, ja tuloksena oli hyvälaatuisia kuvia terävälistä. Kuvista voitiin mm. päätellä, että terä ei peity kokonaisuudessaan massalla 2 % sakeudessa 150 μm terävä-lillä. Alustavien kokeiden perusteella kuva-analyysin kehittäminen massan sakeuden ja terän peit-tävyyden määrittämiseksi on mahdollista. Diplomityön tavoite toimivan jauhatustutkimuslaitteen rakentamiseksi saavutettiin.
Työn valvoja Työn ohjaaja
Hannu Paulapuro Eero Hiltunen, D.Sc. (Tech) Professuuri Koodi
Paperitekniikka Puu-21 Sivumäärä Kieli 70 + 9 englanti Avainsanat Päiväys
Jauhin, rakentaminen, kuva-analyysi, kuidut 22.12.2009

ACKNOWLEDGEMENTS
This thesis was done at TKK Paper and Printing Technology Group with the invaluable help of the staff. I am especially grateful to Timo Ylönen and everyone at the workshop for their assistance. I would also like to thank my instructor Eero Hiltunen for his professional guidance and help throughout the course of this thesis work. My thanks to Professor Hannu Paulapuro for giving me the opportunity to conduct my thesis in his research group, and to Professor Emeritus Richard Kerekes from the University of British Columbia for his expertise and ideas regarding this project. Special thanks to researcher Kaarlo Nieminen for the image analysis.
I am in greatest gratitude to my family and friends for all these years. Especially I would like to thank my parents Jukka and Anne for giving me support both mentally and finan-cially during my student years. Finally I want to express my thanks to my dear girlfriend Sara. Juuso Rantanen, Espoo, 22 December 2009.
TABLE OF CONTENTS
1 INTRODUCTION .......................................................................................... 5
2 HISTORY OF REFINING.............................................................................. 6
3 EQUIPMENT.................................................................................................. 8 3.1 Laboratory and pilot scale refiners.................................................................................8 3.2 Production scale refiners ..............................................................................................11 3.3 Refiner fillings .............................................................................................................14
4 EFFECTS OF REFINING ............................................................................ 17 4.1 Introduction..................................................................................................................17 4.2 Refining mechanism.....................................................................................................17 4.3 Refining effects on fibres .............................................................................................18
5 THEORIES OF REFINING.......................................................................... 21 5.1 Introduction..................................................................................................................21 5.2 Machine intensity based theories .................................................................................22 5.3 Fibre based intensities ..................................................................................................26 5.4 Conclusions about refining theories .............................................................................31
6 REFINING ENERGY AND FORCES ......................................................... 32 6.1 Force acting on pulp mass............................................................................................32 6.2 Forces acting on individual fibres ................................................................................32 6.3 Energy efficiency in refining........................................................................................34
7 CONCLUSIONS OF THE LITERATURE REVIEW.................................. 36
8 EXPERIMENTAL ........................................................................................ 37 8.1 Target ...........................................................................................................................37 8.2 Background ..................................................................................................................37 8.3 Modification of the stator bar.......................................................................................39 8.4 Pulp flow system design...............................................................................................43 8.5 Layout and components ...............................................................................................44 8.6 Imaging system ............................................................................................................49 8.7 Process description.......................................................................................................56
9 PRELIMINARY TRIALS AND RESULTS ................................................ 60 9.1 Pulp flow system and refiner testing ............................................................................60 9.2 Measuring the amount of pulp in the refiner gap .........................................................62 9.3 Imaging system testing.................................................................................................63 9.4 Image analysis..............................................................................................................65
10 RECOMMENDED NEXT STEPS ........................................................... 68
11 CONCLUSIONS....................................................................................... 69
LIST OF REFERENCES
APPENDICES
5
1 INTRODUCTION Beating or refining of chemical pulp has been used by papermakers to introduce
better papermaking quality for the final product. Untreated chemical pulp fibers
have low tendency of bonding and flexibility which may result in low paper
strength properties. Also the formation of sheets can be uneven due to high floc-
culation of pulp fibres /1/.
Refining of chemical pulp is one of the most researched areas in papermaking and
much progress has been already made. Despite this fact there still remain some
areas and phenomena that are not fully understood. Earlier studies have been fo-
cusing mostly on changes produced in pulp and their effect on paper quality, for
example internal and external fibrillation, fibre shortening and secondary fines
production /2, 3/. Refining energy and especially forces that eventually create
these changes have not been studied as thoroughly, hence the need for this project.
The target of this thesis was to construct a laboratory scale refiner for chemical
pulp (Single Bar Refiner, SBR) to study the refining forces and phenomena itself
more closely. The specific objective was to enable determination of fractional bar
coverage and pulp consistency in the gap. A first version of SBR was already built
as part of an earlier project in which TKK Paper and Printing technology group
had a significant contribution /4/. However, some changes on the design of the
SBR were proposed to get a better and more realistic understanding of the me-
chanics of chemical pulp refining.
The literature part of this thesis consists of two parts. The first part is a basic in-
troduction on low-consistency refining of chemical pulp; history, equipment, ef-
fects on fibres etc. The second part gives an understanding about the mechanics
and forces that take place between the refiner bars and within fibres. Different
theories of these phenomena will also be introduced in this part. The practical part
will include the design, construction and some preliminary trials with the Single
Bar Refiner.
6
2 HISTORY OF REFINING The term “beating” originates from early papermaking history when wet rag fibres
were manually beaten to disintegrate them and create bonding surfaces. Nowadays
papermakers still widely talk about beating instead of refining of chemical pulp
and the term is also found in modern literature. The first mechanical refining de-
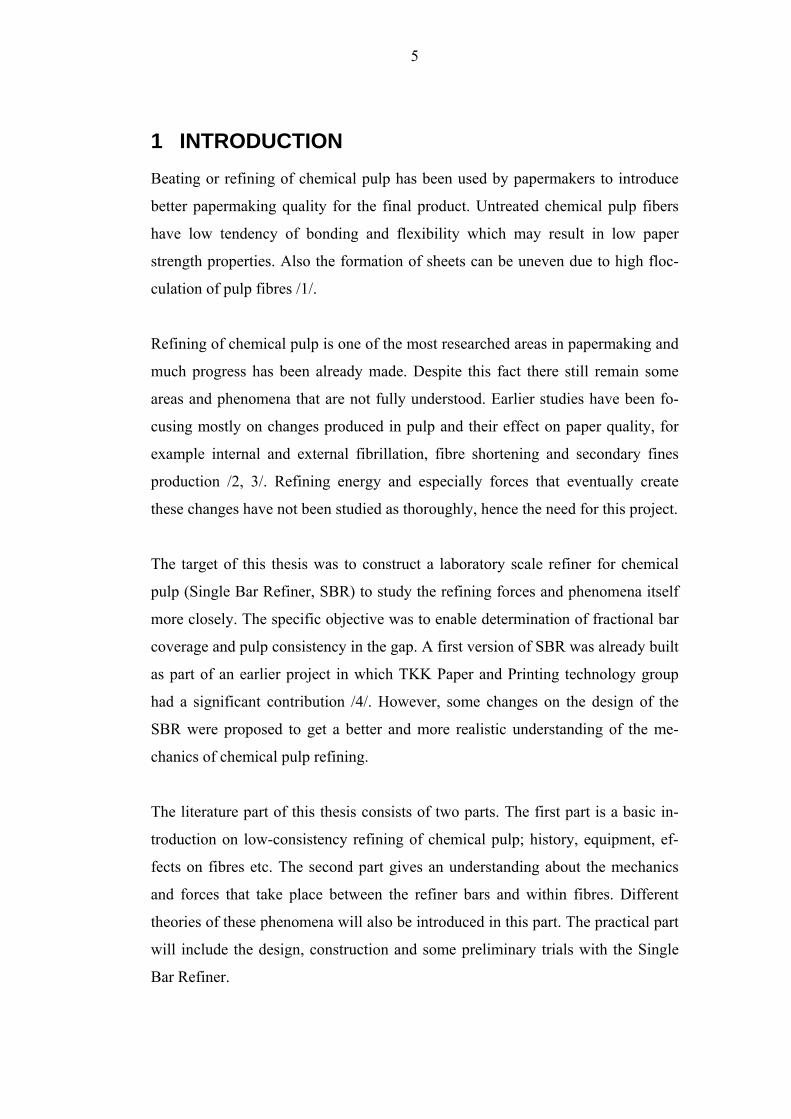
vices were introduced during the 13th century in Italy where the stamping or
hammer mills were invented (Figure 1). A battery of heavy pestles fitted with me-
tallic surfaces was operated by a shaft that took its energy usually from a water-
wheel. Rags were disintegrated to shorter fibres to better suite papermaking de-
mands.
Figure 1. Hammer mills used to prepare fibres for papermaking /1/.
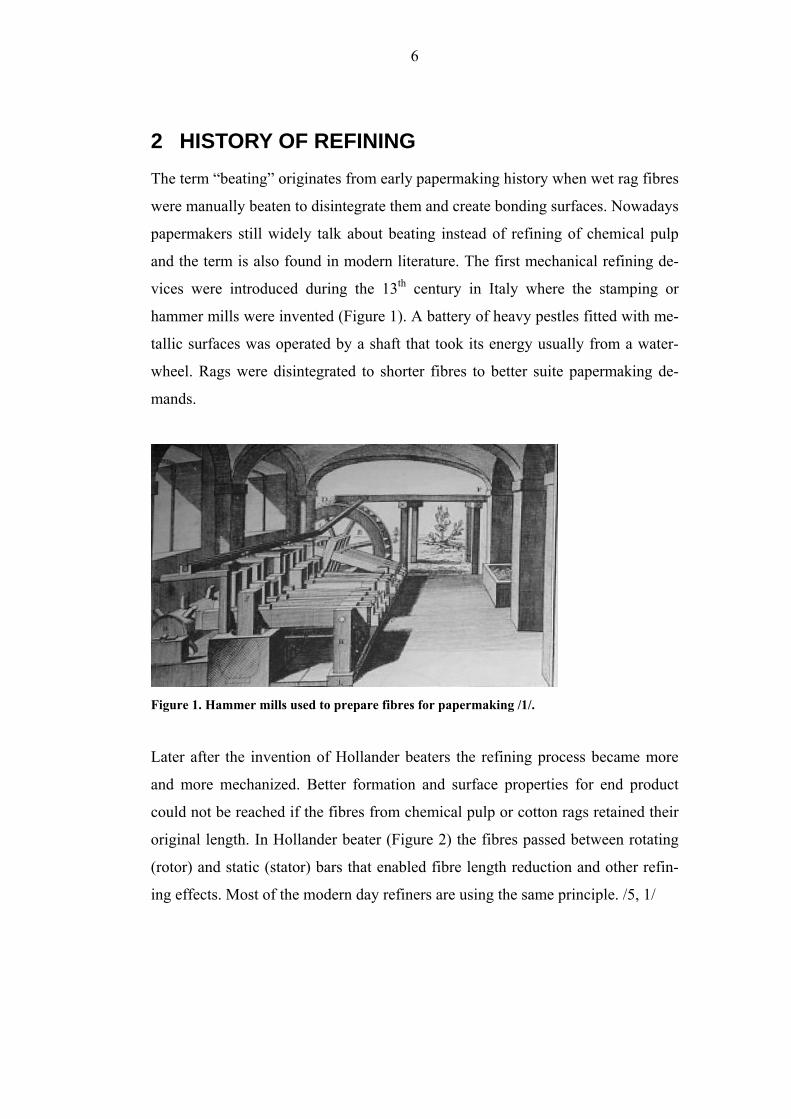
Later after the invention of Hollander beaters the refining process became more
and more mechanized. Better formation and surface properties for end product
could not be reached if the fibres from chemical pulp or cotton rags retained their
original length. In Hollander beater (Figure 2) the fibres passed between rotating
(rotor) and static (stator) bars that enabled fibre length reduction and other refin-
ing effects. Most of the modern day refiners are using the same principle. /5, 1/
7
Figure 2. An early 20th century Hollander (left) with its rotor and stator bars (right) /6/.
8
3 EQUIPMENT
3.1 Laboratory and pilot scale refiners
3.1.1 Valley beater
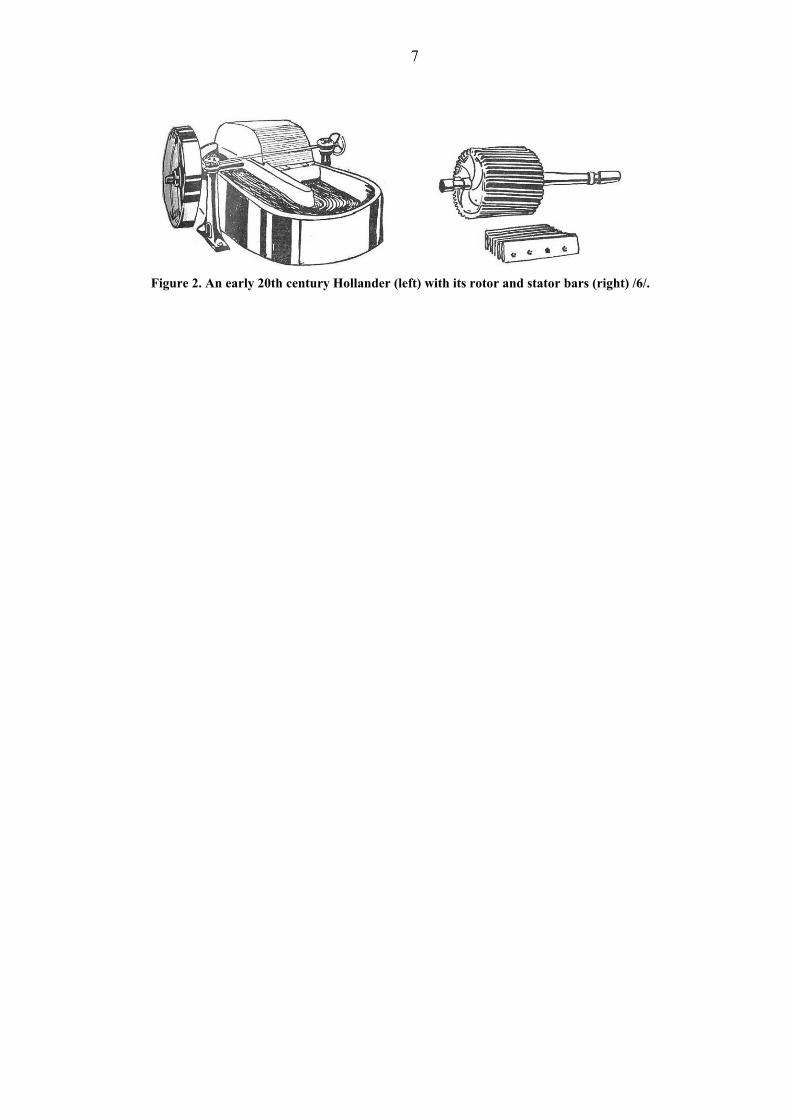
Many of the laboratory scale refiners are based on similar construction as the his-
torical Hollander beater. This is due to its simple and cost-effective design, ade-
quate capacity for laboratory work and reliability. Perhaps the most commonly
used laboratory refiner in studying basic refining phenomena is the Valley beater,
also known as the Hollander beater illustrated in Figure 3. It has a rotating cylin-
der (rotor) with bars and 2-3 bar equipped counter bed plates as a stator. Hol-
lander beaters are batch refiners. They are quite energy intensive but they produce
a gentle and homogeneous refining result. The fact that both refining energy and
refining intensity can be independently controlled is also an advantage.
Figure 3. A schematic illustration of a Hollander beater /7/.
3.1.2 PFI-mill
The PFI-mill has become a popular laboratory refiner due to the small pulp vol-
umes that can be used. Also the versatility of rotational direction and shear rate

9
are advantages. It operates in high energy and low intensity mode due to the high
consistency of pulp, high shear ratio and compression forces. The refining action
is created by a rotor revolving against the chamber walls. This mechanism inflicts
compression and shear forces on the fibres. The working principle of the PFI-mill
generates continuous fibre network redistribution which together with high pulp
consistency gives a high specific energy. /8/
3.1.3 Escher-Wyss conical laboratory refiner
One of the first conical refiners that enabled laboratory refining under controlled
conditions was the Escher-Wyss conical laboratory refiner, shown in Figure 4. It
was developed in the 1950’s specifically for laboratory purposes and later modifi-
cations have been introduced to improve the process control.
Figure 4. The Escher-Wyss conical laboratory refiner /1/.
Recent versions of the refiner can measure the refining intensity as well as calcu-
late the specific energy based on pulp flow and power consumption. Pulp flow is
controlled both by impellers at the inlet and outlet of the refiner as well as by
pumping action of the fillings. Sampling is made through a specific valve that was
designed to prevent settling of the pulp fibres. With conditioned fillings, the refin-
ing results are highly reproducible for a certain pulp type.
10
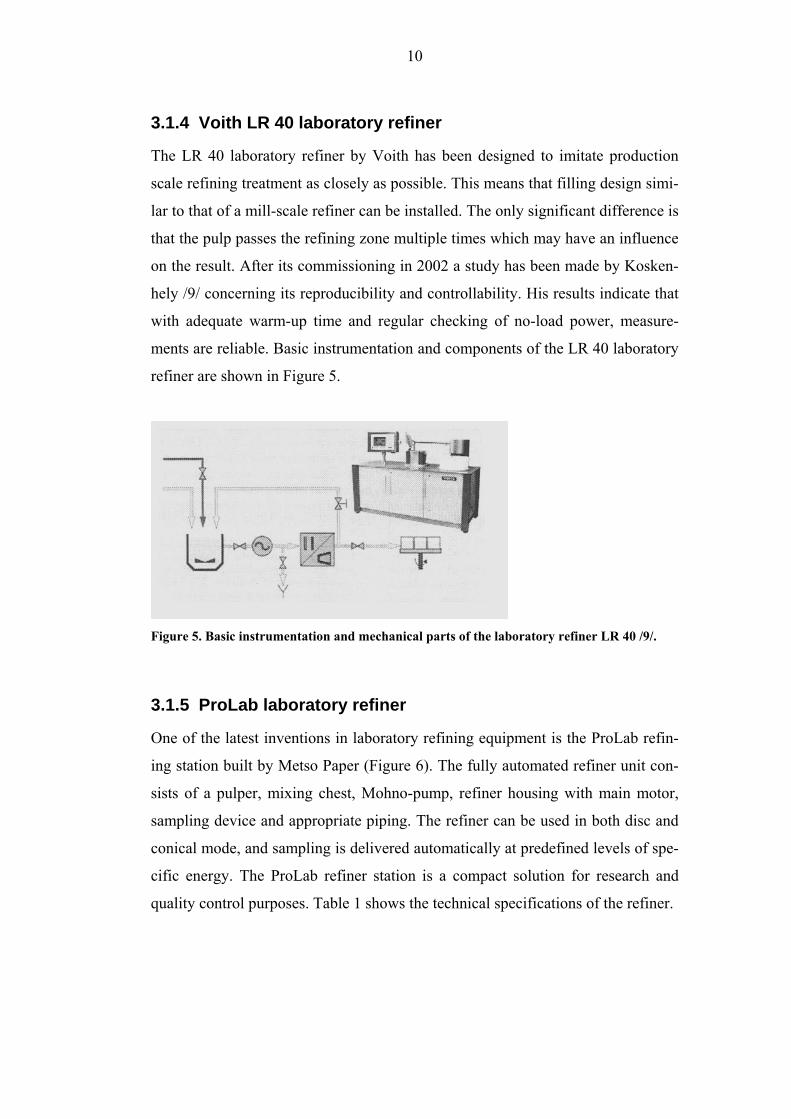
3.1.4 Voith LR 40 laboratory refiner
The LR 40 laboratory refiner by Voith has been designed to imitate production
scale refining treatment as closely as possible. This means that filling design simi-
lar to that of a mill-scale refiner can be installed. The only significant difference is
that the pulp passes the refining zone multiple times which may have an influence
on the result. After its commissioning in 2002 a study has been made by Kosken-
hely /9/ concerning its reproducibility and controllability. His results indicate that
with adequate warm-up time and regular checking of no-load power, measure-
ments are reliable. Basic instrumentation and components of the LR 40 laboratory
refiner are shown in Figure 5.
Figure 5. Basic instrumentation and mechanical parts of the laboratory refiner LR 40 /9/.
3.1.5 ProLab laboratory refiner
One of the latest inventions in laboratory refining equipment is the ProLab refin-
ing station built by Metso Paper (Figure 6). The fully automated refiner unit con-
sists of a pulper, mixing chest, Mohno-pump, refiner housing with main motor,
sampling device and appropriate piping. The refiner can be used in both disc and
conical mode, and sampling is delivered automatically at predefined levels of spe-
cific energy. The ProLab refiner station is a compact solution for research and
quality control purposes. Table 1 shows the technical specifications of the refiner.

11
Figure 6. The ProLab laboratory refining station /1/.
Table 1. Technical specifications of the ProLab laboratory refiner /10/.
3.2 Production scale refiners
3.2.1 Introduction
Conical and disc refiners are most commonly used in mill-scale refining of chemi-
cal pulp. In both configurations pulp is fed via inlet through the refining zone and
to the outlet. Refiners can have either one or two refiner zones depending on
whether there are multiple stator elements. Both of these types are believed to
12
generate similar refining effects and they are usually controlled by the same
methods. /9/
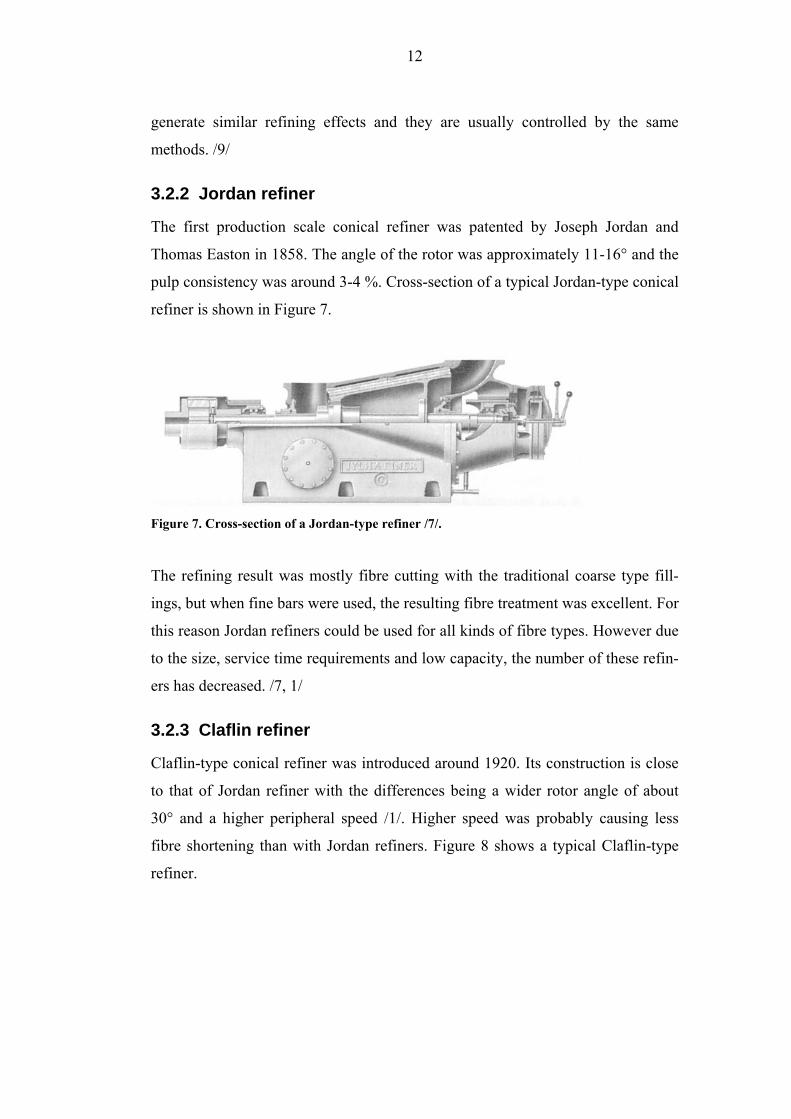
3.2.2 Jordan refiner
The first production scale conical refiner was patented by Joseph Jordan and
Thomas Easton in 1858. The angle of the rotor was approximately 11-16° and the
pulp consistency was around 3-4 %. Cross-section of a typical Jordan-type conical
refiner is shown in Figure 7.
Figure 7. Cross-section of a Jordan-type refiner /7/.
The refining result was mostly fibre cutting with the traditional coarse type fill-
ings, but when fine bars were used, the resulting fibre treatment was excellent. For
this reason Jordan refiners could be used for all kinds of fibre types. However due
to the size, service time requirements and low capacity, the number of these refin-
ers has decreased. /7, 1/
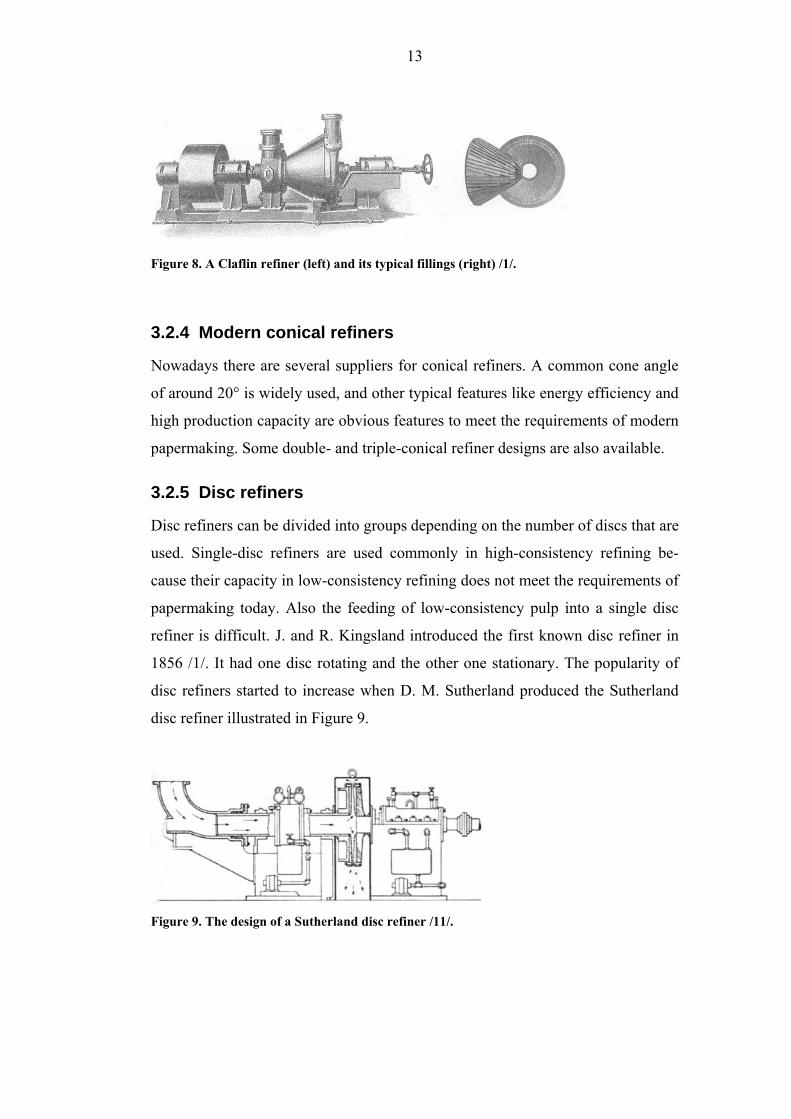
3.2.3 Claflin refiner
Claflin-type conical refiner was introduced around 1920. Its construction is close
to that of Jordan refiner with the differences being a wider rotor angle of about
30° and a higher peripheral speed /1/. Higher speed was probably causing less
fibre shortening than with Jordan refiners. Figure 8 shows a typical Claflin-type
refiner.
13
Figure 8. A Claflin refiner (left) and its typical fillings (right) /1/.
3.2.4 Modern conical refiners
Nowadays there are several suppliers for conical refiners. A common cone angle
of around 20° is widely used, and other typical features like energy efficiency and
high production capacity are obvious features to meet the requirements of modern
papermaking. Some double- and triple-conical refiner designs are also available.
3.2.5 Disc refiners
Disc refiners can be divided into groups depending on the number of discs that are
used. Single-disc refiners are used commonly in high-consistency refining be-
cause their capacity in low-consistency refining does not meet the requirements of
papermaking today. Also the feeding of low-consistency pulp into a single disc
refiner is difficult. J. and R. Kingsland introduced the first known disc refiner in
1856 /1/. It had one disc rotating and the other one stationary. The popularity of
disc refiners started to increase when D. M. Sutherland produced the Sutherland
disc refiner illustrated in Figure 9.
Figure 9. The design of a Sutherland disc refiner /11/.
14
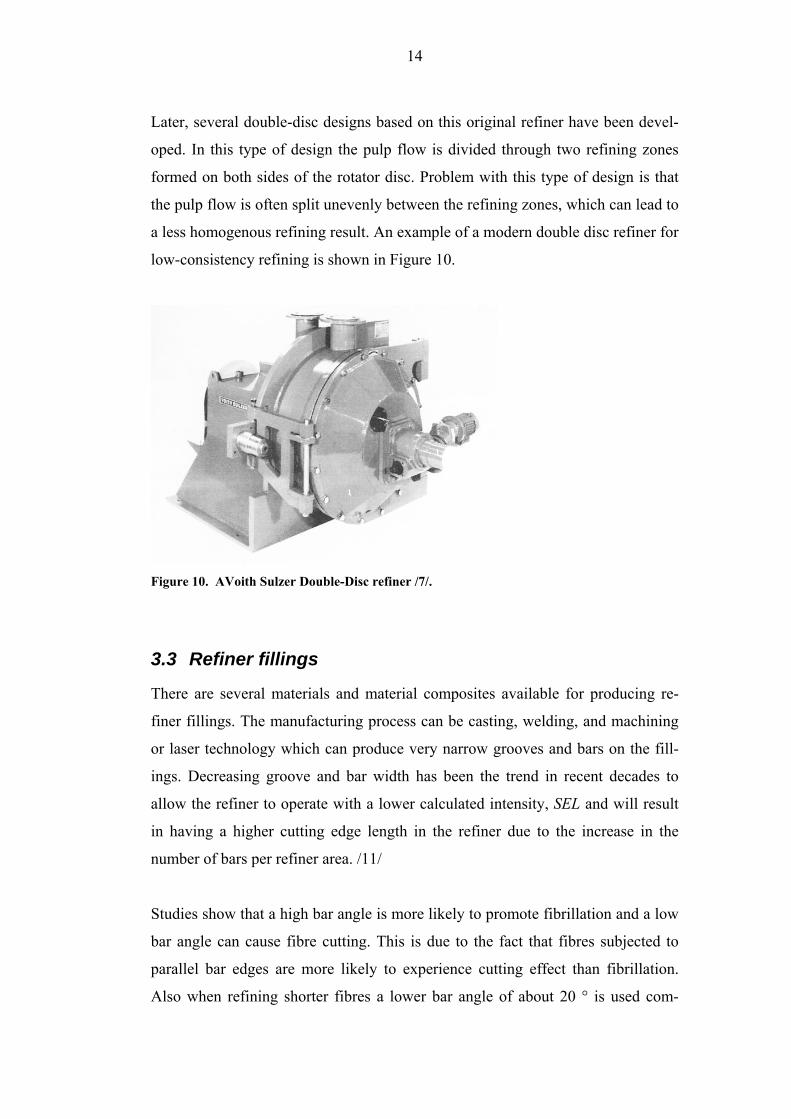
Later, several double-disc designs based on this original refiner have been devel-
oped. In this type of design the pulp flow is divided through two refining zones
formed on both sides of the rotator disc. Problem with this type of design is that
the pulp flow is often split unevenly between the refining zones, which can lead to
a less homogenous refining result. An example of a modern double disc refiner for
low-consistency refining is shown in Figure 10.
Figure 10. AVoith Sulzer Double-Disc refiner /7/.
3.3 Refiner fillings
There are several materials and material composites available for producing re-
finer fillings. The manufacturing process can be casting, welding, and machining
or laser technology which can produce very narrow grooves and bars on the fill-
ings. Decreasing groove and bar width has been the trend in recent decades to
allow the refiner to operate with a lower calculated intensity, SEL and will result
in having a higher cutting edge length in the refiner due to the increase in the
number of bars per refiner area. /11/
Studies show that a high bar angle is more likely to promote fibrillation and a low
bar angle can cause fibre cutting. This is due to the fact that fibres subjected to
parallel bar edges are more likely to experience cutting effect than fibrillation.
Also when refining shorter fibres a lower bar angle of about 20 ° is used com-
15
pared to a bar angle of about 35 ° when refining longer fibres. These angles allow
the refiner to rotate in both pumping direction and non-pumping direction. /12, 11/
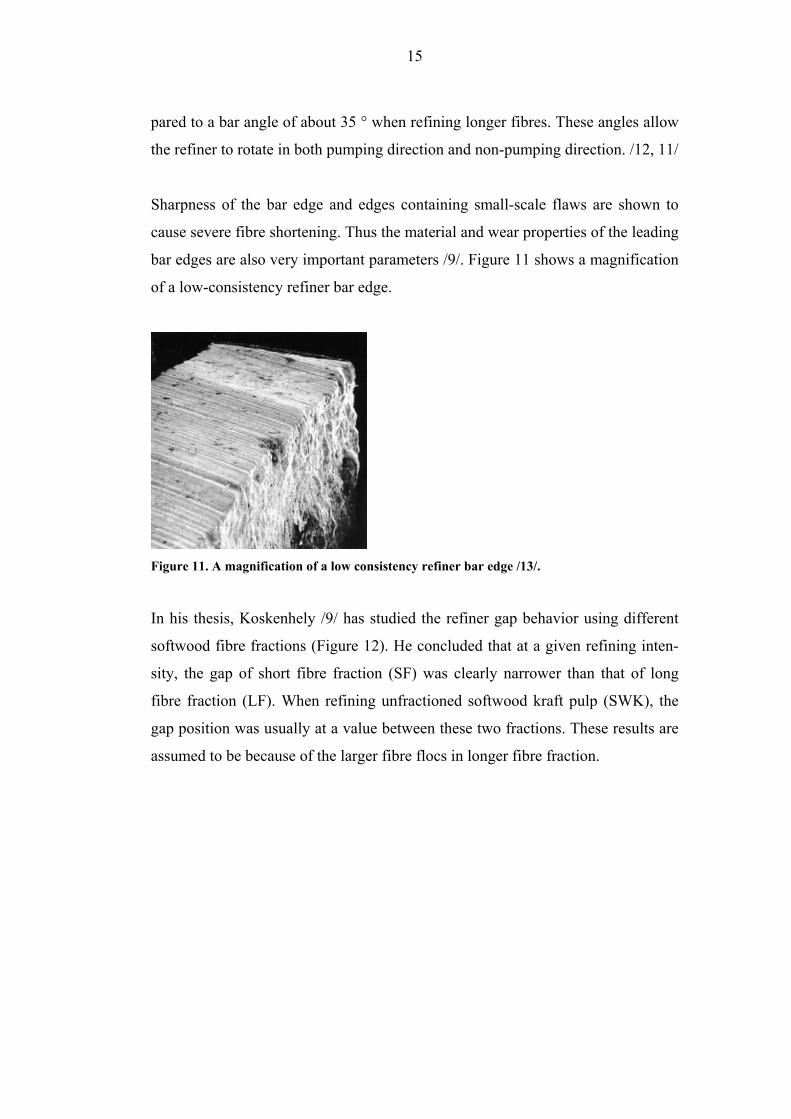
Sharpness of the bar edge and edges containing small-scale flaws are shown to
cause severe fibre shortening. Thus the material and wear properties of the leading
bar edges are also very important parameters /9/. Figure 11 shows a magnification
of a low-consistency refiner bar edge.
Figure 11. A magnification of a low consistency refiner bar edge /13/.
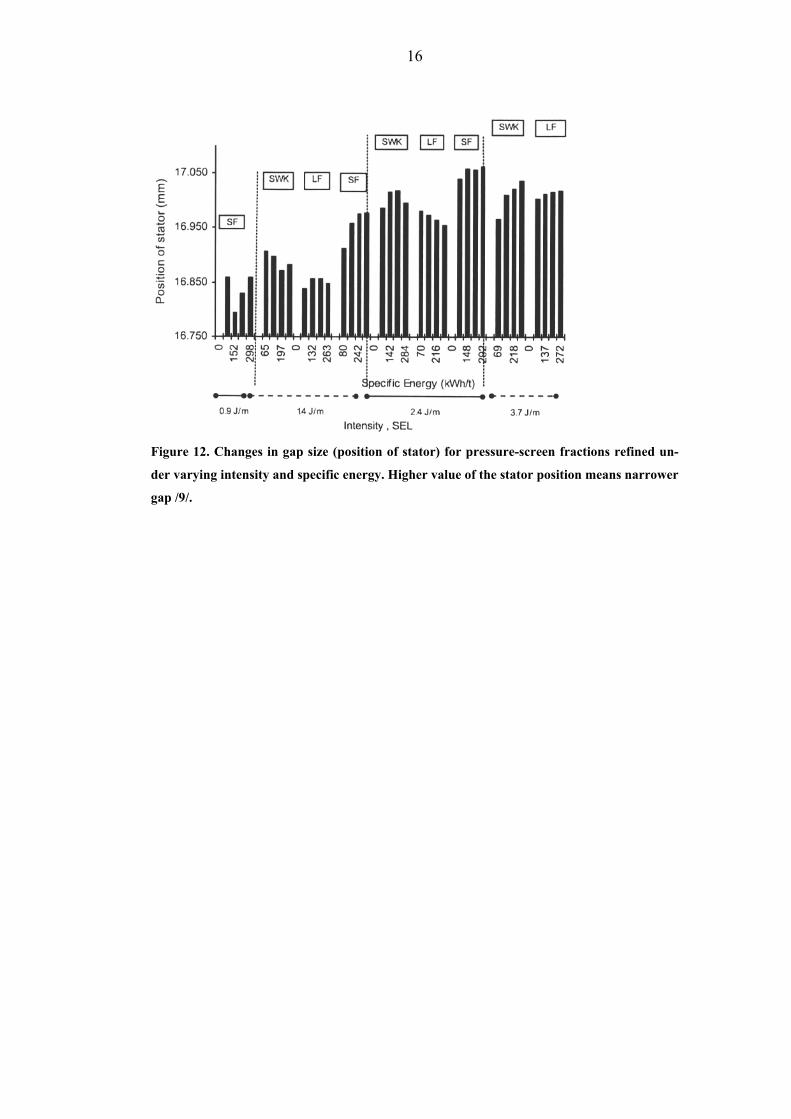
In his thesis, Koskenhely /9/ has studied the refiner gap behavior using different
softwood fibre fractions (Figure 12). He concluded that at a given refining inten-
sity, the gap of short fibre fraction (SF) was clearly narrower than that of long
fibre fraction (LF). When refining unfractioned softwood kraft pulp (SWK), the
gap position was usually at a value between these two fractions. These results are
assumed to be because of the larger fibre flocs in longer fibre fraction.
16
Figure 12. Changes in gap size (position of stator) for pressure-screen fractions refined un-
der varying intensity and specific energy. Higher value of the stator position means narrower
gap /9/.
17
4 EFFECTS OF REFINING
4.1 Introduction
If paper is made entirely from unrefined chemical pulp, it will have poor strength
properties and formation because of very low fibre-bonding potential. In chemical
pulp refining, fibre properties are modified by mechanical treatment in such way
that fibre bonding is improved and good formation is achieved for the end prod-
uct. Refining is sometimes used also to develop other paper properties such as
optical properties and porosity.
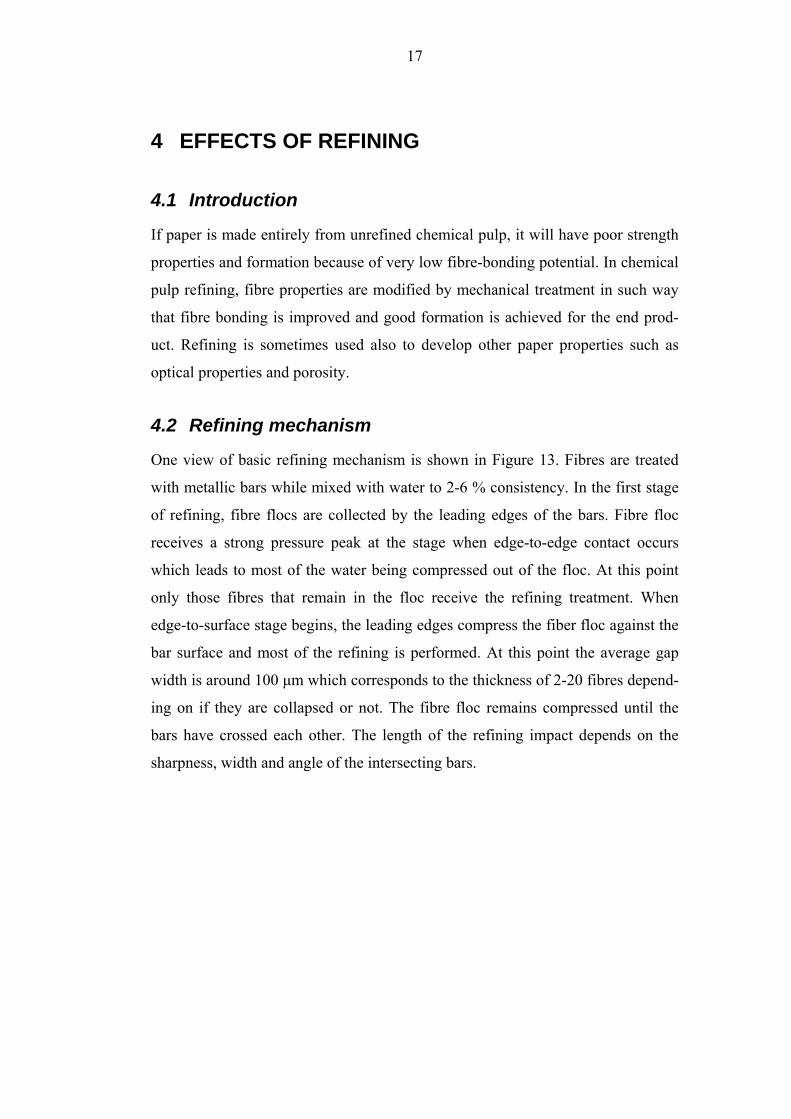
4.2 Refining mechanism
One view of basic refining mechanism is shown in Figure 13. Fibres are treated
with metallic bars while mixed with water to 2-6 % consistency. In the first stage
of refining, fibre flocs are collected by the leading edges of the bars. Fibre floc
receives a strong pressure peak at the stage when edge-to-edge contact occurs
which leads to most of the water being compressed out of the floc. At this point
only those fibres that remain in the floc receive the refining treatment. When
edge-to-surface stage begins, the leading edges compress the fiber floc against the
bar surface and most of the refining is performed. At this point the average gap
width is around 100 μm which corresponds to the thickness of 2-20 fibres depend-
ing on if they are collapsed or not. The fibre floc remains compressed until the
bars have crossed each other. The length of the refining impact depends on the
sharpness, width and angle of the intersecting bars.
18
Figure 13. One view of refining mechanism of chemical pulp fibres /7/.
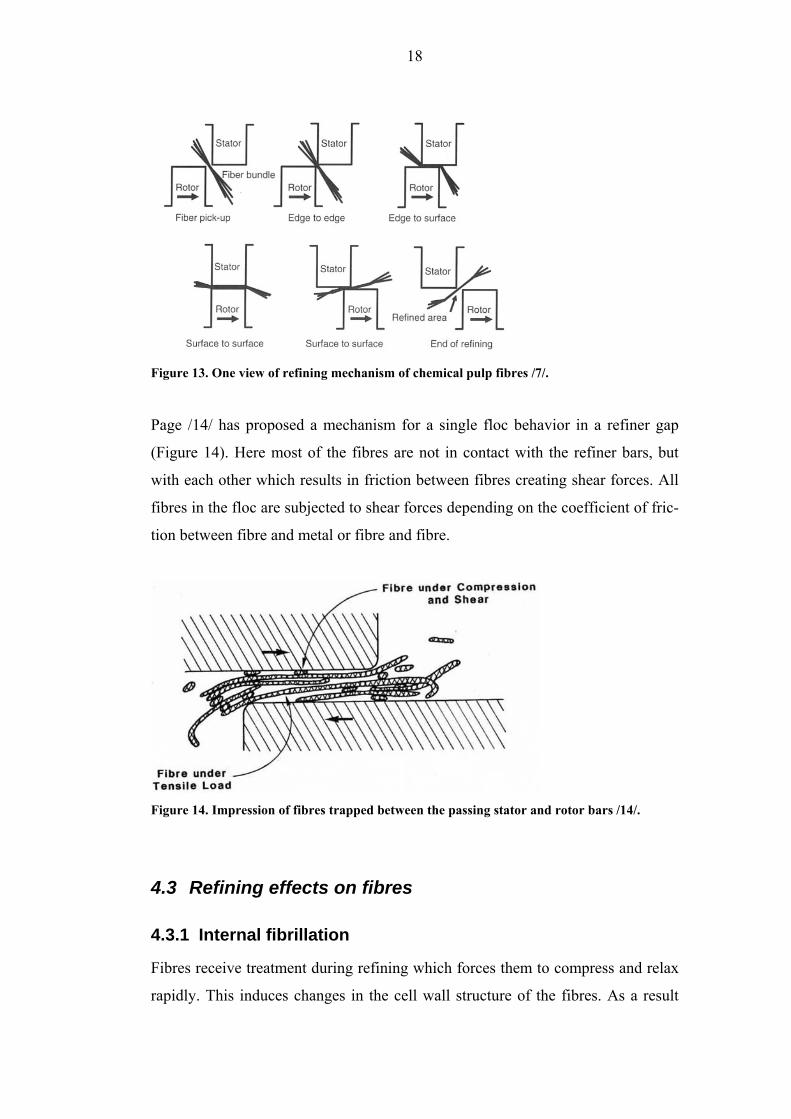
Page /14/ has proposed a mechanism for a single floc behavior in a refiner gap
(Figure 14). Here most of the fibres are not in contact with the refiner bars, but
with each other which results in friction between fibres creating shear forces. All
fibres in the floc are subjected to shear forces depending on the coefficient of fric-
tion between fibre and metal or fibre and fibre.
Figure 14. Impression of fibres trapped between the passing stator and rotor bars /14/.
4.3 Refining effects on fibres
4.3.1 Internal fibrillation
Fibres receive treatment during refining which forces them to compress and relax
rapidly. This induces changes in the cell wall structure of the fibres. As a result

19
water is able to penetrate the cell wall structure and replace the internal bonds
causing swelling of the celluloses and hemicelluloses. As a consequence, swelling
degree, flexibility and conformability of fibres increase which leads to improved
inter-fibre bonding and strength properties of paper /15, 14/.
4.3.2 External fibrillation
The most visible refining effect is the external fibrillation of fibres. This can be
seen as fibrils and parts of cell wall on the surface of the fibre under microscope,
as illustrated in Figure 15. External fibrillation improves the consolidation of the
sheet and bonding between fibres due to the swollen celluloses and hemicelluloses
that are covering the bundles of microfibrils /15/.
Figure 15. Lightly refined summerwood fibre showing sheaths and fibrils on surface. Magni-
fication 100x /16/.
4.3.3 Production of fines
By definition, fines fraction is the part of the pulp that passes through the 200
mesh wire of a Bauer-McNett fractionator. Fines of the chemical pulp can be di-
vided into primary and secondary fines. Primary fines are produced during pulp
cooking and they consist of ray cells, parenchyma cells, bark residues and fibre
fragments. The secondary fines form during the refining stage due to abrasion of
fibre against each others or against refiner bars. They consist of primary wall frag-
20
ments, fibrils and microfibrils /17/. The primary fines content is usually below 2
%, but after heavy refining the secondary fines content can be much higher.
4.3.4 Fibre cutting and shortening
Fibre cutting and shortening are caused by the breaking of covalent bonds of the
fibres. When refiner bars pass each other, the mechanical shear results to cutting
and shortening of the fibres. This cutting effect is more likely to happen during
early stages of the refining process when the fibres have not yet developed flexi-
bility and increased capacity to distribute the energy /12/. Studies have also shown
that lower refiner peripheral speed is likely to increase fibre shortening /1/.
4.3.5 Fibre straightening
Recent studies have indicated that the straightening of the fibres should be also
considered as a main effect of chemical pulp refining. Especially in the beginning
of low-intensity refining the average fibre length appears to increase because of
fibre straightening /18, 2/.
21
5 THEORIES OF REFINING
5.1 Introduction
Many theories of the chemical pulp refining have been developed to determine the
most suitable refining strategy. Jagenberg was the first scientist back in as early as
1887 to introduce such terms as “edge length per second” and “beating area” /19/.
These are still used as a basis for further research. After that a number of more or
less scientific theories have been developed. This part of the study will introduce
most commonly accepted and some further developed theories.
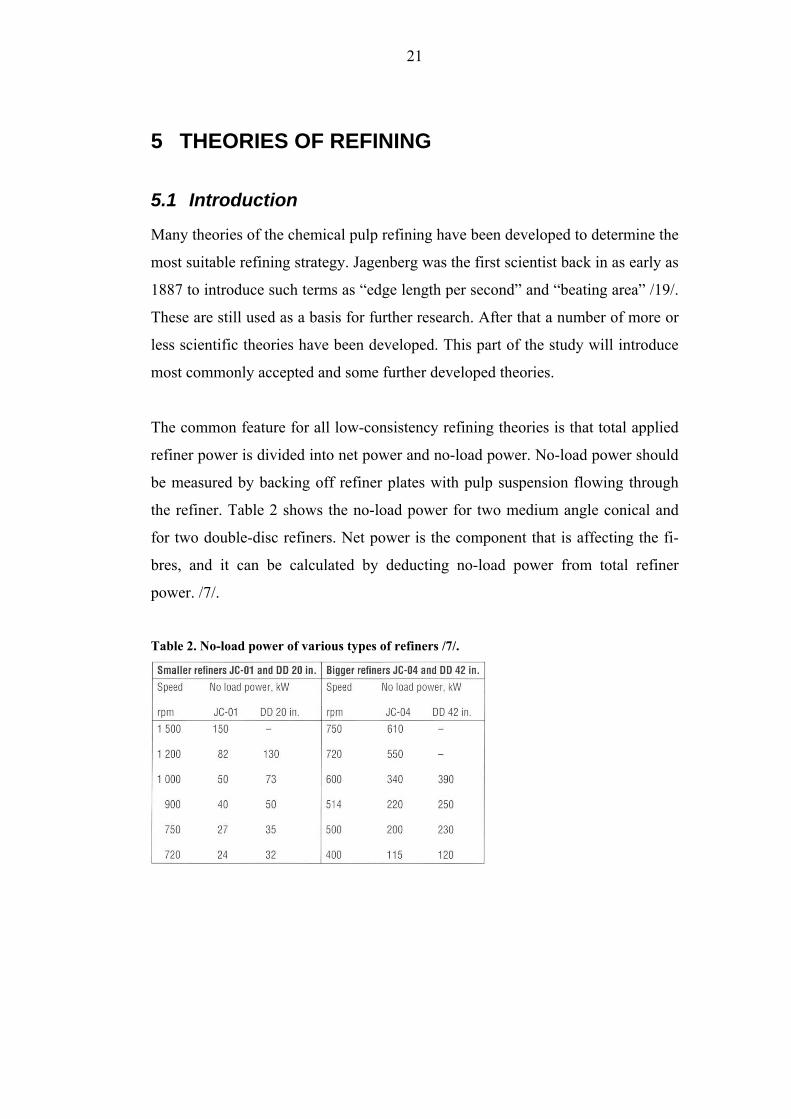
The common feature for all low-consistency refining theories is that total applied
refiner power is divided into net power and no-load power. No-load power should
be measured by backing off refiner plates with pulp suspension flowing through
the refiner. Table 2 shows the no-load power for two medium angle conical and
for two double-disc refiners. Net power is the component that is affecting the fi-
bres, and it can be calculated by deducting no-load power from total refiner
power. /7/.
Table 2. No-load power of various types of refiners /7/.

22
5.2 Machine intensity based theories
5.2.1 Introduction
Machine intensity based theories take only machine parameters into account. This
means that any fibre or pulp related properties are ignored.
5.2.2 Specific edge load
Brecht /20/ has formulated today’s concept of specific refining energy in low-
consistency refining as follows:
( )⋅
⋅
−=
Vc
PPSRE
F
tot 0
(1)
This can also be converted to total refining energy:
⋅
⋅=
Vc
PTRE
F
tot
, (2)
where
Ptot is total refining power
P0 no-load power
cf pulp consistency ⋅
V volume flow.
Wultsch and Flucher /21/ introduced their refining theory in 1958. They used the
number of rotor and stator bars and net refining power per crossing speed to cal-
culate bar treatment intensity. Brecht and Siewert /22/ further developed this the-
ory by demonstrating the dominant impact of the bar edge. This led to the cur-
rently used formula of specific edge load:
23
)/(0 mJlzzn
PPSEL
sr
tot−
⋅⋅⋅
−=
, (3)
where
n is rotational speed of rotor
zr number of rotor bars
zs number of stator bars −
l average bar length.
Because the specific edge load theory does not take into account the net energy
received by fibres, it has its limitations. However it is widely used because of its
simplicity.
5.2.3 Modified edge load
Meltzer /23/ has recently modified the specific edge load theory by taking also the
width of the bar and groove along with the average intersecting angle into ac-
count:
b
gb
www
SELMEL+
⋅⋅
⋅=αtan2
1
, (4)
where
wb is width of the bar
wg width of the groove
α bar angle.
5.2.4 Reference specific edge load
Roux /24/ has proposed a new formula for calculating specific edge load because
it was seen empirically that original theory does not take into account fillings’
geometrical parameter effects on fibre shortening. His version of SEL accounts
for the geometrical parameters such as sum of grinding angles, sector angle and
configuration of bars. Reference specific edge load is calculated:

24
( )( )( ) 2
23
,,,,0
123
rP
kwwww
C netrgrbsgsbS ⋅
−
++=
πω , (5)
where
wb,s is width of stator bar
wg,s width of stator groove
wb,r width of rotor bar
wg,r width of rotor groove
ω bar peripheral speed
r2 external rotor radius
k ratio of internal and external rotor radius (r1/r2)
An expression for the normal compressive force Fn subjected onto the fibres be-
tween passing bars is formulated:
( )θβα ++=− sin
0
fC
n
F Sn
, (6)
where −
n is mean number of bar crossing areas
α stator bar angle
β rotor bar angle
θ sector angle.
5.2.5 Specific surface load
Specific surface load theory (SSL) was introduced by Lumiainen in 1990 /25/. He
assumed that the energy is transferred to the fibre bundles also in edge-to-surface
contact as well as in edge-to-edge contact. The SSL accounts for energy expendi-
ture over bar width and is in fact an extension of the SEL theory with the value of
the bar width included.
25
According to his concept, the refining action is described by the number, intensity
and duration of the refining impacts. Specific surface load theory assumes that
specific refining energy is a product of impact number and impact energy:
IEINSRE ⋅= (kWh/t). (7)
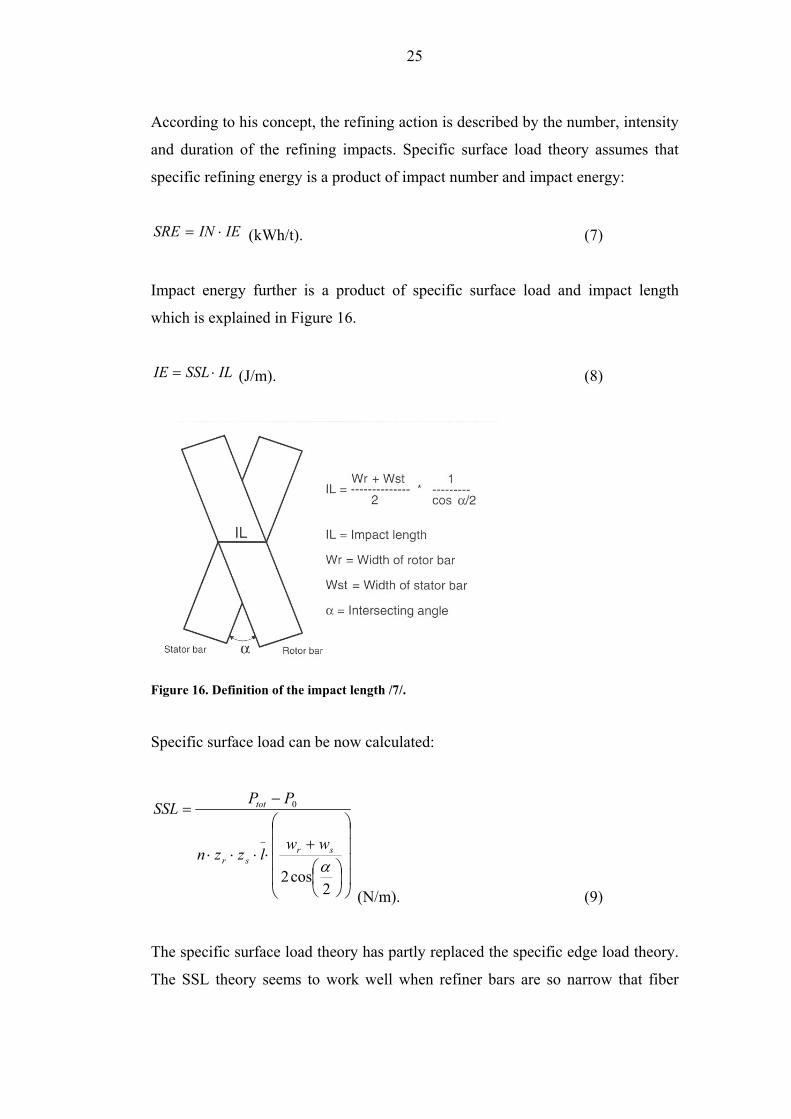
Impact energy further is a product of specific surface load and impact length
which is explained in Figure 16.
ILSSLIE ⋅= (J/m). (8)
Figure 16. Definition of the impact length /7/.
Specific surface load can be now calculated:
⎟⎟⎟⎟
⎠
⎞
⎜⎜⎜⎜
⎝
⎛
⎟⎠⎞
⎜⎝⎛+
⋅⋅⋅⋅
−=
−
2cos2
0
αsr
sr
tot
wwlzzn
PPSSL
(N/m). (9)
The specific surface load theory has partly replaced the specific edge load theory.
The SSL theory seems to work well when refiner bars are so narrow that fiber

26
flocs cover the whole width of bar surface when receiving refining impact. On the
other hand the specific edge load theory introduced earlier works better with
coarse fillings when bars are wider than fibre flocs. Both of the theories have their
limitations but they offer practical tools for selecting fillings and adjusting refin-
ing parameters. /7/
5.2.6 Modified specific surface load
The modified specific surface load theory (MSSL) was introduced by Musselman
et al. /26/ in 1997. His theory is derived from modified specific edge load theory
assuming that the stator bar width wb,s does not have as significant contribution on
the intensity of refining as the rotor bar width wb,r. This is due to the fact that the
rotor was assumed to account for the transportation of fibres onto the stator bars.
MSSL is calculated:
⎥⎥⎥⎥
⎦
⎤
⎢⎢⎢⎢
⎣
⎡
⎟⎠⎞
⎜⎝⎛
⋅⋅⋅
−=
−
2cos
,
0
αrb
sr
tot
wlzzn
PPMSSL
(J/m²). (10)
5.3 Fibre based intensities
5.3.1 Introduction
In addition to the machine parameters, fibre based intensities include also more or
less fibre and pulp properties. This leads to a more accurate but also more com-
plex theories of the refining phenomenon.
5.3.2 Floc hypothesis
In 1990, Hietanen and Ebeling /27/ proposed a new theory for the mechanics of
chemical pulp refining. The role of fibre flocs in refining has been under discus-
sion since 1920’s and after that various authors have dealt with this phenomenon.
27
Floc hypothesis theory is based on the assumption that in low consistency refining
(2-6 %), fibres are refined as flocs instead of independently receiving treatment.
Flocs are continuously formed and broken up under the shear forces in the refin-
ing zone and grooves. Excessive refiner energy is consumed in maintaining turbu-
lent conditions when flocs are transported through the refining zones without un-
dergoing any refining treatment.
The thickness of individual flocs in low consistency refining is normally 1-5 mm.
They are relatively large compared to the size of the refiner gap, which is usually
50-150 μm. For this obvious reason the probability that flocs will be driven into
the gap is low resulting in much larger volume of pulp flow being driven through
rotor and stator grooves than through the gap. This gives a heterogeneous refining
result where some fibres have lost their shape completely because of the harsh
treatment while some fibres do not show any structural changes at all.
Floc hypothesis theory introduces a modern approach for increasing refining effi-
ciency and homogeneity. Designing the refiner zone so that all or most of the fi-
bres entering it undergo treatment would enable more homogeneous refining re-
sult. The volume of the refining zone should also be minimized to enable the re-
fining work to be concentrated on a small fluid volume. This gives the fibres a
possibility to receive a more energy efficient and homogeneous treatment.
Laboratory scale tests have been made with a small disc refiner that was built
based on the concept of floc hypothesis theory, and the results are promising.
However at this time no production scale refiner has been developed based on this
theory.
5.3.3 Frequency and intensity
Lewis and Danforth /28/ attempted to describe the refining process with two inde-
pendent expressions. The number of impacts describes the amount of treatment
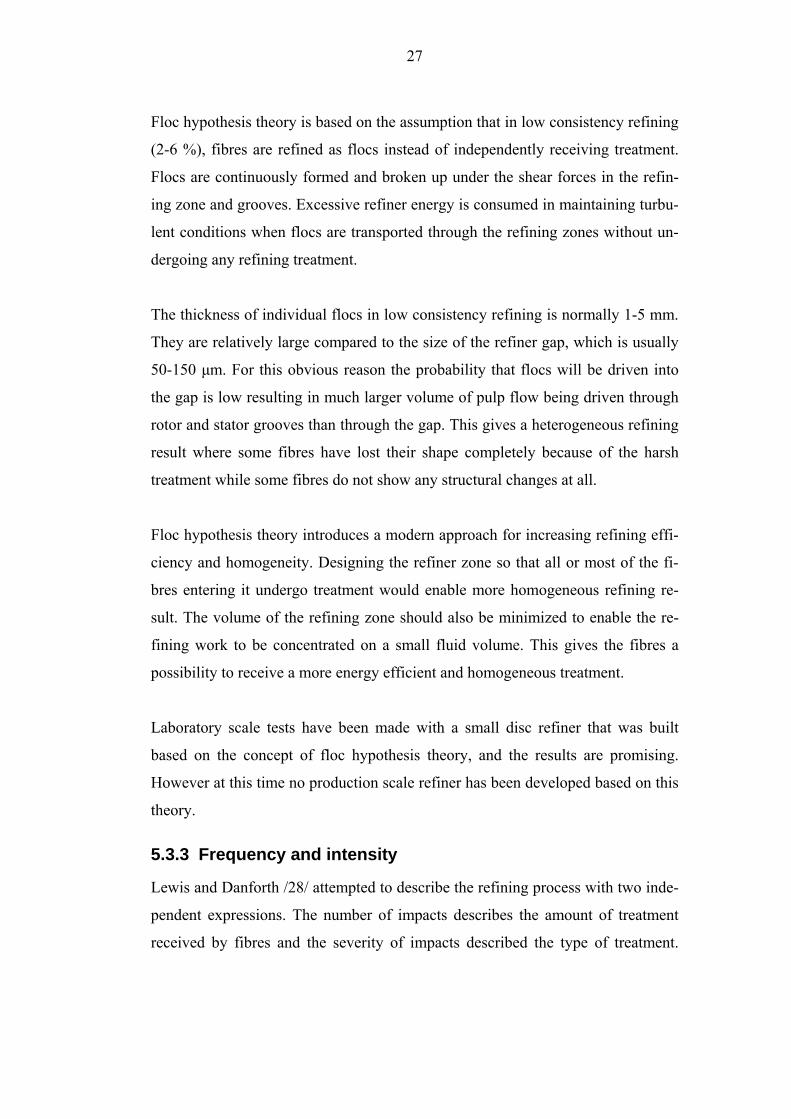
received by fibres and the severity of impacts described the type of treatment.
28
Also the pulp properties were included in the calculations through pulp consis-
tency. Figure 17 shows an illustration of this theory.
Figure 17. Effect of number and nature of impacts on type and degree of refining treatment
/28/.
Danforth later developed this theory into two equations. The equation for severity
of impacts is:
( )2
0
)(K
cLLRPMDAPP
Ssr
ttot ⋅⋅⋅⋅⋅
⋅−=
, (11)
and for number of impacts:
1)(
KRX
cRPMLLN sr ⋅
⋅⋅⋅⋅
=, (12)
where
At is total area of refining zone
D effective diameter
RPM rotor revolutions per minute
Lr total length of rotor edges
Ls total length of stator edges
c stock consistency
29
X average bar contact length
R throughput rate
K1, K2 constants.
Most of the factors affecting refining result are included in this theory. However
because its complexity and constants that are not easily available, it is not so
commonly used.
5.3.4 C-factor
Kerekes /29/ introduced a more comprehensive approach on refining effects in
1990. Using the same approach as Lewis and Danforth, he derived net refining
energy as a product of number and intensity of the impacts:
INE ⋅= (13)
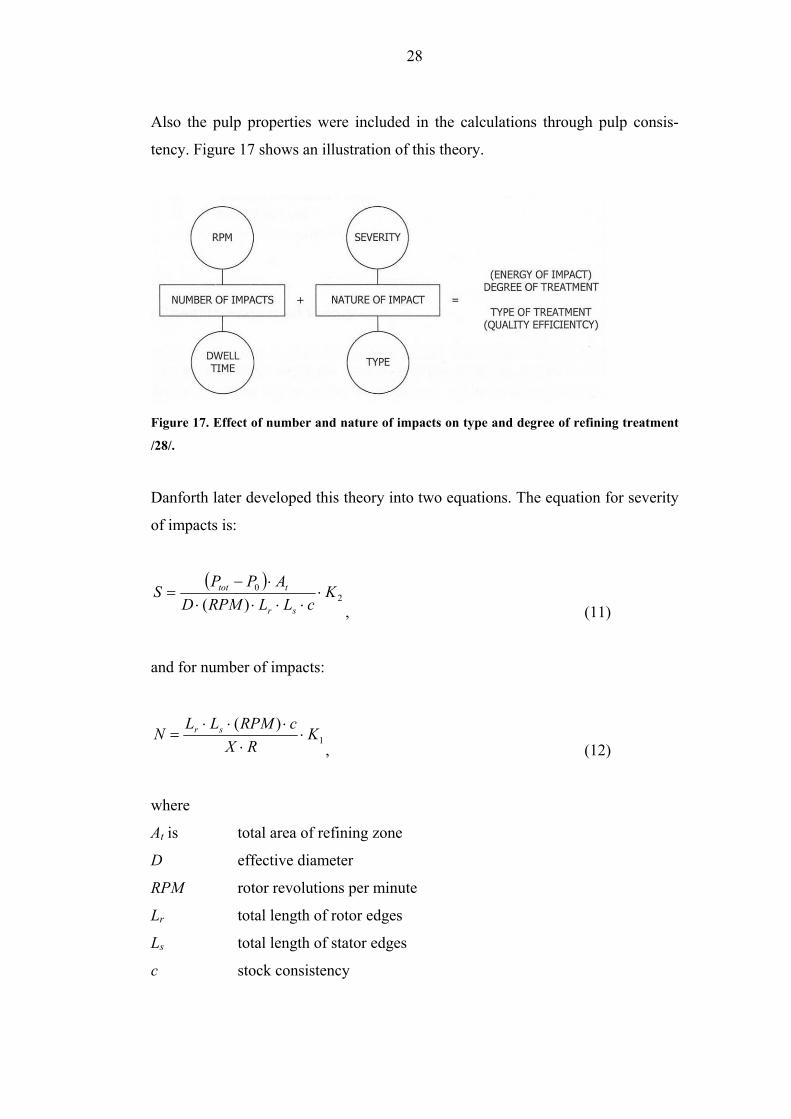
Figure 18 shows the different effects of refining intensity and frequency on the
refining result with similar energy consumption.
Figure 18. The two combinations of refining intensity and frequency effects on the refining
result /29/.
30
C-factor represents the capacity of a refiner to inflict impacts on pulp fibres.
Kerekes has approached the refining process also from the pulp properties point of
view instead of concentrating only on machine parameters and process variables.
The C- factor connects the net power input Pnet and pulp mass flow rate F, to the
average number N and intensity of impacts I by the following equations /7/:
FfactorCN −
= (14)
factorCP
I net
−=
. (15)
The C-factor is a function of refiner filling geometry, rotation speed, pulp consis-
tency, fiber length and coarseness.
For a disc refiner in simplified conditions where the gap size is small and the bar
pattern is similar on both rotor and stator, the C-factor is given by the following
equation:
( )( ) ( )DlwRR
nlCDGC F
+⋅⋅−
⋅+⋅⋅⋅⋅⋅⋅⋅⋅⋅=
3/
tan21831
32
32 φωρπ, (16)
and for a conical refiner in simplified conditions:
( )( )[ ( DlwLRLLR
nlCDGC F
+⋅+⋅+⋅
⋅+⋅⋅⋅⋅⋅⋅⋅⋅⋅=
/sin3/sin
tan21823
122
1
32
θθ
φωρπ
] ) (17)
where
G is width of grooves
D depth of grooves
ρ density of water
CF pulp consistency
31
l length of fiber
n number of bars per unit arc length of rotor/stator
ω rotational velocity of refiner
φ bar angle on rotor/stator
R1 inner radius of disc refiner plate
R2 outer radius of disc refiner plate
w coarseness of fibre
L length of refining zone
θ angle of conical refiner.
C-factor analysis is probably the most comprehensive refining theory developed
so far. It also builds on other widely used and well known theories such as spe-
cific edge load and specific surface load. However for example fillings wear can
have an effect on C-factor. Because these factors can be difficult to determine and
calculations are sometimes very complex, this theory is not widely used among
papermakers /7/.
5.4 Conclusions about refining theories
If full understanding and control is targeted, theories including fibre and pulp
properties seem logical. There are some results which imply that the refining ef-
fect on fibres is described well by the C-factor theory. Similar unpublished results
have been received in studies conducted in Finland /30/. Theories based simply on
machine parameters and data have practical use. As there does not seem to be
clear advantages in any specific one, for papermakers it has been reasonable to
use the simplest one: The specific edge load theory (SEL).

32
6 REFINING ENERGY AND FORCES
6.1 Force acting on pulp mass
Shear stress acting on pulp mass is dependent on specific edge load, sliding dis-
tance, partial bar and partial fibre coverage by equation:
szbSEL
F ⋅⋅=σ , (18)
where
SEL is specific edge load
b length over bar width covered
z fractional bar coverage
s sliding distance.
6.2 Forces acting on individual fibres
Quantifying forces acting on individual fibres can be difficult because of the large
distribution of forces within fibre networks. Kerekes and Senger /31/ have esti-
mated the average normal force acting on a fibre by the equation:
7,023
0
4⎟⎠⎞
⎜⎝⎛
⋅⋅⋅⋅
⋅⋅⋅⋅⋅⋅
=zbS
SELTa
kGCldf s
N ππ
, (19)
where
d0 is uncompressed fibre diameter
l fibre length
Cs consistency of the floc before compression
k fractional proportion of the groove from which fibres are captured
G groove width
T gap size
SEL specific edge load
33
S sliding distance
z fractional distance along unit bar length covered with fibre
a, b constants.
Values of some of the constants in this equation are not known at the present time
/32/. One target of this thesis is to be able to measure fractional distance along
unit bar length covered with fibre z, and possibly consistency of the floc before
compression Cs.
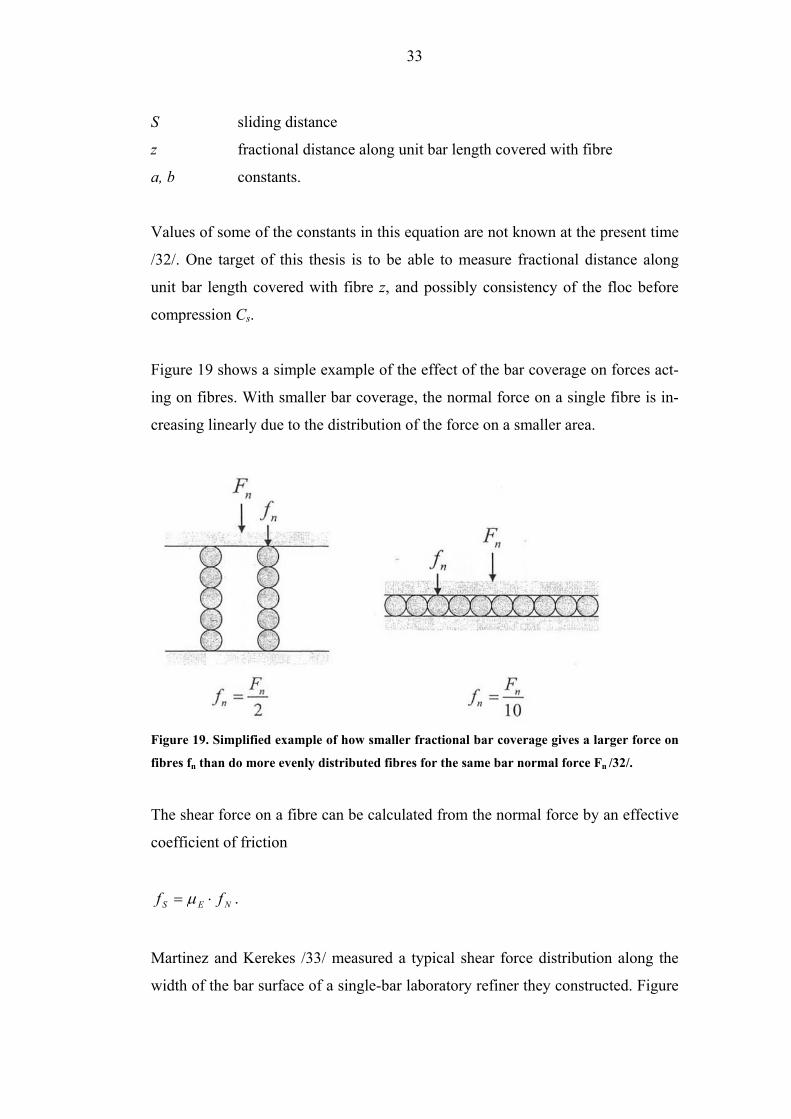
Figure 19 shows a simple example of the effect of the bar coverage on forces act-
ing on fibres. With smaller bar coverage, the normal force on a single fibre is in-
creasing linearly due to the distribution of the force on a smaller area.
Figure 19. Simplified example of how smaller fractional bar coverage gives a larger force on
fibres fn than do more evenly distributed fibres for the same bar normal force Fn /32/.
The shear force on a fibre can be calculated from the normal force by an effective
coefficient of friction
NES ff ⋅= μ .
Martinez and Kerekes /33/ measured a typical shear force distribution along the
width of the bar surface of a single-bar laboratory refiner they constructed. Figure
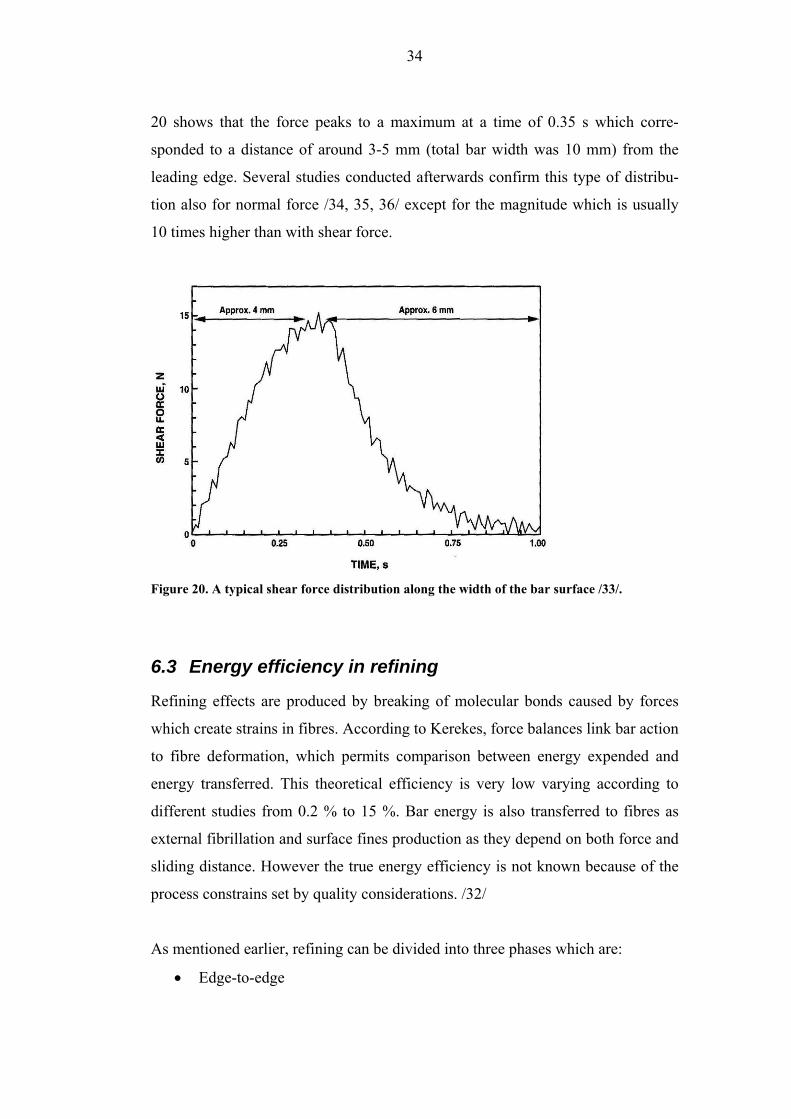
34
20 shows that the force peaks to a maximum at a time of 0.35 s which corre-
sponded to a distance of around 3-5 mm (total bar width was 10 mm) from the
leading edge. Several studies conducted afterwards confirm this type of distribu-
tion also for normal force /34, 35, 36/ except for the magnitude which is usually
10 times higher than with shear force.
Figure 20. A typical shear force distribution along the width of the bar surface /33/.
6.3 Energy efficiency in refining
Refining effects are produced by breaking of molecular bonds caused by forces
which create strains in fibres. According to Kerekes, force balances link bar action
to fibre deformation, which permits comparison between energy expended and
energy transferred. This theoretical efficiency is very low varying according to
different studies from 0.2 % to 15 %. Bar energy is also transferred to fibres as
external fibrillation and surface fines production as they depend on both force and
sliding distance. However the true energy efficiency is not known because of the
process constrains set by quality considerations. /32/
As mentioned earlier, refining can be divided into three phases which are:
• Edge-to-edge
35
• Edge-to-surface
• Surface-to surface.
All of these phases consume energy and the effective part of it is transferred to the
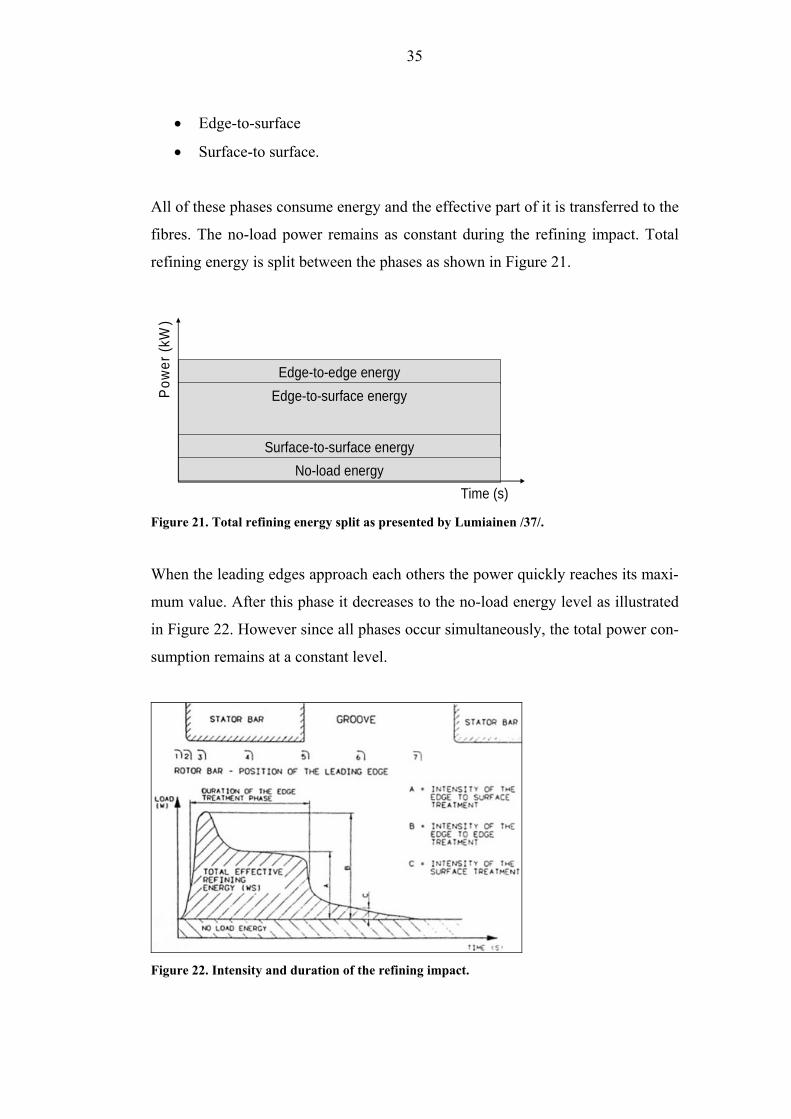
fibres. The no-load power remains as constant during the refining impact. Total
refining energy is split between the phases as shown in Figure 21.
Edge-to-edge energyEdge-to-surface energy
Surface-to-surface energyNo-load energy
Pow
er(k
W)
Time (s) Figure 21. Total refining energy split as presented by Lumiainen /37/.
When the leading edges approach each others the power quickly reaches its maxi-
mum value. After this phase it decreases to the no-load energy level as illustrated
in Figure 22. However since all phases occur simultaneously, the total power con-
sumption remains at a constant level.
Figure 22. Intensity and duration of the refining impact.
36
7 CONCLUSIONS OF THE LITERATURE REVIEW There are many different theories developed concerning low-consistency refining
and its effect on pulp and fibres. Despite the fact that it is one of the most re-
searched areas of papermaking, many unknown issues still remain. These include
parameters such as bar coverage and pulp consistency in the refining gap. Many
of the studies conducted in the earlier days concentrate mostly on the machine
parameters rather than pulp or fibre related parameters. This has lead to the use of
the simplest theories, such as specific edge load (SEL) theory when controlling
the refining process. Understanding of the forces acting on pulp and even individ-
ual fibres during refining is still very much an unknown issue. There are some
studies that have concentrated on measurement of normal and shear forces on fi-
bres during refining in the past decades, but more research in this area is definitely
required.

37
8 EXPERIMENTAL
8.1 Target
Target of the thesis work was to construct a Single Bar Refiner station in order to
enable measurement of fractional bar coverage and pulp consistency in the gap
between rotor and stator bars by image analysis. Improved knowledge of the low
consistency refining phenomenon is expected to provide potential for energy sav-
ings in low-consistency refining of chemical pulp and possibly also in thermome-
chanical pulp refining (TMP). Also improving quality control by for example in-
troducing novel refiner constructions and tailor-made refining for different end
uses could be some of the future innovations.
The experimental section of this thesis describes the designing and construction
process of the Single Bar Refiner station in detail. There were also some prelimi-
nary trials that were conducted with the refiner, which included the imaging sys-
tem testing. Results from those trials are also included in this section. The SBR
station was placed to the machine hall of TKK Forest Product Department and
will be mainly operated by Paper and Printing technology group.
8.2 Background
Starting point of this thesis was linked to an earlier project where first version of
the Single Bar Refiner, later referred as SBR, was constructed by modifying the
chamber of a pump. The rotor shaft of the pump was fitted with a cylinder
equipped with two bars to create a refining effect on the fibres passing between
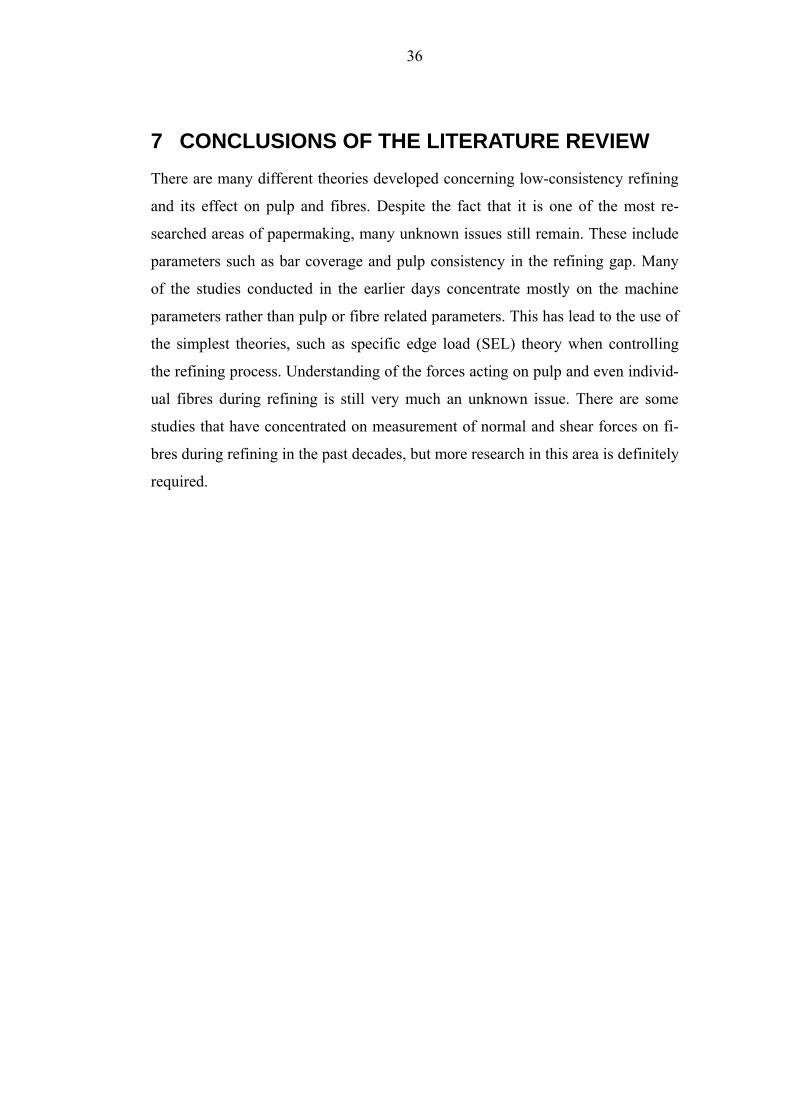
the stator and rotor bars (Figure 23).
38
Figure 23. The refining gap on the first version of the Single Bar Refiner unit /4/.
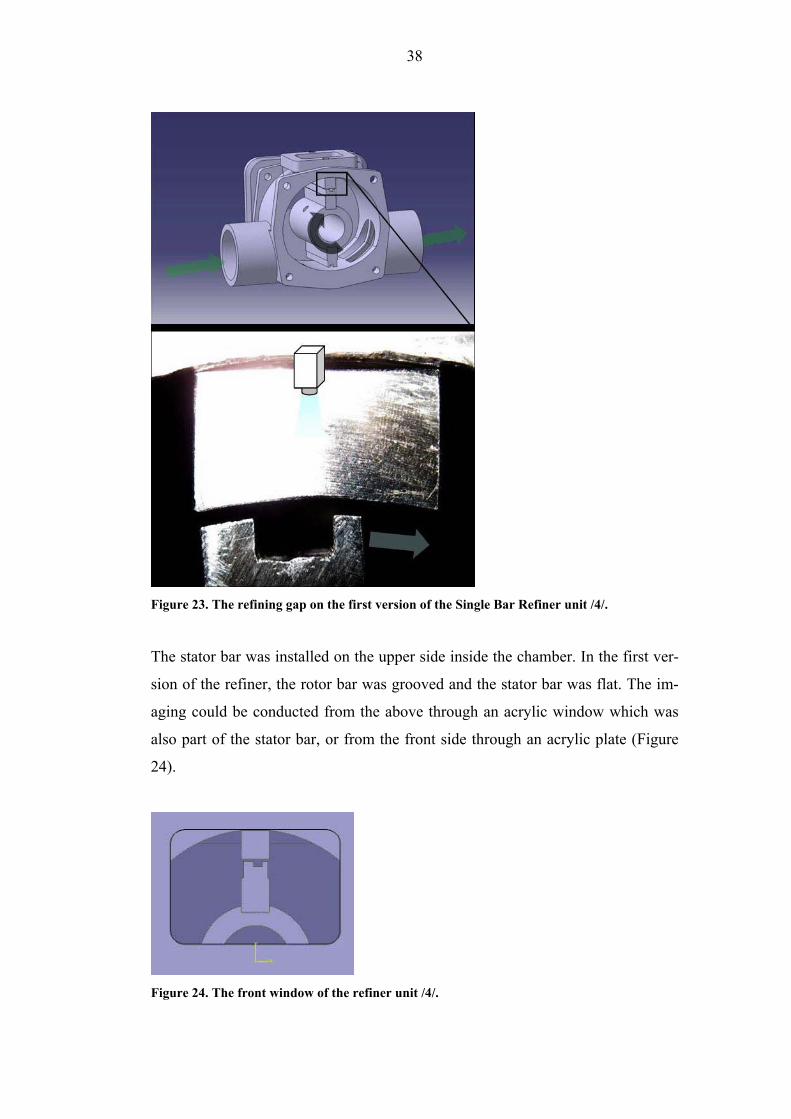
The stator bar was installed on the upper side inside the chamber. In the first ver-
sion of the refiner, the rotor bar was grooved and the stator bar was flat. The im-
aging could be conducted from the above through an acrylic window which was
also part of the stator bar, or from the front side through an acrylic plate (Figure
24).
Figure 24. The front window of the refiner unit /4/.
39
The first version was tested only shortly due to the ENGINE project closure, but
the results were promising. Some good images and video material was shot and
also a technique for image analysis was developed /4/. After the construction of
the refiner some modifications were suggested to create more realistic refining
conditions in the gap between the bars. Because of the stator design (no groove),
the fibre capture was not realistic enough because the fibres were captured in the
refining zone from a much larger volume than in real situation. Grooving the sta-
tor bar would create a finite volume for the pulp suspension and was expected to
have an effect on the fibre behavior in the gap. Also the size of the refining gap
between stator and rotor bars was unrealistically large.
8.3 Modification of the stator bar
8.3.1 Introduction
One of the main targets of the SBR construction was to design a stator with two
bars with a groove between them instead of only one wide bar, as was the case in
the first version. Second important modification was to decrease the gap between
stator and rotor bars to a more realistic value of 150 μm - 300 μm from the origi-
nal gap size which was estimated to be ~500 μm.
8.3.2 Grooving the original stator bar
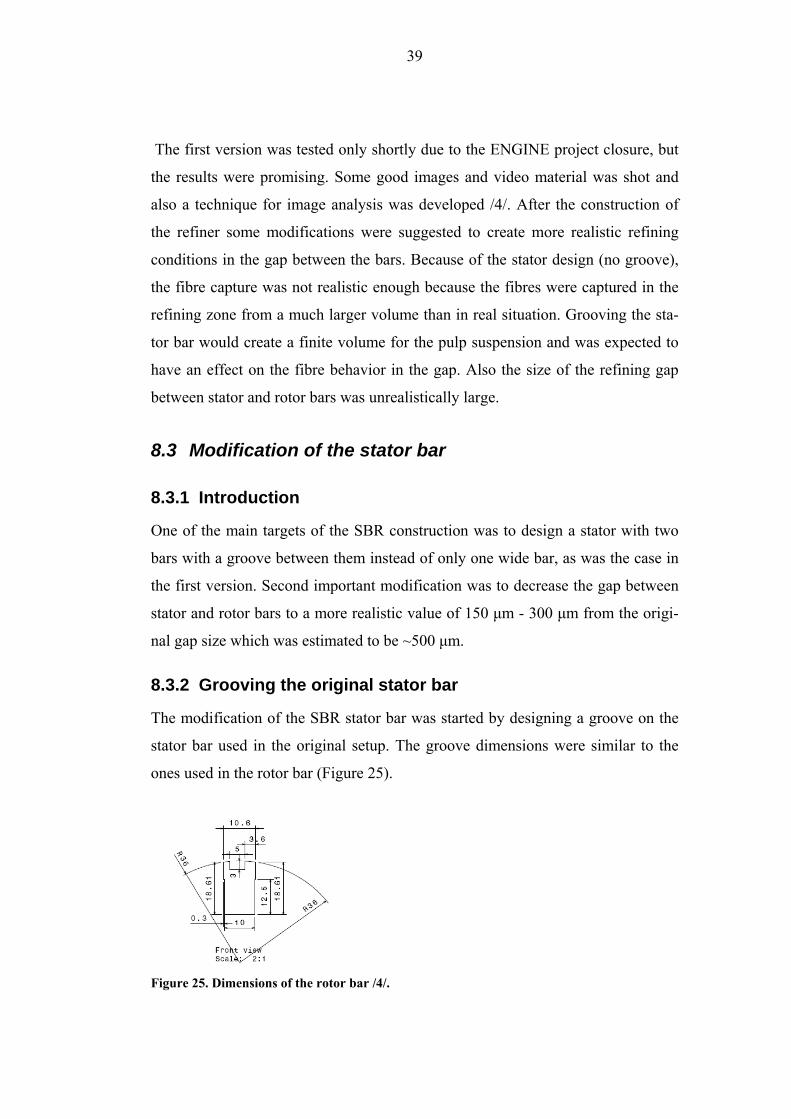
The modification of the SBR stator bar was started by designing a groove on the
stator bar used in the original setup. The groove dimensions were similar to the
ones used in the rotor bar (Figure 25).
Figure 25. Dimensions of the rotor bar /4/.
40
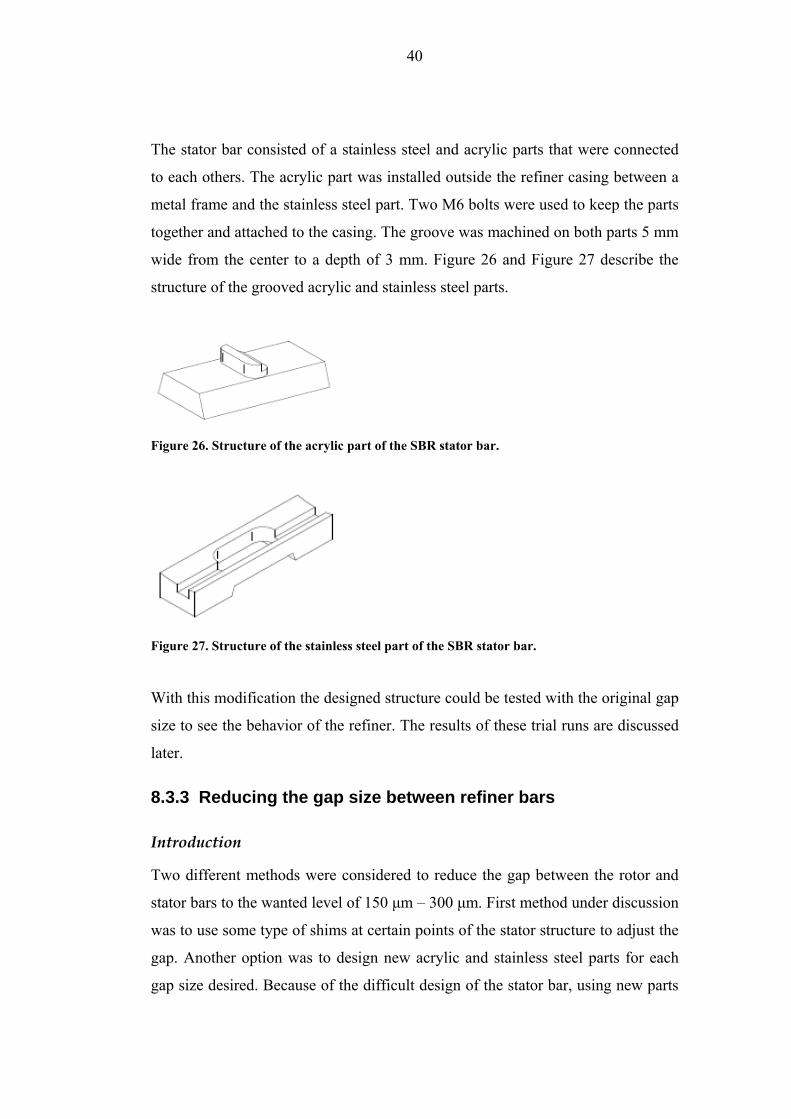
The stator bar consisted of a stainless steel and acrylic parts that were connected
to each others. The acrylic part was installed outside the refiner casing between a
metal frame and the stainless steel part. Two M6 bolts were used to keep the parts
together and attached to the casing. The groove was machined on both parts 5 mm
wide from the center to a depth of 3 mm. Figure 26 and Figure 27 describe the
structure of the grooved acrylic and stainless steel parts.
Figure 26. Structure of the acrylic part of the SBR stator bar.
Figure 27. Structure of the stainless steel part of the SBR stator bar.
With this modification the designed structure could be tested with the original gap
size to see the behavior of the refiner. The results of these trial runs are discussed
later.
8.3.3 Reducing the gap size between refiner bars
Introduction
Two different methods were considered to reduce the gap between the rotor and
stator bars to the wanted level of 150 μm – 300 μm. First method under discussion
was to use some type of shims at certain points of the stator structure to adjust the
gap. Another option was to design new acrylic and stainless steel parts for each
gap size desired. Because of the difficult design of the stator bar, using new parts
41
was considered as more useful approach than adjusting the gap size with shims.
The starting point was to design two sets of parts, first set for the gap size of 150
μm and the second one for the gap size of 300 μm.
Measuring the original gap
First problem was to measure the gap size from the original refiner structure to be
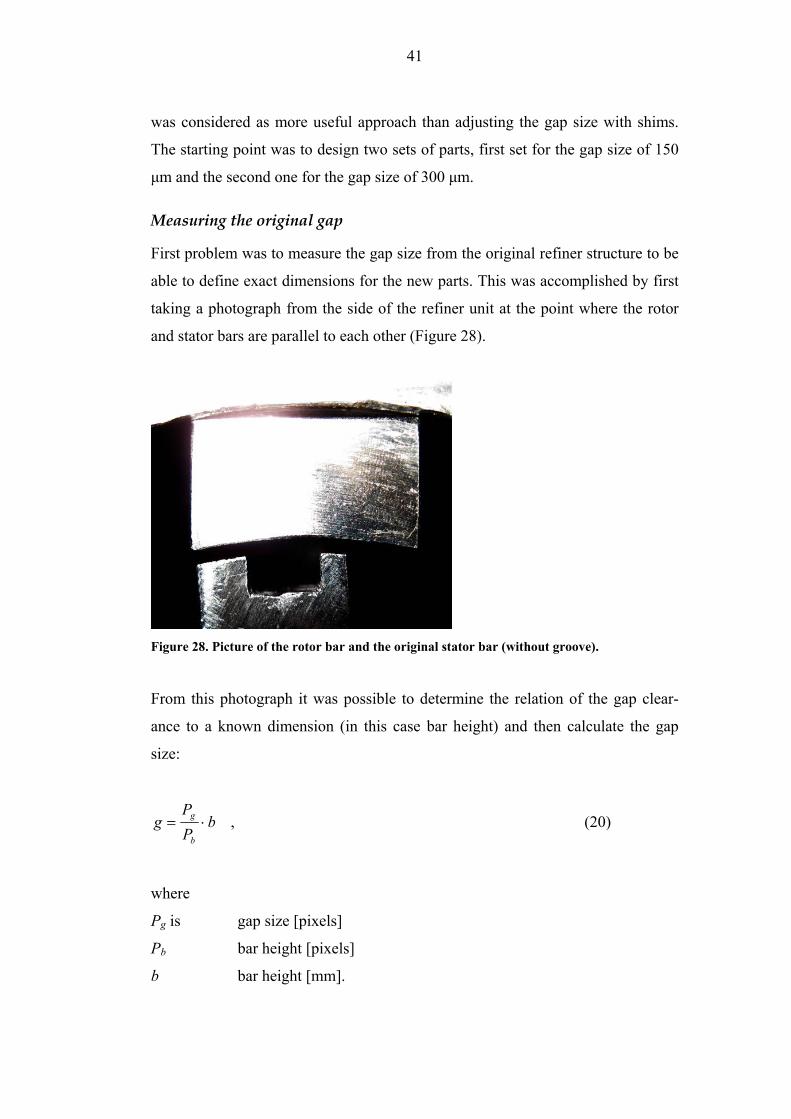
able to define exact dimensions for the new parts. This was accomplished by first
taking a photograph from the side of the refiner unit at the point where the rotor
and stator bars are parallel to each other (Figure 28).
Figure 28. Picture of the rotor bar and the original stator bar (without groove).
From this photograph it was possible to determine the relation of the gap clear-
ance to a known dimension (in this case bar height) and then calculate the gap
size:
bPP
gb
g ⋅= , (20)
where
Pg is gap size [pixels]
Pb bar height [pixels]
b bar height [mm].
42
The measured bar height was 9,1 mm / 740 pixels and gap size 83 pixels. We can
now calculate the gap size of the original setup using equation 20:
.0,11,974083 mmmm
pixpixb
PP
gb
g =⋅=⋅=
Designing the new stator bars
The dimensions for the new acrylic and stainless steel parts could now be calcu-
lated from the original gap size. For example bar height for new stainless steel
part:
( xx gmmbb −+= 0,1 ) , (21)
where
xg is desired gap size.
For a desired gap size of 300 μm we get a bar height of:
( ) .8,93,00,11,9300 mmmmmmmmb =−+=
By measuring the dimensions of the original acrylic and stainless steel parts and
using this information, drawings for all new stator components could be designed
using Solid Edge CAD software. Drawings with all the dimensions are included
as appendices 1-4.
Fitting the new stator bars
When the new stator bar parts designed for the gap size of 150 μm were installed,
the rotor was not able to rotate because the bar seemed to be too high. With the
parts designed for the gap size of 300 μm, the rotor could barely slide past the
stator bar. This problem occurred probably because of the errors in measuring the
43
original gap size. Because the measurement was made only from one side of the
stator – rotor contact, irregularities along the length of the stator bar were not
visible and therefore could not be taken into consideration.
The solution to this problem was to assume that the new stator parts were 300 μm
too high. This in fact was the case because the gap size was actually 0 when a gap
size of 300 μm was wanted. This is due to the fact that the rotor was touching the
stator while still able to slide past it. This lead to a conclusion that the original gap
size was actually 700 μm instead of the 1000 μm calculated earlier. As a result, a
300 μm chip was taken off from both of the stainless steel parts and 300 μm shims
were used under the acrylic parts to keep the refiner casing sealed.
8.4 Pulp flow system design
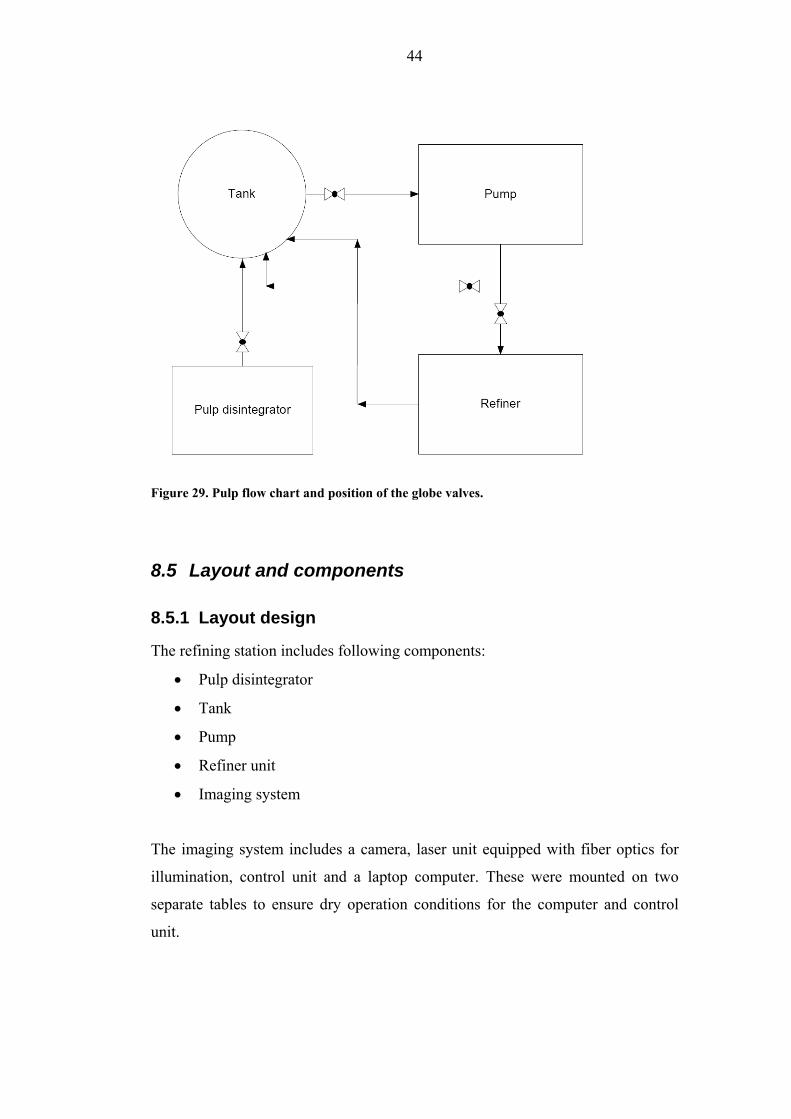
To enable even pulp flow through the refiner, a flow system with recirculation
was designed (Figure 29). A steel reinforced clear PVC hose with an inner diame-
ter of 32 mm was chosen for fluid transportation because of its flexibility, durabil-
ity and relatively low price. Manually operated globe valves were chosen for
process points where control of the flow was considered necessary. These points
are:
• After the pulp disintegrator to drain the suspension to the storage tank
• After the storage tank to open/close access to the flow system
• Two points after the pump to control flow direction and speed to the re-
finer and back to the storage tank (recirculation).
44
Figure 29. Pulp flow chart and position of the globe valves.
8.5 Layout and components
8.5.1 Layout design
The refining station includes following components:
• Pulp disintegrator
• Tank
• Pump
• Refiner unit
• Imaging system
The imaging system includes a camera, laser unit equipped with fiber optics for
illumination, control unit and a laptop computer. These were mounted on two
separate tables to ensure dry operation conditions for the computer and control
unit.
45
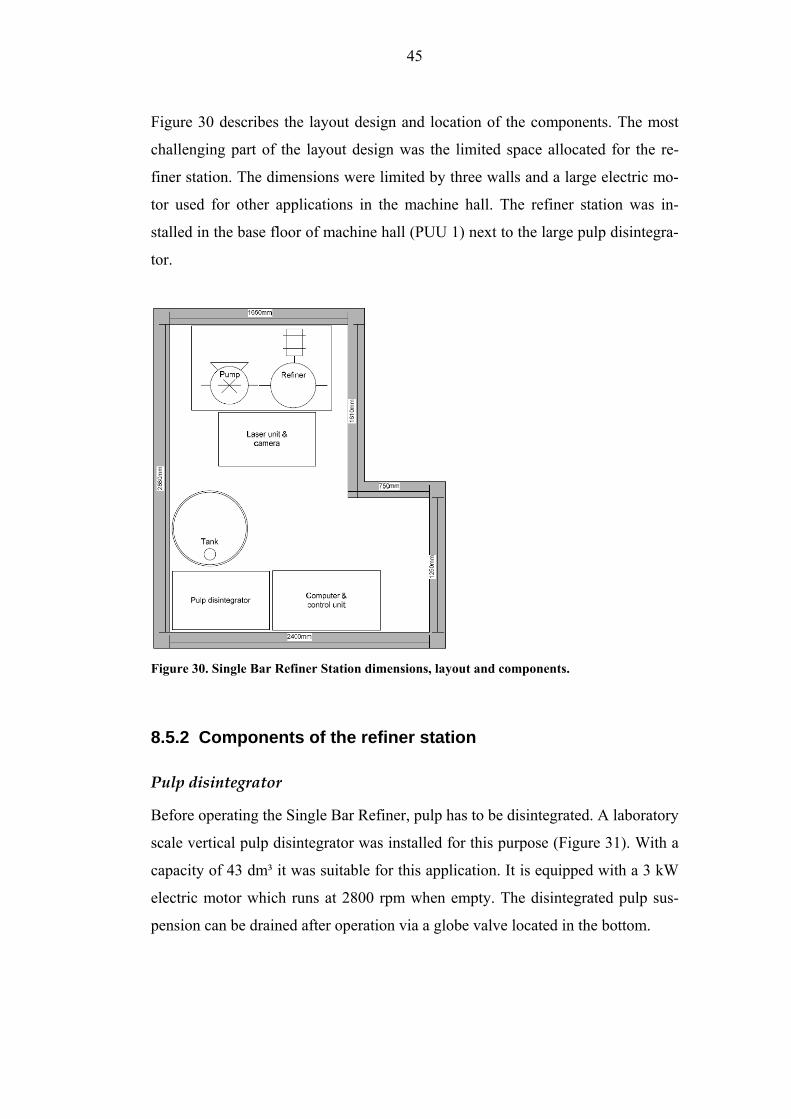
Figure 30 describes the layout design and location of the components. The most
challenging part of the layout design was the limited space allocated for the re-
finer station. The dimensions were limited by three walls and a large electric mo-
tor used for other applications in the machine hall. The refiner station was in-
stalled in the base floor of machine hall (PUU 1) next to the large pulp disintegra-
tor.
Figure 30. Single Bar Refiner Station dimensions, layout and components.
8.5.2 Components of the refiner station
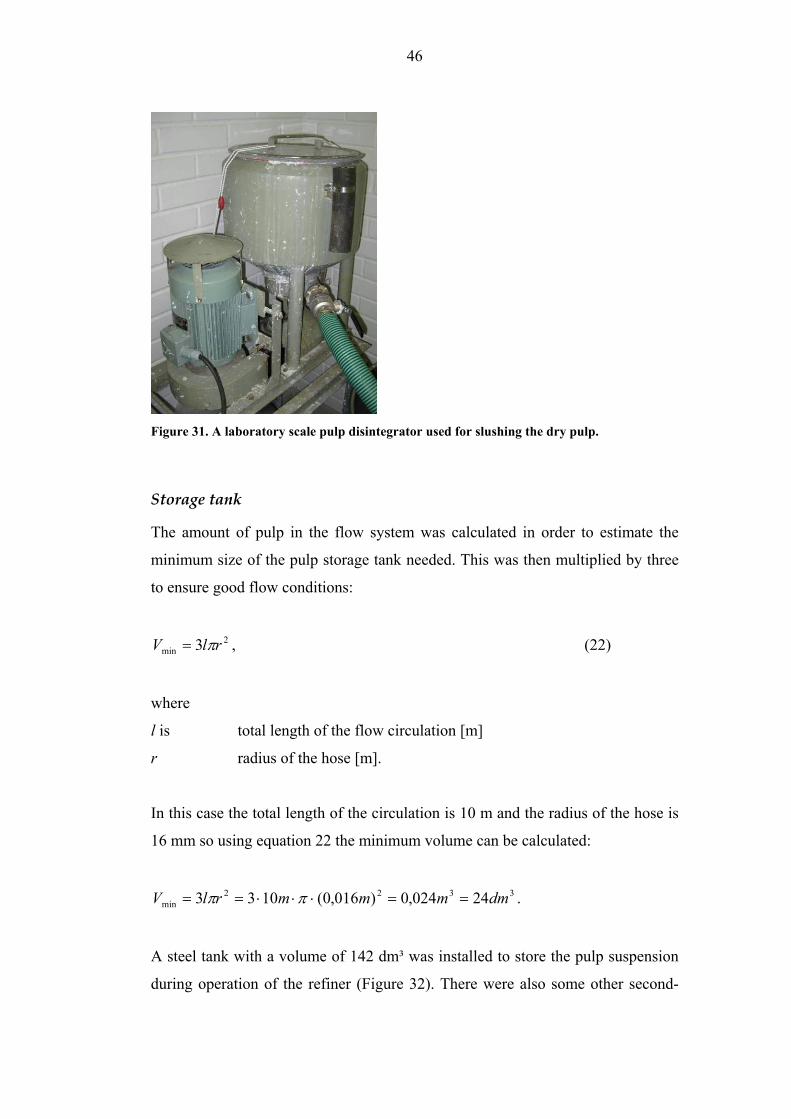
Pulp disintegrator
Before operating the Single Bar Refiner, pulp has to be disintegrated. A laboratory
scale vertical pulp disintegrator was installed for this purpose (Figure 31). With a
capacity of 43 dm³ it was suitable for this application. It is equipped with a 3 kW
electric motor which runs at 2800 rpm when empty. The disintegrated pulp sus-
pension can be drained after operation via a globe valve located in the bottom.
46
Figure 31. A laboratory scale pulp disintegrator used for slushing the dry pulp.
Storage tank
The amount of pulp in the flow system was calculated in order to estimate the
minimum size of the pulp storage tank needed. This was then multiplied by three
to ensure good flow conditions:
2
min 3 rlV π= , (22)
where
l is total length of the flow circulation [m]
r radius of the hose [m].
In this case the total length of the circulation is 10 m and the radius of the hose is
16 mm so using equation 22 the minimum volume can be calculated:
3322
min 24024,0)016,0(1033 dmmmmrlV ==⋅⋅⋅== ππ .
A steel tank with a volume of 142 dm³ was installed to store the pulp suspension
during operation of the refiner (Figure 32). There were also some other second-

47
hand storage tanks available in the machine hall but this one was the best option
because of its compact size and high capacity. In this perspective the capacity of
the tank is high enough for this application and also for possible future modifica-
tions to the pulp flow system. It is also practical to conduct consecutive tests with
different pulp consistencies because of the extra capacity for dilution water.
Figure 32. The tank used for storing the pulp suspension.
Pump
To create flow conditions for the refiner unit, a gear pump (Figure 33) was in-
stalled after the storage tank. It had been used earlier for transportation of pulp
suspensions in the machine hall and was available, which made it optimal for this
use. The pump is also powerful enough to mix the pulp suspension in the storage
tank when recirculation valve is open which makes an additional mixer unneces-
sary.
48
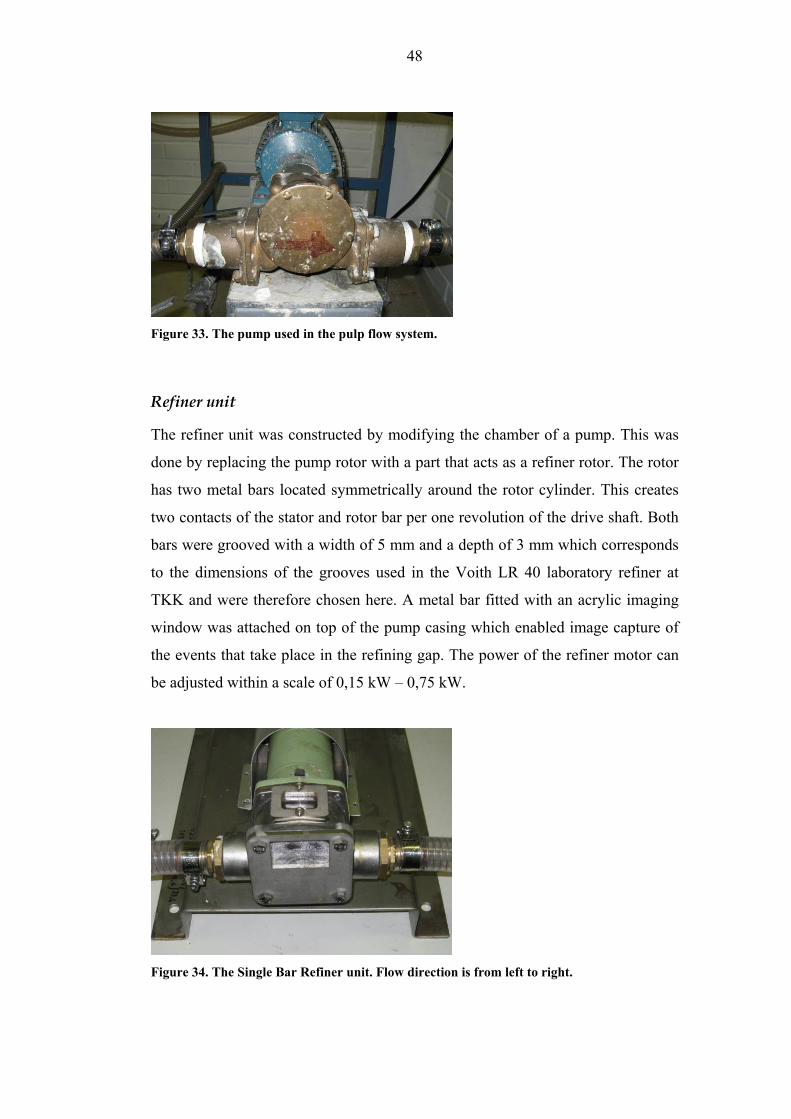
Figure 33. The pump used in the pulp flow system.
Refiner unit
The refiner unit was constructed by modifying the chamber of a pump. This was
done by replacing the pump rotor with a part that acts as a refiner rotor. The rotor
has two metal bars located symmetrically around the rotor cylinder. This creates
two contacts of the stator and rotor bar per one revolution of the drive shaft. Both
bars were grooved with a width of 5 mm and a depth of 3 mm which corresponds
to the dimensions of the grooves used in the Voith LR 40 laboratory refiner at
TKK and were therefore chosen here. A metal bar fitted with an acrylic imaging
window was attached on top of the pump casing which enabled image capture of
the events that take place in the refining gap. The power of the refiner motor can
be adjusted within a scale of 0,15 kW – 0,75 kW.
Figure 34. The Single Bar Refiner unit. Flow direction is from left to right.

49
As mentioned earlier the refiner unit and rotor were designed and constructed as a
part of ENGINE –project discussed in the introduction of the experimental sec-
tion. Only the design and modifications on the stator bar and the motor on the
refiner were changed as part of this thesis.
The imaging is conducted from above the refiner through the acrylic part of stator
bar. The position of the bars and illustrative description of the imaging is shown
in Figure 35.
Figure 35. An illustrative description of the imaging process.
8.6 Imaging system
8.6.1 Introduction
The imaging system for capturing images inside the gap between the rotor and
stator bars was designed to enable image analysis of the fibre behavior during the
refining phenomenon. Some similar methods to capture fibres during refining us-
ing photography has been used by various researchers in the past decades /38, 39,
40/. However these studies have concentrated mostly on thermomechanical pulp
refining, so imaging method for low-consistency refining of chemical pulp with
this type of laser imaging system has not been published. The main target of the
Rotor
Stator

50
image analysis was to study the possibility to measure pulp consistency and frac-
tional bar coverage in the gap between the stator and rotor bars.
All components of the imaging system were supplied by Cavitar Oy, a company
which is specialized in projects that require laser illuminated imaging. The laser
illumination was needed to capture sharp high resolution images from fibres and
fibre flocs captured between the bars during refining. The system with its compo-
nents and connections are described in Figure 36.
Figure 36. The imaging system components and connections.
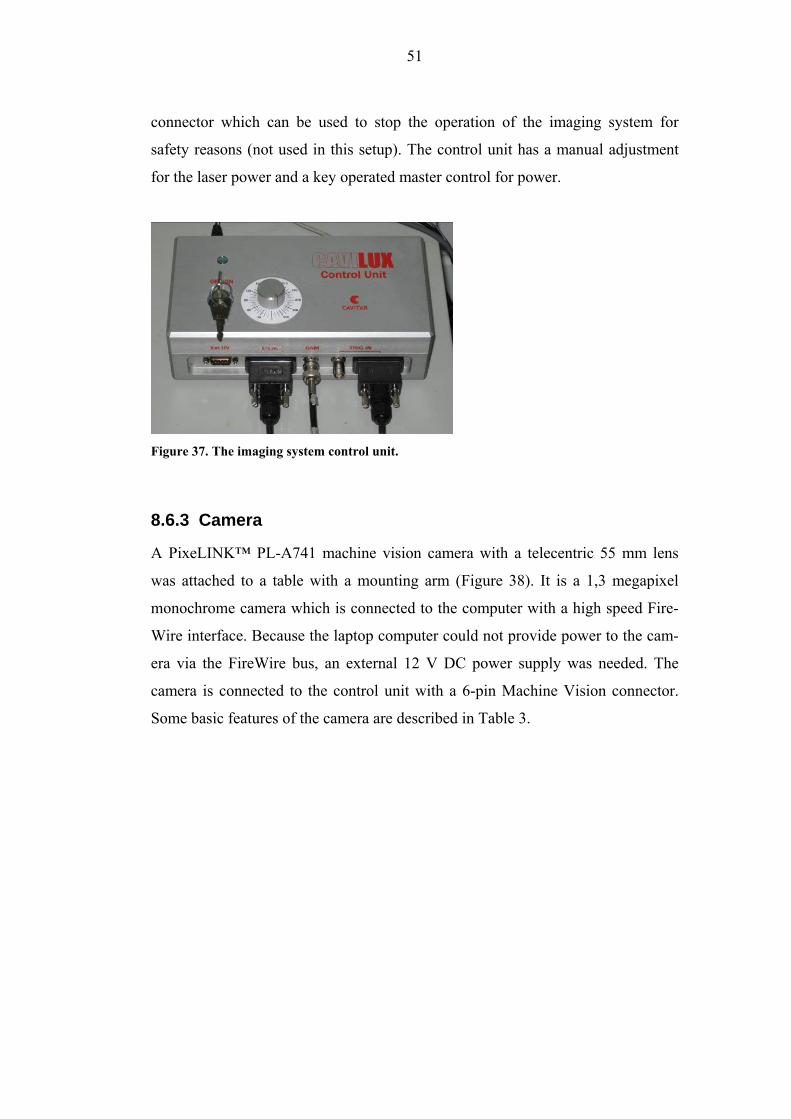
8.6.2 Control unit
The control unit (Figure 37) is used by the computer software to operate the imag-
ing equipment. It has independently programmable outputs for the laser unit and
the camera. The duration of a single pulse within the output pulse pattern can be
adjusted to a value between 42 ns – 10 μs. The unit has a 9-pin D connector and a
BNC connector for external synchronization purposes and a Remote Interlock
51
connector which can be used to stop the operation of the imaging system for
safety reasons (not used in this setup). The control unit has a manual adjustment
for the laser power and a key operated master control for power.
Figure 37. The imaging system control unit.
8.6.3 Camera
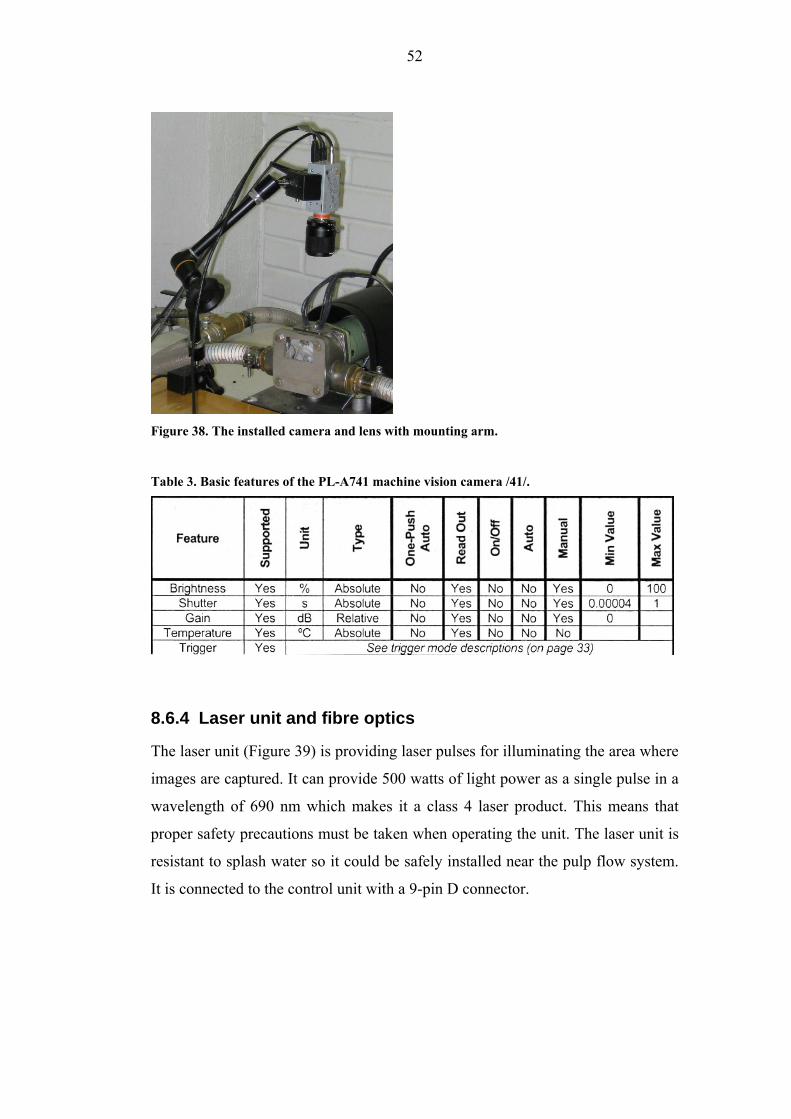
A PixeLINK™ PL-A741 machine vision camera with a telecentric 55 mm lens
was attached to a table with a mounting arm (Figure 38). It is a 1,3 megapixel
monochrome camera which is connected to the computer with a high speed Fire-
Wire interface. Because the laptop computer could not provide power to the cam-
era via the FireWire bus, an external 12 V DC power supply was needed. The
camera is connected to the control unit with a 6-pin Machine Vision connector.
Some basic features of the camera are described in Table 3.
52
Figure 38. The installed camera and lens with mounting arm.
Table 3. Basic features of the PL-A741 machine vision camera /41/.
8.6.4 Laser unit and fibre optics
The laser unit (Figure 39) is providing laser pulses for illuminating the area where
images are captured. It can provide 500 watts of light power as a single pulse in a
wavelength of 690 nm which makes it a class 4 laser product. This means that
proper safety precautions must be taken when operating the unit. The laser unit is
resistant to splash water so it could be safely installed near the pulp flow system.
It is connected to the control unit with a 9-pin D connector.

53
Figure 39. The imaging system laser unit.
The pulse of light is transferred from the laser unit via a fibre optic cable through
an aluminum frame. A bundle of optical fibres divide the light inside the frame to
provide uniform illumination through the acrylic part inside the gap between rotor
and stator bars. Figure 40 shows the position of the aluminum frame and optical
fibres on top of the refiner unit. The images can be taken from the opening located
in the middle of the frame.
Figure 40. The aluminium frame with bundle of optical fibres installed on top of the refiner
unit.

54
8.6.5 Optical trigger
In order to synchronize the camera to capture images from the same position for
each revolution of the refiner, an optical trigger was installed on the refiner unit
(Figure 41). The trigger consists of a cable and a light beam sensor which sends a
5 V electric signal when the beam is interrupted. A metal bar was attached to the
coupling between the refiner unit and its motor in a position where the stator and
rotor bars were aligned. The purpose of the bar was to interrupt the light beam
once per each revolution of the refiner rotor to trig the signal for the control unit.
The final adjusting of the exact moment of image capture was made in the control
software by creating a delay signal for the camera and laser outputs.
Figure 41. Metal bar crossing the light beam of the optical trigger.
8.6.6 Computer and software
The imaging system is controlled with a laptop computer using CAVILUX con-
trol software. The software can be operated either in normal or high speed mode
which is convenient if using high speed camera. Because we are operating the PL-
A741 camera for capturing still images, normal mode is used. The software en-
ables programming of different pulse patterns for the camera and laser unit to ad-
just synchronization with the process.
55
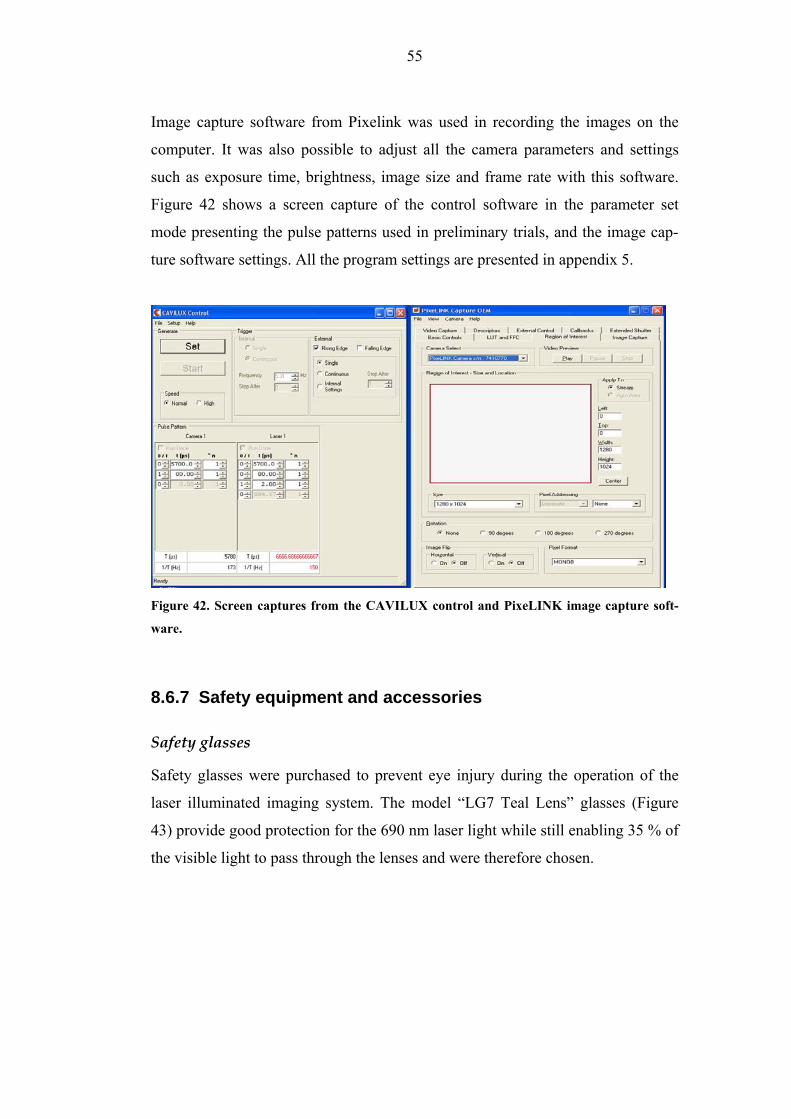
Image capture software from Pixelink was used in recording the images on the
computer. It was also possible to adjust all the camera parameters and settings
such as exposure time, brightness, image size and frame rate with this software.
Figure 42 shows a screen capture of the control software in the parameter set
mode presenting the pulse patterns used in preliminary trials, and the image cap-
ture software settings. All the program settings are presented in appendix 5.
Figure 42. Screen captures from the CAVILUX control and PixeLINK image capture soft-
ware.
8.6.7 Safety equipment and accessories
Safety glasses
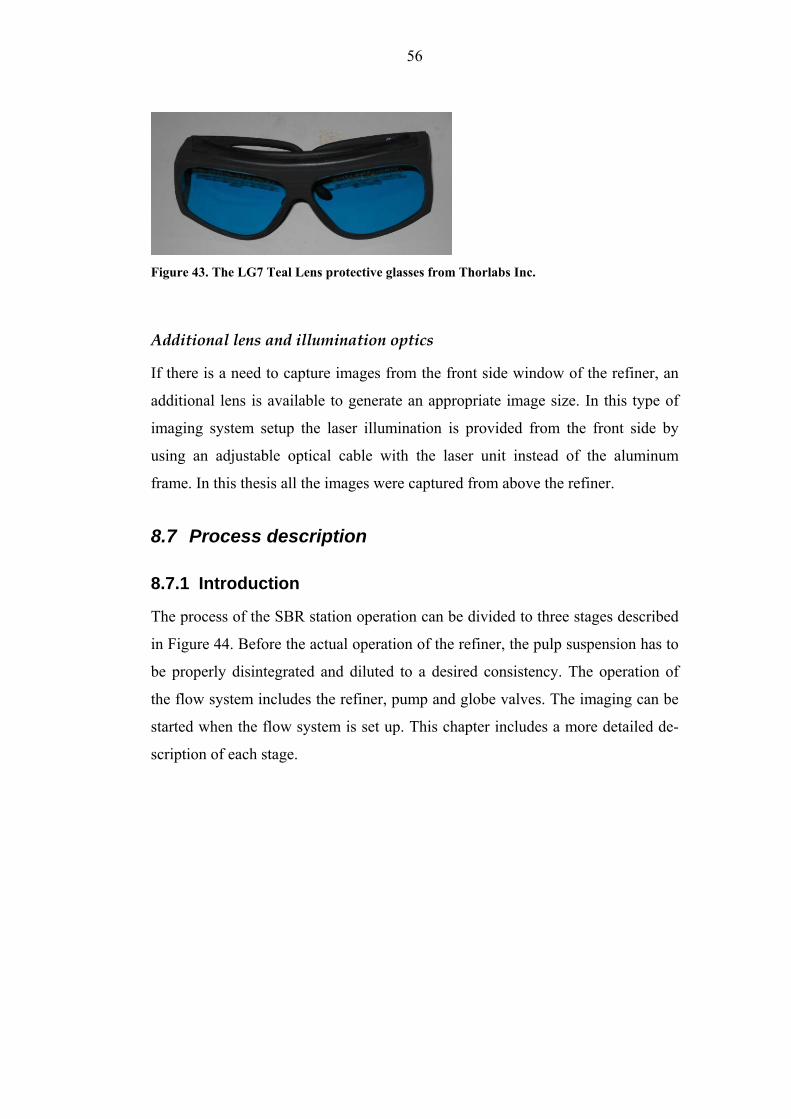
Safety glasses were purchased to prevent eye injury during the operation of the
laser illuminated imaging system. The model “LG7 Teal Lens” glasses (Figure
43) provide good protection for the 690 nm laser light while still enabling 35 % of
the visible light to pass through the lenses and were therefore chosen.
56
Figure 43. The LG7 Teal Lens protective glasses from Thorlabs Inc.
Additional lens and illumination optics
If there is a need to capture images from the front side window of the refiner, an
additional lens is available to generate an appropriate image size. In this type of
imaging system setup the laser illumination is provided from the front side by
using an adjustable optical cable with the laser unit instead of the aluminum
frame. In this thesis all the images were captured from above the refiner.
8.7 Process description
8.7.1 Introduction
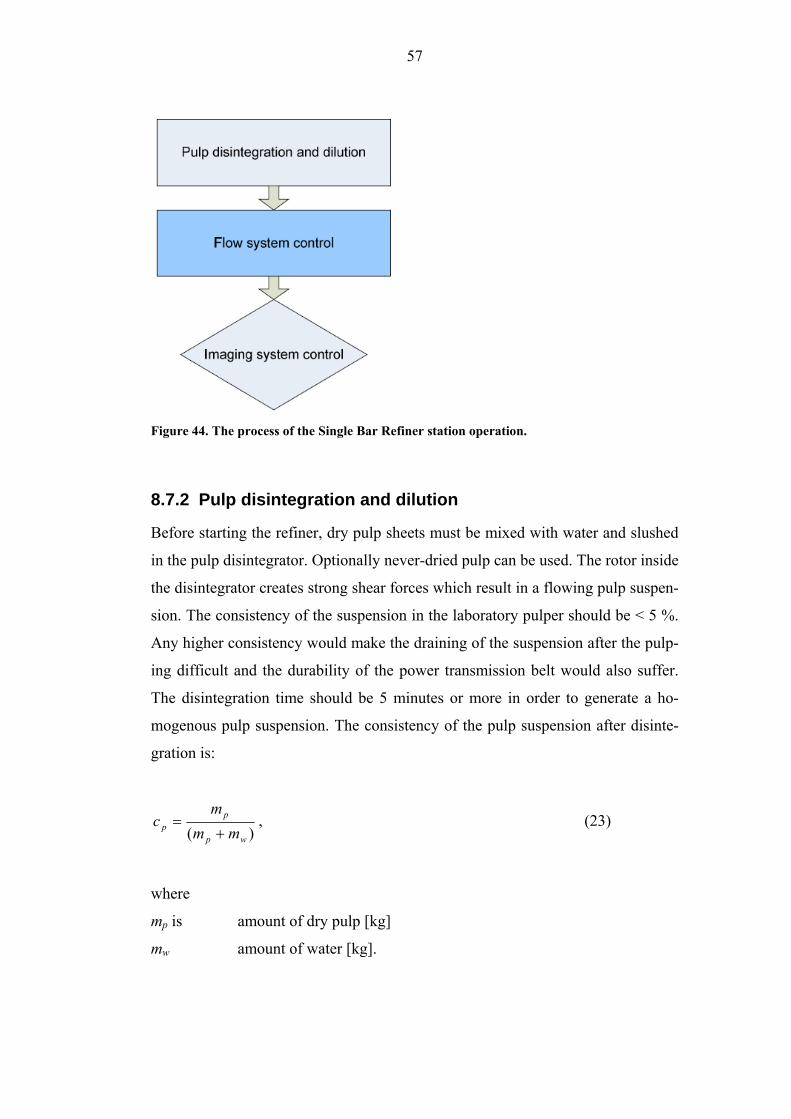
The process of the SBR station operation can be divided to three stages described
in Figure 44. Before the actual operation of the refiner, the pulp suspension has to
be properly disintegrated and diluted to a desired consistency. The operation of
the flow system includes the refiner, pump and globe valves. The imaging can be
started when the flow system is set up. This chapter includes a more detailed de-
scription of each stage.
57
Figure 44. The process of the Single Bar Refiner station operation.
8.7.2 Pulp disintegration and dilution
Before starting the refiner, dry pulp sheets must be mixed with water and slushed
in the pulp disintegrator. Optionally never-dried pulp can be used. The rotor inside
the disintegrator creates strong shear forces which result in a flowing pulp suspen-
sion. The consistency of the suspension in the laboratory pulper should be < 5 %.
Any higher consistency would make the draining of the suspension after the pulp-
ing difficult and the durability of the power transmission belt would also suffer.
The disintegration time should be 5 minutes or more in order to generate a ho-
mogenous pulp suspension. The consistency of the pulp suspension after disinte-
gration is:
)( wp
pp mm
mc
+= , (23)
where
mp is amount of dry pulp [kg]
mw amount of water [kg].
58
After the disintegration pulp is drained from the globe valve to the storage tank
where it is diluted with water to a desired operation consistency. The amount of
dilution water required depends on the consistency after pulp disintegration,
amount of the pulp suspension and the desired refining consistency:
( ) ( wpwpp
dw mmc
mmcm +−
+⋅=, ) , (24)
where
cp is consistency after pulp disintegration [%]
c desired refining consistency [%].
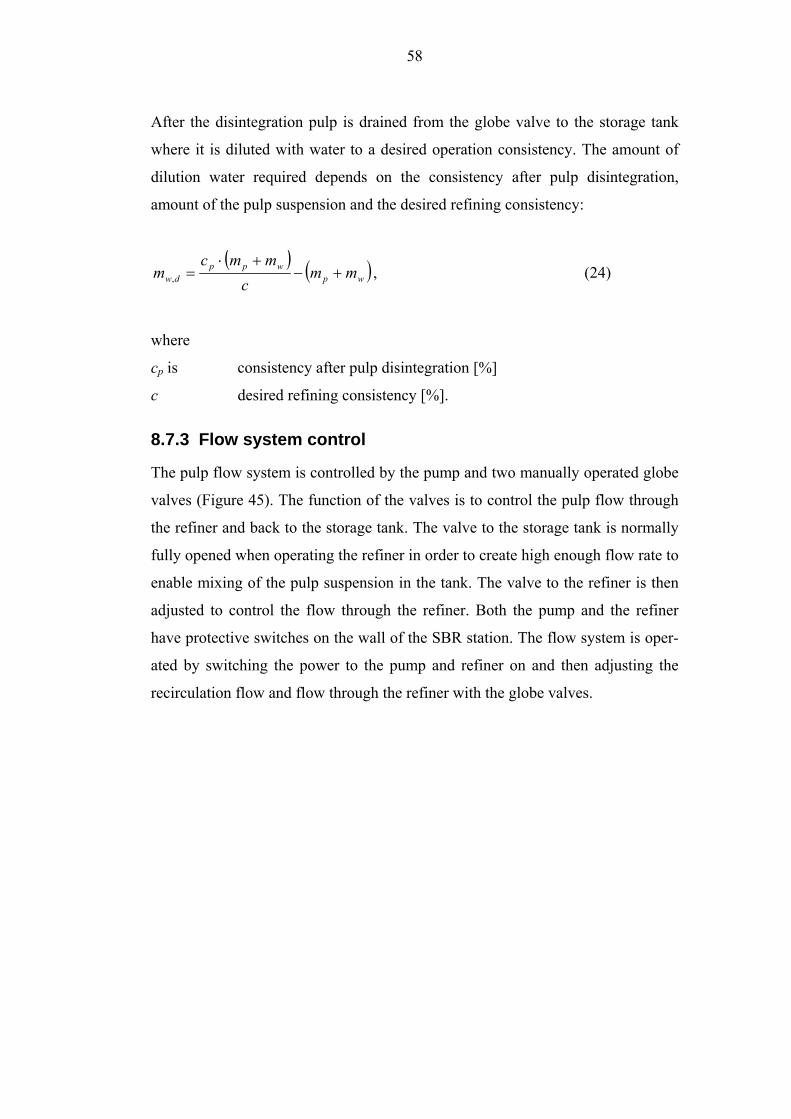
8.7.3 Flow system control
The pulp flow system is controlled by the pump and two manually operated globe
valves (Figure 45). The function of the valves is to control the pulp flow through
the refiner and back to the storage tank. The valve to the storage tank is normally
fully opened when operating the refiner in order to create high enough flow rate to
enable mixing of the pulp suspension in the tank. The valve to the refiner is then
adjusted to control the flow through the refiner. Both the pump and the refiner
have protective switches on the wall of the SBR station. The flow system is oper-
ated by switching the power to the pump and refiner on and then adjusting the
recirculation flow and flow through the refiner with the globe valves.
59
Figure 45. The globe valves used for controlling the pulp flow.
8.7.4 Imaging system control
The imaging system is set up as described in Figure 36. When all the cables are
connected and the control unit and the computer power is on, the camera lens has
to be focused on the area where stator and rotor bar slide past each others. This is
done by first adjusting the camera to a distance of ~15 cm from the targeted area
and then fine tuning the focus from the lens. After the focusing is complete, imag-
ing system is ready to use.
Synchronizing the camera to capture images at exactly the desired moment is
done by first adjusting the optical trigger roughly to the correct position of the
refiner bars. The exact position of the bars during image capture is then fine tuned
by creating a suitable delay signal on the image system control software. If all the
settings are correct and the image system is properly synchronized, image captur-
ing is possible when the pulp flow system is operational and the refiner is rotating.
The image capture is started by pressing the “capture” button on the “image cap-
ture” tab of PixeLINK image capture software shown in appendix 5.
60
9 PRELIMINARY TRIALS AND RESULTS
9.1 Pulp flow system and refiner testing
The pulp flow system was tested to determine the maximum operation consis-
tency of the SBR station. The flow system was first tested with pulp consistencies
from 0,5 % to 4 % with the original stator bar (gap size 700 μm) using long fibred
softwood pine pulp. The result from these tests was that when operating at consis-
tencies higher than 2 %, the refiner unit was at risk of clogging from the pulp sus-
pension. Also the rotor would occasionally get jammed due to the build up of pulp
on the edges of the rotor bars when the flow system and refiner were stopped.
This was probably caused by the fact that the refiner unit was installed higher than
the storage tank which leads to the draining of pulp suspension from the refiner
unit. Pulp concentration inside the refiner chamber increases which can jam the
rotor when refiner is started again.
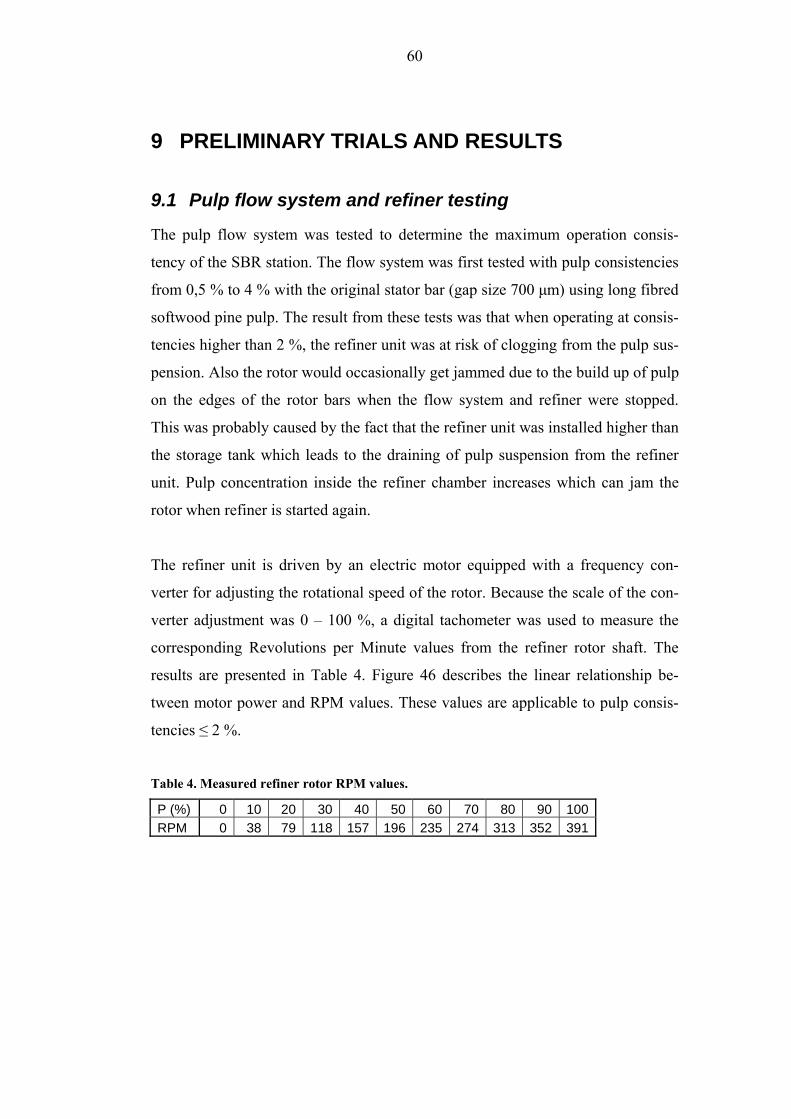
The refiner unit is driven by an electric motor equipped with a frequency con-
verter for adjusting the rotational speed of the rotor. Because the scale of the con-
verter adjustment was 0 – 100 %, a digital tachometer was used to measure the
corresponding Revolutions per Minute values from the refiner rotor shaft. The
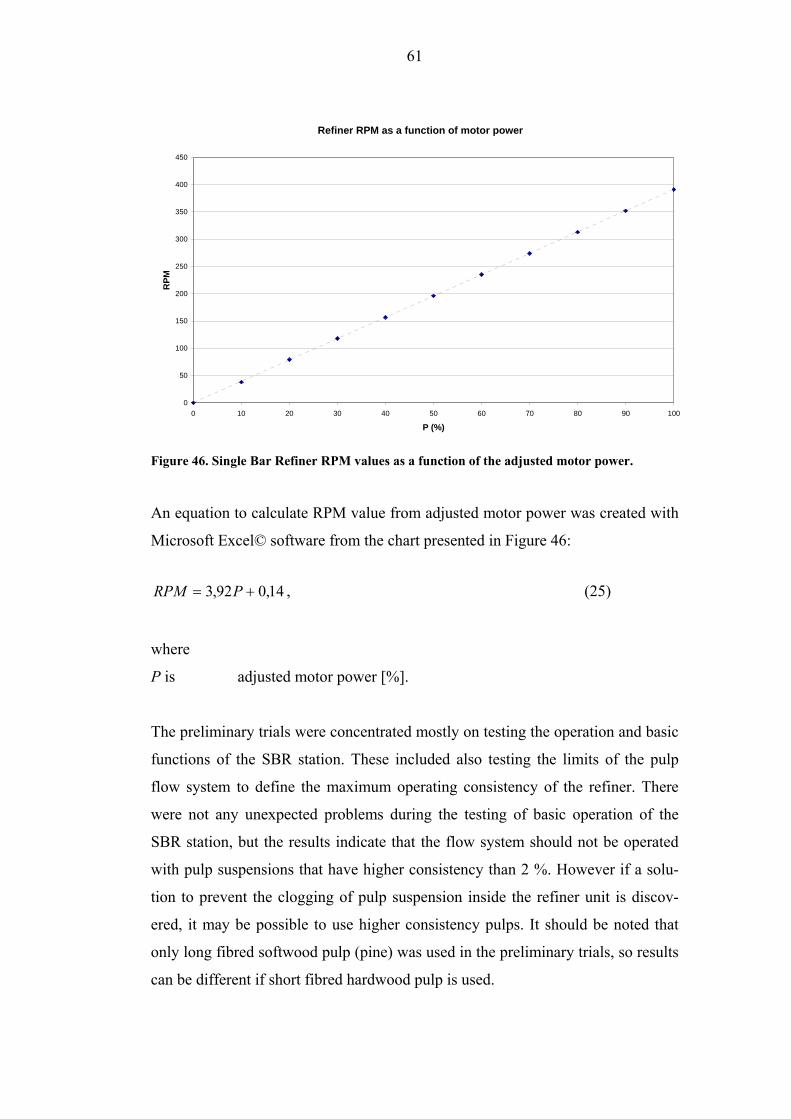
results are presented in Table 4. Figure 46 describes the linear relationship be-
tween motor power and RPM values. These values are applicable to pulp consis-
tencies ≤ 2 %.
Table 4. Measured refiner rotor RPM values.
P (%) 0 10 20 30 40 50 60 70 80 90 100 RPM 0 38 79 118 157 196 235 274 313 352 391
61
Refiner RPM as a function of motor power
0
50
100
150
200
250
300
350
400
450
0 10 20 30 40 50 60 70 80 90 10
P (%)
RPM
0
Figure 46. Single Bar Refiner RPM values as a function of the adjusted motor power.
An equation to calculate RPM value from adjusted motor power was created with
Microsoft Excel© software from the chart presented in Figure 46:
14,092,3 += PRPM , (25)
where
P is adjusted motor power [%].
The preliminary trials were concentrated mostly on testing the operation and basic
functions of the SBR station. These included also testing the limits of the pulp
flow system to define the maximum operating consistency of the refiner. There
were not any unexpected problems during the testing of basic operation of the
SBR station, but the results indicate that the flow system should not be operated
with pulp suspensions that have higher consistency than 2 %. However if a solu-
tion to prevent the clogging of pulp suspension inside the refiner unit is discov-
ered, it may be possible to use higher consistency pulps. It should be noted that
only long fibred softwood pulp (pine) was used in the preliminary trials, so results
can be different if short fibred hardwood pulp is used.

62
9.2 Measuring the amount of pulp in the refiner gap
An idea for experimental method for measuring the exact amount of pulp between
the refiner bars was preliminary tested. The first phase of the measurement was to
turn the pulp flow system on but not starting the refiner. Instead, the refiner rotor
was turned by hand and stopped in the position where the stator and rotor bars are
aligned. After this the flow system was stopped and the refiner unit was drained
from pulp, which left only the flocs of fibres trapped inside the refiner gap. This
pulp was then scraped off from the surface of the rotor bar by hand and weighed
after drying it for 24 hours in a temperature of 105 °C. This procedure was then
used to measure 12 samples using 150 μm gap size and pine pulp with a consis-
tency of 2 %. The pulp mass per bar length and consistency in the gap was also
calculated by using the bar dimensions given earlier. Results from these meas-
urements are presented in Table 5.
Table 5. The results from pulp weight measurements.
sample m (pulp,g) m/bar length (kg/m) c in gap (%) 1 0,0262 4,23E-04 78,26 2 0,0080 1,29E-04 23,89 3 0,0100 1,61E-04 29,87 4 0,0160 2,58E-04 47,79 5 0,0211 3,40E-04 63,02 6 0,0287 4,63E-04 85,72 7 0,0229 3,69E-04 68,40 8 0,0483 7,79E-04 144,27 9 0,0165 2,66E-04 49,28
10 0,0313 5,05E-04 93,49 11 0,0122 1,97E-04 36,44 12 0,0296 4,77E-04 88,41
Average 0,0226 3,64E-04 67,40 95 % conf. 0,0064 1,03E-04 19,06
These results are only indicative and much larger amount of measuring points
would be required in order to get any reliable data. The process of measuring a
single sample is very time consuming and laborious, so measuring larger amounts
would require lot of time and effort. Also the amount of pulp that was weighed
was partly originated from outside the actual refining gap because some of the
flocs trapped between bars would be only partly inside the gap. This makes the
amount of pulp larger than it should be. But this type of “hands-on” measurement

63
is perhaps the only way to know the exact amount of the pulp inside the gap so
further development of this kind of technique could be considered in the future.
9.3 Imaging system testing
The imaging system testing included trial runs and digital image analysis of pic-
tures that were captured from inside the refiner gap during surface-to-surface
phase of the refining. The target of this trial was to study the correlation between
the average pixel brightness values of analyzed images and the consistency of the
refined pulp suspension. The average brightness value was expected to indicate
the amount and coverage of the fibres along the bar surface because of the light
refraction from the fibres. The imaging system was tested by first setting up the
equipment and capturing images from inside the refiner gap during surface-to-
surface phase of the refining event. The tests were conducted using pine pulp at
five consistencies from 0,4 % to 2,0 % and using three different gap sizes of 150
μm, 300 μm and the original 700 μm. 100 images per each test point were cap-
tured to increase the reliability of the test. One of the captured images is shown in
Figure 47. The region highlighted with the white rectangle is the analyzed area
between the stator and rotor bar surfaces where bundles of fibres and flocs are
receiving refining treatment.
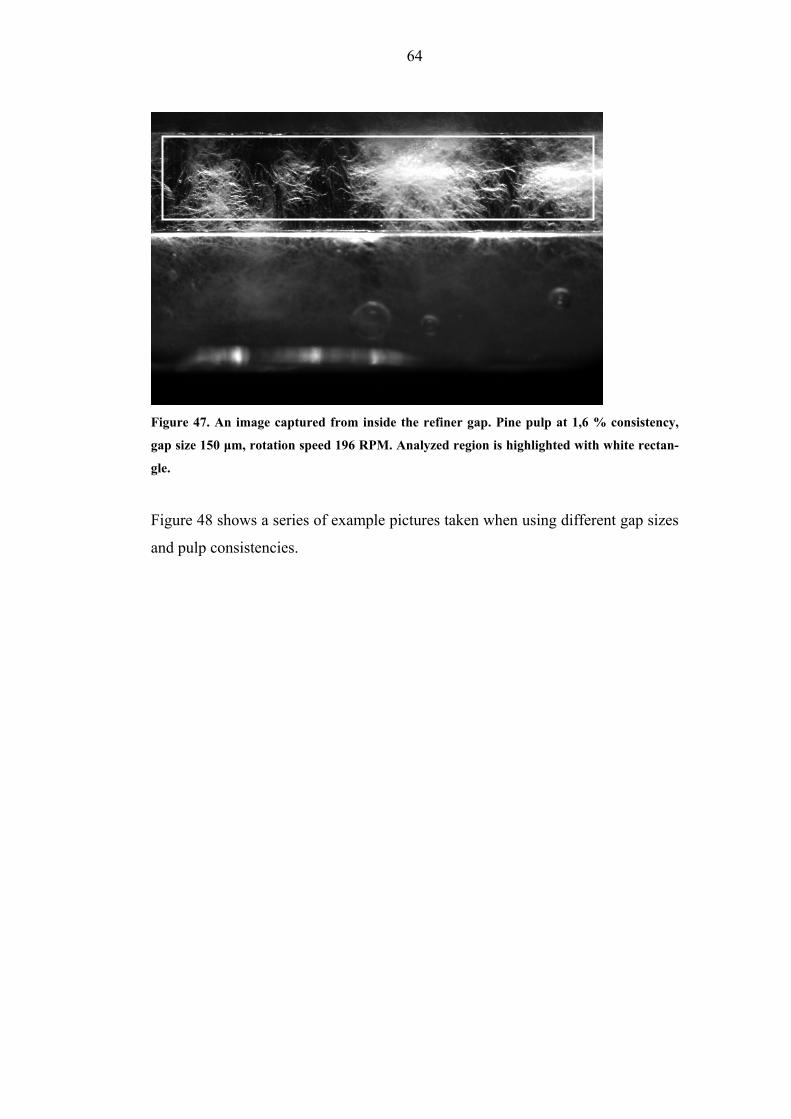
64
Figure 47. An image captured from inside the refiner gap. Pine pulp at 1,6 % consistency,
gap size 150 μm, rotation speed 196 RPM. Analyzed region is highlighted with white rectan-
gle.
Figure 48 shows a series of example pictures taken when using different gap sizes
and pulp consistencies.
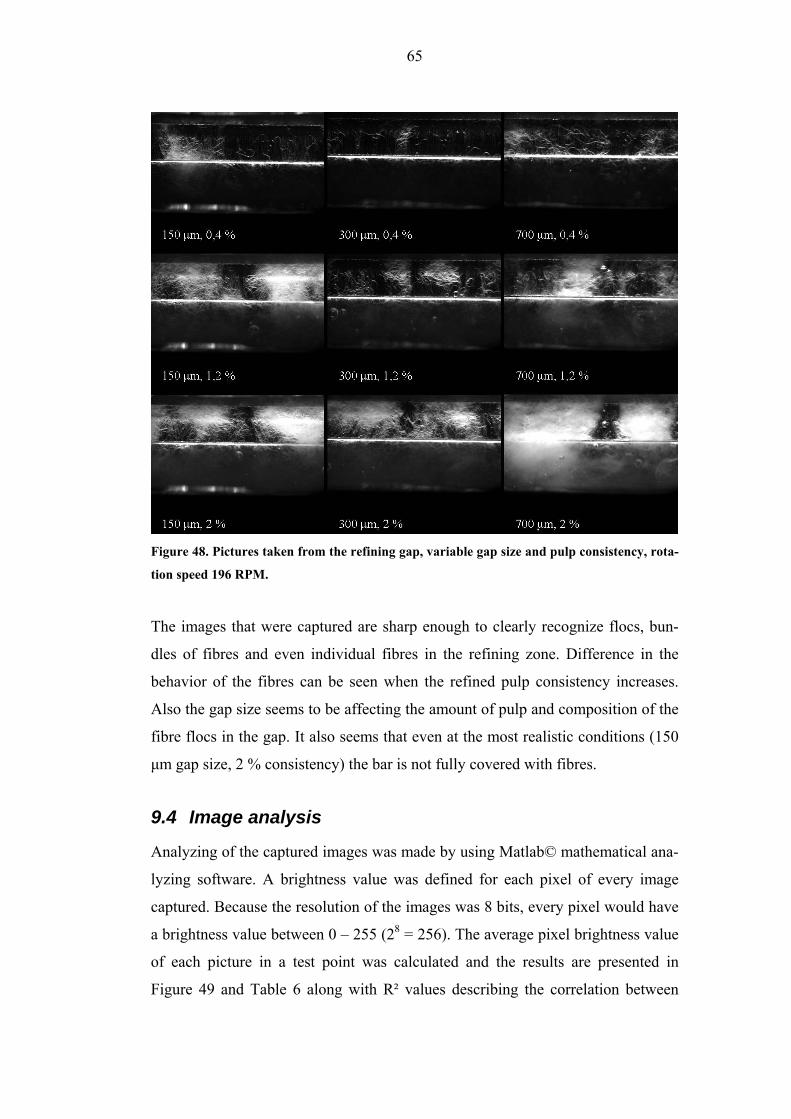
65
Figure 48. Pictures taken from the refining gap, variable gap size and pulp consistency, rota-
tion speed 196 RPM.
The images that were captured are sharp enough to clearly recognize flocs, bun-
dles of fibres and even individual fibres in the refining zone. Difference in the
behavior of the fibres can be seen when the refined pulp consistency increases.
Also the gap size seems to be affecting the amount of pulp and composition of the
fibre flocs in the gap. It also seems that even at the most realistic conditions (150
μm gap size, 2 % consistency) the bar is not fully covered with fibres.
9.4 Image analysis
Analyzing of the captured images was made by using Matlab© mathematical ana-
lyzing software. A brightness value was defined for each pixel of every image
captured. Because the resolution of the images was 8 bits, every pixel would have
a brightness value between 0 – 255 (28 = 256). The average pixel brightness value
of each picture in a test point was calculated and the results are presented in
Figure 49 and Table 6 along with R² values describing the correlation between

66
consistency of the refined pulp and the average pixel brightness values. Appendix
6 contains the measured values for each test point.
Brightness Value as a Function of Pulp Consistency and Gap Size
0
20
40
60
80
100
120
140
0,0 % 0,4 % 0,8 % 1,2 % 1,6 % 2,0 % 2,4 %
Pulp Consistency
Brig
htne
ss
0,15 mm 0,30 mm 0,70 mm
Figure 49. The average brightness values of the captured images as a function of pulp consis-
tency and gap size.
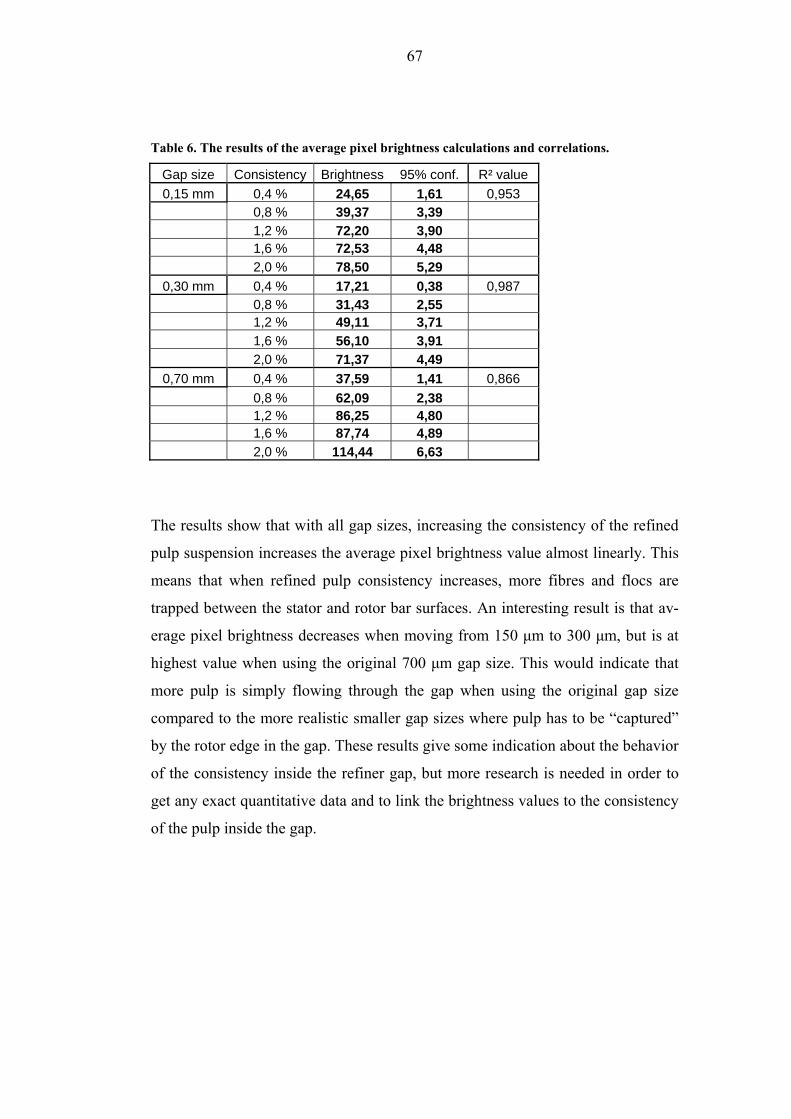
67
Table 6. The results of the average pixel brightness calculations and correlations.
Gap size Consistency Brightness 95% conf. R² value 0,15 mm 0,4 % 24,65 1,61 0,953
0,8 % 39,37 3,39 1,2 % 72,20 3,90 1,6 % 72,53 4,48 2,0 % 78,50 5,29
0,30 mm 0,4 % 17,21 0,38 0,987 0,8 % 31,43 2,55 1,2 % 49,11 3,71 1,6 % 56,10 3,91 2,0 % 71,37 4,49
0,70 mm 0,4 % 37,59 1,41 0,866 0,8 % 62,09 2,38 1,2 % 86,25 4,80 1,6 % 87,74 4,89 2,0 % 114,44 6,63
The results show that with all gap sizes, increasing the consistency of the refined
pulp suspension increases the average pixel brightness value almost linearly. This
means that when refined pulp consistency increases, more fibres and flocs are
trapped between the stator and rotor bar surfaces. An interesting result is that av-
erage pixel brightness decreases when moving from 150 μm to 300 μm, but is at
highest value when using the original 700 μm gap size. This would indicate that
more pulp is simply flowing through the gap when using the original gap size
compared to the more realistic smaller gap sizes where pulp has to be “captured”
by the rotor edge in the gap. These results give some indication about the behavior
of the consistency inside the refiner gap, but more research is needed in order to
get any exact quantitative data and to link the brightness values to the consistency
of the pulp inside the gap.

68
10 RECOMMENDED NEXT STEPS There are some proposals for future work with the Single Bar Refiner. The pre-
liminary testing should be continued with different types of pulps (e.g. hardwood
pulps) with higher consistencies to correspond with industrial scale low-
consistency refiners (c ≥ 3 %). The SBR station could also be upgraded with
measuring equipment to determine process conditions such as temperature or pulp
flow rate if monitoring or controlling these variables is considered necessary in
the future. A possibility to install a force sensor to be able to measure normal
force acting on the fibres in the refining gap should be studied thoroughly to in-
crease the understanding of refining forces leading to fibre deformation. The
measurement of normal force in connection with knowledge of the amount of pulp
in the gap would enable greatly improved analysis of forces affecting fibres.
The image analysis with its possibilities and limitations is also a potential area of
future research. Only preliminary trials with pine pulps and different refining gap
sizes were conducted to test the suitability of this type of image analysis for meas-
uring the pulp consistency inside the gap during surface-to-surface phase of the
refining phenomenon. The results from these trials indicate that there is a strong
correlation between pulp consistency and average pixel brightness values, but to
be able to determine the exact consistency of the pulp inside the gap would re-
quire some kind of calibration of the imaging system. Developing the tested meas-
urement method for defining the amount of pulp inside the gap could be one pos-
sible solution for the calibration problem. One target of this thesis was also to en-
able calculation of the fractional bar coverage in the refiner gap. This could be
possible by using image analysis, but a suitable mathematical analysis method
should be developed first.
69
11 CONCLUSIONS The target of this thesis work was to construct a laboratory scale low-consistency
refiner by modifying an existing design to enable more realistic refining condi-
tions. The aim of the modification is to be able to study the refining forces and
phenomena more closely. The designing and construction of a pulp flow system
for the refiner unit was also an important part of the thesis. Also the setup and
testing of a system for imaging fibres in the refining gap was realized.
The modification of the original design was made by designing a new stator bar
with a groove in it. The purpose of this groove was to create more realistic condi-
tions during refining. This design was first tested with the original stator bar by
machining a groove in it similar to the one in the rotor bar, and later constructing
two additional bars to reach the desired smaller gap size. The pulp flow system
was designed and constructed to enable even flow conditions for the refiner unit.
The installing and setup of the laser illuminated imaging system was conducted to
enable image capture of the refining phenomena.
Some problems were encountered during the modification of the stator bars. The
errors in measuring the original gap size resulted in wrong dimensioning of the
new stator parts. For this reason some modifications had to be made afterwards to
reach the targeted gap sizes. The pulp flow system was constructed without any
major issues, but problems with the refiner unit clogging when operating with
pulp consistencies > 2 % left some room for improvement. The imaging system
installation and preliminary trials were successful, resulting in some good images
from the gap between the rotor and stator bars. Images showed e.g. that bar cover-
age is clearly not 100 % at 2 % refining consistency, and that there is potential in
developing the image analysis method aiming to determine bar coverage and pulp
consistency in the gap. Many problems were solved during this thesis but many
questions are still unanswered. These include the installation of a force sensor for
measurement of normal force in the refiner gap and the development of image

70
analysis for further research. The target of the thesis work to construct a research
tool for refining studies was achieved.
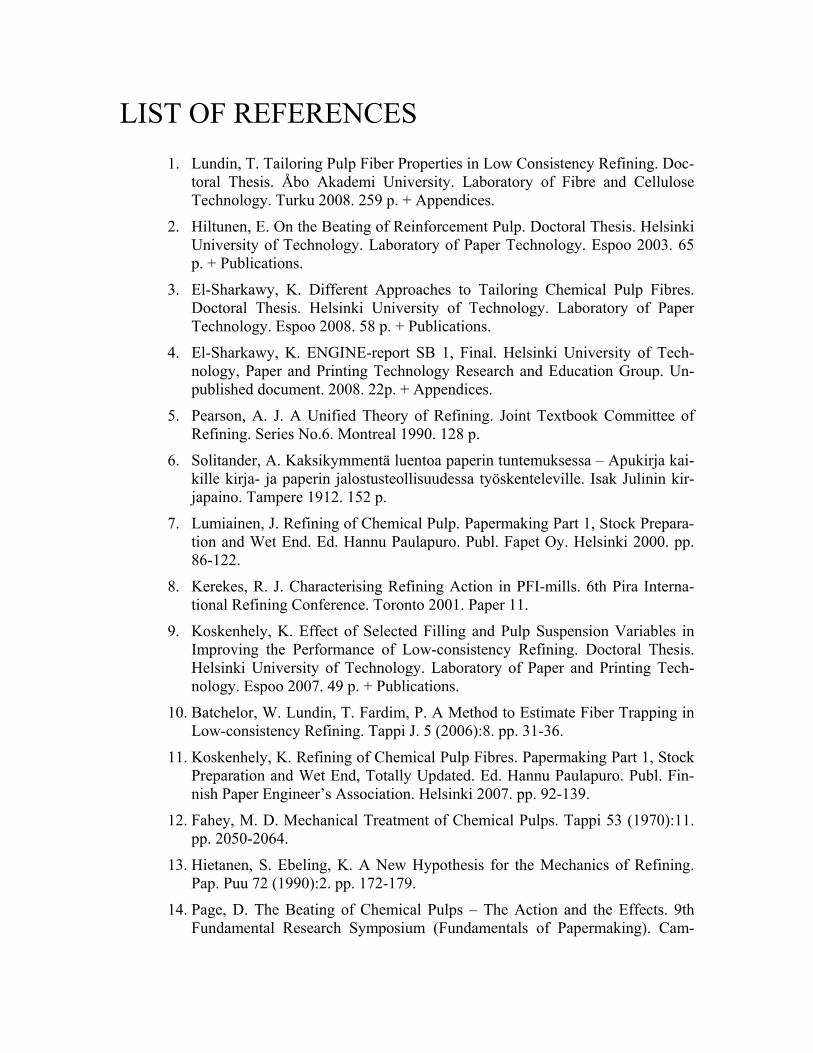
LIST OF REFERENCES 1. Lundin, T. Tailoring Pulp Fiber Properties in Low Consistency Refining. Doc-
toral Thesis. Åbo Akademi University. Laboratory of Fibre and Cellulose Technology. Turku 2008. 259 p. + Appendices.
2. Hiltunen, E. On the Beating of Reinforcement Pulp. Doctoral Thesis. Helsinki University of Technology. Laboratory of Paper Technology. Espoo 2003. 65 p. + Publications.
3. El-Sharkawy, K. Different Approaches to Tailoring Chemical Pulp Fibres. Doctoral Thesis. Helsinki University of Technology. Laboratory of Paper Technology. Espoo 2008. 58 p. + Publications.
4. El-Sharkawy, K. ENGINE-report SB 1, Final. Helsinki University of Tech-nology, Paper and Printing Technology Research and Education Group. Un-published document. 2008. 22p. + Appendices.
5. Pearson, A. J. A Unified Theory of Refining. Joint Textbook Committee of Refining. Series No.6. Montreal 1990. 128 p.
6. Solitander, A. Kaksikymmentä luentoa paperin tuntemuksessa – Apukirja kai-kille kirja- ja paperin jalostusteollisuudessa työskenteleville. Isak Julinin kir-japaino. Tampere 1912. 152 p.
7. Lumiainen, J. Refining of Chemical Pulp. Papermaking Part 1, Stock Prepara-tion and Wet End. Ed. Hannu Paulapuro. Publ. Fapet Oy. Helsinki 2000. pp. 86-122.
8. Kerekes, R. J. Characterising Refining Action in PFI-mills. 6th Pira Interna-tional Refining Conference. Toronto 2001. Paper 11.
9. Koskenhely, K. Effect of Selected Filling and Pulp Suspension Variables in Improving the Performance of Low-consistency Refining. Doctoral Thesis. Helsinki University of Technology. Laboratory of Paper and Printing Tech-nology. Espoo 2007. 49 p. + Publications.
10. Batchelor, W. Lundin, T. Fardim, P. A Method to Estimate Fiber Trapping in Low-consistency Refining. Tappi J. 5 (2006):8. pp. 31-36.
11. Koskenhely, K. Refining of Chemical Pulp Fibres. Papermaking Part 1, Stock Preparation and Wet End, Totally Updated. Ed. Hannu Paulapuro. Publ. Fin-nish Paper Engineer’s Association. Helsinki 2007. pp. 92-139.
12. Fahey, M. D. Mechanical Treatment of Chemical Pulps. Tappi 53 (1970):11. pp. 2050-2064.
13. Hietanen, S. Ebeling, K. A New Hypothesis for the Mechanics of Refining. Pap. Puu 72 (1990):2. pp. 172-179.
14. Page, D. The Beating of Chemical Pulps – The Action and the Effects. 9th Fundamental Research Symposium (Fundamentals of Papermaking). Cam-

bridge, UK. Sept 17-22 1989. Mechanical Engineering Publications Ltd 1989. Vol. 1 pp. 1-38.
15. Giertz, H. W. The Influence of Beating on Individual fibers and the Causal Ef-fects on Paper Properties. International Symposium on Fundamental Concepts of Refining. Appleton. Sept 16-18 1980. TAPPI Press 1980. pp. 87-92.
16. McIntosh, D. C. The Effect of Refining on the Structure of the Fibre Wall. Tappi 50 (1967):10. pp. 482-489.
17. Retulainen, E. Niskanen, K. Nilsen, N. Fibers and bonds. Paper Physics. Ed. Kaarlo Niskanen. Publ. Fapet Oy. Helsinki 1998. pp. 54-87.
18. Seth, R. S. Zero-span Tensile Strength of papermaking fibres. Pap. Puu 83 (2001):8. pp. 597-604.
19. Jagenberg, F. Das Holländergeschirr in Briefen an einen Papiermacher. 1887.
20. Brecht, W. A Method for Comparative Evaluation of Bar-equipped Beating Devices. Tappi 50 (1967):8. pp. 40A-44A.
21. Wultsch, F., Flucher, W. Der Escher-Wyss-Kleinrefeiner als Standard-Prufgerät für Moderne Stoffaufbereitungsanlagen. Papier 12 (1958):13/14. pp. 334-342.
22. Brecht, W. Siewert, W. H. Zur Theoretisch-technischen Beurteilung des Mahlprozesses Modern Mahlmaschinen. Papier 20 (1966):1. pp. 4-13.
23. Meltzer, F. P. Technologie der Zellstoffmahlung. Doctoral Thesis. RWTH Aachen University. Aachen, Germany 1994. 148p.
24. Roux, J-C. Bloch, J-F. Nortier, P. A Kinetic Model for Pulp Refining, Includ-ing the Angular Parameters of the Equipment. Appita J. 60 (2007):1 pp. 29-34.
25. Lumiainen, J. A New Approach to the Critical Factors Effecting Refining In-tensity and Refining Result in Low-consistency Refining. Papermakers Con-ference. Atlanta, USA. April 23-25 1990. Tappi press 1990. pp. 269-278.
26. Musselman, R. Letarte, D. Simard, R. Third Stage Low Consistency Refining of TMP for Energy Savings and Quality Enhancement. 4th Pira International Refining Conference. Fiuggu 1997. Leatherhead, UK 1997. pp. 141-147.
27. Hietanen, S. Ebeling, K. Fundamental Aspects of the Refining Process. Pap. Puu 72 (1990):2. pp. 158-170.
28. Lewis, J. Danforth, D. W. Stock Preparation Analysis. Tappi J. 45 (1962):3. pp.185-188.
29. Kerekes, R. J. Characterization of Pulp Refiners by a C-factor. Nord. Pulp Pap. Res. J. 5 (1990):1. pp. 3-8.
30. Hiltunen, E. Helsinki University of Technology. Personal communications. 2.7.2009.
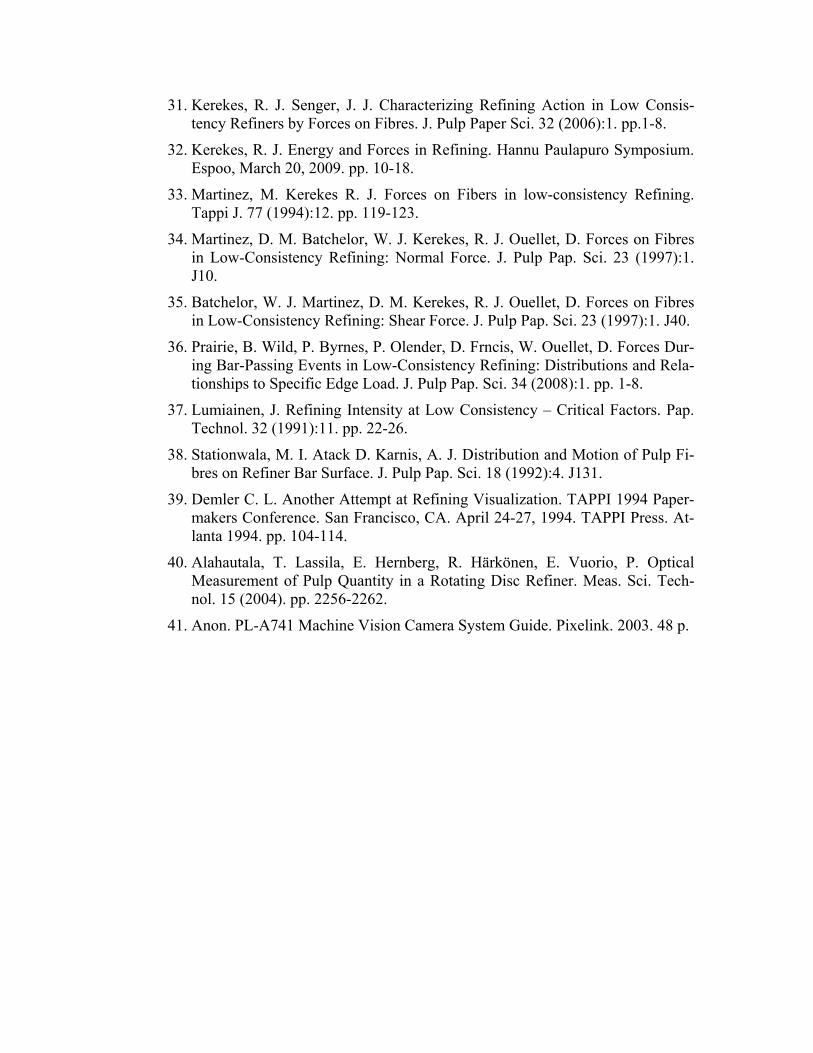
31. Kerekes, R. J. Senger, J. J. Characterizing Refining Action in Low Consis-tency Refiners by Forces on Fibres. J. Pulp Paper Sci. 32 (2006):1. pp.1-8.
32. Kerekes, R. J. Energy and Forces in Refining. Hannu Paulapuro Symposium. Espoo, March 20, 2009. pp. 10-18.
33. Martinez, M. Kerekes R. J. Forces on Fibers in low-consistency Refining. Tappi J. 77 (1994):12. pp. 119-123.
34. Martinez, D. M. Batchelor, W. J. Kerekes, R. J. Ouellet, D. Forces on Fibres in Low-Consistency Refining: Normal Force. J. Pulp Pap. Sci. 23 (1997):1. J10.
35. Batchelor, W. J. Martinez, D. M. Kerekes, R. J. Ouellet, D. Forces on Fibres in Low-Consistency Refining: Shear Force. J. Pulp Pap. Sci. 23 (1997):1. J40.
36. Prairie, B. Wild, P. Byrnes, P. Olender, D. Frncis, W. Ouellet, D. Forces Dur-ing Bar-Passing Events in Low-Consistency Refining: Distributions and Rela-tionships to Specific Edge Load. J. Pulp Pap. Sci. 34 (2008):1. pp. 1-8.
37. Lumiainen, J. Refining Intensity at Low Consistency – Critical Factors. Pap. Technol. 32 (1991):11. pp. 22-26.
38. Stationwala, M. I. Atack D. Karnis, A. J. Distribution and Motion of Pulp Fi-bres on Refiner Bar Surface. J. Pulp Pap. Sci. 18 (1992):4. J131.
39. Demler C. L. Another Attempt at Refining Visualization. TAPPI 1994 Paper-makers Conference. San Francisco, CA. April 24-27, 1994. TAPPI Press. At-lanta 1994. pp. 104-114.
40. Alahautala, T. Lassila, E. Hernberg, R. Härkönen, E. Vuorio, P. Optical Measurement of Pulp Quantity in a Rotating Disc Refiner. Meas. Sci. Tech-nol. 15 (2004). pp. 2256-2262.
41. Anon. PL-A741 Machine Vision Camera System Guide. Pixelink. 2003. 48 p.
APPENDIX 1
Figure 50. The dimensions of the stator bar acrylic part for 300 μm gap size.
APPENDIX 2
Figure 51. The dimensions of the stator bar stainless steel part for 300 μm gap size.
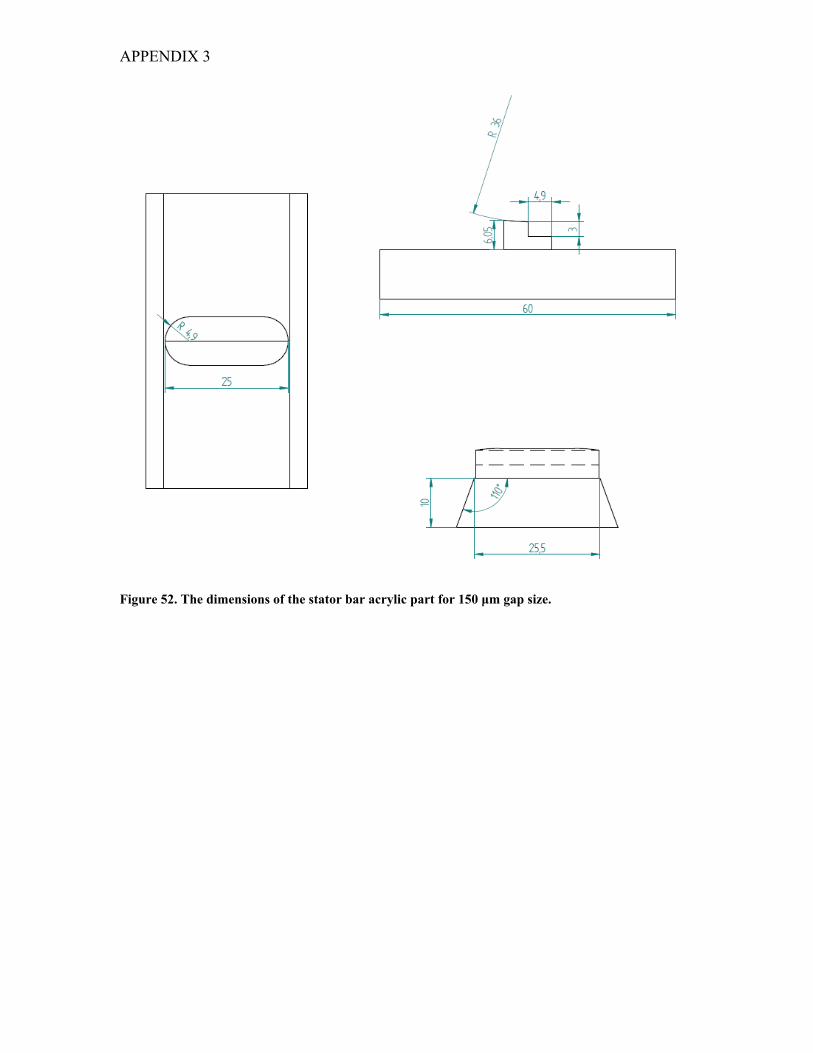
APPENDIX 3
Figure 52. The dimensions of the stator bar acrylic part for 150 μm gap size.
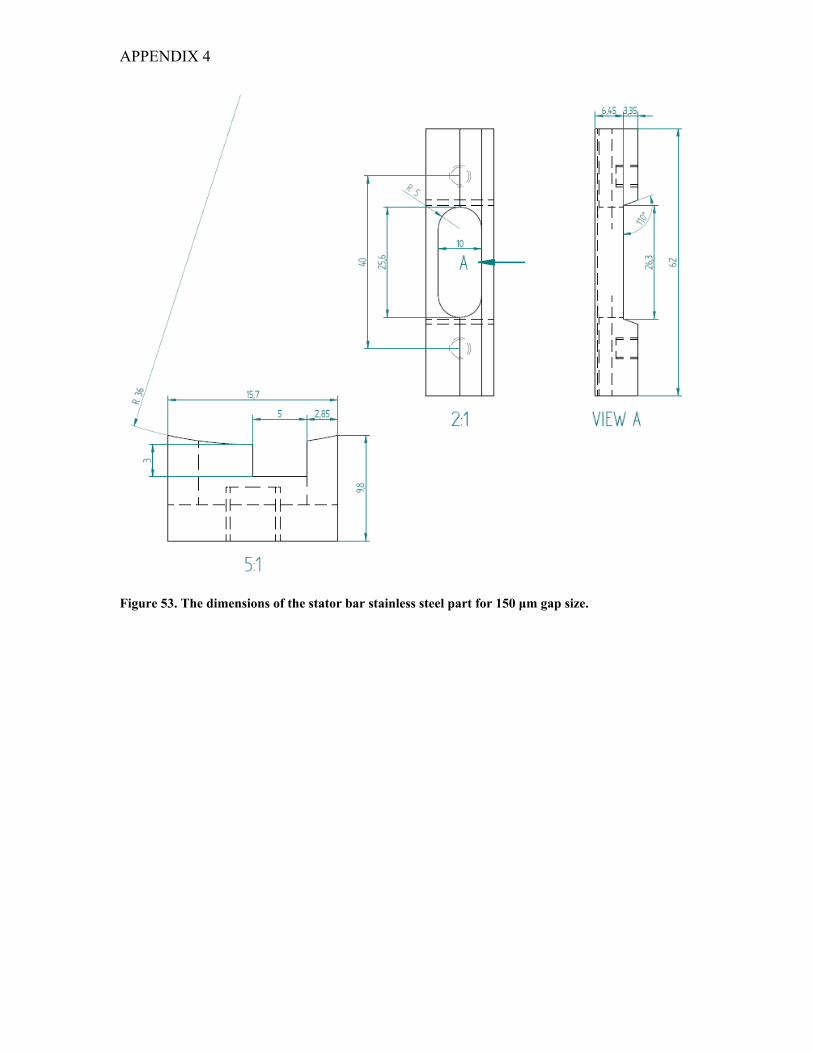
APPENDIX 4
Figure 53. The dimensions of the stator bar stainless steel part for 150 μm gap size.

APPENDIX 5
Figure 54. The tabs of the Pixelink image capture software showing the settings used in preliminary
trials.
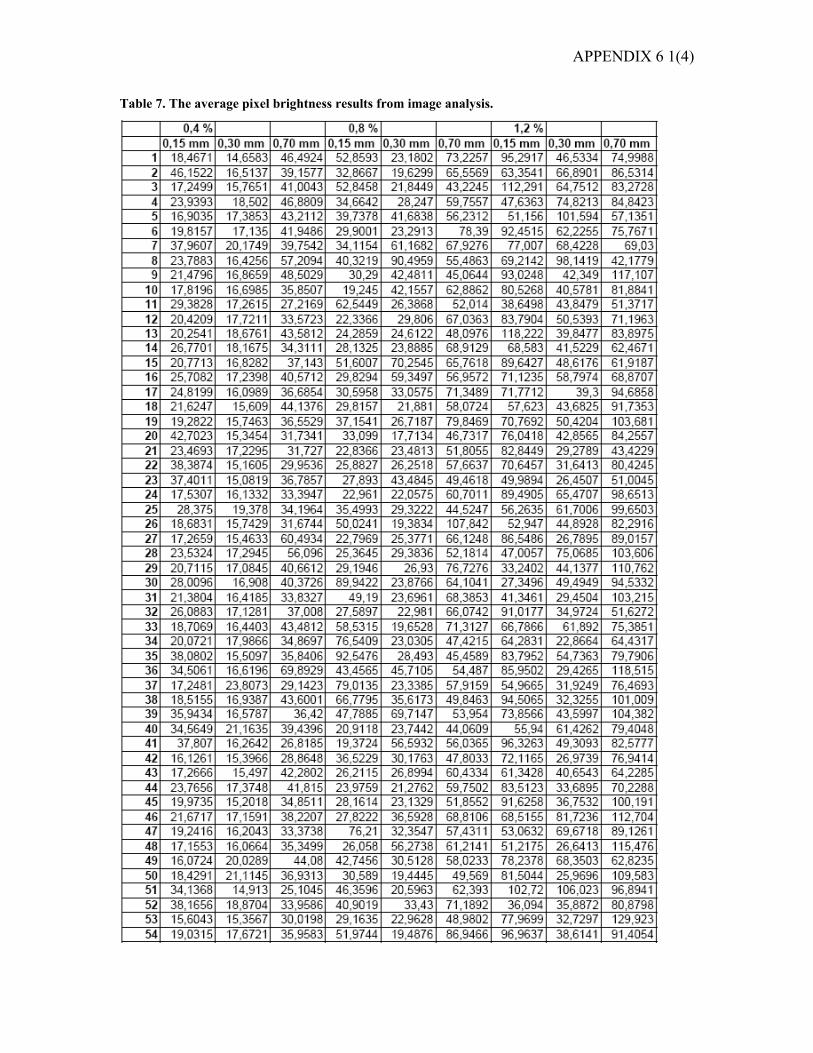
APPENDIX 6 1(4)
Table 7. The average pixel brightness results from image analysis.
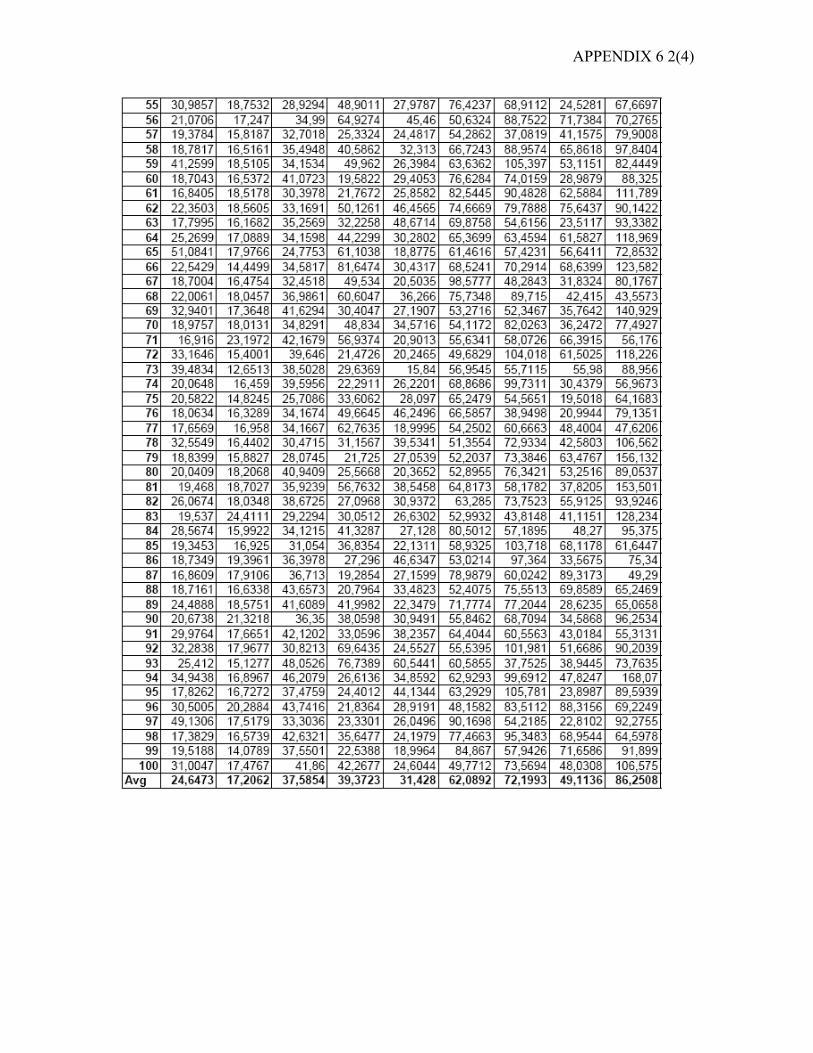
APPENDIX 6 2(4)
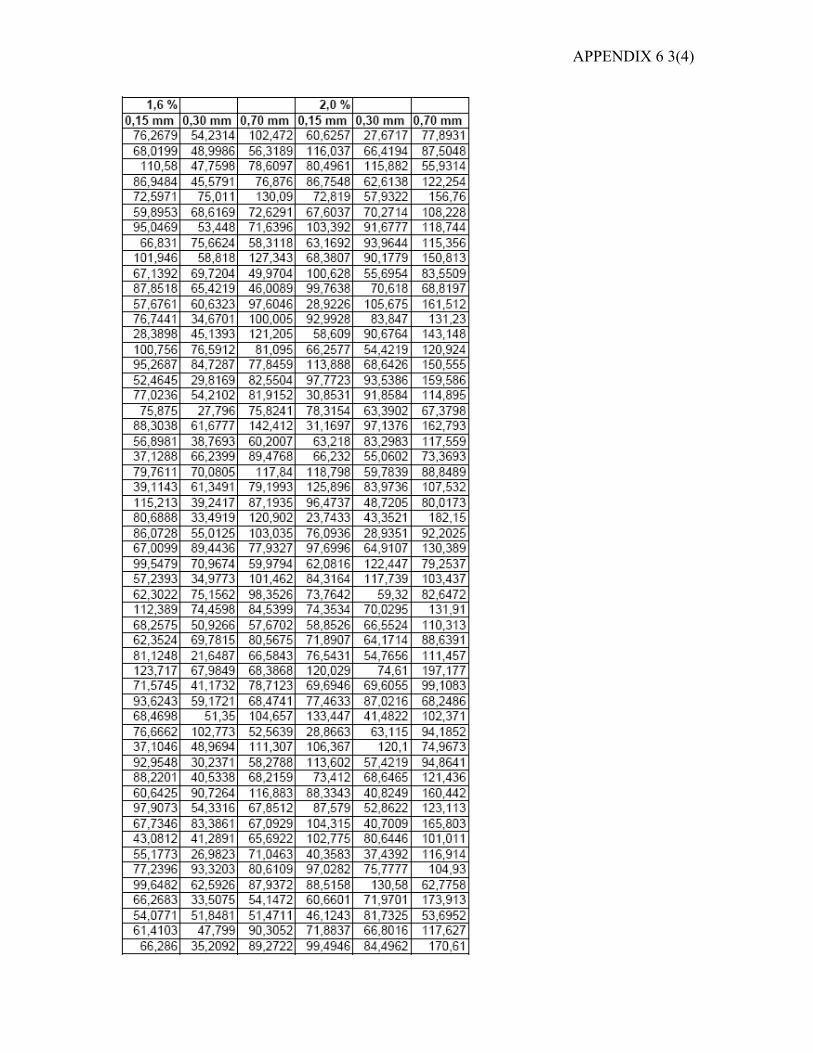
APPENDIX 6 3(4)
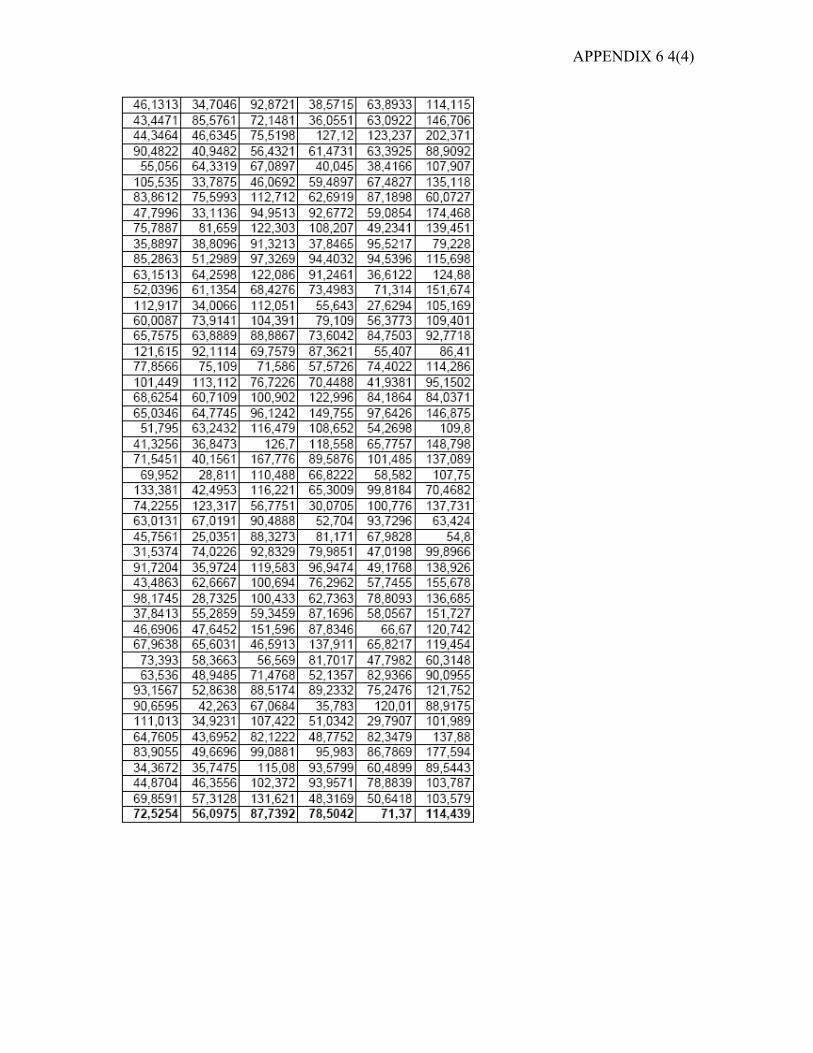
APPENDIX 6 4(4)


![ADA / ASR - gemu-group.com€¦ · ADA/ASR (A) = Standard Torques for single acting actuators - ASR [Nm] Type 3 bar 3.5 bar 4 bar 4.5 bar 5 bar 5.5 bar 6 bar (A) 6.5 bar 7 bar 8 bar](https://img.pdfslide.us/doc/110x75/6053620ca523dc211202bed4/ada-asr-gemu-groupcom-adaasr-a-standard-torques-for-single-acting-actuators.jpg)