Embed Size (px)
Citation preview

F 18 025
Examensarbete 15 hpJuni 2018
Construction of a Geiger counter
For cosmic radiation measurements in near
space conditions.
Carl TyskAnton OlssonElvira Brenner

Populärvetenskaplig sammanfattning
CIGS solceller är en ny typ av solcell som utvecklas påUppsala Universitet. De består av koppar,indium, gallium och selen som tillsammans bildar ett halvledarmaterial som har visat sig vara enväldigt effektiv ljusabsorbator. CIGS är så kallade tunnfilmssolceller, de kan tillverkas myckettunnare än många andra halvledarmaterial eftersom att deras absorbtionsförmåga är så hög.
Det är idag vanligt att rymdfarkoster och sateliter använder sig av solceller för att utvinnaelektricitet eftersomatt behovet av batterier dåminskar. Dock så innebär den kraftigare kosmiskastrålningen utanför atmosfären att solcellerna slits i en högre takt. Jämförs CIGS med dekonventionella kiselsolcellerna som finns på marknaden idag är de både lättare och billigare.Experiment har också visat att de är tåligare mot radioaktiv strålning. Dessa egenskaper gördem till väldigt lämpliga kandidater för rymdteknik. Om de är tåligare mot strålning är detmöjligt att minska hur mycket de behöver underhållas och repareras, vilket förstås är avsevärtsvårare och dyrare för farkoster som redan är i rymden. Minskas massan på solcellerna som skafästas på rymdfarkoster kan även bränslekostnaderna reduceras.
Det är svårt att veta hur stor potential CIGS solcellerna har inom rymdtekniken. Denkosmiska miljön är svår att simulera på jorden, och strålningspåverkan på CIGS solceller är ettaktivt forskningsämne. LODESTAR är ett projekt vars mål är att undersöka hur CIGS solcellerpåverkas av den kosmiska strålningen. Det är ett projekt inom det svensk-tyska programmetBEXUS som genomförs i samarbete med ESA. BEXUS ger universitetsstudenter möjlighetenatt sända upp egna experiment på en ballong från Esrange i Kiruna. LODESTAR kommer attgöra mätningar på solcellerna före, under och direkt efter färden. “Construction of a Geigercounter” är en del av LODESTAR-projektet. Vårt mål är att tillverka en strålningsmätare somkan mäta strålningen som solcellerna utsätts för. Då mätaren skall tåla en ballongfärd upp tillstratosfären måste den vara tålig. Inga kontakter i dess krets får lossna och den måste uthärdalåga temperaturer och låga tryck. Vid låga tryck finns det en risk att elektriska urladdningarsker, vilket skulle kunna vara ytterst destruktivt för hela experimentet.
1

Teknisk- naturvetenskaplig fakultet UTH-enheten Besöksadress: Ångströmlaboratoriet Lägerhyddsvägen 1 Hus 4, Plan 0 Postadress: Box 536 751 21 Uppsala Telefon: 018 – 471 30 03 Telefax: 018 – 471 30 00 Hemsida: http://www.teknat.uu.se/student
Abstract
Construction of a Geiger tube
Carl Tysk Anton Olsson Elvira Brenner
"Construction of a Geiger counter" is a project which aims to create a Geiger counter that is functional under near space conditions. It is a part of a bigger project called LODESTAR, which aims to measure how cosmic radiation affects CIGS solar cells. The counter will be used to measure how much radiation the solar cells get exposed to. The solar cells and the counter will be sent up on a balloon. The balloon will lift from Esrange in Kiruna and can reach an approximate altitude of 30 km. At this altitude the cosmic radiation can be approximated to consist of only high energy protons. The counter has to be able to detect these protons, at a rate of at least 40 counts per second. It also has to be small and lightweight. It is important that no cords come loose from its connections and that it can operate in the low temperatures it will encounter. The high voltages and low pressure might also cause electric discharges that can damage the circuit.
The Geiger-Müller counter consists of an Arduino Nano generating a square wave and a boost converter, stepping the voltage up to 400 V from the 12 V supply voltage. The 400V is needed for the Geiger-Müller tube to operate. Every detection the tube makes gets stored on the Arduino. When a discharge occurs in the circuit the recharge time is 500 microseconds, meaning the counter should be able to detect 2000 discharges per second. All components have been chosen so that they can operate for the high voltages and low temperatures.
Testing the Geiger-Müller counter showed that the circuit, which will be shielded inside a box during the balloon flight, could operate for temperatures down to -49$^{circ}$C, where -40$^{circ}$C is the expected temperature in the box in which it is placed. Furthermore, the tube could operate at temperatures down to -80$^{circ}$C, which is the lowest possible temperature that can be expected outside the box. A vacuum test showed that the circuit can operate for a pressure as low as 0.2 mBar. The expected pressure will be about 100 times greater. A radiation test showed that our tube could detect secondary radiation from a Am-241 radioactive source. It could not detect alpha radiation directly, but protons are much lighter than alpha particles so that will not be a problem. Simulations have shown that protons with an energy of 4 MeV or higher should be detected. The only protons that will pass through the plastic shielding covering the solar cells are those with an energy of 15 MeV or more. Therefore, the counter will be able to detect all the radiation that is potentially damaging the solar cells.
The Geiger-Müller counter constructed in this projects fulfills all the requirements stated in the beginning. This leads us to believe that the counter can measure the radiation in the LODESTAR project without breaking.
ISSN: 1401-5757, F 18 025Examinator: Martin SjödinÄmnesgranskare: Michelle Åhlén Handledare: Uwe Zimmerman
2

Contents1 Introduction 4
1.1 Background . . . . . . . . . . . . . . . . . . . . . . . . . . . . . . . . . . . . 41.2 Objective . . . . . . . . . . . . . . . . . . . . . . . . . . . . . . . . . . . . . 41.3 Theory . . . . . . . . . . . . . . . . . . . . . . . . . . . . . . . . . . . . . . . 4
1.3.1 Geiger-Müller tube . . . . . . . . . . . . . . . . . . . . . . . . . . . . 41.3.2 Electronic discharges . . . . . . . . . . . . . . . . . . . . . . . . . . . 61.3.3 Boost converter . . . . . . . . . . . . . . . . . . . . . . . . . . . . . . 8
2 Method 92.1 Work procedure . . . . . . . . . . . . . . . . . . . . . . . . . . . . . . . . . . 92.2 Arduino software . . . . . . . . . . . . . . . . . . . . . . . . . . . . . . . . . 122.3 Tests . . . . . . . . . . . . . . . . . . . . . . . . . . . . . . . . . . . . . . . . 13
2.3.1 Temperature test . . . . . . . . . . . . . . . . . . . . . . . . . . . . . 132.3.2 Pressure test . . . . . . . . . . . . . . . . . . . . . . . . . . . . . . . 132.3.3 Radiation measurement . . . . . . . . . . . . . . . . . . . . . . . . . . 14
3 Result 153.1 Temperature test . . . . . . . . . . . . . . . . . . . . . . . . . . . . . . . . . . 163.2 Pressure test . . . . . . . . . . . . . . . . . . . . . . . . . . . . . . . . . . . . 183.3 Radiation test . . . . . . . . . . . . . . . . . . . . . . . . . . . . . . . . . . . 18
4 Discussion 19
5 Conclusion 20
3
1 Introduction
1.1 BackgroundThe BEXUS program is realized under a bilateral Agency Agreement between the GermanAerospace Center (DLR), Swedish National Space Board (SNSB) and the European SpaceAgency (ESA). The program allows students to carry out scientific and technological experi-ments on balloons. The balloon can reach a maximum altitude of 30 km and will fly for 2-5hours. [1]
LODESTAR is one of the experiments scheduled to fly on the BEXUS balloon flight inOctober 2018. The objective of the experiment is to investigate the effects of cosmic radiationon CIGS solar cells. [2] To measure the radiation the solar cells gets exposed to a radiationmeasurement unit has to be installed. The experiment will launch from Esrange in Kiruna andreach an altitude of approximately 27 km. A research made over Murmansk showed that thecosmic radiation at the altitude mostly consists of high energy protons. [3] Since Murmansk isgeographically close to Kiruna the cosmic ray spectrum can be approximated to only consist ofprotons.
1.2 ObjectiveThe task is to design a Geiger counter that can be sent up on a balloon to measure the highenergy protons. It should be small and lightweight to fit in the module that is being sent up. It isimportant that no wires lose contact during the flight. Also, it has to be able to endure the harshexternal conditions, the low temperature and pressure. In high voltage systems spontaneousdischarges can occur, especially in low pressure environments. The counter must be constructedin a way so that these discharges do not happen.
One request from the LODESTAR project is that the counter can send data to an ArduinoMega using I2C communication. The counter should also have a function to be turned off andon by command from the Arduino Mega. The radiation dosage should be displayed by diodeswhere a higher intensity results in a higher number of diodes being lit.
More specifically, the circuit should, according to simulations, at lowest have to endure-20◦C but -40◦C is the requirement that is set so that there is a safety margin. The pressurethat is expected is about 20 mBar but the circuit will be tested down to 0.2mBar. The Geigercounter should be able to detect at least 40 detections per second.
1.3 Theory1.3.1 Geiger-Müller tube
In a Geiger counter there is a Geiger-Müller tube detecting the radiation. Geiger-Müller tubesneed a high voltage to operate. The tube consists of a chamber containing two electrodes and apotential difference of several hundred volts. The chamber is filled with a gas at a low pressure.A charged particle passing through the gas causes excited and ionized molecules along its path.A neutral molecule being ionized results in a positive ion and a free, negatively charged electron:an ion pair. Due to the high voltage there is a strong electric field accelerating the positive ionstowards the cathode and the electrons towards the anode. Free electrons close to the anode gainsufficient energy to ionize more gas molecules due to a stronger electric field. This creates a
4

large number of electron avalanches, meaning the tube can produce a significant output pulsefrom a single original ionizing event. This phenomenon is called Townsend avalanche. [7]Different tubes were considered for the experiment. However, the STS-5 Geiger-Müller tubehas, for this experiment, overall the best properties and was therefore chosen. From an economicperspective it was cheap. According to its data sheet it can function down to -40◦C and it hasbeen used in a previous experiment measuring cosmic radiation in space. [8] The walls ofthe STS-5 consist of 50µm thick stainless steel. [9] The National Institute of Standards andTechnology (NIST), provides tabulated values for the range of protons in Iron, given in g/cm2.[10] Since stainless steel mainly consists of iron and has a similar density it is approximatedthat stainless steel have similar proton blocking abilities as iron. Figure 1 shows the range fromNIST divided by the density of the walls in the Geiger tube, the wall thickness is marked by ared line in the figure. From this we can estimate that the minimum energy needed by a proton toionize the tube is 4 MeV. SRIM is a free software used to calculate range and stopping power inmatter. [11] Figure 2 shows the calculated predicted path of 2000 hydrogen ions with an energyof 4 MeV entering into stainless steel simulated with the SRIM software. There are only a fewstray ions not managing to reach 50 µm into the stainless steel showing that the estimation usedin figure 1 is valid. The energy needed for a proton to penetrate the plastic shielding used onthe CIGS solar cells during the LODESTAR experiment is estimated to 15 MeV, this means theSTS-5 is sensitive enough to measure the relevant radiation.
Figure 1: Approximate range of protons with different kinetic energies in stainless steel.
5

Figure 2: Simulated path of 2000 H ions with 4 MeV energy projected in stainless steel.
1.3.2 Electronic discharges
In high voltage systems spontaneous discharges can occur. This happens when the strength ofthe potential gradient from a conductors surface is stronger than the dielectric strength of the airsurrounding it. If this happens then the air itself becomes ionized thus letting a current flow outof the conductor into the air, this phenomenom is called Corona discharge or the Corona effect.The dielectric strength of the air decreases when the pressure drops meaning this becomes evenmore important in low pressure conditions. Corona discharge may cause efficiency losses andit is undesired in most circuits. The maximum distance between two conductors with a certainpotential that may cause Corona effect can be expressed with Peek’s law,
d = reVC
mvgvr . (1)
Where d is the maximum distance between the electrodes, VC is the voltage, r is the radius ofthe conductors, mv is a surface irregularity factor, gv is the critical electric field that depends onthe density of the gas. [4] A plot of Peek’s law with the conditions we expect for our experimentcan be seen in figure 3. From this graph we can see that for a 500 V potential the maximumdistance between two electrodes to cause Corona discharge is approximately 2.8 mm. In theactual circuit the highest voltage will be about 400 V which will mean that the conductors canbe closer without causing corona but we choose to use 500 V for calculations as a safety margin.
6

Figure 3: Maximum distance between conductors which may cause a Corona discharge overvoltage according to Peek’s law.
If the electric potential in the surrounding air becomes even greater a discharge between twoelectrodes can occur. This can damage other components in a circuit or cause physical harm.The voltage needed between two conductors can be calculated using Paschen’s law,
VB =Bpd
ln(Apd) − ln(ln(1 + 1γse ))
. (2)
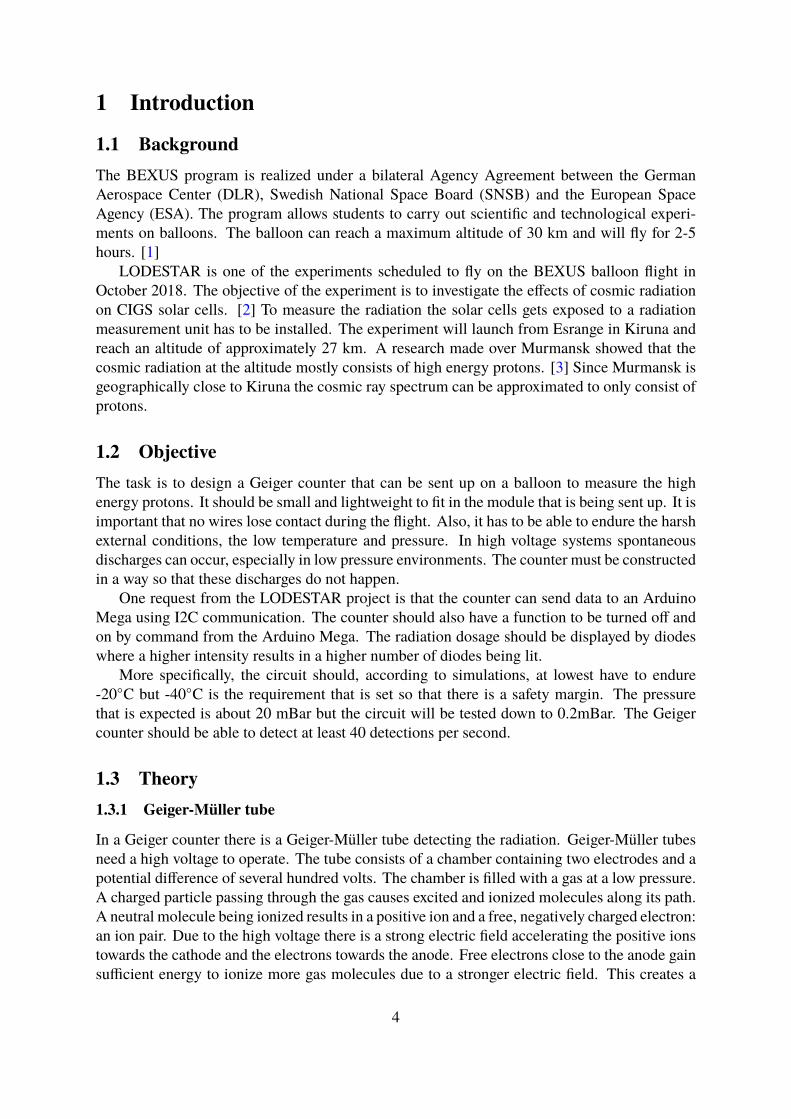
Here,VB is the breakdown voltage e.g. the voltage needed to cause a discharge, p is the pressure,d is the distance between the electrodes. [5] A, B and γse are related to the ionization energiesin the gas and the number of emitted electrons from an ionization, these can be difficult todetermine for different conditions. In figure 4 we can see the Paschen curve plotted for air at20 degrees Celsius and with different values for the product of p and d. From the figure we canapproximate for a 500 V potential, that the maximum product of pd needed to initiate a dischargeis 35 mTorr m, this equals 4666 mm Pa. The pressure at 25 km altitude is approximately 1.76kPa which means that the maximum distance between two conductors that can cause a dischargeis approximately 2.6 mm.
7
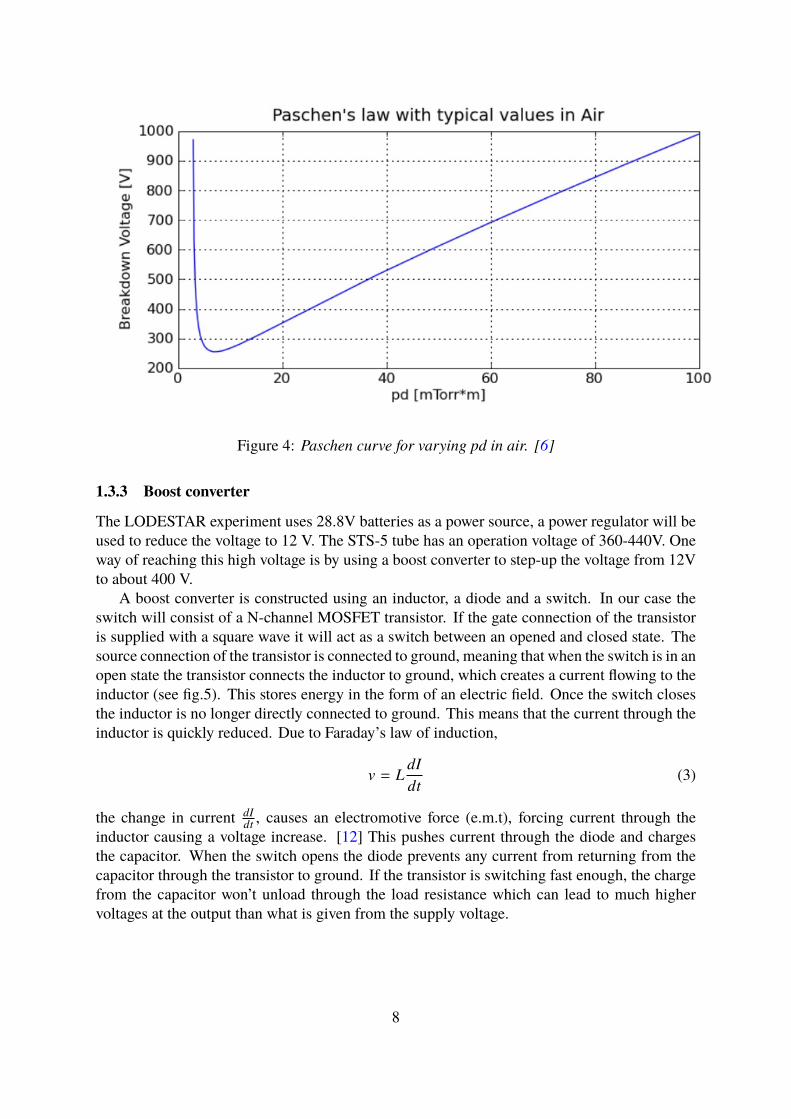
Figure 4: Paschen curve for varying pd in air. [6]
1.3.3 Boost converter
The LODESTAR experiment uses 28.8V batteries as a power source, a power regulator will beused to reduce the voltage to 12 V. The STS-5 tube has an operation voltage of 360-440V. Oneway of reaching this high voltage is by using a boost converter to step-up the voltage from 12Vto about 400 V.
A boost converter is constructed using an inductor, a diode and a switch. In our case theswitch will consist of a N-channel MOSFET transistor. If the gate connection of the transistoris supplied with a square wave it will act as a switch between an opened and closed state. Thesource connection of the transistor is connected to ground, meaning that when the switch is in anopen state the transistor connects the inductor to ground, which creates a current flowing to theinductor (see fig.5). This stores energy in the form of an electric field. Once the switch closesthe inductor is no longer directly connected to ground. This means that the current through theinductor is quickly reduced. Due to Faraday’s law of induction,
v = LdIdt
(3)
the change in current dIdt , causes an electromotive force (e.m.t), forcing current through the
inductor causing a voltage increase. [12] This pushes current through the diode and chargesthe capacitor. When the switch opens the diode prevents any current from returning from thecapacitor through the transistor to ground. If the transistor is switching fast enough, the chargefrom the capacitor won’t unload through the load resistance which can lead to much highervoltages at the output than what is given from the supply voltage.
8

Figure 5: Different states of a boost converter cycle [13].
2 Method
2.1 Work procedureTo collect and store data some kind of microcontroller was needed. An Arduino Nano waschosen for this since it is cheap, not hard to find and relatively easy to program. The C basedprogramming language is easy to use with a lot of preprogrammed functions. The switch inthe boost converter, a MOSFET transistor, needs a square wave connected to its gate. At first aWien bridge oscillator was used but it was later replaced with the Arduino using the function.analogWrite. Changing the frequency of the square wave was much easier with the Arduino,since it could be done through software changes. For the oscillator resistors and capacitors hadto be removed and replaced which was far more time consuming. Also, the oscillator can onlygenerate a square wave which is half on half off but the Arduino can vary the duty cycle, givingmore control over the voltage. A circuit was simulated in LT-spice, connecting the square wavecreated by the Arduino to the gate of the a MOSFET transistor in the boost converter. The boostconverter then steps the voltage up to 400 V. A capacitor was used replacing the Geiger-Müllertube and large resistors were used to keep the current low. The part to the right in the circuit, seefigure 7, is a signal processing part connected to the Arduino. The capactitors keeps the outputsignal clean and the Arduino registers pulses from particles striking the tube. The output signalis 5V, when a discharge occurs in the Geiger-Müller tube it drops to 0 V. For every drop in theoutput voltage a variable counting them increases by one. The radiation can then be read fromthe Arduino in counts per minute.
9

Figure 6: Circuit diagram over the Geiger-Müller counter
A feedback loop was added by making a voltage divider that lowered the voltage to a level read-able by the Arduino. This ensured that the voltage over the Geiger-Müller tube would remainat 400 V even if some components were altered due to change in temperature. By varying theduty cycle of the square wave the circuit can be controlled easily by just making some minorchanges in the code for the Arduino. The circuit was then built on a breadbord. Since parts ofthe circuit handle high voltages a few special components were needed. Table 1 shows a list ofcomponents and a motivation as to why the component was chosen. Since the Geiger counterneed to be able to work in low pressures electrolytic capacitors need to be avoided since theycontain a liquid that can boil if the pressure becomes to low. Only ceramic capacitors were usedbecause of this.
10

Table 1. List of components
Component Placement MotivationST6NK60Z MOSFET Input of boost converter Able to switch high voltages(600 V)
transistor while remaining a small size,fast switching speed.
UF4007 Diode Diode in boost converter High breakdown voltage(1000 V),fast switching speed.
High voltage capacitors Capacitors in boost converter Able of handling high voltages(2000 V), ceramic capacitors.
22 mH Inductor Inductor in boost converter Large inductor lowers the currentneeded to step up voltage.
2N3904 BJT Pulse detection High availabilityCapacitors Capacitors not Ceramic capacitors.
in boost converterResistors Full circuit Resistors with low temperature
coefficient.
After the circuit worked properly on the breadboard the making of the printed circuit board(PCB) started. The circuit was drawn in KiCad and the design was printed on glossy transferpaper. The reason why the PCB was designed in KiCad was that it is user-friendly and it isrelatively simple to transfer the schematic onto an actual copper board. The PCB board waspassed through a laminator with the printed design and the paper residue was scrubbed off. Toetch the PCB sodidum persulfate was mixed with warm water. A heating rod kept the waterwarm while a rack kept the PCB in a standing position in the solution. Sodium persulfate ishighly oxidizing and dissolves copper to copper sulphate. To finish the PCB holes were drilledand components were soldered on. The legs of the N-channel MOSFET and the high voltagecapacitors was insulated with heat-shrink tubing to avoid electronic discharges. The finishedPCB was tested to see if it functioned properly.
Figure 7: The making of the PCB
11

2.2 Arduino softwareA few different functions are needed by the Arduino Nano. First, the Arduino needs to generatea square wave as input to the boost converter, this was accomplished by using the analogWritefunction. This uses a method called pulse width modulation (PWM) and generates a squarewave from an analog pin with a duty cycle between 0 and 255, where 0 gives a logical zeroand 255 gives a logical one. The Arduino has a clock frequency of 62.5 kHz and by defaultthe analogWrite function has a frequency of the clock frequency divided by 64 resulting in 980Hz. The boost converter needs a higher frequency to step up the voltage so the PWM frequencywas changed to the clocking frequency divided by 16, resulting in a frequency of 7.8 kHz. Thishas some unwanted side effects causing the time measurements of the Arduino system to run8 times faster than normal. This has to be counteracted by multiplying all uses of the timefunction millis and the delay function delay by a factor eight. The duty cycle of the PWM haveto be adapted to maintain a constant voltage since components characteristics may change due tochanges in temperature and pressure. The Arduino reads the voltage at the Geiger tube with thefunction analogRead wich returns a value between 0 and 1023 where a 0 represents 0 volts and1023 represents 5 volts. The Arduino library PID was the used to regulate the signal, this usesPID regulation to adapt the voltage in the feedback loop by altering the duty cycle. DifferentPID settings were tested and the settings found to give the best results was setting the derivativepart, Kd , to zero and the integral part, Ki to 1 and the proportional part, Kp to 0.1. Since onlysmall regulations are expected once the system reaches the target voltage it is reasonable that theintegral part is the dominant since avoiding static errors are of higher priority than regulationspeed.
Next the Arduino have to count the number of ionizations in the Geiger tube. This was doneby implementing an Interrupt Service Protocol (ISP) with the Arduino function attachInterrupt.The ISP is prioritized above all other commands in the Arduino, and is activated when a changeis detected on a digital pin. In our case the interrupt is activated when the signal on thedesignated pin switches from a logical one to a logical zero. When the interrupt is activated aInterrupt Service Routine (ISR) runs to perform actions wanted. The ISR countPulse registersan ionization by adding a one to two variables of int type, one of the variables are reset everyminute and the other every second to enable the counts per minute and counts per second to beobtainable. When implementing the ISP some trouble with doubling were encountered, whichmeans every pulse where counted twice. To avoid this a time check was added, only makingone pulse each 500 microseconds possible. The Arduino software uses a continuous loop whichrepeatedly iterates its content. Inside the loop the Arduino checks if one minute has elapsedsince its last reading, if that is the case then the number of counts are saved as an int namedcountsPerMinute and the count is reset. The same procedure is performed for the counts persecond.
The Arduino Nano also needs to be able to communicate with an Arduino Mega over an I2Cbus. This is accomplished by using the Wire library in Arduino. The Arduino Nano operatesas a slave and it is assigned an address in the bus. The Arduino Mega operates as a master andcan send a request for informaion or send information to the Nano. When the Mega requestsinformation the int countsPerMinute is sent over the I2C bus. The bus can only handle byte sizeinformation and an int normally consists of two bytes. So the int has to be separated. This ismanaged easily with Arduino’s functions highByte and lowByte. highByte returns the leftmostbyte of the integer and lowByte returns the rightmost byte. The Mega may also send commands
12

to the Nano which requires the Nano to start or stop the voltage supply for the Geiger-Müllertube. The mega sends one byte of information. If that byte is a one, the PID regulator is turnedoff and the duty cycle is set to zero, thus lowering the voltage to the supply voltage 12 volts. Ifthe Mega sends a zero then the PID is turned back on and the voltage is resumed.
The int countsPerSecond is used to control four LED diodes indicating the amount of radi-ation measured by the unit. If the value exceeds a threshold value a certain amount of diodesare lit, this is controlled by the function ledVar. The full code can be seen in the appendix.
2.3 Tests2.3.1 Temperature test
A requirement to send the constellation with the Bexus balloon is that our circuit has to be ableto operate for temperatures as low as -40◦C and our Geiger-Müller tube -80◦C. Two temperaturetests were done. In the first one the circuit and a radioactive Thorium source were placedtogether with a nitrogen gas supply in a freezer. The nitrogen is used to reduce the humidityand the formation of ice crystals. The freezer started at room temperature and as it was cooleddown measurements were done continuously every time the temperature had decreased withabout 10◦C. Five measurements were done at each temperature of interest and an average wascalculated along with the standard deviation. The circuit was cooled down to -80◦C. When thetemperature reached -37◦C the voltage over the Geiger tube was increased from 400 V to 425V to counteract a loss of data.
In the second test a new STS-5 tube was used and the electric circuit was placed outside ofthe freezer and only the Geiger-Müller tube and the Thorium source were placed inside. In thisexperiment no nitrogen gas was used. The freezer started at room temperature and the tube wascooled down to -80◦C. Measurements were done continuously every time the temperature haddropped with about 10◦C.
2.3.2 Pressure test
The circuit has to be able to operate low pressures, a requirement was 20 mBar. The circuit wasplaced in a vacuum chamber together with a radioactive Thorium source. To see if the circuitworked in there two LED-lights were connected. One light was on as long as the voltage overthe tube stayed at 400V and the other was on as long as the counter measured over 5 countsper second. The pressure in the chamber decreased until it got to 0.2 mBar. Then a vault wasopened to let air back in and the pressure increased to normal atmospheric pressure.
13

Figure 8: The setup for the pressure test.
2.3.3 Radiation measurement
The radiation from an americium-241 source with an intensity of 370 kBq was measured. TheAm-241 emits mainly alpha-radiation but also secondary radiation like gamma radiation.[15]The Geiger-Müller tube was placed so that it touched the source and the radiation count wasmeasured in counts per minute (CPM). Five measurements were done and an average wascalculated. In the same way the source was measured at a distance of 2 cm, 4 cm and 8cm. The same measurements were done using a RAM GENE-1 Meter and a Mini-InstrumentsMini-Monitor G M Meter Type 510. The RAM GENE-1 Meter had a mica window coveringits radiation detector instead of metal walls, enabling heavier particles to pass through. Thebackground radiation was measured for all three measurement devices with the Am-241 sourceplaced behind thick blocks of lead. The measured CPM was divided by the cross sectional areaof the instrument used for the measurement.
Figure 9: The setup for the radiation measurement test using our Geiger-Müller counter (left),RAM GENE-1 (middle) and Mini-Monitor G M Meter (right)
14

3 ResultThe finished product is a Geiger-Müller counter shown in figure 10. It can detect backgroundradiation in a room, and also secondary radiation from a thorium source. Looking at a registeredpulse in an oscilloscope the recharge time could be measured to 500 µs see figure 11, meaningthe theoretical limit of counts the counter could detect is 2000 counts per second.
Figure 10: The finished product
15
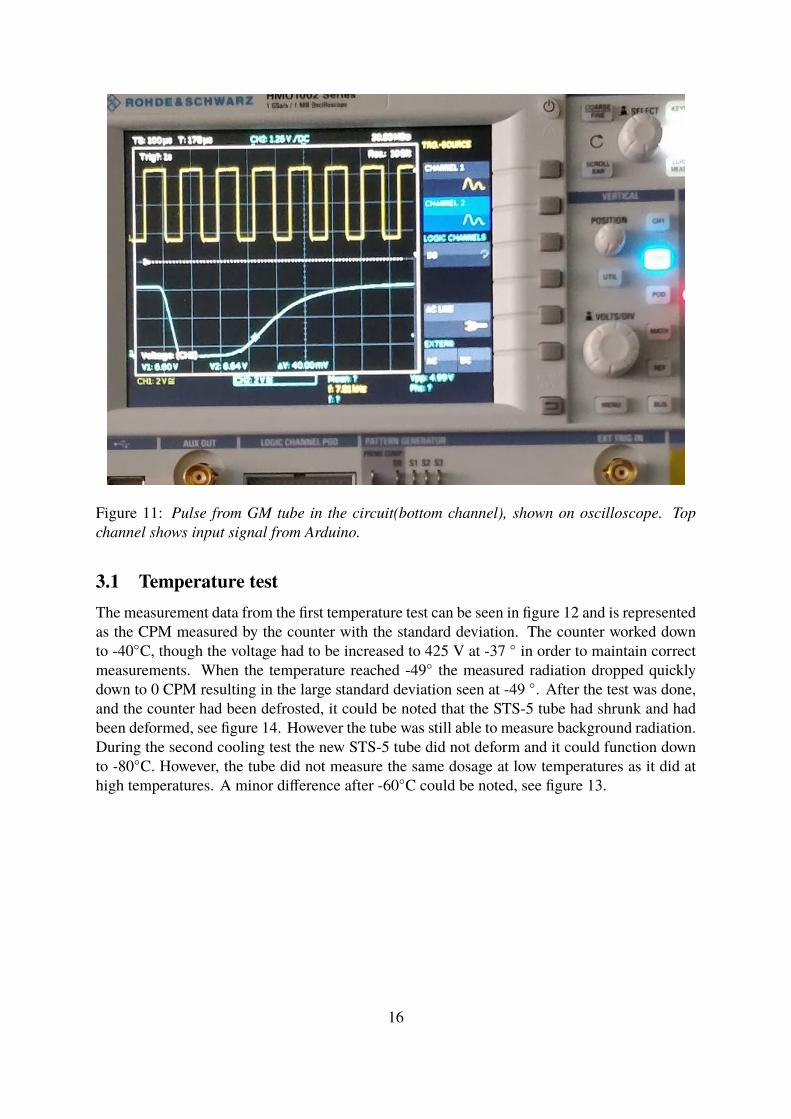
Figure 11: Pulse from GM tube in the circuit(bottom channel), shown on oscilloscope. Topchannel shows input signal from Arduino.
3.1 Temperature testThe measurement data from the first temperature test can be seen in figure 12 and is representedas the CPM measured by the counter with the standard deviation. The counter worked downto -40◦C, though the voltage had to be increased to 425 V at -37 ◦ in order to maintain correctmeasurements. When the temperature reached -49◦ the measured radiation dropped quicklydown to 0 CPM resulting in the large standard deviation seen at -49 ◦. After the test was done,and the counter had been defrosted, it could be noted that the STS-5 tube had shrunk and hadbeen deformed, see figure 14. However the tube was still able to measure background radiation.During the second cooling test the new STS-5 tube did not deform and it could function downto -80◦C. However, the tube did not measure the same dosage at low temperatures as it did athigh temperatures. A minor difference after -60◦C could be noted, see figure 13.
16
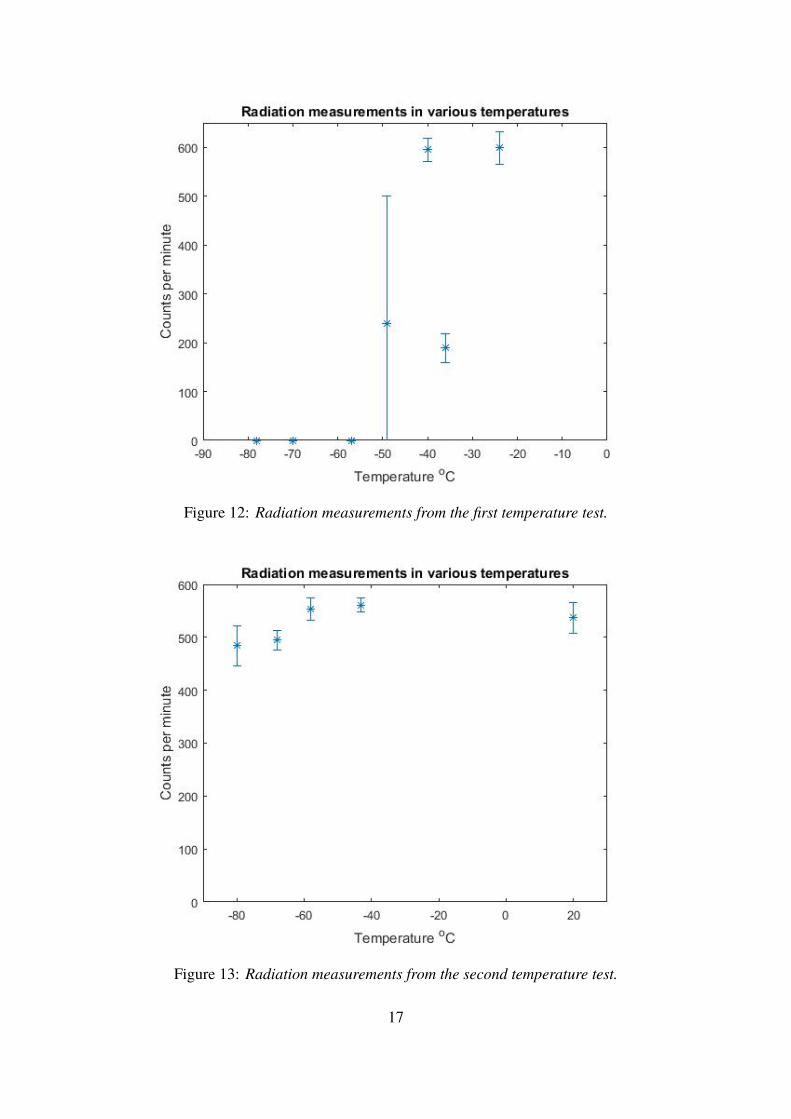
Figure 12: Radiation measurements from the first temperature test.
Figure 13: Radiation measurements from the second temperature test.
17
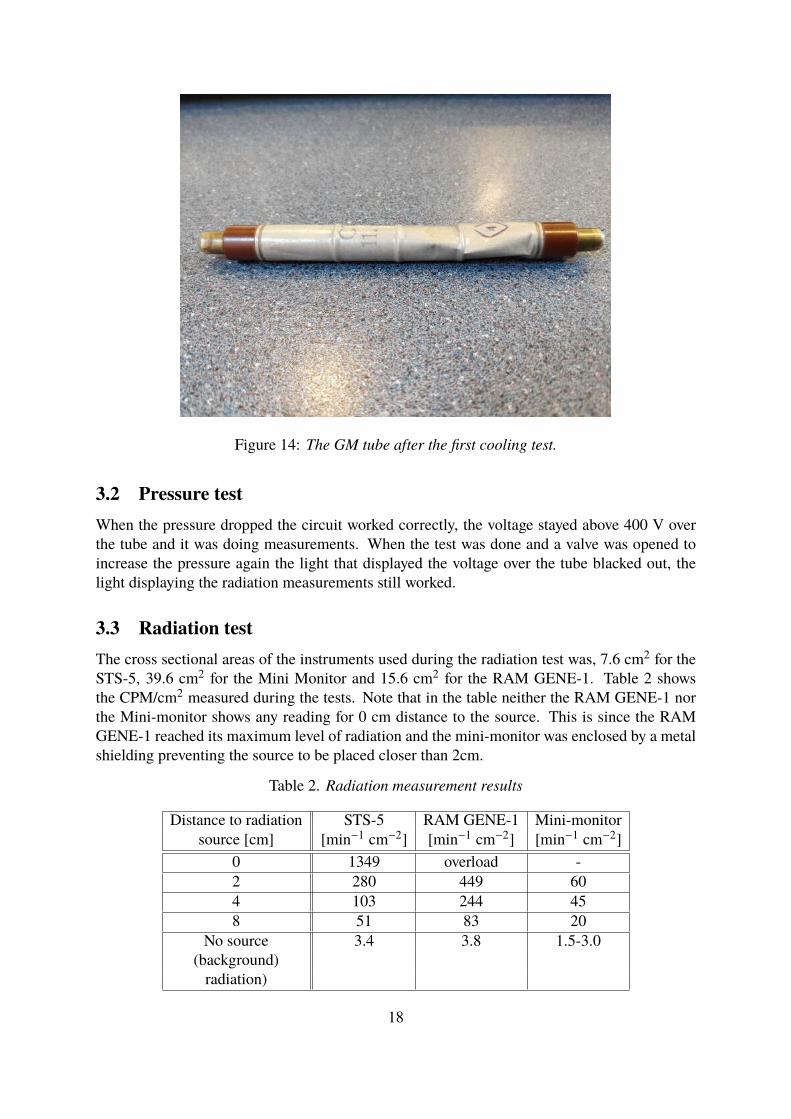
Figure 14: The GM tube after the first cooling test.
3.2 Pressure testWhen the pressure dropped the circuit worked correctly, the voltage stayed above 400 V overthe tube and it was doing measurements. When the test was done and a valve was opened toincrease the pressure again the light that displayed the voltage over the tube blacked out, thelight displaying the radiation measurements still worked.
3.3 Radiation testThe cross sectional areas of the instruments used during the radiation test was, 7.6 cm2 for theSTS-5, 39.6 cm2 for the Mini Monitor and 15.6 cm2 for the RAM GENE-1. Table 2 showsthe CPM/cm2 measured during the tests. Note that in the table neither the RAM GENE-1 northe Mini-monitor shows any reading for 0 cm distance to the source. This is since the RAMGENE-1 reached its maximum level of radiation and the mini-monitor was enclosed by a metalshielding preventing the source to be placed closer than 2cm.
Table 2. Radiation measurement results
Distance to radiation STS-5 RAM GENE-1 Mini-monitorsource [cm] [min−1 cm−2] [min−1 cm−2] [min−1 cm−2]
0 1349 overload -2 280 449 604 103 244 458 51 83 20
No source 3.4 3.8 1.5-3.0(background)radiation)
18

4 DiscussionThe first temperature test showed that our construction could function down to -49◦C. Whenthe circuit instead was placed outside the freezer and the STS-5 tube inside freezer the tubedid not deform in any way and was able to provide measurements down to the required -80◦C. This probably happened because the first tube had sustained some damage prior to the test.The tubes were constructed in 1975 and bought second hand on EBAY. There is no way toknow how the tubes has been handled before being acquired for this experiment. Also the firsttube was dropped on the floor by accident a few times which may have damaged the thin metalsurrounding the ionization chamber. Furthermore, during the first test the radiation source wasleaning on the tube which means that a force acted on the metal which could have led to thedeformation of the tube. In the second temperature test the circuit did not measure as muchradiation at the lower temperatures compared to the measurements done when the temperaturewas about room temperature. This may have been caused by the freezer having been openedafter the third measurement to investigate whether the tube had deformed or not. This causedthe freezer to shake and may have moved the radiation source slightly away from the tube. Afterthe experiment when the equipment was taken out of the freezer the radiation source had movedfrom it’s original position which supports this explanation. The circuit could function down to-49◦C and the tube down to -80◦C which means that both the circuit, that has to endure at worst-40◦C, and the tube, which has to manage -80◦C both are capable of withstanding the spaceenvironment.
The purpose of the pressure test was to analyze if the construction could operate at a lowpressure without any electrical discharges. The pressure chamber went down to 0.2 mBar,whereas the lowest estimated pressure for the balloon flight is 20 mBar. As the pressuredecreased the construction did measurements the entire time and there were no electricaldischarges that could be seen from the observational window. Right before the vault opened tolet air back in to increase the pressure the construction worked perfectly. According to Paschen’sand Peek’s laws a decrease in pressure increases the risk of discharges. However, the circuitstopped working when the pressure rose again. This may be because when the vault opened itshook our construction causing a connection to come loose. But most likely the Arduino wasdamaged from the first cooling test. Testing the Arduino showed that the feedback pin receivingthe value of the voltage did not work and neither did several of the analog pins. But even with adamaged Arduino the counter could measure radiation down to a pressure 100 times lower thanwhat is expected during the experiment which shows that the circuit is safe to use.
The Am-241 emits alpha radiation, which the RAM GENE-1 Meter could measure sinceit has a mica window that lets bigger particles pass through. The walls of our Geiger-Müllertube and the mini-monitors metal rod are too thick for the alpha particles to penetrate it. Thealpha radiation emitted from the source will ionize particles in the air surrounding it as wellas in the walls of the Geiger-Müller tube. This will result in secondary radiation which canbe registered by our counter and the mini monitor. Since the RAM GENE-1can measure bothtypes of radiation it is expected that it would measure a higher dose than the two other deviceswhich it did. The mini-monitor also measured more counts than our Geiger counter, but whenthe radiation over the cross sectional area per cm2 was calculated our tube registered morecounts/cm2 than the mini monitor. The reason this comparison was needed is because thelarger the area of the measuring device is the more counts can strike it. The mini monitorhad a measuring device almost twice the size of the STS-5 tube. This comparison is based
19

on an approximation that all of the tubes cross sections receives the same amount of radiation,it is very likely that since the mini-monitor was much longer than our STS-5 the ends of themini-monitor tube had very little activity. The mini-monitor was also covered partly by a metalcasing that may have shielded it from some radiation. For a better comparison two tubes withsimilar shape should be used.
The test shows that our construction competes well with other windowless Geiger countersbut that a window counter is far better for measuring alpha particles. But we are only interestedinmeasuring the high energy protons that can enter our tube. Since charged particles have almost100% efficiency in gaseous counters once they penetrated the walls, all relevant radiation shouldbe detected by the counter. [16] The test also shows that the counter can register much higherdoses than the 40 CPS required.
There are several ways the construction and the tests could be improved. Firstly, anotherradiation detection could be used, for example an ionization chamber or a semiconductor detectorwhich can also measure the energy levels of the protons. If we had used a Geiger-Müller tubewhich could measure alpha radiation as well our counter could be used in more types of projects.We could also try to improve the recharge time when a pulse is detected so that it can measuremore pulses than 2000 per second by using smaller capacitors in the signal processing part ofthe circuit. As far as testing goes one could measure exactly how thick the STS-5 shell is to dobetter estimations of what energy a particle needs to be detected. Since we are only interested inmeasuring protons during the experiment it would be more relevant to perform a radiation testusing a proton source. This is however hard to accomplish since proton beams can be expensiveto operate.
5 ConclusionThe radiation measurement unit constructed in this project is able to measure radiation, workat low temperatures and at a low pressure. When exposing it to extremely low temperaturesand pressures, much less than it would experience for the BEXUS balloon flight, the circuitdid not function properly. The circuit managed down to -49◦ C. When exposing the circuit tolow pressures the measurement worked as it should but when the pressure was increased, thecircuit stopped measuring. However, this was probably due to damage caused to the Arduinoduring the cooling test. The objective was fulfilled, the circuit can endure -40◦ C, a pressure aslow as 0.2mBar and the tube can measure more than 40 detections per second and can enduretemperatures as low as -80◦ C. Conclusively, our radiation unit will be able to measure cosmicradiation in near space conditions.
20

Appendix
Arduino code
//Include relevant libraries#include <Wire.h>#include <PID_v1.h>
//Definitions#define sigPin 6 //Pin Supplying PWM signal (DIGITAL)#define feedback 0 //Pin reading feedback loop (ANALOG)#define gm_input 3 //Pin recieving signal from GM tube (DIGITAL)
//Variablesdouble tresh = (3.3/5.0)*1023; //Setpoint value in feedback, 3.3 gives
400V.int ledArray [] = {2,1,4,5}; //Pins used for diodes.
//Variables for ISR.long interruptTime = 0; //Time for a new Interrupt.long lastInterrupt = 0; //Time when last interrupt occured.long bouncePreventTime = 4; //Minimum allowed time between interrupts.
//Variables for PIDdouble Input; //Input value.double Output; //Output value.double Setpoint; //Setpoint value.
//Variables for radiation count.unsigned int countPerSecond = 0; //Counts per second (CPS).unsigned int countPerMinute = 0; //Counts per minute (CPM).unsigned int count = 0; //Counts used in ISRunsigned int countDiode = 0; //Counts used in ISR for diode
control.long timePreviousMeassure = 0; //Time for previous CPM reading.long timePreviousFlash = 0; //Time for previous CPS reading.
//Threshhold values for diodes.int diode1 = 2;int diode2 = 100;int diode3 = 1;int diode4 = 2;
//Set PID tuning parameters. Kp = 0.1, Ki = 1, Kd = 0.//Direct sets direction. Higher output gives higher input.PID feedbackPID(&Input, &Output, &Setpoint, 0.1, 1, 0, DIRECT);
void setup() {//Define pins as input or output.pinMode(sigPin,OUTPUT);for (int i=0;i<4;i++){
pinMode(ledArray[i],OUTPUT);}
21

pinMode(gm_input,INPUT);digitalWrite(gm_input,HIGH); //Set high as "normal" mode.//PID startupInput = analogRead(feedback); //Reads inputSetpoint = tresh; //Defines setpoint.feedbackPID.SetMode(AUTOMATIC); //Turn regulator ON.feedbackPID.SetOutputLimits(24, 200); //Sets limits for dutyCycle.feedbackPID.SetSampleTime(10); //Sets regulator speed.
//Alter PWM frequency to 62500/8 (Instead of 62500/64).TCCR0B = (TCCR0B & 0b11111000) | 0x02;
//Attaches ISP to gm_inpt pin.// When pulse is detected ISR countPulse is initiated.attachInterrupt(digitalPinToInterrupt(gm_input), countPulse, FALLING);
//i2c bus start up.Wire.begin(3); // Join i2c bus with address #3.Wire.onRequest(requestEvent); // Run requestEvent when requested by MEGA.
}
void loop() {//Run PID regulationInput = analogRead(feedback); //Read input.feedbackPID.Compute(); //Compute regulation needed.analogWrite(sigPin, Output); //Apply regulation
//Check if one minute has passed since last measurement.if ((millis())-timePreviousMeassure > 480000){ //8*60 s = 480000
mscountPerMinute = count; //Set CPM.timePreviousMeassure = millis(); //Update
measurement time.count = 0; //Reset count.
}//Check if one second has passed since last measurement.if (millis()-timePreviousFlash > 8000){ //8*1 s = 8000 ms
countPerSecond = countDiode; //Set CPS.timePreviousFlash = millis(); //Update
measurement time.countDiode = 0; //Reset countDiode.
//Check CPS vs thresholds. Run ledVar function based on results.if(countPerSecond <= diode1) ledVar(0);if((countPerSecond <= diode2)&&(countPerMinute>diode1)) ledVar(1);if((countPerSecond <= diode3)&&(countPerMinute>diode2)) ledVar(2);if((countPerSecond <= diode4)&&(countPerMinute>diode3)) ledVar(3);if(countPerSecond>diode4) ledVar(4);
}
22

//Function that executes whenever data is requested by master.//If master sends data turn on/off signal for boost converter.void requestEvent() {
if (Wire.available() > 0){ //Check if master sends data.byte c = Wire.read(); //Read data sent by master.if (c == 1) {feedbackPID.SetMode(MANUAL); //Turn regulator OFF if 1 is sent
.Output = 0;}if (c==0) {feedbackPID.SetMode(AUTOMATIC); //Turn regulator ON if 0 is
sent.}
}else{ //If no data is sent send CPMWire.write(highByte(countPerMinute)); //byte by byte.Wire.write(lowByte(countPerMinute));
}}
//ISR Interrupt Service Routine countPulse.void countPulse(){
interruptTime = millis(); //Set time for interrupt, check forbouncing.
if (interruptTime - lastInterrupt > bouncePreventTime){//Detach Interrupt from input pin.detachInterrupt(digitalPinToInterrupt(gm_input));count++; //Add counts.countDiode++;//Reattach interrupt.attachInterrupt(digitalPinToInterrupt(gm_input),countPulse,FALLING);
lastInterrupt = interruptTime; //Update lastinterrupt time.
}}
//Function controlling diodes.void ledVar(int value){
if (value > 0){ //If value > 0 light that number of diodes.
for(int i=0;i<value;i++){digitalWrite(ledArray[i],HIGH);
}for(int i=3;i>value;i--){ //Turn off remaining diodes.
digitalWrite(ledArray[i],LOW);}
}else { //If value = 0 turn of all diodes.
for(int i=3;i>=0;i--){digitalWrite(ledArray[i],LOW);
}}
}
23

References[1] http://rexusbexus.net
[2] http://lodestarbexus.se
[3] Y.I. Stozhkov et al.Cosmic raymeasurements in the atmosphere, LebedevPhysical Institute, RussianAcademyof Sciences, Moscow, Russia
[4] https://en.wikipedia.org/wiki/Peek%27s_law
[5] https://en.wikipedia.org/wiki/Paschen%27s_law
[6] https://w3.pppl.gov/scied/docs/Paschens_law.pdf
[7] Glenn F Knoll. Detection and Measurement, third edition 2000. John Wiley and sons
[8] S.N Vernov, I.A Savenko, M.V Teltsov, P.I Shavrin, Investigation of the outer proton belt, Proceedings of the9th International Cosmic Ray Conference, Vol. 1
[9] http://www.gstube.com/data/4540/
[10] https://physics.nist.gov/cgi-bin/Star/ap_table.pl
[11] http://www.srim.org/SRIM/SRIMINTRO.htm
[12] https://en.wikipedia.org/wiki/Inductor
[13] http://www.learnabout-electronics.org/PSU/psu32.php
[14] https://www.pocketmagic.net/tube-sts-5-%d1%81tc-5-geiger-tube/
[15] http://www.nucleide.org/DDEP_WG/Nuclides/Am-241_tables.pdf
[16] https://en.wikipedia.org/wiki/Counting_efficiency
24


![[ Air Geiger-Muller counter tube] - Bit Trade One · 2011-10-14 · 1-1 . Making an air Geiger-Muller counter tube. [prepare cables] 1 Strip lead one side 10mm another side 50mm [](https://img.pdfslide.us/doc/110x75/5f14935e601d760b0476d7af/-air-geiger-muller-counter-tube-bit-trade-one-2011-10-14-1-1-making-an-air.jpg)

![[ Air Geiger-Muller counter tube] - Bit Trade Onebit-trade-one.co.jp/BTOpicture/Products/002-GM/AirGeigerCANManual-EN1.pdf · Geiger-Müller counter tube How to make [ Air Geiger-Muller](https://img.pdfslide.us/doc/110x75/5d0bee7688c993a3578b741c/-air-geiger-muller-counter-tube-bit-trade-onebit-trade-onecojpbtopictureproducts002-gmairgeigercanmanual-en1pdf.jpg)