Embed Size (px)
Citation preview

CONSTRUCTION BEST MANAGEMENT PRACTICES PLAN
FOR ALDOT PROJECT NUMBER
project number project location/description
county stormwater permit sequence number
RESPONSIBLE OFFICIAL:
responsible official ALDOT Region Engineer for Don T. Arkle, P.E., ALDOT Chief Engineer
CBMPP COMPILER:
CBMPP compiler company, title
DESIGN QUALIFIED CREDENTIALED PROFESSIONAL:
CBMPP certifier company, title
OPERATIONAL QUALIFIED CREDENTIALED PROFESSIONAL:
operational QCP ALDOT Stormwater Coordinator
Permit Sequence #1867
Steven C. Graben , P.E.ALDOT Region Engineer for Don T. Arkle, P.E., ALDOT Chief Engineer
Trudy Johnson
LeeAnn Williams, P.E.ALDOT Southeast Region - Montgomery Area, Stormwater Engineer
Jeffery A. Bender, CPESCALDOT Southeast Region - Montgomery Area, Stormwater Coordinator

ALDOT CBMPP Version December 2016
INDEX
CBMPP Explanation CBMPP Certifications ALDOT Contact Information
CBMPP DESIGN COMPONENT
I. Project Information
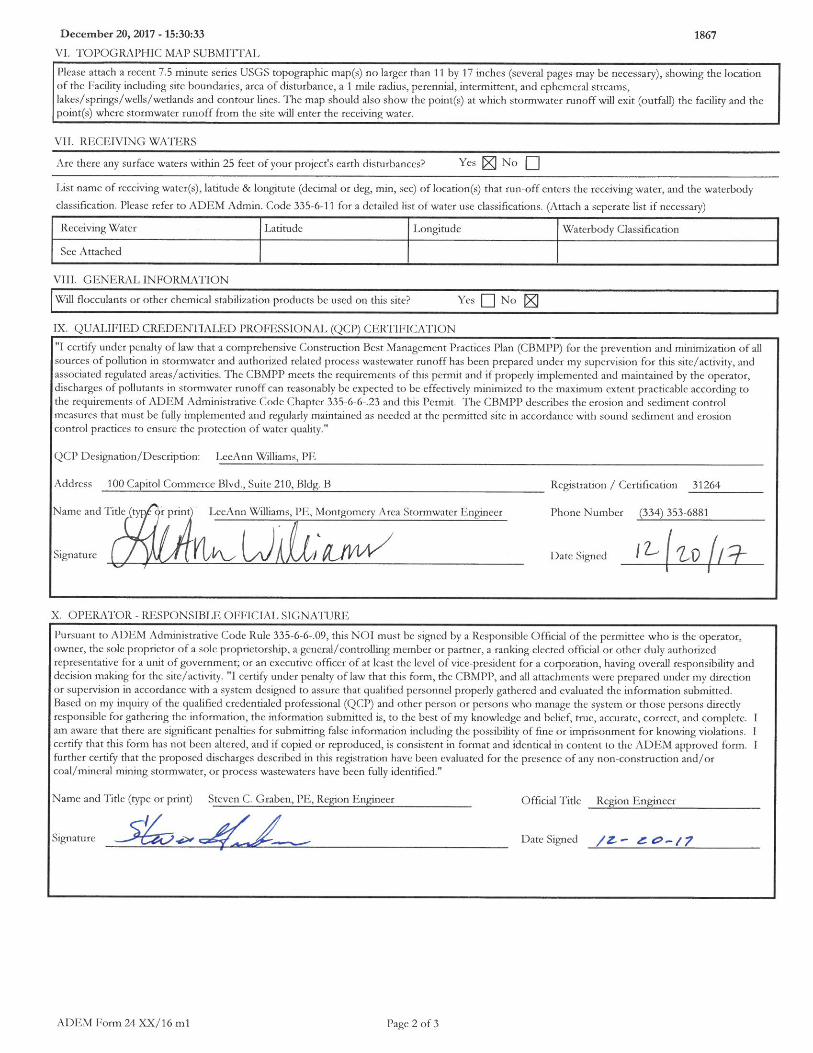
a. ADEM NPDES Notice of Intent
b. Project Plan Checklist
c. Soil Properties
d. Hydraulics/Hydrology
II. Environmental Concerns and Commitments
a. Environmental Concerns
b. Environmental Commitments
III. Environmental Best Management Practices
a. Project Specific Best Management Practices
i. ALDOT Project Specific Special Provisions
ii. ALDOT Special Project Details
b. Standard Best Management Practices
i. 2012 ALDOT Standard Specifications and General Application Special Provisions
ii. 2017 ALDOT Special Drawings
iii. ALDOT Construction Manual – Section 2.5 Construction Stormwater
iv. ALDOT Approved Treatment Chemicals
CBMPP OPERATIONAL COMPONENT
IV. Contractor Submitted Components
V. Inspections and CBMPP Review Log
VI. Rainfall Journal and Rain Gauge Log
VII. Regulatory Documentation and Actions Log
VIII. CBMPP Modifications Log
2012
2017

ALDOT CBMPP Version December 2016
CBMPP Explanation This ALDOT Construction Best Management Practices Plan (CBMPP) is intended to satisfy the requirements of the Alabama Department of Environmental Management (ADEM) Administrative Code and the National Pollutant Discharge Elimination System (NPDES) Construction General Permit. This CBMPP is also a means to gather and communicate environmental concerns, commitments, and contract requirements to ALDOT design and construction personnel as well as Contractors. This document, all referenced or attached documents, and those posted on the Electronic CBMPP webpage together constitute the CBMPP for this project. This CBMPP is provided to ALDOT Contractors prior to project letting. The CBMPP is comprised of two main components; a Design Component and an Operational Component. The Design Component is created and updated during the planning and design phase by ALDOT and/or consultant design personnel. The Design Qualified Credentialed Professional (QCP) certifies the Design Component of the CBMPP as having addressed all known environmental concerns, and that these concerns have been addressed in the project design. The Operational Component is created and updated during the construction phase by ALDOT project personnel and contractor personnel. The Operational Qualified Credentialed Professional (QCP) certifies that the Design Component will be adhered to as closely as possible, and that the Operational Component will be created, updated, and adhered to during construction of the project. This CBMPP is to be maintained at the Project Office during active construction on the project and retained with the project records after project completion. The CBMPP is to be made available to all project staff including all Contractors, ALDOT staff, and Regulators.

ALDOT CBMPP Version December 2016
ALDOT Contact Information RESPONSIBLE OFFICIAL: responsible official ALDOT Region Engineer for Don T. Arkle, P.E., ALDOT Chief Engineer street address city, state zip business phone Phone business fax Fax email DESIGN QUALIFIED CREDENTIALED PROFESSIONAL: CBMPP certifier company, title street address city, state zip business phone Phone business fax Fax email OPERATIONAL QUALIFIED CREDENTIALED PROFESSIONAL: operational QCP ALDOT Stormwater Coordinator street address city, state zip business phone Phone business fax Fax email
Steven C. Graben , P.E.ALDOT Region Engineer for Don T. Arkle, P.E., ALDOT Chief EngineerCapitol Commerce Center, 100 Capitol Commerce Blvd., Suite 210, Building BMontgomery, AL 36117PhoneFax 334-801-9804Email [email protected]
LeeAnn Williams, P.E.ALDOT Southeast Region - Montgomery Area, Stormwater EngineerCapitol Commerce Center, 100 Capitol Commerce Blvd., Suite 210, Building BMontgomery, AL 36117Phone 334-353-6881Fax 334-801-9804Email [email protected]
Jeffery A. Bender, CPESCALDOT Southeast Region - Montgomery Area, Stormwater Coordinator1525 Coliseum Blvd.Montgomery, AL 36110Phone 334-241-8520Fax 334-263-2599Email [email protected]
1867December 20, 2017 - 15:32:36
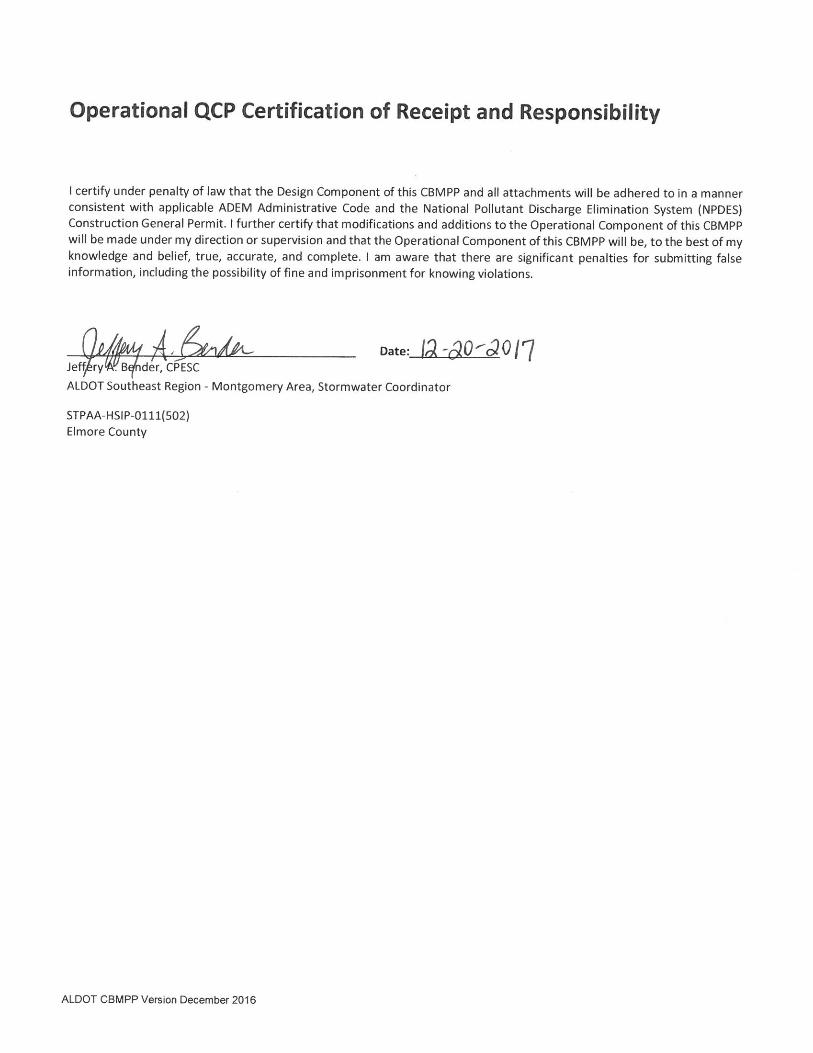
NOTICE OF INTENT - GENERAL PERMIT NUMBER ALR100000
Mail to: Alabama Department of Environmental ManagementWater DivisionStormwater Management BranchPost Office Box 301463Montgomery, Alabama 36130-1463
SITES LESS THAN ONE ACRE BUT ARE PART OF A LARGER COMMON PLAN OR DEVELOPMENT OR SALE
OTHER INFORMATION AS NEEDED. PLEASE TYPE OR PRINT LEGIBLY IN INK.
NPDES PERMIT NUMBER ALR100000 IS A GENERAL PERMIT AUTHORIZING DISCHARGES ASSOCIATED WITHCONSTRUCTION ACTIVITIES THAT RESULT IN A TOTAL LAND DISTURBANCE OF ONE ACRE OR GREATER AND
PLEASE COMPLETE ALL QUESTIONS. INCOMPLETE OR INCORRECT ANSWERS, OR MISSING SIGNATURES WILL DELAYPROCESSING. IF SPACE IS INSUFFICIENT, CONTINUE ON AN ATTACHED SHEET(S) AS NECESSARY. ATTACH CBMPP AND
Responsible Official Phone NumberPermittee Name (Legal Name)
Modification:Initial: I. PERMITTEE INFORMATION Transfer: Renewal: Previous ALR
Steven C. Graben, PE, Region Engineer
Montgomery, AL 36117
Montgomery, AL 36117
Responsible Owner/Operator or Official, and Title
City, State and Zip
Responsible Official (RO) Street/Physical Address City, State and Zip
Responsible Official (RO) Mailing Address
Responsible Official E-Mail Address
Corporation Individual Sole Proprietorship Partnership LLC LLP
100 Capitol Commerce Blvd., Suite 210, Bldg. B
100 Capitol Commerce Blvd., Suite 210, Bldg. B
II. FACILITY INFORMATION
Government Agency Other
RESURFACE AND 2' SAFETY WIDENING SR-111 FROMSR-14 TO HOGAN ROAD
Jeffery A. Bender, CPESC, ALDOT Montgomery Area SWCSTPOA-HSIP-0111(502) PS1867
ZipCity County(s)WETUMPKA 36092 ELMORE
Facility Street Address or Location Description Facility Contact Phone Number
Facility Contact and TitleFacility/Site Name
Facility Contact Company Name
ALABAMA DEPARTMENT OF TRANSPORTATION
(334) 241-8520
(334) 353-6853ALABAMA DEPARTMENT OF TRANSPORTATION
Beginning / Ending Project Latitude and Longitude Facility Contact e-Mail Address:
32° 33' 13" 86° 12' 56" 32° 38' 13" 86° 19' 52" [email protected]
Detailed Directions to the Site
RESURFACE AND 2' SAFETY WIDENING SR-111 FROM SR-14 TO HOGAN ROAD
III. ACTIVITY DESCRIPTION
Brief Description of Construction / Land disturbance activity(s): PREVENTATIVE MAINTENANCE LEVEL 2W/ SAFETY WIDEN
Primary NAICS Code: 237310Primary SIC Code: 1611
IV. PROPOSED SCHEDULE
(For Modifications Only) Brief description of the action / change that has resulted in the request for permit modification:
Anticipated Activity Schedule: Completion date:Commencement date: 09/30/2018
Area of the Registered site: 22Total disturbed area in acres:Total site area in acres:
01/26/2018
91
V. PRIORITY CONSTRUCTION SITE
copy of the CBMPP that meets or exceeds the requirements of Parts III A. and E. of the construction stormwater general permit.Yes NoIs this a Priority Construction Site as defined by Part V of the construction stormwater general Permit? If yes, attach/submit a
Page 1 of 3 ADEM Form 24 XX/16 m1
1867December 20, 2017 - 15:32:36
NOTICE OF INTENT - GENERAL PERMIT NUMBER ALR100000ATTACHMENTS
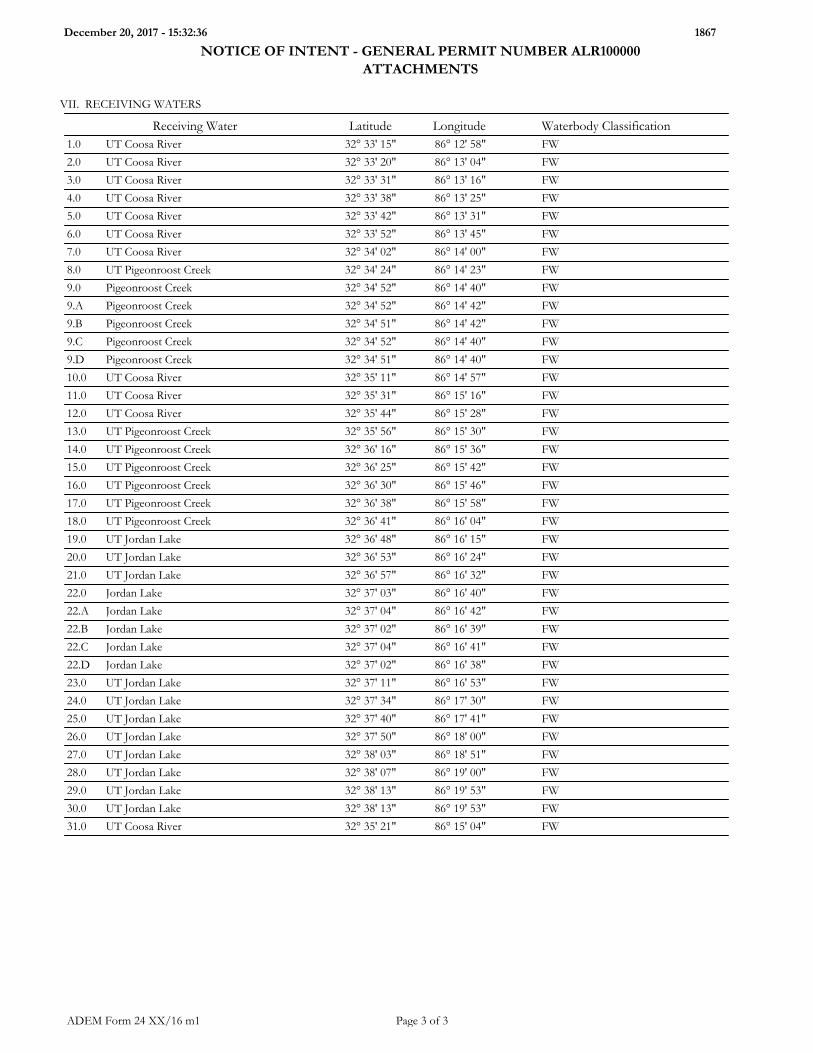
VII. RECEIVING WATERS
Waterbody ClassificationLatitude LongitudeReceiving WaterFW32° 33' 15" 86° 12' 58"UT Coosa River1.0
FW32° 33' 20" 86° 13' 04"UT Coosa River2.0
FW32° 33' 31" 86° 13' 16"UT Coosa River3.0
FW32° 33' 38" 86° 13' 25"UT Coosa River4.0
FW32° 33' 42" 86° 13' 31"UT Coosa River5.0
FW32° 33' 52" 86° 13' 45"UT Coosa River6.0
FW32° 34' 02" 86° 14' 00"UT Coosa River7.0
FW32° 34' 24" 86° 14' 23"UT Pigeonroost Creek8.0
FW32° 34' 52" 86° 14' 40"Pigeonroost Creek9.0
FW32° 34' 52" 86° 14' 42"Pigeonroost Creek9.A
FW32° 34' 51" 86° 14' 42"Pigeonroost Creek9.B
FW32° 34' 52" 86° 14' 40"Pigeonroost Creek9.C
FW32° 34' 51" 86° 14' 40"Pigeonroost Creek9.D
FW32° 35' 11" 86° 14' 57"UT Coosa River10.0
FW32° 35' 31" 86° 15' 16"UT Coosa River11.0
FW32° 35' 44" 86° 15' 28"UT Coosa River12.0
FW32° 35' 56" 86° 15' 30"UT Pigeonroost Creek13.0
FW32° 36' 16" 86° 15' 36"UT Pigeonroost Creek14.0
FW32° 36' 25" 86° 15' 42"UT Pigeonroost Creek15.0
FW32° 36' 30" 86° 15' 46"UT Pigeonroost Creek16.0
FW32° 36' 38" 86° 15' 58"UT Pigeonroost Creek17.0
FW32° 36' 41" 86° 16' 04"UT Pigeonroost Creek18.0
FW32° 36' 48" 86° 16' 15"UT Jordan Lake19.0
FW32° 36' 53" 86° 16' 24"UT Jordan Lake20.0
FW32° 36' 57" 86° 16' 32"UT Jordan Lake21.0
FW32° 37' 03" 86° 16' 40"Jordan Lake22.0
FW32° 37' 04" 86° 16' 42"Jordan Lake22.A
FW32° 37' 02" 86° 16' 39"Jordan Lake22.B
FW32° 37' 04" 86° 16' 41"Jordan Lake22.C
FW32° 37' 02" 86° 16' 38"Jordan Lake22.D
FW32° 37' 11" 86° 16' 53"UT Jordan Lake23.0
FW32° 37' 34" 86° 17' 30"UT Jordan Lake24.0
FW32° 37' 40" 86° 17' 41"UT Jordan Lake25.0
FW32° 37' 50" 86° 18' 00"UT Jordan Lake26.0
FW32° 38' 03" 86° 18' 51"UT Jordan Lake27.0
FW32° 38' 07" 86° 19' 00"UT Jordan Lake28.0
FW32° 38' 13" 86° 19' 53"UT Jordan Lake29.0
FW32° 38' 13" 86° 19' 53"UT Jordan Lake30.0
FW32° 35' 21" 86° 15' 04"UT Coosa River31.0
Page 3 of 3 ADEM Form 24 XX/16 m1

ALDOT CBMPP Version December 2016
I.b. Project Plan Checklist Detailed project information relevant to environmental design, protection, and compliance is located in the plan set. Information contained in the plan sheets satisfies the requirements of the ADEM Administrative Code and the NPDES Construction General Permit. Please reference the following applicable plan sheets. Their location within the plan set can be found on sheet 1A, the Index to Sheets.
Yes
No
Plan Sheet Name
Plan and Profile Sheets
Utility Sheets
Sequence of Construction
Erosion & Sediment Control Plans
Erosion & Sediment Control Schematics
Hydraulic Data Sheet
Drainage Sections
Soil Boring Logs
Cross Sections

ALDOT CBMPP Version December 2016
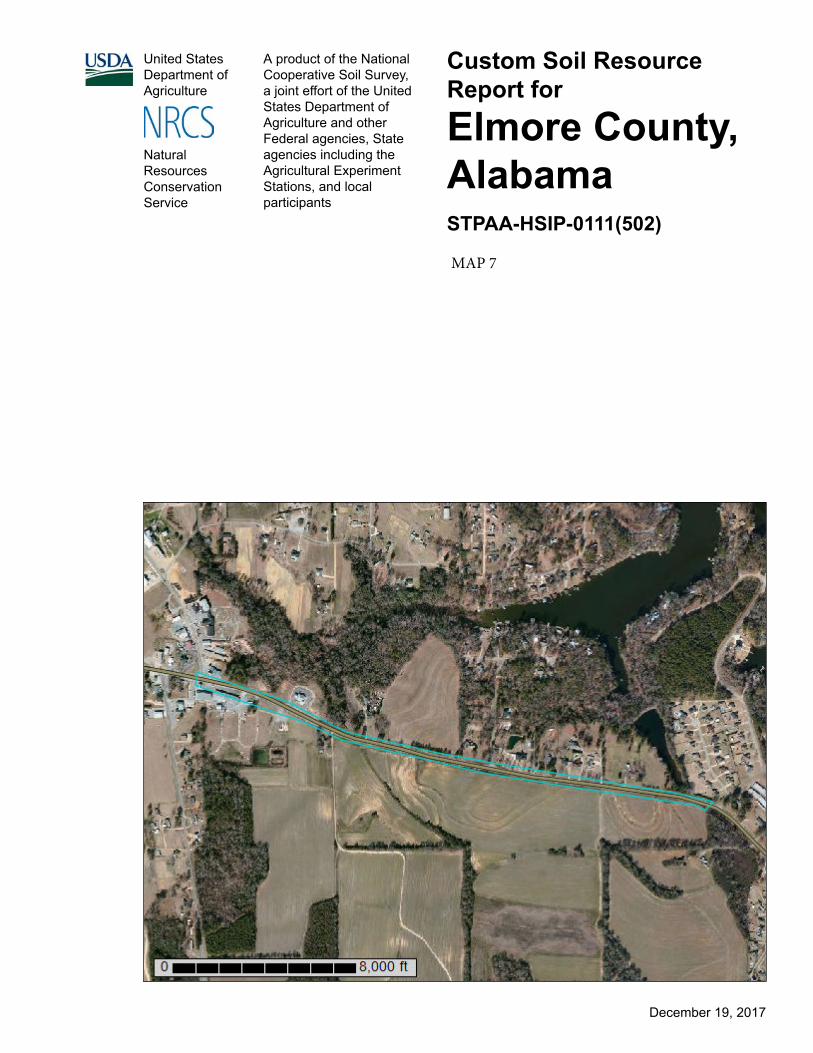
I.c. Soil Properties

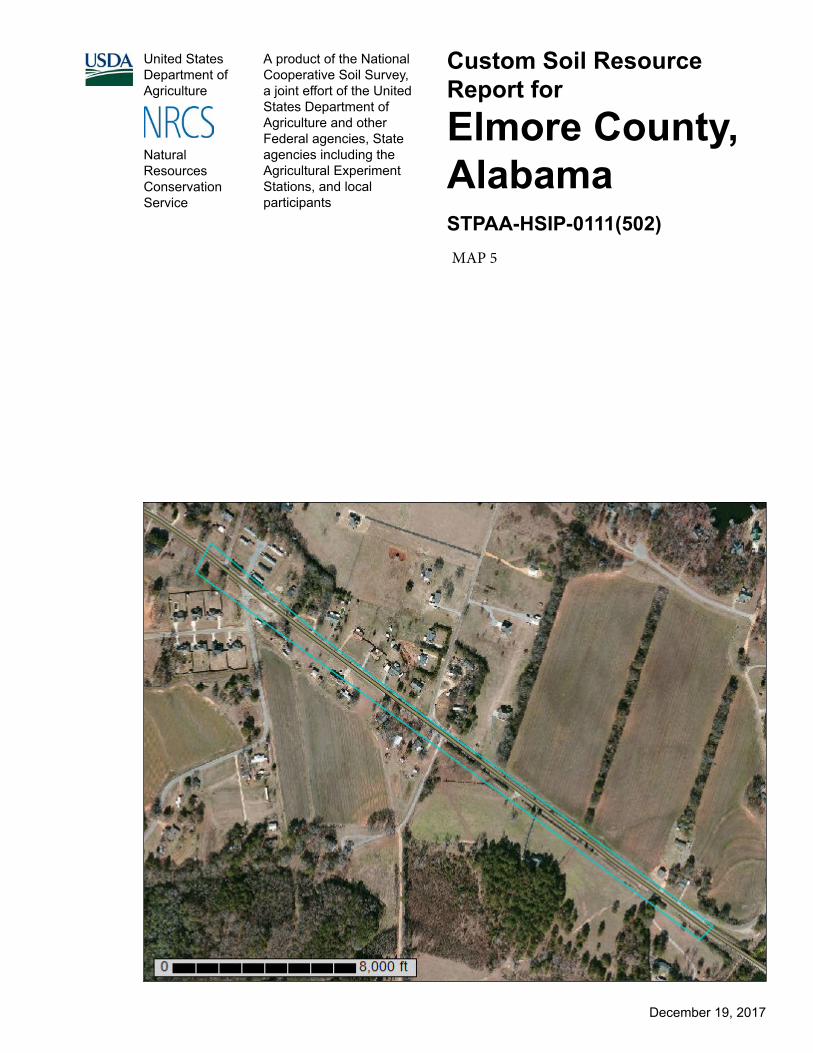
United StatesDepartment ofAgriculture
A product of the NationalCooperative Soil Survey,a joint effort of the UnitedStates Department ofAgriculture and otherFederal agencies, Stateagencies including theAgricultural ExperimentStations, and localparticipants
Custom Soil Resource Report for
Elmore County, AlabamaSTPAA-HSIP-0111(502)
NaturalResourcesConservationService
December 19, 2017
MAP 1
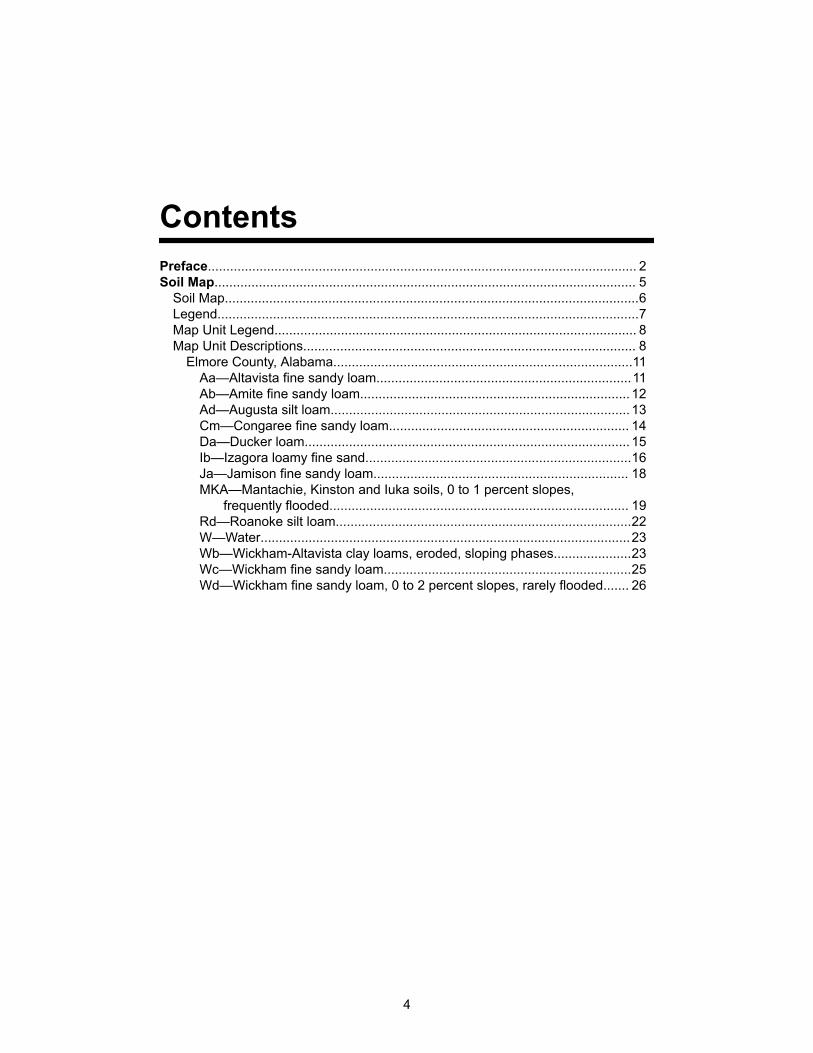
ContentsPreface.................................................................................................................... 2Soil Map.................................................................................................................. 5
Soil Map................................................................................................................6Legend..................................................................................................................7Map Unit Legend.................................................................................................. 8Map Unit Descriptions.......................................................................................... 8
Elmore County, Alabama.................................................................................11Aa—Altavista fine sandy loam.....................................................................11Ab—Amite fine sandy loam......................................................................... 12Ad—Augusta silt loam................................................................................. 13Cm—Congaree fine sandy loam................................................................. 14Da—Ducker loam........................................................................................ 15Ib—Izagora loamy fine sand........................................................................16Ja—Jamison fine sandy loam..................................................................... 18MKA—Mantachie, Kinston and Iuka soils, 0 to 1 percent slopes,
frequently flooded................................................................................. 19Rd—Roanoke silt loam................................................................................22W—Water....................................................................................................23Wb—Wickham-Altavista clay loams, eroded, sloping phases.....................23Wc—Wickham fine sandy loam...................................................................25Wd—Wickham fine sandy loam, 0 to 2 percent slopes, rarely flooded....... 26
4
6
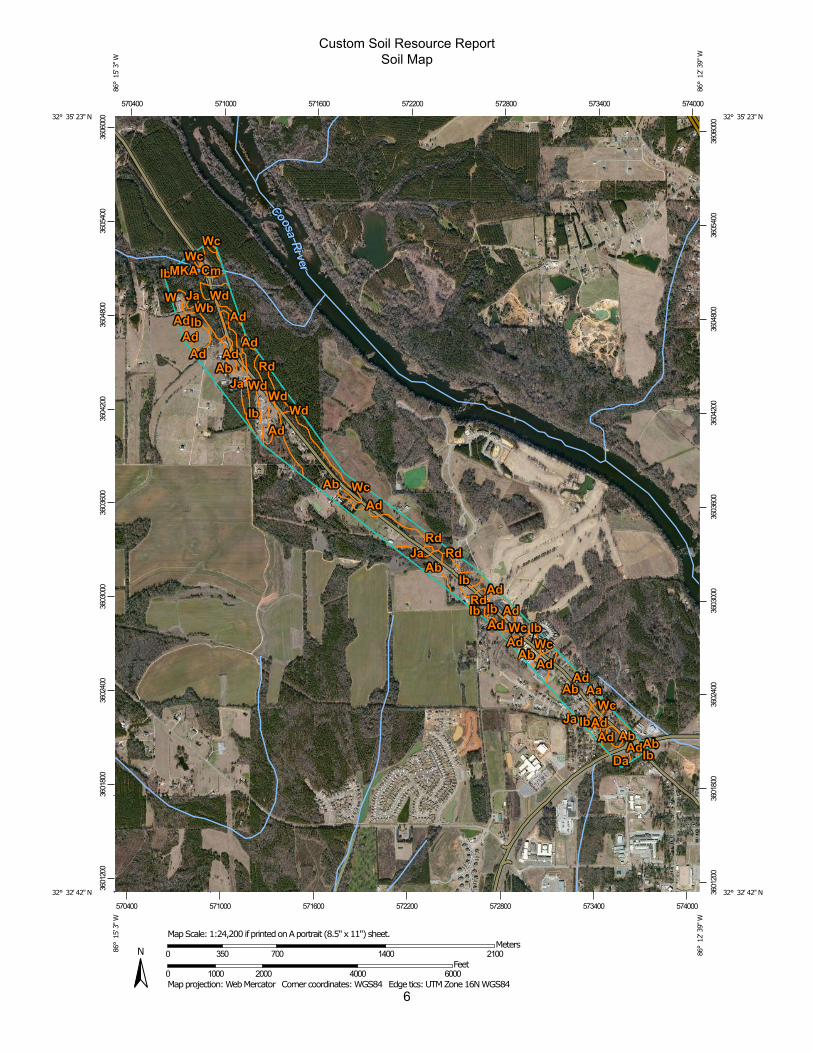
Custom Soil Resource ReportSoil Map
3601
200
3601
800
3602
400
3603
000
3603
600
3604
200
3604
800
3605
400
3606
000
3601
200
3601
800
3602
400
3603
000
3603
600
3604
200
3604
800
3605
400
3606
000
570400 571000 571600 572200 572800 573400 574000
570400 571000 571600 572200 572800 573400 574000
32° 35' 23'' N86
° 1
5' 3
'' W32° 35' 23'' N
86° 1
2' 3
9'' W
32° 32' 42'' N
86° 1
5' 3
'' W
32° 32' 42'' N
86° 1
2' 3
9'' W
N
Map projection: Web Mercator Corner coordinates: WGS84 Edge tics: UTM Zone 16N WGS840 1000 2000 4000 6000
Feet0 350 700 1400 2100
MetersMap Scale: 1:24,200 if printed on A portrait (8.5" x 11") sheet.
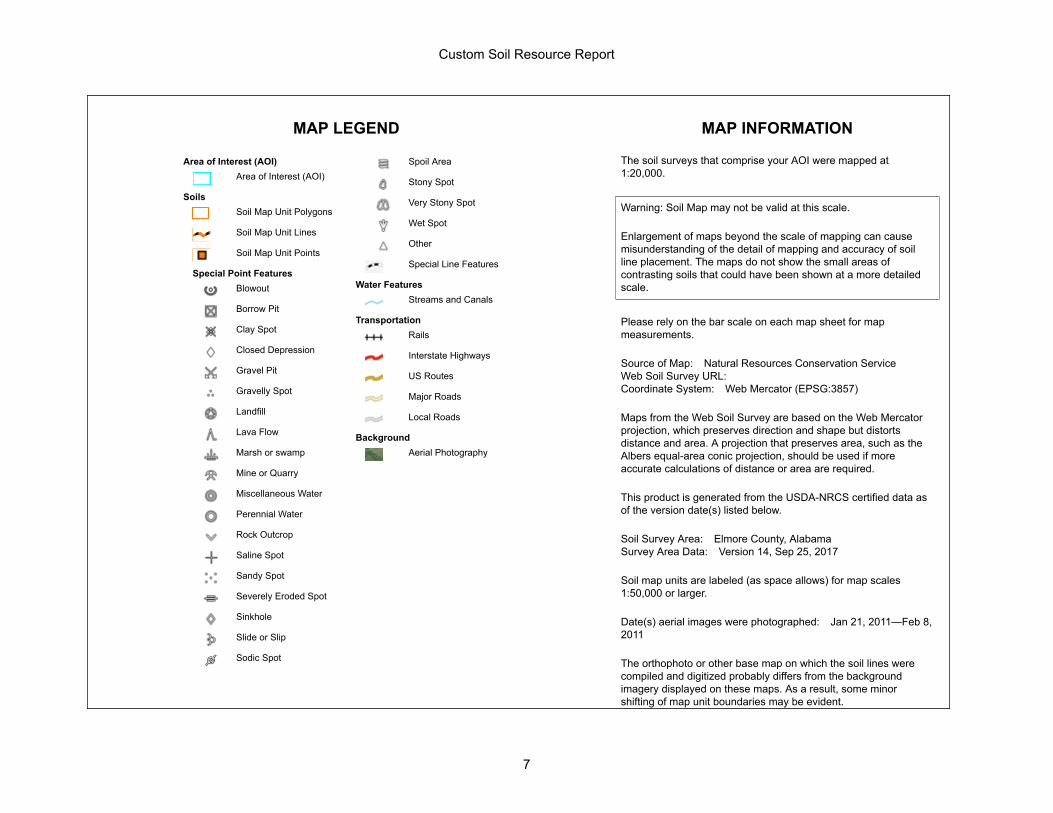
MAP LEGEND MAP INFORMATION
Area of Interest (AOI)Area of Interest (AOI)
SoilsSoil Map Unit Polygons
Soil Map Unit Lines
Soil Map Unit Points
Special Point FeaturesBlowout
Borrow Pit
Clay Spot
Closed Depression
Gravel Pit
Gravelly Spot
Landfill
Lava Flow
Marsh or swamp
Mine or Quarry
Miscellaneous Water
Perennial Water
Rock Outcrop
Saline Spot
Sandy Spot
Severely Eroded Spot
Sinkhole
Slide or Slip
Sodic Spot
Spoil Area
Stony Spot
Very Stony Spot
Wet Spot
Other
Special Line Features
Water FeaturesStreams and Canals
TransportationRails
Interstate Highways
US Routes
Major Roads
Local Roads
BackgroundAerial Photography
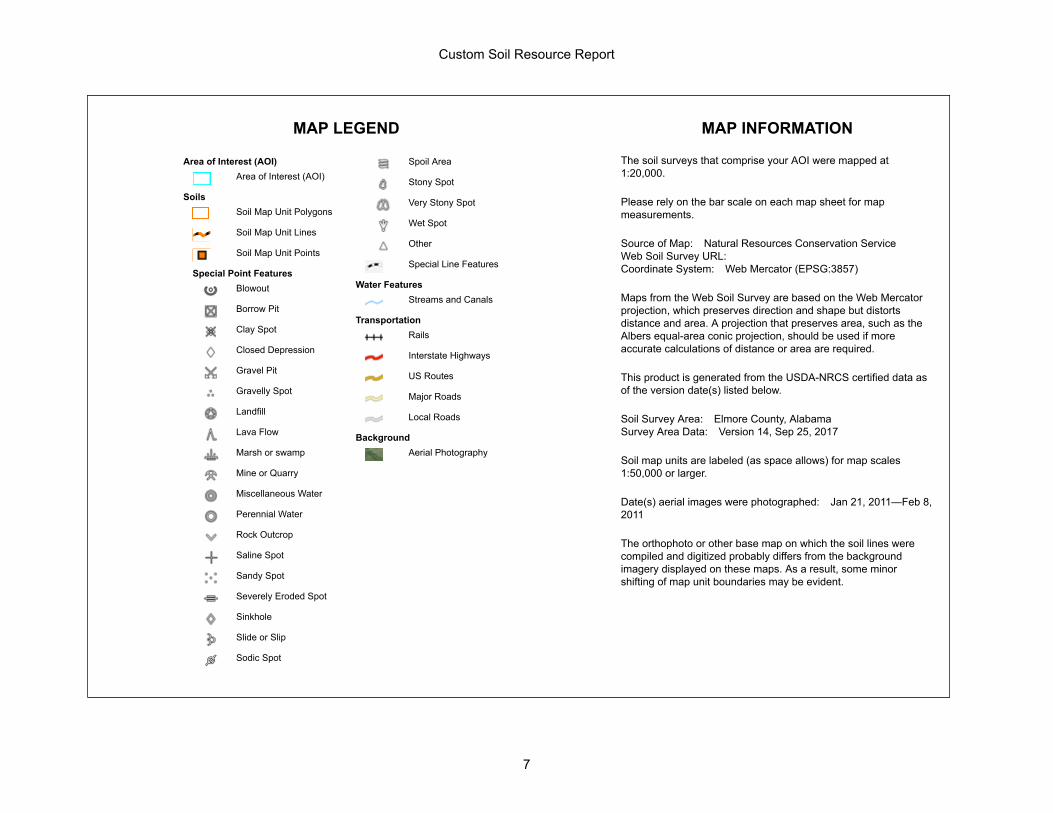
The soil surveys that comprise your AOI were mapped at 1:20,000.
Please rely on the bar scale on each map sheet for map measurements.
Source of Map: Natural Resources Conservation ServiceWeb Soil Survey URL: Coordinate System: Web Mercator (EPSG:3857)
Maps from the Web Soil Survey are based on the Web Mercator projection, which preserves direction and shape but distorts distance and area. A projection that preserves area, such as the Albers equal-area conic projection, should be used if more accurate calculations of distance or area are required.
This product is generated from the USDA-NRCS certified data as of the version date(s) listed below.
Soil Survey Area: Elmore County, AlabamaSurvey Area Data: Version 14, Sep 25, 2017
Soil map units are labeled (as space allows) for map scales 1:50,000 or larger.
Date(s) aerial images were photographed: Jan 21, 2011—Feb 8, 2011
The orthophoto or other base map on which the soil lines were compiled and digitized probably differs from the background imagery displayed on these maps. As a result, some minor shifting of map unit boundaries may be evident.
Custom Soil Resource Report
7

Map Unit Legend
Map Unit Symbol Map Unit Name Acres in AOI Percent of AOI
Aa Altavista fine sandy loam 1.4 0.5%
Ab Amite fine sandy loam 99.7 37.0%
Ad Augusta silt loam 58.4 21.7%
Cm Congaree fine sandy loam 5.1 1.9%
Da Ducker loam 0.8 0.3%
Ib Izagora loamy fine sand 35.2 13.1%
Ja Jamison fine sandy loam 7.6 2.8%
MKA Mantachie, Kinston and Iuka soils, 0 to 1 percent slopes, frequently flooded
3.0 1.1%
Rd Roanoke silt loam 6.1 2.3%
W Water 0.6 0.2%
Wb Wickham-Altavista clay loams, eroded, sloping phases
22.9 8.5%
Wc Wickham fine sandy loam 8.3 3.1%
Wd Wickham fine sandy loam, 0 to 2 percent slopes, rarely flooded
20.0 7.4%
Totals for Area of Interest 269.2 100.0%
Map Unit DescriptionsThe map units delineated on the detailed soil maps in a soil survey represent the soils or miscellaneous areas in the survey area. The map unit descriptions, along with the maps, can be used to determine the composition and properties of a unit.
A map unit delineation on a soil map represents an area dominated by one or more major kinds of soil or miscellaneous areas. A map unit is identified and named according to the taxonomic classification of the dominant soils. Within a taxonomic class there are precisely defined limits for the properties of the soils. On the landscape, however, the soils are natural phenomena, and they have the characteristic variability of all natural phenomena. Thus, the range of some observed properties may extend beyond the limits defined for a taxonomic class. Areas of soils of a single taxonomic class rarely, if ever, can be mapped without including areas of other taxonomic classes. Consequently, every map unit is made up of the soils or miscellaneous areas for which it is named and some minor components that belong to taxonomic classes other than those of the major soils.
Most minor soils have properties similar to those of the dominant soil or soils in the map unit, and thus they do not affect use and management. These are called noncontrasting, or similar, components. They may or may not be mentioned in a particular map unit description. Other minor components, however, have properties
Custom Soil Resource Report
8

United StatesDepartment ofAgriculture
A product of the NationalCooperative Soil Survey,a joint effort of the UnitedStates Department ofAgriculture and otherFederal agencies, Stateagencies including theAgricultural ExperimentStations, and localparticipants
Custom Soil Resource Report for
Elmore County, AlabamaSTPAA-HSIP-0111(502)
NaturalResourcesConservationService
December 19, 2017
MAP 2

United StatesDepartment ofAgriculture
A product of the NationalCooperative Soil Survey,a joint effort of the UnitedStates Department ofAgriculture and otherFederal agencies, Stateagencies including theAgricultural ExperimentStations, and localparticipants
Custom Soil Resource Report for
Elmore County, AlabamaSTPAA-HSIP-0111(502)
NaturalResourcesConservationService
December 19, 2017
MAP 3
ContentsPreface.................................................................................................................... 2Soil Map.................................................................................................................. 5
Soil Map................................................................................................................6Legend..................................................................................................................7Map Unit Legend.................................................................................................. 8Map Unit Descriptions.......................................................................................... 8
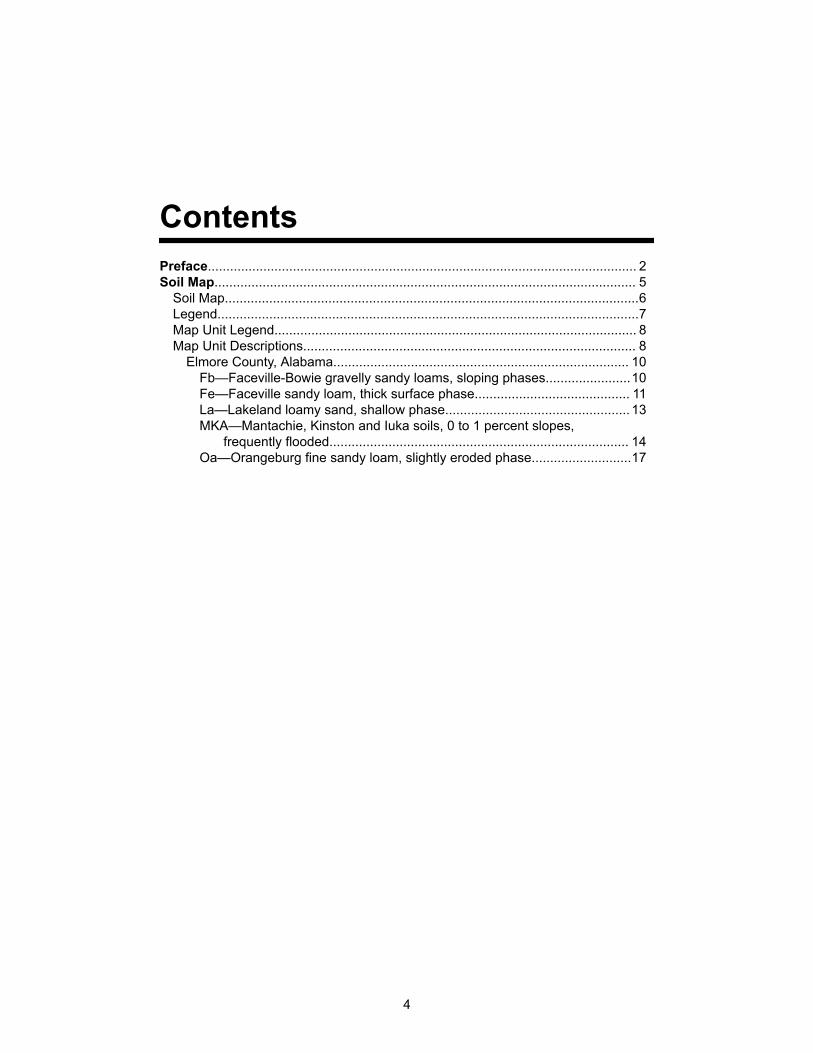
Elmore County, Alabama................................................................................ 10Fb—Faceville-Bowie gravelly sandy loams, sloping phases.......................10Fe—Faceville sandy loam, thick surface phase.......................................... 11La—Lakeland loamy sand, shallow phase.................................................. 13MKA—Mantachie, Kinston and Iuka soils, 0 to 1 percent slopes,
frequently flooded................................................................................. 14Oa—Orangeburg fine sandy loam, slightly eroded phase...........................17
4

6
Custom Soil Resource ReportSoil Map
3606
800
3607
000
3607
200
3607
400
3607
600
3607
800
3608
000
3608
200
3608
400
3606
800
3607
000
3607
200
3607
400
3607
600
3607
800
3608
000
3608
200
3608
400
568800 569000 569200 569400 569600 569800
568800 569000 569200 569400 569600 569800
32° 36' 39'' N86
° 1
6' 3
'' W32° 36' 39'' N
86° 1
5' 1
6'' W
32° 35' 47'' N
86° 1
6' 3
'' W
32° 35' 47'' N
86° 1
5' 1
6'' W
N
Map projection: Web Mercator Corner coordinates: WGS84 Edge tics: UTM Zone 16N WGS840 350 700 1400 2100
Feet0 100 200 400 600
MetersMap Scale: 1:7,890 if printed on A portrait (8.5" x 11") sheet.
Soil Map may not be valid at this scale.

MAP LEGEND MAP INFORMATION
Area of Interest (AOI)Area of Interest (AOI)
SoilsSoil Map Unit Polygons
Soil Map Unit Lines
Soil Map Unit Points
Special Point FeaturesBlowout
Borrow Pit
Clay Spot
Closed Depression
Gravel Pit
Gravelly Spot
Landfill
Lava Flow
Marsh or swamp
Mine or Quarry
Miscellaneous Water
Perennial Water
Rock Outcrop
Saline Spot
Sandy Spot
Severely Eroded Spot
Sinkhole
Slide or Slip
Sodic Spot
Spoil Area
Stony Spot
Very Stony Spot
Wet Spot
Other
Special Line Features
Water FeaturesStreams and Canals
TransportationRails
Interstate Highways
US Routes
Major Roads
Local Roads
BackgroundAerial Photography
The soil surveys that comprise your AOI were mapped at 1:20,000.
Warning: Soil Map may not be valid at this scale.
Enlargement of maps beyond the scale of mapping can cause misunderstanding of the detail of mapping and accuracy of soil line placement. The maps do not show the small areas of contrasting soils that could have been shown at a more detailed scale.
Please rely on the bar scale on each map sheet for map measurements.
Source of Map: Natural Resources Conservation ServiceWeb Soil Survey URL: Coordinate System: Web Mercator (EPSG:3857)
Maps from the Web Soil Survey are based on the Web Mercator projection, which preserves direction and shape but distorts distance and area. A projection that preserves area, such as the Albers equal-area conic projection, should be used if more accurate calculations of distance or area are required.
This product is generated from the USDA-NRCS certified data as of the version date(s) listed below.
Soil Survey Area: Elmore County, AlabamaSurvey Area Data: Version 14, Sep 25, 2017
Soil map units are labeled (as space allows) for map scales 1:50,000 or larger.
Date(s) aerial images were photographed: Jan 21, 2011—Feb 8, 2011
The orthophoto or other base map on which the soil lines were compiled and digitized probably differs from the background imagery displayed on these maps. As a result, some minor shifting of map unit boundaries may be evident.
Custom Soil Resource Report
7
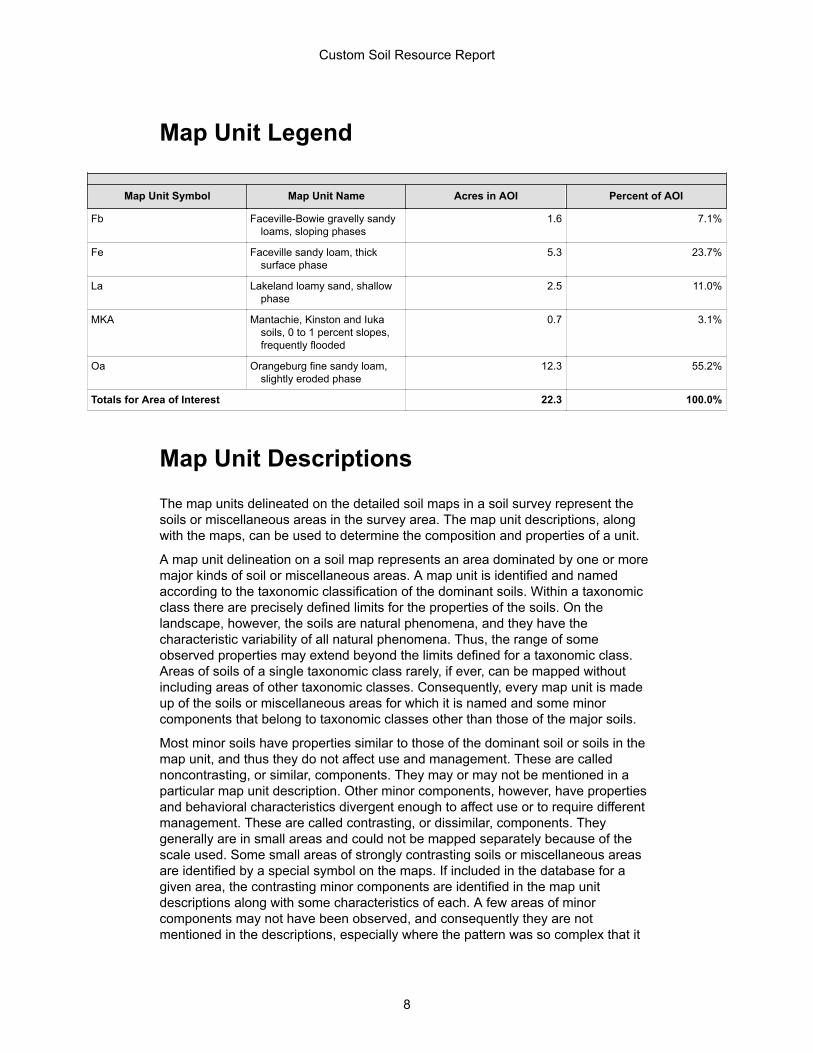
Map Unit Legend
Map Unit Symbol Map Unit Name Acres in AOI Percent of AOI
Fb Faceville-Bowie gravelly sandy loams, sloping phases
1.6 7.1%
Fe Faceville sandy loam, thick surface phase
5.3 23.7%
La Lakeland loamy sand, shallow phase
2.5 11.0%
MKA Mantachie, Kinston and Iuka soils, 0 to 1 percent slopes, frequently flooded
0.7 3.1%
Oa Orangeburg fine sandy loam, slightly eroded phase
12.3 55.2%
Totals for Area of Interest 22.3 100.0%
Map Unit DescriptionsThe map units delineated on the detailed soil maps in a soil survey represent the soils or miscellaneous areas in the survey area. The map unit descriptions, along with the maps, can be used to determine the composition and properties of a unit.
A map unit delineation on a soil map represents an area dominated by one or more major kinds of soil or miscellaneous areas. A map unit is identified and named according to the taxonomic classification of the dominant soils. Within a taxonomic class there are precisely defined limits for the properties of the soils. On the landscape, however, the soils are natural phenomena, and they have the characteristic variability of all natural phenomena. Thus, the range of some observed properties may extend beyond the limits defined for a taxonomic class. Areas of soils of a single taxonomic class rarely, if ever, can be mapped without including areas of other taxonomic classes. Consequently, every map unit is made up of the soils or miscellaneous areas for which it is named and some minor components that belong to taxonomic classes other than those of the major soils.
Most minor soils have properties similar to those of the dominant soil or soils in the map unit, and thus they do not affect use and management. These are called noncontrasting, or similar, components. They may or may not be mentioned in a particular map unit description. Other minor components, however, have properties and behavioral characteristics divergent enough to affect use or to require different management. These are called contrasting, or dissimilar, components. They generally are in small areas and could not be mapped separately because of the scale used. Some small areas of strongly contrasting soils or miscellaneous areas are identified by a special symbol on the maps. If included in the database for a given area, the contrasting minor components are identified in the map unit descriptions along with some characteristics of each. A few areas of minor components may not have been observed, and consequently they are not mentioned in the descriptions, especially where the pattern was so complex that it
Custom Soil Resource Report
8
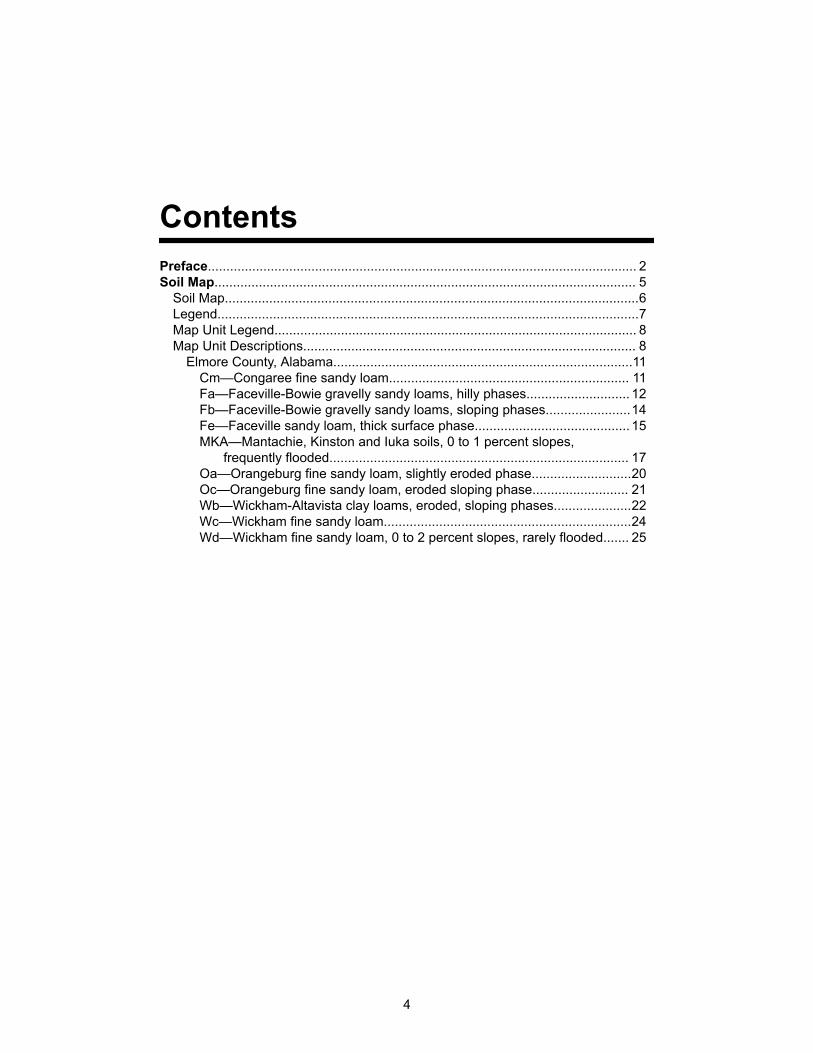
ContentsPreface.................................................................................................................... 2Soil Map.................................................................................................................. 5
Soil Map................................................................................................................6Legend..................................................................................................................7Map Unit Legend.................................................................................................. 8Map Unit Descriptions.......................................................................................... 8
Elmore County, Alabama.................................................................................11Cm—Congaree fine sandy loam................................................................. 11Fa—Faceville-Bowie gravelly sandy loams, hilly phases............................ 12Fb—Faceville-Bowie gravelly sandy loams, sloping phases.......................14Fe—Faceville sandy loam, thick surface phase.......................................... 15MKA—Mantachie, Kinston and Iuka soils, 0 to 1 percent slopes,
frequently flooded................................................................................. 17Oa—Orangeburg fine sandy loam, slightly eroded phase...........................20Oc—Orangeburg fine sandy loam, eroded sloping phase.......................... 21Wb—Wickham-Altavista clay loams, eroded, sloping phases.....................22Wc—Wickham fine sandy loam...................................................................24Wd—Wickham fine sandy loam, 0 to 2 percent slopes, rarely flooded....... 25
4

6
Custom Soil Resource ReportSoil Map
3605
000
3605
200
3605
400
3605
600
3605
800
3606
000
3606
200
3606
400
3606
600
3606
800
3607
000
3607
200
3605
000
3605
200
3605
400
3605
600
3605
800
3606
000
3606
200
3606
400
3606
600
3606
800
3607
000
3607
200
569400 569600 569800 570000 570200 570400 570600 570800 571000
569400 569600 569800 570000 570200 570400 570600 570800 571000
32° 36' 3'' N86
° 1
5' 4
2'' W
32° 36' 3'' N
86° 1
4' 3
4'' W
32° 34' 47'' N
86° 1
5' 4
2'' W
32° 34' 47'' N
86° 1
4' 3
4'' W
N
Map projection: Web Mercator Corner coordinates: WGS84 Edge tics: UTM Zone 16N WGS840 500 1000 2000 3000
Feet0 150 300 600 900
MetersMap Scale: 1:11,400 if printed on A portrait (8.5" x 11") sheet.
Soil Map may not be valid at this scale.

MAP LEGEND MAP INFORMATION
Area of Interest (AOI)Area of Interest (AOI)
SoilsSoil Map Unit Polygons
Soil Map Unit Lines
Soil Map Unit Points
Special Point FeaturesBlowout
Borrow Pit
Clay Spot
Closed Depression
Gravel Pit
Gravelly Spot
Landfill
Lava Flow
Marsh or swamp
Mine or Quarry
Miscellaneous Water
Perennial Water
Rock Outcrop
Saline Spot
Sandy Spot
Severely Eroded Spot
Sinkhole
Slide or Slip
Sodic Spot
Spoil Area
Stony Spot
Very Stony Spot
Wet Spot
Other
Special Line Features
Water FeaturesStreams and Canals
TransportationRails
Interstate Highways
US Routes
Major Roads
Local Roads
BackgroundAerial Photography
The soil surveys that comprise your AOI were mapped at 1:20,000.
Warning: Soil Map may not be valid at this scale.
Enlargement of maps beyond the scale of mapping can cause misunderstanding of the detail of mapping and accuracy of soil line placement. The maps do not show the small areas of contrasting soils that could have been shown at a more detailed scale.
Please rely on the bar scale on each map sheet for map measurements.
Source of Map: Natural Resources Conservation ServiceWeb Soil Survey URL: Coordinate System: Web Mercator (EPSG:3857)
Maps from the Web Soil Survey are based on the Web Mercator projection, which preserves direction and shape but distorts distance and area. A projection that preserves area, such as the Albers equal-area conic projection, should be used if more accurate calculations of distance or area are required.
This product is generated from the USDA-NRCS certified data as of the version date(s) listed below.
Soil Survey Area: Elmore County, AlabamaSurvey Area Data: Version 14, Sep 25, 2017
Soil map units are labeled (as space allows) for map scales 1:50,000 or larger.
Date(s) aerial images were photographed: Jan 21, 2011—Feb 8, 2011
The orthophoto or other base map on which the soil lines were compiled and digitized probably differs from the background imagery displayed on these maps. As a result, some minor shifting of map unit boundaries may be evident.
Custom Soil Resource Report
7

Map Unit Legend
Map Unit Symbol Map Unit Name Acres in AOI Percent of AOI
Cm Congaree fine sandy loam 0.6 1.0%
Fa Faceville-Bowie gravelly sandy loams, hilly phases
4.0 7.4%
Fb Faceville-Bowie gravelly sandy loams, sloping phases
0.3 0.5%
Fe Faceville sandy loam, thick surface phase
2.5 4.5%
MKA Mantachie, Kinston and Iuka soils, 0 to 1 percent slopes, frequently flooded
3.1 5.6%
Oa Orangeburg fine sandy loam, slightly eroded phase
22.3 40.7%
Oc Orangeburg fine sandy loam, eroded sloping phase
2.9 5.3%
Wb Wickham-Altavista clay loams, eroded, sloping phases
4.0 7.2%
Wc Wickham fine sandy loam 15.2 27.7%
Wd Wickham fine sandy loam, 0 to 2 percent slopes, rarely flooded
0.1 0.1%
Totals for Area of Interest 54.8 100.0%
Map Unit DescriptionsThe map units delineated on the detailed soil maps in a soil survey represent the soils or miscellaneous areas in the survey area. The map unit descriptions, along with the maps, can be used to determine the composition and properties of a unit.
A map unit delineation on a soil map represents an area dominated by one or more major kinds of soil or miscellaneous areas. A map unit is identified and named according to the taxonomic classification of the dominant soils. Within a taxonomic class there are precisely defined limits for the properties of the soils. On the landscape, however, the soils are natural phenomena, and they have the characteristic variability of all natural phenomena. Thus, the range of some observed properties may extend beyond the limits defined for a taxonomic class. Areas of soils of a single taxonomic class rarely, if ever, can be mapped without including areas of other taxonomic classes. Consequently, every map unit is made up of the soils or miscellaneous areas for which it is named and some minor components that belong to taxonomic classes other than those of the major soils.
Most minor soils have properties similar to those of the dominant soil or soils in the map unit, and thus they do not affect use and management. These are called noncontrasting, or similar, components. They may or may not be mentioned in a particular map unit description. Other minor components, however, have properties
Custom Soil Resource Report
8

United StatesDepartment ofAgriculture
A product of the NationalCooperative Soil Survey,a joint effort of the UnitedStates Department ofAgriculture and otherFederal agencies, Stateagencies including theAgricultural ExperimentStations, and localparticipants
Custom Soil Resource Report for
Elmore County, AlabamaSTPAA-HSIP-0111(502)
NaturalResourcesConservationService
December 19, 2017
MAP 4

ContentsPreface.................................................................................................................... 2Soil Map.................................................................................................................. 5
Soil Map................................................................................................................6Legend..................................................................................................................7Map Unit Legend.................................................................................................. 8Map Unit Descriptions.......................................................................................... 8
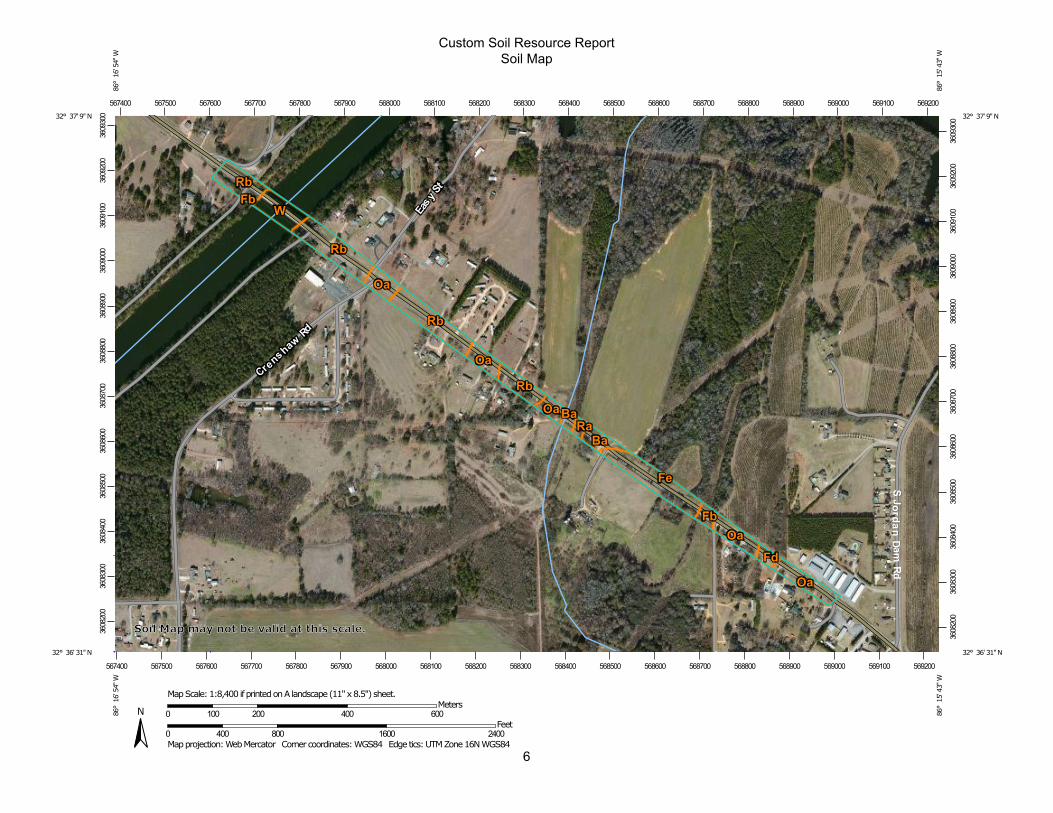
Elmore County, Alabama................................................................................ 10Ba—Bowie sandy loam............................................................................... 10Fb—Faceville-Bowie gravelly sandy loams, sloping phases....................... 11Fd—Faceville sandy loam, sloping, thick surface phase.............................13Fe—Faceville sandy loam, thick surface phase.......................................... 14Oa—Orangeburg fine sandy loam, slightly eroded phase...........................15Ra—Rains loamy sand................................................................................16Rb—Red Bay sandy loam........................................................................... 17W—Water....................................................................................................18
4
6
Custom Soil Resource ReportSoil Map
3608
200
3608
300
3608
400
3608
500
3608
600
3608
700
3608
800
3608
900
3609
000
3609
100
3609
200
3609
300
3608
200
3608
300
3608
400
3608
500
3608
600
3608
700
3608
800
3608
900
3609
000
3609
100
3609
200
3609
300
567400 567500 567600 567700 567800 567900 568000 568100 568200 568300 568400 568500 568600 568700 568800 568900 569000 569100 569200
567400 567500 567600 567700 567800 567900 568000 568100 568200 568300 568400 568500 568600 568700 568800 568900 569000 569100 569200
32° 37' 9'' N86
° 1
6' 5
4'' W
32° 37' 9'' N
86° 1
5' 4
3'' W
32° 36' 31'' N
86° 1
6' 5
4'' W
32° 36' 31'' N
86° 1
5' 4
3'' W
N
Map projection: Web Mercator Corner coordinates: WGS84 Edge tics: UTM Zone 16N WGS840 400 800 1600 2400
Feet0 100 200 400 600
MetersMap Scale: 1:8,400 if printed on A landscape (11" x 8.5") sheet.
Soil Map may not be valid at this scale.

MAP LEGEND MAP INFORMATION
Area of Interest (AOI)Area of Interest (AOI)
SoilsSoil Map Unit Polygons
Soil Map Unit Lines
Soil Map Unit Points
Special Point FeaturesBlowout
Borrow Pit
Clay Spot
Closed Depression
Gravel Pit
Gravelly Spot
Landfill
Lava Flow
Marsh or swamp
Mine or Quarry
Miscellaneous Water
Perennial Water
Rock Outcrop
Saline Spot
Sandy Spot
Severely Eroded Spot
Sinkhole
Slide or Slip
Sodic Spot
Spoil Area
Stony Spot
Very Stony Spot
Wet Spot
Other
Special Line Features
Water FeaturesStreams and Canals
TransportationRails
Interstate Highways
US Routes
Major Roads
Local Roads
BackgroundAerial Photography
The soil surveys that comprise your AOI were mapped at 1:20,000.
Warning: Soil Map may not be valid at this scale.
Enlargement of maps beyond the scale of mapping can cause misunderstanding of the detail of mapping and accuracy of soil line placement. The maps do not show the small areas of contrasting soils that could have been shown at a more detailed scale.
Please rely on the bar scale on each map sheet for map measurements.
Source of Map: Natural Resources Conservation ServiceWeb Soil Survey URL: Coordinate System: Web Mercator (EPSG:3857)
Maps from the Web Soil Survey are based on the Web Mercator projection, which preserves direction and shape but distorts distance and area. A projection that preserves area, such as the Albers equal-area conic projection, should be used if more accurate calculations of distance or area are required.
This product is generated from the USDA-NRCS certified data as of the version date(s) listed below.
Soil Survey Area: Elmore County, AlabamaSurvey Area Data: Version 14, Sep 25, 2017
Soil map units are labeled (as space allows) for map scales 1:50,000 or larger.
Date(s) aerial images were photographed: Jan 21, 2011—Feb 8, 2011
The orthophoto or other base map on which the soil lines were compiled and digitized probably differs from the background imagery displayed on these maps. As a result, some minor shifting of map unit boundaries may be evident.
Custom Soil Resource Report
7

Map Unit Legend
Map Unit Symbol Map Unit Name Acres in AOI Percent of AOI
Ba Bowie sandy loam 1.0 5.8%
Fb Faceville-Bowie gravelly sandy loams, sloping phases
0.4 2.3%
Fd Faceville sandy loam, sloping, thick surface phase
0.4 2.1%
Fe Faceville sandy loam, thick surface phase
2.4 14.3%
Oa Orangeburg fine sandy loam, slightly eroded phase
4.3 25.3%
Ra Rains loamy sand 0.2 1.5%
Rb Red Bay sandy loam 6.8 40.5%
W Water 1.4 8.2%
Totals for Area of Interest 16.9 100.0%
Map Unit DescriptionsThe map units delineated on the detailed soil maps in a soil survey represent the soils or miscellaneous areas in the survey area. The map unit descriptions, along with the maps, can be used to determine the composition and properties of a unit.
A map unit delineation on a soil map represents an area dominated by one or more major kinds of soil or miscellaneous areas. A map unit is identified and named according to the taxonomic classification of the dominant soils. Within a taxonomic class there are precisely defined limits for the properties of the soils. On the landscape, however, the soils are natural phenomena, and they have the characteristic variability of all natural phenomena. Thus, the range of some observed properties may extend beyond the limits defined for a taxonomic class. Areas of soils of a single taxonomic class rarely, if ever, can be mapped without including areas of other taxonomic classes. Consequently, every map unit is made up of the soils or miscellaneous areas for which it is named and some minor components that belong to taxonomic classes other than those of the major soils.
Most minor soils have properties similar to those of the dominant soil or soils in the map unit, and thus they do not affect use and management. These are called noncontrasting, or similar, components. They may or may not be mentioned in a particular map unit description. Other minor components, however, have properties and behavioral characteristics divergent enough to affect use or to require different management. These are called contrasting, or dissimilar, components. They generally are in small areas and could not be mapped separately because of the scale used. Some small areas of strongly contrasting soils or miscellaneous areas are identified by a special symbol on the maps. If included in the database for a given area, the contrasting minor components are identified in the map unit descriptions along with some characteristics of each. A few areas of minor components may not have been observed, and consequently they are not
Custom Soil Resource Report
8
United StatesDepartment ofAgriculture
A product of the NationalCooperative Soil Survey,a joint effort of the UnitedStates Department ofAgriculture and otherFederal agencies, Stateagencies including theAgricultural ExperimentStations, and localparticipants
Custom Soil Resource Report for
Elmore County, AlabamaSTPAA-HSIP-0111(502)
NaturalResourcesConservationService
December 19, 2017
MAP 5

6
Custom Soil Resource ReportSoil Map
3609
200
3609
300
3609
400
3609
500
3609
600
3609
700
3609
800
3609
900
3609
200
3609
300
3609
400
3609
500
3609
600
3609
700
3609
800
3609
900
566600 566700 566800 566900 567000 567100 567200 567300 567400 567500 567600 567700 567800
566600 566700 566800 566900 567000 567100 567200 567300 567400 567500 567600 567700 567800
32° 37' 29'' N86
° 1
7' 2
4'' W
32° 37' 29'' N
86° 1
6' 3
7'' W
32° 37' 3'' N
86° 1
7' 2
4'' W
32° 37' 3'' N
86° 1
6' 3
7'' W
N
Map projection: Web Mercator Corner coordinates: WGS84 Edge tics: UTM Zone 16N WGS840 250 500 1000 1500
Feet0 50 100 200 300
MetersMap Scale: 1:5,590 if printed on A landscape (11" x 8.5") sheet.
Soil Map may not be valid at this scale.

MAP LEGEND MAP INFORMATION
Area of Interest (AOI)Area of Interest (AOI)
SoilsSoil Map Unit Polygons
Soil Map Unit Lines
Soil Map Unit Points
Special Point FeaturesBlowout
Borrow Pit
Clay Spot
Closed Depression
Gravel Pit
Gravelly Spot
Landfill
Lava Flow
Marsh or swamp
Mine or Quarry
Miscellaneous Water
Perennial Water
Rock Outcrop
Saline Spot
Sandy Spot
Severely Eroded Spot
Sinkhole
Slide or Slip
Sodic Spot
Spoil Area
Stony Spot
Very Stony Spot
Wet Spot
Other
Special Line Features
Water FeaturesStreams and Canals
TransportationRails
Interstate Highways
US Routes
Major Roads
Local Roads
BackgroundAerial Photography
The soil surveys that comprise your AOI were mapped at 1:20,000.
Warning: Soil Map may not be valid at this scale.
Enlargement of maps beyond the scale of mapping can cause misunderstanding of the detail of mapping and accuracy of soil line placement. The maps do not show the small areas of contrasting soils that could have been shown at a more detailed scale.
Please rely on the bar scale on each map sheet for map measurements.
Source of Map: Natural Resources Conservation ServiceWeb Soil Survey URL: Coordinate System: Web Mercator (EPSG:3857)
Maps from the Web Soil Survey are based on the Web Mercator projection, which preserves direction and shape but distorts distance and area. A projection that preserves area, such as the Albers equal-area conic projection, should be used if more accurate calculations of distance or area are required.
This product is generated from the USDA-NRCS certified data as of the version date(s) listed below.
Soil Survey Area: Elmore County, AlabamaSurvey Area Data: Version 14, Sep 25, 2017
Soil map units are labeled (as space allows) for map scales 1:50,000 or larger.
Date(s) aerial images were photographed: Jan 21, 2011—Feb 8, 2011
The orthophoto or other base map on which the soil lines were compiled and digitized probably differs from the background imagery displayed on these maps. As a result, some minor shifting of map unit boundaries may be evident.
Custom Soil Resource Report
7

Map Unit Legend
Map Unit Symbol Map Unit Name Acres in AOI Percent of AOI
Ba Bowie sandy loam 0.8 8.9%
MKA Mantachie, Kinston and Iuka soils, 0 to 1 percent slopes, frequently flooded
0.0 0.0%
Oa Orangeburg fine sandy loam, slightly eroded phase
2.8 31.8%
Rb Red Bay sandy loam 5.3 59.3%
Totals for Area of Interest 8.9 100.0%
Map Unit DescriptionsThe map units delineated on the detailed soil maps in a soil survey represent the soils or miscellaneous areas in the survey area. The map unit descriptions, along with the maps, can be used to determine the composition and properties of a unit.
A map unit delineation on a soil map represents an area dominated by one or more major kinds of soil or miscellaneous areas. A map unit is identified and named according to the taxonomic classification of the dominant soils. Within a taxonomic class there are precisely defined limits for the properties of the soils. On the landscape, however, the soils are natural phenomena, and they have the characteristic variability of all natural phenomena. Thus, the range of some observed properties may extend beyond the limits defined for a taxonomic class. Areas of soils of a single taxonomic class rarely, if ever, can be mapped without including areas of other taxonomic classes. Consequently, every map unit is made up of the soils or miscellaneous areas for which it is named and some minor components that belong to taxonomic classes other than those of the major soils.
Most minor soils have properties similar to those of the dominant soil or soils in the map unit, and thus they do not affect use and management. These are called noncontrasting, or similar, components. They may or may not be mentioned in a particular map unit description. Other minor components, however, have properties and behavioral characteristics divergent enough to affect use or to require different management. These are called contrasting, or dissimilar, components. They generally are in small areas and could not be mapped separately because of the scale used. Some small areas of strongly contrasting soils or miscellaneous areas are identified by a special symbol on the maps. If included in the database for a given area, the contrasting minor components are identified in the map unit descriptions along with some characteristics of each. A few areas of minor components may not have been observed, and consequently they are not mentioned in the descriptions, especially where the pattern was so complex that it was impractical to make enough observations to identify all the soils and miscellaneous areas on the landscape.
The presence of minor components in a map unit in no way diminishes the usefulness or accuracy of the data. The objective of mapping is not to delineate
Custom Soil Resource Report
8

United StatesDepartment ofAgriculture
A product of the NationalCooperative Soil Survey,a joint effort of the UnitedStates Department ofAgriculture and otherFederal agencies, Stateagencies including theAgricultural ExperimentStations, and localparticipants
Custom Soil Resource Report for
Elmore County, AlabamaSTPAA-HSIP-0111(502)
NaturalResourcesConservationService
December 19, 2017
MAP 6

ContentsPreface.................................................................................................................... 2Soil Map.................................................................................................................. 5
Soil Map................................................................................................................6Legend..................................................................................................................7Map Unit Legend.................................................................................................. 8Map Unit Descriptions.......................................................................................... 8
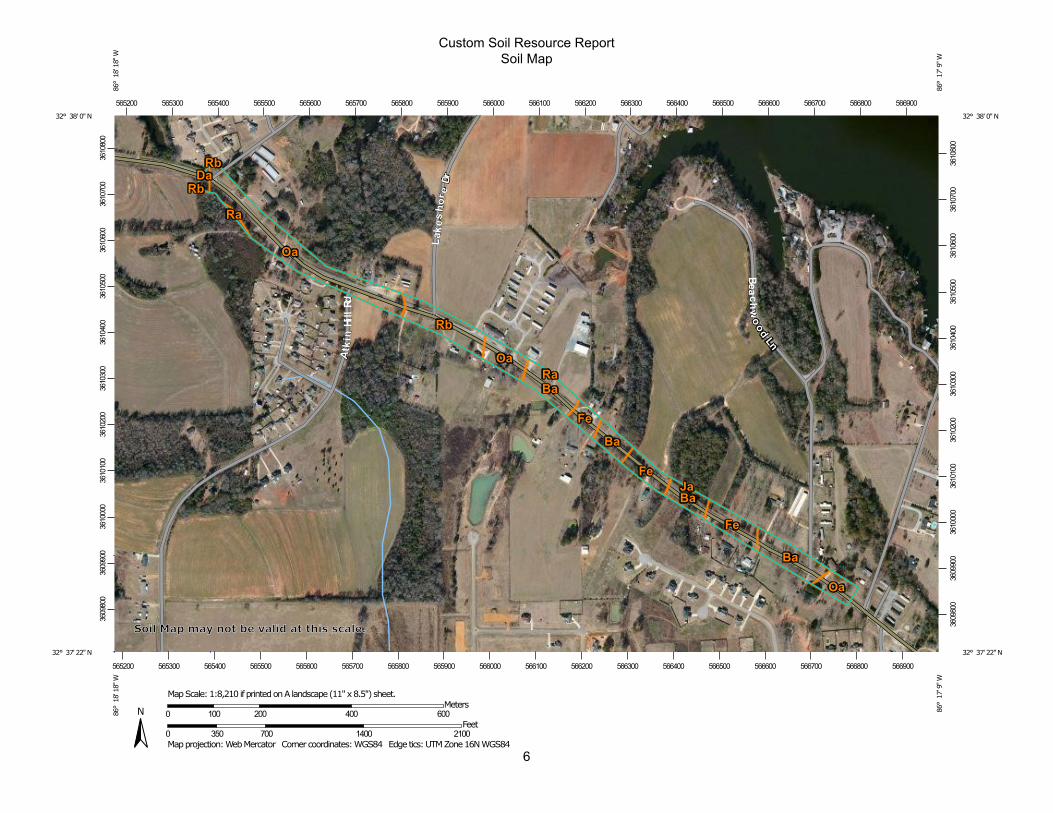
Elmore County, Alabama................................................................................ 10Ba—Bowie sandy loam............................................................................... 10Da—Ducker loam........................................................................................ 11Fe—Faceville sandy loam, thick surface phase.......................................... 12Ja—Jamison fine sandy loam..................................................................... 13Oa—Orangeburg fine sandy loam, slightly eroded phase...........................14Ra—Rains loamy sand................................................................................15Rb—Red Bay sandy loam........................................................................... 16
4
6
Custom Soil Resource ReportSoil Map
3609
800
3609
900
3610
000
3610
100
3610
200
3610
300
3610
400
3610
500
3610
600
3610
700
3610
800
3609
800
3609
900
3610
000
3610
100
3610
200
3610
300
3610
400
3610
500
3610
600
3610
700
3610
800
565200 565300 565400 565500 565600 565700 565800 565900 566000 566100 566200 566300 566400 566500 566600 566700 566800 566900
565200 565300 565400 565500 565600 565700 565800 565900 566000 566100 566200 566300 566400 566500 566600 566700 566800 566900
32° 38' 0'' N86
° 1
8' 1
8'' W
32° 38' 0'' N
86° 1
7' 9
'' W
32° 37' 22'' N
86° 1
8' 1
8'' W
32° 37' 22'' N
86° 1
7' 9
'' W
N
Map projection: Web Mercator Corner coordinates: WGS84 Edge tics: UTM Zone 16N WGS840 350 700 1400 2100
Feet0 100 200 400 600
MetersMap Scale: 1:8,210 if printed on A landscape (11" x 8.5") sheet.
Soil Map may not be valid at this scale.
MAP LEGEND MAP INFORMATION
Area of Interest (AOI)Area of Interest (AOI)
SoilsSoil Map Unit Polygons
Soil Map Unit Lines
Soil Map Unit Points
Special Point FeaturesBlowout
Borrow Pit
Clay Spot
Closed Depression
Gravel Pit
Gravelly Spot
Landfill
Lava Flow
Marsh or swamp
Mine or Quarry
Miscellaneous Water
Perennial Water
Rock Outcrop
Saline Spot
Sandy Spot
Severely Eroded Spot
Sinkhole
Slide or Slip
Sodic Spot
Spoil Area
Stony Spot
Very Stony Spot
Wet Spot
Other
Special Line Features
Water FeaturesStreams and Canals
TransportationRails
Interstate Highways
US Routes
Major Roads
Local Roads
BackgroundAerial Photography
The soil surveys that comprise your AOI were mapped at 1:20,000.
Warning: Soil Map may not be valid at this scale.
Enlargement of maps beyond the scale of mapping can cause misunderstanding of the detail of mapping and accuracy of soil line placement. The maps do not show the small areas of contrasting soils that could have been shown at a more detailed scale.
Please rely on the bar scale on each map sheet for map measurements.
Source of Map: Natural Resources Conservation ServiceWeb Soil Survey URL: Coordinate System: Web Mercator (EPSG:3857)
Maps from the Web Soil Survey are based on the Web Mercator projection, which preserves direction and shape but distorts distance and area. A projection that preserves area, such as the Albers equal-area conic projection, should be used if more accurate calculations of distance or area are required.
This product is generated from the USDA-NRCS certified data as of the version date(s) listed below.
Soil Survey Area: Elmore County, AlabamaSurvey Area Data: Version 14, Sep 25, 2017
Soil map units are labeled (as space allows) for map scales 1:50,000 or larger.
Date(s) aerial images were photographed: Jan 21, 2011—Feb 8, 2011
The orthophoto or other base map on which the soil lines were compiled and digitized probably differs from the background imagery displayed on these maps. As a result, some minor shifting of map unit boundaries may be evident.
Custom Soil Resource Report
7

Map Unit Legend
Map Unit Symbol Map Unit Name Acres in AOI Percent of AOI
Ba Bowie sandy loam 5.4 27.7%
Da Ducker loam 0.2 1.2%
Fe Faceville sandy loam, thick surface phase
3.3 16.8%
Ja Jamison fine sandy loam 0.0 0.0%
Oa Orangeburg fine sandy loam, slightly eroded phase
8.1 41.5%
Ra Rains loamy sand 0.1 0.6%
Rb Red Bay sandy loam 2.4 12.2%
Totals for Area of Interest 19.6 100.0%
Map Unit DescriptionsThe map units delineated on the detailed soil maps in a soil survey represent the soils or miscellaneous areas in the survey area. The map unit descriptions, along with the maps, can be used to determine the composition and properties of a unit.
A map unit delineation on a soil map represents an area dominated by one or more major kinds of soil or miscellaneous areas. A map unit is identified and named according to the taxonomic classification of the dominant soils. Within a taxonomic class there are precisely defined limits for the properties of the soils. On the landscape, however, the soils are natural phenomena, and they have the characteristic variability of all natural phenomena. Thus, the range of some observed properties may extend beyond the limits defined for a taxonomic class. Areas of soils of a single taxonomic class rarely, if ever, can be mapped without including areas of other taxonomic classes. Consequently, every map unit is made up of the soils or miscellaneous areas for which it is named and some minor components that belong to taxonomic classes other than those of the major soils.
Most minor soils have properties similar to those of the dominant soil or soils in the map unit, and thus they do not affect use and management. These are called noncontrasting, or similar, components. They may or may not be mentioned in a particular map unit description. Other minor components, however, have properties and behavioral characteristics divergent enough to affect use or to require different management. These are called contrasting, or dissimilar, components. They generally are in small areas and could not be mapped separately because of the scale used. Some small areas of strongly contrasting soils or miscellaneous areas are identified by a special symbol on the maps. If included in the database for a given area, the contrasting minor components are identified in the map unit descriptions along with some characteristics of each. A few areas of minor components may not have been observed, and consequently they are not mentioned in the descriptions, especially where the pattern was so complex that it
Custom Soil Resource Report
8
United StatesDepartment ofAgriculture
A product of the NationalCooperative Soil Survey,a joint effort of the UnitedStates Department ofAgriculture and otherFederal agencies, Stateagencies including theAgricultural ExperimentStations, and localparticipants
Custom Soil Resource Report for
Elmore County, AlabamaSTPAA-HSIP-0111(502)
NaturalResourcesConservationService
December 19, 2017
MAP 7
ContentsPreface.................................................................................................................... 2Soil Map.................................................................................................................. 5
Soil Map................................................................................................................6Legend..................................................................................................................7Map Unit Legend.................................................................................................. 8Map Unit Descriptions.......................................................................................... 8
Elmore County, Alabama................................................................................ 10Ba—Bowie sandy loam............................................................................... 10Da—Ducker loam........................................................................................ 11Ja—Jamison fine sandy loam..................................................................... 12Oa—Orangeburg fine sandy loam, slightly eroded phase...........................13Oc—Orangeburg fine sandy loam, eroded sloping phase.......................... 14Rb—Red Bay sandy loam........................................................................... 15
4

6
Custom Soil Resource ReportSoil Map
3610
400
3610
500
3610
600
3610
700
3610
800
3610
900
3611
000
3611
100
3611
200
3611
300
3611
400
3610
400
3610
500
3610
600
3610
700
3610
800
3610
900
3611
000
3611
100
3611
200
3611
300
3611
400
563800 563900 564000 564100 564200 564300 564400 564500 564600 564700 564800 564900 565000 565100 565200 565300 565400 565500
563800 563900 564000 564100 564200 564300 564400 564500 564600 564700 564800 564900 565000 565100 565200 565300 565400 565500
32° 38' 20'' N86
° 1
9' 1
3'' W
32° 38' 20'' N
86° 1
8' 5
'' W
32° 37' 43'' N
86° 1
9' 1
3'' W
32° 37' 43'' N
86° 1
8' 5
'' W
N
Map projection: Web Mercator Corner coordinates: WGS84 Edge tics: UTM Zone 16N WGS840 350 700 1400 2100
Feet0 100 200 400 600
MetersMap Scale: 1:8,120 if printed on A landscape (11" x 8.5") sheet.
Soil Map may not be valid at this scale.

MAP LEGEND MAP INFORMATION
Area of Interest (AOI)Area of Interest (AOI)
SoilsSoil Map Unit Polygons
Soil Map Unit Lines
Soil Map Unit Points
Special Point FeaturesBlowout
Borrow Pit
Clay Spot
Closed Depression
Gravel Pit
Gravelly Spot
Landfill
Lava Flow
Marsh or swamp
Mine or Quarry
Miscellaneous Water
Perennial Water
Rock Outcrop
Saline Spot
Sandy Spot
Severely Eroded Spot
Sinkhole
Slide or Slip
Sodic Spot
Spoil Area
Stony Spot
Very Stony Spot
Wet Spot
Other
Special Line Features
Water FeaturesStreams and Canals
TransportationRails
Interstate Highways
US Routes
Major Roads
Local Roads
BackgroundAerial Photography
The soil surveys that comprise your AOI were mapped at 1:20,000.
Warning: Soil Map may not be valid at this scale.
Enlargement of maps beyond the scale of mapping can cause misunderstanding of the detail of mapping and accuracy of soil line placement. The maps do not show the small areas of contrasting soils that could have been shown at a more detailed scale.
Please rely on the bar scale on each map sheet for map measurements.
Source of Map: Natural Resources Conservation ServiceWeb Soil Survey URL: Coordinate System: Web Mercator (EPSG:3857)
Maps from the Web Soil Survey are based on the Web Mercator projection, which preserves direction and shape but distorts distance and area. A projection that preserves area, such as the Albers equal-area conic projection, should be used if more accurate calculations of distance or area are required.
This product is generated from the USDA-NRCS certified data as of the version date(s) listed below.
Soil Survey Area: Elmore County, AlabamaSurvey Area Data: Version 14, Sep 25, 2017
Soil map units are labeled (as space allows) for map scales 1:50,000 or larger.
Date(s) aerial images were photographed: Jan 21, 2011—Feb 8, 2011
The orthophoto or other base map on which the soil lines were compiled and digitized probably differs from the background imagery displayed on these maps. As a result, some minor shifting of map unit boundaries may be evident.
Custom Soil Resource Report
7

Map Unit Legend
Map Unit Symbol Map Unit Name Acres in AOI Percent of AOI
Ba Bowie sandy loam 7.0 61.7%
Da Ducker loam 0.4 3.1%
Ja Jamison fine sandy loam 0.1 0.6%
Oa Orangeburg fine sandy loam, slightly eroded phase
3.5 30.6%
Oc Orangeburg fine sandy loam, eroded sloping phase
0.1 0.7%
Rb Red Bay sandy loam 0.4 3.3%
Totals for Area of Interest 11.4 100.0%
Map Unit DescriptionsThe map units delineated on the detailed soil maps in a soil survey represent the soils or miscellaneous areas in the survey area. The map unit descriptions, along with the maps, can be used to determine the composition and properties of a unit.
A map unit delineation on a soil map represents an area dominated by one or more major kinds of soil or miscellaneous areas. A map unit is identified and named according to the taxonomic classification of the dominant soils. Within a taxonomic class there are precisely defined limits for the properties of the soils. On the landscape, however, the soils are natural phenomena, and they have the characteristic variability of all natural phenomena. Thus, the range of some observed properties may extend beyond the limits defined for a taxonomic class. Areas of soils of a single taxonomic class rarely, if ever, can be mapped without including areas of other taxonomic classes. Consequently, every map unit is made up of the soils or miscellaneous areas for which it is named and some minor components that belong to taxonomic classes other than those of the major soils.
Most minor soils have properties similar to those of the dominant soil or soils in the map unit, and thus they do not affect use and management. These are called noncontrasting, or similar, components. They may or may not be mentioned in a particular map unit description. Other minor components, however, have properties and behavioral characteristics divergent enough to affect use or to require different management. These are called contrasting, or dissimilar, components. They generally are in small areas and could not be mapped separately because of the scale used. Some small areas of strongly contrasting soils or miscellaneous areas are identified by a special symbol on the maps. If included in the database for a given area, the contrasting minor components are identified in the map unit descriptions along with some characteristics of each. A few areas of minor components may not have been observed, and consequently they are not mentioned in the descriptions, especially where the pattern was so complex that it was impractical to make enough observations to identify all the soils and miscellaneous areas on the landscape.
Custom Soil Resource Report
8

United StatesDepartment ofAgriculture
A product of the NationalCooperative Soil Survey,a joint effort of the UnitedStates Department ofAgriculture and otherFederal agencies, Stateagencies including theAgricultural ExperimentStations, and localparticipants
Custom Soil Resource Report for
Elmore County, AlabamaSTPAA-HSIP-0111(502)
NaturalResourcesConservationService
December 19, 2017
MAP 8

ContentsPreface.................................................................................................................... 2Soil Map.................................................................................................................. 5
Soil Map................................................................................................................6Legend..................................................................................................................7Map Unit Legend.................................................................................................. 8Map Unit Descriptions.......................................................................................... 8
Elmore County, Alabama................................................................................ 10Ba—Bowie sandy loam............................................................................... 10Fe—Faceville sandy loam, thick surface phase.......................................... 11Oc—Orangeburg fine sandy loam, eroded sloping phase.......................... 12Pa—Pheba fine sandy loam........................................................................13
4

6
Custom Soil Resource ReportSoil Map
3610
800
3610
900
3611
000
3611
100
3611
200
3611
300
3611
400
3611
500
3610
800
3610
900
3611
000
3611
100
3611
200
3611
300
3611
400
3611
500
562900 563000 563100 563200 563300 563400 563500 563600 563700 563800 563900
562900 563000 563100 563200 563300 563400 563500 563600 563700 563800 563900 564000
32° 38' 22'' N86
° 1
9' 4
7'' W
32° 38' 22'' N
86° 1
9' 3
'' W
32° 37' 57'' N
86° 1
9' 4
7'' W
32° 37' 57'' N
86° 1
9' 3
'' W
N
Map projection: Web Mercator Corner coordinates: WGS84 Edge tics: UTM Zone 16N WGS840 250 500 1000 1500
Feet0 50 100 200 300
MetersMap Scale: 1:5,280 if printed on A landscape (11" x 8.5") sheet.
Soil Map may not be valid at this scale.

MAP LEGEND MAP INFORMATION
Area of Interest (AOI)Area of Interest (AOI)
SoilsSoil Map Unit Polygons
Soil Map Unit Lines
Soil Map Unit Points
Special Point FeaturesBlowout
Borrow Pit
Clay Spot
Closed Depression
Gravel Pit
Gravelly Spot
Landfill
Lava Flow
Marsh or swamp
Mine or Quarry
Miscellaneous Water
Perennial Water
Rock Outcrop
Saline Spot
Sandy Spot
Severely Eroded Spot
Sinkhole
Slide or Slip
Sodic Spot
Spoil Area
Stony Spot
Very Stony Spot
Wet Spot
Other
Special Line Features
Water FeaturesStreams and Canals
TransportationRails
Interstate Highways
US Routes
Major Roads
Local Roads
BackgroundAerial Photography
The soil surveys that comprise your AOI were mapped at 1:20,000.
Warning: Soil Map may not be valid at this scale.
Enlargement of maps beyond the scale of mapping can cause misunderstanding of the detail of mapping and accuracy of soil line placement. The maps do not show the small areas of contrasting soils that could have been shown at a more detailed scale.
Please rely on the bar scale on each map sheet for map measurements.
Source of Map: Natural Resources Conservation ServiceWeb Soil Survey URL: Coordinate System: Web Mercator (EPSG:3857)
Maps from the Web Soil Survey are based on the Web Mercator projection, which preserves direction and shape but distorts distance and area. A projection that preserves area, such as the Albers equal-area conic projection, should be used if more accurate calculations of distance or area are required.
This product is generated from the USDA-NRCS certified data as of the version date(s) listed below.
Soil Survey Area: Elmore County, AlabamaSurvey Area Data: Version 14, Sep 25, 2017
Soil map units are labeled (as space allows) for map scales 1:50,000 or larger.
Date(s) aerial images were photographed: Jan 21, 2011—Feb 8, 2011
The orthophoto or other base map on which the soil lines were compiled and digitized probably differs from the background imagery displayed on these maps. As a result, some minor shifting of map unit boundaries may be evident.
Custom Soil Resource Report
7

Map Unit Legend
Map Unit Symbol Map Unit Name Acres in AOI Percent of AOI
Ba Bowie sandy loam 5.8 79.2%
Fe Faceville sandy loam, thick surface phase
0.5 7.3%
Oc Orangeburg fine sandy loam, eroded sloping phase
0.5 6.7%
Pa Pheba fine sandy loam 0.5 6.8%
Totals for Area of Interest 7.3 100.0%
Map Unit DescriptionsThe map units delineated on the detailed soil maps in a soil survey represent the soils or miscellaneous areas in the survey area. The map unit descriptions, along with the maps, can be used to determine the composition and properties of a unit.
A map unit delineation on a soil map represents an area dominated by one or more major kinds of soil or miscellaneous areas. A map unit is identified and named according to the taxonomic classification of the dominant soils. Within a taxonomic class there are precisely defined limits for the properties of the soils. On the landscape, however, the soils are natural phenomena, and they have the characteristic variability of all natural phenomena. Thus, the range of some observed properties may extend beyond the limits defined for a taxonomic class. Areas of soils of a single taxonomic class rarely, if ever, can be mapped without including areas of other taxonomic classes. Consequently, every map unit is made up of the soils or miscellaneous areas for which it is named and some minor components that belong to taxonomic classes other than those of the major soils.
Most minor soils have properties similar to those of the dominant soil or soils in the map unit, and thus they do not affect use and management. These are called noncontrasting, or similar, components. They may or may not be mentioned in a particular map unit description. Other minor components, however, have properties and behavioral characteristics divergent enough to affect use or to require different management. These are called contrasting, or dissimilar, components. They generally are in small areas and could not be mapped separately because of the scale used. Some small areas of strongly contrasting soils or miscellaneous areas are identified by a special symbol on the maps. If included in the database for a given area, the contrasting minor components are identified in the map unit descriptions along with some characteristics of each. A few areas of minor components may not have been observed, and consequently they are not mentioned in the descriptions, especially where the pattern was so complex that it was impractical to make enough observations to identify all the soils and miscellaneous areas on the landscape.
The presence of minor components in a map unit in no way diminishes the usefulness or accuracy of the data. The objective of mapping is not to delineate pure taxonomic classes but rather to separate the landscape into landforms or
Custom Soil Resource Report
8
ALDOT CBMPP Version December 2016
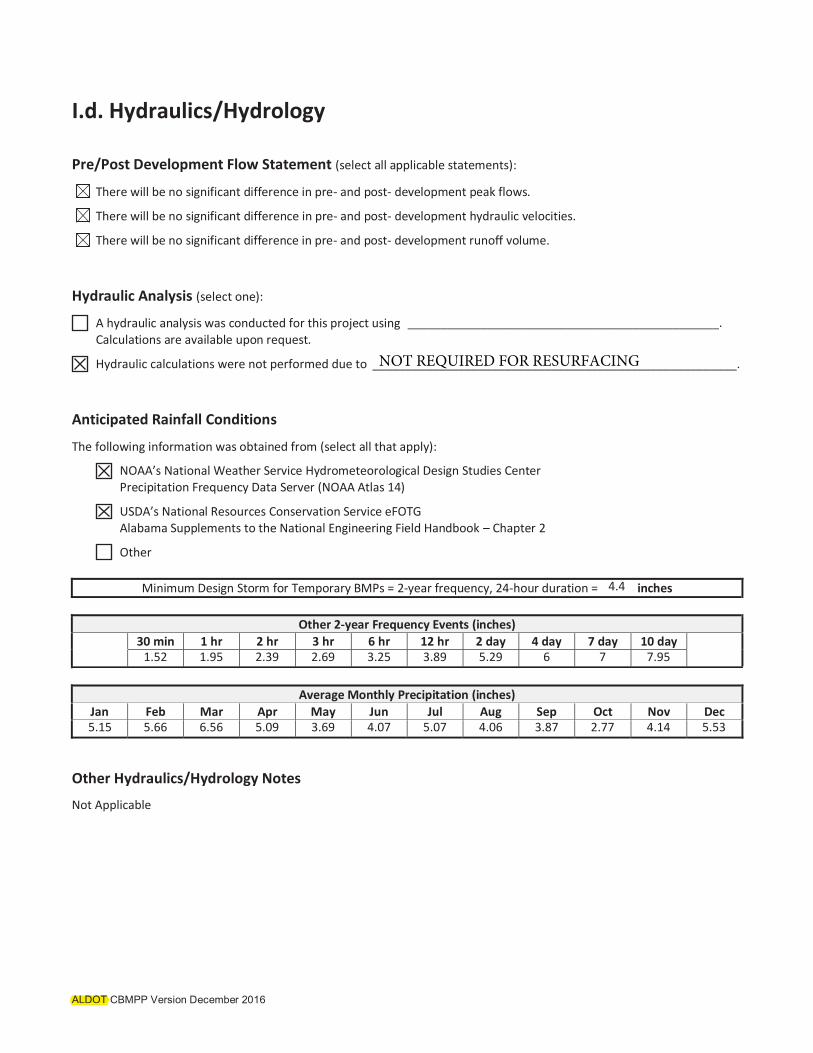
I.d. Hydraulics/Hydrology
Pre/Post Development Flow Statement (select all applicable statements):
There will be no significant difference in pre- and post- development peak flows.
There will be no significant difference in pre- and post- development hydraulic velocities.
There will be no significant difference in pre- and post- development runoff volume.
Hydraulic Analysis (select one):
A hydraulic analysis was conducted for this project using ____________________ . Calculations are available upon request.
Hydraulic calculations were not performed due to ____________________ .
Anticipated Rainfall Conditions
The following information was obtained from (select all that apply):
NOAA’s National Weather Service Hydrometeorological Design Studies Center Precipitation Frequency Data Server (NOAA Atlas 14)
USDA’s National Resources Conservation Service eFOTG Alabama Supplements to the National Engineering Field Handbook – Chapter 2
Other
Minimum Design Storm for Temporary BMPs = 2-year frequency, 24-hour duration = inches
Other 2-year Frequency Events (inches) 30 min 1 hr 2 hr 3 hr 6 hr 12 hr 2 day 4 day 7 day 10 day
Average Monthly Precipitation (inches) Jan Feb Mar Apr May Jun Jul Aug Sep Oct Nov Dec
Other Hydraulics/Hydrology Notes
Not Applicable
ALDOT
_______________________________________________________.
Not Applicable
NOT REQUIRED FOR RESURFACING
ALDOT CBMPP Version December 2016
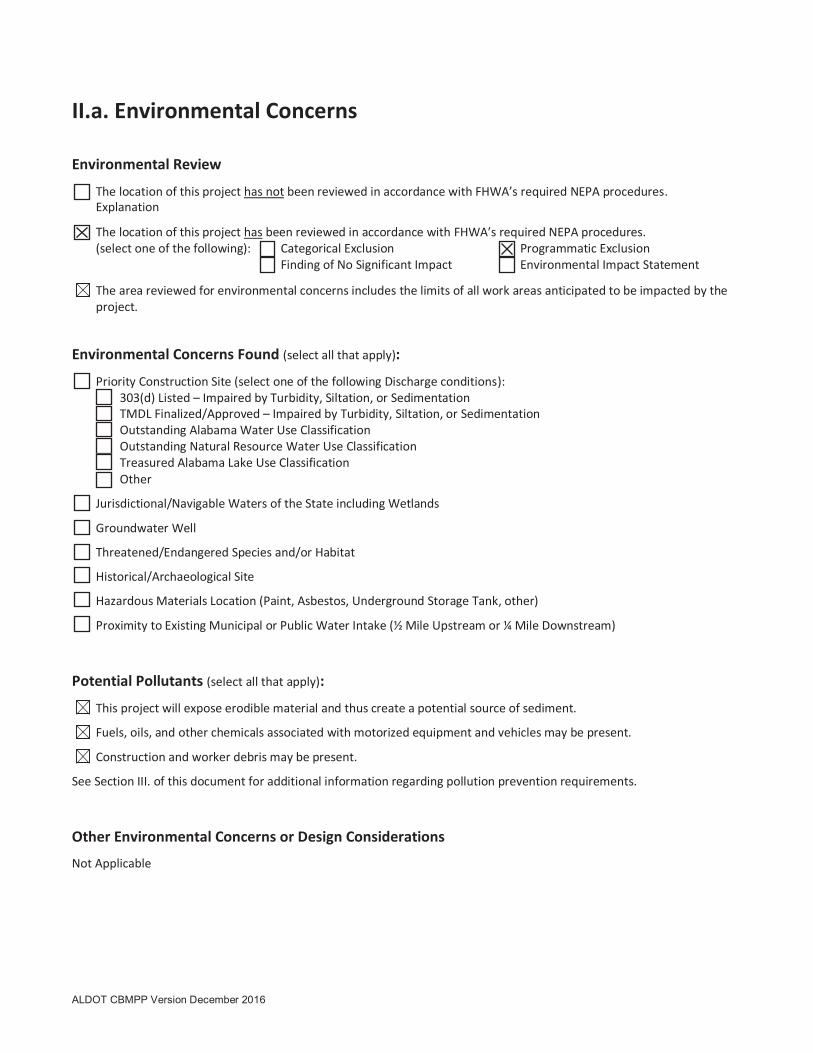
II.a. Environmental Concerns
Environmental Review
The location of this project has not been reviewed in accordance with FHWA’s required NEPA procedures. explanation
The location of this project has been reviewed in accordance with FHWA’s required NEPA procedures. (select one of the following): Categorical Exclusion Programmatic Exclusion
Finding of No Significant Impact Environmental Impact Statement
The area reviewed for environmental concerns includes the limits of all work areas anticipated to be impacted by the project.
Environmental Concerns Found (select all that apply):
Priority Construction Site (select one of the following Discharge conditions): 303(d) Listed – Impaired by Turbidity, Siltation, or Sedimentation TMDL Finalized/Approved – Impaired by Turbidity, Siltation, or Sedimentation Outstanding Alabama Water Use Classification Outstanding Natural Resource Water Use Classification Treasured Alabama Lake Use Classification
Other
Jurisdictional/Navigable Waters of the State including Wetlands
Groundwater Well
Threatened/Endangered Species and/or Habitat
Historical/Archaeological Site
Hazardous Materials Location (Paint, Asbestos, Underground Storage Tank, other)
Proximity to Existing Municipal or Public Water Intake (½ Mile Upstream or ¼ Mile Downstream)
Potential Pollutants (select all that apply):
This project will expose erodible material and thus create a potential source of sediment.
Fuels, oils, and other chemicals associated with motorized equipment and vehicles may be present.
Construction and worker debris may be present.
See Section III. of this document for additional information regarding pollution prevention requirements.
Other Environmental Concerns or Design Considerations
Not Applicable
Explanation
Not Applicable
ALDOT CBMPP Version December 2016
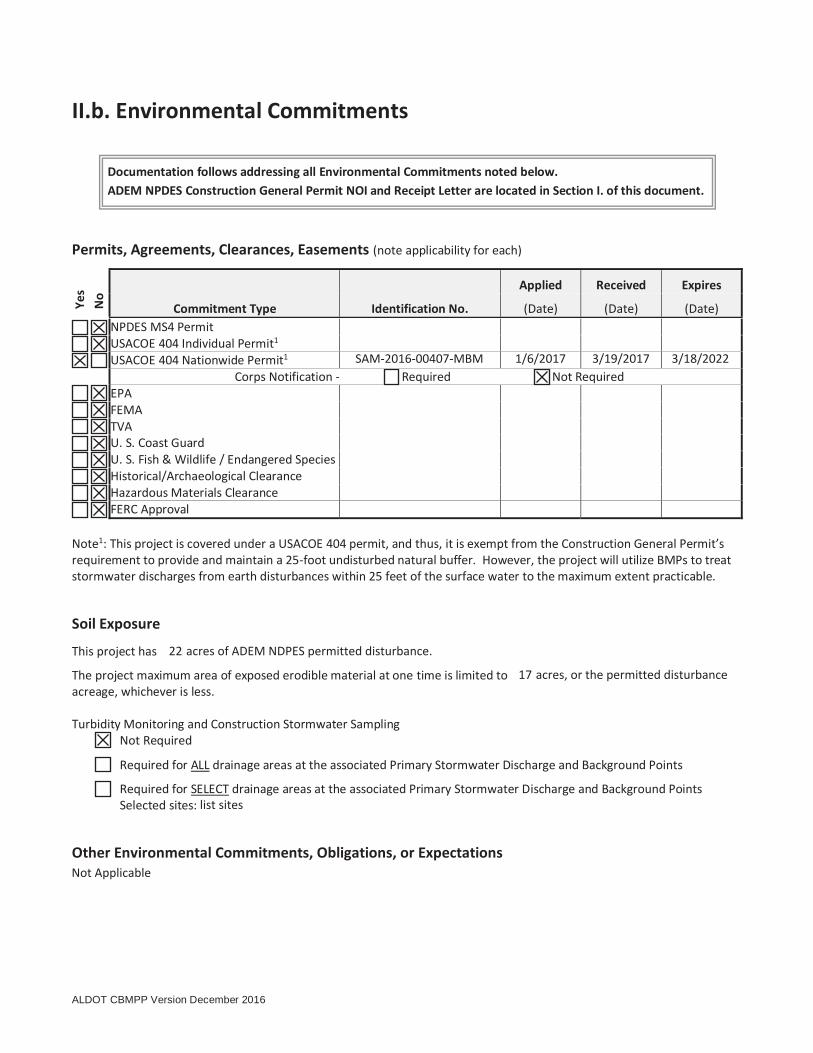
II.b. Environmental Commitments
Permits, Agreements, Clearances, Easements (note applicability for each)
Yes
No
Commitment Type Identification No.
Applied Received Expires
(Date) (Date) (Date) NPDES MS4 Permit USACOE 404 Individual Permit1 USACOE 404 Nationwide Permit1
Corps Notification - Required Not Required EPA FEMA TVA U. S. Coast Guard U. S. Fish & Wildlife / Endangered Species Historical/Archaeological Clearance Hazardous Materials Clearance FERC Approval
Note1: This project is covered under a USACOE 404 permit, and thus, it is exempt from the Construction General Permit’s requirement to provide and maintain a 25-foot undisturbed natural buffer. However, the project will utilize BMPs to treat stormwater discharges from earth disturbances within 25 feet of the surface water to the maximum extent practicable.
Soil Exposure
This project has 0 acres of ADEM NPDES permitted disturbance.
The project maximum area of exposed erodible material at one time is limited to 17 acres, or the permitted disturbance acreage, whichever is less. Turbidity Monitoring and Construction Stormwater Sampling Not Required
Required for ALL drainage areas at the associated Primary Stormwater Discharge and Background Points
Required for SELECT drainage areas at the associated Primary Stormwater Discharge and Background Points Selected sites: list sites
Other Environmental Commitments, Obligations, or Expectations
Not Applicable
Documentation follows addressing all Environmental Commitments noted below. ADEM NPDES Construction General Permit NOI and Receipt Letter are located in Section I. of this document.
22 acres of ADEM NDPES permitted disturbance.
17 acres, or the permitted disturbance
list sites
Not Applicable

ALDOT CBMPP Version December 2016
INSERT FINAL DOCUMENTATION
OF ALL ENVIRONMENTAL
COMMITMENTS
8.5” x 11” Preferred 11” x 17” Maximum
THIS PAGE TO BE REMOVED/REPLACED
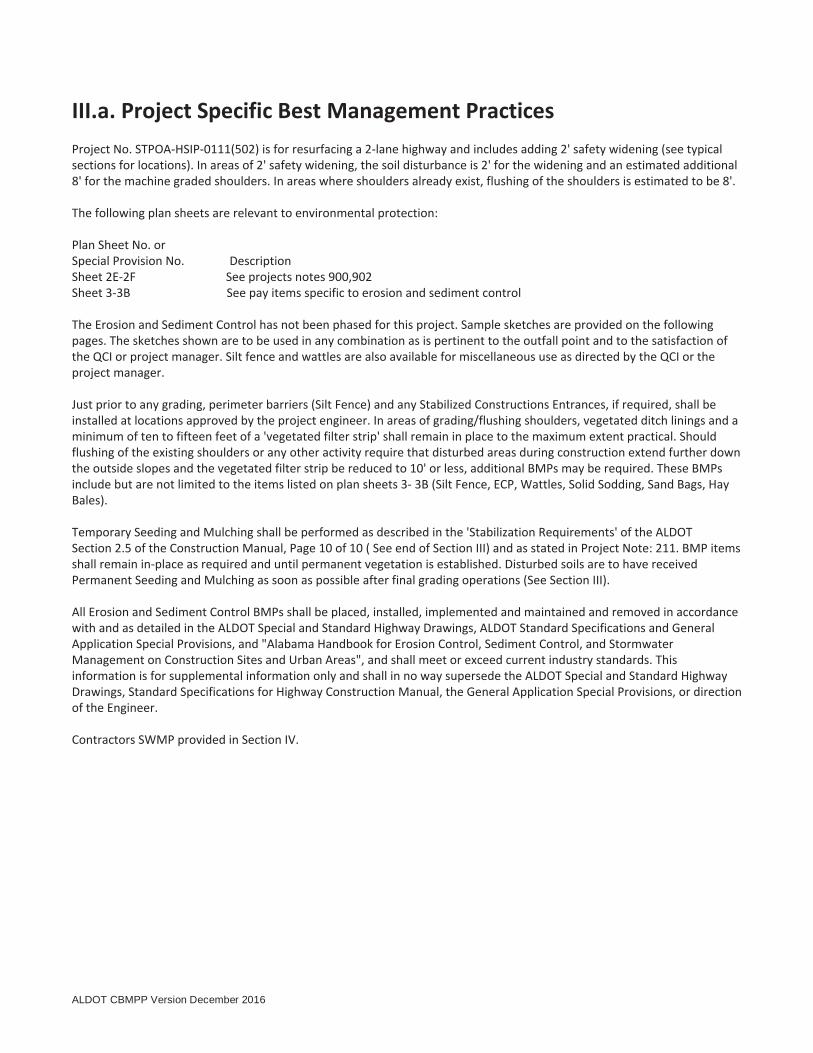
ALDOT CBMPP Version December 2016
III.a. Project Specific Best Management Practices
Not Applicable
Project No. STPOA-HSIP-0111(502) is for resurfacing a 2-lane highway and includes adding 2' safety widening (see typicalsections for locations). In areas of 2' safety widening, the soil disturbance is 2' for the widening and an estimated additional8' for the machine graded shoulders. In areas where shoulders already exist, flushing of the shoulders is estimated to be 8'.
The following plan sheets are relevant to environmental protection:
Plan Sheet No. orSpecial Provision No. DescriptionSheet 2E-2F See projects notes 900,902Sheet 3-3B See pay items specific to erosion and sediment control
The Erosion and Sediment Control has not been phased for this project. Sample sketches are provided on the followingpages. The sketches shown are to be used in any combination as is pertinent to the outfall point and to the satisfaction ofthe QCI or project manager. Silt fence and wattles are also available for miscellaneous use as directed by the QCI or theproject manager.
Just prior to any grading, perimeter barriers (Silt Fence) and any Stabilized Constructions Entrances, if required, shall beinstalled at locations approved by the project engineer. In areas of grading/flushing shoulders, vegetated ditch linings and aminimum of ten to fifteen feet of a 'vegetated filter strip' shall remain in place to the maximum extent practical. Shouldflushing of the existing shoulders or any other activity require that disturbed areas during construction extend further downthe outside slopes and the vegetated filter strip be reduced to 10' or less, additional BMPs may be required. These BMPsinclude but are not limited to the items listed on plan sheets 3- 3B (Silt Fence, ECP, Wattles, Solid Sodding, Sand Bags, HayBales).
Temporary Seeding and Mulching shall be performed as described in the 'Stabilization Requirements' of the ALDOTSection 2.5 of the Construction Manual, Page 10 of 10 ( See end of Section III) and as stated in Project Note: 211. BMP itemsshall remain in-place as required and until permanent vegetation is established. Disturbed soils are to have receivedPermanent Seeding and Mulching as soon as possible after final grading operations (See Section III).
All Erosion and Sediment Control BMPs shall be placed, installed, implemented and maintained and removed in accordancewith and as detailed in the ALDOT Special and Standard Highway Drawings, ALDOT Standard Specifications and GeneralApplication Special Provisions, and "Alabama Handbook for Erosion Control, Sediment Control, and StormwaterManagement on Construction Sites and Urban Areas", and shall meet or exceed current industry standards. Thisinformation is for supplemental information only and shall in no way supersede the ALDOT Special and Standard HighwayDrawings, Standard Specifications for Highway Construction Manual, the General Application Special Provisions, or directionof the Engineer.
Contractors SWMP provided in Section IV.

Name Latitude Longitude Milepost Offset Side
1.0 32°33'14.544" ‐86°12'58.216" 2.137 32 L2.0 32°33'20.209" ‐86°13'4.090" 2.382 40 R2.1 32°33'22.508" ‐86°13'7.659" 2.346 35 L2.2 32°33'22.240" ‐86°13'7.397" 2.353 35 L3.0 32°33'30.882" ‐86°13'15.955" 2.563 35 R4.0 32°33'37.837" ‐86°13'25.395" 2.765 35 R4.1 32°33'37.333" ‐86°13'25.904" 2.765 35 L5.0 32°33'41.926" ‐86°13'31.359" 2.891 35 L5.1 32°33'42.444" ‐86°13'30.907" 2.891 35 R6.0 32°33'52.493" ‐86°13'44.723" 3.176 45 R6.1 32°33'51.785" ‐86°13'45.300" 3.176 45 L7.0 32°34'1.920" ‐86°13'59.676" 3.479 40 R7.1 32°34'1.423" ‐86°14'0.220" 3.479 40 L8.0 32°34'23.687" ‐86°14'23.504" 4.063 40 R8.1 32°34'22.720" ‐86°14'23.687" 4.052 40 L9.0 32°34'51.593" ‐86°14'39.600" 4.678 135 R9.1 32°34'51.689" ‐86°14'43.115" 4.690 135 L9.A 32°34'51.536" ‐86°14'42.200" 4.682 75 L9.B 32°34'51.064" ‐86°14'42.115" 4.674 75 L9.C 32°34'51.673" ‐86°14'40.455" 4.682 75 R9.D 32°34'51.136" ‐86°14'40.183" 4.670 75 R10.0 32°35'10.615" ‐86°14'56.510" 5.121 40 L10.1 32°35'11.007" ‐86°14'55.689" 5.121 40 R11.0 32°35'31.381" ‐86°15'16.325" 5.636 30 R12.0 32°35'44.435" ‐86°15'28.038" 5.961 30 R13.0 32°35'56.364" ‐86°15'30.138" 6.193 30 L13.1 32°35'56.486" ‐86°15'29.413" 6.193 30 R14.0 32°36'16.431" ‐86°15'36.053" 6.591 40 L14.1 32°36'16.750" ‐86°15'35.021" 6.591 40 R15.0 32°36'25.386" ‐86°15'41.659" 6.787 35 L15.1 32°36'25.762" ‐86°15'41.064" 6.787 35 R16.0 32°36'29.868" ‐86°15'45.928" 6.899 35 L16.1 32°36'30.453" ‐86°15'45.331" 6.899 35 R17.0 32°36'37.869" ‐86°15'58.496" 7.158 35 L17.1 32°36'38.502" ‐86°15'58.073" 7.158 35 R18.0 32°36'41.057" ‐86°16'4.390" 7.272 40 L
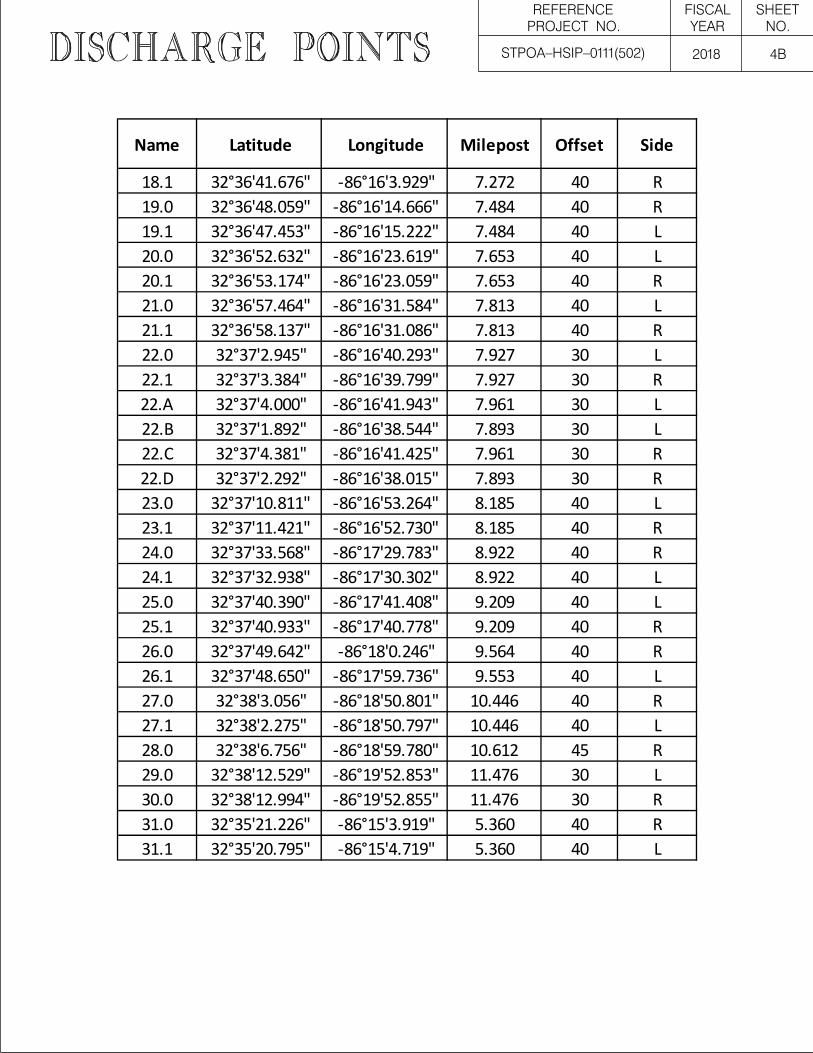
Name Latitude Longitude Milepost Offset Side
18.1 32°36'41.676" ‐86°16'3.929" 7.272 40 R19.0 32°36'48.059" ‐86°16'14.666" 7.484 40 R19.1 32°36'47.453" ‐86°16'15.222" 7.484 40 L20.0 32°36'52.632" ‐86°16'23.619" 7.653 40 L20.1 32°36'53.174" ‐86°16'23.059" 7.653 40 R21.0 32°36'57.464" ‐86°16'31.584" 7.813 40 L21.1 32°36'58.137" ‐86°16'31.086" 7.813 40 R22.0 32°37'2.945" ‐86°16'40.293" 7.927 30 L22.1 32°37'3.384" ‐86°16'39.799" 7.927 30 R22.A 32°37'4.000" ‐86°16'41.943" 7.961 30 L22.B 32°37'1.892" ‐86°16'38.544" 7.893 30 L22.C 32°37'4.381" ‐86°16'41.425" 7.961 30 R22.D 32°37'2.292" ‐86°16'38.015" 7.893 30 R23.0 32°37'10.811" ‐86°16'53.264" 8.185 40 L23.1 32°37'11.421" ‐86°16'52.730" 8.185 40 R24.0 32°37'33.568" ‐86°17'29.783" 8.922 40 R24.1 32°37'32.938" ‐86°17'30.302" 8.922 40 L25.0 32°37'40.390" ‐86°17'41.408" 9.209 40 L25.1 32°37'40.933" ‐86°17'40.778" 9.209 40 R26.0 32°37'49.642" ‐86°18'0.246" 9.564 40 R26.1 32°37'48.650" ‐86°17'59.736" 9.553 40 L27.0 32°38'3.056" ‐86°18'50.801" 10.446 40 R27.1 32°38'2.275" ‐86°18'50.797" 10.446 40 L28.0 32°38'6.756" ‐86°18'59.780" 10.612 45 R29.0 32°38'12.529" ‐86°19'52.853" 11.476 30 L30.0 32°38'12.994" ‐86°19'52.855" 11.476 30 R31.0 32°35'21.226" ‐86°15'3.919" 5.360 40 R31.1 32°35'20.795" ‐86°15'4.719" 5.360 40 L
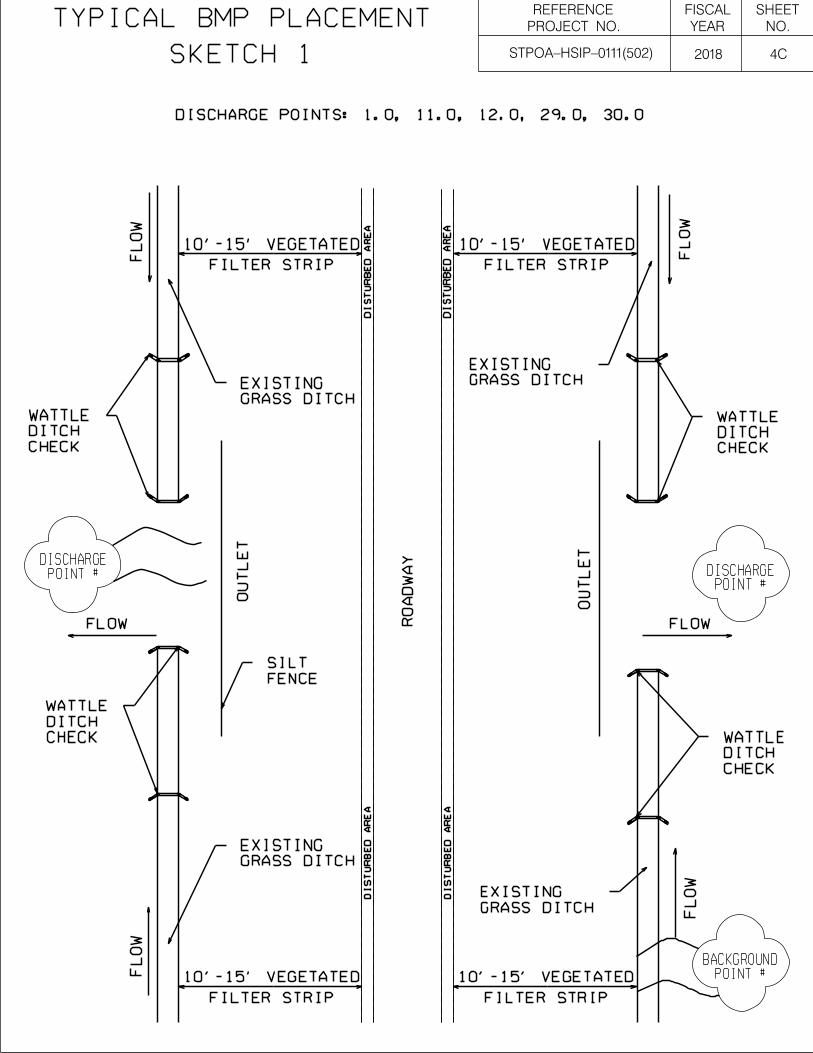

ALDOT CBMPP Version December 2016
IF APPLICABLE, INSERT TSS%
LOAD REDUCTION SCHEMATIC
THIS PAGE TO BE REMOVED/REPLACED
ALDOT CBMPP Version December 2016
INSERT PROJECT SPECIFIC SPECIAL
PROVISIONS (Relevant to Environmental Protection)
THIS PAGE TO BE REMOVED/REPLACED

ALDOT CBMPP Version December 2016
III.b. Standard Best Management Practices
ALDOT Standard Specifications and General Applications Special Provisions Contract specification requirements regarding environmental protection during construction may be found in the ALDOT Standard Specifications for Highway Construction or in the contract document in the form of a special provision. Special provisions may be General Application Special Provisions approved for general use and incorporation into the standard specifications in the future or as Project Specific Special Provisions created specifically for the project at hand. Please reference the following applicable 2012 ALDOT Standard Specifications sections.
106.01(b) Clearances and Acknowledgements for the Use of Offsite Areas - GASP 12-0399(3). 106.01(c) Operation of Offsite Pits and Waste Areas. 107.09 Construction Over or Adjacent to Waters of the United States. 107.12 Protection and Restoration of Property, Landscape and Utility Facilities. 107.13 Woodland Protection, Conservation, Abatement of Water Pollution and Quarantine Regulations. 107.14 Responsibility for Damage Claims. 107.21 Stormwater Management. 107.22 Environmental Protection and Spill Prevention. 107.23 Temporary Construction Encroachment into Streams, Water Bodies and Wetlands. 107.24 Permits for Pesticide Application. 108.04 Prosecution of Work.
201.03 Clearing and Grubbing. 205.03 Removal and Relocation of Structures. 206.04 Disposal of Materials. 210.03 Excavation and Embankment. 250.03 Removal of Underground Storage Tanks and Contaminated Soil.
521.04 Blast Cleaning, Mechanical Cleaning and Surface Roughness. 521.05 Containment System for Removal of Coating from Existing Bridge. 521.06 Collection and Disposal of Coating Material Waste from Existing Bridge. 521.07 Surface Preparation Plan Submittal for the Removal of Existing Coatings. 521.08 Final Cleaning of Blast Cleaned Surfaces. 521.14 Worker Protection. 524.03(a)2. Water Quality Protection 534 Cleaning Existing Drainage Structures.
650 Topsoil. 652 Ground Preparation, Vegetation Establishment and Mowing. 654 Solid Sodding. 656 Mulching for Vegetation Establishment. 659 Rolled and Hydraulic Erosion Control Products. 665 Temporary Soil Erosion and Sediment Control - GASP 12-0399(3). 666 Pest Control. 668 Pre-Emergent Herbicide Treatment. 669 Post-Emergent Herbicide Treatment. 672 Stormwater Turbidity Control - GASP 12-0575.
810 Geotextiles. 814 Riprap Materials. 860.01 Seed. 860.03 Mulching Material. 860.05 Solid Sod. 860.11 Rolled and Hydraulic Erosion Control Products.
2012
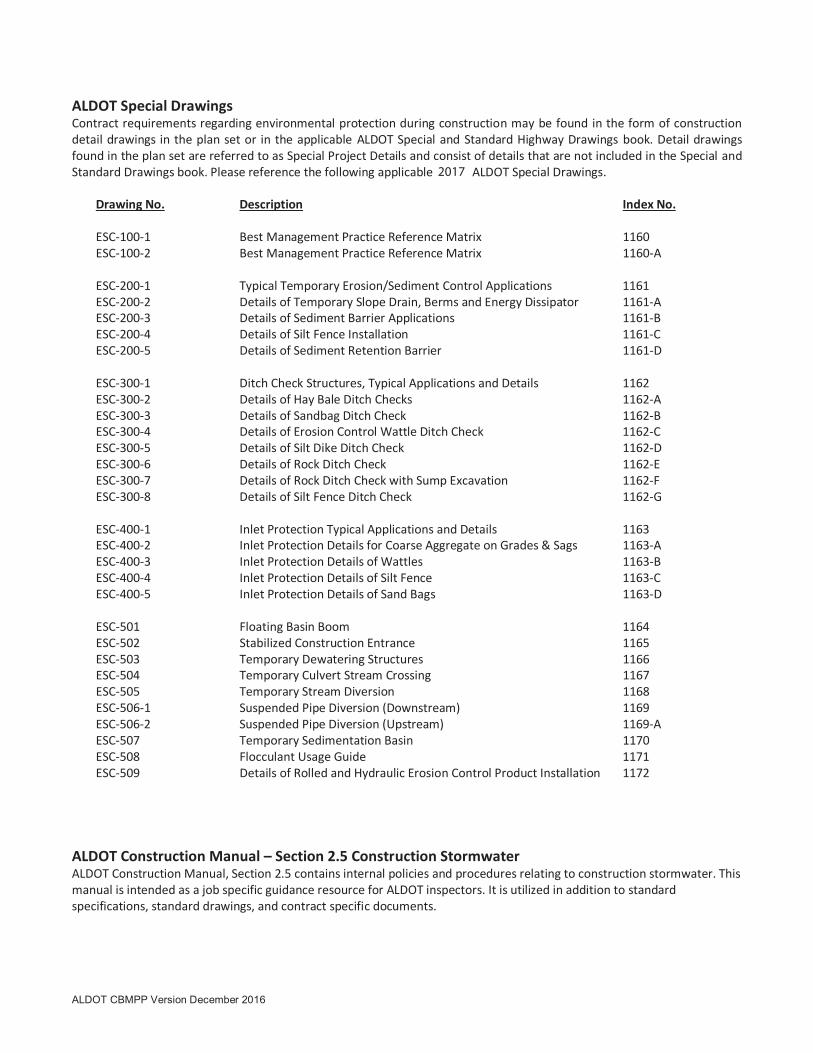
ALDOT CBMPP Version December 2016
ALDOT Special DrawingsContract requirements regarding environmental protection during construction may be found in the form of construction detail drawings in the plan set or in the applicable ALDOT Special and Standard Highway Drawings book. Detail drawings found in the plan set are referred to as Special Project Details and consist of details that are not included in the Special and Standard Drawings book. Please reference the following applicable 2017 ALDOT Special Drawings.
Drawing No. Description Index No.
ESC-100-1 Best Management Practice Reference Matrix 1160 ESC-100-2 Best Management Practice Reference Matrix 1160-A
ESC-200-1 Typical Temporary Erosion/Sediment Control Applications 1161 ESC-200-2 Details of Temporary Slope Drain, Berms and Energy Dissipator 1161-A ESC-200-3 Details of Sediment Barrier Applications 1161-B ESC-200-4 Details of Silt Fence Installation 1161-C ESC-200-5 Details of Sediment Retention Barrier 1161-D
ESC-300-1 Ditch Check Structures, Typical Applications and Details 1162 ESC-300-2 Details of Hay Bale Ditch Checks 1162-A ESC-300-3 Details of Sandbag Ditch Check 1162-B ESC-300-4 Details of Erosion Control Wattle Ditch Check 1162-C ESC-300-5 Details of Silt Dike Ditch Check 1162-D ESC-300-6 Details of Rock Ditch Check 1162-E ESC-300-7 Details of Rock Ditch Check with Sump Excavation 1162-F ESC-300-8 Details of Silt Fence Ditch Check 1162-G
ESC-400-1 Inlet Protection Typical Applications and Details 1163 ESC-400-2 Inlet Protection Details for Coarse Aggregate on Grades & Sags 1163-A ESC-400-3 Inlet Protection Details of Wattles 1163-B ESC-400-4 Inlet Protection Details of Silt Fence 1163-C ESC-400-5 Inlet Protection Details of Sand Bags 1163-D
ESC-501 Floating Basin Boom 1164 ESC-502 Stabilized Construction Entrance 1165 ESC-503 Temporary Dewatering Structures 1166 ESC-504 Temporary Culvert Stream Crossing 1167 ESC-505 Temporary Stream Diversion 1168 ESC-506-1 Suspended Pipe Diversion (Downstream) 1169ESC-506-2 Suspended Pipe Diversion (Upstream) 1169-AESC-507 Temporary Sedimentation Basin 1170 ESC-508 Flocculant Usage Guide 1171 ESC-509 Details of Rolled and Hydraulic Erosion Control Product Installation 1172
ALDOT Construction Manual – Section 2.5 Construction Stormwater ALDOT Construction Manual, Section 2.5 contains internal policies and procedures relating to construction stormwater. This manual is intended as a job specific guidance resource for ALDOT inspectors. It is utilized in addition to standard specifications, standard drawings, and contract specific documents.
2017

ALDOT CBMPP Version December 2016
ALDOT Approved Treatment Chemicals Contract requirements regarding flocculants and chemical stabilization during construction may be found in the form of contract pay items on the Quantities Sheets and their usage locations are shown on the Erosion and Sediment Control Sheets in the plan set. Proper usage requirements are included in the applicable 2017 ALDOT Special and Standard Highway Drawings book and applicable 2012 ALDOT Specifications. These products may only be used if they have been reviewed and included on the applicable approved products lists of the ALDOT Materials, Sources, and Devices with Special Acceptance Requirements Manual which is maintained on the ALDOT website. Safety Data Sheets and manufacturer’s dosage instructions for these products are also maintained on the ALDOT website. Please visit the applicable ALDOT webpages for the most current information. Specific products selected for use on a project and associated documentation is submitted as part of the Contractor’s Stormwater Management Plan and included in the CBMPP after project award.
Flocculants APS 700 Series Applied Polymer Systems EnviroPam (Granular) Innovative Turf Solutions FLOC Innovative Turf Solutions HaloKlear/StormKlear DBP-2100 & Gel Floc (System) HaloSource, Inc. Tackifiers FINN HydroStik FINN Corporation Tacking Agent 3 Profile Products EnviroPam (Granular) Innovative Turf Solutions Enviro-Tak Central Fiber Hydraulic Mulches Conwed Fibers Hydro Mulch 2000 Profile Products EcoFibre Plus Tackifier Profile Products Enviro-Mix Wood Fiber Blend Central Fiber HydroCover Wood Fiber with Tack Profile Products Hydro-Spray Wood with Tack Profile Products Second Nature Wood Fiber Blend Central Fiber SoilCover Wood Fiber with Tack Profile Products Terra-Wood with Tacking Agent 3 Profile Products Hydraulic Erosion Control Products Safe Slope Xtreme Landmark Earth Solutions ProMatrix Profile Products Ground Control HY-C3 East Coast HydraCM North American Green HydroStraw Bonded Fiber Matrix HydroStraw, LLC Bindex BFM American Excelsior EcoMatrix Profile Products Enviro-Matt Central Fiber Ground Control HY-C4 East Coast Hydra CX2 North American Green SprayMatt Central Fiber EnviroMatrix Central Fiber Flexterra HP-FGM Profile Products SprayMatrix Central Fiber EarthGuard Terra Novo, Inc.
20122017