Embed Size (px)
Citation preview

1
ENERGY INNOVATIONS SMALL GRANT (EISG) PROGRAM
EISG FINAL REPORT
CONSTRUCTION AND TESTING OF A HIGH EFFICIENCY SOLAR WATER STILL
EISG AWARDEEThe Starburst Foundation
Email: [email protected]
AUTHORPaul LaViolette, Ph.D., Principal Investigator
Grant Number: 03-07/04
Grant Funding: $74,998
Term: January 2004 – January 31, 2005
PIER Subject Area: Industrial/Agricultural/Water End-Use Efficiency
For EISG PA Use Only -----Do Not Write Below This Line
Did PI call to obtain FormatInstructions briefing?
Report returned to PI or sent out forTR?
Was an outline submitted to the PA? Is TR evaluation and manual mark-upconsistent with policy
Was receipt of outlineacknowledged by “Next Steps”memo to PI?
Was Formal comment letter sent to PI
Is proffered report complete, formatand content compliant?
Was Revised final report received?

2
Legal Notice
This report was prepared as a result of work sponsored by the California Energy Commission(Commission). It does not necessarily represent the views of the Commission, its employees, orthe State of California. The Commission, the State of California, its employees, contractors, andsubcontractors make no warranty, express or implied, and assume no legal liability for theinformation in this report; nor does any party represent that the use of this information will notinfringe upon privately owned rights. This report has not been approved or disapproved by theCommission nor has the Commission passed upon the accuracy or adequacy of the informationin this report.
Inquires related to this final report should be directed to the Awardee (see contact information oncover page) or the EISG Program Administrator at (619) 594-1049 or [email protected].

3
I am very grateful to Fred LaViolette, David Zoldoske, Greg Jorgensen, and Raphael Allendefor their interest and help on this project. Also I would like to thank others at the CaliforniaWater Institute for their help and support.

4
Table of Contents
Abstract………………………………………………………………………………… 6
Executive Summary…………..…………………………………………………….… 7
Introduction………………………………………………………………………….… 9
Project Objectives………………………………….………………………….……… 10
Project Approach……………………………………………..………………….…… 11
Project Outcomes……………………………………………………..……………… 29
Conclusions…….……………………………………………………..……………… 32
Recommendations……………………………………………………..……………… 33
Public Benefits to California ………………………………………………………… 33
Development Status Questionnaire ..……………………………………………… 34
Appendix A: Additional Diagrams, Photos, and Tables…………………………… 37
5
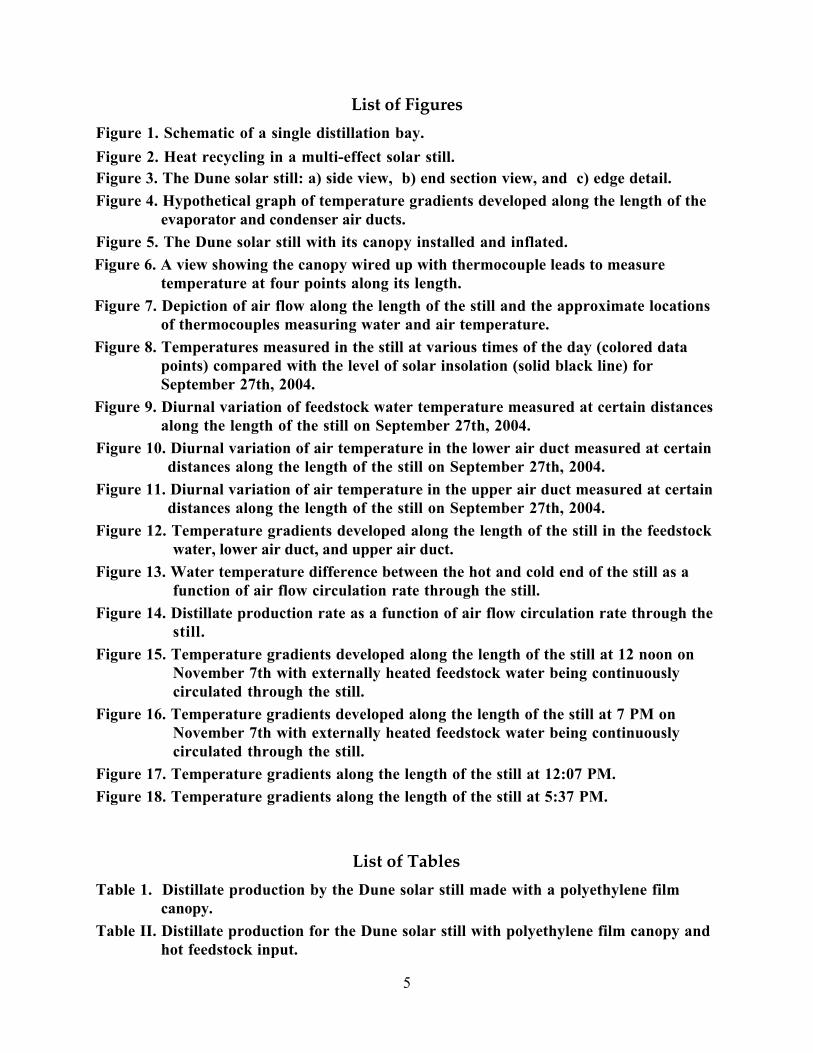
List of Figures
Figure 1. Schematic of a single distillation bay.
Figure 2. Heat recycling in a multi-effect solar still.Figure 3. The Dune solar still: a) side view, b) end section view, and c) edge detail.Figure 4. Hypothetical graph of temperature gradients developed along the length of the
evaporator and condenser air ducts.Figure 5. The Dune solar still with its canopy installed and inflated.Figure 6. A view showing the canopy wired up with thermocouple leads to measure
temperature at four points along its length.Figure 7. Depiction of air flow along the length of the still and the approximate locations
of thermocouples measuring water and air temperature.Figure 8. Temperatures measured in the still at various times of the day (colored data
points) compared with the level of solar insolation (solid black line) forSeptember 27th, 2004.
Figure 9. Diurnal variation of feedstock water temperature measured at certain distancesalong the length of the still on September 27th, 2004.
Figure 10. Diurnal variation of air temperature in the lower air duct measured at certaindistances along the length of the still on September 27th, 2004.
Figure 11. Diurnal variation of air temperature in the upper air duct measured at certaindistances along the length of the still on September 27th, 2004.
Figure 12. Temperature gradients developed along the length of the still in the feedstockwater, lower air duct, and upper air duct.
Figure 13. Water temperature difference between the hot and cold end of the still as afunction of air flow circulation rate through the still.
Figure 14. Distillate production rate as a function of air flow circulation rate through thestill.
Figure 15. Temperature gradients developed along the length of the still at 12 noon onNovember 7th with externally heated feedstock water being continuouslycirculated through the still.
Figure 16. Temperature gradients developed along the length of the still at 7 PM onNovember 7th with externally heated feedstock water being continuouslycirculated through the still.
Figure 17. Temperature gradients along the length of the still at 12:07 PM.Figure 18. Temperature gradients along the length of the still at 5:37 PM.
List of Tables
Table 1. Distillate production by the Dune solar still made with a polyethylene filmcanopy.
Table II. Distillate production for the Dune solar still with polyethylene film canopy andhot feedstock input.

6
AbstractThe present study tested the feasibility of a new type of solar still which covers an elongated
pool of feedstock water with an inflatable transparent plastic film canopy and uses a fan to blowair along the length of the pool allowing it to return through an overlying transparent air ductwhere it condenses its acquired vapor. A prototype still was built and shown to successfullydistill water. The still was tested to determine whether its rate of daily water production wouldexceed the milestone goal of 2.5 gal/m2/day and whether its rate of power consumption per gallonof water distilled would be less than 4 Wh/gal. Tests showed that the prototype's performancefell far short of these goals, producing 0.5 gal/m2/day at the end of September with a powerconsumption of 47 Wh/gal. The prototype was calculated to have a distillation efficiency of25%, or 30% if its canopy were fabricated of PFA Teflon film instead of polyethylene. Theseresults demonstrate that the still operates as a single-effect still, rather than as a multi-effect still,with an efficiency comparable to that of a conventional greenhouse solar still. If fabricated with aPFA film canopy, it is projected to produce water at an average cost of $16,400/AF, as comparedwith $1,000/AF for a reverse osmosis desalinator. We conclude that this solar desalinationtechnology is not feasible in comparison with existing desalination technologies.
Key words: solar, water desalination, still, multi-effect, water re-use
7
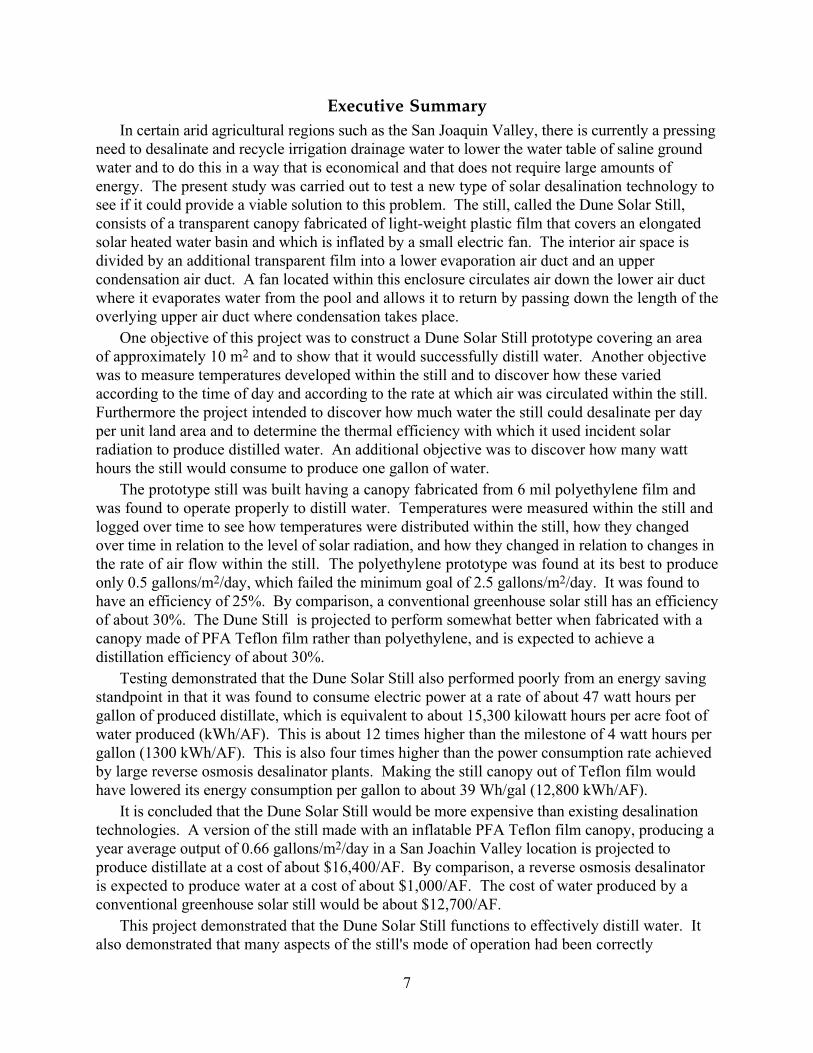
Executive SummaryIn certain arid agricultural regions such as the San Joaquin Valley, there is currently a pressing
need to desalinate and recycle irrigation drainage water to lower the water table of saline groundwater and to do this in a way that is economical and that does not require large amounts ofenergy. The present study was carried out to test a new type of solar desalination technology tosee if it could provide a viable solution to this problem. The still, called the Dune Solar Still,consists of a transparent canopy fabricated of light-weight plastic film that covers an elongatedsolar heated water basin and which is inflated by a small electric fan. The interior air space isdivided by an additional transparent film into a lower evaporation air duct and an uppercondensation air duct. A fan located within this enclosure circulates air down the lower air ductwhere it evaporates water from the pool and allows it to return by passing down the length of theoverlying upper air duct where condensation takes place.
One objective of this project was to construct a Dune Solar Still prototype covering an areaof approximately 10 m2 and to show that it would successfully distill water. Another objectivewas to measure temperatures developed within the still and to discover how these variedaccording to the time of day and according to the rate at which air was circulated within the still.Furthermore the project intended to discover how much water the still could desalinate per dayper unit land area and to determine the thermal efficiency with which it used incident solarradiation to produce distilled water. An additional objective was to discover how many watthours the still would consume to produce one gallon of water.
The prototype still was built having a canopy fabricated from 6 mil polyethylene film andwas found to operate properly to distill water. Temperatures were measured within the still andlogged over time to see how temperatures were distributed within the still, how they changedover time in relation to the level of solar radiation, and how they changed in relation to changes inthe rate of air flow within the still. The polyethylene prototype was found at its best to produceonly 0.5 gallons/m2/day, which failed the minimum goal of 2.5 gallons/m2/day. It was found tohave an efficiency of 25%. By comparison, a conventional greenhouse solar still has an efficiencyof about 30%. The Dune Still is projected to perform somewhat better when fabricated with acanopy made of PFA Teflon film rather than polyethylene, and is expected to achieve adistillation efficiency of about 30%.
Testing demonstrated that the Dune Solar Still also performed poorly from an energy savingstandpoint in that it was found to consume electric power at a rate of about 47 watt hours pergallon of produced distillate, which is equivalent to about 15,300 kilowatt hours per acre foot ofwater produced (kWh/AF). This is about 12 times higher than the milestone of 4 watt hours pergallon (1300 kWh/AF). This is also four times higher than the power consumption rate achievedby large reverse osmosis desalinator plants. Making the still canopy out of Teflon film wouldhave lowered its energy consumption per gallon to about 39 Wh/gal (12,800 kWh/AF).
It is concluded that the Dune Solar Still would be more expensive than existing desalinationtechnologies. A version of the still made with an inflatable PFA Teflon film canopy, producing ayear average output of 0.66 gallons/m2/day in a San Joachin Valley location is projected toproduce distillate at a cost of about $16,400/AF. By comparison, a reverse osmosis desalinatoris expected to produce water at a cost of about $1,000/AF. The cost of water produced by aconventional greenhouse solar still would be about $12,700/AF.
This project demonstrated that the Dune Solar Still functions to effectively distill water. Italso demonstrated that many aspects of the still's mode of operation had been correctly
8
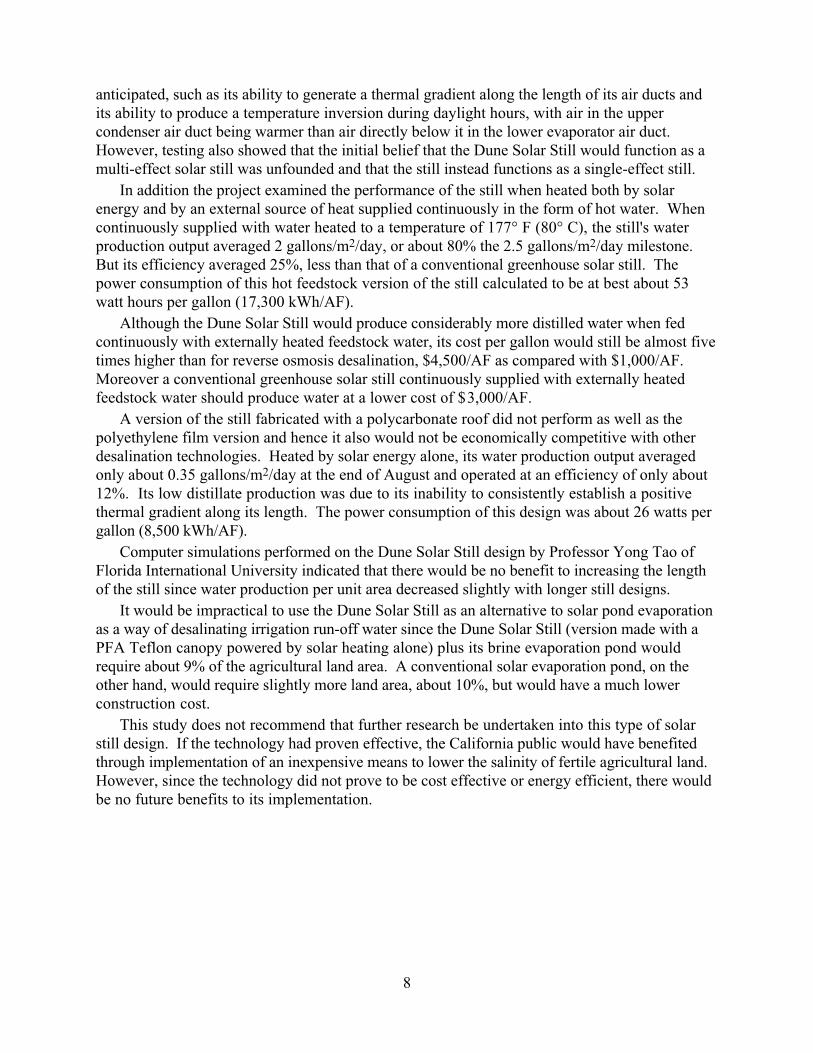
anticipated, such as its ability to generate a thermal gradient along the length of its air ducts andits ability to produce a temperature inversion during daylight hours, with air in the uppercondenser air duct being warmer than air directly below it in the lower evaporator air duct.However, testing also showed that the initial belief that the Dune Solar Still would function as amulti-effect solar still was unfounded and that the still instead functions as a single-effect still.
In addition the project examined the performance of the still when heated both by solarenergy and by an external source of heat supplied continuously in the form of hot water. Whencontinuously supplied with water heated to a temperature of 177° F (80° C), the still's waterproduction output averaged 2 gallons/m2/day, or about 80% the 2.5 gallons/m2/day milestone.But its efficiency averaged 25%, less than that of a conventional greenhouse solar still. Thepower consumption of this hot feedstock version of the still calculated to be at best about 53watt hours per gallon (17,300 kWh/AF).
Although the Dune Solar Still would produce considerably more distilled water when fedcontinuously with externally heated feedstock water, its cost per gallon would still be almost fivetimes higher than for reverse osmosis desalination, $4,500/AF as compared with $1,000/AF.Moreover a conventional greenhouse solar still continuously supplied with externally heatedfeedstock water should produce water at a lower cost of $3,000/AF.
A version of the still fabricated with a polycarbonate roof did not perform as well as thepolyethylene film version and hence it also would not be economically competitive with otherdesalination technologies. Heated by solar energy alone, its water production output averagedonly about 0.35 gallons/m2/day at the end of August and operated at an efficiency of only about12%. Its low distillate production was due to its inability to consistently establish a positivethermal gradient along its length. The power consumption of this design was about 26 watts pergallon (8,500 kWh/AF).
Computer simulations performed on the Dune Solar Still design by Professor Yong Tao ofFlorida International University indicated that there would be no benefit to increasing the lengthof the still since water production per unit area decreased slightly with longer still designs.
It would be impractical to use the Dune Solar Still as an alternative to solar pond evaporationas a way of desalinating irrigation run-off water since the Dune Solar Still (version made with aPFA Teflon canopy powered by solar heating alone) plus its brine evaporation pond wouldrequire about 9% of the agricultural land area. A conventional solar evaporation pond, on theother hand, would require slightly more land area, about 10%, but would have a much lowerconstruction cost.
This study does not recommend that further research be undertaken into this type of solarstill design. If the technology had proven effective, the California public would have benefitedthrough implementation of an inexpensive means to lower the salinity of fertile agricultural land.However, since the technology did not prove to be cost effective or energy efficient, there wouldbe no future benefits to its implementation.
9
IntroductionThe purpose of this project has been to determine the feasibility, performance, and operating
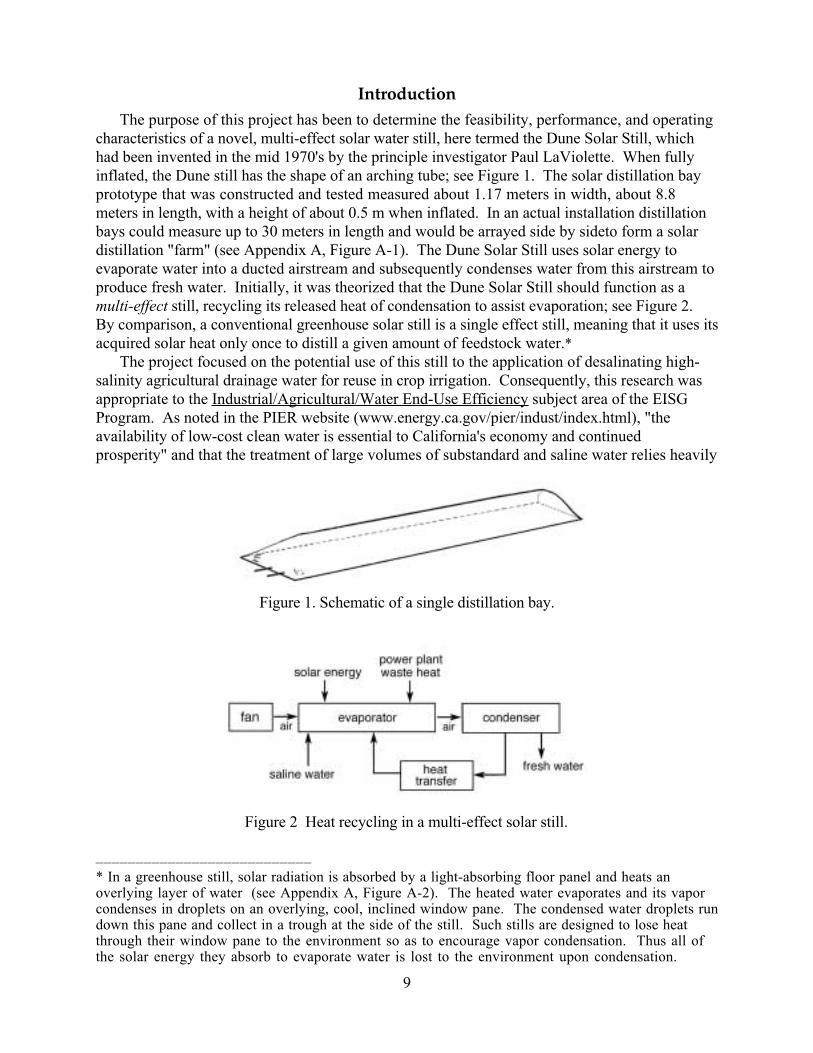
characteristics of a novel, multi-effect solar water still, here termed the Dune Solar Still, whichhad been invented in the mid 1970's by the principle investigator Paul LaViolette. When fullyinflated, the Dune still has the shape of an arching tube; see Figure 1. The solar distillation bayprototype that was constructed and tested measured about 1.17 meters in width, about 8.8meters in length, with a height of about 0.5 m when inflated. In an actual installation distillationbays could measure up to 30 meters in length and would be arrayed side by sideto form a solardistillation "farm" (see Appendix A, Figure A-1). The Dune Solar Still uses solar energy toevaporate water into a ducted airstream and subsequently condenses water from this airstream toproduce fresh water. Initially, it was theorized that the Dune Solar Still should function as amulti-effect still, recycling its released heat of condensation to assist evaporation; see Figure 2.By comparison, a conventional greenhouse solar still is a single effect still, meaning that it uses itsacquired solar heat only once to distill a given amount of feedstock water.*
The project focused on the potential use of this still to the application of desalinating high-salinity agricultural drainage water for reuse in crop irrigation. Consequently, this research wasappropriate to the Industrial/Agricultural/Water End-Use Efficiency subject area of the EISGProgram. As noted in the PIER website (www.energy.ca.gov/pier/indust/index.html), "theavailability of low-cost clean water is essential to California's economy and continuedprosperity" and that the treatment of large volumes of substandard and saline water relies heavily
Figure 1. Schematic of a single distillation bay.
Figure 2 Heat recycling in a multi-effect solar still.
___________________________
* In a greenhouse still, solar radiation is absorbed by a light-absorbing floor panel and heats anoverlying layer of water (see Appendix A, Figure A-2). The heated water evaporates and its vaporcondenses in droplets on an overlying, cool, inclined window pane. The condensed water droplets rundown this pane and collect in a trough at the side of the still. Such stills are designed to lose heatthrough their window pane to the environment so as to encourage vapor condensation. Thus all ofthe solar energy they absorb to evaporate water is lost to the environment upon condensation.

10
on electric power. So if this technology were to prove superior to existing desalinationtechnologies it could result in substantial savings to California in terms of reduced kilowatt hourconsumption used in the desalination of irrigation drainage water, or in the production ofdesalinated water for residential or industry use.
In the past, solar distillation technologies have been considered economically impracticalbecause their water cost has been high when compared to that of municipal drinking water at~$460 per acre-foot (AF). The economics for water desalination is more favorable in the SanJoaquin Valley in the application to desalinating irrigation drainage water since drainage waterdesalination and reuse is a necessity here independent of the price of irrigation water. Forexample, in the San Joaquin Valley soil salinity has become excessive because of failure in thepast to recycle agricultural drainage water. The long time practice of importing irrigation waterhas raised the water table in the area due to the presence of an impermeable clay layer whichprevents downward percolation of the water. Fertilizer salts have leached into the ground waterand the resulting salty ground water has risen to root level killing crops. About 2.5 million acresof productive farmland there are threatened by saline shallow ground water, of which about750,000 acres have already been lost due to elevated soil salinity. The California Department ofWater Resources (DWR) has implemented a program to address this problem which currentlypromotes solar evaporation ponds as a way of dispensing of this water. However, these requireexcessive acreage: ~10% of the arable land area for evaporating once-used irrigation water.Moreover in many regions these ponds pose a threat to bird wildlife due to their highconcentration of toxic metals such as selenium. Consequently, California is interested inexploring drainage water desalination and reuse as a way of reducing the needed solar evaporationpond acreage. Furthermore, the California Dept. of Water Resources is interested in exploringalternatives to reverse osmosis desalination since R.O. by itself does not provide a completebrine disposal solution. At 10,000 TDS, R.O. desalinators must discharge 25% of the inputstream volume as high-salinity water as compared to only 5% in the case of a solar still such asthe Dune still. Also, as noted below, R.O. consumes large amounts of electricity per acre-foot(AF) of processed water. Hence if an alternative technology can be found that consumes lesspower per AF of water produced, this would be of great benefit to California and the world as awhole.
Project ObjectivesProject objectives were as follows:
1) Hire personnel, set up and prepare the office for the project, purchase equipment andsupplies, and erect an instrument shed and set up a fence around the test site.
2) Prepare a working sketch of the 10 m2 still. Fabricate initial prototype of solar water stillhaving a polyethylene film canopy.
3) Test the solar still constructed with a polyethylene canopy and demonstrate that it willproduce more than 2.5 gallons per day per square meter of still land area and that it willconsume less than 4 watt-hours per gallon (Whr/gal) on the average under winter season testingconditions (cloudless sky, 75° F weather) typical of southern California and processagricultural drainage water of less than 10,000 TDS salinity. Also demonstrate that thepolyethylene prototype still will produce more than 3.5 gallons/m2/day on average andconsume less than 2.5 Whr/gal on average under summer conditions typical of southernCalifornia (100° + weather), while processing agricultural drainage water of less than 10,000TDS salinity.

11
4) Fabricate and install a still canopy made of PFA Teflon film.
5) Test the still fitted with a canopy made of PFA Teflon film. Determine whether the still willproduce more than 3.5 gal/m2/ day on average and consume less than 2.5 Whr/gal on average(< 800 kWh/AF) under winter season testing conditions (cloudless sky, 75° F weather) typicalof southern California and processing agricultural drainage water of less than 10,000 TDSsalinity. Also demonstrate that under summer conditions typical of southern California (100°+ weather) it will produce more than 5 gallons/m2/day on average and consume less than 1.53Whr/gal on average, while processing agricultural drainage water of less than 10,000 TDSsalinity.
6) Perform a cost analysis. Show from the data generated in this project that the projected costof $113/m2 for building a 173 m2 still module continues to be supported. Show from the datagenerated in this project that the projected cost of $490/AF for desalinating drainage waterhaving a salinity of less than 10,000 TDS continues to be supported.
Project Approach
1. Design and Operation of the Still
The lower part of the still consists of a shallow water filled basin whose floor is covered withblack Hypalon membrane overlying an insulating concrete base. An electric pump fills this basinto a depth of a few inches with brackish feedstock such as agricultural drainage water, saline riverwater, seawater, or high-salinity well water. The still's canopy section is fabricated from severallayers of transparent plastic film heat-sealed together at the edges. This may be made of 4 yearpolyethylene film or long life, UV resistant Teflon film such as PFA or FEP which have lifetimes(> 30 years). One of the canopy's transparent film layers divides the still's interior air space intoa lower evaporating air duct and an upper condensing air duct; see Figure 3. Also two additionaltransparent films form the roof of the upper air duct, the double layer helping to prevent heatloss much as would the thermopane window of a flat plate solar collector. The insulating airspace between these two outer transparent films is inflated with dry air. The edges of the plasticfilm canopy are secured to the basin floor of the still by means of film gripping strips. Thecanopy may be detached from the basin, allowing the still to be opened for periodic cleaning.
During daylight hours the brackish water pool is heated by solar radiation which passesthrough the still's transparent roof and which is absorbed by the still's light-absorbing floor. Anelectric fan, similar to a desktop computer cooling fan, is mounted in a partition that rests uprighton the floor of the still at one end of its enclosed air space and beneath the heat exchanger film.When operating, the fan circulates air in a closed loop within the still. As air is blown down thelength of the lower tubular air duct, it passes over the surface of the heated feedstock water andbecomes humidified. Under steady state conditions a temperature gradient will becomeestablished along the length of the still, the temperature of both the air and water increasing withincreasing distance along the length of the lower air duct. As the air travels forward, itstemperature rises and it accumulates an increasing amount of water vapor.
At the far end of the still, the hot moist air enters the cooler upper tubular air duct through ahole in the transparent heat transfer film. Here it reverses its direction of flow to travel towardthe fan end of the still. As the air passes down the length of this air duct, it gradually cools dueto heat being lost both upward through the roof of the still and downward through the lowertransparent heat transfer film. Condensation takes place on the wall surfaces of this upper airduct and especially at the lower edges of the air duct where the heat transfer film directly

12
Figure 3. The Dune Solar Still: a) side view, b) end section view, and c) edge detail.
contacts the pool of feedstock water allowing efficient transfer of the heat of condensation. Atthe fan end of the still the air reenters the lower air duct through a second hole in the transparentfilm at a point behind the fan intake. The still is kept pressurized by an outside air vent tube thatterminates in the low pressure region behind the fan.
Throughout a portion of the length of the still, the air in the upper condenser air duct isexpected to be warmer than the air in the lower evaporator air duct. This is due to the time laginvolved in heating the air in the lower air duct and the complementary time lag involved incooling air in the upper air duct, as illustrated in the hypothetical diagram shown in Figure 4.Consequently, heat will conduct and radiate through the plastic film partition from the upper tothe lower air duct. The condensate that collects at the edges of the plastic tube will also bewarmer than the adjacent pool of brackish feedstock water and will transfer heat to this poolthrough the heat transfer film.
The Dune still insulates its evaporator chamber better than a greenhouse still by making itscanopy from two transparent films separated by an insulating air space. Rather than encouragecondensation through roof heat loss, as in the conventional greenhouse solar still, the Dune stillseeks to develop its condensation thermal gradient along the length of its enclosure whileminimizing its upward heat loss. It was expected that this would allow the Dune still to achievehigher interior temperatures than those within a greenhouse solar still. Since a given volume ofair is able to hold far more water vapor at higher temperatures; see Appendix A, Figure A-3.This would act to favor the operation of the still.
The Dune still could incorporate control circuits to automate its operation. Generallyspeaking, higher levels of insolation will require higher fan speeds and greater air flow rates tomaintain optimal distillation rates. Consequently, one control circuit design might utilize a

13
Figure 4. Hypothetical graph of temperature gradients developed alongthe length of the evaporator and condenser air ducts. Actual test dataindicates that the temperature differential between the hot and coldends of the still actually is about one fourth as much as shown here.
photovoltaic cell to sense the level of insolation and control the fan speed accordingly. Anothercontrol circuit might use a sensing thermistor to turn on the still's fan when its evaporatorchamber has warmed to a sufficiently high temperature. Control for the feedstock water pumpscould be manual or automatic via a timer. The pump would begin its cycle in the morning beforethe still had warmed up. First, the concentrated brine would be pumped out from the basin andthen a new batch of feedstock water would be admitted to the basin. Distillate pumping wouldbe done at periodic intervals.
2. Construction Phase
a. Construction of the Still Base and Test Site
The project to test the Dune Solar Still prototype was carried out by the Starburst Founda-tion on facilities leased from the California Water Institute (CWI) of Fresno, California. The testsite was located at the northwest corner of the California State University Fresno campus.
The first phase of the project was to bring water and electric utilities out to the test sitewhich was located on a plot of land in an open field adjacent to the CWI building. Trenches weredug and pipe and conduit was laid down to supply water and 20 amps of line current to the site.The site was then tractor graded and leveled with the aid of a laser level. A load of sand wasadded prior to final leveling. The area was then wetted and compacted with a vibra compactor.
Two-by-four beams were laid out, nailed together, and secured to the ground with cementstakes to form frames for the bases of two adjacent solar still bays. One bay measured about 28feet long and the other bay measured about 56 feet long. Each bay was about 46 inches wide.Trenches were dug at the end of each bay and four PVC pipes were laid to each bay to supply,feedstock water to the basin, drain brine from the basin, remove freshwater distillate from thestill, and supply air and electrical power to the still interior; see Appendix A, Figures A-4 and A-5. The frames were aligned and leveled with the aid of strings and a laser level. Next, the framewas filled with a 3.25" layer of insulating concrete (mixture of Perlite, cement, and aerating agent);see Appendix A, Figures A-6. The surface was trawled and leveled with a screed. Next, after thecement had cured, the basin sideboards were nailed on and the cement surface was sanded level;see Appendix A, Figure A-7. Then, a 36 mil thick Hypalon® membrane was glued to the basin

14
bottom and side walls; see Appendix A, Figure A-8. The sides of the basin were insulated withfoam insulation. Bowl like drains were formed at the ends of each basin and were plumbed tounderground drain pipes leading to water storage tanks. The basins were filled with water andfound to be to level within 1 centimeter along their lengths. At a later time this basin was to becovered with a polyethylene film canopy.
Two polyethylene tanks, holding 325 and 510 gallons respectively were installed andplumbed to the still; see Appendix A, Figure A-9. Four pumps operating on 12 volts DC wereinstalled on a vertical board near the tanks, two hooked up to each basin. But it was discoveredthat the pumps were not self priming, so they were later were moved underground to valve boxeslocated at each end of the still bays. For each basin, one pump pumped brine from through thebasin drain and into the top of one of the polyethylene tanks. It was actuated by a float levelswitch when water in the basin fell below a certain lower limit; see Appendix A, Figure A-10.After a set time period during which the bay would be drained of water, a timer relay mounted inthe circuit breaker control box (Appendix A, Figure A-11) would shut off the pump and open asolenoid valve allowing feedstock water to flow from the bottom of the tank to the bay. Thepump would shut off when the water level in the bay had risen above a set upper limit. In orderto conserve water, the test set up was designed as a closed water circulation system: from thestill to the tank and from the tank back to the still. Another timer relay at set intervals wouldcause a second diaphragm pump to turn on and pump distillate from the still into a 15 gallondistillate holding tank located on top of each of the main storage tanks; see Appendix A, FigureA-12. The amount of distillate was measured either by siting the tank's level from gradationsmarked on its side or by actuating a solenoid valve to empty the tank while measuring the waterflow rate through a data logged water flow meter.
b. Construction of the Polyethylene Canopy Version of the Dune Solar Still
While the test facilities were under construction, a plastic fabricating company wasfabricating the tubular polyethylene canopy. The fabrication involved heat sealing three layers ofclear, 6 mil thick polyethylene film along their edges to form an inflatable tubular enclosureaccording to the design shown in Figure 3. The film had an anticondensate coating. Thefabricators were supplied with drawings and with a 1/4 scale model mock up of one end of thecanopy; see Figures A-13 and A-14 (Appendix A). The first canopy they manufacturedunfortunately was flawed. After testing was begun it was discovered that the heat seal along itslong dimension was open in four places. Hence the canopy had to be remanufactured at aconsiderable delay to the project.
Meanwhile we experimented with several methods of anchoring the edges of the polyethylenefilm canopy to the bottom of the still basin. Various types of film grips were installed along theedges of the basin and tested for their effectiveness. First, a rubber U channel was installed togrip both the edge of the canopy and the distillate tube running along the perimeter of its interior,but the air pressure inflating the canopy pulled the canopy free. Then, cupped flexiblepolyethylene strips (Figure A-15) were fastened to the basin perimeter in various orientations,but these also failed to retain the canopy upon inflation. PVC pipe tees were also tried. Finally,it was concluded that the canopy would need to be redesigned to include a three inch flap alongits perimeter. This flap was to be secured by aluminum poly-grip fasteners used in securinggreenhouse canopies. A new polyethylene canopy was manufactured and the poly fastenerswere installed (see Figure A-16 of Appendix A). This method was found to successfully holddown the canopy under inflation.

15
Figure 5 shows the solar still canopy inflated and in operation. In this picture a 12 volt hairdryer fan was being used to inflate the canopy by applying a positive pressure to the vertical airpipe leading to the interior of the still. By redesigning the air pipe to provide less flow resistancea low wattage 18 cfm 12 volt (0.14 amp) axial fan was later used to keep the canopy inflated; seeFigure A-17, Appendix A. The metered control panel leaning against the edge of the still wasused to operate the still's fans. The voltage to the fans was controlled by a rheostat. The metersread out voltage and current flowing to the fans to assess power consumption. A partitiondivided the 56 foot long water basin approximately in half to accommodate the still canopywhich measured about 29 feet long.
The lower air duct had a cross sectional area of approximately 1800 cm2 and the upper airduct had a cross sectional area about 30% larger. When operating the fan blew air down thelength of the bay, evaporating water from the pool of feedstock water. At the other end of thebay the air would pass through a 12 inch diameter hole into the upper air duct formed within thecanopy and would flow back to the fan end of the still, condensing a portion of its water vapor asit cooled. Then, the air would pass through another 12 inch diameter hole into the airspace belowthe canopy and downstream of the fan inlet to be recirculated once again. Air blown through oneof the vertical PVC pipes helped to keep the canopy inflated. A 3/8" black Norprene tube whichran along the perimeter of the interior of the canopy can be seen in the photograph. It wouldmake a complete loop of the perimeter with both of its ends attaching via the T connector to thedistillate suction hose, This hose led to a 12 volt diaphragm pump located in an undergroundvalve box.
Figure 5. The Dune Solar Still with its canopy installed and inflated.

16
c) Construction of a System to Externally Heat the Feedstock Water
In November the still design was modified so that hot feedstock water would continuouslycirculate through it. One reason this was done was to study the still's performance at a highertemperature range. Since construction of the Dune Solar Still was delayed, testing did not beginuntil after the equinox, and as a result, maximum temperatures achieved in the still were muchlower than they would have been if tested close to the solstice. By artificially heating thefeedstock water with an external heat source, the performance of the still could be examined inthis higher temperature range. A second reason for testing the still with an external heat sourcewas to simulate the still's performance if it were designed to distill saline geothermal water passedcontinuously through the distillation bay from the hot to the cool end of the still. Such watercould be supplied from geothermal water exiting a geothermal power plant and diverted to thestill prior to subterranean reinjection. It could also come from saline produced water, the by-product geothermal water discharged from petroleum wells. Often this water comes out of theground at moderately high temperatures, 140° F or more, and is costly to dispose of. Theadvantage of using geothermally heated water as feedstock water is that the still may be made tooperate continuously, rather than just during daylight hours.
To test the Dune Solar Still modified for receiving a continuous flow of hot water, the outputfrom the still's drain pump was connected to an insulated rubber hose (Appendix A, Figure A-20). Feedstock water pumped from the cool end of the still through this hose was conductedthrough a water filter and into a Takagi TK-Jr. tankless water heater located at the hot end of thestill; see Figure A-21 (Appendix A).* From there the heated water was discharged throughanother insulated hose which emptied into the hot end of the still. The water heater was fueledwith propane tanks which were recharged daily. The ends of the still were covered with piecesof foam insulation to reduce heat loss from the heated water pool which at these end locationswould otherwise be exposed to the atmosphere (Appendix A, as shown in Figure A-22).
d) Construction of a Version of the Dune Solar Still Made with a Polycarbonate Roof
Another variation of the Dune solar still that was built was one that used clear, polycarbonatesheet (6 mm thick twin-wall Lexan® containing an insulating air space) to form the roof and endpieces of the still; see Appendix A, Figure A-23. This replaced the upper two film layers of theinflatable polyethylene canopy version. The roof was self supporting being a stiff sheet that wasspring loaded against the walls of the basin to form an arch. Cut panels were sealed to the endswith putty. As in the polyethylene canopy version, a 6 mil polyethylene sheet was used todivide the upper and lower air ducts. The film was wrapped around the edge of thepolycarbonate sheet and taped to its outside (Figure A-24, Appendix A). The air flow along thelower air duct would keep this dividing film inflated allowing distillate to collect at the edges ofits upper surface. A fan partition was placed below one end of this film in the same manner aswas done with the polyethylene canopy version of the still. Although the polycarbonate sheethad an anticondensate coating on its lower side, there was still considerable beading of waterdroplets on its surface.________________________* Earlier in October several other types of water heaters had been tried, both tank type and tankless,but were found to be inadequate. It was found that they were not able to take heated water as aninput since as the input temperature approached a certain threshold an internal thermostatic safetyswitch would be tripped, preventing the heater from achieving a high enough exit water temperature.Only the Takagi water heater was found to be suitable. This was able to take heated water as an inputand achieve exit water temperatures as high as 182° F (83° C) regulated to within ±2° C.
17
3. Instrumentation
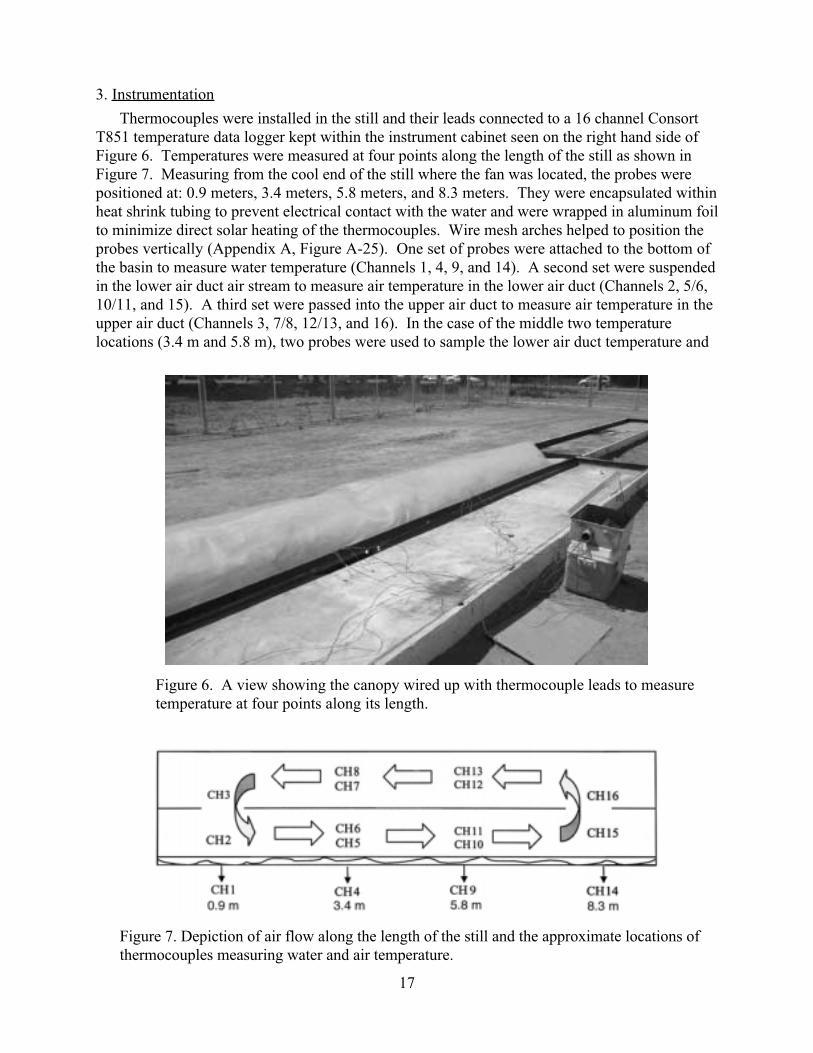
Thermocouples were installed in the still and their leads connected to a 16 channel ConsortT851 temperature data logger kept within the instrument cabinet seen on the right hand side ofFigure 6. Temperatures were measured at four points along the length of the still as shown inFigure 7. Measuring from the cool end of the still where the fan was located, the probes werepositioned at: 0.9 meters, 3.4 meters, 5.8 meters, and 8.3 meters. They were encapsulated withinheat shrink tubing to prevent electrical contact with the water and were wrapped in aluminum foilto minimize direct solar heating of the thermocouples. Wire mesh arches helped to position theprobes vertically (Appendix A, Figure A-25). One set of probes were attached to the bottom ofthe basin to measure water temperature (Channels 1, 4, 9, and 14). A second set were suspendedin the lower air duct air stream to measure air temperature in the lower air duct (Channels 2, 5/6,10/11, and 15). A third set were passed into the upper air duct to measure air temperature in theupper air duct (Channels 3, 7/8, 12/13, and 16). In the case of the middle two temperaturelocations (3.4 m and 5.8 m), two probes were used to sample the lower air duct temperature and
Figure 6. A view showing the canopy wired up with thermocouple leads to measuretemperature at four points along its length.
Figure 7. Depiction of air flow along the length of the still and the approximate locations ofthermocouples measuring water and air temperature.

18
two to sample the upper air duct temperature. The readings of the two probes were lateraveraged together.
The temperature readings were estimated to have an absolute error of about ±1.5° C. Whencomparing one temperature probe to another, their relative error was somewhat lower at about±0.4° C (see Appendix A, Figure A-26). The vertical scale marks the amount by which thetemperature reading for each of the 16 thermocouple probes deviated from the average bathtemperature measured by three mercury thermometers and plotted against bath temperature onthe horizontal axis.
Air speed in the lower air duct was measured with a rotating vane Extech anemometer placedupstream of the fan intake (Appendix A, Figure A-27). Initially, air speed was measured at thehot end of the still at the entrance to the hole between the upper and lower air ducts. But it wasdetermined that measuring at the fan intake gave a more accurate reading.
Solar insolation levels, ambient air temperature, and wind speed were logged hourly at theCIMIS (California Irrigation Management Information System) weather station located on theFresno State University Campus. This data was accessible from the CIMIS website athttp://wwwcimis.water.ca.gov/cimis/welcome.jsp .
4. Solar Still Performance Data
a) Dune Solar Still with an Inflatable Polyethylene Film Canopy
Experimentation and testing of the Dune Solar Still with a polyethylene canopy were carriedout from September 16th to October 7th and on October 14th. Figures 8 through 12 plot datathat was logged over a 24 hour period on September 27th. Figure 8 shows the temperaturesmeasured at four locations along the length of the still by the 16 thermocouples (colored datapoints) compared with the level of solar insolation (solid black line). Ambient air temperature onSeptember 27th ranged from a low of 11° C at 9 AM to a maximum of 33° C at 3 PM. Windspeed averaged about 2 meters per second. As seen here, temperature in the still reached amaximum around 3:30 PM, three and a half hours after solar insolation maximum. The dip intemperatures around 4 PM was due to the shadow from the tops of two tall pine trees near thesouthwest corner of the site which shaded about 30% of the still's area until sundown. When thesite was first staked out in mid April, it had been thought that the site had been locatedsufficiently northward to avoid these tree shadows. But these measurements were made on adate that was one month further from solstice when the trees cast longer shadows to the north.
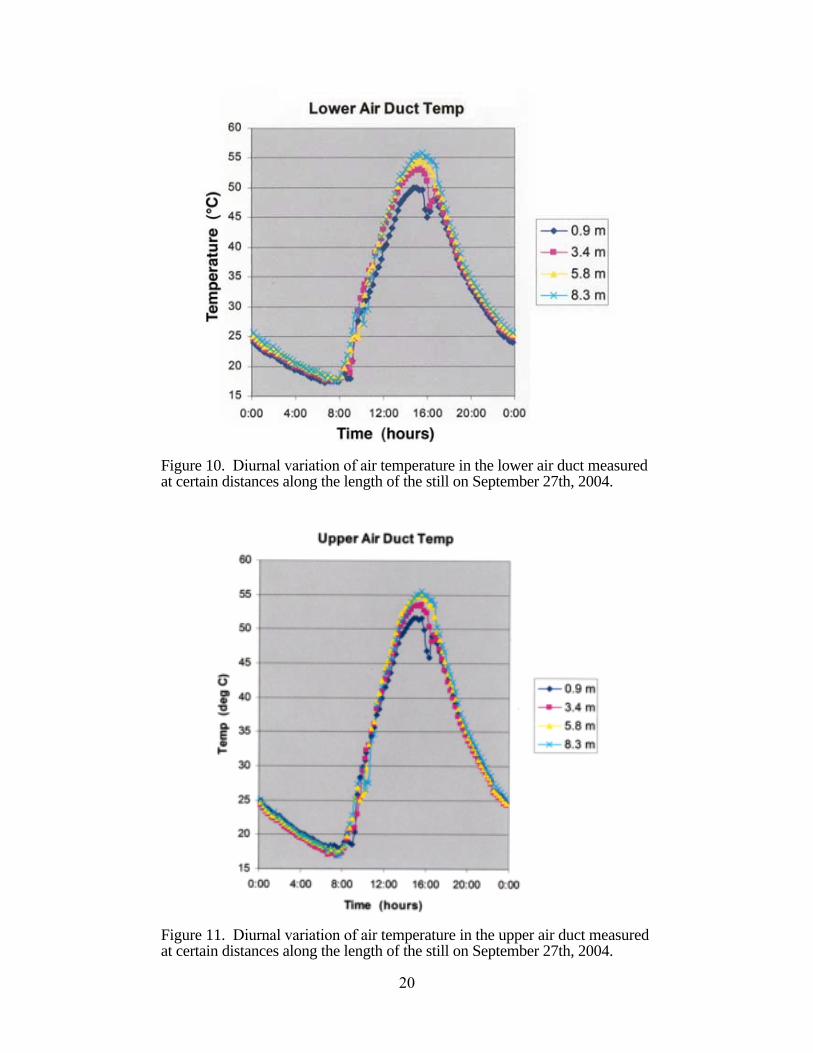
Figures 9, 10, and 11 show the diurnal temperature variations at four locations along thelength of the still in the feedstock water pool, lower air duct, and upper air duct respectively.Figure 12 plots the temperature gradients measured along the length of the still at 3:02 PM in thefeedstock water pool (blue), lower air duct (red), and upper air duct (yellow). The still's fanswere circulating air through the air ducts at a rate of 140 cfm (cubic feet per minute). Hygrometermeasurements showed that air in the lower air duct at the hot end of the still had a relativehumidity of 96%.
Data on daily distillate production per unit area, fan air flow within the still, and energyefficiency are presented in Table I. The gained output rate (GOR) energy efficiency is calculatedby taking the volume of distillate produced per square meter, multiplying it by the heat ofevaporation (539 calories per gram), and dividing it by the daily incident solar energy flux persquare meter as measured by the CIMIS weather monitoring station.
At the time when the still achieved its maximum temperature, around 3:02 PM, the feedstock

19
Figure 8. Temperatures measured in the still at various times of the day (colored data points)compared with the level of solar insolation (solid black line) for September 27th, 2004.
Figure 9. Diurnal variation of feedstock water temperature measured atcertain distances along the length of the still on September 27th, 2004.
20
Figure 10. Diurnal variation of air temperature in the lower air duct measuredat certain distances along the length of the still on September 27th, 2004.
Figure 11. Diurnal variation of air temperature in the upper air duct measuredat certain distances along the length of the still on September 27th, 2004.

21
Figure 12. Temperature gradients developed along the length ofthe still in the feedstock water, lower air duct, and upper air duct.
Table IDistillate Production by the Dune Solar Still Made with a Polyethylene Film Canopy
DateWater
Produced(gal/m2/day)
EnergyEffic.(%)
Air Flow(cfm)
Water∆T(°C)
Comments
9/16 0.3 110 9 Still down from 9:30 - 10:30 for adjustment9/17 0.3 Canopy deflated from 12 AM to 4:50 PM9/18 0.279/19 0.27 65 119/20 0.48 280 7 Repair/canopy open 1 - 3:15 PM fan end9/21 0.48 1359/22 0.48 115 49/23 0.38 85 Repair/ hot end open 1:15 PM9/24 Still not operating9/25 Still not operating
9/26 - 27 Still began operation 12:50 PM9/27 - 28 0.5* 24.8* 180 As of 10:40 AM, 9/279/28 - 29 " " 1609/29 - 30 " " 100 - 200 8.3 Until 5:30 PM. Still under repair for 3/4 hr
9/30 0.25 13.3** 70 5.710/1 0.3 " 80 6.810/2 0.3 " 8010/3 0.3 " Still under repair10/4 0.25 " 525 3.710/5 0.31 " 200-50010/6 0.32 " 240 4.710/7 Still is operated until 12 noon
10/14 0.35 23.7 225 3
* Average of 9/27 through 9/29 ** Average of 9/30 through 10/6

22
water achieved a temperature difference of 4.8° C along the length of the still (blue line in Figure12). The air temperature in the lower evaporator air duct achieved a greater temperaturedifferentials of 5.6° C while the air temperature in the upper condenser air duct achieved a lowertemperature differential of 3.5° C (red and yellow lines in Figure 12). These gradients weresubstantially less or nonexistent during night time and early morning hours.
In general, when the still was at its maximum temperature, the air in the lower air ductaveraged about half a degree cooler than the temperature of the solar heated water that it was incontact with. Over three fourths of the still's length, the air in the upper air duct was from 0.5 to1.6° C warmer than the air directly below it in the lower air duct. This indicates that heat ofcondensation could be transferred from the upper to the lower air duct indicating that the stillwas possibly recuperating some of this heat. Over half of the length of the still the airtemperature in the upper air duct was warmer than the temperature of the water in the feedstockwater pool directly below it. So it is even possible that some of the heat of condensation washelping to heat this water pool.
It had been initially theorized that due to the fact that air was being advected through thelower air duct from the cooler to the warmer end of the still and through the upper air duct fromthe warmer to the cooler end of the still and because there would be a time lag for this air tochange its temperature, that such a temperature inversion would develop. The observedtemperature gradients confirmed these initial expectations that the air temperature in the upperair duct would be greater than that in the lower air duct.
As expected, the thermal gradient along the length of the still tended to decline as air flow ratecirculating through the still increased. For example, using the data in Table I, Figure 13 plots thewater pool temperature difference between the hot and cold end of the still as a function of airflow rate through the upper and lower air ducts. Although there is considerable scatter in thedata, a trend is definitely seen. Figure 14 plots how distillate production was affected by air ductair flow rate. The production rate appears to be low at both low fan speed and high fan speed,with a maximum at around 180 cfm.
The distillate production rate of the still at its best averaged 0.5 gallons/m2/day during theperiod September 27th to 30th. This fell far below the milestone goal which was set at 2.5gallons per day per square meter of still area for suboptimal season conditions. The thermalenergy efficiency of the still was also calculated to be very low. The highest efficiency listed inTable I, about 25%, is low compared to that of a greenhouse solar still which typically has anefficiency of 30%. The efficiency would have been higher if the canopy had instead been made ofPFA Teflon film, which has a solar transmission of 96% as compared to polyethylene film whichhas a transmission of 88%. Transmission through three layers of PFA film would have been 30%greater than through three layers of polyethylene film, although the PFA film may have producedmore back scattering since it would have had no anticondensate coating. If there had been aproportional increase in distillate production, the efficiency of the Dune still would have beenboosted to about 32.5%. Although computer simulations performed on the Dune still by Prof.Yong Tao of Florida International University suggest that distillate production would haveincreased only about 18% with use of a PFA film canopy, in which case the Dune still wouldhave had an overall efficiency of around 30%, essentially the same as a conventional greenhousesolar still.
The electric power consumption for operating the still was calculated as follows. Power wasneeded for the following: a) operating the fan inside the still and the external blower inflating thecanopy, b) operating the diaphragm pump to extract distillate from the canopy, c) operating the

23
Figure 13. Water temperature difference between the hot and cold endof the still as a function of air flow circulation rate through the still.
Figure 14. Distillate production rate as a function of airflow circulation rate through the still.
24
diaphragm pump to empty brine from the still's basin.
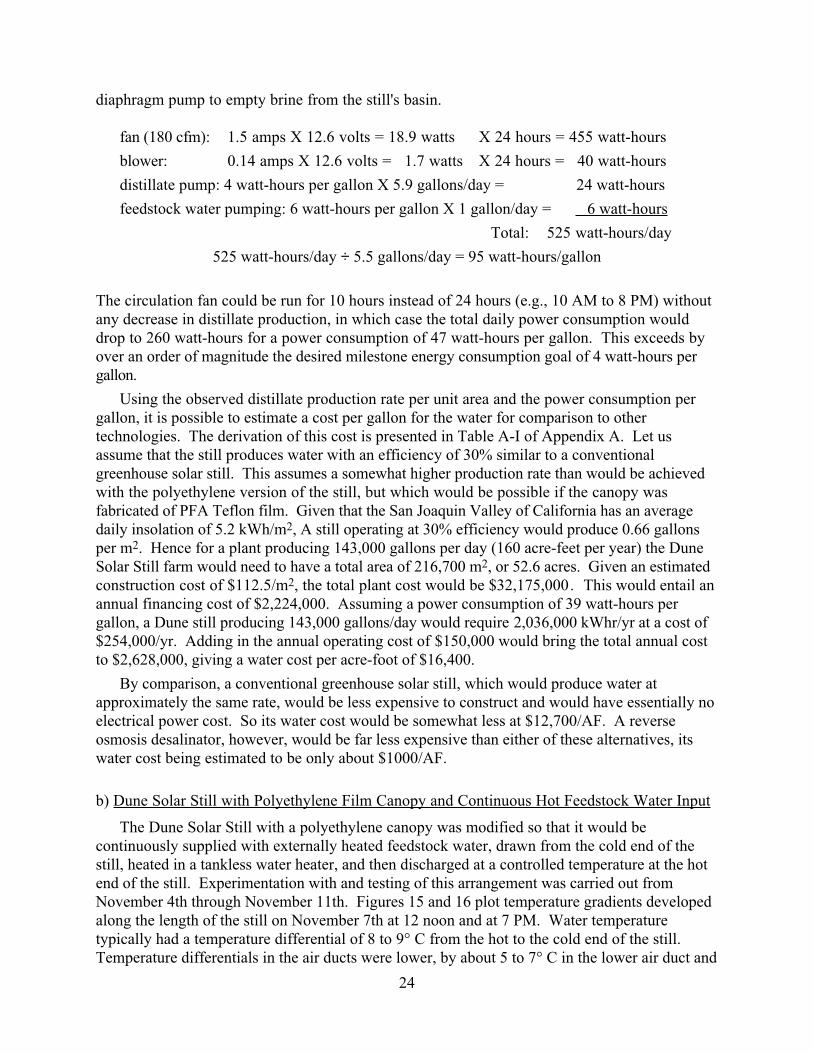
fan (180 cfm): 1.5 amps X 12.6 volts = 18.9 watts X 24 hours = 455 watt-hours
blower: 0.14 amps X 12.6 volts = 1.7 watts X 24 hours = 40 watt-hours
distillate pump: 4 watt-hours per gallon X 5.9 gallons/day = 24 watt-hours
feedstock water pumping: 6 watt-hours per gallon X 1 gallon/day = 6 watt-hours
Total: 525 watt-hours/day
525 watt-hours/day ÷ 5.5 gallons/day = 95 watt-hours/gallon
The circulation fan could be run for 10 hours instead of 24 hours (e.g., 10 AM to 8 PM) withoutany decrease in distillate production, in which case the total daily power consumption woulddrop to 260 watt-hours for a power consumption of 47 watt-hours per gallon. This exceeds byover an order of magnitude the desired milestone energy consumption goal of 4 watt-hours pergallon.
Using the observed distillate production rate per unit area and the power consumption pergallon, it is possible to estimate a cost per gallon for the water for comparison to othertechnologies. The derivation of this cost is presented in Table A-I of Appendix A. Let usassume that the still produces water with an efficiency of 30% similar to a conventionalgreenhouse solar still. This assumes a somewhat higher production rate than would be achievedwith the polyethylene version of the still, but which would be possible if the canopy wasfabricated of PFA Teflon film. Given that the San Joaquin Valley of California has an averagedaily insolation of 5.2 kWh/m2, A still operating at 30% efficiency would produce 0.66 gallonsper m2. Hence for a plant producing 143,000 gallons per day (160 acre-feet per year) the DuneSolar Still farm would need to have a total area of 216,700 m2, or 52.6 acres. Given an estimatedconstruction cost of $112.5/m2, the total plant cost would be $32,175,000. This would entail anannual financing cost of $2,224,000. Assuming a power consumption of 39 watt-hours pergallon, a Dune still producing 143,000 gallons/day would require 2,036,000 kWhr/yr at a cost of$254,000/yr. Adding in the annual operating cost of $150,000 would bring the total annual costto $2,628,000, giving a water cost per acre-foot of $16,400.
By comparison, a conventional greenhouse solar still, which would produce water atapproximately the same rate, would be less expensive to construct and would have essentially noelectrical power cost. So its water cost would be somewhat less at $12,700/AF. A reverseosmosis desalinator, however, would be far less expensive than either of these alternatives, itswater cost being estimated to be only about $1000/AF.
b) Dune Solar Still with Polyethylene Film Canopy and Continuous Hot Feedstock Water Input
The Dune Solar Still with a polyethylene canopy was modified so that it would becontinuously supplied with externally heated feedstock water, drawn from the cold end of thestill, heated in a tankless water heater, and then discharged at a controlled temperature at the hotend of the still. Experimentation with and testing of this arrangement was carried out fromNovember 4th through November 11th. Figures 15 and 16 plot temperature gradients developedalong the length of the still on November 7th at 12 noon and at 7 PM. Water temperaturetypically had a temperature differential of 8 to 9° C from the hot to the cold end of the still.Temperature differentials in the air ducts were lower, by about 5 to 7° C in the lower air duct and

25
Figure 15. Temperature gradients developed along the length of the still at12 noon on November 7th with externally heated feedstock water beingcontinuously circulated through the still. Gradients plotted are for thefeedstock water, lower air duct, and upper air duct.
Figure 16. Temperature gradients developed along the length of the still at 7 PM onNovember 7th with externally heated feedstock water being continuously circulatedthrough the still. Gradients plotted are for the feedstock water, lower air duct, andupper air duct.
by 3° C in the upper air duct. Unlike the version heated by solar energy alone, air temperature inthe upper air duct was generally less than that in the lower air duct. So a temperature inversiondid not develop and as a result heat would not have been recycled back to the feedstock reservoir.
Solar energy made up a small fraction of the total heat input to the still, with about 90%coming from the externally heated feedstock water being circulated through the still; see Table II(last column). In tests where the Dune still was heated exclusively by solar energy, solar energy

26
Table IIDistillate Production for the Dune Solar Still with Polyethylene Film Canopy and Hot Feedstock Input
DateWater
Produced(gal/m2/day)
EnergyEffic.(%)
Air Flow(cfm)
Hot InletWater T
(° C)
OutletWater T
(° C)
Water∆T(° C)
WaterFlowrate(lt/min)
Ratio ofsolar toauxiliary
11/4 - 5 1.6 18 230 72.8 60 12.8 7.8 16.5%11/5- 6 3.2 38.7 220 73.3 / 80.6 60.9/66.7 12.4/13.9 7.7/7.8 11.5%11/6-7 1.5 20 256 80.5 67.7 12.8 7.8 8.8%11/ 7-8 2.0 26 140 80.5 67.1 13.4 7.4 4.6%11/8-9 2.4 26 122 80.7 65.1 15.6 7.3 8.7%11/9-11 1.4 23 100 80.5 64.2 16.3 4.45 13.2%Average: 2.0 25.3
absorbed by the polyethylene film canopy could have contributed heat to the upper air passageand could explain why the upper air duct temperature in those tests had a higher temperaturethan the air in the lower air duct. In the present tests, this solar heating contribution would havebeen much less significant which could explain why the temperature inversion was not seen here.Nevertheless solar heating did produce a rise in the still's temperature. Comparing Figures 15 and16, we see that at noon the still's s water temperature was about 2° C warmer.
By maintaining the water continually hot with a continuous flow through of heated feedstock,the still was able to distill water both day and night rather than just during midday as would bethe case where the still was operated on solar energy alone. As a result, the still's waterproduction rate increased considerably, averaging about 2 gal/m2/day; see second column in TableII. But this was less than the 2.5 gal/m2/day milestone goal set for the Dune Solar Still operatingon solar energy alone. These results dispel earlier hopes that the Dune Solar Still might functionas a multi-effect solar still and that if operated continuously to desalinate geothermal water itmight have been able to produce 20 gallons or more per square meter per day. These tests showthat it in fact produces about an order of magnitude less water than had been hoped.
The third column in Table II lists the still's distillation efficiency. This averaged about 25%,about the same result as when the still was powered by solar energy alone. Again this may becompared with the efficiency of a passive greenhouse solar still which is about 30% efficient.This test determined that even when operating at higher temperatures the still's efficiency did notimprove, and that it continued to function as a single-effect still, rather than as a multi-effect still,without any sign of recuperating and reusing its heat of condensation.
The efficiency of the still was calculated by taking the heat of vaporization of the distilledwater that was produced in a given day and dividing it by the total thermal energy that enteredthe still during that time. In this case the total thermal energy input would include both the solarradiation incident on the still and the heat entering the still through recirculation and heating of itsfeedstock water. Solar radiation falling on the still was estimated from the CIMIS weatherstation data with the radiation values from noon until sunset being reduced by 50% to take intoaccount the effect of shading on the still by two pine trees at the southwest corner of the testsite. Shading was substantially more than for the tests carried out a month earlier. Heat enteringthe still from the heated feedstock water was calculated by measuring the rate at which feedstockwater was circulated through the external heater, multiplying by the water's heat capacity and byits temperature difference, the temperature entering the still minus temperature exiting the still.

27
This version of the Dune Solar Still is estimated to consume 53 whrs per gallon, which is overten times higher than the milestone goal of 4 whrs per gallon. The blower for inflating the canopyconsumed 1.8 watts, the fan circulating air in the still consumed 9.2 watts, and the feedstockpump circulating water through the water heater consumed 31 watts, giving a total consumptionof 42 watts or 1008 watt hours per day. Dividing this by the average distillate production ofabout 19 gallons per day gives 53 whrs/gal. Energy for heating the feedstock water is notincluded since it is assumed that this is a free resource (e.g., geothermally heated water). In theevent that the still could be designed to use gravity flow for its feedstock water throughput, thetotal energy consumption would drop to 14 whrs/gal, which is still several times higher than themilestone goal.
Table A-II of Appendix A derives the water cost for the case in which the Dune Solar Still isdesigned to desalinate geothermal water on a continuous 24 hour operation. Feedstock water isassumed to flow through the still without the need for pumps. In this case the water costcalculates to be $4,500/AF which is still more expensive than the reverse osmosis alternative of$1,000/AF and slightly more expensive than the passive solar still alternative of $3,000/AF.
c) Dune Solar Still with a Polycarbonate Roof
Experimentation and testing of the Dune Solar Still with a polycarbonate roof were carriedout from August 19th to 30th. Figures A-28 through A-30 of Appendix A show the diurnaltemperature variations at four locations along the length of the still measured on August 25th,measured in the feedstock water pool (Figure A-28), lower air duct (Figure A-29), and upper airduct (Figure A-30). These curves may be compared with the level of solar insolation marked bythe x's. Ambient air temperature on August 25th ranged from a low of 16° C at 6 AM to amaximum of 31° C at 4 PM. Wind speed averaged about 1 meter per second. The still's fanswere circulating air through the air ducts at a rate of 60 cfm.
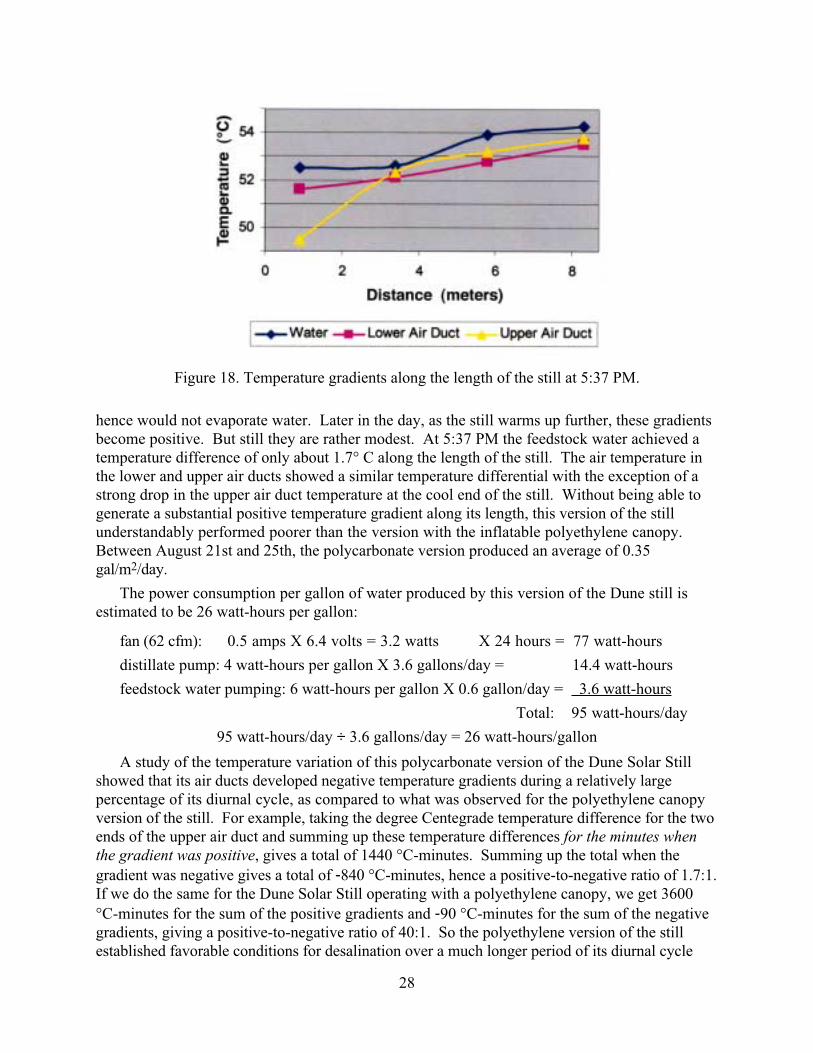
Figures 17 and 18 plot the temperature gradients measured along the length of the still at12:07 PM and 5:37 PM. Gradients are marked as follows: the feedstock water pool temperature(blue), lower air duct temperature (red), and upper air duct temperature (yellow). Note that at12:07 PM there is no gradient in the feedstock pool and the gradient in the lower and upper airducts are negative, that is air moving down the lower air duct would cool rather than warm and
Figure 17. Temperature gradients along the length of the still at 12:07 PM.
28
Figure 18. Temperature gradients along the length of the still at 5:37 PM.
hence would not evaporate water. Later in the day, as the still warms up further, these gradientsbecome positive. But still they are rather modest. At 5:37 PM the feedstock water achieved atemperature difference of only about 1.7° C along the length of the still. The air temperature inthe lower and upper air ducts showed a similar temperature differential with the exception of astrong drop in the upper air duct temperature at the cool end of the still. Without being able togenerate a substantial positive temperature gradient along its length, this version of the stillunderstandably performed poorer than the version with the inflatable polyethylene canopy.Between August 21st and 25th, the polycarbonate version produced an average of 0.35gal/m2/day.
The power consumption per gallon of water produced by this version of the Dune still isestimated to be 26 watt-hours per gallon:
fan (62 cfm): 0.5 amps X 6.4 volts = 3.2 watts X 24 hours = 77 watt-hours
distillate pump: 4 watt-hours per gallon X 3.6 gallons/day = 14.4 watt-hours
feedstock water pumping: 6 watt-hours per gallon X 0.6 gallon/day = 3.6 watt-hours
Total: 95 watt-hours/day
95 watt-hours/day ÷ 3.6 gallons/day = 26 watt-hours/gallon
A study of the temperature variation of this polycarbonate version of the Dune Solar Stillshowed that its air ducts developed negative temperature gradients during a relatively largepercentage of its diurnal cycle, as compared to what was observed for the polyethylene canopyversion of the still. For example, taking the degree Centegrade temperature difference for the twoends of the upper air duct and summing up these temperature differences for the minutes whenthe gradient was positive, gives a total of 1440 °C-minutes. Summing up the total when thegradient was negative gives a total of -840 °C-minutes, hence a positive-to-negative ratio of 1.7:1.If we do the same for the Dune Solar Still operating with a polyethylene canopy, we get 3600°C-minutes for the sum of the positive gradients and -90 °C-minutes for the sum of the negativegradients, giving a positive-to-negative ratio of 40:1. So the polyethylene version of the stillestablished favorable conditions for desalination over a much longer period of its diurnal cycle

29
and this would explain the difference in performance of the two still constructions.
Increasing the fan speed made matters worse. For example, on October 30th, the fan speedwas increased from 62 to 115 cfm. At 11 AM the upper air duct was observed to have a negativethermal gradient of a few tenths of a degree, 48.6° C at the fan end and 48.2° C at the oppositeend. At 3 PM the thermal gradient was still negative with 57.3° C at the fan end and 57.0° C atthe opposite end. At 10:20 AM on September 1st the gradient was again relatively flat with38.0° C at the fan end and 38.1° C at the opposite end.
It is not clear why the polycarbonate version had negative temperature gradients so much ofthe time. Perhaps it is because its roof reflected more sunlight due to droplet formation on theinner polycarbonate surface, or perhaps it is because the polycarbonate absorbed more energythan the polyethylene film and added this energy to the upper air duct. For example note thatwhen the gradient is negative, the temperature in the water pool is substantially cooler than in theair ducts, whereas when the gradient is positive, the water pool is instead warmer than the airduct temperature. Comparing to Figure 12 which shows strong positive temperature gradientsfor the polyethylene version of the still, we see that the feedstock water temperature is slightlywarmer than the air duct temperature, although at the cooler end of the still the upper air ducttemperature slightly exceeds its temperature, which is good.
The distillation efficiency of the polycarbonate version of the Dune Solar Still was calculatedto be only 11.7%, or almost one third of that of a greenhouse solar still. Solar insolation duringthis period averaged about 7,000 watt hours/m2/day, and since the still had a footprint area of10.3 m2, the total daily solar energy input calculates to 6.3 X 10⁷ calories. Comparing this withan average distillate production of 3.6 gallons per day, or a heat of vaporization of 7.4 X 10⁶
calories, gives an efficiency of 11.7%. So, we find no advantage to pursuing this polycarbonateroof design over the polyethylene film design.
Project OutcomesProject outcomes were as follows:
1) Initially, the Starburst Foundation was based in upstate New York. But to carry out thisresearch project an adequate test site in an arid southwestern U.S. location had to be found.Efforts were begun in January to locate an adequate site for the project. Sites in New Mexico,Arizona, and California were investigated. Finally, in early February, discussions were begunwith representatives of the California Water Institute in Fresno, California subcontract theirfacilities for the research project and to provide needed personnel. It was not until June that acontract was signed specifying the relationship between the Starburst Foundation andCWI/California State University Fresno Foundation.
The Starburst Foundation hired only one person for the project, the project's principleinvestigator. All other personnel working on the project at the CWI test site were employeesof CWI. They were scheduled to work on the project at times when their help was needed,particularly during the first five or six weeks during which time the test site and still werebeing constructed. California Water Institute provided office space in the office buildingadjacent to the test site. This was occupied in mid June. Supplies for the project were beingpurchased as early as April and continued throughout the course of the project.
The entire site was enclosed within a rented chain link fence. Instead of erecting a shed atthe test site, the Foundation instead purchased a used RV trailer for a comparable price. Thishad the advantage of being easily moved at the end of the project. It also provided excellent

30
facilities to store the instruments and tools as well as space to work in out of the sun for doingshop work. Its stove and sink facilities were also useful for carrying out thermistor calibrationoperations. Moreover its battery provided an excellent source of 12 volt DC power forrunning the solar still.
2) Working sketches of the Dune Solar Still were prepared. A scale model was prepared of oneend of the still's polyethylene film canopy and a plastic film fabricating company wassubcontracted to fabricate a prototype canopy. The canopy consisted of three layers ofpolyethylene film about 5' X 29' heat sealed together to form an elongated bag. When testswere begun on the still at the end of July, it was discovered that the canopy's heat seals hadcome apart in four places. So the subcontractor had to fabricate a new canopy. This wasredesigned to include edge flaps for fastening the canopy to the bottom of the still's basin.
While the canopy was being fabricated, the base of the solar still was constructed alongwith its solar absorbing lining. Adjoining pump and tank equipment needed to operate the stillwas also constructed. Due to delays in securing a contract agreement with California WaterInstitute for use of their test facilities, construction on the project did not begin until mid Juneand the still was not assembled with its canopy and ready for testing until late July, whichwas a month and a half past the targeted completion date of mid June. At that point problemsemerged with an effective method to anchor the canopy and with separation of the canopy'sheat seals. Then there were further delays in getting a new canopy fabricated by thesubcontractor. So actual testing of the polyethylene canopy version of the still was not ableto begin until the middle of September, three months past the targeted date.
3) As a result of the project delays mentioned above, testing began almost three months after thesolstice. So we were not able to evaluate the still's performance under summer seasonconditions when it would have yielded its best performance. Even so, the still did not performnearly as well as had been expected. Its daily distillate production was not found to meet thesuboptimal season milestone. Production measured in late September (9/27 - 9/30) with thestill heated solely by solar energy was found to average about 0.5 gallons/m2/day, or five timeslower than the suboptimal season milestone goal. By using solar insolation data for Fresno,California, it was possible to translate the water production rate into a gained output rate(GOR) efficiency for the still. This was calculated to average around 25%. This may becompared to a conventional single effect solar still which has an efficiency typically of 30%.
The still also failed to meet the energy consumption milestone for power consumed pergallon of distillate produced. Daily power consumption of the still was measured, as was thedaily amount of distillate that was produced. In cases where the still was heated solely bysolar energy, in one example this ratio was found to be approximately 47 watt-hours per gallonof produced distillate, which is equivalent to about 15,300 kilowatt hours per acre-foot ofwater produced (kWh/AF). This is about 12 times higher than the milestone of 4 watt hoursper gallon (1300 kWh/AF). By comparison, a 50,000 AF/yr reverse osmosis plant wouldconsume about 3,600 kWh/AF and a 5 AF/yr R.O. would plant consume about 13,000kWh/AF. If fabricated with a PFA film canopy, this power consumption per gallon isprojected to drop about 20% to 39 watt-hours per gallon.
Replacing the fresh feedstock water with saline feedstock water would not have changed thestill's performance efficiency. So, since the still had failed its milestone goals, it was decidednot to carry out additional tests using saline feedstock water.
4) Since the polyethylene version of the Dune still failed to meet the water production and energyconsumption goals, it was determined that it would be pointless to proceed further on the
31
project to fabricate a PFA Teflon film canopy for the still. Pyroheliometer tests were carriedout on solar transmission through 3 layers of 6 mil polyethylene film for comparison to solartransmission through 3 layers of 2 mil PFA Teflon film. It was determined that the lattertransmitted about 30% more solar energy. But even if the still were to produce 30% morewater as a result of receiving more solar energy, its daily water production rate and energyconsumption per gallon would nevertheless again have fallen well below the suboptimal seasonmilestones set for the polyethylene version.
5) A PFA film version of the canopy was not fabricated for the reason stated in 4) above, so teststhat had been planned for this version of the still were canceled.
6) We determined that our initial solar still design was functional and that a still built according tothis design would function properly to distill water. Hence we do not see any reason tochange our initial estimate of the square meter construction cost of $113/m2. However, sincethe water production per square meter fell far below our previous expectations, our projectedcost of $490 per acre-foot of produced distillate is no longer supported. The projected outputof 0.66 gallons per square meter per day for the Dune Solar Still outfitted with a PFA Teflonfilm canopy and its high power consumption of 39 watt-hours per gallon, implies a very highcost per gallon of distillate of about $16,400/AF, far in excess of our original cost goal.
7) Tests were also carried out in which a version of the Dune Solar Still was built with a twin-wall polycarbonate sheet roof instead of a polyethylene film roof. However, this did notprove to be an effective design. Its performance was distinctly poorer than the polyethylenefilm canopy design. The still was unable to generate a temperature difference along the lengthof its evaporator and condenser air ducts, the temperature difference being either nonexistentor in some cases the reverse of what it should have been. Although this solar still design didhave a vertical temperature gradient such that its upper condenser air duct was cooler than itslower evaporator air duct. As a result of its nonexistent lengthwise thermal gradient, the stillhad a relatively low water production output, averaging about 0.35 gallons/m2/day at the endof August. This was over 7 times lower than the suboptimal season milestone. Powerconsumption was 26 watts per gallon (8,500 kWh/AF) which was almost 7 times higher thanthe set milestone goal. The distillation efficiency of the polycarbonate version was calculatedto be very low, about 12%.
8) Tests were also carried out in which the Dune Solar Still prototype with a polyethylenecanopy was continually supplied with feedstock water from an external heat source. Thisallowed the performance of the still to be checked in the instance where it would receive itssaline feedstock water from a geothermal water source and also allowed the performance of thestill to be checked at higher water temperatures such as those that might be achieved duringmid summer months. When continuously supplied with water at a temperature of 177° F (80°C), the still's water production output increased dramatically, averaging a daily production rateof 2 gallons/m2/day, or about 80% of the 2.5 gallons/m2/day milestone. But its efficiencyaveraged about 25%, indicating that its thermal efficiency was somewhat less than that of aconventional greenhouse solar still. The average distillation efficiency of the Dune stillboosted with externally heated feedstock water was about the same as that of the Dune stilloperating on solar energy alone.
The power consumption of this hot feedstock version of the still calculated to be about 53watt hours per gallon (17,300 kWh/AF). This value is higher than in the version heated bysolar energy alone because feedstock must be continuously circulated through the still from theexternal heat source. If this pumping requirement could be eliminated by use of gravity flow

32
through the still the power requirement would drop to about 14 watt hours per gallon (4600kWh/AF) which still would exceed the set milestone target by over three fold.
9) Additional information about the Dune Solar Still design were discovered through computersimulations of the Dune Solar Still design performed by Professor Yong Tao of FloridaInternational University. These indicated that there would be no benefit to increasing thelength of the still. For example, simulations showed that, compared with an 8.77 meter longstill, a 20 meter long still had a 1.3% lower condensation rate per meter area. Also simulationsshowed that increasing the upper air duct cross section to produce a 50% reduction in air flowvelocity resulted in about a 1% increase in condensation rate per unit still area. Simulationsalso confirmed that at times of low insolation a lower fan speed will result in slightly higherdistillation rates. For example an increase from 150 to 350 cfm at 5 PM resulted in a 2%decline in distillation rate.
Conclusions1) The project successfully located a test site, set up an office space, and erected an instrument
trailer and surrounding fencing. It also successfully found adequate personnel for constructionand testing of the still, and purchased the needed equipment and supplies to carry out theproject.
2) The project successfully prepared working sketches of the still and fabricated an operationalprototype solar water still having a polyethylene film canopy.
3) The project successfully tested the Dune Solar Still constructed with a polyethylene filmcanopy. However, it is concluded from these tests that the still performed poorly in compar-ison with existing desalination technologies in that both its water production rate per unit areaand energy consumption per gallon of distillate were much lower than the milestone goals.
4) Fabrication of a version of the Dune Solar Still using a PFA Teflon film canopy was notjustified since its rate of water distillation would have been only about 20% greater than thatof the tested prototype which used a polyethylene canopy. So, a PFA version of the stillwould have failed to meet the milestone goals for water production and energy consumption.
5) It was decided that it was not worth testing the Dune Solar Still fabricated with a PFA Teflonfilm canopy for the reasons stated in 4) above.
6) The Dune Solar Still is not cost competitive in comparison with other desalinationtechnologies. The cost per gallon of distillate produced by a Dune Solar Still made with a PFAfilm would be about $16,800/AF, which is high compared with the cost of water produced bya reverse osmosis desalinator ($1,000/AF) or by a conventional greenhouse solar still($12,700/AF).
7) A version of the Dune Solar Still built with a twin-wall polycarbonate sheet roof did notperform as well as the version of the Dune Solar Still built with a polyethylene film canopy.Hence this version also is not cost competitive in comparison with other desalinationtechnologies.
8) When continually supplied with feedstock water from an external heat source, the Dune SolarStill prototype with a polyethylene canopy was found to increase its water production outputper unit area by about four fold in comparison to the case where the still's feedstock water washeated by solar energy alone. However, the cost per gallon of water would be almost five

33
times higher than for reverse osmosis desalination, $4,500/AF as compared with $1,000/AF.Moreover a conventional greenhouse solar still continuously supplied with externally heatedfeedstock water could have about an 80% higher water production output as the Dune SolarStill, and without the fan and blower power expense. So it would produce water at asomewhat lower cost of $3,000/AF.
9) In overview, the initial belief that the Dune Solar Still would function as a multi-effect solarstill was unfounded. If constructed with a high transparency film, such as PFA, it would havefunctioned no more efficiently than a conventional single-effect greenhouse solar still.
10) It would also be impractical to use the Dune Solar Still as an alternative to solar pondevaporation as a way of desalinating irrigation run-off water since the Dune Solar Still(version made with a PFA Teflon canopy powered by solar heating alone) plus its brineevaporation pond would consume about 9% of the agricultural land area. A conventionalsolar evaporation pond, on the other hand, would require slightly more land area, about 10%,but would have a much lower construction cost.
Recommendations
This study does not recommend that further research be undertaken into this type of solarstill design.
Public Benefits to California
No public benefits to California are seen for further development of the Dune Solar Stilldesign.
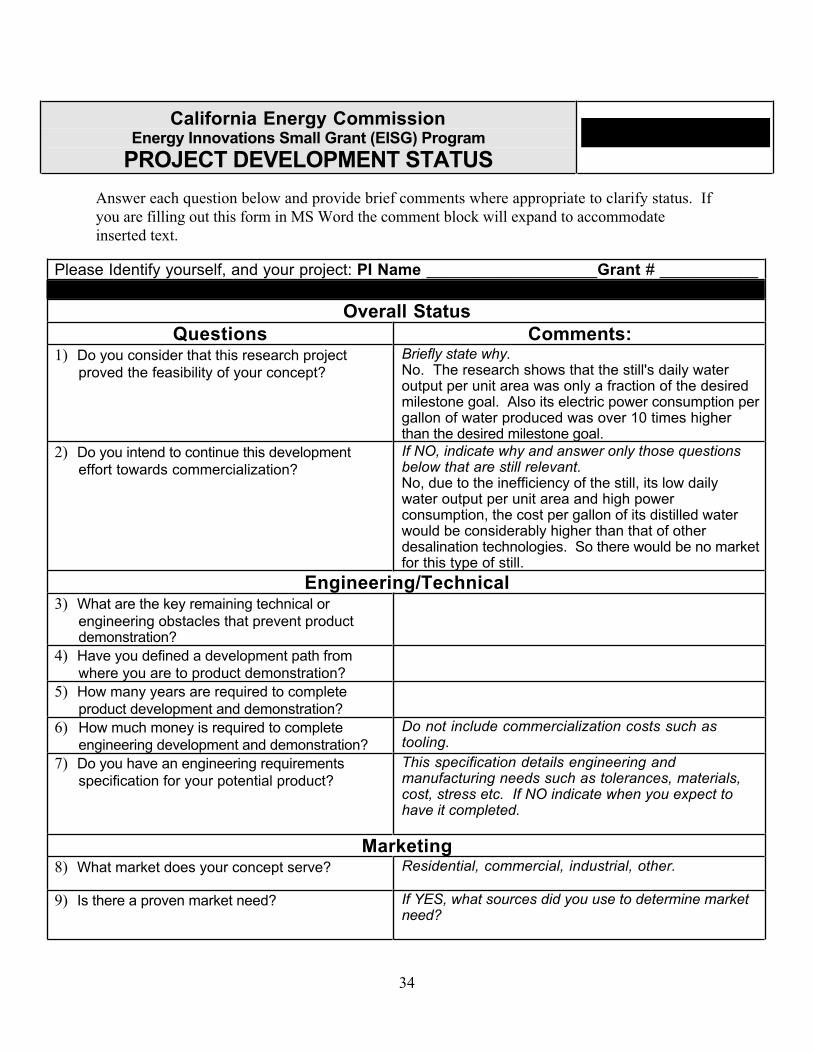
34
California Energy CommissionEnergy Innovations Small Grant (EISG) Program
PROJECT DEVELOPMENT STATUSQuestionnaire
Answer each question below and provide brief comments where appropriate to clarify status. Ifyou are filling out this form in MS Word the comment block will expand to accommodateinserted text.
Please Identify yourself, and your project: PI Name ___________________Grant # ___________
Overall StatusQuestions Comments:
1) Do you consider that this research projectproved the feasibility of your concept?
Briefly state why.No. The research shows that the still's daily wateroutput per unit area was only a fraction of the desiredmilestone goal. Also its electric power consumption pergallon of water produced was over 10 times higherthan the desired milestone goal.
2) Do you intend to continue this developmenteffort towards commercialization?
If NO, indicate why and answer only those questionsbelow that are still relevant.No, due to the inefficiency of the still, its low dailywater output per unit area and high powerconsumption, the cost per gallon of its distilled waterwould be considerably higher than that of otherdesalination technologies. So there would be no marketfor this type of still.
Engineering/Technical3) What are the key remaining technical or
engineering obstacles that prevent productdemonstration?
4) Have you defined a development path fromwhere you are to product demonstration?
5) How many years are required to completeproduct development and demonstration?
6) How much money is required to completeengineering development and demonstration?
Do not include commercialization costs such astooling.
7) Do you have an engineering requirementsspecification for your potential product?
This specification details engineering andmanufacturing needs such as tolerances, materials,cost, stress etc. If NO indicate when you expect tohave it completed.
Marketing8) What market does your concept serve? Residential, commercial, industrial, other.
9) Is there a proven market need? If YES, what sources did you use to determine marketneed?

35
10) Have you surveyed potential end users forinterest in your product?
If YES, the results of the survey should be discussedin the Final Report.
11) Have you performed a market analysis thattakes external factors into consideration?
External factors include potential actions bycompetitors, other new technologies, or changes inregulations or laws that can impact market acceptanceof your product?
12) Have you compared your product with thecompetition in terms of cost, function,maintenance etc.?
Yes, based on this research, this desalinationapproach would be more costly than competingdesalination technologies.
13) Have you identified any regulatory,institutional or legal barriers to productacceptance?
If YES, how do you plan to overcome these barriers?
14) What is the size of the potential market inCalifornia?
Identify the sources used to assess market size.
15) Have you clearly identified the technologythat can be patented?
If NO, how do you propose to protect your intellectualproperty?
16) Have you performed a patent search? If YES, was it a self-search or professional search anddid you determine if your product infringes or appearsto infringe on any other active or expired patent?
17) Have you applied for patents? If YES, provide the number of applications.Yes, but the applications were abandoned after itbecame clear that this solar still design fell short ofinitial expectations.
18) Have you secured any patents? If YES, provide the patent numbers assigned andindicate if they are generic or application patents.
19) Have you published any paper or publiclydisclosed your concept in any way that wouldlimit your ability to seek patent protection?
If YES, is it your intent to put the intellectual propertyinto the public domain?
Commercialization Path20) Can your organization develop and produce
your product without partnering with anotherorganization?
If YES, indicate how you would accomplish that.If NO, indicate who would be the logical partners fordevelopment and manufacture of the product.
21) Has an industrial or commercial companyexpressed interest in helping you take yourtechnology to the market?
If YES, are they a major player in the marketplace foryour product?
22) Have you developed a commercializationplan?
If yes, has it been updated since completing your grantwork?
23) What are the commercialization risks? Risks are those factors particular to your concept thatmay delay or block commercialization.
Financial Plan24) If you plan to continue development of your
concept, do you have a plan for the requiredfunding?

36
25) Have you identified funding requirements foreach of the development and commercializationphases?
26) Have you received any follow-on funding orcommitments to fund the follow-on work to thisgrant?
If YES, indicate the sources and the amount.If NO, indicate any potential sources of follow-onfunding.
27) Have you identified milestones or key go/nogo decision points in your financial plan?
28) What are the financial risks?29) Have you developed a comprehensive
business plan that incorporates the informationrequested in this questionnaire?
If YES, can you attach a non-proprietary version of thatplan to your final report?
Public Benefits30) What sectors will receive the greatest
benefits as a result of your concept?Residential, commercial, industrial, the environment,other.
31) Identify the relevant savings to California interms of kWh, cost, reliability, safety,environment etc.
Show all assumptions used in calculations.
32) Does the proposed technology impactemissions from power generation?
If YES, calculate the quantity in total tons per year ortons per year per relevant unit. Show all assumptionsused in calculations.
33) Are there any potential negative effectsfrom the application of this technology withregard to public safety, environment etc.?
If YES, please specify.
Competitive Analysis34) Identify the primary strengths of your
technology with regard to the marketplace.Identify top 3.
35) Identify the primary weaknesses of yourtechnology with regard to the marketplace.
Identify top 3.
36) What characteristics (function,performance, cost etc.) distinguishes yourproduct from that of your competitors?
Development AssistanceThe EISG Program may in the future provide follow-on services to selected Awardees that would assist themin obtaining follow-on funding from the full range of funding sources (i.e. Partners, PIER, NSF, SBIR, DOE etc.).The types of services offered could include: (1) intellectual property assessment; (2) market assessment; (3)business plan development etc.37) If selected, would you be interested in
receiving development assistance?If YES, indicate the type of assistance that you believewould be most useful in attracting follow-on funding.

37
Appendix A. Additional Diagrams, Photos, and Tables
Figure A-1. Solar still farm for distilled water production.
Figure A-2. A conventional greenhouse solar still.
Figure A-3. Concentration of water vapor in saturated air showing a nonlinear increase with air temperature.
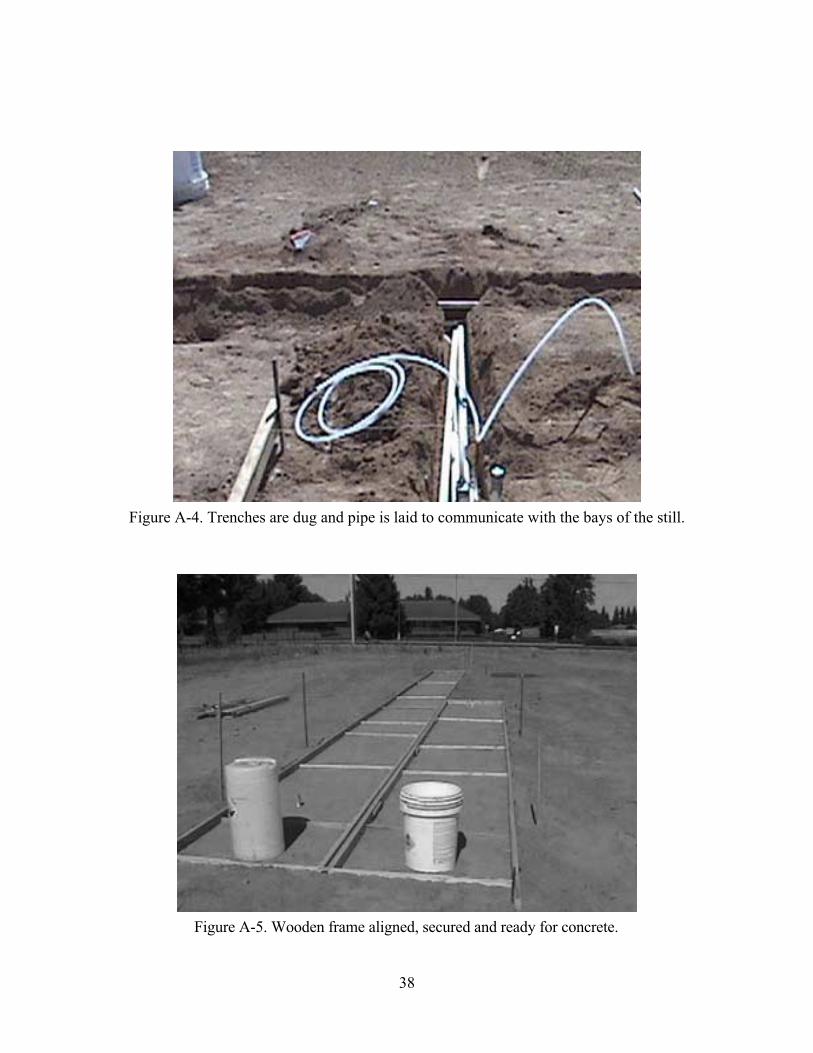
38
Figure A-4. Trenches are dug and pipe is laid to communicate with the bays of the still.
Figure A-5. Wooden frame aligned, secured and ready for concrete.

39
Figure A-6. Insulating concrete being trawled into the forms.
Figure A-7. Floor of still being sanded level after basin walls were installed.

40
Figure A-8. The still basins completed and lined with 36 mil Hypalon® membrane.Dish depressions at one end of each basin contain drains plumbed to drain pipes.Vertical pipe seen in the foreground is one of two used to blow air into the stillenclosure for inflating the still's transparent canopy. The 1/2 inch polyethylenetubes protruding from the PVC pipes will connect to Norprene tubes forevacuating distillate from the still's canopy.

41
Figure A-9. Water storage tanks and pump panel.
Figure A-10. Float switch positioned near drain well. Its (SPST)contacts close when the water level falls below its lower set point andopen when the level rises above its upper set point 3 inches higher.
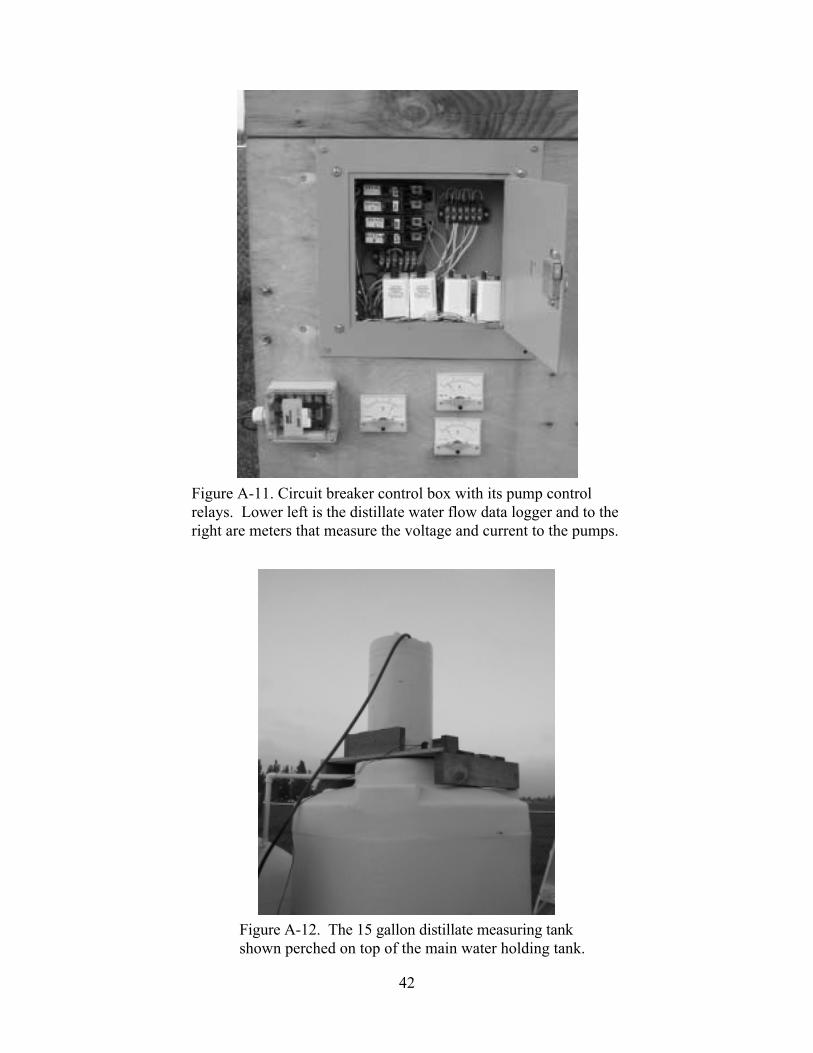
42
Figure A-11. Circuit breaker control box with its pump controlrelays. Lower left is the distillate water flow data logger and to theright are meters that measure the voltage and current to the pumps.
Figure A-12. The 15 gallon distillate measuring tankshown perched on top of the main water holding tank.

43
Figure A-13. Top view of a quarter scale model mock up ofthe polyethylene canopy. The foam arch inside the canopysimulates the partition for holding the still's air circulation fan.
Figure A-14. Side view of the canopy mock up mounted ina cardboard enclosure simulating the still's basin enclosure.
Figure A-15. Polyethylene film grip strips being attached to the edge of the basin.

44
Figure A-16. Aluminum snap-on strips along the basinsidewall are used to secure the canopy by gripping apolyethylene film flap running along the canopy's perimeter.
Figure A-17. Fan used to keep canopy inflated.
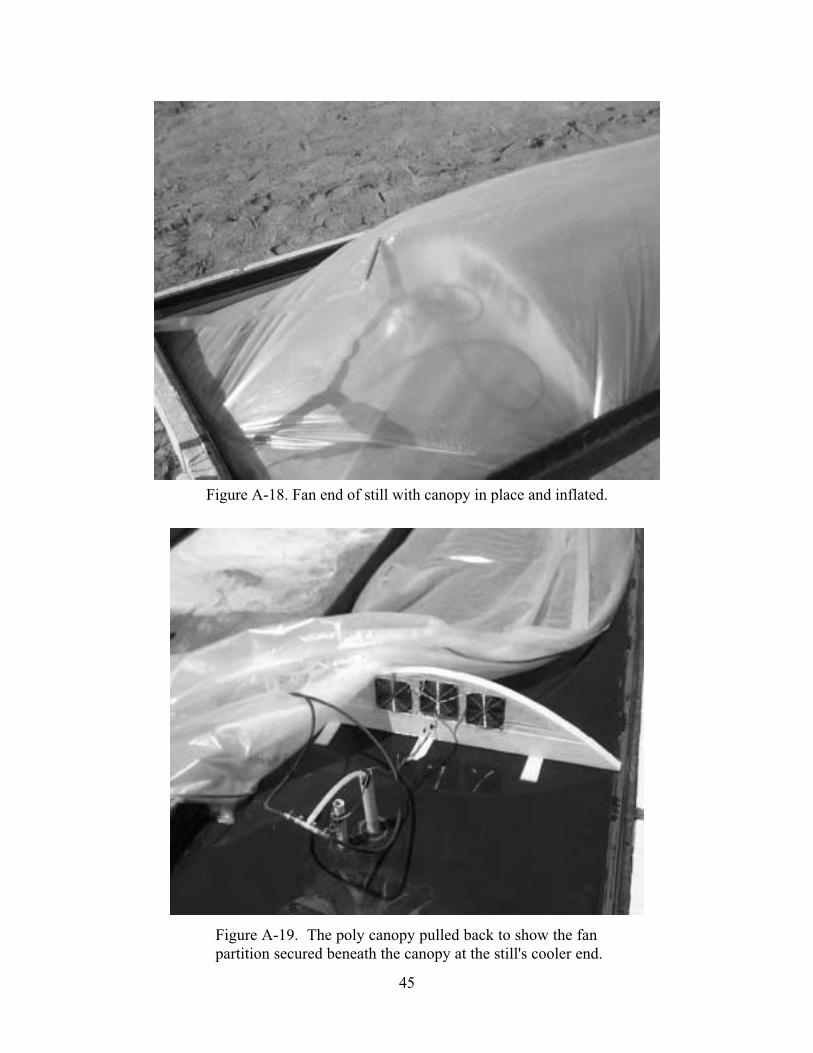
45
Figure A-18. Fan end of still with canopy in place and inflated.
Figure A-19. The poly canopy pulled back to show the fanpartition secured beneath the canopy at the still's cooler end.

46
Figure A-20. Feedstock water from the cool end of the still is pumpedthrough the insulated rubber hose shown exiting the underground pump box.
Figure A-21. Feedstock water is heated in the Takagi tankless water heater(left) and is discharged into the hot end of the still.

47
Figure A-22. Edges of the still bay where feedstock water isexposed to the open air are insulated by pieces of foam insulation.
Figure A-23. The Dune Solar Still made with a twin wall polycarbonate sheet roof.
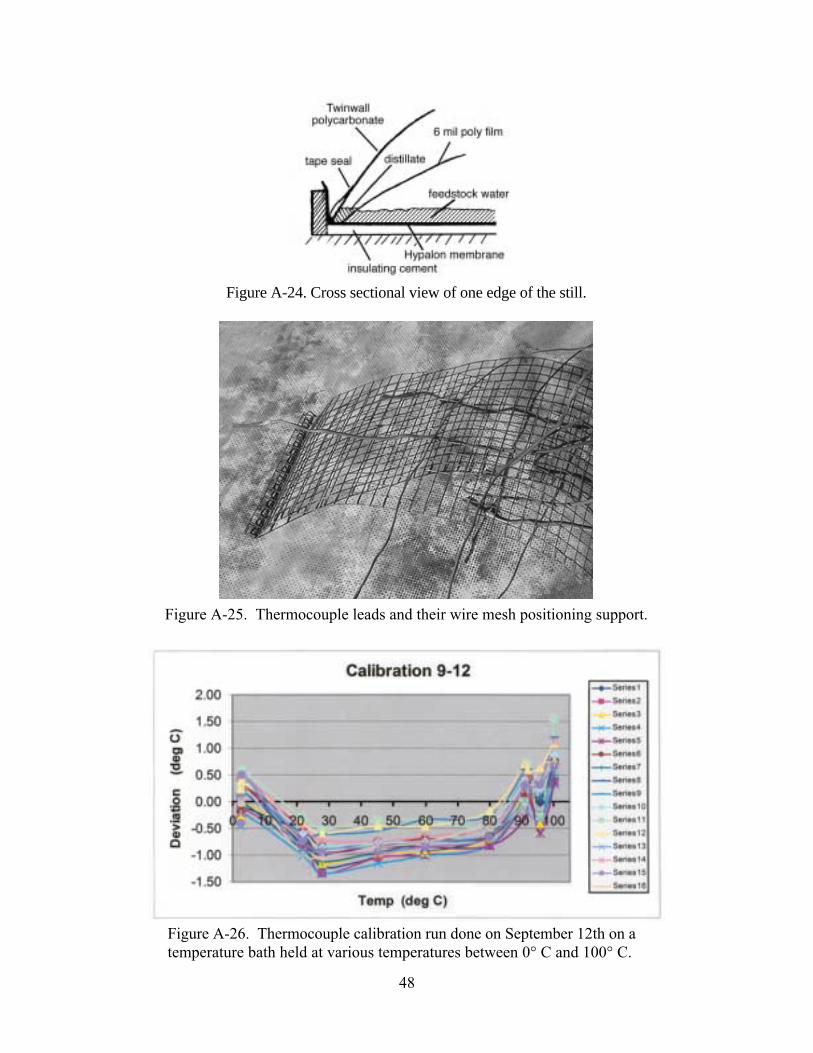
48
Figure A-24. Cross sectional view of one edge of the still.
Figure A-25. Thermocouple leads and their wire mesh positioning support.
Figure A-26. Thermocouple calibration run done on September 12th on atemperature bath held at various temperatures between 0° C and 100° C.
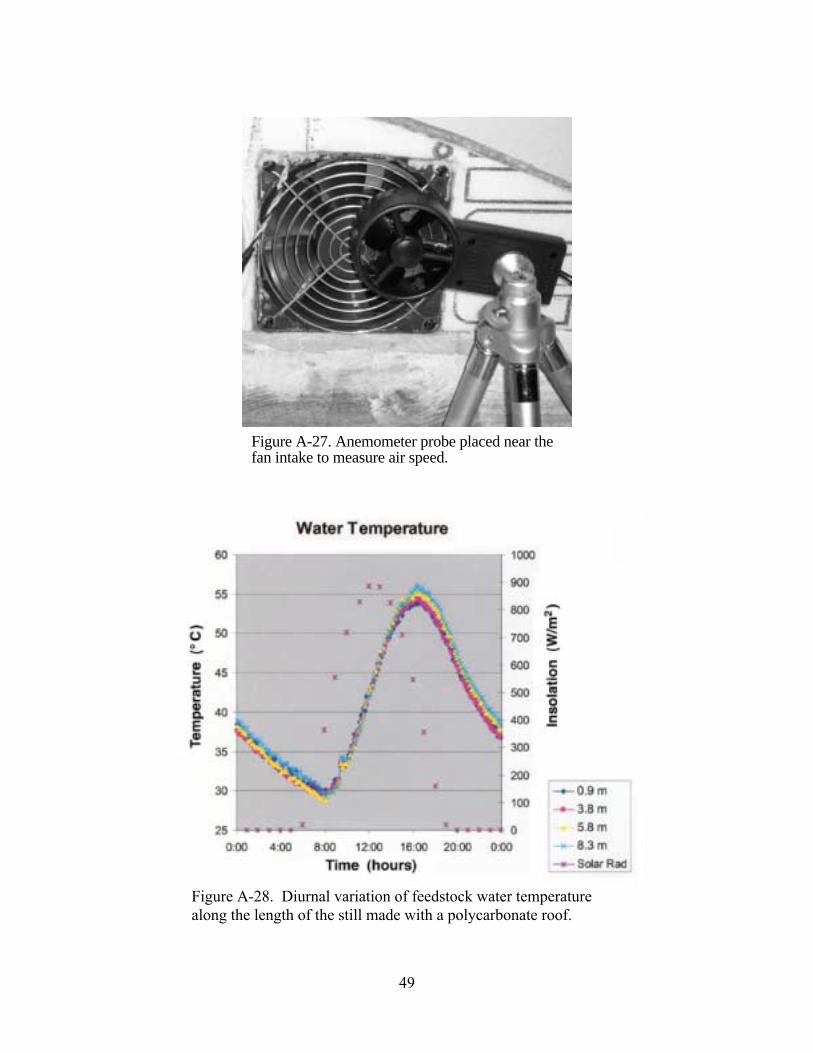
49
Figure A-27. Anemometer probe placed near thefan intake to measure air speed.
Figure A-28. Diurnal variation of feedstock water temperaturealong the length of the still made with a polycarbonate roof.
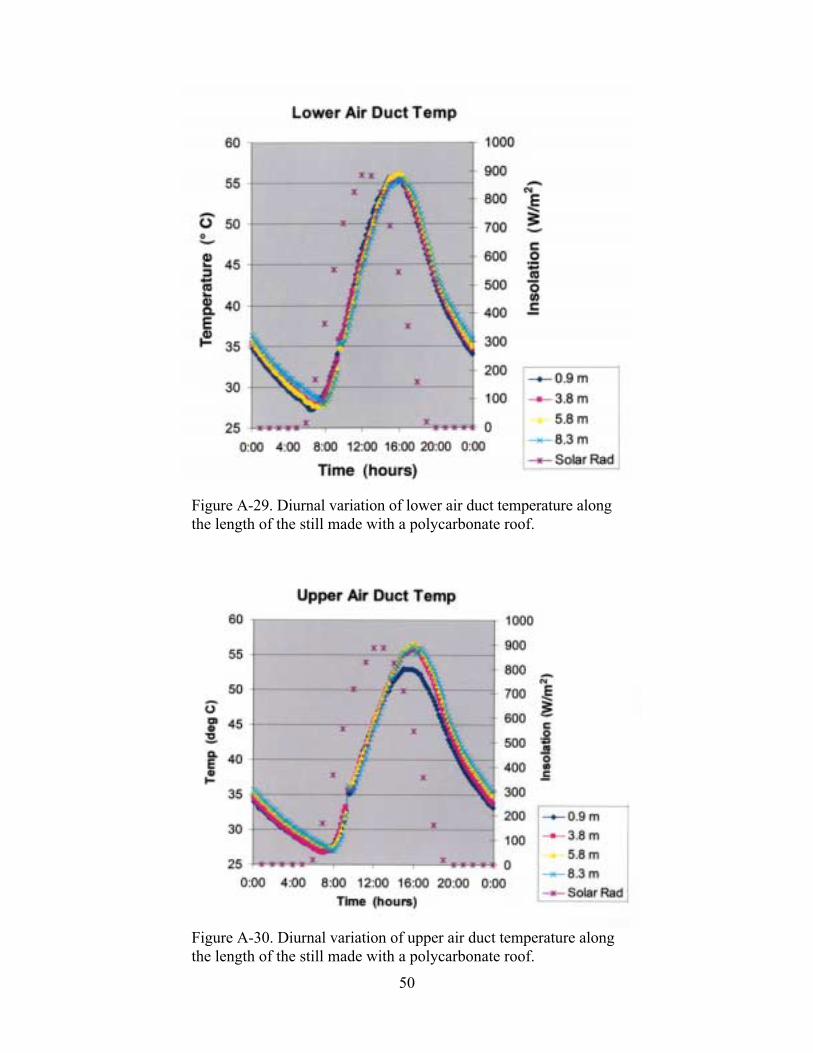
50
Figure A-29. Diurnal variation of lower air duct temperature alongthe length of the still made with a polycarbonate roof.
Figure A-30. Diurnal variation of upper air duct temperature alongthe length of the still made with a polycarbonate roof.

51
Table A-IWater Cost for a 160 AF/yr Agricultural Drainage Water Desalting Plant (143,000 gallons/day)
(Size sufficient to reclaim irrigation run off from 640 acres of farm land; 30,000 TDS salinity is assumed)
Reverse Osmosis ProcessDune Solar Still
(entirely solar heated)Conventional Solar Still
(greenhouse type)
1) Capital cost of plant $715,000 $32,175,000(b) $27,170,000(b)
2) Amortization30 year @ 5.6%/yr $49,300 /yr (a) $2,224,000/yr. $1,878,000/yr.
3) Still land requirement
Pond land requirement Total land requirement(d)
Still: (400 m2)Pond: 22 acres (90,600 m2)Total: 22 acres (91,000 m2)
Still: 52.6 acres (286,000 m2)Pond: 5.7 acres (23,500 m2)
Total: 58.3 acres (309.500 m2)
Still: 52.6 acres (286,000 m2)Pond: 5.7 acres (23,500 m2)
Total: 58.3 acres (309,500 m2)
4) Power requirement 70 kw peak570,000 kWhr/yr (e)
400 kw peak2,036,000 kWhr/yr
None
5) Power cost(f) $71,300/yr @ 12.5 ¢/kwhr $254,000/yr @ 12.5 ¢/kwhr None
6) Other operating costs $35,200/yr(g) $150,000 (includes $110,000for replacement of 10% of stillover 30 years)
$150,000 (includes $100,000for replacement of 10% of stillover 30 years)
7) Distillate production costlines (2)+(5)+(6)
$156,000/yr $2,628,000/yr. $2,028,000/yr.
8) Total annual costper acre foot of distillate
$625/AF not including pretreatment costs$1000/AF including pretreatment(h) $16,400/AF @ 0.66 gpd/m2 $12,700/AF @ 0.66 gpd/m2
9) Solid waste disposal(i) Yes, Pretreatment sludge wastedisposal problem, plus:16 metric tons/day of salt
16 metric tons/day of salt 16 metric tons/day of salt
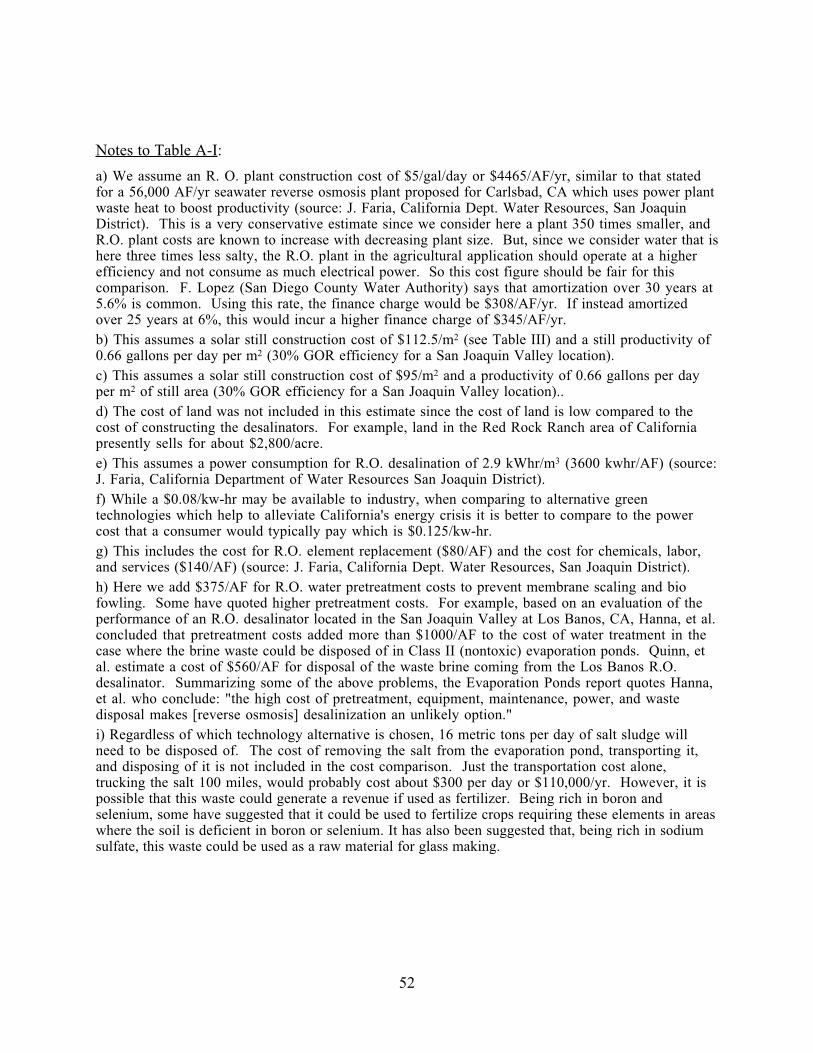
52
Notes to Table A-I:
a) We assume an R. O. plant construction cost of $5/gal/day or $4465/AF/yr, similar to that statedfor a 56,000 AF/yr seawater reverse osmosis plant proposed for Carlsbad, CA which uses power plantwaste heat to boost productivity (source: J. Faria, California Dept. Water Resources, San JoaquinDistrict). This is a very conservative estimate since we consider here a plant 350 times smaller, andR.O. plant costs are known to increase with decreasing plant size. But, since we consider water that ishere three times less salty, the R.O. plant in the agricultural application should operate at a higherefficiency and not consume as much electrical power. So this cost figure should be fair for thiscomparison. F. Lopez (San Diego County Water Authority) says that amortization over 30 years at5.6% is common. Using this rate, the finance charge would be $308/AF/yr. If instead amortizedover 25 years at 6%, this would incur a higher finance charge of $345/AF/yr.b) This assumes a solar still construction cost of $112.5/m2 (see Table III) and a still productivity of0.66 gallons per day per m2 (30% GOR efficiency for a San Joaquin Valley location).c) This assumes a solar still construction cost of $95/m2 and a productivity of 0.66 gallons per dayper m2 of still area (30% GOR efficiency for a San Joaquin Valley location)..d) The cost of land was not included in this estimate since the cost of land is low compared to thecost of constructing the desalinators. For example, land in the Red Rock Ranch area of Californiapresently sells for about $2,800/acre.e) This assumes a power consumption for R.O. desalination of 2.9 kWhr/m3 (3600 kwhr/AF) (source:J. Faria, California Department of Water Resources San Joaquin District).f) While a $0.08/kw-hr may be available to industry, when comparing to alternative greentechnologies which help to alleviate California's energy crisis it is better to compare to the powercost that a consumer would typically pay which is $0.125/kw-hr.g) This includes the cost for R.O. element replacement ($80/AF) and the cost for chemicals, labor,and services ($140/AF) (source: J. Faria, California Dept. Water Resources, San Joaquin District).h) Here we add $375/AF for R.O. water pretreatment costs to prevent membrane scaling and biofowling. Some have quoted higher pretreatment costs. For example, based on an evaluation of theperformance of an R.O. desalinator located in the San Joaquin Valley at Los Banos, CA, Hanna, et al.concluded that pretreatment costs added more than $1000/AF to the cost of water treatment in thecase where the brine waste could be disposed of in Class II (nontoxic) evaporation ponds. Quinn, etal. estimate a cost of $560/AF for disposal of the waste brine coming from the Los Banos R.O.desalinator. Summarizing some of the above problems, the Evaporation Ponds report quotes Hanna,et al. who conclude: "the high cost of pretreatment, equipment, maintenance, power, and wastedisposal makes [reverse osmosis] desalinization an unlikely option."i) Regardless of which technology alternative is chosen, 16 metric tons per day of salt sludge willneed to be disposed of. The cost of removing the salt from the evaporation pond, transporting it,and disposing of it is not included in the cost comparison. Just the transportation cost alone,trucking the salt 100 miles, would probably cost about $300 per day or $110,000/yr. However, it ispossible that this waste could generate a revenue if used as fertilizer. Being rich in boron andselenium, some have suggested that it could be used to fertilize crops requiring these elements in areaswhere the soil is deficient in boron or selenium. It has also been suggested that, being rich in sodiumsulfate, this waste could be used as a raw material for glass making.

53
Table A-IIWater Cost for 160 AF/yr Solar/Geothermal Desalination Plant Version (143,000 gallons/day)
Reverse Osmosis ProcessDune Solar Still
(multi-effect, advective)Conventional Solar Still
(greenhouse type)
1) Capital cost of plant $715,000 $8,040,000 $5,548,000
2) Amortization30 year @ 5.6%/yr $49,300/yr (a) $553,000/yr. $381,700/yr.
3) Still land requirement
Pond land requirement Total land requirement(d)
Still: (400 m2)Pond: 22 acres (90,600 m2)Total: 22 acres (91,000 m2)
Still: 17.3 acres (71,500 m2)Pond: 9.6 acres (40,000 m2)
Total: 23.7 acres (98,000 m2)
Still: 14.1 acres (58,400 m2)Pond: 9.6 acres (40,000 m2)
Total: 23.7 acres (98,000 m2)
4) Power requirement 70 kw peak570,000 kWhr/yr (e)
150 kw peak730,000 kWhr/yr
5) Power cost(f) $71,300/yr @ 12.5 ¢/kwhr $91,000/yr @ 12.5 ¢/kwhr
6) Other operating costs $35,200/yr(g) $80,000 (includes $30,000for replacement of 10% of stillover 30 years)
$100,000 (includes $70,000for replacement of 10% of stillover 30 years)
7) Distillate production costlines (2)+(5)+(6)
$156,000/yr $724,000/yr. $481,700/yr.
8) Total annual costper acre foot of distillate
$625/AF not including pretreatment costs$1000/AF including pretreatment(j) $4,500/AF @ 2 gpd/m2 $3,000/AF @ 2.45 gpd/m2
9) Solid waste disposal(k) Yes, Pretreatment sludge wastedisposal problem, plus:16 metric tons/day of salt
16 metric tons/day of salt 16 metric tons/day of salt