Embed Size (px)
Citation preview
Republic of Iraq
Ministry of Higher Education and Scientific Research
Al-Nahrain University
College of Science
Department of Chemistry
Construction and study of new polymeric membrane electrodes
for clarithromycin determination
A Thesis submitted to the College of Science of Al-Nahrain University in partial fulfillment of the requirements for the Degree of Master of Science in Chemistry
By
Haider Qais Munshed
B.Sc. in Chemistry
(University of Baghdad 2010)
Supervised by Assistant professor
Dr. Khaleda H. Al-Saidi
2013 4141

صدق الله العظيم
(11)المجادلة

الإهداء إلى الذي لم يأل جهدا في تربيتي منذ الصغر ............. أبي الغالي
أمي الغالية ..................... إلى التي نذرت شبابها من اجلي
ةي الغاليتزوج......…… في نفسي الامل الى القلب الكبير تمن غرس إلى
ولدي إلى شمسي وضياء نهاري ..............................
أخواتيوتي و أخ .......................... بلسم جراحي مإلى من ه
قاربالأو ءصدقاالا ...... كل من فرح بي وشجعني على هذه الدراسة ..لى إ
..إليهم جميعا اهدي ثمرة جهدي عرفانا بفضلهم ....
حيدر

Acknowledgments
I wish to express my deepest gratitude and
appreciation to my supervisor Dr. Khaleda H. Al-saidi
for her patience, supervision and encouragement
during the course of my study.
I am sincerely thankful to Dr. Hadi M. A. Abood
the Head of Chemistry Department at AL-Nahrain
University for all the facilities that he offered during
my research.
Finally, I would like to thank my wife, parents,
brothers and my sisters as well as all my friends for
their support and encourage me.
Haider Qais
2013
I
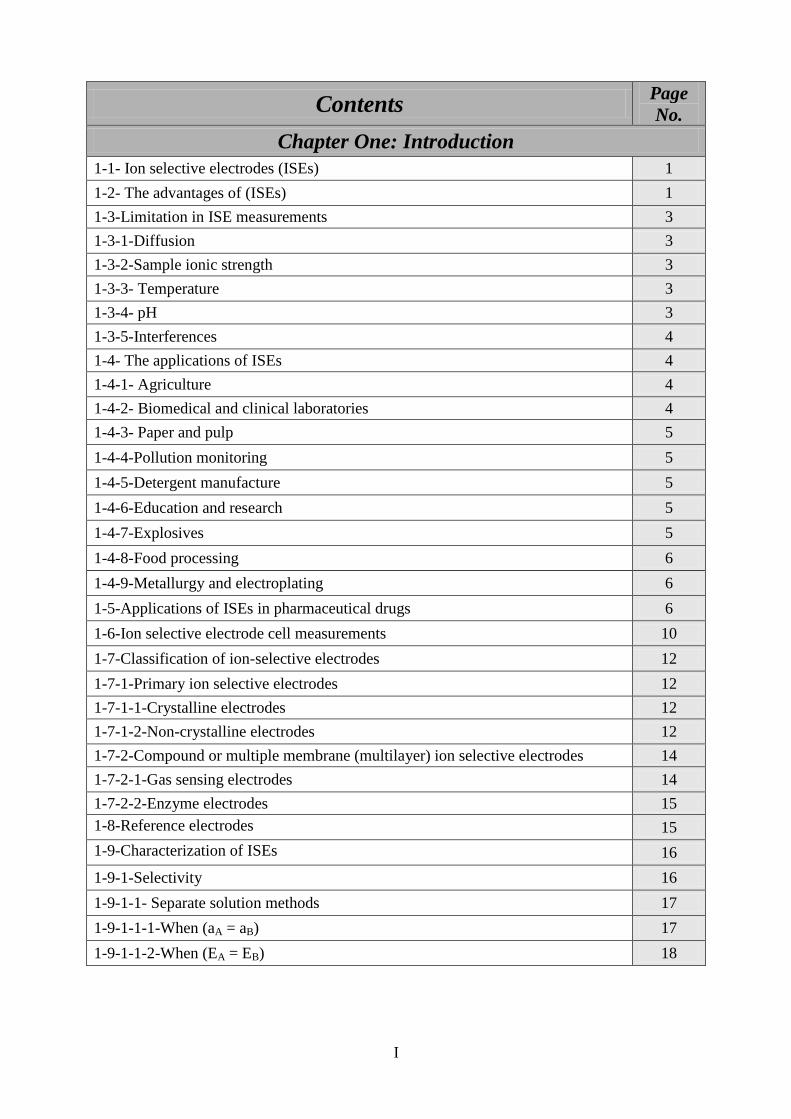
Contents Page
No.
Chapter One: Introduction
1-1- Ion selective electrodes (ISEs) 1
1-2- The advantages of (ISEs) 1
1-3-Limitation in ISE measurements 3
1-3-1-Diffusion 3
1-3-2-Sample ionic strength 3
1-3-3- Temperature 3
1-3-4- pH 3
1-3-5-Interferences 4
1-4- The applications of ISEs 4
1-4-1- Agriculture 4
1-4-2- Biomedical and clinical laboratories 4
1-4-3- Paper and pulp 5
1-4-4-Pollution monitoring 5
1-4-5-Detergent manufacture 5
1-4-6-Education and research 5
1-4-7-Explosives 5
1-4-8-Food processing 6
1-4-9-Metallurgy and electroplating 6
1-5-Applications of ISEs in pharmaceutical drugs 6
1-6-Ion selective electrode cell measurements 10
1-7-Classification of ion-selective electrodes 12
1-7-1-Primary ion selective electrodes 12
1-7-1-1-Crystalline electrodes 12
1-7-1-2-Non-crystalline electrodes 12
1-7-2-Compound or multiple membrane (multilayer) ion selective electrodes 14
1-7-2-1-Gas sensing electrodes 14
1-7-2-2-Enzyme electrodes 15
1-8-Reference electrodes 15
1-9-Characterization of ISEs 16
1-9-1-Selectivity 16
1-9-1-1- Separate solution methods 17
1-9-1-1-1-When (aA = aB) 17
1-9-1-1-2-When (EA = EB) 18
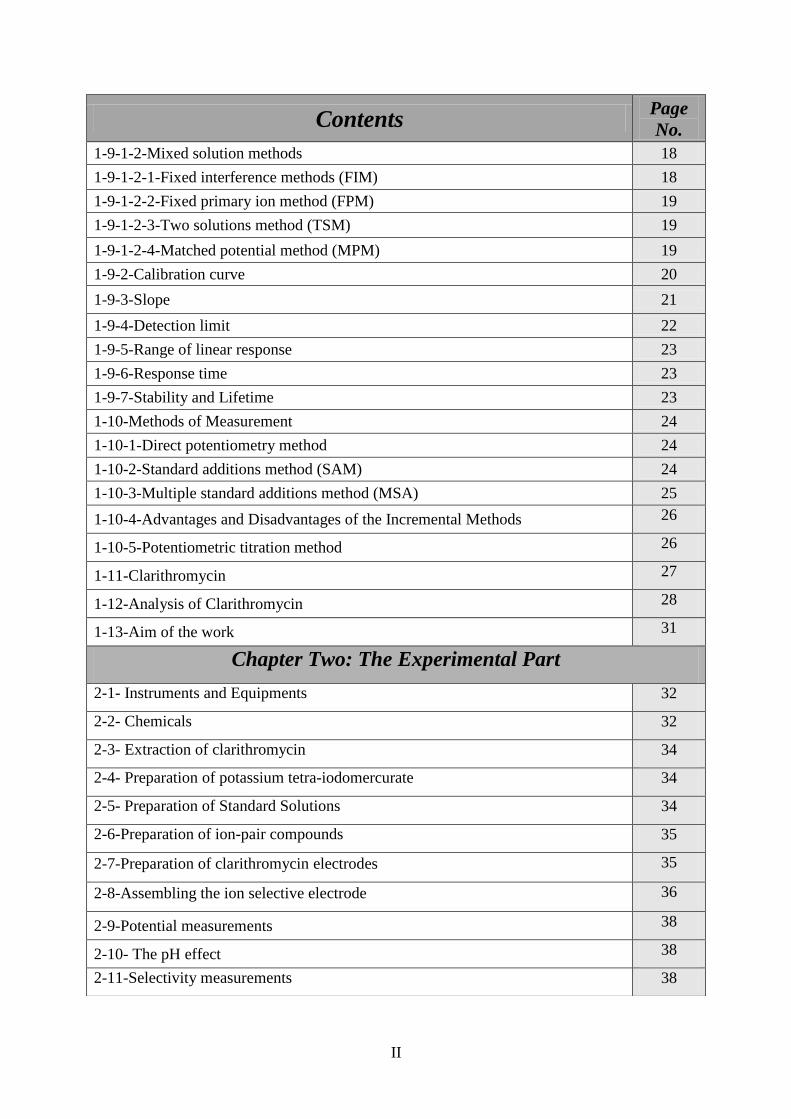
II
Contents Page
No.
1-9-1-2-Mixed solution methods 18
1-9-1-2-1-Fixed interference methods (FIM) 18
1-9-1-2-2-Fixed primary ion method (FPM) 19
1-9-1-2-3-Two solutions method (TSM) 19
1-9-1-2-4-Matched potential method (MPM) 19
1-9-2-Calibration curve 20
1-9-3-Slope 21
1-9-4-Detection limit 22
1-9-5-Range of linear response 23
1-9-6-Response time 23
1-9-7-Stability and Lifetime 23
1-10-Methods of Measurement 24
1-10-1-Direct potentiometry method 24
1-10-2-Standard additions method (SAM) 24
1-10-3-Multiple standard additions method (MSA) 25
1-10-4-Advantages and Disadvantages of the Incremental Methods 26
1-10-5-Potentiometric titration method 26
1-11-Clarithromycin 27
1-12-Analysis of Clarithromycin 28
1-13-Aim of the work 31
Chapter Two: The Experimental Part
2-1- Instruments and Equipments 32
2-2- Chemicals 32
2-3- Extraction of clarithromycin 34
2-4- Preparation of potassium tetra-iodomercurate 34
2-5- Preparation of Standard Solutions 34
2-6-Preparation of ion-pair compounds 35
2-7-Preparation of clarithromycin electrodes 35
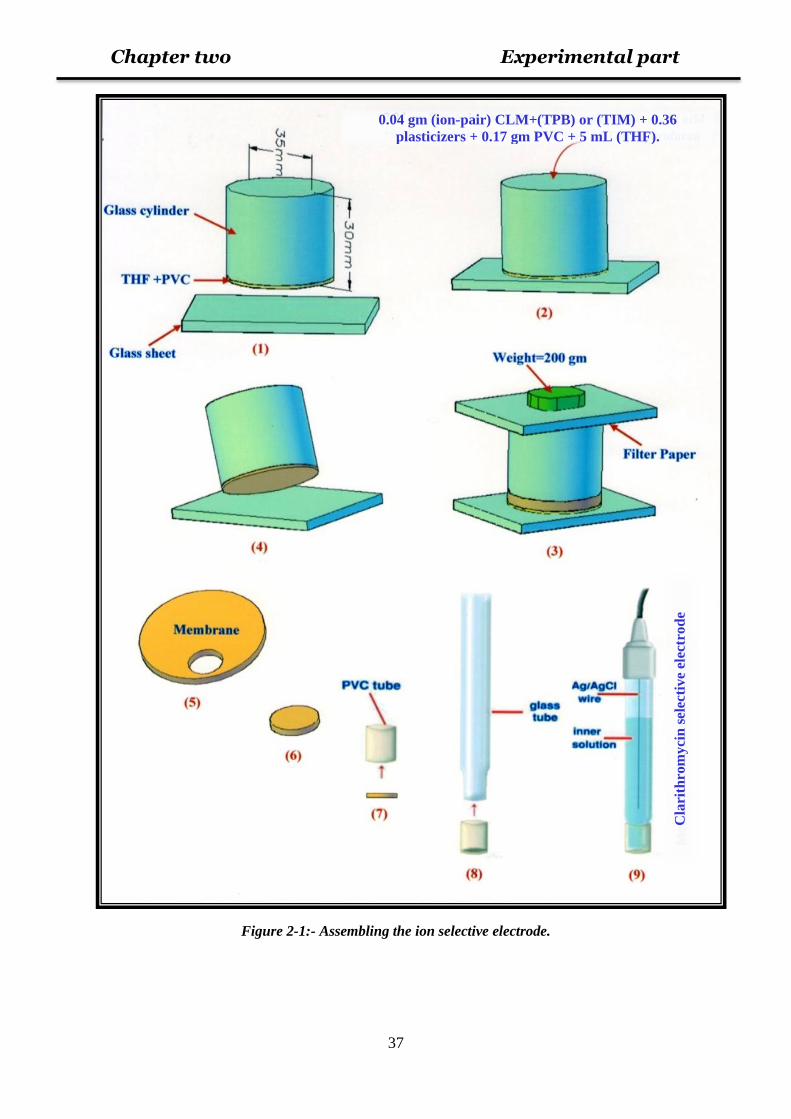
2-8-Assembling the ion selective electrode 36
2-9-Potential measurements 38
2-10- The pH effect 38
2-11-Selectivity measurements 38
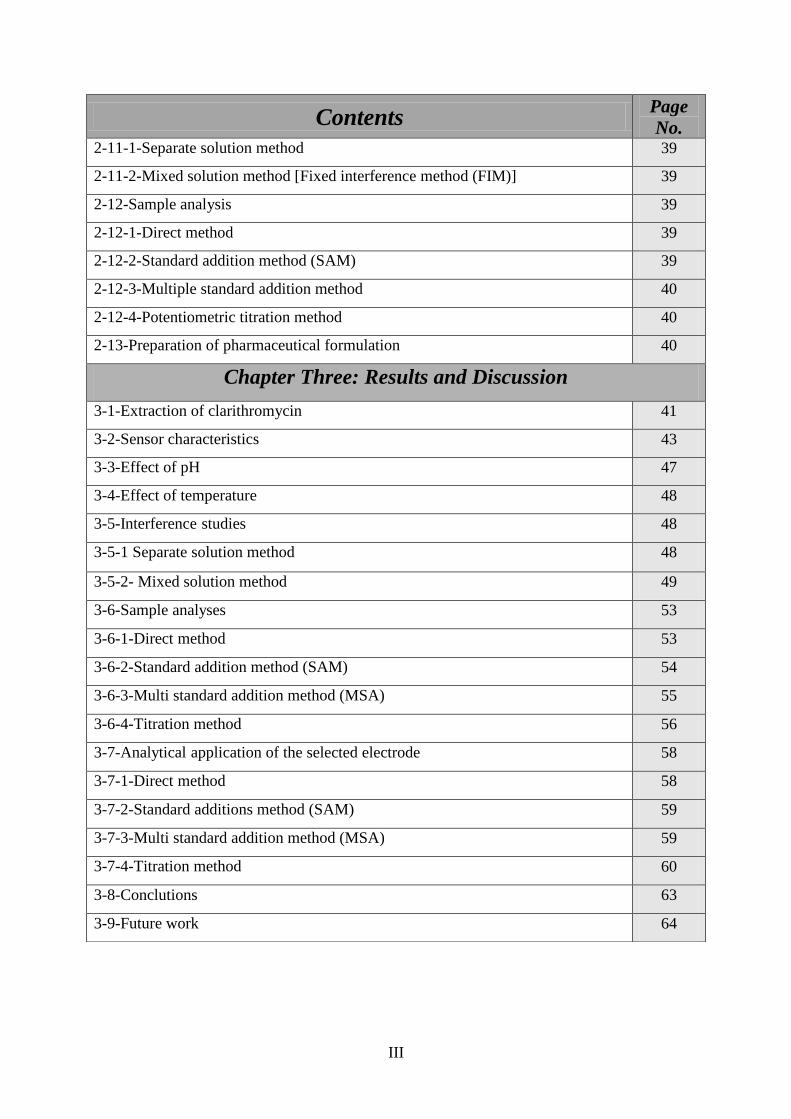
III
Contents Page
No. 2-11-1-Separate solution method 39
2-11-2-Mixed solution method [Fixed interference method (FIM)] 39
2-12-Sample analysis 39
2-12-1-Direct method 39
2-12-2-Standard addition method (SAM) 39
2-12-3-Multiple standard addition method 40
2-12-4-Potentiometric titration method 40
2-13-Preparation of pharmaceutical formulation 40
Chapter Three: Results and Discussion
3-1-Extraction of clarithromycin 41
3-2-Sensor characteristics 43
3-3-Effect of pH 47
3-4-Effect of temperature 48
3-5-Interference studies 48
3-5-1 Separate solution method 48
3-5-2- Mixed solution method 49
3-6-Sample analyses 53
3-6-1-Direct method 53
3-6-2-Standard addition method (SAM) 54
3-6-3-Multi standard addition method (MSA) 55
3-6-4-Titration method 56
3-7-Analytical application of the selected electrode 58
3-7-1-Direct method 58
3-7-2-Standard additions method (SAM) 59
3-7-3-Multi standard addition method (MSA) 59
3-7-4-Titration method 60
3-8-Conclutions 63
3-9-Future work 64
IV
Summary
This piece of research includes constructing and characterizing two
kinds of ion-selective electrodes (ISEs) based on PVC matrix membrane.
First, four ion-selective electrodes for clarithromycin (CLM) which
based on clarithromycin-tetraphenylborate (CLM-TPB) ion-pair complex
as the electro-active materials were prepared. Second, four ion-selective
electrodes for clarithromycin which based on using clarithromycin-
tetraiodomercurate (CLM-TIM) ion-pair complex as the electro-active
materials were also prepared. In both kinds of ISEs, some of the selected
plasticizers were employed such as; Di-octyl phthalate (DOP), Di-butyl
phosphate (DBP), Acetophenone (AP) and Di-butyl phthalate (DBPH) in
PVC matrix.
This thesis has mainly been structured in three different chapters,
each one containing the following information:
Chapter one provides a short historical review with the analytical
performance characteristics of ISEs are described. The applications of
ISEs in pharmaceutical and clarithromycin analyses are well-arranged in
tables and the general and specific objectives of thesis are reported.
Chapter two corresponds to the experimental part. Reagents,
instruments, procedures and detail protocols for the preparation of two
kinds of ISEs used in this study are reported.
Chapter three contains the experimental results and discussion that lead
to the possibility of successful applications the constructed ISEs in
pharmaceuticals preparation and clarithromycin measurements. It is
reporting the construction of two kinds of clarithromycin ISEs;
V
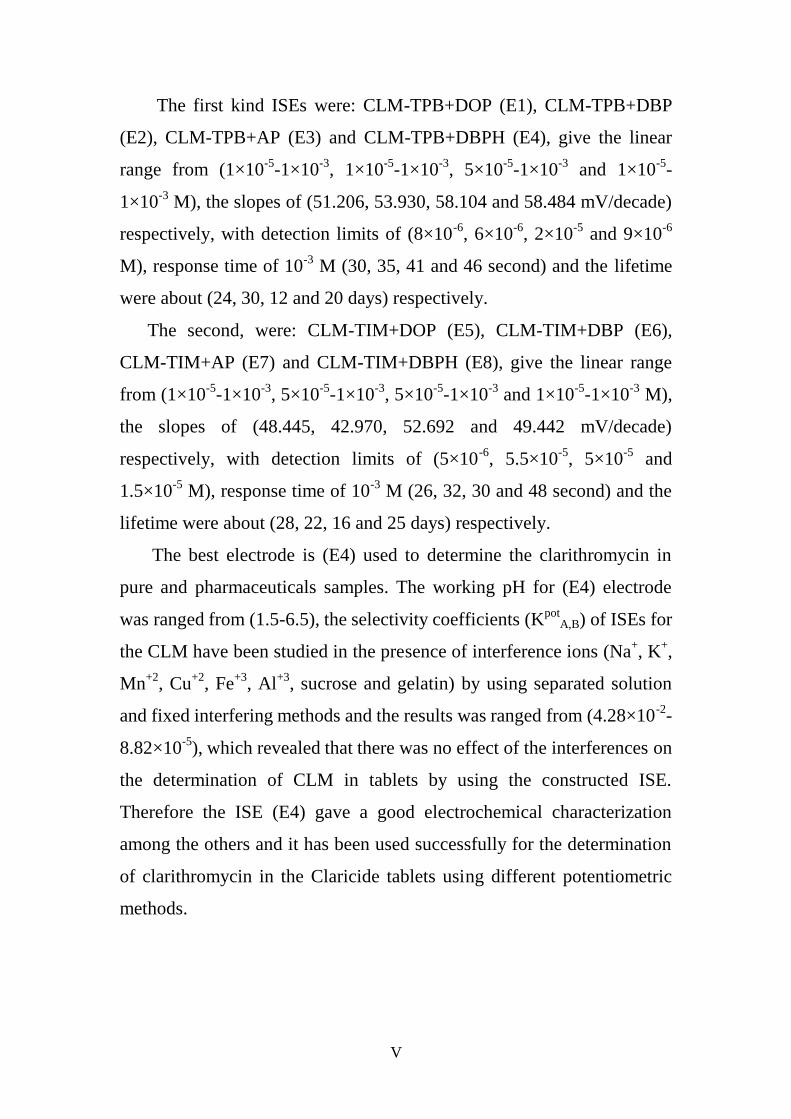
The first kind ISEs were: CLM-TPB+DOP (E1), CLM-TPB+DBP
(E2), CLM-TPB+AP (E3) and CLM-TPB+DBPH (E4), give the linear
range from (1×10⁻⁵
-1×10⁻³
, 1×10⁻⁵
-1×10⁻³
, 5×10⁻⁵
-1×10⁻³
and 1×10⁻⁵
-
1×10⁻³
M), the slopes of (51.206, 53.930, 58.104 and 58.484 mV/decade)
respectively, with detection limits of (8×10⁻⁶
, 6×10⁻⁶
, 2×10⁻⁵
and 9×10⁻⁶
M), response time of 10-3
M (30, 35, 41 and 46 second) and the lifetime
were about (24, 30, 12 and 20 days) respectively.
The second, were: CLM-TIM+DOP (E5), CLM-TIM+DBP (E6),
CLM-TIM+AP (E7) and CLM-TIM+DBPH (E8), give the linear range
from (1×10⁻⁵
-1×10⁻³
, 5×10⁻⁵
-1×10⁻³
, 5×10⁻⁵
-1×10⁻³
and 1×10⁻⁵
-1×10⁻³
M),
the slopes of (48.445, 42.970, 52.692 and 49.442 mV/decade)
respectively, with detection limits of (5×10⁻⁶
, 5.5×10⁻⁵
, 5×10⁻⁵
and
1.5×10⁻⁵
M), response time of 10-3
M (26, 32, 30 and 48 second) and the
lifetime were about (28, 22, 16 and 25 days) respectively.
The best electrode is (E4) used to determine the clarithromycin in
pure and pharmaceuticals samples. The working pH for (E4) electrode
was ranged from (1.5-6.5), the selectivity coefficients (Kpot
A,B) of ISEs for
the CLM have been studied in the presence of interference ions (Na+, K
+,
Mn+2
, Cu+2
, Fe+3
, Al+3
, sucrose and gelatin) by using separated solution
and fixed interfering methods and the results was ranged from (4.28×10⁻²
-
8.82×10⁻⁵
), which revealed that there was no effect of the interferences on
the determination of CLM in tablets by using the constructed ISE.
Therefore the ISE (E4) gave a good electrochemical characterization
among the others and it has been used successfully for the determination
of clarithromycin in the Claricide tablets using different potentiometric
methods.
VI
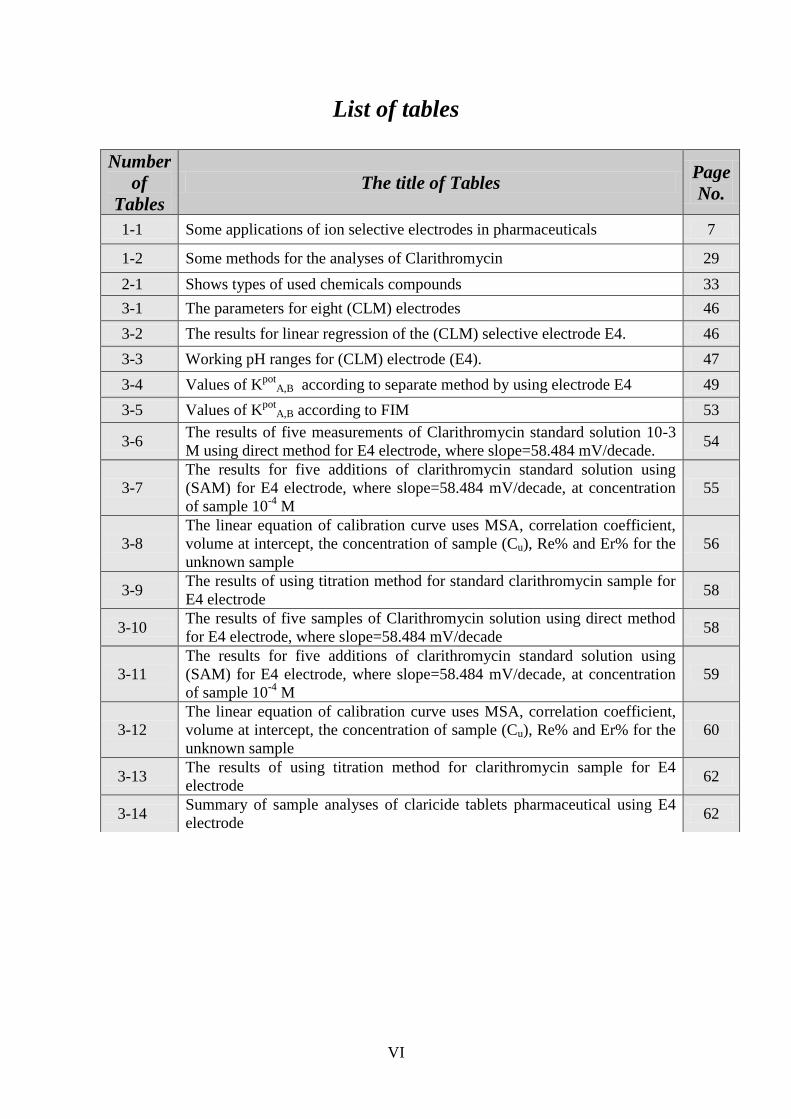
List of tables
Number
of
Tables
The title of Tables Page
No.
1-1 Some applications of ion selective electrodes in pharmaceuticals 7
1-2 Some methods for the analyses of Clarithromycin 29
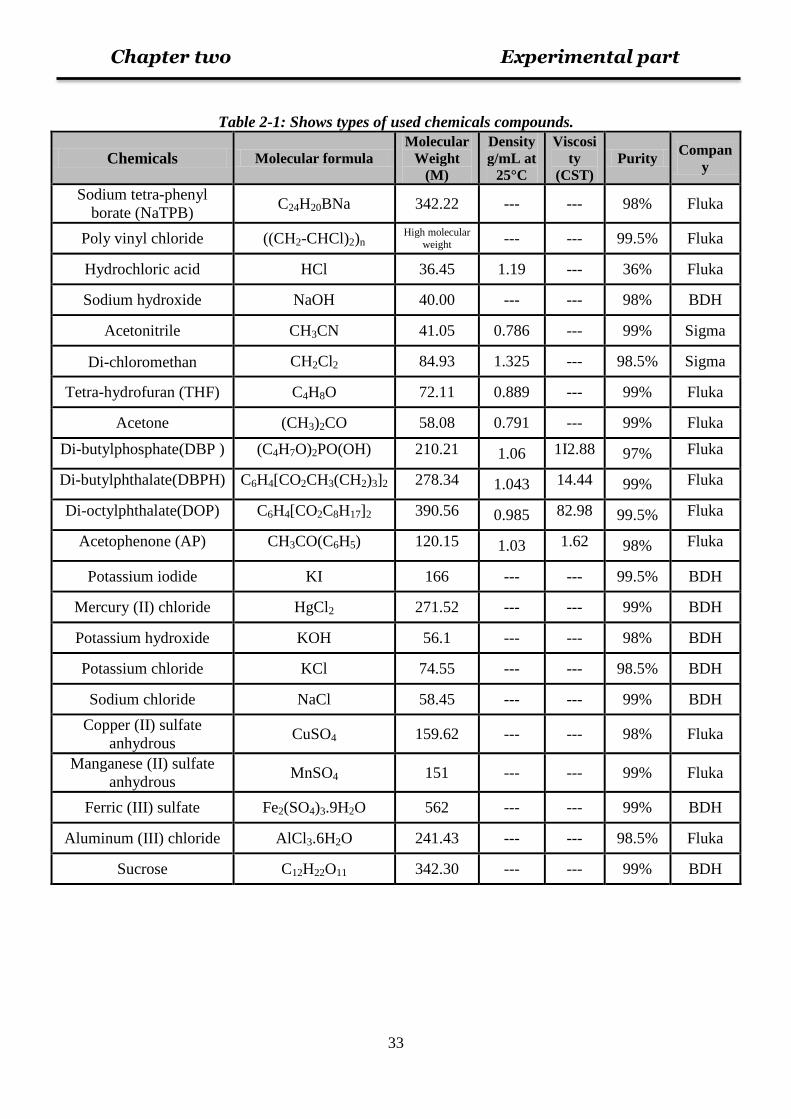
2-1 Shows types of used chemicals compounds 33
3-1 The parameters for eight (CLM) electrodes 46
3-2 The results for linear regression of the (CLM) selective electrode E4. 46
3-3 Working pH ranges for (CLM) electrode (E4). 47
3-4 Values of Kpot
A,B according to separate method by using electrode E4 49
3-5 Values of Kpot
A,B according to FIM 53
3-6 The results of five measurements of Clarithromycin standard solution 10-3
M using direct method for E4 electrode, where slope=58.484 mV/decade. 54
3-7
The results for five additions of clarithromycin standard solution using
(SAM) for E4 electrode, where slope=58.484 mV/decade, at concentration
of sample 10-4
M
55
3-8
The linear equation of calibration curve uses MSA, correlation coefficient,
volume at intercept, the concentration of sample (Cu), Re% and Er% for the
unknown sample
56
3-9 The results of using titration method for standard clarithromycin sample for
E4 electrode 58
3-10 The results of five samples of Clarithromycin solution using direct method
for E4 electrode, where slope=58.484 mV/decade 58
3-11
The results for five additions of clarithromycin standard solution using
(SAM) for E4 electrode, where slope=58.484 mV/decade, at concentration
of sample 10-4
M
59
3-12
The linear equation of calibration curve uses MSA, correlation coefficient,
volume at intercept, the concentration of sample (Cu), Re% and Er% for the
unknown sample
60
3-13 The results of using titration method for clarithromycin sample for E4
electrode 62
3-14 Summary of sample analyses of claricide tablets pharmaceutical using E4
electrode 62
VII
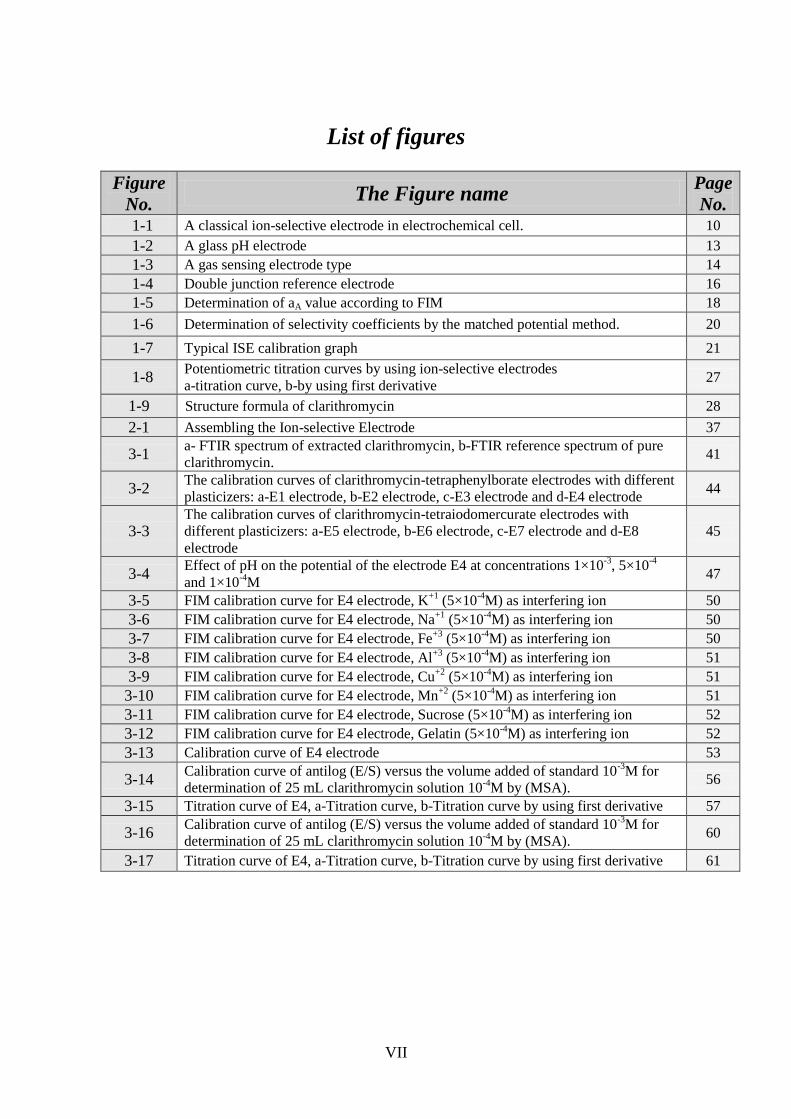
List of figures
Figure
No. The Figure name
Page
No. 1-1 A classical ion-selective electrode in electrochemical cell. 10
1-2 A glass pH electrode 13
1-3 A gas sensing electrode type 14
1-4 Double junction reference electrode 16
1-5 Determination of aA value according to FIM 18
1-6 Determination of selectivity coefficients by the matched potential method. 20
1-7 Typical ISE calibration graph 21
1-8 Potentiometric titration curves by using ion-selective electrodes
a-titration curve, b-by using first derivative 27
1-9 Structure formula of clarithromycin 28
2-1 Assembling the Ion-selective Electrode 37
3-1 a- FTIR spectrum of extracted clarithromycin, b-FTIR reference spectrum of pure
clarithromycin. 41
3-2 The calibration curves of clarithromycin-tetraphenylborate electrodes with different
plasticizers: a-E1 electrode, b-E2 electrode, c-E3 electrode and d-E4 electrode 44
3-3 The calibration curves of clarithromycin-tetraiodomercurate electrodes with
different plasticizers: a-E5 electrode, b-E6 electrode, c-E7 electrode and d-E8
electrode
45
3-4 Effect of pH on the potential of the electrode E4 at concentrations 1×10
-3, 5×10
-4
and 1×10⁻⁴
M 47
3-5 FIM calibration curve for E4 electrode, K+1
(5×10⁻⁴
M) as interfering ion 50
3-6 FIM calibration curve for E4 electrode, Na+1
(5×10⁻⁴
M) as interfering ion 50
3-7 FIM calibration curve for E4 electrode, Fe+3
(5×10⁻⁴
M) as interfering ion 50
3-8 FIM calibration curve for E4 electrode, Al+3
(5×10⁻⁴
M) as interfering ion 51
3-9 FIM calibration curve for E4 electrode, Cu+2
(5×10⁻⁴
M) as interfering ion 51
3-10 FIM calibration curve for E4 electrode, Mn+2
(5×10⁻⁴
M) as interfering ion 51
3-11 FIM calibration curve for E4 electrode, Sucrose (5×10⁻⁴
M) as interfering ion 52
3-12 FIM calibration curve for E4 electrode, Gelatin (5×10⁻⁴
M) as interfering ion 52
3-13 Calibration curve of E4 electrode 53
3-14 Calibration curve of antilog (E/S) versus the volume added of standard 10
-3M for
determination of 25 mL clarithromycin solution 10-4
M by (MSA). 56
3-15 Titration curve of E4, a-Titration curve, b-Titration curve by using first derivative 57
3-16 Calibration curve of antilog (E/S) versus the volume added of standard 10
-3M for
determination of 25 mL clarithromycin solution 10-4
M by (MSA). 60
3-17 Titration curve of E4, a-Titration curve, b-Titration curve by using first derivative 61
VIII
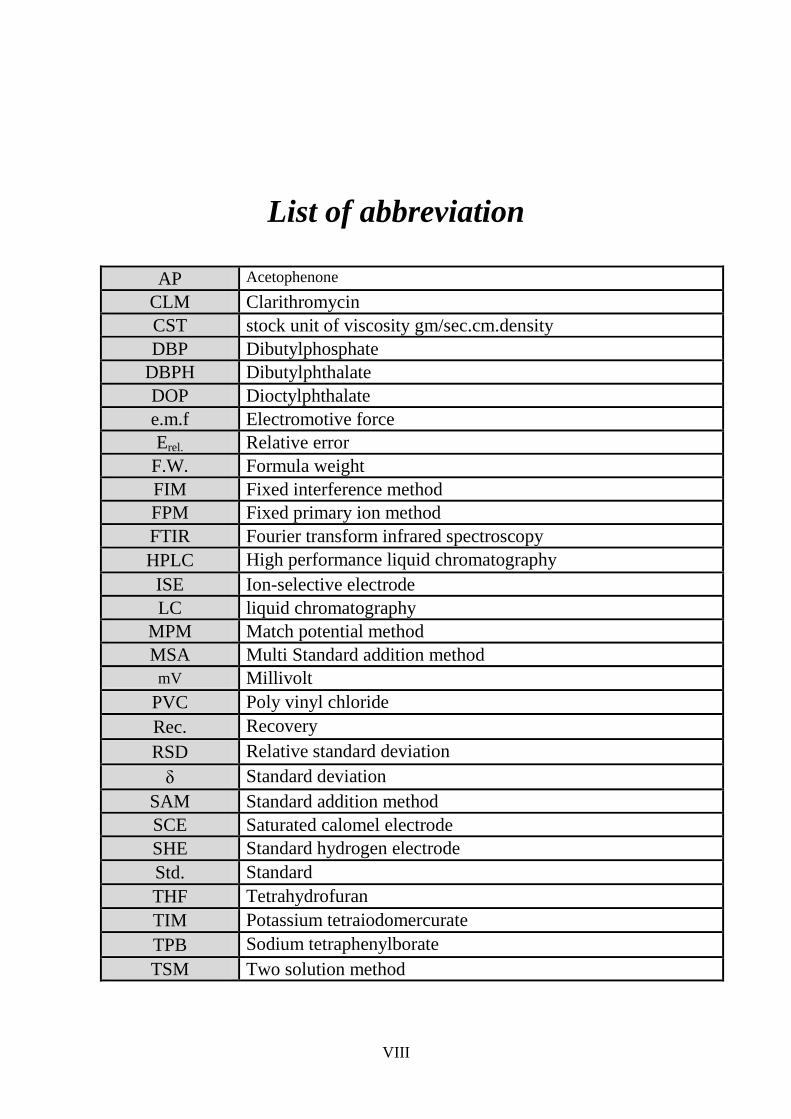
List of abbreviation
AP Acetophenone
CLM Clarithromycin
CST stock unit of viscosity gm/sec.cm.density
DBP Dibutylphosphate
DBPH Dibutylphthalate
DOP Dioctylphthalate
e.m.f Electromotive force
Erel. Relative error
F.W. Formula weight
FIM Fixed interference method
FPM Fixed primary ion method
FTIR Fourier transform infrared spectroscopy
HPLC High performance liquid chromatography
ISE Ion-selective electrode
LC liquid chromatography
MPM Match potential method
MSA Multi Standard addition method
mV Millivolt
PVC Poly vinyl chloride
Rec. Recovery
RSD Relative standard deviation
δ Standard deviation
SAM Standard addition method
SCE Saturated calomel electrode
SHE Standard hydrogen electrode
Std. Standard
THF Tetrahydrofuran
TIM Potassium tetraiodomercurate
TPB Sodium tetraphenylborate
TSM Two solution method

Chapter one Introduction
1
Introduction
1-1-Ion selective electrodes (ISEs):- Ion-Selective Electrodes (ISEs) are part of a group of relatively simple and
inexpensive analytical tools which are commonly referred to as Sensors, based
on thin films or selective membranes as recognition elements.
ISE is an electrochemical half-cell equivalent to other half-cells of the
different kinds. These devices are distinct from systems that involve redox
reactions, although they often contain a second kind electrode as the "inner" or
"internal" reference electrode. The potential difference response has, as its
principal component, the Gibbs energy change associated with perm selective
mass transfer (by ion-exchange, solvent extraction or some other mechanism)
across a phase boundary.
The ion selective electrodes must be used in conjunction with a reference
electrode (i.e. "outer" or "external" reference electrode) to form a complete
electrochemical cell. The measured potential differences (ISE versus outer
reference electrode potentials) are linearly dependent on the logarithm of the
activity of a given ion in solution [1]
. The pH electrode is the most well-known
and simplest member of this group and can be used to illustrate the basic
principles of ISEs [2]
.
1-2- The advantages of (ISEs) [3]
:-
1- Ion-Selective Electrodes are relatively inexpensive and simple to use and
have an extremely wide range of applications and wide concentration
range.
Chapter one Introduction
2
2- The most recent plastic-bodied all-solid-state or gel-filled models are
very strong and permanent and ideal for use in either field or laboratory
environments.
3- Under the most favorable conditions, when measuring ions in relatively
dilute aqueous solutions and where interfering ions are not a problem,
they can be used very rapidly and easily(e.g. simply dipping in lakes or
rivers, dangling from a bridge or dragging behind a boat).
4- They are particularly useful in applications where only an order of
magnitude concentration is required, or it is only necessary to know that a
particular ion is below a certain concentration level.
5- They are invaluable for the continuous monitoring of changes in
concentration: e.g. in potentiometric titrations or monitoring the uptake of
nutrients, or the consumption of reagents.
6- They are particularly useful in biological/medical applications because
they measure the activity of the ion directly, rather than the concentration.
7- In applications where interfering ions, pH levels, or high concentrations
are a problem, then many manufacturers can supply a library of
specialized experimental methods and special reagents to overcome many
of these difficulties.
8- With careful use, frequent calibration, and an awareness of the
limitations, they can achieve accuracy and precision levels of ± 2 or 3%
for some ions and thus compare favorably with analytical techniques
which require far more complex and expensive instrumentation.
9- ISEs are one of the few techniques which can measure both positive and
negative ions.
10- They are unaffected by sample color or turbidity.
Chapter one Introduction
3
11- ISEs can be used in aqueous solutions over a wide temperature range.
Crystal membranes can operate in the range 0°C to 80°C and plastic
membranes from 0°C to 50°C.
1-3-Limitation in ISE measurements:-
1-3-1-Diffusion [3]
:-
Orion Research points out that difference in the rates of diffusion of ions
based on size can lead to some error. In the example of sodium iodide, sodium
diffuses across the junction at a given rate. Iodide moves much slower due to its
larger size. To compensate for this type it is important that a positive flow of
filling solution move through the junction.
1-3-2-Sample ionic strength [1,4]
:-
The total ionic strength of a sample affects the activity coefficient and that
it is important that this factor stay constant. This adjustment is large, compared
to the ionic strength of the sample, such that variation between samples
becomes small and the potential for error is reduced.
1-3-3- Temperature [1,5]
:-
It is important that temperature be controlled as variation in this parameter
can lead to significant measurement errors. A single degree (C) change in
sample temperature can lead to measurement errors greater than 4%.
1-3-4- pH [3,6]
:-
Some samples may require conversion of the analyte to one form by
adjusting the pH of the solution. Failure to adjust the pH in these instances can
lead to significant measurement errors.
Chapter one Introduction
4
1-3-5-Interferences [3,6]
:-
The background matrix can affect the accuracy of measurements taken
using ISE's. Covington was pointed out that some interference may be
eliminated by reacting the interfering ions prior to analysis.
1-4- The applications of ISEs [3]
:-
Ion-selective electrodes are used in a wide variety of applications for
determining the concentrations of various ions in aqueous solutions. The
following is a list of some of the main areas in which ISEs have been used.
1-4-1- Agriculture [7,8]
:
a) Determination of nitrate, potassium, calcium and chloride in soils.
b) Analysis of additives in animal foodstuffs.
c) Analysis of plant materials for nitrate, potassium, chloride, fluoride,
iodide, cyanide and calcium.
d) Measurement of nitrate content of fertilizers.
1-4-2- Biomedical and clinical laboratories [9,10]
:
a) Determination of various species including calcium, potassium, chloride
in serum, blood, plasma and other body fluids. Electrodes are particularly
suitable as they monitor ion activity which is considered to be more
biologically significant than concentration.
b) Analysis of fluoride in skeletal structures.
c) Investigation of fluoride in dental studies.
d) Sweat chloride measurement as a screening test for cystic fibrosis.
Chapter one Introduction
5
1-4-3- Paper and pulp [3]
:
a) Sulphide is measured at every stage of the pulping and recovery cycle in
liquors, as well as in mill effluents.
b) Analysis of chloride in pulping liquors.
1-4-4- Pollution monitoring [11,12]
:
Levels of cyanide, fluoride, sulphide and chloride can be measured in
effluents, natural waters and waste-matters. The use of electrodes for
continuous, unattended and trouble-free monitoring makes them increasingly
suitable for pollution monitoring.
1-4-5- Detergent manufacture [13]
:
The measurements of calcium, water hardness and barium can be used to
study the effects of detergents on water quality.
1-4-6- Education and research [13]
:
a) Electrodes of all types are being used as sensors in many experiments to
study reaction mechanisms, kinetics, equilibria, activity coefficients and
solubility.
b) Electrodes are simple and inexpensive enough to be used by
undergraduates as part of analytical chemistry training.
c) Electrodes are particularly suitable for nuclear applications since they are
unaffected by radiation and can be remotely operated. Fluoride finds wide
application in fuel reprocessing solutions.
1-4-7- Explosives [3]
:
Fluoride, chloride and nitrate have been measured in explosives and their
combustion products.
Chapter one Introduction
6
1-4-8- Food processing [3,14]
:
a) Determination of nitrate and nitrate in meat preservatives.
b) Determination of salt content of meat, fish, milk, dairy products, fruit
juices, beer and brewing water.
c) Analysis of fluoride in drinking water, mineral drinks, fish protein, tea,
beer and brewing water.
d) Measurement of calcium in milk and dairy products and beer.
e) Determination of potassium in fruit juices and wine-making.
f) Monitoring the potential corrosive effect of nitrate in canned foods.
g) Determination of water hardness in brewing water.
1-4-9- Metallurgy and electroplating [3,13]
:
a) Analysis of etching baths for fluoride and chloride.
b) Measurement of sulphate and aluminium in anodizing baths.
c) Monitoring of urinary fluoride concentrations in people involved in the
extraction of aluminium.
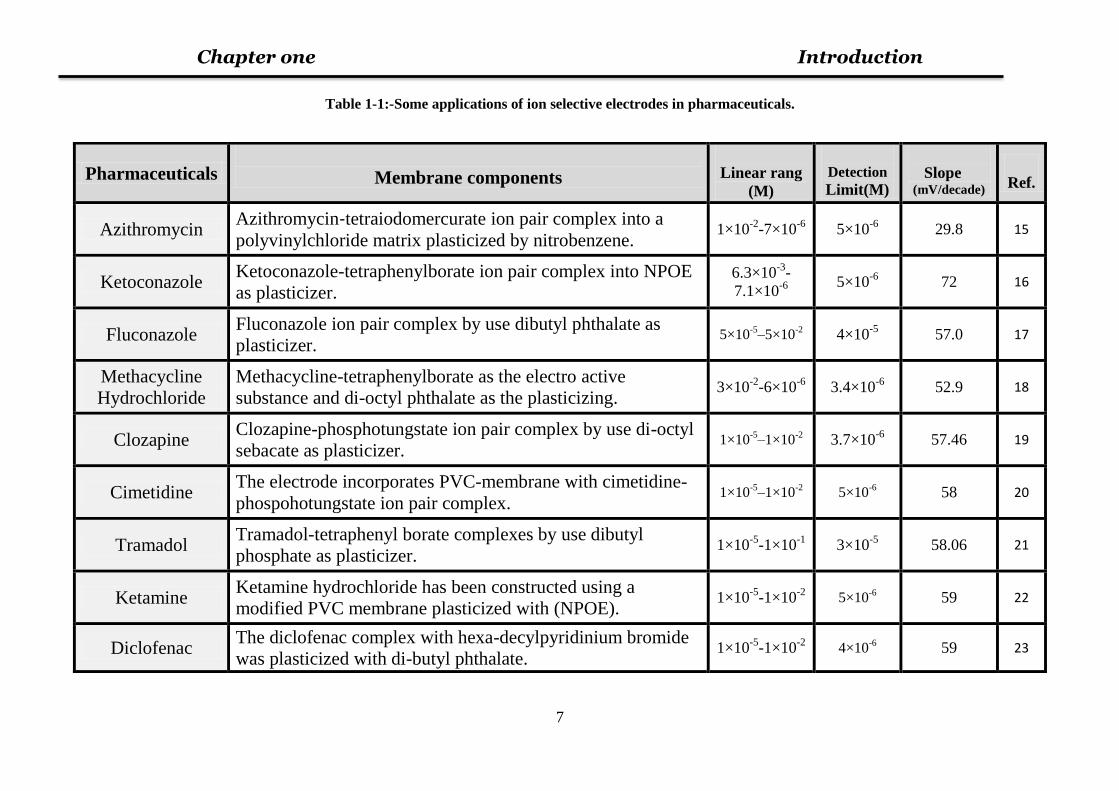
1-5- Applications of ISEs in pharmaceutical drugs:-
The ion selective membranes are widely used for pharmaceutical analysis
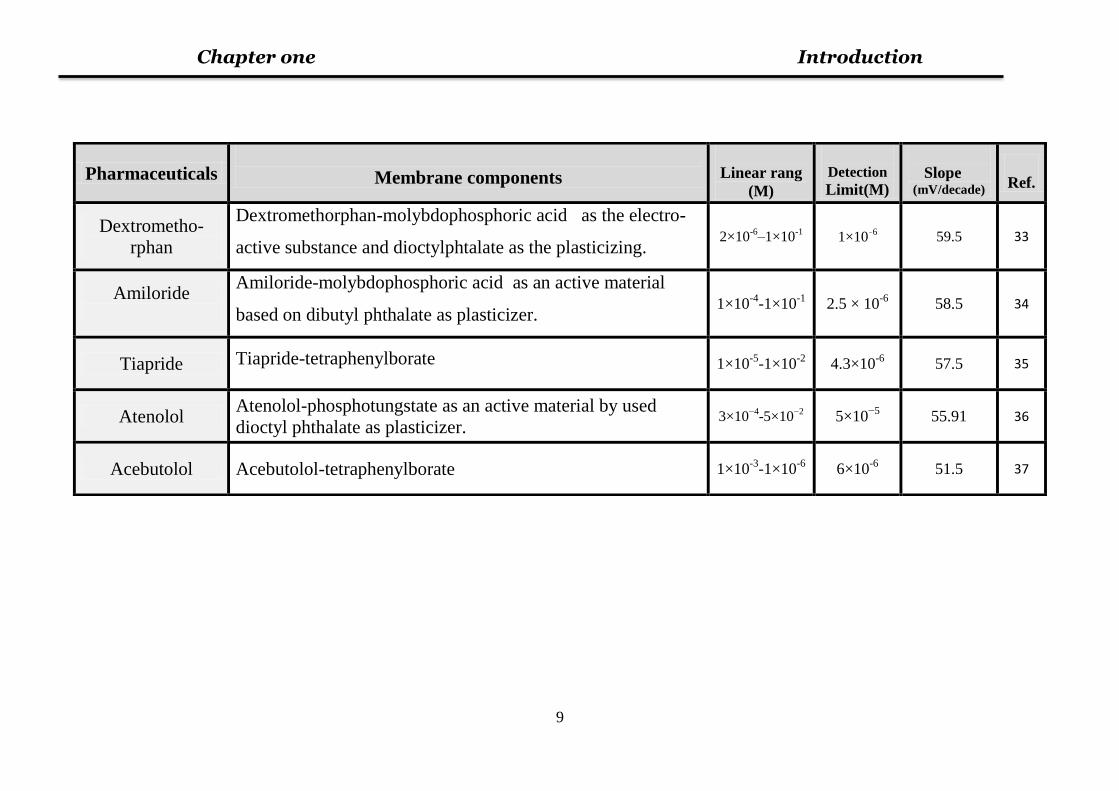
with advantages of determining sample directly, rapidly and simplicity. Table
(1-1) shows some applications of ion selective electrodes in pharmaceuticals.
Chapter one Introduction
7
Table 1-1:-Some applications of ion selective electrodes in pharmaceuticals.
Pharmaceuticals
Membrane components
Linear rang (M)
Detection
Limit(M)
Slope (mV/decade)
Ref.
Azithromycin Azithromycin‐tetraiodomercurate ion pair complex into a
polyvinylchloride matrix plasticized by nitrobenzene. 1×10
-2-7×10
-6 5×10
-6 29.8 15
Ketoconazole Ketoconazole-tetraphenylborate ion pair complex into NPOE
as plasticizer. 6.3×10
-3-
7.1×10⁻⁶
5×10
-6 72 16
Fluconazole Fluconazole ion pair complex by use dibutyl phthalate as
plasticizer. 5×10
-5–5×10
-2 4×10⁻⁵
57.0 17
Methacycline
Hydrochloride
Methacycline-tetraphenylborate as the electro active
substance and di-octyl phthalate as the plasticizing. 3×10
-2-6×10
-6 3.4×10⁻⁶
52.9 18
Clozapine Clozapine-phosphotungstate ion pair complex by use di-octyl
sebacate as plasticizer. 1×10
-5–1×10
-2 3.7×10⁻⁶
57.46 19
Cimetidine The electrode incorporates PVC-membrane with cimetidine-
phospohotungstate ion pair complex. 1×10
-5–1×10
-2 5×10⁻⁶ 58 20
Tramadol Tramadol-tetraphenyl borate complexes by use dibutyl
phosphate as plasticizer. 1×10
-5-1×10
-1 3×10
-5 58.06 21
Ketamine Ketamine hydrochloride has been constructed using a
modified PVC membrane plasticized with (NPOE). 1×10
-5-1×10
-2 5×10
-6 59 22
Diclofenac The diclofenac complex with hexa-decylpyridinium bromide
was plasticized with di-butyl phthalate. 1×10
-5-1×10
-2 4×10
-6 59 23
Chapter one Introduction
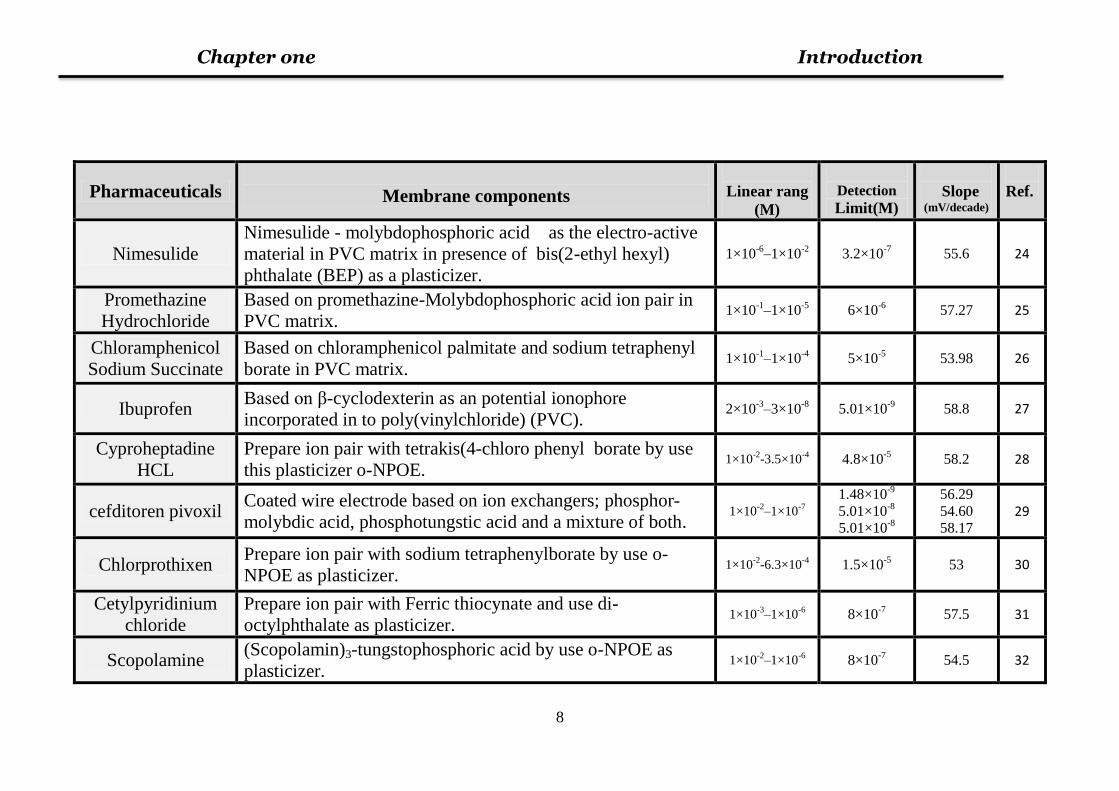
8
Pharmaceuticals
Membrane components
Linear rang
(M)
Detection
Limit(M)
Slope (mV/decade)
Ref.
Nimesulide
Nimesulide - molybdophosphoric acid as the electro-active
material in PVC matrix in presence of bis(2-ethyl hexyl)
phthalate (BEP) as a plasticizer.
1×10⁻⁶
–1×10⁻²
3.2×10⁻⁷
55.6 24
Promethazine
Hydrochloride
Based on promethazine-Molybdophosphoric acid ion pair in
PVC matrix. 1×10
-1–1×10
-5 6×10
-6 57.27 25
Chloramphenicol
Sodium Succinate
Based on chloramphenicol palmitate and sodium tetraphenyl
borate in PVC matrix. 1×10
-1–1×10
-4 5×10
-5 53.98 26
Ibuprofen Based on β-cyclodexterin as an potential ionophore
incorporated in to poly(vinylchloride) (PVC). 2×10
-3–3×10
-8 5.01×10
-9 58.8 27
Cyproheptadine
HCL
Prepare ion pair with tetrakis(4-chloro phenyl borate by use
this plasticizer o-NPOE. 1×10
-2-3.5×10
-4 4.8×10
-5 58.2 28
cefditoren pivoxil Coated wire electrode based on ion exchangers; phosphor-
molybdic acid, phosphotungstic acid and a mixture of both. 1×10
-2–1×10
-7
1.48×10⁻⁹
5.01×10⁻⁸
5.01×10⁻⁸
56.29
54.60
58.17
29
Chlorprothixen Prepare ion pair with sodium tetraphenylborate by use o-
NPOE as plasticizer. 1×10
-2-6.3×10
-4 1.5×10
-5
53
30
Cetylpyridinium
chloride
Prepare ion pair with Ferric thiocynate and use di-
octylphthalate as plasticizer. 1×10
-3–1×10
-6 8×10
-7 57.5 31
Scopolamine (Scopolamin)3-tungstophosphoric acid by use o-NPOE as
plasticizer. 1×10
-2–1×10
-6 8×10
-7 54.5 32
Chapter one Introduction
9
Pharmaceuticals
Membrane components
Linear rang (M)
Detection
Limit(M)
Slope (mV/decade)
Ref.
Dextrometho-
rphan
Dextromethorphan-molybdophosphoric acid as the electro-
active substance and dioctylphtalate as the plasticizing. 2×10
-6–1×10
-1 1×10⁻⁶ 59.5 33
Amiloride
Amiloride-molybdophosphoric acid as an active material
based on dibutyl phthalate as plasticizer. 1×10
-4-1×10
-1 2.5 × 10
-6 58.5 34
Tiapride Tiapride-tetraphenylborate 1×10⁻⁵
-1×10⁻²
4.3×10⁻⁶
57.5 35
Atenolol Atenolol-phosphotungstate as an active material by used
dioctyl phthalate as plasticizer. 3×10
−4-5×10
−2 5×10
−5 55.91 36
Acebutolol Acebutolol-tetraphenylborate 1×10⁻³
-1×10⁻⁶
6×10⁻⁶
51.5 37
Chapter one Introduction
10
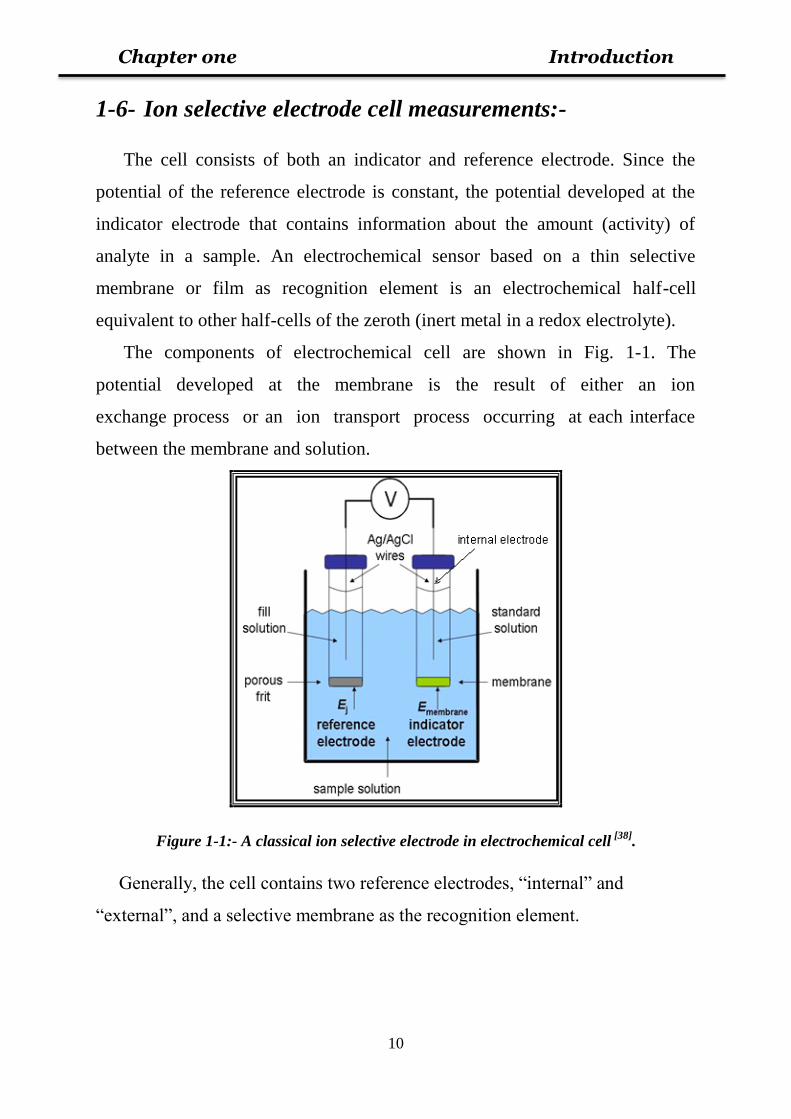
1-6- Ion selective electrode cell measurements:-
The cell consists of both an indicator and reference electrode. Since the
potential of the reference electrode is constant, the potential developed at the
indicator electrode that contains information about the amount (activity) of
analyte in a sample. An electrochemical sensor based on a thin selective
membrane or film as recognition element is an electrochemical half-cell
equivalent to other half-cells of the zeroth (inert metal in a redox electrolyte).
The components of electrochemical cell are shown in Fig. 1-1. The
potential developed at the membrane is the result of either an ion
exchange process or an ion transport process occurring at each interface
between the membrane and solution.
Figure 1-1:- A classical ion selective electrode in electrochemical cell [38]
.
Generally, the cell contains two reference electrodes, “internal” and
“external”, and a selective membrane as the recognition element.
Chapter one Introduction
11
However, besides this conventional type of the cell with solution contact on
both sides of the membrane there are ISE cell arrangements with wire contact to
one side of the membrane. Conventional notation of the cell is [38]
:-
External ref.│test solution│membrane│internal solution│internal ref.
The measured cell e.m.f, E is described with the Nernst equation [39]
:-
E = E0 - (RT/nF) ln a …1-1
E = E0 - (2.303RT/nF) log a …1-2
Where E0 = constant for a given cell, E = the total potential developed
between the sensing and reference electrode (mV), R = gas constant (8.314
joule mole-1
deg-1
), T= temperature in Kelvin (298ºK or 250C), n = ionic charge,
F = faraday constant (96485 coulombs), a = is the ion activity. At room
temperature (250C) Nernst equation is frequently expressed as:-
E = E0 - (59.2 / n) log a …1-3
Cell design according to the basic rule of designing of electrolytical cells,
with a condition that the current passed through the electrolytical cell equals
zero, as showed in Fig. 1-1. The exchange that occurs between the internal and
external solution across the membrane depends on ionic exchange and the
active ionophore which used in the membrane [40]
.
Etotal = E0 + Ejunction – Emembren …1-4
Chapter one Introduction
12
1-7- Classification of ion-selective electrodes [1]
:-
1-7-1- Primary ion selective electrodes:
1-7-1-1- Crystalline electrodes:
May be homogeneous or heterogeneous:
(a) Homogeneous membrane electrodes are ion-selective electrodes in
which the membrane is a crystalline material prepared from either a
single compound or a homogeneous mixture of compounds (i.e., Ag2S,
AgI + Ag2S).
(b) Heterogeneous membrane electrodes are formed when an active
substance or mixture of active substances, is mixed with an inert matrix,
such as silicone rubber or polyvinyl chloride (PVC), to form the sensing
membrane.
1-7-1-2- Non-crystalline electrodes:
In these electrodes, the ion-selective membrane consists of a matrix
containing an ion-exchanger [see (a) and (b) below) and is usually interposed
between two aqueous solutions. The matrix may be porous (e.g., cellulose ester)
or nonporous (e.g., glass or inert polymeric material such as PVC).
(a) Glass electrodes [41,42]
:
Are ion-selective electrodes in which the sensing membrane is a thin piece
of special glass. The chemical composition of the glass determines the
selectivity of the membrane. In this group are:
(i) hydrogen ion-selective electrodes,
(ii) monovalent cation-selective electrodes.
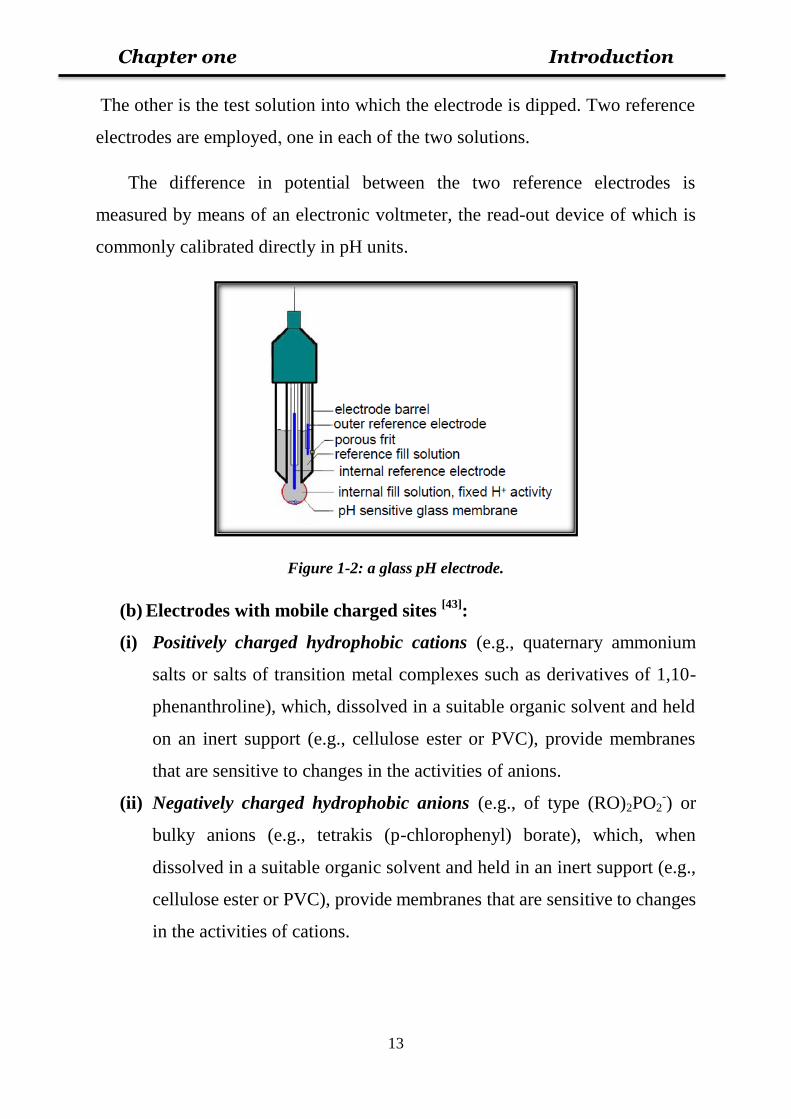
A common form of the glass membrane electrode is depicted in Fig. 1-2. In use
for measurement of pH, the glass membrane separates two liquid phases. One is
inside the electrode as shown and it is typically 0.1 F hydrochloric acid.
Chapter one Introduction
13
The other is the test solution into which the electrode is dipped. Two reference
electrodes are employed, one in each of the two solutions.
The difference in potential between the two reference electrodes is
measured by means of an electronic voltmeter, the read-out device of which is
commonly calibrated directly in pH units.
Figure 1-2: a glass pH electrode.
(b) Electrodes with mobile charged sites [43]
:
(i) Positively charged hydrophobic cations (e.g., quaternary ammonium
salts or salts of transition metal complexes such as derivatives of 1,10-
phenanthroline), which, dissolved in a suitable organic solvent and held
on an inert support (e.g., cellulose ester or PVC), provide membranes
that are sensitive to changes in the activities of anions.
(ii) Negatively charged hydrophobic anions (e.g., of type (RO)2PO2-) or
bulky anions (e.g., tetrakis (p-chlorophenyl) borate), which, when
dissolved in a suitable organic solvent and held in an inert support (e.g.,
cellulose ester or PVC), provide membranes that are sensitive to changes
in the activities of cations.
Chapter one Introduction
14
(iii) Uncharged ‘carrier’ electrodes based on solutions of molecular
complexing agents (e.g., antibiotics, macrocyclic compounds or other
sequestering agents), which can be used in membrane preparations to
give selectivity to certain cations.
(iv) Hydrophobic ion-pair electrodes consisting of a dissolved
hydrophobic ion-pair in plasticized PVC (e.g., a cation drug tetra-
phenyl borate, or a tetra-alkyl ammonium surfactant anion) responding
to component activities in the solution (e.g., containing the cation drug
chloride or sodium salt of the surfactant).
1-7-2- Compound or multiple membrane (multilayer) ion
selective electrodes:-
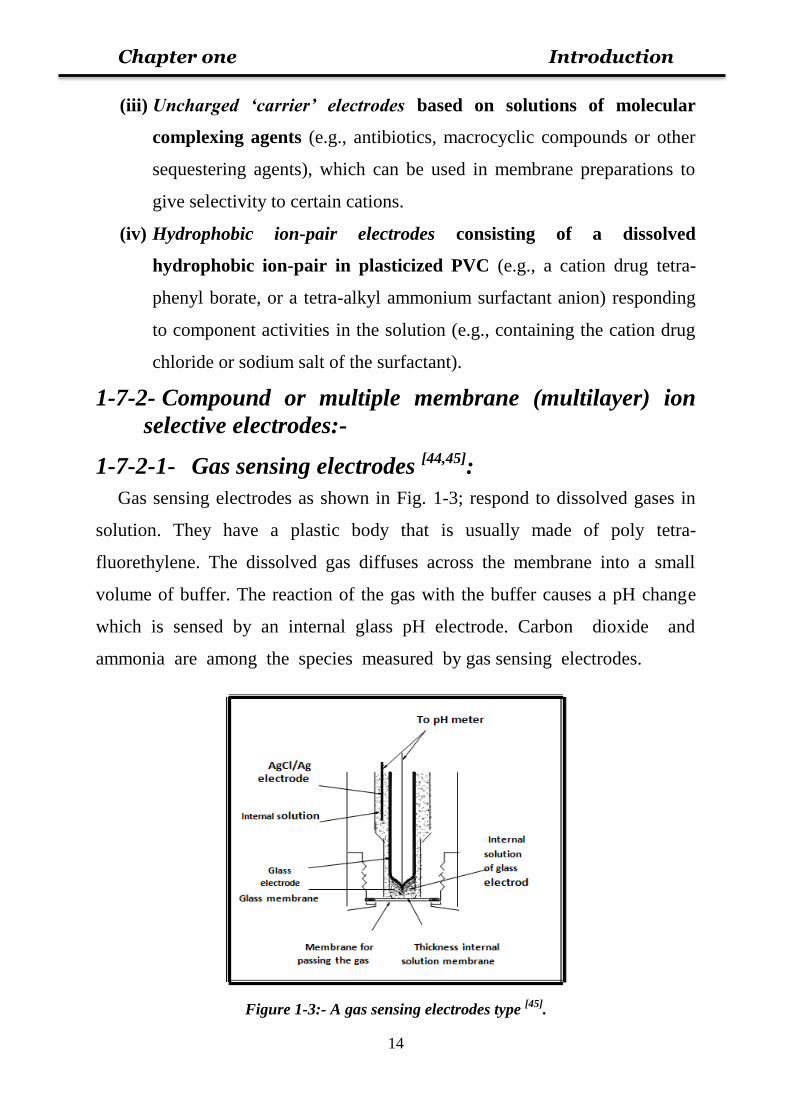
1-7-2-1- Gas sensing electrodes [44,45]
: Gas sensing electrodes as shown in Fig. 1-3; respond to dissolved gases in
solution. They have a plastic body that is usually made of poly tetra-
fluorethylene. The dissolved gas diffuses across the membrane into a small
volume of buffer. The reaction of the gas with the buffer causes a pH change
which is sensed by an internal glass pH electrode. Carbon dioxide and
ammonia are among the species measured by gas sensing electrodes.
Figure 1-3:- A gas sensing electrodes type [45]
.
Chapter one Introduction
15
1-7-2-2- Enzyme electrodes [46]
:-
Enzyme electrodes definitely are not true ion selective electrodes but
usually are considered within the ion specific electrode topic. Such an electrode
has a double reaction mechanism, an enzyme reacts with a specific substance,
and the product of this reaction (usually ammonia or carbon dioxide) is detected
by a true ion selective electrode, such as a pH selective electrode. All these
reactions occur inside a special membrane which covers the true ion selective
electrode. An example is glucose selective electrodes.
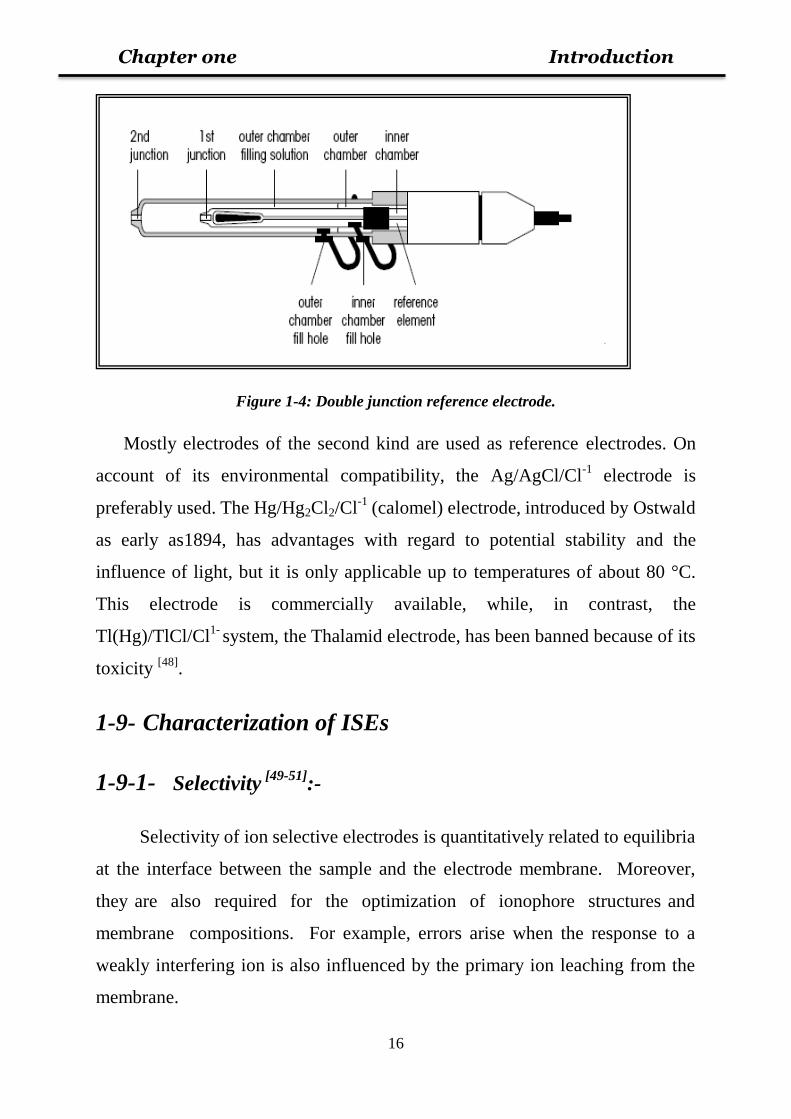
1-8- Reference electrodes [47]
:-
Reference electrodes are applicable in instances where the electrical
potential is to be imposed or measured in a solution. Also, it has a stable and
well defined electrochemical potential against which the applied or measured
potentials in an electrochemical cell are referred, Reference electrode is
necessary to complete electrochemical cell. It is preferable to use a double-
junction reference electrode for ISE applications. Standard reference half cells
have KCl based electrolyte filling solutions, as shown in Fig. 1-4. This is a
distinct disadvantage when, for example, potassium or chloride is being
measured. To overcome this, a double junction reference is used in which the
escaping KCI is retained in a second chamber containing a non-interfering
electrolyte, which in turn escapes into the test solution at the second junction.
Chapter one Introduction
16
Figure 1-4: Double junction reference electrode.
Mostly electrodes of the second kind are used as reference electrodes. On
account of its environmental compatibility, the Ag/AgCl/Cl-1
electrode is
preferably used. The Hg/Hg2Cl2/Cl-1
(calomel) electrode, introduced by Ostwald
as early as1894, has advantages with regard to potential stability and the
influence of light, but it is only applicable up to temperatures of about 80 °C.
This electrode is commercially available, while, in contrast, the
Tl(Hg)/TlCl/Cl1-
system, the Thalamid electrode, has been banned because of its
toxicity [48]
.
1-9- Characterization of ISEs
1-9-1- Selectivity [49-51]
:-
Selectivity of ion selective electrodes is quantitatively related to equilibria
at the interface between the sample and the electrode membrane. Moreover,
they are also required for the optimization of ionophore structures and
membrane compositions. For example, errors arise when the response to a
weakly interfering ion is also influenced by the primary ion leaching from the
membrane.
Chapter one Introduction
17
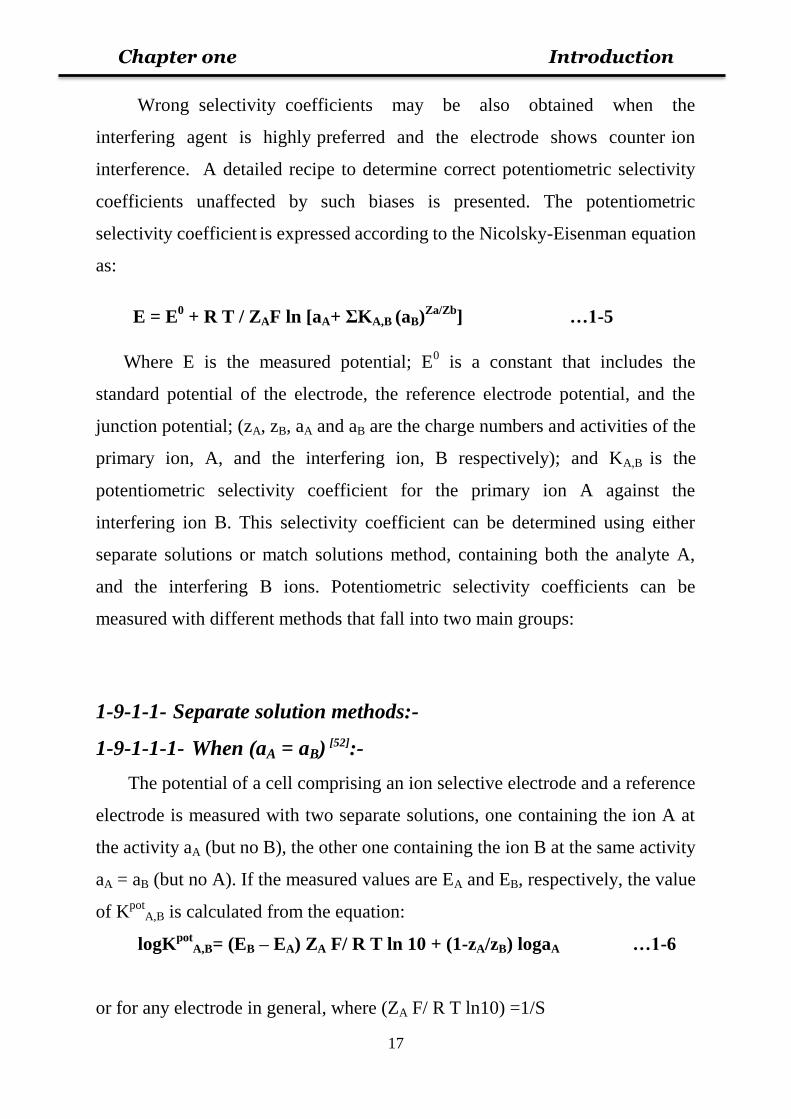
Wrong selectivity coefficients may be also obtained when the
interfering agent is highly preferred and the electrode shows counter ion
interference. A detailed recipe to determine correct potentiometric selectivity
coefficients unaffected by such biases is presented. The potentiometric
selectivity coefficient is expressed according to the Nicolsky-Eisenman equation
as:
E = E0 + R T / ZAF ln [aA+ ΣKA,B (aB)
Za/Zb] …1-5
Where E is the measured potential; E0 is a constant that includes the
standard potential of the electrode, the reference electrode potential, and the
junction potential; (zA, zB, aA and aB are the charge numbers and activities of the
primary ion, A, and the interfering ion, B respectively); and KA,B is the
potentiometric selectivity coefficient for the primary ion A against the
interfering ion B. This selectivity coefficient can be determined using either
separate solutions or match solutions method, containing both the analyte A,
and the interfering B ions. Potentiometric selectivity coefficients can be
measured with different methods that fall into two main groups:
1-9-1-1- Separate solution methods:-
1-9-1-1-1- When (aA = aB) [52]:-
The potential of a cell comprising an ion selective electrode and a reference
electrode is measured with two separate solutions, one containing the ion A at
the activity aA (but no B), the other one containing the ion B at the same activity
aA = aB (but no A). If the measured values are EA and EB, respectively, the value
of Kpot
A,B is calculated from the equation:
logKpot
A,B= (EB – EA) ZA F/ R T ln 10 + (1-zA/zB) logaA …1-6
or for any electrode in general, where (ZA F/ R T ln10) =1/S
Chapter one Introduction
18
logKpot
A,B = (EB –EA) /S + (1 – zA/zB) logaA …1-7
Where (S) is the slope of the electrode.This method is recommended only if
the electrode exhibits a Nernstian response. It is less desirable because it does
not represent as well the actual conditions under which the electrodes are used.
1-9-1-1-2- When (EA = EB )[53]
:-
The potential of an ISE for the primary and interfering ions are obtained
independently. Then, the activities that correspond to the same electrode
potential value are used to determine the Kpot
A,B value and it equal:
Kpot
A,B = aA / (aB) Za/Zb
…1-8
1-9-1-2- Mixed solution methods:-
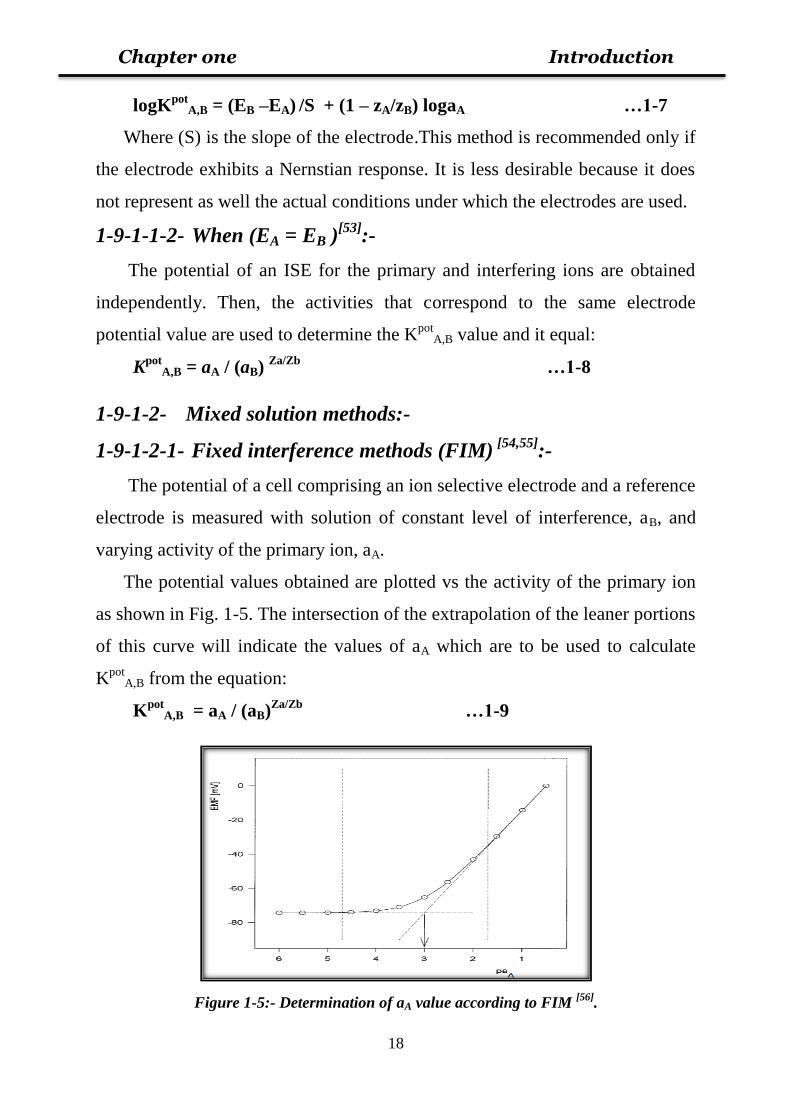
1-9-1-2-1- Fixed interference methods (FIM) [54,55]
:-
The potential of a cell comprising an ion selective electrode and a reference
electrode is measured with solution of constant level of interference, aB, and
varying activity of the primary ion, aA.
The potential values obtained are plotted vs the activity of the primary ion
as shown in Fig. 1-5. The intersection of the extrapolation of the leaner portions
of this curve will indicate the values of aA which are to be used to calculate
Kpot
A,B from the equation:
Kpot
A,B = aA / (aB)Za/Zb
…1-9
Figure 1-5:- Determination of aA value according to FIM [56]
.
Chapter one Introduction
19
1-9-1-2-2- Fixed primary ion method (FPM) [57,58]
:-
The e.m.f of the cell comprising and a ion selective electrode and reference
electrode (ISE cell) is measured for solutions of constant activity of the primary
ion, aA and a varying activity of the interfering ion, aB. The e.m.f. values
obtained are plotted vs. the logarithm of the activity of the interfering ion. The
intersection of the extrapolated linear portions of this plot indicates the value of
aB that is to be used to calculate Kpot
A,B from the equation 1-8.
1-9-1-2-3- Two solutions method (TSM) [57,53]
:-
This method involves measuring potentials of a pure solution of the primary
ion, EA, and a mixed solution containing the primary and interfering ions EA+B.
The Kpot
A,B is calculated by inserting the value of the potential difference,
ΔE=EA+B -EA, into the following equation:
Kpot
A,B = aA (eΔE zA F / (R T)
– 1) / (aB) Za/Zb
... 1-10
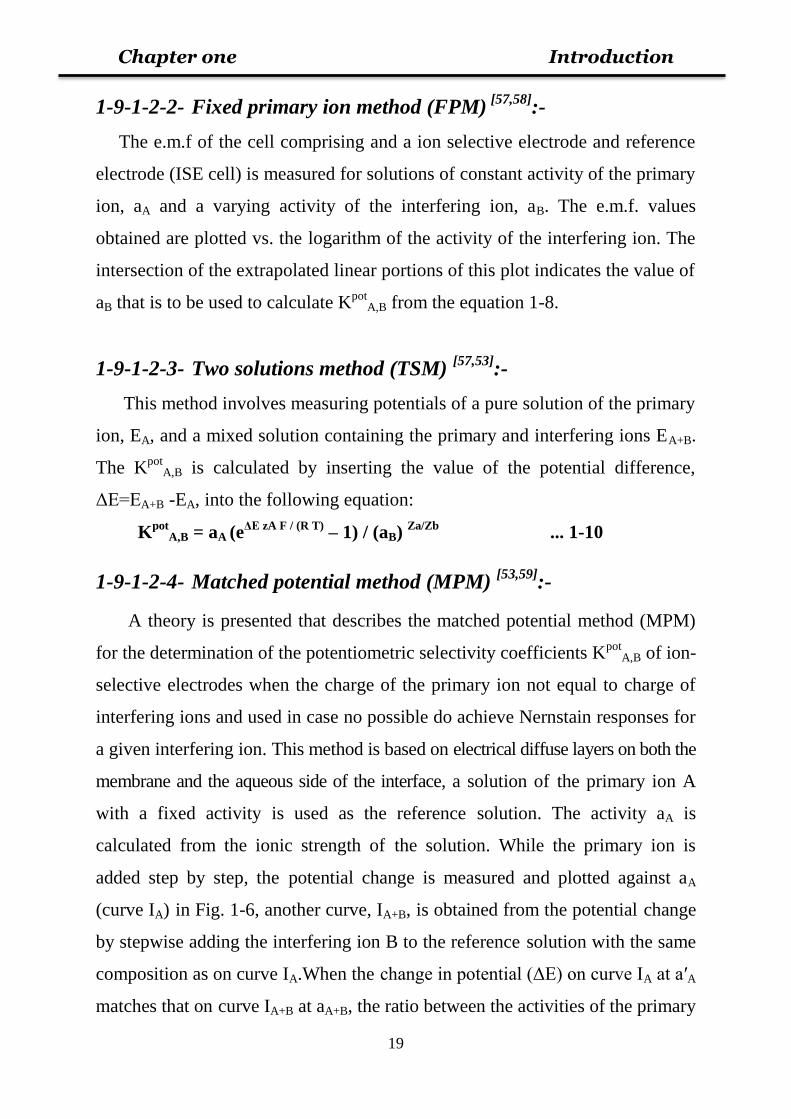
1-9-1-2-4- Matched potential method (MPM) [53,59]
:-
A theory is presented that describes the matched potential method (MPM)
for the determination of the potentiometric selectivity coefficients Kpot
A,B of ion-
selective electrodes when the charge of the primary ion not equal to charge of
interfering ions and used in case no possible do achieve Nernstain responses for
a given interfering ion. This method is based on electrical diffuse layers on both the
membrane and the aqueous side of the interface, a solution of the primary ion A
with a fixed activity is used as the reference solution. The activity aA is
calculated from the ionic strength of the solution. While the primary ion is
added step by step, the potential change is measured and plotted against aA
(curve IA) in Fig. 1-6, another curve, IA+B, is obtained from the potential change
by stepwise adding the interfering ion B to the reference solution with the same
composition as on curve IA.When the change in potential (ΔE) on curve IA at a′A
matches that on curve IA+B at aA+B, the ratio between the activities of the primary
Chapter one Introduction
20
ion A relative to the interfering ion B denotes the selectivity coefficient Kpot
A,B.
The selectivity coefficient Kpot
A,B is thus obtained as
Kpot
A,B = ∆aA / aB … 1-11
Which ∆aA = (aA' – aA)
Figure 1-6: Determination of selectivity coefficients by the matched potential method [53]
.
1-9-2- Calibration curve [3,39,60]
:-
The operation of ion selective electrodes is based on the fact that there is a
linear relationship between the electrical potential developed between an ISE
and a reference electrode (RE) immersed in the same solution, and the
logarithm of the activity (or “effective concentration”) of the ions in the
solution. This relationship is described by the Nernst equation:
E = constant ± (2.303 RT/ nF) log a ...1-12
Fig. 1-7 shows, a typical plot of the cell e.m.f (i.e. the galvanic potential
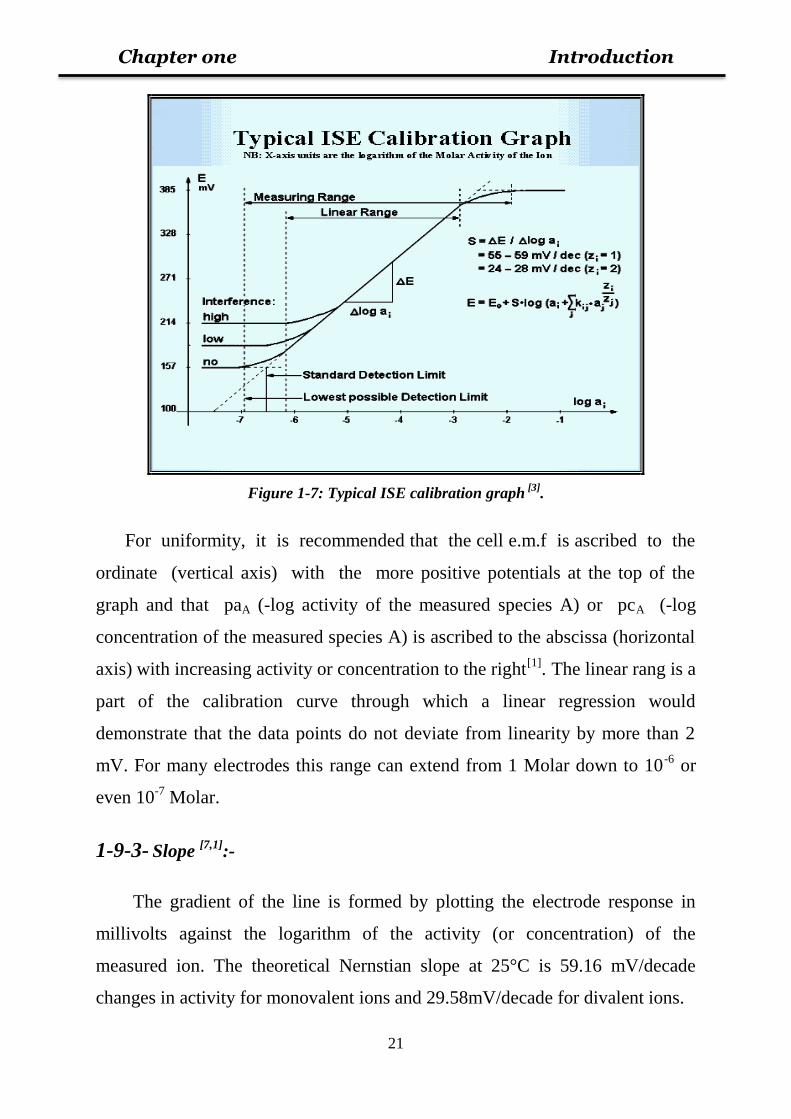
difference measured between the ISE and the external RE of a given ion-
selective electrode cell assembly) versus the logarithm of the single ionic
activity (concentration) of a given species.
Chapter one Introduction
21
Figure 1-7: Typical ISE calibration graph [3]
.
For uniformity, it is recommended that the cell e.m.f is ascribed to the
ordinate (vertical axis) with the more positive potentials at the top of the
graph and that paA (-log activity of the measured species A) or pcA (-log
concentration of the measured species A) is ascribed to the abscissa (horizontal
axis) with increasing activity or concentration to the right[1]
. The linear rang is a
part of the calibration curve through which a linear regression would
demonstrate that the data points do not deviate from linearity by more than 2
mV. For many electrodes this range can extend from 1 Molar down to 10-6
or
even 10-7
Molar.
1-9-3- Slope [7,1]
:-
The gradient of the line is formed by plotting the electrode response in
millivolts against the logarithm of the activity (or concentration) of the
measured ion. The theoretical Nernstian slope at 25°C is 59.16 mV/decade
changes in activity for monovalent ions and 29.58mV/decade for divalent ions.
Chapter one Introduction
22
In practice the slope is generally lower than (59.16 and 29.58mV/decade.)
this is due to the inefficiency of the ion selective membranes and the failure to
meet ideal conditions. Measured slopes generally lie in the range 54±5 and 26±3
mV/decade, respectively and will have a negative for anion. Measured slopes
lower than this, or a gradual reduction of slope during use, are indicative of
contamination of the ISE membrane. The slope of an electrode can be
determined by measuring the mV response in two standard solutions with
concentrations (activities) of a1 and a2, (effectively creating a calibration graph
of mV (E) against the log of the concentration). The slope of the line is
calculated from:
S = (E1 - E2) / (Log a1 – Log a2) ….. 1-13
And the intercept from:
c = E1 - S Log a1 …..1-14
Thus, if an unknown sample is measured and found to have a potential of E3
mV the concentration can be calculated from: Log a = (E3-c)/S. This is
essentially the calculation used in the direct potentiometry method of sample
measurement.
1-9-4- Detection limit [1]
:-
According to the IUPAC recommendation, the detection limit is defined by
the intersection of the two extrapolated linear parts of the ion selective
calibration curve as shown in Figure 1-6. In practice, detection limit on the
order of 10-6
-10-5
M is measured for most of ion selective electrodes. The
observed detection limit is often governed by the presence of other interfering
ions and the purity of standard solutions used for calibration curve.
Chapter one Introduction
23
1-9-5- Range of linear response [3]
:-
The linear range of the electrode is defined as that part of the calibration
curve through which a linear regression would demonstrate that the data points
do not deviate from linearity by more than 2 mV. For many electrodes this
range can extend from about 0.1 Molar down to 10-6
or even 10-7
Molar.
1-9-6- Response time [61,62]
:-
In earlier IUPAC recommendations, it was defined as the time between the
instant at which the ion selective electrode and a reference electrode are
dipped in the sample solution and the first instant at which the potential of the
cell becomes equal to its steady-state value within ±1mV for the final
equilibrium potential. Generally electrodes with liquid ion-exchanger membrane
have longer response time than solid membrane electrode. This may be due to
the slow rate of reaction between the determined ion and the ion-exchanger
which lead to slower transport of the ions across the membrane-solution
interface. However, the main factors that influenced on the response time
include; the type of membrane, the rate of change of solution activity and the
presence of interference which all slow the response time of these electrodes.
1-9-7- Stability and Lifetime [49]
:-
The stability and lifetime are features associated with the response behavior
of ISEs. A number of problems affect the stability and lifetime of PVC based
electrodes. They include the solution concentration, the interfering ions, which
poison the electrode surface, the limited solubility of the active material, and its
solvent, which affect the content of the membrane to leak away. All these lead
to a positive or negative drift in the response and slope values, indicating that
the electrode is approaching the end of its life.
Chapter one Introduction
24
1-10- Methods of measurement [3]
:-
Many measurement techniques are based on ion selective electrodes have
been described. The most important and widely used techniques for such studies
are; direct method, incremental methods and potentiometric titration method.
1-10-1- Direct potentiometry method [56]
:-
Direct potentiometric method is the simplest and most widely used for the
quantitative measurements using ISEs. Simply measure the electrode response
in an unknown solution and calculate the concentration directly from the
regression line of the calibration curve or manually by using a special type of
graph paper called the semi-log (or log/mm) paper is used. Semi-log paper
comes in one cycle, two cycles, three cycles…etc.
Each cycle is an exact repetition of single cycle. Each single cycle
corresponds to an order of magnitude or decade, or by using special computer
graphics and calculations (eg. Microsoft Office Excel). A big advantage of this
method is that it can be used to measure large batches of samples covering a
wide range of concentrations very rapidly without having to change range,
recalibrate or make any complicated calculations.
1-10-2- Standard additions method (SAM) [49,63]
:-
This method is generally more accurate than the direct method for
concentration measuring in the sample, but it is more time-consuming because
of the calibration involved. In this method, the ISE cell assembly is immersed in
the sample and the equilibrium cell potential is recorded, then a known volume
of a standard solution of the determinant is added to the first volume and the
electrode potential is re-measured, from which the potential difference (ΔE) is
found. By solving the following equation the unknown concentration can be
obtained:
CU = CS / 10ΔE/S
[1+ (VU / VS)] - (VU / VS) … 1-15
Chapter one Introduction
25
Where CU: the concentration of unknown solution, CS: the concentration of
standard solution, VU: the volume of unknown solution, VS: the volume of
standard solution and S: the slope of electrode. Standard addition can be applied
to most analytical techniques and is used instead of a calibration curve to solve
the matrix effect problem. The standard solution is added to the unknown
solution so any impurities in the unknown are accounted for in the calibration.
1-10-3- Multiple standard additions method (MSA) [64]
:-
It is an extension of standard additions method. The response of ISE to
certain analyte A, in solution free from interfering ions can be represented
by Nernst equation:
E= E0 + S Log aA ×VS/ VU ...1-16
Where S is the slope of the electrode, VS, VU, are the volumes of added
standard and unknown (sample) respectively; VU is usually set to be hundred
times more than VS. Rearranging of equation and taking the antilog gives:
Antilog E/S = constant × aA VS /VU ...1-17
Where antilog E/S is constant thus the antilog E/S is proportional to VS. A
plot of antilog E/S as a measure of aA along the ordinate against VS along
abscissa yields a straight line which can be extrapolated back to an intercept on
the standard volume. The concentration of sample (unknown) can be calculated:
CU = Vs × CS / VU …1-18
Where CU and CS are the concentration of unknown and standard,
respectively, Vs is the volume of standard.
Chapter one Introduction
26
1-10-4- Advantages and Disadvantages of the Incremental
Methods [3]
:-
1- Incremental methods are particularly useful for the 'one-off' analysis since
they generally require only one standard solution and two potential
measurements.
2- Since the standard solution is always in at least 10:1 excess, the effects of
the matrix in the sample are practically eliminated. Ionic strength
adjustors are not necessary.
3- Temperature differences between the sample and the standard become
unimportant, since again the dilution effect will quickly reduce the
sample temperature to that of the standard.
4- An increased range of species can be measured using the sample
subtraction technique, since measurements can be made on samples for
which there is no ion selective electrode.
5- A disadvantage of all incremental addition methods is the fact that the
approximate value of the 'unknown' concentration must be known so that
the correct standard solution can be used.
6- The use of incremental techniques also introduces the need for the
accurate measurement of volumes of both sample and standard.
1-10-5- Potentiometric titration method [65]
:-
Potentiometric titration method has also been used for the evaluation of
the performance of ion selective electrode in which the ion selective electrode
is only used as an indicator and the accuracy is derived from the classical
titration process can yield answers to within 0.1-0.5%. Potentiometry is
generally valuable as a technique for detecting the end-point of titrations where
there is often a drastic change in the concentration of the reactants and thus a
big shift in the electrode potential.
Chapter one Introduction
27
These end point determinations can often be made more precisely than other
ISE methods because they depend on the accuracy of the volumetric
measurements rather than the measurement of the electrode potential. The
sample is titrated with a suitable titrant and the increase or decrease in titrant
activity is followed with an ISE response, to locate the equivalence point as in
Fig. 1-8.
(b)-Titration curve by using first derivative. (a)-Titration curve.
Figure 1-8: Potentiometric titration curves by using ion-selective electrodes:
(a)-titration curve, (b)-by using first derivative [66].
1-11- Clarithromycin:
Clarithromycin (CLM), 6-o-methyl-erythromycin or 4-[(2,6-Dideoxy-3-C-
methyl- 3-O-methyl- L-ribohexopyranosyl) oxy] -14-ethyl -12,13-dihydroxy -7-
methoxy- 3,5,7,9,11,13-hexamethyl -6-[[3,4,6-trideoxy -3-(di-methyl amino)-D-
xylohexopyranosyl] oxy] oxa-cyclo-tetra-decane-2,10-dione, which has the
empirical formula (C38H69NO13), as shown in Fig. 1-9, is white or almost white,
crystalline powder with molecular weight 748 g/mole, practically insoluble in
water, soluble in acetone and in methylene chloride, slightly soluble in
methanol [67]
.
Chapter one Introduction
28
Figure 1-9: Structure formula of clarithromycin [67]
.
Clarithromycin is a semi-synthetic macrolide antibiotic with good
antimicrobial activity against a wide range of gram-positive and gram-negative
organisms. It is widely used for the treatment of Mycoplasmas, Haemophilus
influenzae, Chlamydia species and Rickettsia [68,69]
.
1-12- Analysis of Clarithromycin:-
Various analytical methods have been developed to determine
clarithromycin in formulations and biological samples, such as spectro-
photometric and high performance liquid chromatography with electrochemical
and spectrophotometric detection methods. Table 1-2, shows some of these
methods.
Chapter one Introduction
29
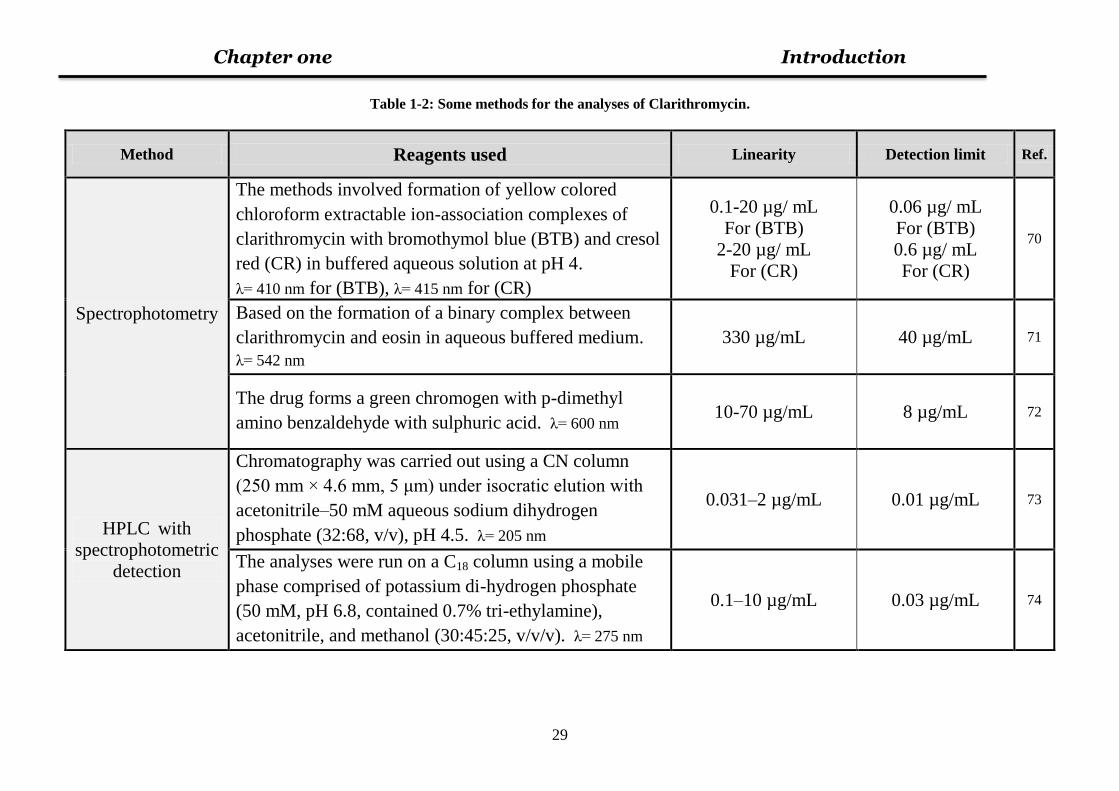
Table 1-2: Some methods for the analyses of Clarithromycin.
Method Reagents used Linearity Detection limit Ref.
Spectrophotometry
The methods involved formation of yellow colored
chloroform extractable ion-association complexes of
clarithromycin with bromothymol blue (BTB) and cresol
red (CR) in buffered aqueous solution at pH 4.
λ= 410 nm for (BTB), λ= 415 nm for (CR)
0.1-20 µg/ mL
For (BTB)
2-20 µg/ mL
For (CR)
0.06 µg/ mL
For (BTB)
0.6 µg/ mL
For (CR)
70
Based on the formation of a binary complex between
clarithromycin and eosin in aqueous buffered medium.
λ= 542 nm
330 µg/mL 40 µg/mL 71
The drug forms a green chromogen with p-dimethyl
amino benzaldehyde with sulphuric acid. λ= 600 nm 10-70 µg/mL 8 µg/mL 72
HPLC with
spectrophotometric
detection
Chromatography was carried out using a CN column
(250 mm × 4.6 mm, 5 μm) under isocratic elution with
acetonitrile–50 mM aqueous sodium dihydrogen
phosphate (32:68, v/v), pH 4.5. λ= 205 nm
0.031–2 µg/mL 0.01 µg/mL 73
The analyses were run on a C18 column using a mobile
phase comprised of potassium di-hydrogen phosphate
(50 mM, pH 6.8, contained 0.7% tri-ethylamine),
acetonitrile, and methanol (30:45:25, v/v/v). λ= 275 nm
0.1–10 µg/mL 0.03 µg/mL 74
Chapter one Introduction
30
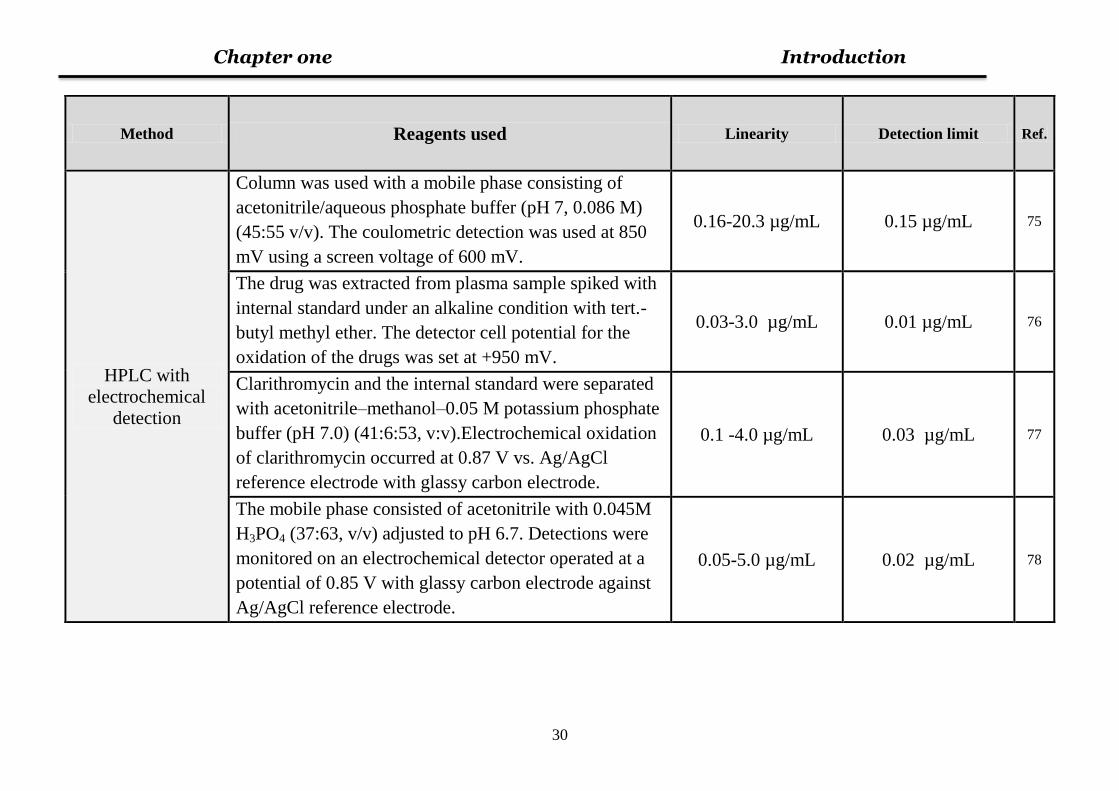
Method Reagents used Linearity Detection limit Ref.
HPLC with
electrochemical
detection
Column was used with a mobile phase consisting of
acetonitrile/aqueous phosphate buffer (pH 7, 0.086 M)
(45:55 v/v). The coulometric detection was used at 850
mV using a screen voltage of 600 mV.
0.16-20.3 µg/mL 0.15 µg/mL 75
The drug was extracted from plasma sample spiked with
internal standard under an alkaline condition with tert.-
butyl methyl ether. The detector cell potential for the
oxidation of the drugs was set at +950 mV.
0.03-3.0 µg/mL 0.01 µg/mL 76
Clarithromycin and the internal standard were separated
with acetonitrile–methanol–0.05 M potassium phosphate
buffer (pH 7.0) (41:6:53, v:v).Electrochemical oxidation
of clarithromycin occurred at 0.87 V vs. Ag/AgCl
reference electrode with glassy carbon electrode.
0.1 -4.0 µg/mL 0.03 µg/mL 77
The mobile phase consisted of acetonitrile with 0.045M
H3PO4 (37:63, v/v) adjusted to pH 6.7. Detections were
monitored on an electrochemical detector operated at a
potential of 0.85 V with glassy carbon electrode against
Ag/AgCl reference electrode.
0.05-5.0 µg/mL 0.02 µg/mL 78
Chapter one Introduction
31
1-13-Aim of the work:-
This project was aimed to construct and characterize several types of ion-
selective electrodes for the potentiometric determination of Clarithromycin
(CLM) in pure and pharmaceuticals. These electrodes utilize plasticizers as the
solvent mediators such as; di-butylphthalate (DBPH), di-butylphosphate (DBP),
di-octyl phthalate (DOP) and Acetophenone (AP). The constructed electrodes
characteristic parameters that include slope, linear range, detection limit,
lifetime, selectivity, and working pH range will be investigated. Also, the
statistical treatments were applied for the analytical results.
The best combination of clarithromycin (ionophore), solvent mediator, and
PVC matrix will be chosen. Potentiometric measurements including direct
method, standard additions method and titration method will be studied.

Chapter two Experimental part
32
Experimental part
2-1- Instruments and equipment:- 1- A digital pH/ion meter (inoLab 740 with terminal 740 – WTW,
Germany).
2- Fourier transforms infrared spectrophotometer (FTIR-8300 SHIMADZU,
Japan).
3- Hotplate Magnetic stirrer (LMS-1003, Daihan Labtech).
4- Sartorius Handy 4digits Analytical Balance (GMBH, H110, Germany).
5- pH combination glass electrode (SenTix® 82 WTW, Germany).
6- Calomel reference electrode.
7- Silver-silver chloride wire.
8- Clear PVC tubing (6 mm o.d.).
2-2- Chemicals:-
The chemical compounds were used throughout the study as shown in
Table2-1.
Chapter two Experimental part
33
Table 2-1: Shows types of used chemicals compounds.
Chemicals Molecular formula
Molecular Weight
(M)
Density
g/mL at
25°C
Viscosi
ty
(CST)
Purity Compan
y
Sodium tetra-phenyl
borate (NaTPB) C24H20BNa 342.22 --- --- 98% Fluka
Poly vinyl chloride ((CH2-CHCl)2)n High molecular
weight --- --- 99.5% Fluka
Hydrochloric acid HCl 36.45 1.19 --- 36% Fluka
Sodium hydroxide NaOH 40.00 --- --- 98% BDH
Acetonitrile CH3CN 41.05 0.786 --- 99% Sigma
Di-chloromethan CH2Cl2 84.93 1.325 --- 98.5% Sigma
Tetra-hydrofuran (THF) C4H8O 72.11 0.889 --- 99% Fluka
Acetone (CH3)2CO 58.08 0.791 --- 99% Fluka
Di-butylphosphate(DBP ) (C4H7O)2PO(OH) 210.21 1.06 1I2.88 97% Fluka
Di-butylphthalate(DBPH) C6H4[CO2CH3(CH2)3]2 278.34 1.043 14.44 99% Fluka
Di-octylphthalate(DOP) C6H4[CO2C8H17]2 390.56 0.985 82.98 99.5% Fluka
Acetophenone (AP) CH3CO(C6H5) 120.15 1.03 1.62 98% Fluka
Potassium iodide KI 166 --- --- 99.5% BDH
Mercury (II) chloride HgCl2 271.52 --- --- 99% BDH
Potassium hydroxide KOH 56.1 --- --- 98% BDH
Potassium chloride KCl 74.55 --- --- 98.5% BDH
Sodium chloride NaCl 58.45 --- --- 99% BDH
Copper (II) sulfate
anhydrous CuSO4 159.62 --- --- 98% Fluka
Manganese (II) sulfate
anhydrous MnSO4 151 --- --- 99% Fluka
Ferric (III) sulfate Fe2(SO4)3.9H2O 562 --- --- 99% BDH
Aluminum (III) chloride AlCl3.6H2O 241.43 --- --- 98.5% Fluka
Sucrose C12H22O11 342.30 --- --- 99% BDH
Chapter two Experimental part
34
2-3- Extraction of Clarithromycin:-
Clarithromycin was extracted from Claricide tablets according to the
literature procedure [79]
. Claricide tablets (containing 500 mg clarithromycin)
were purchased from Bilim pharmaceuticals (made in Turkey).
A quantity of the powdered tablets containing 0.5 g of Clarithromycin
was shaken with 10 ml of water and extracted with 20 ml of dichloromethane.
The lower dichloromethane layer was separated and centrifuged, and then the
supernatant was filtered and evaporated to dryness at room temperature, the
resulting precipitate was investigated using FTIR.
2-4- Preparation of potassium tetra-iodomercurate [80]
:-
Potassium tetra-iodomercurate (KTIM), Nessler's reagent, is generally
prepared from potassium iodide and mercury chloride. A hot saturated solution
(60 g/L) of mercury chloride is added to solution of potassium iodide (10 g
dissolved in 10 mL water), until the precipitate formed, then adding 80 mL of
9M potassium hydroxide solution and diluted to 200mL. The resulting solution
is then cooled and then 5.55mL of this solution was diluted to 50mL to prepare
0.01M.
2-5- Preparation of standard solutions:-
1- A stock solution of 10-3
M Clarithromycin was prepared by dissolving
0.0374 g of pure (CLM) in acetonitrile and water in proportion (1:3) and
completing the solution up to 50 mL. The working solutions 10-8
-10-3
M
of CLM were prepared by serial appropriate dilution of the stock solution
using the same solvent.
2- A standard solution of 0.01 M Sodium tetra-phenyl borate (NaTPB) was
prepared by dissolving 0.1711 g of pure (NaTPB) in acetone and
completing the solution up to 50 mL.
Chapter two Experimental part
35
3- A 0.1 M hydrochloric acid was prepared by diluting 0.8 mL of 12 M HCl
concentrated stoke solution to 100 mL by distilled water, and 0.1 M of
NaOH was prepared by weighting 0.4 g of NaOH and dissolving it in 100
mL by distilled water.
4- All solutions were prepared in distilled water, stock solutions of 0.1 M of
NaCl, KCl, CuSO4, MnSO4, Fe2(SO4)3.9H2O, AlCl3.6H2O, sucrose and
gelatein were prepared by weighted (0.2922, 0.3727, 0.7981, 0.7550,
2.81, 1.2071, 1.7115 and 1.50 g) and dissolved by distilled water in 50
mL volumetric flask. More diluted solutions were prepared by dilution
from the stock solutions as required.
2-6- Preparation of ion-pair compounds:-
Two type of electro-active substance were prepared, the preparation of ion-
pair of (CLM-TPB) was performed by mixing equal volume of 0.01 M solution
of tetra-phenyl borate with an equimolar solution of clarithromycin dissolved in
acetone, a white precipitate formed immediately after addition of a few drops of
concentrated hydrochloride acid. The ion-pair of (CLM-TIM) was prepared
using the same method and a semi white precipitate formed.
The resulting precipitates were filtered off, washed with water, dried at
room temperature for two days using the vacuum desiccator.
2-7- Preparation of clarithromycin electrodes:-
Eight clarithromycin ion-selective electrodes were prepared based on the
use of ion-pair compounds clarithromycin-tetraphenylborate (CLM-TPB) and
clarithromycin-tetraiodomercurate (CLM-TIM) as the electro-active substance
with four plasticizers. The method of immobilization the ion-pair compounds
into the PVC matrix membrane as described by Craggs et al [81]
.
Chapter two Experimental part
36
A 0.040 g of electro-active precipitates was mixed with 0.360 g of
plasticizer and 0.17 g of PVC powder; all were dissolved in 5 mL of THF with
stirring until a clear viscous solution was obtained.
2-8- Assembling the ion-selective electrode:-
The above solution poured into a glass casting ring about 30mm length and
35mm in diameter. It consists of two pieces; one of them is the glass cylinder
and the other is glass plate. The two pieces was pasted together by using (PVC-
THF) viscous mixture (to make sure no loss in the membrane mixture) Figure 2-
1. The top side of the cylinder was covered with a pad of filter paper on which a
heavy weight was placed. The assembly was left for 2-3 days to allow graduate
evaporation of the solvent.
The glass ring with adhering membrane was carefully removed from the
glass plates as shown in Figure 2-1 (3rd
step). The membrane was then detached
away from the edge of the ring. A disc of the membrane was cut equal to the
external diameter of a PVC tube; step (4).One of sides of PVC tubing was
flatted and smoothed by placing it on glass plate moisture with THF with aid of
vertical rotation.
The disc then mounted with a forceps on the polished end, the outer edge
of the disc membrane was carefully sealed to the end of the PVC tube, step (7).
Next step is connection into a glass tube, step (8).
The other side of the glass tube was assembled with plastic cover in which
Ag/AgCl wire was inserted through it, the tube was filled 3/4 with 1×10⁻³
M
clarithromycin solution before fixing the cover, step (9). The electrode was then
conditioned by placing it in 1×10⁻³
M solution containing the CLM to be
measured (at least 2 hour's) before using.
Chapter two Experimental part
37
Figure 2-1:- Assembling the ion selective electrode.
0.04 gm (ion-pair) CLM+(TPB) or (TIM) + 0.36
plasticizers + 0.17 gm PVC + 5 mL (THF).
Cla
rith
rom
yci
n s
elec
tive
elec
trod
e
Chapter two Experimental part
38
2-9- Potential measurement:-
The potentiometric cell was arranged by immersing the electrode and
reference electrode in 50 mL containing certain amount of analyte solutions 25
mL. The cell was equipped with a magnetic stirrer. The potential measurements
were carried out at room temperature. A calibration curve was constructed for
each electrode using standard analyte solutions ranged from (10-3
-10-8
M). The
calibration curves were prepared by plotting the potential (E) versus log
concentration by using computer program (Microsoft office Excel 2010). From
the calibration curve, the characterization parameters of an ISE were obtained,
including; concentration range; slope and detection limit.
The lifetime of each membrane was calculated, when the positive or
negative drift in the slope values, indicating that the electrode is approaching the
lifetime.
2-10- pH effect:-
The effect of pH on the response of membrane was examined by
measuring the potential of the standard solutions of CLM at concentrations
(1×10⁻³
, 5×10⁻⁴
, 1×10⁻⁴
M) at different pH ranged from 1 to 12 were obtained
by addition of small volumes of hydrochloric acid and/or sodium hydroxide
solutions.
2-11- Selectivity measurements [49-51]
:-
The selectivity coefficients of the ion-selective electrodes for: some
inorganic ions (Na+, K
+, Mn
2+, Cu
2+, Fe
3+, Al
3+), sucrose and gelatins, were
determined by:-
Chapter two Experimental part
39
2-11-1- The separate solution methods [52]
:-
In this method, a 25 mL of 1x10⁻³
M solution of the prepared analyte (A)
(clarithromycin) and 25 mL of 1x10⁻³
M from each other interfering ion (B)
(Na+, K
+, Mn
2+, Cu
2+, Fe
3+, Al
3+, sucrose and gelatins).
The potential of each solution is measured separately. The selectivity
coefficient was calculated from the equation 1-7.
2-11-2- Mixed solution methods [fixed interference method (FIM)]
[54,55]:-
In this method, a 10 mL of analyte (A) solution (clarithromycin) from each
(1×10⁻⁸
to 1×10⁻³
M) are mixed with 10 mL from (1×10⁻³
M) interfering ion (B)
in 50 mL beaker. The potential were measured for each solution. The activities
of analyte (A) are found after mixing as shown in Figure 1-5. The selectivity
coefficient (Kpot
A,B) are calculated according to equation 1-9. The activities of
interfering ion (aB) are calculated after dilution:-
aB = (1×10-3
M× 10 mL)/ 20 mL = 5×10⁻⁴
M.
2-12- Sample analyses [3]
:-
2-12-1- Direct method [63]
:-
The potentiometry of sample is measured directly using clarithromycin
indicator electrodes. The concentration was then calculated using calibration
curve of standard clarithromycin.
2-12-2- Standard additions method (SAM) [63,49]
:-
In this method, the sample of 20 mL with concentration of 1×10⁻⁴
M is
introduced followed by addition of 0.5 mL of 1×10⁻³
M increment of
clarithromycin solution. The potential were measured before and after addition.
The concentration of the sample is calculated using equation 1-15 for a single
point increment.
Chapter two Experimental part
40
2-12-3- Multiple standard additions method [49,64]
:-
This method is an extension of standard additions method, the sample of
20 mL of 1×10⁻⁴
M is introduced followed by addition of 0.5 mL of 1×10⁻³
M
of clarithromycin solution. The potential is recorded before and after each
addition. The multi additions method was plotted between antilog (E/S) and the
added volume of standard solution.
2-12-4- Potentiometric titration method [65]
:-
A precipitation titration was performed for the clarithromycin sample
under study. In this method, a 15 mL sample solution containing clarithromycin
1×10⁻⁴
M was titrated against 1×10⁻⁴
M Sodium tetraphenylborate (NaTPB)
solution. Potential was measured after each addition using the prepared
electrode.
A direct plot of potential as a function of titrant volume, the midpoint in
the steeply rising portion of the curve is estimated visually and taken as end
point. A second approach to end point detection is to calculate the change in
potential per unit volume of titrant ∆E/∆V plotted versus the average volume of
titrant, the maximum is the end point.
2-13- Preparation of pharmaceutical formulation:-
All contents of 10 tablets of clarithromycin (500 mg) powdered and
weighted accurately to be found 5.8692 g, then 0.0878 g of this powder
dissolved in 250 mL acetonitrile and then filtered and completing the solution
up to 1 L with distilled water, the resultant solution is 1×10⁻⁴
M.

Chapter three Results and Discussion
41
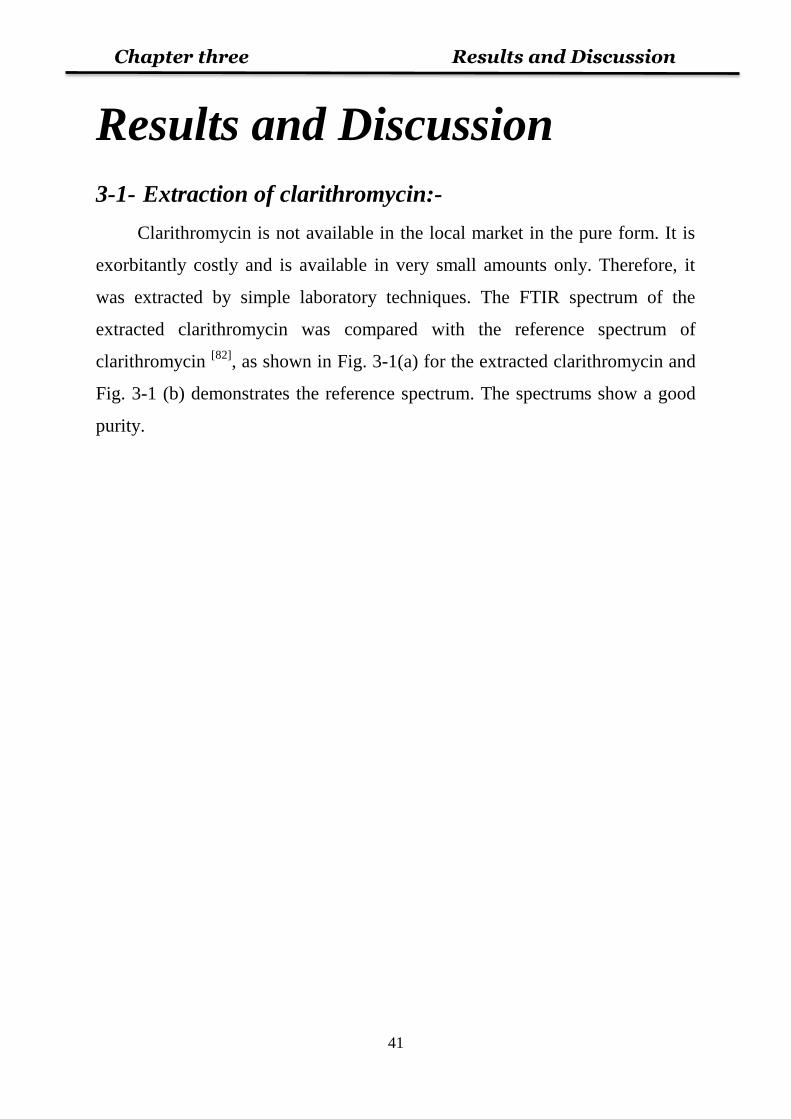
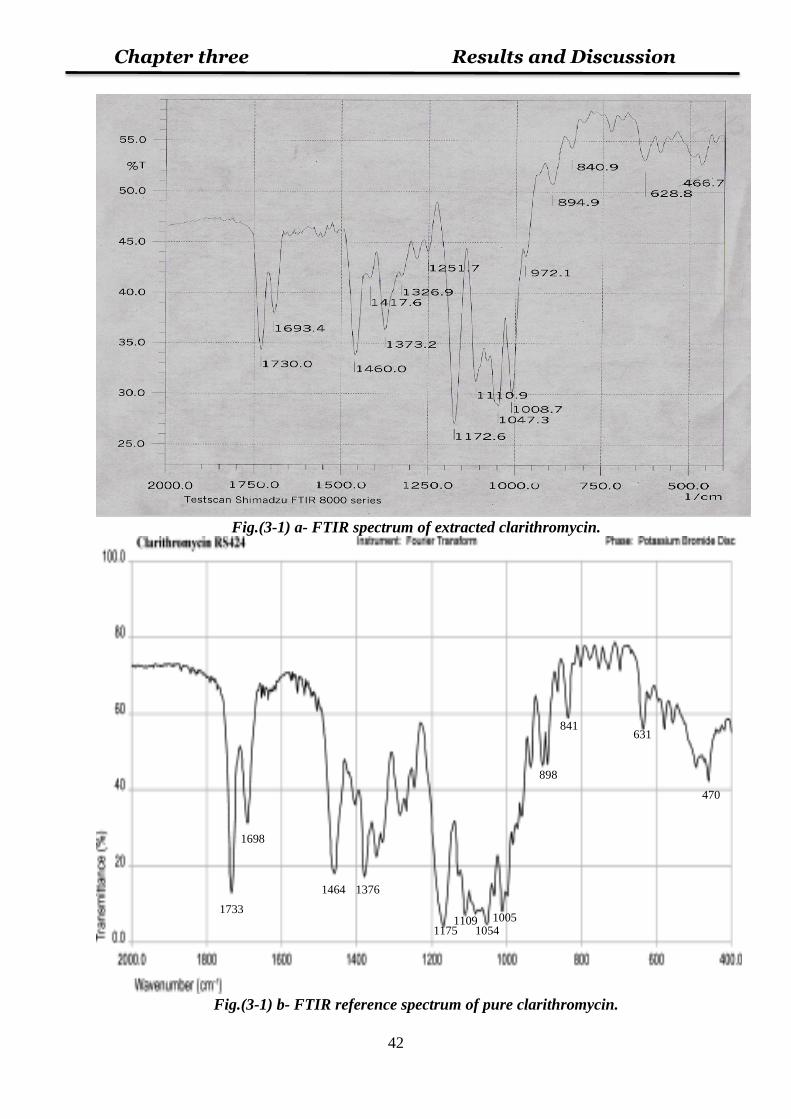
Results and Discussion
3-1- Extraction of clarithromycin:- Clarithromycin is not available in the local market in the pure form. It is
exorbitantly costly and is available in very small amounts only. Therefore, it
was extracted by simple laboratory techniques. The FTIR spectrum of the
extracted clarithromycin was compared with the reference spectrum of
clarithromycin [82]
, as shown in Fig. 3-1(a) for the extracted clarithromycin and
Fig. 3-1 (b) demonstrates the reference spectrum. The spectrums show a good
purity.
Chapter three Results and Discussion
42
Fig.(3-1) a- FTIR spectrum of extracted clarithromycin.
Fig.(3-1) b- FTIR reference spectrum of pure clarithromycin.
1698
1376
1175 1054
1733
1464
1005 1109
631
898
470
841
Chapter three Results and Discussion
43
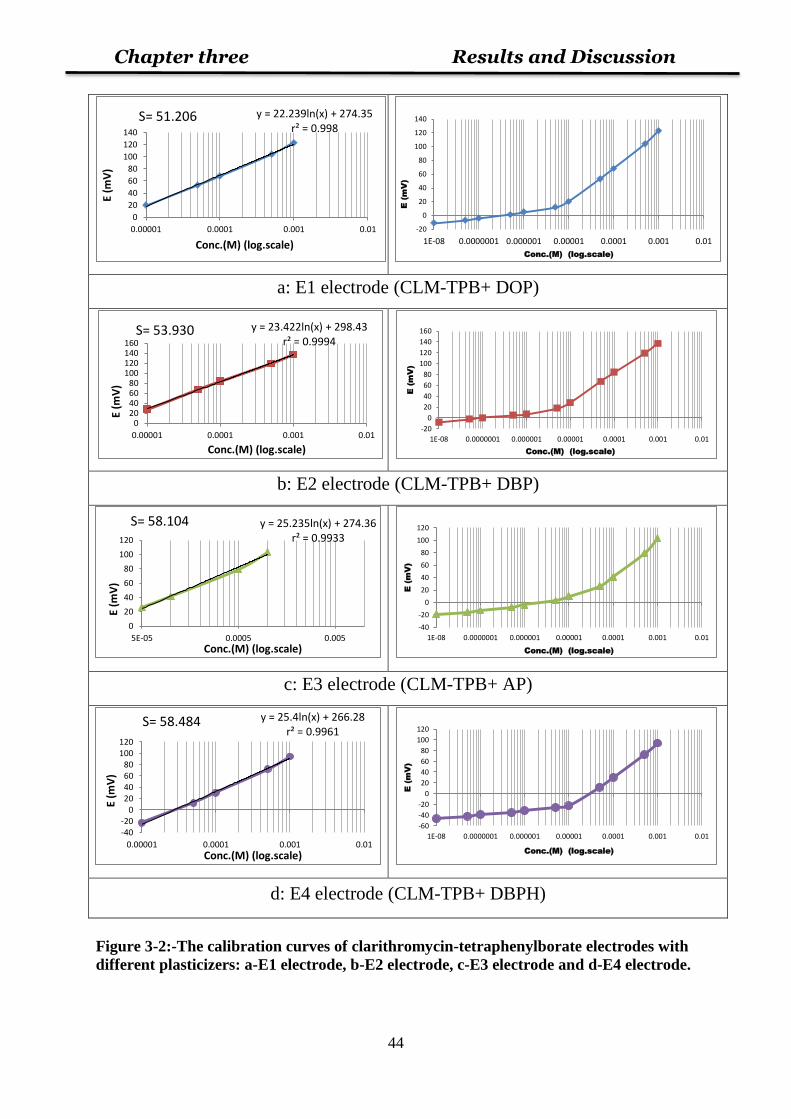
3-2- Sensor Characteristics:-
Eight electrodes of clarithromycin were prepared four of them based on
clarithromycin-tetraphenylborate (CLM-TPB) as the electro-active material and
the other four electrodes based on clarithromycin-tetraiodomercurate (CLM-
TIM) as the electro-active material. These ion-pair complexes were examined
with four plasticizers such as: Di-octyl phthalate (DOP); Di-butyl phosphate
(DBP); Acetophenone (AP); Di-butyl phthalate (DBPH) in PVC matrix.
The effects of different plasticizers were studied with respect to the linear
concentration range, slope, detection limit, response time and lifetime.
The potential values of these electrodes were plotted versus the logarithm
of concentration of drug. All membranes were soaked in 1×10⁻³
M of
clarithromycin solution for one hour for condition by the membrane.
Clarithromycin-tetraphenylborate electrodes (E1, E2, E3 and E4) using
these plasticizers (DOP, DBP, AP and DBPH) respectively, which their
calibration curves shown in Fig. 3-2(a, b, c, d) respectively. These electrodes
gave the slopes of (51.206, 53.930, 58.104 and 58.484) mV/decade respectively.
The linear range for these electrodes (1×10⁻⁵
-1×10⁻³
, 1×10⁻⁵
-1×10⁻³
, 5×10⁻⁵
-
1×10⁻³
and 1×10⁻⁵
-1×10⁻³
M) with detection limits of (8×10⁻⁶
, 6×10⁻⁶
, 2×10⁻⁵
and
9×10⁻⁶
M) respectively.
The other electrodes are for Clarithromycin-tetraiodomercurate ion-pair.
These electrodes are (E5, E6, E7 and E8) using the plasticizers (DOP, DBP, AP
and DBPH) respectively, which their calibration curves shown in Fig. 3-3(a, b,
c, d) respectively. These electrodes gave the slopes of (48.445, 42,970, 52.692
and 49.442) mV/decade respectively. The linear range for these electrodes
(1×10⁻⁵
-1×10⁻³
, 5×10⁻⁵
-1×10⁻³
, 5×10⁻⁵
-1×10⁻³
and 1×10⁻⁵
-1×10⁻³
M), with
detection limits of (5×10⁻⁶
, 5.5×10⁻⁵
, 5×10⁻⁵
and 1.5×10⁻⁵
M) respectively. The
results of all electrodes were summarized in Table 3-1.
Chapter three Results and Discussion
44
a: E1 electrode (CLM-TPB+ DOP)
b: E2 electrode (CLM-TPB+ DBP)
c: E3 electrode (CLM-TPB+ AP)
d: E4 electrode (CLM-TPB+ DBPH)
Figure 3-2:-The calibration curves of clarithromycin-tetraphenylborate electrodes with
different plasticizers: a-E1 electrode, b-E2 electrode, c-E3 electrode and d-E4 electrode.
y = 22.239ln(x) + 274.35 r² = 0.998
0
20
40
60
80
100
120
140
0.00001 0.0001 0.001 0.01
E (m
V)
Conc.(M) (log.scale)
S= 51.206
-20
0
20
40
60
80
100
120
140
1E-08 0.0000001 0.000001 0.00001 0.0001 0.001 0.01
E (m
V)
Conc.(M) (log.scale)
y = 23.422ln(x) + 298.43 r² = 0.9994
020406080
100120140160
0.00001 0.0001 0.001 0.01
E (m
V)
Conc.(M) (log.scale)
S= 53.930
-20
0
20
40
60
80
100
120
140
160
1E-08 0.0000001 0.000001 0.00001 0.0001 0.001 0.01
E (m
V)
Conc.(M) (log.scale)
y = 25.235ln(x) + 274.36 r² = 0.9933
0
20
40
60
80
100
120
5E-05 0.0005 0.005
E (m
V)
Conc.(M) (log.scale)
S= 58.104
-40
-20
0
20
40
60
80
100
120
1E-08 0.0000001 0.000001 0.00001 0.0001 0.001 0.01
E (m
V)
Conc.(M) (log.scale)
y = 25.4ln(x) + 266.28 r² = 0.9961
-40-20
020406080
100120
0.00001 0.0001 0.001 0.01
E (m
V)
Conc.(M) (log.scale)
S= 58.484
-60
-40
-20
0
20
40
60
80
100
120
1E-08 0.0000001 0.000001 0.00001 0.0001 0.001 0.01
E (m
V)
Conc.(M) (log.scale)
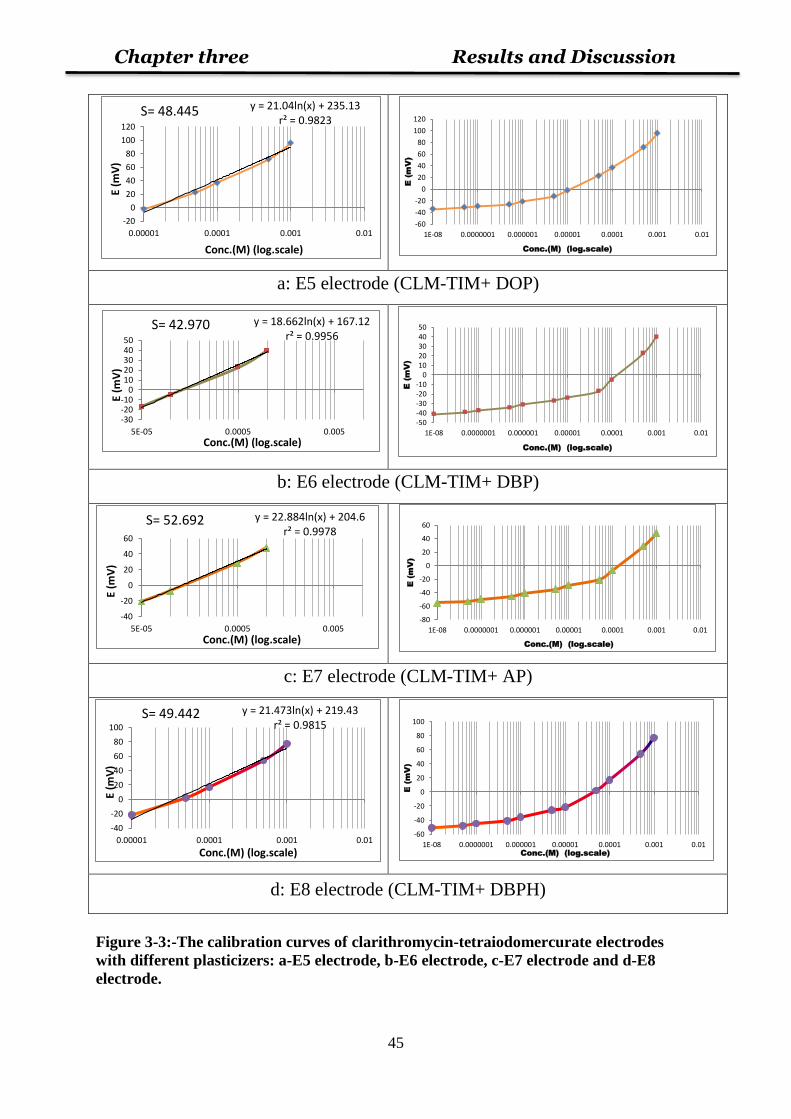
Chapter three Results and Discussion
45
a: E5 electrode (CLM-TIM+ DOP)
b: E6 electrode (CLM-TIM+ DBP)
c: E7 electrode (CLM-TIM+ AP)
d: E8 electrode (CLM-TIM+ DBPH)
Figure 3-3:-The calibration curves of clarithromycin-tetraiodomercurate electrodes
with different plasticizers: a-E5 electrode, b-E6 electrode, c-E7 electrode and d-E8
electrode.
y = 21.04ln(x) + 235.13 r² = 0.9823
-20
0
20
40
60
80
100
120
0.00001 0.0001 0.001 0.01
E (m
V)
Conc.(M) (log.scale)
S= 48.445
-60
-40
-20
0
20
40
60
80
100
120
1E-08 0.0000001 0.000001 0.00001 0.0001 0.001 0.01
E (m
V)
Conc.(M) (log.scale)
y = 18.662ln(x) + 167.12 r² = 0.9956
-30-20-10
01020304050
5E-05 0.0005 0.005
E (m
V)
Conc.(M) (log.scale)
S= 42.970
-50-40-30-20-10
01020304050
1E-08 0.0000001 0.000001 0.00001 0.0001 0.001 0.01
E (m
V)
Conc.(M) (log.scale)
y = 22.884ln(x) + 204.6 r² = 0.9978
-40
-20
0
20
40
60
5E-05 0.0005 0.005
E (m
V)
Conc.(M) (log.scale)
S= 52.692
-80
-60
-40
-20
0
20
40
60
1E-08 0.0000001 0.000001 0.00001 0.0001 0.001 0.01
E (m
V)
Conc.(M) (log.scale)
y = 21.473ln(x) + 219.43 r² = 0.9815
-40
-20
0
20
40
60
80
100
0.00001 0.0001 0.001 0.01
E (m
V)
Conc.(M) (log.scale)
S= 49.442
-60
-40
-20
0
20
40
60
80
100
1E-08 0.0000001 0.000001 0.00001 0.0001 0.001 0.01
E (m
V)
Conc.(M) (log.scale)
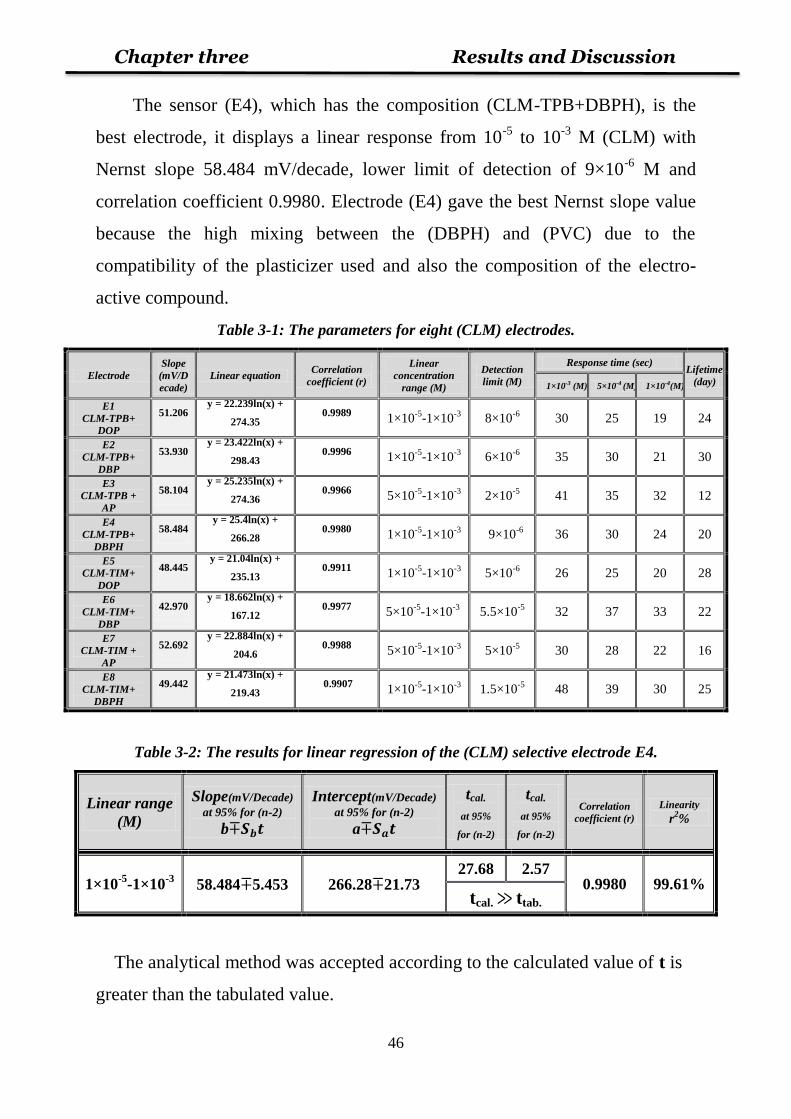
Chapter three Results and Discussion
46
The sensor (E4), which has the composition (CLM-TPB+DBPH), is the
best electrode, it displays a linear response from 10-5
to 10-3
M (CLM) with
Nernst slope 58.484 mV/decade, lower limit of detection of 9×10⁻⁶
M and
correlation coefficient 0.9980. Electrode (E4) gave the best Nernst slope value
because the high mixing between the (DBPH) and (PVC) due to the
compatibility of the plasticizer used and also the composition of the electro-
active compound.
Table 3-1: The parameters for eight (CLM) electrodes.
Electrode
Slope
(mV/D
ecade)
Linear equation Correlation
coefficient (r)
Linear
concentration
range (M)
Detection
limit (M)
Response time (sec) Lifetime
(day) 1×10⁻³ (M) 5×10⁻⁴ (M) 1×10⁻⁴(M)
E1
CLM-TPB+
DOP
51.206 y = 22.239ln(x) +
274.35 0.9989
1×10⁻⁵
-1×10⁻³
8×10⁻⁶
30 25 19 24
E2
CLM-TPB+
DBP
53.930 y = 23.422ln(x) +
298.43 0.9996
1×10⁻⁵
-1×10⁻³
6×10⁻⁶
35 30 21 30
E3
CLM-TPB +
AP
58.104 y = 25.235ln(x) +
274.36 0.9966
5×10⁻⁵
-1×10⁻³
2×10⁻⁵
41 35 32 12
E4
CLM-TPB+
DBPH
58.484 y = 25.4ln(x) +
266.28 0.9980
1×10⁻⁵
-1×10⁻³
9×10⁻⁶
36 30 24 20
E5
CLM-TIM+
DOP
48.445 y = 21.04ln(x) +
235.13 0.9911
1×10⁻⁵
-1×10⁻³
5×10⁻⁶
26 25 20 28
E6
CLM-TIM+
DBP
42.970 y = 18.662ln(x) +
167.12 0.9977
5×10⁻⁵
-1×10⁻³
5.5×10⁻⁵
32 37 33 22
E7
CLM-TIM +
AP
52.692 y = 22.884ln(x) +
204.6 0.9988
5×10⁻⁵
-1×10⁻³
5×10⁻⁵
30 28 22 16
E8
CLM-TIM+
DBPH
49.442 y = 21.473ln(x) +
219.43 0.9907
1×10⁻⁵
-1×10⁻³
1.5×10⁻⁵
48 39 30 25
Table 3-2: The results for linear regression of the (CLM) selective electrode E4.
Linear range
(M)
Slope(mV/Decade)
at 95% for (n-2)
b
Intercept(mV/Decade)
at 95% for (n-2)
a
tcal.
at 95%
for (n-2)
tcal.
at 95%
for (n-2)
Correlation
coefficient (r) Linearity
r2%
1×10⁻⁵
-1×10⁻³
58.484 5.453
266.28 21.73 27.68 2.57
0.9980 99.61% tcal. ttab.
The analytical method was accepted according to the calculated value of t is
greater than the tabulated value.
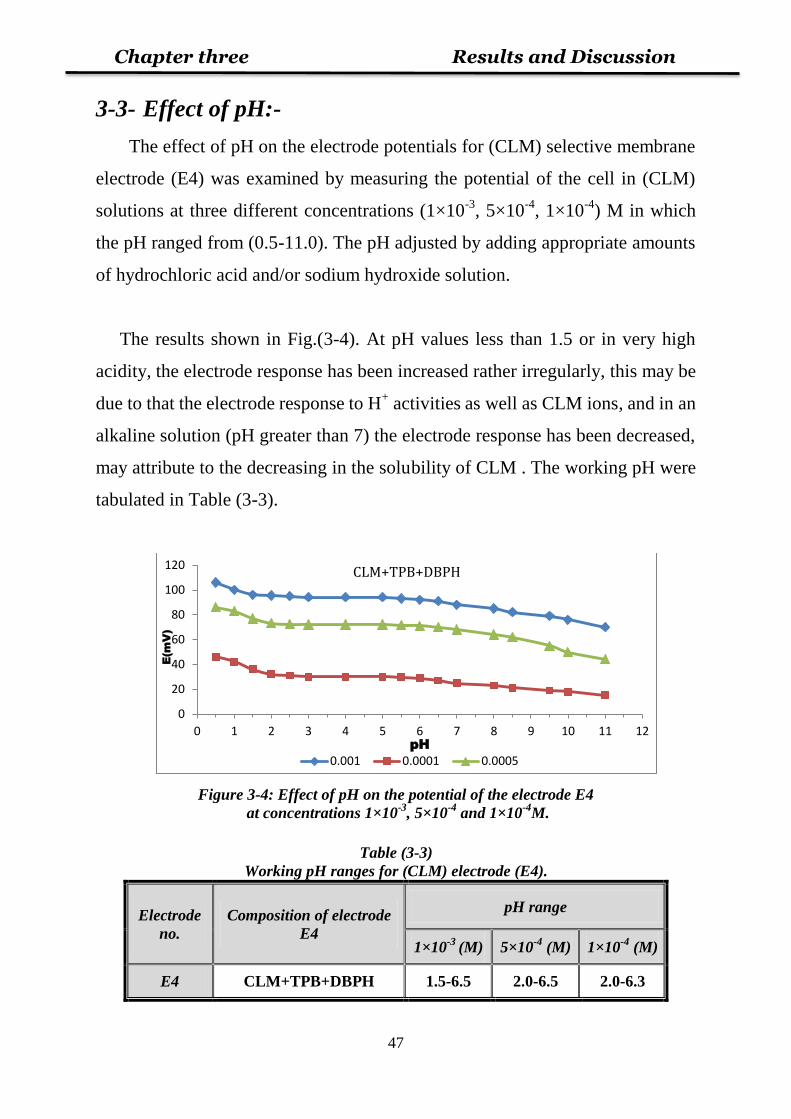
Chapter three Results and Discussion
47
3-3- Effect of pH:-
The effect of pH on the electrode potentials for (CLM) selective membrane
electrode (E4) was examined by measuring the potential of the cell in (CLM)
solutions at three different concentrations (1×10⁻³
, 5×10⁻⁴
, 1×10⁻⁴
) M in which
the pH ranged from (0.5-11.0). The pH adjusted by adding appropriate amounts
of hydrochloric acid and/or sodium hydroxide solution.
The results shown in Fig.(3-4). At pH values less than 1.5 or in very high
acidity, the electrode response has been increased rather irregularly, this may be
due to that the electrode response to H+ activities as well as CLM ions, and in an
alkaline solution (pH greater than 7) the electrode response has been decreased,
may attribute to the decreasing in the solubility of CLM . The working pH were
tabulated in Table (3-3).
Figure 3-4: Effect of pH on the potential of the electrode E4
at concentrations 1×10⁻³
, 5×10⁻⁴
and 1×10⁻⁴
M.
Table (3-3)
Working pH ranges for (CLM) electrode (E4).
Electrode
no.
Composition of electrode
E4
pH range
1×10⁻³
(M) 5×10⁻⁴
(M) 1×10⁻⁴
(M)
E4 CLM+TPB+DBPH 1.5-6.5 2.0-6.5 2.0-6.3
0
20
40
60
80
100
120
0 1 2 3 4 5 6 7 8 9 10 11 12
E(m
V)
pH
CLM+TPB+DBPH
0.001 0.0001 0.0005
Chapter three Results and Discussion
48
3-4- Effect of temperature:-
The effect of temperature on the electrode potentials for (CLM)
selective membrane electrode (E4) was studied by adjusting different
temperatures. The best temperature for the working of electrode (E4) was
at room temperature.
3-5- Interference studies:-
In order to investigate the selectivity of the proposed membrane (E4) ion
selective electrode toward clarithromycin with respect to various interfering
ions two methods of selectivity are used:-
3-5-1- Separate solution methods:-
In this case (aA= aB =10-3
M) The potential is measured with two separate
solutions, one containing the clarithromycin at the concentration 1×10⁻³
M and
the other one containing the interfering ion at the same concentration. The
value of Kpot
A,B is calculated by using the equation 1-7, by measurement the
values of EA and EB. When EA= 94 mV and the slope is 58.484 mV/decade.
The results of selectivity coefficients are summarized in Table 3-4.
Chapter three Results and Discussion
49
Table 3-4:
Values of Kpot
A,B according to separate method by using electrode E4.
Interfering
ions
EB (mV)
When
aB =10-3
log Kpot
A,B Kpot
A,B
k+ 10 -1.43629 3.66×10
-2
Na+
14 -1.3679 4.28×10⁻²
Fe+3
7 -3.48759 3.25×10⁻⁴
Al+3
5 -3.52178 3.01×10⁻⁴
Cu+2
11 -2.91919 1.20×10⁻³
Mn+2
9 -2.95339 1.11×10⁻³
Sucrose 6 -1.50469 3.12×10⁻²
Gelatin 7 -1.48759 3.25×10⁻²
From the Table 3-3, all values of Kpot
A,B are less than (0.1), This reflects a
very high selectivity of this electrodes towards clarithromycin.
3-5-2- Mixed solution methods (FIM):-
The potential of cell is measured for the solutions at constant
concentration of the interfering ion (aB) at first used 1×10⁻³
M that
calculated in 20 mL total volume after mixed it with varying concentration
of the clarithromycin (aA). The potential values obtained are plotted vs. the
logarithm of the concentration of the clarithromycin.
From Fig. 3-5 to Fig. 3-12 the intersection of the extrapolated linear
portions of this plot determine the value of (aA), which can be used to
calculate Kpot
A,B using equation 1-9, all results of Kpot
A,B were listed in
Table 3-5.
Chapter three Results and Discussion
50
Figure 3-5: FIM calibration curve for E4 electrode, K+1
(5×10⁻⁴
M)
as interfering ion aA= 5.5×10⁻⁶
M.
Figure 3-6: FIM calibration curve for E4 electrode, Na+1
(5×10⁻⁴
M)
as interfering ion aA= 8×10⁻⁶
M.
Figure 3-7: FIM calibration curve for E4 electrode, Fe+3
(5×10⁻⁴
M)
as interfering ion aA= 8×10⁻⁶
M.
-60
-40
-20
0
20
40
60
80
100
1E-08 0.0000001 0.000001 0.00001 0.0001 0.001 0.01
E (m
V)
Conc.(M) (log.scale)
(0.0005 M) K+
-60
-40
-20
0
20
40
60
80
100
1E-08 0.0000001 0.000001 0.00001 0.0001 0.001 0.01
E (m
V)
Conc.(M) (log.scale)
(0.0005 M) Na+
-40
-20
0
20
40
60
80
100
1E-08 0.0000001 0.000001 0.00001 0.0001 0.001 0.01
E (m
V)
Conc.(M) (log.scale)
(0.0005 M) Fe+++
Chapter three Results and Discussion
51
Figure 3-8: FIM calibration curve for E4 electrode, Al+3
(5×10⁻⁴
M)
as interfering ion aA= 7×10⁻⁶
M.
Figure 3-9: FIM calibration curve for E4 electrode, Cu+2
(5×10⁻⁴
M)
as interfering ion aA= 9×10⁻⁶
M.
Figure 3-10: FIM calibration curve for E4 electrode, Mn+2
(5×10⁻⁴
M)
as interfering ion aA= 7×10⁻⁶
M.
-40
-20
0
20
40
60
80
100
1E-08 0.0000001 0.000001 0.00001 0.0001 0.001 0.01
E (m
V)
Conc.(M) (log.scale)
(0.0005 M) Al+++
-60
-40
-20
0
20
40
60
80
100
1E-08 0.0000001 0.000001 0.00001 0.0001 0.001 0.01
E (m
V)
Conc.(M) (log.scale)
(0.0005 M) Cu++
-60
-40
-20
0
20
40
60
80
100
1E-08 0.0000001 0.000001 0.00001 0.0001 0.001 0.01
E (m
V)
Conc.(M) (log.scale)
(0.0005 M) Mn++
Chapter three Results and Discussion
52
Figure 3-11: FIM calibration curve for E4 electrode, Sucrose (5×10⁻⁴
M)
as interfering ion aA= 6.5×10⁻⁶
M.
Figure 3-12: FIM calibration curve for E4 electrode, Gelatin (5×10⁻⁴
M)
as interfering ion aA= 8.5×10⁻⁶
M.
-40
-20
0
20
40
60
80
100
1E-08 0.0000001 0.000001 0.00001 0.0001 0.001 0.01
E (m
V)
Conc.(M) (log.scale)
(0.0005 M) Sucrose
-40
-20
0
20
40
60
80
100
1E-08 0.0000001 0.000001 0.00001 0.0001 0.001 0.01
E (m
V)
Conc.(M) (log.scale)
(0.0005 M) Gelatin
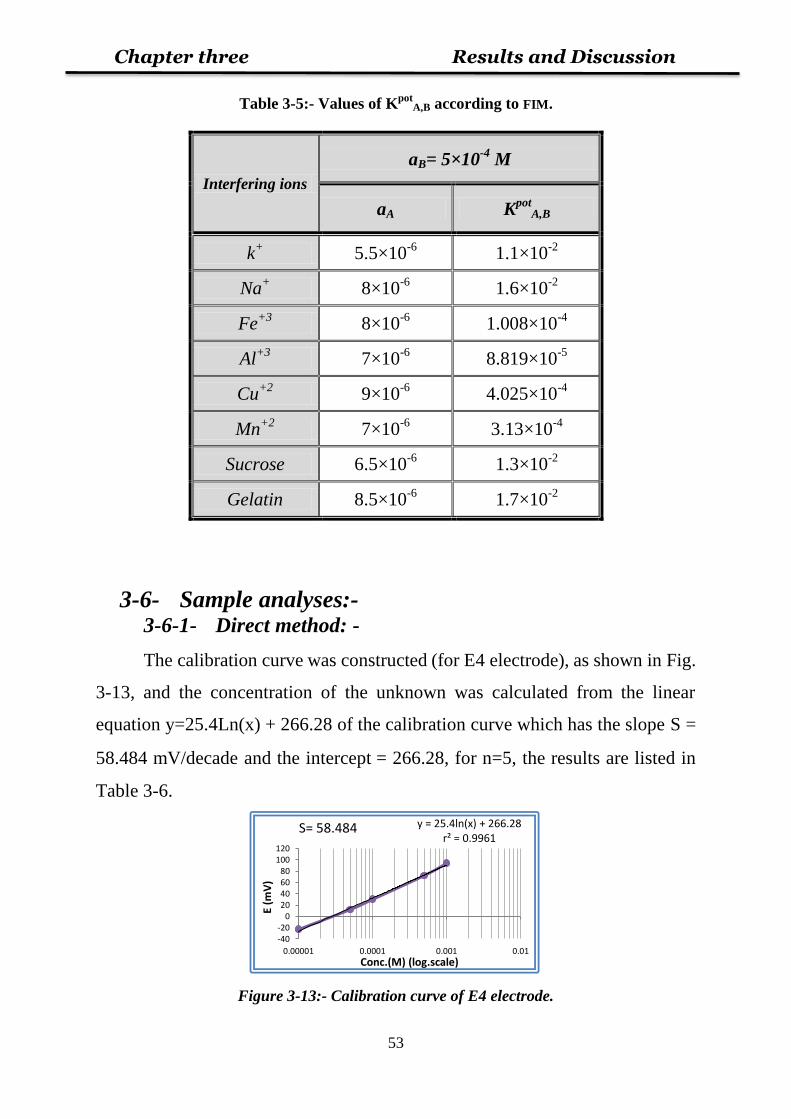
Chapter three Results and Discussion
53
Table 3-5:- Values of Kpot
A,B according to FIM.
Interfering ions
aB= 5×10⁻⁴
M
aA Kpot
A,B
k+ 5.5×10
-6 1.1×10
-2
Na+
8×10⁻⁶
1.6×10⁻²
Fe+3
8×10⁻⁶
1.008×10⁻⁴
Al+3
7×10⁻⁶
8.819×10⁻⁵
Cu+2
9×10⁻⁶
4.025×10⁻⁴
Mn+2
7×10⁻⁶
3.13×10⁻⁴
Sucrose 6.5×10⁻⁶
1.3×10⁻²
Gelatin 8.5×10⁻⁶
1.7×10⁻²
3-6- Sample analyses:-
3-6-1- Direct method: -
The calibration curve was constructed (for E4 electrode), as shown in Fig.
3-13, and the concentration of the unknown was calculated from the linear
equation y=25.4Ln(x) + 266.28 of the calibration curve which has the slope S =
58.484 mV/decade and the intercept= 266.28, for n=5, the results are listed in
Table 3-6.
Figure 3-13:- Calibration curve of E4 electrode.
y = 25.4ln(x) + 266.28 r² = 0.9961
-40-20
020406080
100120
0.00001 0.0001 0.001 0.01
E (m
V)
Conc.(M) (log.scale)
S= 58.484
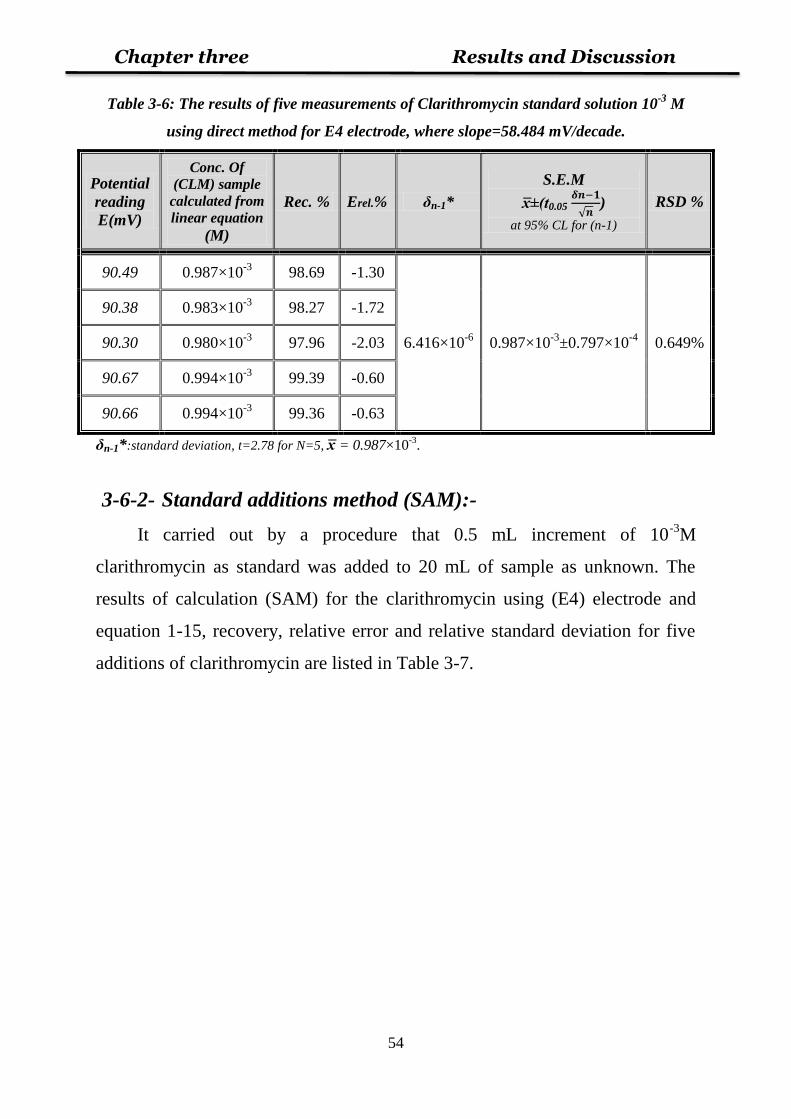
Chapter three Results and Discussion
54
Table 3-6: The results of five measurements of Clarithromycin standard solution 10-3
M
using direct method for E4 electrode, where slope=58.484 mV/decade.
Potential
reading
E(mV)
Conc. Of
(CLM) sample
calculated from
linear equation
(M)
Rec. % Erel.% δn-1*
S.E.M
0.05
√ )
at 95% CL for (n-1)
RSD %
90.49 0.987×10⁻³
98.69 -1.30
6.416×10⁻⁶
0.987×10⁻³
±0.797×10⁻⁴
0.649%
90.38 0.983×10⁻³
98.27 -1.72
90.30 0.980×10⁻³
97.96 -2.03
90.67 0.994×10⁻³
99.39 -0.60
90.66 0.994×10⁻³
99.36 -0.63
δn-1*:standard deviation, t=2.78 for N=5, = 0.987×10⁻³
.
3-6-2- Standard additions method (SAM):-
It carried out by a procedure that 0.5 mL increment of 10-3
M
clarithromycin as standard was added to 20 mL of sample as unknown. The
results of calculation (SAM) for the clarithromycin using (E4) electrode and
equation 1-15, recovery, relative error and relative standard deviation for five
additions of clarithromycin are listed in Table 3-7.
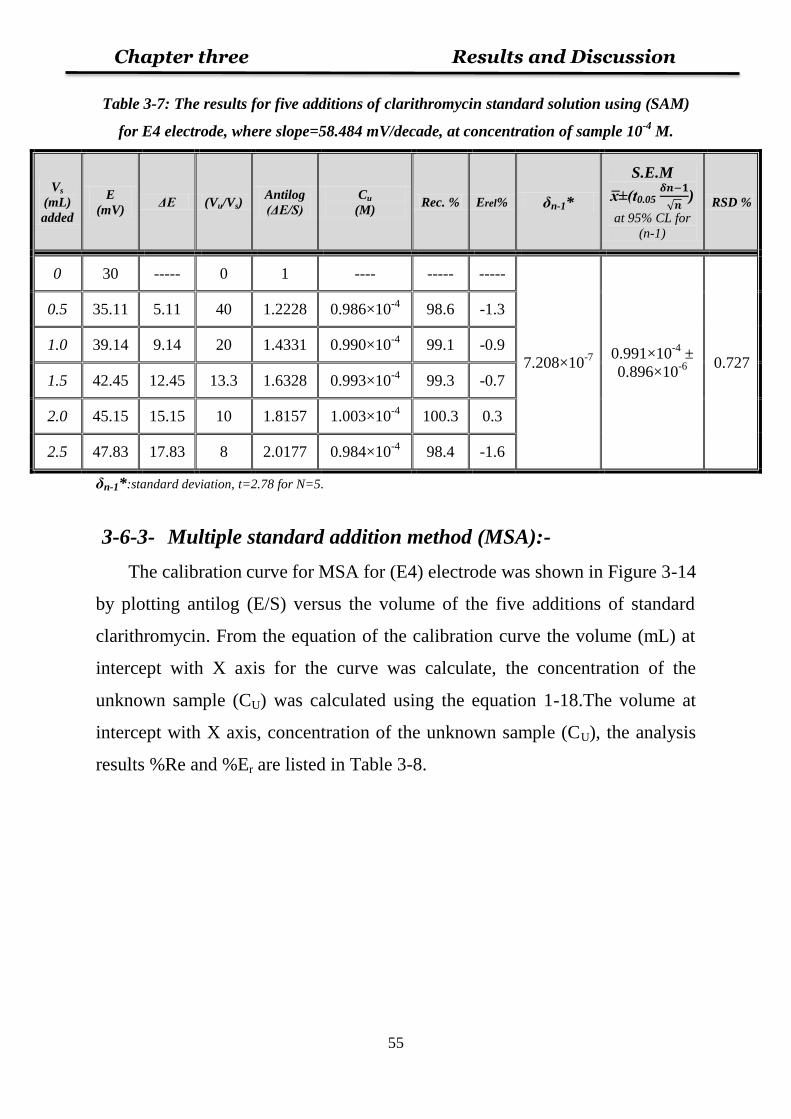
Chapter three Results and Discussion
55
Table 3-7: The results for five additions of clarithromycin standard solution using (SAM)
for E4 electrode, where slope=58.484 mV/decade, at concentration of sample 10-4
M.
Vs
(mL)
added
E
(mV) ΔE (Vu/Vs)
Antilog
ΔE/S)
Cu
(M) Rec. % Erel% δn-1*
S.E.M
0.05
√ )
at 95% CL for
(n-1)
RSD %
0 30 ----- 0 1 ---- ----- -----
7.208×10⁻⁷ 0.991×10
-4 ±
0.896×10⁻⁶ 0.727
0.5 35.11 5.11 40 1.2228 0.986×10⁻⁴
98.6 -1.3
1.0 39.14 9.14 20 1.4331 0.990×10⁻⁴
99.1 -0.9
1.5 42.45 12.45 13.3 1.6328 0.993×10⁻⁴
99.3 -0.7
2.0 45.15 15.15 10 1.8157 1.003×10⁻⁴
100.3 0.3
2.5 47.83 17.83 8 2.0177 0.984×10⁻⁴
98.4 -1.6
δn-1*:standard deviation, t=2.78 for N=5.
3-6-3- Multiple standard addition method (MSA):-
The calibration curve for MSA for (E4) electrode was shown in Figure 3-14
by plotting antilog (E/S) versus the volume of the five additions of standard
clarithromycin. From the equation of the calibration curve the volume (mL) at
intercept with X axis for the curve was calculate, the concentration of the
unknown sample (CU) was calculated using the equation 1-18.The volume at
intercept with X axis, concentration of the unknown sample (CU), the analysis
results %Re and %Er are listed in Table 3-8.
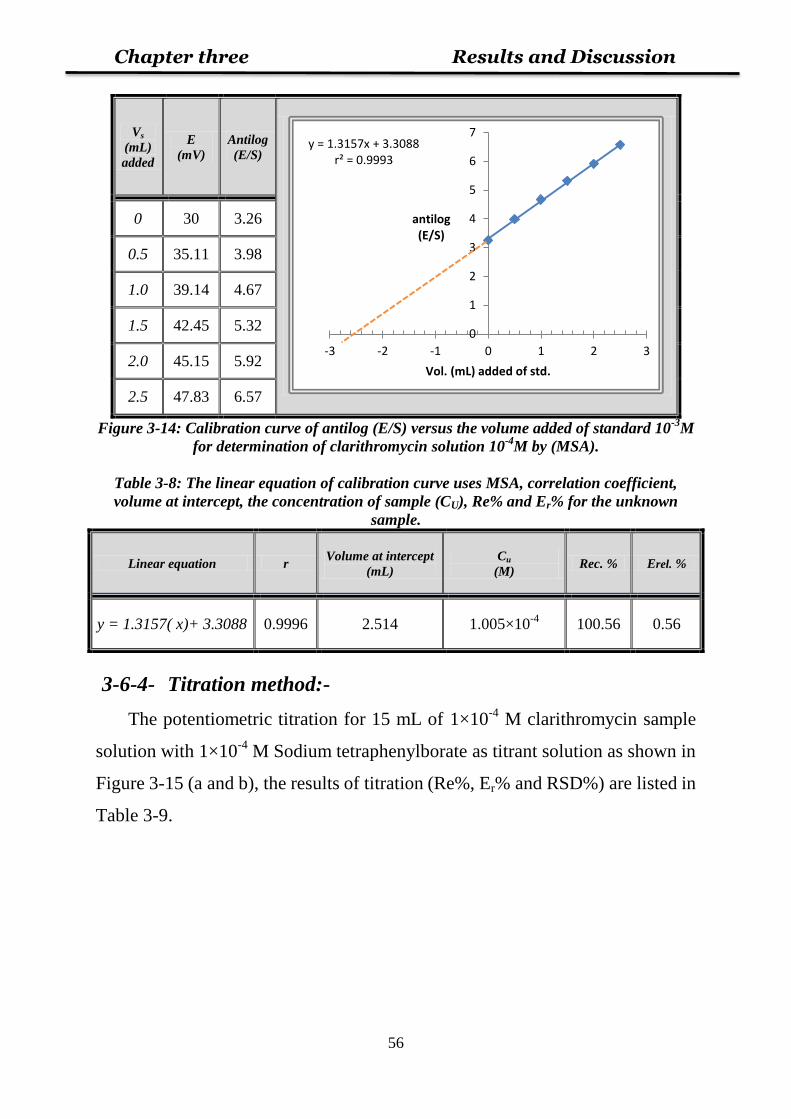
Chapter three Results and Discussion
56
Vs
(mL)
added
E
(mV)
Antilog
(E/S)
0 30 3.26
0.5 35.11 3.98
1.0 39.14 4.67
1.5 42.45 5.32
2.0 45.15 5.92
2.5 47.83 6.57
Figure 3-14: Calibration curve of antilog (E/S) versus the volume added of standard 10-3
M
for determination of clarithromycin solution 10-4
M by (MSA).
Table 3-8: The linear equation of calibration curve uses MSA, correlation coefficient,
volume at intercept, the concentration of sample (CU), Re% and Er% for the unknown
sample.
Linear equation r Volume at intercept
(mL)
Cu
(M) Rec. % Erel. %
y = 1.3157( x)+ 3.3088 0.9996 2.514 1.005×10⁻⁴
100.56 0.56
3-6-4- Titration method:-
The potentiometric titration for 15 mL of 1×10⁻⁴
M clarithromycin sample
solution with 1×10⁻⁴
M Sodium tetraphenylborate as titrant solution as shown in
Figure 3-15 (a and b), the results of titration (Re%, Er% and RSD%) are listed in
Table 3-9.
y = 1.3157x + 3.3088 r² = 0.9993
0
1
2
3
4
5
6
7
-3 -2 -1 0 1 2 3
antilog (E/S)
Vol. (mL) added of std.
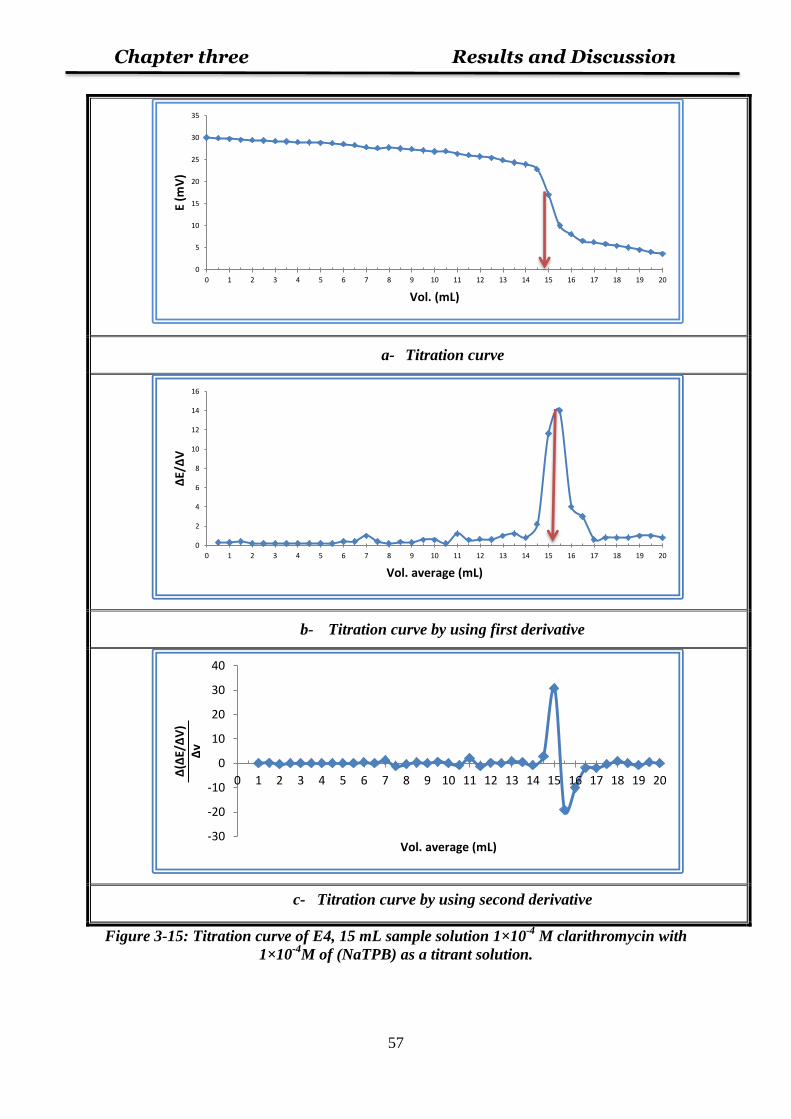
Chapter three Results and Discussion
57
a- Titration curve
b- Titration curve by using first derivative
c- Titration curve by using second derivative
Figure 3-15: Titration curve of E4, 15 mL sample solution 1×10⁻⁴
M clarithromycin with
1×10⁻⁴
M of (NaTPB) as a titrant solution.
0
5
10
15
20
25
30
35
0 1 2 3 4 5 6 7 8 9 10 11 12 13 14 15 16 17 18 19 20
E (m
V)
Vol. (mL)
0
2
4
6
8
10
12
14
16
0 1 2 3 4 5 6 7 8 9 10 11 12 13 14 15 16 17 18 19 20
ΔE/
ΔV
Vol. average (mL)
-30
-20
-10
0
10
20
30
40
0 1 2 3 4 5 6 7 8 9 10 11 12 13 14 15 16 17 18 19 20
Δ(Δ
E/Δ
V)
Δv
Vol. average (mL)
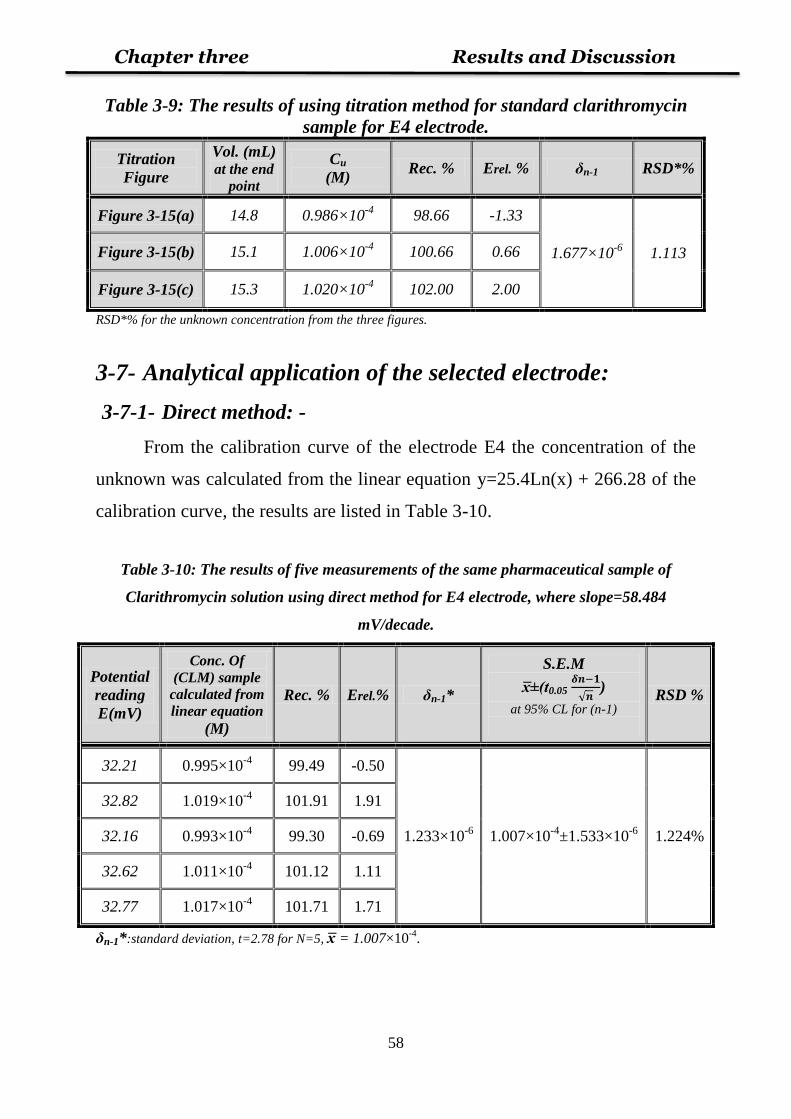
Chapter three Results and Discussion
58
Table 3-9: The results of using titration method for standard clarithromycin
sample for E4 electrode.
Titration
Figure
Vol. (mL) at the end
point
Cu
(M) Rec. % Erel. % δn-1 RSD*%
Figure 3-15(a) 14.8 0.986×10⁻⁴
98.66 -1.33
1.677×10⁻⁶
1.113 Figure 3-15(b) 15.1 1.006×10⁻⁴
100.66 0.66
Figure 3-15(c) 15.3 1.020×10⁻⁴
102.00 2.00
RSD*% for the unknown concentration from the three figures.
3-7- Analytical application of the selected electrode:
3-7-1- Direct method: -
From the calibration curve of the electrode E4 the concentration of the
unknown was calculated from the linear equation y=25.4Ln(x) + 266.28 of the
calibration curve, the results are listed in Table 3-10.
Table 3-10: The results of five measurements of the same pharmaceutical sample of
Clarithromycin solution using direct method for E4 electrode, where slope=58.484
mV/decade.
Potential
reading
E(mV)
Conc. Of
(CLM) sample
calculated from
linear equation
(M)
Rec. % Erel.% δn-1*
S.E.M
0.05
√ )
at 95% CL for (n-1)
RSD %
32.21 0.995×10⁻⁴
99.49 -0.50
1.233×10⁻⁶
1.007×10⁻⁴
±1.533×10⁻⁶
1.224%
32.82 1.019×10⁻⁴
101.91 1.91
32.16 0.993×10⁻⁴
99.30 -0.69
32.62 1.011×10⁻⁴
101.12 1.11
32.77 1.017×10⁻⁴
101.71 1.71
δn-1*:standard deviation, t=2.78 for N=5, = 1.007×10⁻⁴
.
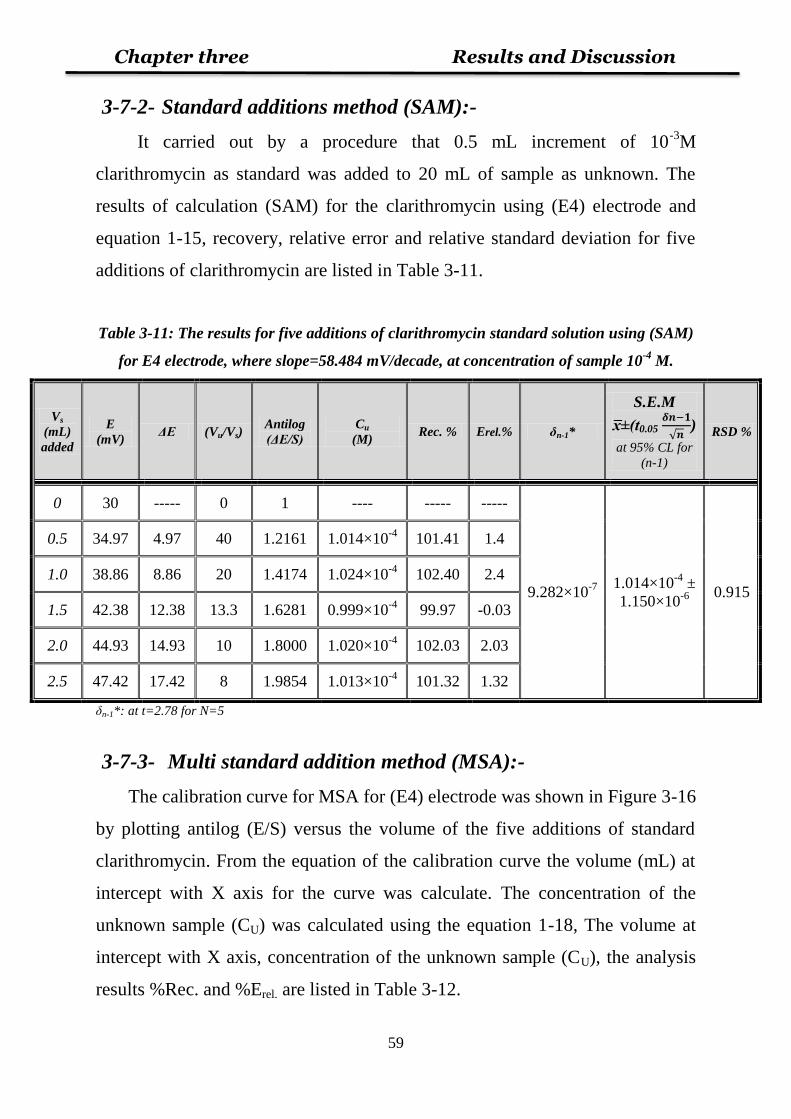
Chapter three Results and Discussion
59
3-7-2- Standard additions method (SAM):-
It carried out by a procedure that 0.5 mL increment of 10-3
M
clarithromycin as standard was added to 20 mL of sample as unknown. The
results of calculation (SAM) for the clarithromycin using (E4) electrode and
equation 1-15, recovery, relative error and relative standard deviation for five
additions of clarithromycin are listed in Table 3-11.
Table 3-11: The results for five additions of clarithromycin standard solution using (SAM)
for E4 electrode, where slope=58.484 mV/decade, at concentration of sample 10-4
M.
Vs
(mL)
added
E
(mV) ΔE (Vu/Vs)
Antilog
ΔE/S)
Cu
(M) Rec. % Erel.% δn-1*
S.E.M
0.05
√ )
at 95% CL for
(n-1)
RSD %
0 30 ----- 0 1 ---- ----- -----
9.282×10⁻⁷ 1.014×10
-4 ±
1.150×10⁻⁶ 0.915
0.5 34.97 4.97 40 1.2161 1.014×10⁻⁴
101.41 1.4
1.0 38.86 8.86 20 1.4174 1.024×10⁻⁴
102.40 2.4
1.5 42.38 12.38 13.3 1.6281 0.999×10⁻⁴
99.97 -0.03
2.0 44.93 14.93 10 1.8000 1.020×10⁻⁴
102.03 2.03
2.5 47.42 17.42 8 1.9854 1.013×10⁻⁴
101.32 1.32
δn-1*: at t=2.78 for N=5
3-7-3- Multi standard addition method (MSA):-
The calibration curve for MSA for (E4) electrode was shown in Figure 3-16
by plotting antilog (E/S) versus the volume of the five additions of standard
clarithromycin. From the equation of the calibration curve the volume (mL) at
intercept with X axis for the curve was calculate. The concentration of the
unknown sample (CU) was calculated using the equation 1-18, The volume at
intercept with X axis, concentration of the unknown sample (CU), the analysis
results %Rec. and %Erel. are listed in Table 3-12.
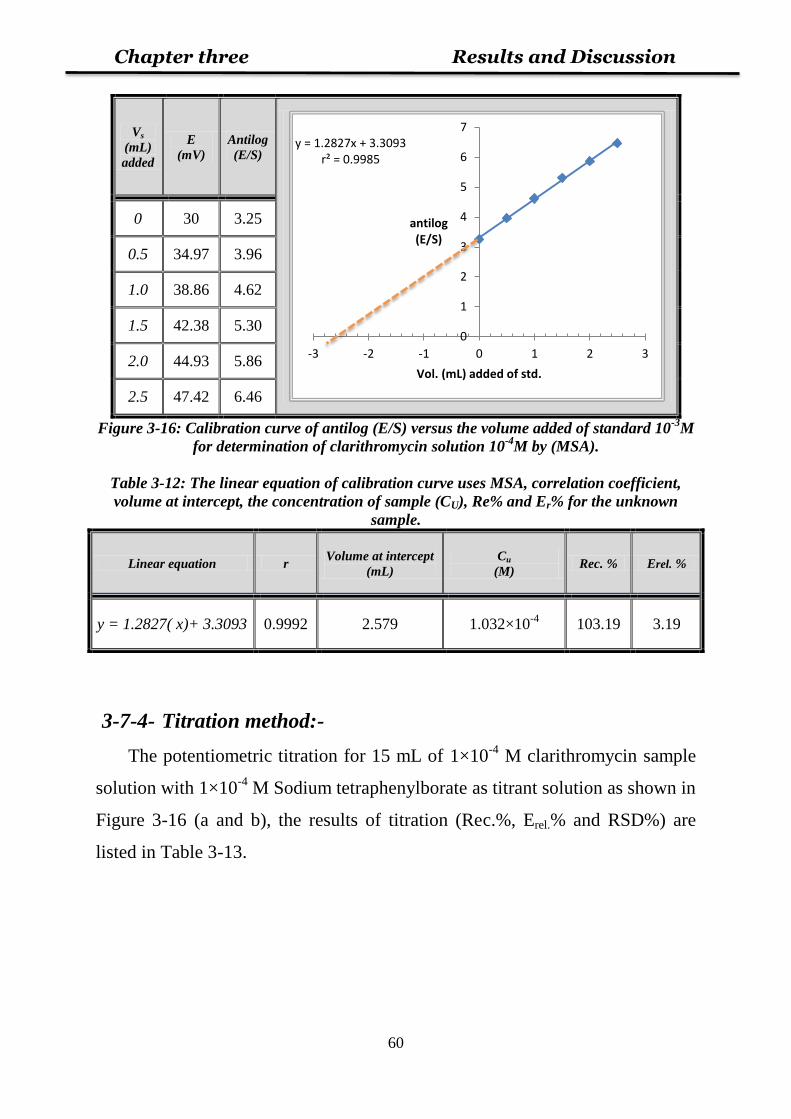
Chapter three Results and Discussion
60
Vs
(mL)
added
E
(mV)
Antilog
(E/S)
0 30 3.25
0.5 34.97 3.96
1.0 38.86 4.62
1.5 42.38 5.30
2.0 44.93 5.86
2.5 47.42 6.46
Figure 3-16: Calibration curve of antilog (E/S) versus the volume added of standard 10-3
M
for determination of clarithromycin solution 10-4
M by (MSA).
Table 3-12: The linear equation of calibration curve uses MSA, correlation coefficient,
volume at intercept, the concentration of sample (CU), Re% and Er% for the unknown
sample.
Linear equation r Volume at intercept
(mL)
Cu
(M) Rec. % Erel. %
y = 1.2827( x)+ 3.3093 0.9992 2.579 1.032×10⁻⁴
103.19 3.19
3-7-4- Titration method:-
The potentiometric titration for 15 mL of 1×10⁻⁴
M clarithromycin sample
solution with 1×10⁻⁴
M Sodium tetraphenylborate as titrant solution as shown in
Figure 3-16 (a and b), the results of titration (Rec.%, Erel.% and RSD%) are
listed in Table 3-13.
y = 1.2827x + 3.3093 r² = 0.9985
0
1
2
3
4
5
6
7
-3 -2 -1 0 1 2 3
antilog (E/S)
Vol. (mL) added of std.
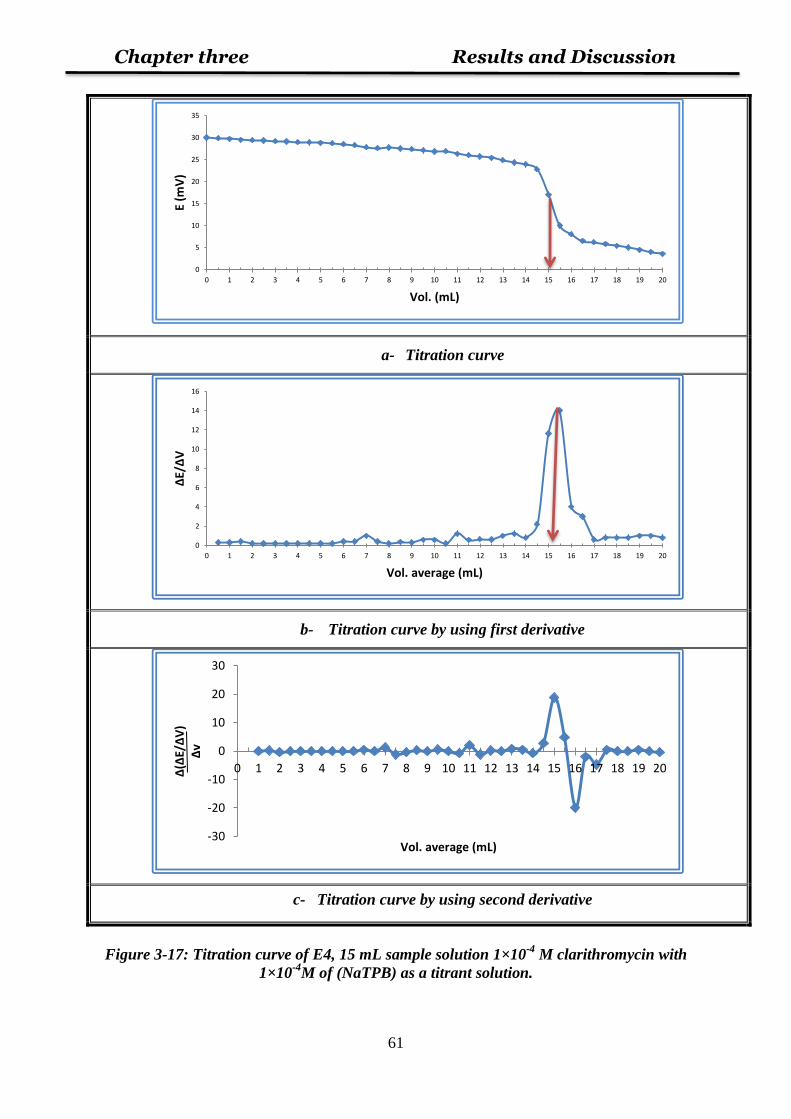
Chapter three Results and Discussion
61
a- Titration curve
b- Titration curve by using first derivative
c- Titration curve by using second derivative
Figure 3-17: Titration curve of E4, 15 mL sample solution 1×10⁻⁴
M clarithromycin with
1×10⁻⁴
M of (NaTPB) as a titrant solution.
0
5
10
15
20
25
30
35
0 1 2 3 4 5 6 7 8 9 10 11 12 13 14 15 16 17 18 19 20
E (m
V)
Vol. (mL)
0
2
4
6
8
10
12
14
16
0 1 2 3 4 5 6 7 8 9 10 11 12 13 14 15 16 17 18 19 20
ΔE/
ΔV
Vol. average (mL)
-30
-20
-10
0
10
20
30
0 1 2 3 4 5 6 7 8 9 10 11 12 13 14 15 16 17 18 19 20Δ(Δ
E/Δ
V)
Δv
Vol. average (mL)
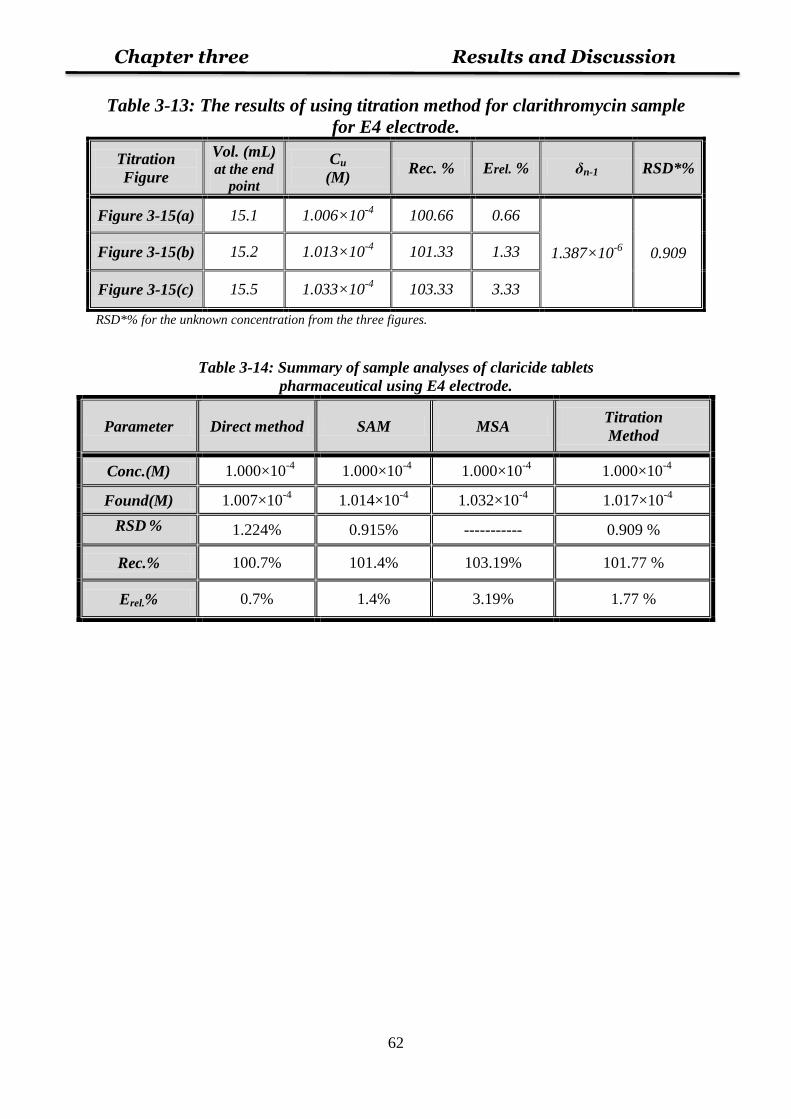
Chapter three Results and Discussion
62
Table 3-13: The results of using titration method for clarithromycin sample
for E4 electrode.
Titration
Figure
Vol. (mL) at the end
point
Cu
(M) Rec. % Erel. % δn-1 RSD*%
Figure 3-15(a) 15.1 1.006×10⁻⁴
100.66 0.66
1.387×10⁻⁶
0.909 Figure 3-15(b) 15.2 1.013×10⁻⁴
101.33 1.33
Figure 3-15(c) 15.5 1.033×10⁻⁴
103.33 3.33
RSD*% for the unknown concentration from the three figures.
Table 3-14: Summary of sample analyses of claricide tablets
pharmaceutical using E4 electrode.
Parameter Direct method SAM MSA Titration
Method
Conc.(M) 1.000×10⁻⁴
1.000×10⁻⁴
1.000×10⁻⁴
1.000×10⁻⁴
Found(M) 1.007×10⁻⁴
1.014×10⁻⁴
1.032×10⁻⁴
1.017×10⁻⁴
RSD % 1.224% 0.915% ----------- 0.909 %
Rec.% 100.7% 101.4% 103.19% 101.77 %
Erel.% 0.7% 1.4% 3.19% 1.77 %
Chapter three Results and Discussion
63
3-8- Conclusions:-
The two kinds of electrodes were prepared in this study based on PVC
matrix for clarithromycin determination; the first kind included fabrication of
membranes for clarithromycin (CLM) was constructed by tetraphenylborate
(TPB) with drug as ion-exchanger and many plasticizers: Di-butyl phthalate
(DBPH), Di-octyl phthalate (DOP), Di-butyl phosphate (DBP) and
Acetophenone (AP) in PVC matrix membrane, and the second kind included
fabrication of membranes for clarithromycin (CLM) was constructed by
tetraiodomercurate (TIM) with drug as ion-exchanger with the same
plasticizers. The best electrode was (E4) electrode which used to determine
clarithromycin in the pharmaceutical sample.
Also there is no interference for some interfering ion (Na+, K
+, Mn
2+, Cu
2+,
Fe3+
, Al3+
, sucrose and gelatin), it also has the working pH in the range (1.5–
6.5). The practical utility of the electrode has been demonstrated by use it as
indicator electrode in potentiometric precipitation titration of clarithromycin
solution with sodium tetraphenylborate solution. Direct method, standard
additions method and multi standard additions method have been also
successfully applied and showing a very good results. The results of these
analytical methods were showed to be simple, rapid and with good accuracy.
Chapter three Results and Discussion
64
3-9- Future Work:-
Based on the above ion selective electrode studies, a future work can be
applied on other ISE's which can be fabricated using:
1- Other types of drugs and antibiotic, with different properties and
chemical structure, to obtain wide selectivity over drugs and multiple
drugs.
2- Other methods for preparation ion-exchanger (ionophore).
3- Other plasticizers to get better idea on their influence on the electrode
performance.
4- Other types of matrixes as alternative to PVC matrix.
5- Other physical properties of membrane: percentage of components
proportions in membrane, through fixing one of the components and
changing the other, and thickness by increasing the weight of the
components or changing the diameter of a glass casting ring.
6- Application of these membranes in analyses of other drug samples with
similar active groups.
7- Study the selectivity behavior using other methods and also by using
more interfering ions.
8- Using new analytical techniques such as flow injection technique.
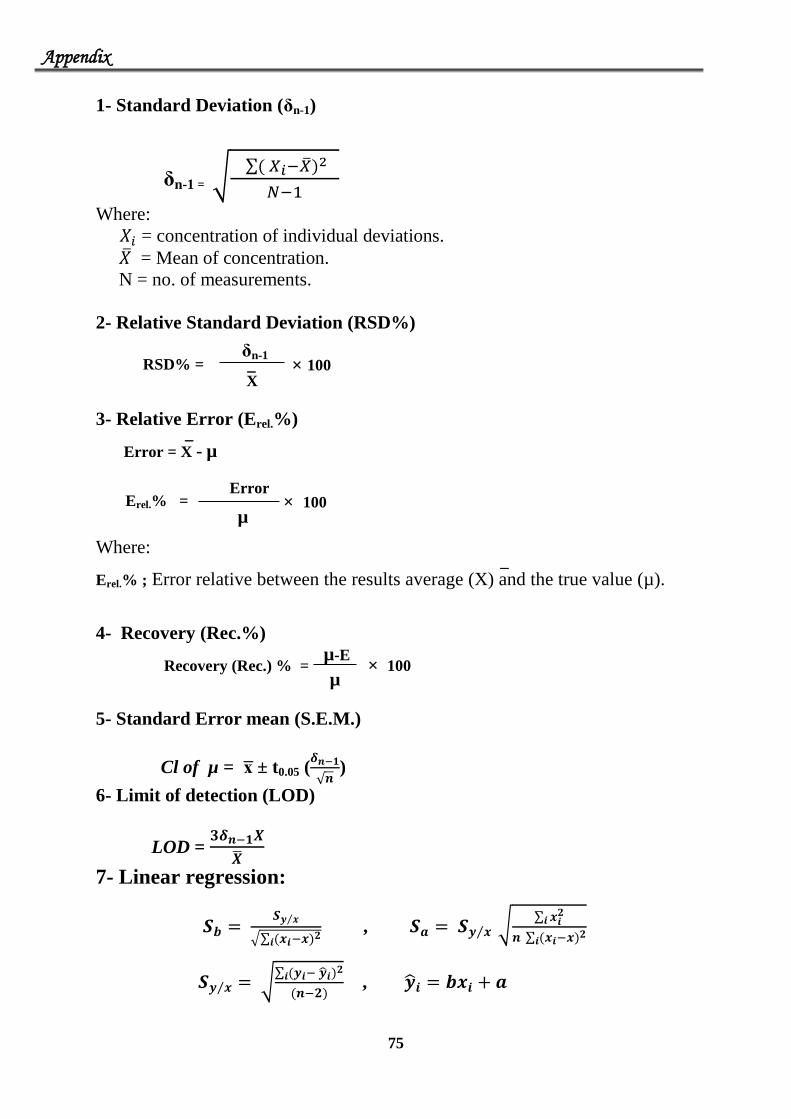
Appendix
75
1- Standard Deviation (δn-1)
δn-1 = √ ∑
Where:
= concentration of individual deviations.
= Mean of concentration.
N = no. of measurements.
2- Relative Standard Deviation (RSD%)
3- Relative Error (Erel.%)
Error = X - µ
Where:
Erel.% ; Error relative between the results average (X) and the true value (µ).
4- Recovery (Rec.%)
5- Standard Error mean (S.E.M.)
Cl of µ = ± t0.05 (
√ )
6- Limit of detection (LOD)
LOD =
7- Linear regression:
⁄
√∑
, ⁄ √∑
∑
⁄ √∑
,
Recovery (Rec.) % = µ-E
100 µ
Erel.% = Error
µ
100
RSD% = δn-1
X
100

References
65
References:-
1- R. P. Buck and E. Lindner, "Recommendations for nomenclature of
ion-selective electrodes", Pure &Appl. Chem., Vol. 66, No. 12, pp.
2527-2536, 1994.
2- A. S. Paihan, A. G. Fogg and D. T. Burns, "Development and
applications of ion-selective electrodes", A thesis for Lough
borough University of Technology, 1974.
3- C. Rundle, ''A Beginners Guide to Ion-Selective Electrode
Measurements'', Nico2000 Ltd, London, UK, 2008.
4- H. M. Brown and B. Rydqvist, "Arsenazo III-Ca2+
Effect of pH,
ionic strength, and Arsenazo III concentration on equilibrium
binding evaluated with Ca2+
ion-sensitive electrodes and
absorbance measurements", Biophys., Vol. 36, No. 1, pp. 117-137,
1981.
5- S. I. M. Zayed and Y. M. Issa, " Sibutramine Selective Electrodes
for Batch and Flow Injection Determinations in Pharmaceutical
Preparations", Anal. Sci., Vol. 26, No. 1, pp. 45-49, 2010.
6- G. Somer, S. Sezer, M. Dogan, S. Kalayc and O. Sendil,
"Preparation and properties of a new solid state borate ion selective
electrode and its application", Talanta, Vol. 85, No. 3, pp. 1461-
1465, 2011.
7- P. J. Milham, A. S. Awad, R. E. Paull and J. H. Bull, “Analysis of
plants, soils and waters for nitrate by using an ion-selective
electrode”, Analyst, Vol. 95, No. 1133,pp. 751-757, 1970.
8- J. M. Bremner, L. G. Bundy and A. S. Agarwal, “Use of a
Selective Ion Electrode for Determination of Nitrate in Soils”,
Analytical Latters, Vol. 1, No. 13, pp. 837-844, 1968.
References
66
9- A. Lewenstam, M. M. Zurawska and A. Hulanicki, “Application of
ion-selective electrodes in clinical analysis”, Electroanalysis, Vol.
3, No. 8, pp. 727-734, 1991.
10- U. Oesch, D. Ammann and W. Simon, “Ion-Selective Membrane
Electrodes for Clinical Use”, Clin. Chem., Vol. 32, No. 8, pp.
1448-1459, 1986.
11- R. A. Durst, “Ion selective electrodes in science, medicine, and
technology”, American Scientist, Vol. 59, No. 3, pp. 353-361,1971.
12- B. Fleet and H. V. Storp, “Analytical evaluation of a cyanide-ion
selective membrane electrode under flow-stream conditions”, Anal.
Chem., Vol. 43, No. 12, pp. 1575–1581, 1971.
13- J. Koryta, “Theory and applications of ion-selective electrodes
part II”, Anal. Chem. Acta, Vol. 91, No. 1, pp. 1-85, 1977.
14- L. D. Mello and L. T. Kubota, “Review of the use of biosensors
as analytical tools in the food and drink industries”, Food
Chemistry, Vol. 77, No. 2, pp. 237-256, 2002.
15- M. Rachidi, J. Elharti, K. Digua, Y. Cherrah and A. Bouklouze,
"New Polymeric Membrane Electrode for Azithromycin
Determination", Analytical Letters, Vol. 40, No. 1, pp. 53-66,
2007.
16- M. Shamsipur and F. Jalali, "Preparation of a Ketoconazole Ion-
Selective Electrode and Its Application to Pharmaceutical
Analysis", Anal. Sci., Vol. 16, No. 5, pp. 549-552, 2000.
17- E. Sohrab, K. Sahar, ''Preparation of a Fluconazole Potentiometric
Sensor and its Application to Pharmaceutical Analysis and to Drug
Recovery from Biological Fluids'', Int. J. Electrochem. Sci., Vol. 4,
No. 8, pp. 1100-1108, 2009.
References
67
18- H. Y. Aboul-Enein, X. S. Xian, J. S. Cheng, ''Ion Selective PVC
Membrane Electrode for the Determination of Methacycline
Hydrochloride in Pharmaceutical Formulation'', Sensors, Vol. 2,
No. 10, pp. 424-431, 2002.
19- A. S. Al-Attas, ''Novel PVC Membrane Selective Electrode for
the Determination of Clozapine in Pharmaceutical Preparations'',
Int. J. Electrochem. Sci., Vol. 4, No. 1, pp. 9-19, 2009.
20- M. Shamsipur, S. Haghgoo and F. Jalali, "Preparation of a
cimetidine ion-selective electrode and its application to
pharmaceutical analysis", J. Pharm. & Biomed. Anal., Vol. 27, No.
6, pp. 867-872, 2002.
21- G. R. Mohammad, R. Taherehsadat, F. Farnoush, R. Siavash and
N. Parviz, ''Application of a New Tramadol Potentiometric
Membrane Sensor as a Useful Device for Tramadol Hydrochloride
Analysis in Pharmaceutical Formulation and Urine'', Current
Pharm. Anal., Vol. 5, No. 1, pp. 28-33, 2009.
22- N. Alizadeh and R. Mehdipour, "Drug-selective electrode for
ketamine determination in pharmaceutical preparations and
electrochemical study of drug with BSA", Pharm. & Biomed.
Anal., Vol. 30, No. 3, pp. 725-731, 2002.
23- M. Shamsipur, S. Ershad and F. Jalali, "Preparation of a
diclofenac potentiometric sensor and its application to
pharmaceutical analysis and to drug recovery from biological
fluids", Pharm. & Biomed. Anal., Vol. 37, No. 5, pp. 943-947,
2005.
24- K.G. Kumar, P. Augustine and S. John, '' A Novel Potentiometric
Sensor for the Determination of Nimesulide'', Portugaliae
Electrochimica Acta, Vol. 25, No. 3, pp. 375-381, 2007.
References
68
25- K. H. Al-Saidi and Z. W. Ahmed, "Construction of Promethazine
Hydrochloride Selective Electrodes in A PVC Matrix Membrane",
JNUS, Vol. 14, No. 4, pp. 11-17, 2011.
26- K. H. Al-Saidi and W. R. Aziz, "Construction of New Ion
Selective Electrodes for Determination Chloramphenicol Sodium
Succinate and Their Application in Pharmaceutical Samples",
JNUS, Vol. 15, No. 2, pp. 71-78, 2012.
27- G. M. Bagher, B. Arash, N. Saherah, D. Hamed and K. S.
Hossein, ''A New Potentiometric Membrane Sensor: Determination
of Ibuprofen in Pharmaceutical and Human Serum Samples'', Adv.
Sci., Eng. & Med.,Vol. 5, No. 1, pp. 73-77, 2013.
28- J. Drozd and H. Hopkala,'' Cyproheptadine ion-selective
electrodes and their applications in some pharmaceutical
formulations'', Desalination, Vol. 163, No. 1-3, pp. 119-125, 2004.
29- S. A. Al-Tamimi, A. M. Al-Mohaimeed, N. A. Alarfaj and F. A.
Aly, ''Ion Selective Electrodes for Determination of Cefditoren
Pivoxil in Pharmaceutical Formulations and Biological Fluids'', Int.
J. Electrochem. Sci., Vol. 8, No. 3, pp. 3988-4001, 2013.
30- H. Hopkala, J. Drozd, S. Zareba, ''Chlorprothixene ion-selective
membrane electrodes development and application in
pharmaceutical analysis'', Pharmazie., Vol. 52, No. 2, pp. 307-309,
1997.
31- G. E. Mostafa., "PVC matrix membrane sensor for potentiometric
determination of cetyl pyridinium chloride", Anal. Sci., Vol. 17,
No. 9 pp. 1043-1047, 2001.
32- G. M. Abdel-Hafeez, ''Potentiometric PVC Membrane Sensor for
the Determination of Scopolamine in Some Pharmaceutical
Formulations'', Anal. Sci., Vol. 18, No. 12, pp. 1335-1341, 2002.
References
69
33- E. H. EL-Naby,'' Polymeric Membrane Sensors for the Selective
Determination of Dextromethorphan in Pharmaceutical
Preparations'', Anal. Sci., Vol. 24, No. 11, pp. 1409-1414, 2008.
34- N. S. Nassory, A. A. Al-Haideri and I. K. M. Al-Mashhadany,
''Preparation and Examination of Amine and Amiloride-Ion
Selective Electrodes with PVC Matrix Membranes'', Chem. Anal.,
Vol. 43, No. 1, pp. 52- 55, 2007.
35- J. A. Ortuno, R. Vicente, M. S. Garcia, A. Isabel and S. P.
Concepcion, ''A New Tiapride Selective Electrode and Its Clinical
Application'', Sensors, Vol. 7, No. 3, pp. 400-409, 2007.
36- N. S. Nassory, S. A. Maki and M. A. ALI, ''Preparation and
Characterization of an Atenolol Selective Electrode Based on a
PVC Matrix Membrane'', Turk. J. Chem., Vol. 31, No. 1, pp. 75-82,
2007.
37- G. M. Abdel-Hafiz, M. M. Hefnawy and A. Al-Majed, ''PVC
Membrane Sensors for Potentiometric Determination of
Acebutolol'', Sensors, Vol. 7, No. 12, pp. 3272-3286, 2007.
38- B. Eric and Q. Yu, "Electrochemical Sensors", Anal. Chem., Vol.
78, No. 12, pp. 3965-3984, 2006.
39- G. G. Guilbault, "Recommendations for publishing manuscripts
on ion-selective electrodes", Pure & Appl. Chem., Vol. 53, No.10,
pp.1907-1912, 1981.
40- F. Farnoush, R. Mohammad, D. Rassoul and N. Parviz,
"Developments in the Field of Conducting and Non-conducting
Polymer Based Potentiometric Membrane Sensors for Ions Over
the Past Decade", Sensors, Vol. 8, No. 4, pp. 2331-2412, 2008.
41- A. A. Belyustin, "The centenary of glass electrode: from Max
Cremer to F. G. K. Baucke", Solid State Electrochem., Vol. 15,
No. 1, pp. 47-65, 2011.
References
70
42- R. B. Fischer, " Ion-Selective Electrodes", Chem. Edu., Vol. 51,
No. 6, pp. 387-390, 1974.
43- R. W. Burnett, A. K. Covington, N. F. Andersen, W. R.
Külpmann, A. Lewenstam, A. H. Maas, O. M. Plathe, A. L.
VanKessel and W. G. Zijlstra, " Use of Ion-Selective Electrodes for
Blood-Electrolyte Analysis", Clin. Chem. Lab. Med., Vol. 38,
No. 4, pp. 363–370, 2000.
44- H. S. Yim, G. S. Cha and M. E. Meyerhoff, "Differential ion-
selective membrane electrode-based potentiometric gas-sensing
cells with enhanced gas sensitivity", Anal. Chem. Acta, Vol. 237,
pp. 115-125, 1990.
45- R. G. Mohammad, D. Rassoul and N. Parviz, ''Ion-Selective
Electrodes'', chemical abstract , Vol. 32, pp.323-332, 2008.
46- F. Scheller, D. Kirstein, L. Kirstein, F. Schubert, U.
Wollenberger, B. Olsson, L. Gorton, G. Johansson, W. J. Albery, F.
Scheller and J. D. R. Thomas, " Enzyme Electrodes and Their
Application", Biological sciences, Vol. 316, No. 1176, pp. 85-94,
1987.
47- L. Tymecki, E. Zwierkowska and R. Koncki, "Screen-printed
reference electrodes for potentiometric measurements", Anal.
Chem. Acta, Vol. 526, No. 1, pp. 3–11, 2004.
48- U. Guth, F. Gerlach, M. Decker, W. Oelbner and W. Vonau,
"Solid-state reference electrodes for potentiometric sensors", Solid
State Electrochem., Vol. 13, No. 1, pp. 27-39, 2009.
49- A. Evans, "Potentiometry and Ion Selective Electrodes", John
Wiley & Sons, 1987.
50- B. Eric, P. Erno and B. Philippe, ''Selectivity of Potentiometric
Ion Sensors'', Anal. Chem., Vol. 72, No. 6, pp. 1127-1133, 2000.

References
71
51- V. V. Egorov, "Ion-Selective Liquid Electrodes: Problems of
Description and Experimental Determination of Selectivity",
Russian Journal of General Chemistry, Vol. 78, No. 12, pp. 2455–
2471, 2008.
52- M. M. Zurawska and A. Lewenstam, "Selectivity coefficients of
ion-selective magnesium electrodes used for simultaneous
determination of magnesium and calcium ions", Talanta, Vol. 87,
295-301, 2011.
53- Y. Umezawa, K. Umezawa and H. Sato, "Selectivity Coefficients
for ion-selective electrodes: Recommended methods for reporting
Kpot
A,B values", Pure & Appl. Chem., Vol. 67, No. 3, pp. 507-518,
1995.
54- T. A. Patko, "Understanding ion selective sensors", Advanced
Sensor Technologies, Inc., USA, 2009.
55- Y. K. Umezawa and H. Sato, "Selectivity Coefficients for Ion
Selective Electrodes'', Pure & Appl. Chem., Vol. 74, No. 6, pp.
923-994, 2002.
56- K. Ren, "Selectivity problems of membrane ion-selective
electrodes", Fresenius J Anal. Chem., Vol. 365, No. 5, pp. 389-
397, 1999.
57- H. X. Wang and P. Min, ''A Method of Determining Selectivity
Coefficients Based on the Practical Slope of Ion Selective
Electrodes'', Chinese Chemical Letters, Vol. 13, No. 4, pp. 355-
358, 2002.
58- Y. Umezawa, ''Handbook of Ion-Selective Electrodes: Selectivity
Coefficients'', CRC Press, Boca Raton, Fl., 1990.
References
72
59- K. Tohda, D. Dragoe, M. Shibata and Y. Umezawa, "Studies on
the Matched Potential Method for Determining the Selectivity
Coefficients of Ion-Selective Electrodes Based on Neutral
Ionophores", Anal. Sci., Vol. 17, No. 6, pp. 733-743, 2001.
60- S. Solomon, "Sensors Handbook", McGraw-Hill, New York, NY,
1998.
61- P. Baily, L. Thomas, "Analysis with ion selective electrodes",
Heyden and Son, London (1976).
62- E. Lindner, K. Toth and E. Pungor, " Definition and determination
of response time of ion selective electrodes", Pure & Appl. Chem.,
Vol. 58, No. 3, pp. 469-479, 1986.
63- W. James, M. Eileen and M. George, ''Undergraduate
instrumental analysis'', New York, 6th edition, CRC Press, 2005.
64- D. A. Skoog and D. West. , "Analytical Chemistry", 6th Ed.,
Saunders Collge Publishing, USA, New York, P. 332, 1992.
65- M. Takashi and I. Toshihiko, '' Potentiometric titration method for
Ion-Selective Electrodes'', Analytical Communications, Vol. 34, pp.
257-259, 2007.
66- A. Y. Maha, "Preparation of liquid electrode based on Amiloride
drug complex in PVC matrix membrane", MSc thesis, al-Nahrain
university, 2009.
67- British pharmacopoeia, "Medicinal and Pharmaceutical
Substances", Published by The Stationery Office on behalf of the
Medicines and Healthcare products Regulatory Agency (MHRA),
Vol. 1 & 2, pp. 1406-1407, 2009.
68- K. Isadore, F. S. Michael and B. W. Roderick, "Analysis of
macrolide antibiotics", Chromatogr. A, Vol.812, No. 2, pp. 255-
286, 1998.
References
73
69- H. D. Langtry, R. N. Brogden, "Clarithromycin. A review of its
efficacy in the treatment of respiratory tract infections in
immunocompetent patients", Drugs, Vol. 53, No. 1, pp. 973-1004,
1997.
70- S. Jasmin, M. J. Rasul and M. Suraya, "Extractive
Spectrophotometric Methods for Determination of Clarithromycin
in Pharmaceutical Formulations Using Bromothymol Blue and
Cresol Red", J. Chin. Chem. Soc., Vol. 55, No. 3, pp. 1107-1112,
2008.
71- W. Mohamed, R. Mohamed, E. Manal and F. Muna,
"Spectrophotometric Determination of Four Macrolide Antibiotics
in Pharmaceutical Formulations and Biological Fluids via Binary
Complex Formation with Eosin and Spectrophotometry", AOAC
Int., Vol. 90, No. 6, pp. 1579-1589, 2007.
72- Y. Srinivasa, K. P. Chowdary and J. V. Seshagiriao, "A new
spectrophotometric method for determination of clarithromycin in
tablets", Int. J. Chem. Sci., Vol. 3, No. 1, pp. 225-226, 2003.
73- A. Hossein, A. Abolhassan, "Sensitive determination of
clarithromycin in human plasma by high-performance liquid
chromatography with spectrophotometric detection", J. Chrom. B,
Vol. 817, No. 2, pp. 193-197, 2005.
74- W. Li, H. Jia and K. Zhao, "Determination of clarithromycin in rat
plasma by HPLC–UV method with pre-column derivatization",
Talanta, Vol. 71, No. 3, pp. 385-390, 2007.
75- J.I.D Wibawa, P.N Shaw and D.A Barrett, " Quantification of
clarithromycin, its 14-hydroxy and decladinose metabolites in rat
plasma, gastric juice and gastric tissue using high-performance
liquid chromatography with electrochemical detection", J. Chrom.
B, Vol. 783, No. 2, pp. 359-366, 2003.
References
74
76- C. Taninakaa, H. Ohtania, E. Hanadaa, H. Kotakib, H. Satoa and
T. Igaa, "Determination of erythromycin, clarithromycin,
roxithromycin, and azithromycin in plasma by high-performance
liquid chromatography with amperometric detection", J. Chrom. B:
Biomed. Sci. & App., Vol. 738, No. 5, pp. 405-411, 2000.
77- S.J. Choi, S.B. Kim, H.Y. Lee, D.H. Na, Y.S. Yoon, S.S. Lee,
J.H. Kim, K.Ch. Lee and H.S. Lee, " Column-switching high-
performance liquid chromatographic determination of
clarithromycin in human plasma with electrochemical detection",
Talanta, Vol. 54, pp. 377-382, 2001.
78- M.F. Zaater, Y.R. Tahboub and E. Ghanem, "Determination and
Stability Assessment of Clarithromycin in Human Plasma using
RP-LC with Electrochemical Detection", J. Chrom. Sci., Vol. 50,
No. 4, pp. 763-768, 2012.
79- British pharmacopoeia, "Specific Monographs", Published by
The Stationery Office on behalf of the Medicines and Healthcare
products Regulatory Agency (MHRA), Vol. 3, p. 8359, 2009.
80- G. Svehla, "Vogel's textbook of macro and semimicro qualitative
inorganic analysis", 5th
ed., Longman group limited, p 294, 1979.
81- A. Craggs, G. J. Moody and J. D. R. Thomas, "PVC matrix
membrane ion-selective electrodes: Construction and laboratory
experiments", Chem. Educ., Vol. 51, No. 8, pp. 541-544, 1974.
82- British pharmacopoeia, "Infrared Reference Spectra", Published
by The Stationery Office on behalf of the Medicines and
Healthcare products Regulatory Agency (MHRA), Vol. 4, p 10638,
2009.
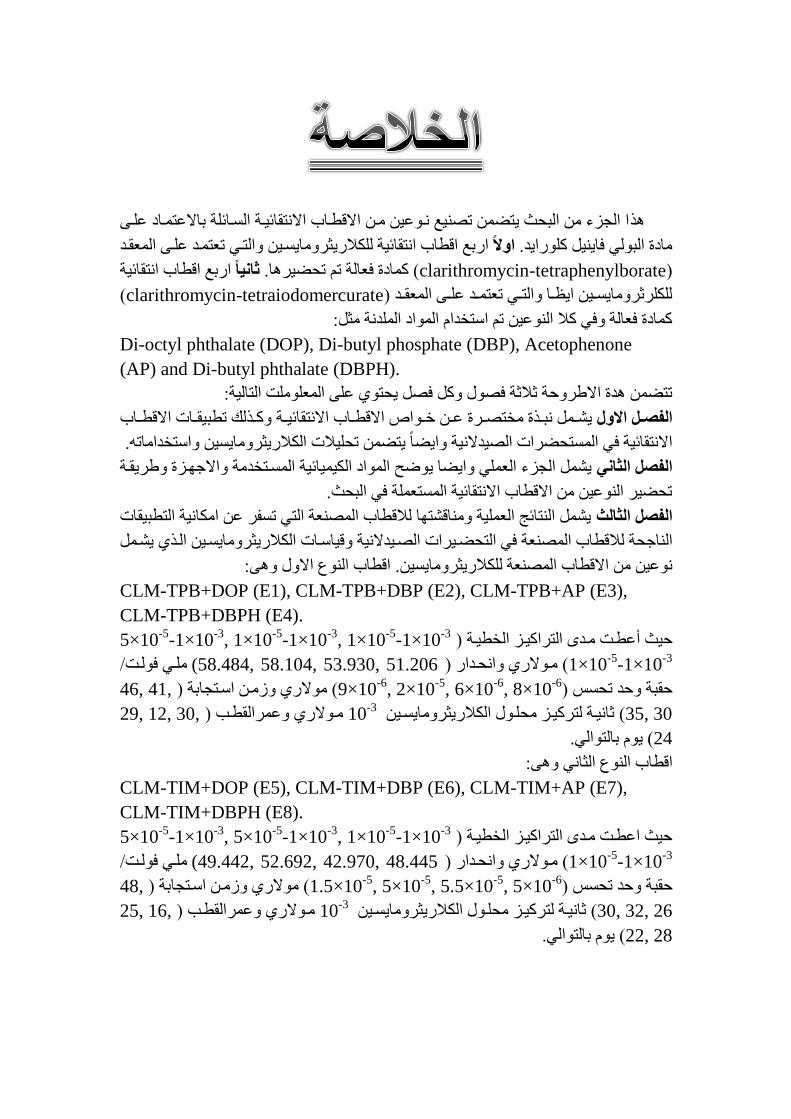
يهو ا انجشء ي انبحث يخض حصيع وعيي يو اطابوالا اطخيا يوت انةوا هت ماطيخوا ذه
ثزويايةوي وانخوي حمخود يهو انميود يرارمع اابالا اخيا يت نهكلا اولا. يا ة انبعني فاييم كهعرايد
(clarithromycin-tetraphenylborate) ارمع اابالا اخيا يت ثانياا. كا ة فمانت حى ححضيزها
(clarithromycin-tetraiodomercurateنهكهزثزويايةووي اي ووا وانخووي حمخوود يهوو انميوود )
:كا ة فمانت وفي كلا انعيي حى اسخخداو انعا انهدت يثم
Di-octyl phthalate (DOP), Di-butyl phosphate (DBP), Acetophenone
(AP) and Di-butyl phthalate (DBPH).
:فصم يحخعي يه انمهعيهج انخانيتحخض هدة اططزوحت ثلاثت فصعل وكم
وكووذنت حببييوواث اطابووالا يشووم بووذة يخخصووزة يوو طووعالا اطابووالا اطخيا يووتالفصللاالو
اطخيا يت في انةخحضزاث انصيدطيت وايضا يخض ححهيلاث انكلاريثزويايةي واسخخداياحه.
يشم انجشء انمهي وايضا يعضح انعا انكييا يت انةوخخديت واطهزوشة وطزييوت الفصاالثاني
ححضيز انعيي ي اطابالا اطخيا يت انةخمهت في انبحث.
يشم انخا ج انمهيت ويااشخزا نلاابالا انصمت انخي حةفز ي ايكايت انخببيياث الفصاالثالث
ي يشوم ذثزويايةوي انويرانصويدطيت واياسواث انكلا في انخحضويزاثاناهحت نلاابالا انصمت
:اابالا انعع اطول وه . ثزويايةييراطابالا انصمت نهكلا عيي ي
CLM-TPB+DOP (E1), CLM-TPB+DBP (E2), CLM-TPB+AP (E3),
CLM-TPB+DBPH (E4).
10×5يبوج يودا انخزاكيوش انخبيوت )أحيث -5
-1×10⁻³
, 1×10⁻⁵
-1×10⁻³
, 1×10⁻⁵
-1×10⁻³
1×10⁻⁵
-1×10⁻³
يهوي فعنوج 51.206 ,53.930 ,58.104 ,58.484)) يوعطري واحودار (
10×9وحد ححةس ) حيبت-6
, 2×10⁻⁵
, 6×10⁻⁶
, 8×10⁻⁶
,41 ,46) يعطري وسيو اسوخجامت (
10 ثزويايةوي يرثايوت نخزكيوش يحهوعل انكلا (30 ,35-3
,30 ,12 ,29) ويزانيبو يوعطري
مانخعاني.يعو (24
:انعع انثاي وه اابالا
CLM-TIM+DOP (E5), CLM-TIM+DBP (E6), CLM-TIM+AP (E7),
CLM-TIM+DBPH (E8).
10×5حيث ايبوج يودا انخزاكيوش انخبيوت )-5
-1×10⁻³
, 5×10⁻⁵
-1×10⁻³
, 1×10⁻⁵
-1×10⁻³
1×10⁻⁵
-1×10⁻³
يهوي فعنوج 48.445 ,42.970 ,52.692 ,49.442)) يوعطري واحودار (
10×1.5وحد ححةس ) حيبت-5
, 5×10⁻⁵
, 5.5×10⁻⁵
, 5×10⁻⁶
,48) يعطري وسيو اسوخجامت (
10 ثزويايةوي يرثايوت نخزكيوش يحهوعل انكلا (26 ,32 ,30-3
,16 ,25) ويزانيبو يوعطري
مانخعاني.يعو (28 ,22

حيث اسخخدو نخيديز انكلاريثزويايةي في انةخحضزاث E4نيد وهد ا افضم اب هع
يمايم ( ونيد حى راست 6.5-1.5محدو )E4 ا يدا اندانت انحايضيت نهيب انصيدطيت.
Kاطخيا يت pot
A,B نهخدطلاث انخانيت ) نلاابالا اطخيا يتNa+, K
+, Mn
+2, Cu
+2, Fe
+3,
Al+3
, sucrose and gelatin معاسبت طزييت انحانيم انفصهت وطزييت انحانيم )
10×4.28حيث حزاوحج مي )انشوهت -2
-8.82×10⁻⁵
في E4نت حى اسخخداو انيب ذوك(
انخيديزاث اطهزا يت نخميي انكهزثزويايةي في اط ويت انخجاريت .

العراق جمهورية وزارة التعميم العالي والبحث العممي
جامعة النهرين/كمية العموم قسم الكيمياء
جديدة لتقدير مريةيبول تصنيع ودراسة اقطاب الكلاريثرومايسين
رسالة جامعة النهرين -كلية العلوم إلىمقدمة
وهي جزء من متطلبات نيل درجة الماجستير في الكيمياء
من قبل
حيدر قيس منشد (بغداد)جامعت 0202 كيمياء علوم بكالوريوس
شرافإتحت
خالدة حميد محمد السعيدي أ.م.د.
0141 ھ 2013 م


![New advances in polymeric membranes for CO separation · 2016-06-15 · New advances in polymeric membranes for CO2 ... [1]. The membrane gas separation industry has grown dramatically](https://img.pdfslide.us/doc/110x75/5b1c992d7f8b9aef288b459c/new-advances-in-polymeric-membranes-for-co-2016-06-15-new-advances-in-polymeric.jpg)