Embed Size (px)
Citation preview
International Journal of Primatology, Vol. 21, No. 4, 2000
Constraints on Group Size in Red Colobus andRed-tailed Guenons: Examining the Generality ofthe Ecological Constraints Model
Colin A. Chapman1,2 and Lauren J. Chapman1,2
Received May 16, 1999; revision September 27, 1999; accepted January 7, 2000
The ecological constraints model proposes that an increase in group size willincrease intragroup feeding competition and thereby constrain group size.Although this model has received wide acceptance, tests of it are based onlyon a few studies of species that have similar ecological requirements and socialorganizations, and there are reasons to question the widespread acceptance ofthe assumptions underpinning it. Via a 2-year study, we explored determi-nants of group size in species that feed on markedly different types of foods:the folivorous red colobus (Procolobus pennantii) and the frugivorous/insec-tivorous red-tailed guenon (Cercopithecus ascanius). We established 4 studysites approximately 15 km apart in Kibale National Park, Uganda, to examinethe relationship between average group size and food availability. In bothspecies, we quantified interdemic variation in diet, density of food trees, rateof travel, and group size. Red colobus at all sites relied heavily on leafresources (75.5%–86.9%), but fruit (6.4%–13.9%) and flowers (2.0%–13.9%)were important in some populations. In general, red-tailed guenons fed onfruit (35.7%–59.7%), insects (14.5%–17.6%), and young leaves (12.2%–32.8%), but the amount of time allocated to these foods varied among sites.Average monthly density of trees bearing food items ranged among sitesfrom 45 to 79 trees/ha for red colobus and from 19.6 to 67.3 trees/ha forred-tailed guenons. For both species, rate of travel was similar among sites,with one exception for red colobus. Average red colobus group size varied
1Department of Zoology, University of Florida, Gainesville, Florida 32611; Fax: 352-392-3704;e-mail: [email protected].
2Wildlife Conservation Society, 185th Street and Southern Boulevard, Bronx, New York 10460.
565
0164-0291/00/0800-0565$18.00/0 2000 Plenum Publishing Corporation

566 Chapman and Chapman
among sites from 14 to 40 (28 groups counted). Red-tailed guenon groupsize varied among sites from 11 to 24 (16 groups counted). As predicted bythe ecological constraints model, group size increased with food tree densityacross sites for both species.
KEY WORDS: colobus; cercopithecine; group size; social organization; food abundance; dayrange; diet; group movement; ecological constraints model.
INTRODUCTION
Identifying ecological factors underlying primate group size and socialorganization has been a central theme in primate behavioral ecology (Alt-mann, 1974; Chapman, 1990a,b; Chapman et al., 1995; Struhsaker, 1975;Terborgh, 1983). Determinants of group size have been extensively dis-cussed in terms of their costs and benefits (Altmann, 1974; Bradbury andVehrencamp, 1976; Chapman, 1989; McDonald, 1979; 1983; Milton, 1984;Waser, 1981), and various authors have suggested that grouping conferssuch predictable benefits that differences in group size can be explained bythe disadvantages (Clutton-Brock and Harvey, 1977; Terborgh and Janson,1986; Wrangham et al., 1993). The most widely acknowledged cost of groupliving is intragroup feeding competition, which has clear fitness effects,including increased mortality (Dittus, 1979) and lower female reproductiverates (Whitten, 1983). Intragroup competition can reduce foraging effi-ciency in two ways: via direct contest over food resources (interferencecompetition; Janson, 1985, 1988; Nicholson, 1954; van Schaik, 1989) orexploitation independent of direct interaction (exploitation competition;Chapman et al., 1995; Janson, 1988; van Schaik and van Noordwijk, 1988;Terborgh, 1983). Unfortunately, competition has proved extremely difficultto detect and quantify because of the difficulty of establishing whether foodis limiting for wild primate populations.
Recent reviews of constraints on group size suggest that indices ofexploitation competition can predict a large proportion of the variance inanimal group size whenever a group has to travel further per day than asolitary forager does to satisfy its food requirements (Chapman et al., 1995;Janson and Goldsmith, 1995; Wrangham et al., 1993). This has led to thedevelopment of a general model: the ecological constraints model of groupsize (Chapman and Chapman, 2000). The foundations of this model havebeen well-established through studies on a variety of vertebrates (Bradburyand Vehrencamp, 1976; Elgar, 1986; Pulliam and Caraco, 1984). An increasein group size normally increases the distance that must be traveled to findadequate food supplies (Chapman, 1990a,b; Milton, 1984). Thus, individuals
Constraints on Group Size 567
must travel farther and expend more energy if they are in a large groupthan if they were to forage in a smaller group or alone. With an increasein the time spent traveling, a point is approached in which energy spent intravel exceeds that obtained from the environment, and a smaller groupsize becomes advantageous. In this way, ecological factors can influencemovement patterns and foraging efficiency and thereby constrain group size.
This model rests on one critical assumption: When resource availabilityis constant, the addition of new members leads to increased intragroupfeeding competition, necessitating increased travel. The need for increasedtravel can result from larger groups depleting patches quickly, necessitatingthat the group visit many patches. Alternatively, for species that do notdeplete the patches in which they feed or that feed on dispersed foods butare unable to increase group spread, individual search fields may increas-ingly overlap as group size increases. This reduces per-capita encounterrate with food, thereby increasing the area that must be searched to findfood. Van Schaik et al. (1983) suggested that foraging animals tend to moveaway when approached by others, presumably to avoid foraging conspecificsthat reduce the availability of dispersed food items or to avoid contestcompetition. They dubbed this behavioral mechanism pushing forward.Unfortunately, there are few field data to support these two mechanismsleading to higher travel costs with increasing group size.
It is often assumed that increased intragroup competition associatedwith increased group size must lead to longer day range for group size tobe constrained by ecological conditions (Chapman, 1990a,b; Isbell, 1991;Olupot et al., 1994; Terborgh, 1983; Terborgh and Janson, 1986). However,this need not necessarily be the case. If groups are always attempting tobe in the largest group possible, e.g., to decrease predation risk or toincrease effectiveness in intergroup competition, then they will always betraveling to the maximum level possible within the constraints of availableresources. Thus, one might expect an increase in group size with an increasein food availability, but travel may remain constant because food per indi-vidual remains the same regardless of group size. Previous studies showedthat food availability, daily travel distance, and group size are interrelated.For example, Struhsaker (1967) documented that two groups of vervets(Chlorocebus aethiops) that were roughly the same size had very differentday ranges. He attributed this difference to the fact one group lived in aless productive habitat, which forced them to cover a larger area on anaverage day.
Although the ecological constraints model has received widespreadacceptance, tests of the model with primates are based on relatively fewstudies that were limited to species that have similar ecological requirementsand social organization (Ateles: Chapman, 1988a, 1990a,b; Chapman et al.,
568 Chapman and Chapman
1995; Symington, 1987, 1988a,b; 1990; Brachyteles arachnoides: Milton, 1984;Strier, 1989; Alouatta palliata: Chapman, 1990a; Pan: Chapman et al., 1994,1995; White and Wrangham, 1988). For species with stable grouping pat-terns, testing the model is difficult because one must relate changes ingroup size to a set of ecological conditions and both ecological conditions,e.g., phenological states, and group size—births, deaths, immigration, andemigration—typically change slowly. As a result, researchers have oftenexamined fission–fusion societies (Chapman, 1990a,b; Chapman et al., 1995;Milton, 1984). In these societies, animals from a single community foragein subgroups that frequently change size and composition. Because sub-group size is flexible, animals can respond to ecological changes that occurover short temporal and spatial scales, and one can relate ecological changeto change in subgroup size.
Despite supporting evidence for the ecological constraints model fromstudies of fission–fusion societies, there is reason to question its widespreadacceptance throughout the primate order. Isbell (1991) pointed out thatthere is no relationship between group size and daily travel distance forsome folivorous and frugivorous/insectivorous primate species. For exam-ple, a red colobus (Procolobus pennantii) group of 9 individuals had a dayrange length of 578 m, whereas a group of 68 red colobus had a day rangelength of 593 m (Isbell, 1983, 1991; Struhsaker and Leland, 1987). Similarly,Struhsaker and Leland (1988) documented that after a red-tailed guenon(Cercopithecus ascanius) group divided, the daily distance traveled by thesmaller of the two groups (15 members; 1595 � 312, n � 10 days) wassimilar to the daily distance traveled by the large group (30–35 members;1546 � 287, n � 9 days). Similarly, Butynski (1990) found no relationshipbetween group size and day range for 5 groups of blue monkeys (Cercopi-thecus mitis). Such examples appear to violate an assumption of the modelbecause an increase in group size does not correspond to an increase intravel distance, assuming resource availability is similar between groups.
If species rely on dispersed foods, the addition of extragroup memberswould not increase the rate of patch depletion. For such species, additionalgroup members may result in increased overlap of search fields resultingin increased travel (van Schaik et al., 1983), but such a process has notbeen broadly examined. For species such as red-tailed guenons and patasmonkeys (Erythrocebus patas), which spend a great deal of time searchingfor and feeding on small dispersed foods, travel distance would not haveto increase with larger group sizes and search field overlap would notincrease as long as the group could spread out (Chism and Rowell, 1988;Isbell, 1991; Isbell et al., 1998).
Such observations raise the intriguing question of what controls groupsize in folivorous species or in ones that feed on dispersed food items, e.g.,
Constraints on Group Size 569
frugivore/insectivores for which no relationship between group size andday range has been documented. For red-tailed guenons, Isbell (1991)suggested that the harassment of females by males may constrain groupsize. This hypothesis is based on observations by Struhsaker and Leland(1988) on a group of red-tailed guenons that split. They found that thesmaller group increased their reproductive rate relative to the larger group,despite the fact that the food resource base did not appear to differ betweenthem. They attributed the difference in the reproductive rates to higherlevels of aggression and greater male harassment of females in the largergroup. The idea is that male harassment can constrain group size becauseas group size increases, the number of females in the group increases, moremales are attracted to the group, male tenure in the group will decrease,and this increases the level of male harassment. What remains unclearfrom Struhsaker and Leland’s (1988) description is why males are morefrequently taking over large groups, when they would have higher reproduc-tive success if they took over small groups which they could have longertenure. Possibly, small groups are more difficult to overtake. Also, it isunclear whether the increased level of aggression associated with largegroups is a result of increased male harassment versus aggression associatedwith increased feeding competition, as the ecological constraints modelwould predict, or simply an effect of having more animals in close proximity(T. T. Struhsaker, pers. comm.).
In a 2-year study, we explored determinants of group size with primatespecies that feed on markedly different foods. We focus on red colobusand red-tailed guenons, species for which there are reasons to question theapplicability of the ecological constraints model. Red colobus are supposedto use nondepleting patches, and it has been documented that an increasein red colobus group size does not correspond to an increase in day-rangelength (Isbell, 1983, 1991; Struhsaker and Leland, 1987). Red-tailed guenonsrely on dispersed food resources, and an increase in their group size didnot correspond to an increase in day-range length (Isbell 1991; Struhsakerand Leland 1988). We established 4 study sites approximately 15 km apartalong a north–south axis in Kibale National Park, Uganda, to examine therelationship between average group size and food density.
METHODS
Study Sites
Kibale National Park (766 km2) is located in western Uganda (0�13�0�41�N, 30�19� 30�32�E) near the foothills of the Ruwenzori Mountains
570 Chapman and Chapman
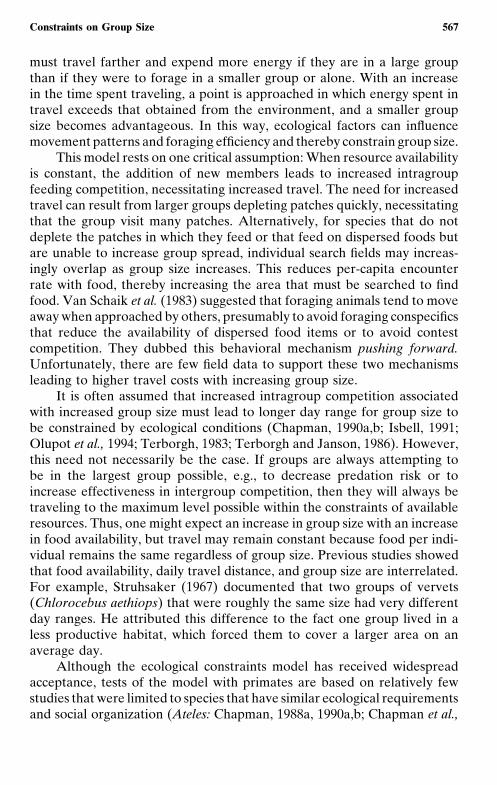
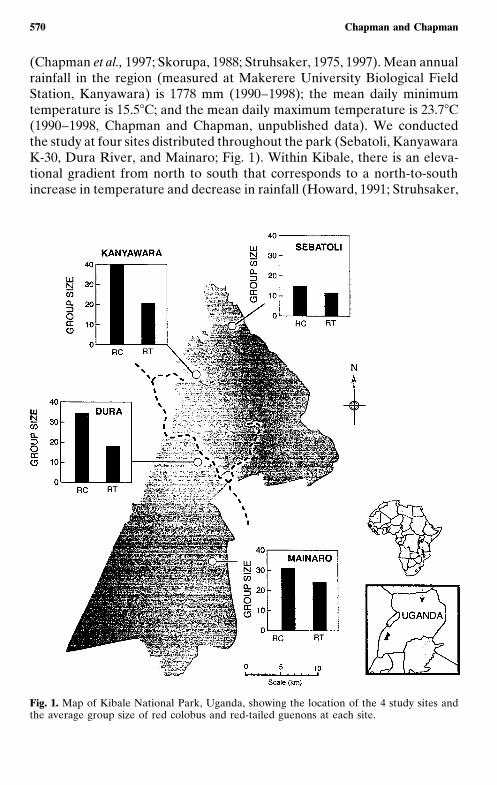
(Chapman et al., 1997; Skorupa, 1988; Struhsaker, 1975, 1997). Mean annualrainfall in the region (measured at Makerere University Biological FieldStation, Kanyawara) is 1778 mm (1990–1998); the mean daily minimumtemperature is 15.5�C; and the mean daily maximum temperature is 23.7�C(1990–1998, Chapman and Chapman, unpublished data). We conductedthe study at four sites distributed throughout the park (Sebatoli, KanyawaraK-30, Dura River, and Mainaro; Fig. 1). Within Kibale, there is an eleva-tional gradient from north to south that corresponds to a north-to-southincrease in temperature and decrease in rainfall (Howard, 1991; Struhsaker,
Fig. 1. Map of Kibale National Park, Uganda, showing the location of the 4 study sites andthe average group size of red colobus and red-tailed guenons at each site.
Constraints on Group Size 571
1997). The most northern site, Sebatoli (elevation 1500 m, 1997 rainfall1491 mm) is considered Parinari forest by foresters because the spreadingcrown of Parinari excelsa can be distinguished on aerial photographs. Thecanopy is dominated by trees such as Parinari excelsa, Carapa grandiflora,Olea welwitschii, Aningeria altissima, Strombosia scheffleri, and Newtoniabuchanani (Osmaston, 1959). Kibale forest received National Park statusin 1993. Before 1993, it was a Forest Reserve, gazetted in 1932, with thestated goal of providing a sustained production of hardwood timber (Chap-man and Chapman, 1997; Osmaston, 1959; Struhsaker, 1997). As a result,the forest near Sebatoli was commercially logged in the late 1960s. Wewere unable to obtain information on the level of extraction. However,detailed quantification of stand structure suggests that the level of extractionwas similar to or slightly lower than an area just to the south, K-15 forestrycompartment (Chapman and Chapman, unpublished data), in which theharvest averaged 21 m3/ha or approximately 7.4 stems/ha (Skorupa, 1988;Struhsaker, 1997). Incidental damage in the K-15 forestry compartmentwas much higher: approximately 50% of all trees probably were destroyedby logging and incidental damage (Chapman and Chapman, 1997; Skor-upa, 1988).
Kanyawara (K-30 Forestry Compartment, elevation � 1500 m, 1997rainfall � 1976 mm) is a 282-ha area that has not been commerciallyharvested. However, before 1970, a few large stems (0.03–0.04 trees/ha)were removed by pitsawyers. This extremely low level of extraction seemsto have had very little impact on the structure and composition of the forest(Skorupa, 1988; Struhsaker, 1997).
At the Dura River (elevation � 1250 m, 1997 rainfall � 1500 mm),the forest is no longer considered a Parinari forest, as P. excelsa and thetree species associated with it are relatively rare and Pterygota mildbraedii,Cola gigantea, Pipadeniastrum africanum, and Chrysophyllum albidum arethe dominant canopy species (Kingston, 1967).
Further south at Mainaro (elevation � 1200 m, 1997 rainfall � 1394),the forest is dominated by Cynometra alexandri and affiliated species(Kingston, 1967). At both the Dura River and Mainaro sites, a few timbertrees have been extracted by pitsawyers (approximately 0.1 trees/ha), butthis activity has had little impact on the forest. Detailed enumeration ofthe tree communities in these areas is provided by Chapman et al. (1997).
Behavioral Observations
We observed behavior of red colobus from July 1996 to June 1997 atall four sites, producing 832 hours of observation. Rebel activity prevented

572 Chapman and Chapman
us from sampling at Mainaro in January, February, and April, 1997. Weobserved red-tailed guenons from July 1997 to June 1998 at all four sites,producing 587 hours of observations. We used an observational methodthat approximates methods employed in previous studies in Kibale (Butyn-ski, 1990; Struhsaker, 1975; Waser 1974). In each half hour that the observerwas with the group, he or she took 5-point samples of different individualsthat were in clear view. For each observation, we noted the first activitythe individual sustained for � 5 continuous seconds. If the subject wasfeeding, we recorded the species and the plant part, e.g., fruit, young leaf,and leaf petiole. We estimated distance traveled every half hour as thestraight-line distance between the apparent center of mass of the group inthe previous 30-min sample to the current center of mass (Waser 1974;Olupot et al. 1994). Distance estimations were assisted by the fact that weplotted travel routes on detailed trail maps.
When possible, we conducted observations at each location during 2consecutive days each month. On the first day, we attempted to locate thestudy group early in the morning and to follow it until late afternoon. Thisassisted in locating the same group early the next morning. Observationsgenerally began at �8:30 h and ended at �16:00 h; however, the time thatobservations started varied because of difficulties in traveling to sites orbecause the study group could not be readily located. To address thispotential bias, we adjusted behavioral samples from different sites so thatthe same proportion of observations were from each hour of the day byrandomly removing observations from the datasets of sites with the greaternumber of observation hours during a particular hour of the day. Thisapproach produced a sample that can be compared among sites and timeperiods; however, caution must be used when comparing the results of thisstudy to research conducted using different methods.
Group Counts
Obtaining reliable counts of forest-dwelling primate groups is ex-tremely difficult because inactive subjects are often hard to locate andwhen groups travel they often take different pathways. Accordingly, weendeavored to count groups in each area. Each month between July 1996and May 1998 (22 months), two observers spent 2 days at each site simplyfollowing groups and attempting to get counts. We rarely attempted countswhen a group was stationary; the best counts were obtained when a groupcrossed a gap, such as the river (Dura, Sebatoli, and Mainaro) or a road(Kanyawara and Dura). We repeated counts of the same group to ensureaccuracy. We identified groups either by seeing recognizable individuals
Constraints on Group Size 573
or by matching the group count to previous ones from the same area.In addition, we counted opportunistically while collecting behavioral orphenological data and the subjects crossed a road or river. Skorupa (1988)found that red colobus groups in a logged area in Kibale divided intoindependent subgroups that could be separated by several hundred meterson 33% of the days (N � 74 days over 15 months). We observed similarpatterns with a red colobus group in an unlogged area (K-30). As a result,we were concerned that counts of particular populations could be biasedby considering subgroups to be groups. However, we did not observe groupfissioning in any population other than the K-30 one, and we were able todetermine that fissioning had occurred by noting recognizable individualsin the separate subgroups. Furthermore, the average maximum differenceof counts of groups with recognizable individuals is small (mean differenceamong populations � 2.48, range � 1.0 to 4.3, excluding the group knownto fission).
Ecological Assessment/Phenology
The ecological constraints model predicts that group size will be afunction of food availability. We examined the applicability of this model bydetermining if average monthly food-tree density corresponded to averagegroup size of red colobus and red-tailed guenons at each of the four sites. Toobtain an index of habitat-wide food availability, we constructed vegetationtransects (200 m � 10 m) at each site: 6 transects at Kanyawara and 4 atDura River, Mainaro, and Sebatoli. In Kanyawara, we selected transectlocations at random from within existing trail systems (Chapman and Chap-man, 1997, 2000). At the Mainaro, Dura River, and Sebatoli sites therewere no preexisting trails, so we established transects perpendicular to eachother at 50- to 100-m intervals. This regime produced a sampling area of3.6 ha (1.2 ha at Kanyawara and 0.8 ha at Dura River, Mainaro, andSebatoli). We marked each tree �10 cm diameter at breast height (DBH)within 5 m of each side of the trail with a numbered aluminum tag andmeasured its DBH. This produced a sample of 1543 trees: 590 at Kanyawara,338 at Dura River, 293 at Mainaro, and 322, at Sebatoli).
We recorded phenological information monthly between January 1990and July 1998 at Kanyawara (n � 103 months), July 1995 and July 1998 atMainaro and Dura River (n � 36 months), and July 1996 and July 1998 atSebatoli (n � 24 months). We documented the stage of leaf development—(leaf bud, young leaves, mature leaves; visually assessed through binocu-lars)—and noted the presence or absence of flowers and ripe and unripefruit for all trees. We used phenology data to correct for the proportion
574 Chapman and Chapman
of individual trees of a given species that were actually producing therelevant plant part, e.g., young leaves, ripe fruit, in a given month.
When relating mean group size for a site to food density, we used thebehavioral observations to determine which species to consider food trees.We calculated the density of food trees for a particular month as the densityof trees containing food items eaten for �10% of a species’ foraging time.We only considered foods that were eaten for �10% of their foraging timebecause both red colobus and red-tailed guenons often eat for short periodsin trees of several species (Struhsaker, 1975, 1980). When food resourceswere relatively scarce and the trees fed upon for only short periods happento be common, the estimate of food availability would be erroneously high.Foods that were eaten for �10% of foraging time represent an average of82.1% of the red colobus total foraging effort (Sebatoli 90.6, Dura River83.6, K-30 83.0%, Mainaro 71.3%) and an average of 76.8% of red-tailedguenon noninsect foraging time (Sebatoli 65.5%, K-30 74.1%, Dura River80.4%, Mainaro 87.3%). This method assumes that trees of the same speciesproduce similar crops of food items at the different sites. We indexedoverall food availability at a site as the average of the monthly estimatesof the density of trees bearing food items.
RESULTS
Interdemic Variation in Diet, Density of Food Trees, Rate of Travel,and Group Size
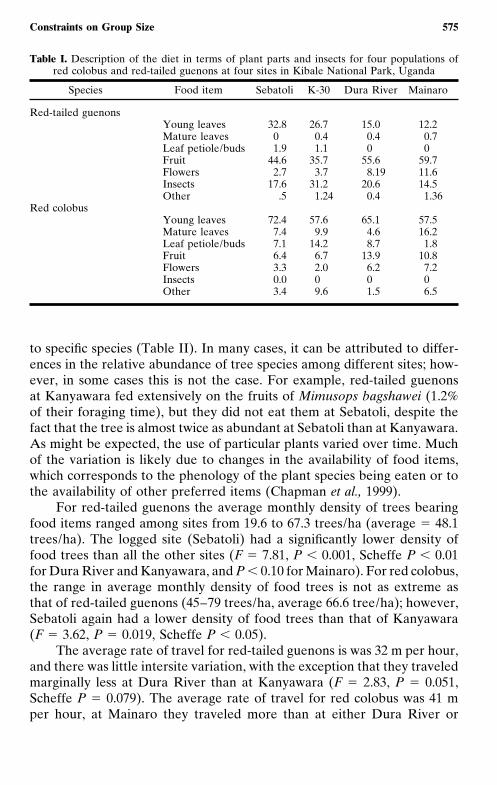
For both red-tailed guenons and red colobus, we quantified interdemicvariation among the four sites in diet, density of food trees, rate of travel,and group size. As expected, red colobus at all sites relied heavily on leafresources (range among populations in percentage of foraging effort spenteating leaves � 75.5–86.9%); however, the leaf part selected varied amonglocations (Table I). For example, the Kanyawara population relied heavilyon leaf petioles (14.2% of their foraging time), whereas the Mainaro popula-tion did not (1.8%). Similarly, the extent to which red colobus populationsrelied on fruit (range 6.4–13.9%) or flowers (2.0–13.9%) varied amongpopulations. Interdemic variation in red-tailed guenon diet is also evident.In general, they fed on fruit, leaves, and insects, but the amount of timespent eating each of these different food items varied among sites (TableI). For example, the amount of time devoted to eating young leaves variedbetween 32.8 % at Sebatoli and 12.2% at the Cynometra-dominated forestof Mainaro.
There is considerable intersite variance in the foraging effort devoted
Constraints on Group Size 575
Table I. Description of the diet in terms of plant parts and insects for four populations ofred colobus and red-tailed guenons at four sites in Kibale National Park, Uganda
Species Food item Sebatoli K-30 Dura River Mainaro
Red-tailed guenonsYoung leaves 32.8 26.7 15.0 12.2Mature leaves 0 0.4 0.4 0.7Leaf petiole/buds 1.9 1.1 0 0Fruit 44.6 35.7 55.6 59.7Flowers 2.7 3.7 8.19 11.6Insects 17.6 31.2 20.6 14.5Other .5 1.24 0.4 1.36
Red colobusYoung leaves 72.4 57.6 65.1 57.5Mature leaves 7.4 9.9 4.6 16.2Leaf petiole/buds 7.1 14.2 8.7 1.8Fruit 6.4 6.7 13.9 10.8Flowers 3.3 2.0 6.2 7.2Insects 0.0 0 0 0Other 3.4 9.6 1.5 6.5
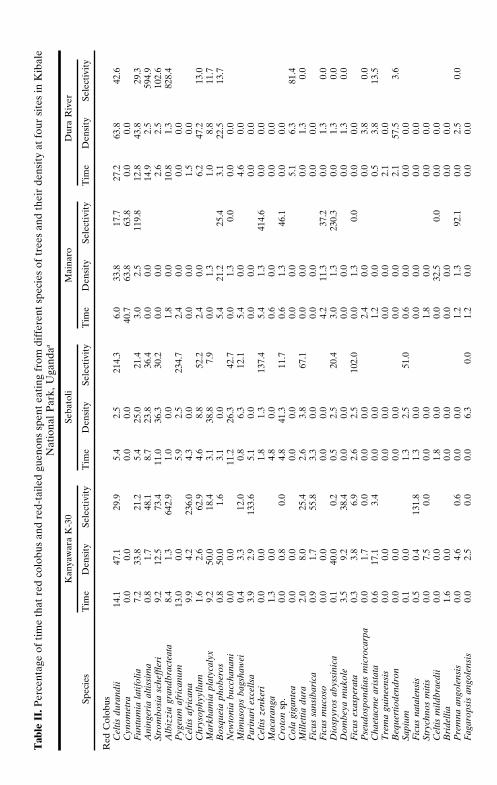
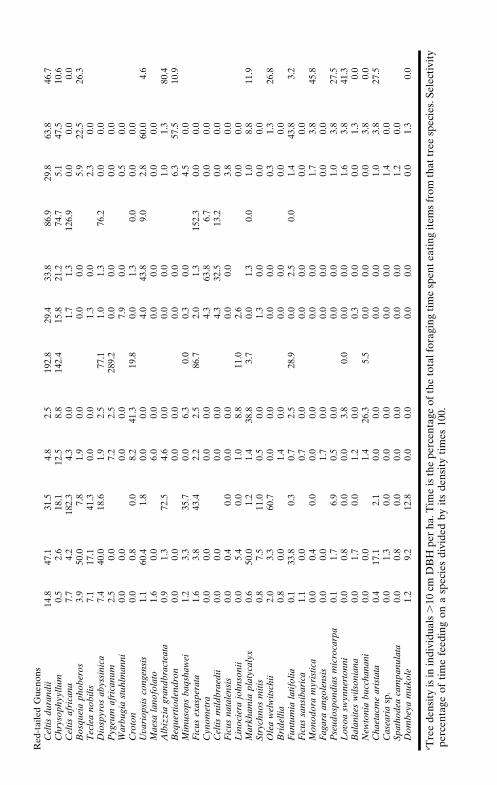
to specific species (Table II). In many cases, it can be attributed to differ-ences in the relative abundance of tree species among different sites; how-ever, in some cases this is not the case. For example, red-tailed guenonsat Kanyawara fed extensively on the fruits of Mimusops bagshawei (1.2%of their foraging time), but they did not eat them at Sebatoli, despite thefact that the tree is almost twice as abundant at Sebatoli than at Kanyawara.As might be expected, the use of particular plants varied over time. Muchof the variation is likely due to changes in the availability of food items,which corresponds to the phenology of the plant species being eaten or tothe availability of other preferred items (Chapman et al., 1999).
For red-tailed guenons the average monthly density of trees bearingfood items ranged among sites from 19.6 to 67.3 trees/ha (average � 48.1trees/ha). The logged site (Sebatoli) had a significantly lower density offood trees than all the other sites (F � 7.81, P � 0.001, Scheffe P � 0.01for Dura River and Kanyawara, and P � 0.10 for Mainaro). For red colobus,the range in average monthly density of food trees is not as extreme asthat of red-tailed guenons (45–79 trees/ha, average 66.6 tree/ha); however,Sebatoli again had a lower density of food trees than that of Kanyawara(F � 3.62, P � 0.019, Scheffe P � 0.05).
The average rate of travel for red-tailed guenons is was 32 m per hour,and there was little intersite variation, with the exception that they traveledmarginally less at Dura River than at Kanyawara (F � 2.83, P � 0.051,Scheffe P � 0.079). The average rate of travel for red colobus was 41 mper hour, at Mainaro they traveled more than at either Dura River or
Tab
leII
.Per
cent
age
ofti
me
that
red
colo
bus
and
red-
taile
dgu
enon
ssp
ent
eati
ngfr
omdi
ffer
ent
spec
ies
oftr
ees
and
thei
rde
nsit
yat
four
site
sin
Kib
ale
Nat
iona
lP
ark,
Uga
ndaa
Kan
yaw
ara
K-3
0Se
bato
liM
aina
roD
ura
Riv
er
Spec
ies
Tim
eD
ensi
tySe
lect
ivit
yT
ime
Den
sity
Sele
ctiv
ity
Tim
eD
ensi
tySe
lect
ivit
yT
ime
Den
sity
Sele
ctiv
ity
Red
Col
obus
Cel
tisdu
rand
ii14
.147
.129
.95.
42.
521
4.3
6.0
33.8
17.7
27.2
63.8
42.6
Cyn
omet
ra0.
00.
00.
00.
040
.763
.863
.80.
00.
0F
untu
mia
latif
olia
7.2
33.8
21.2
5.4
25.0
21.4
3.0
2.5
119.
812
.843
.829
.3A
ning
eria
altis
sim
a0.
81.
748
.18.
723
.836
.40.
00.
014
.92.
559
4.9
Stro
mbo
sia
sche
ffler
i9.
212
.573
.411
.036
.330
.20.
00.
02.
62.
510
2.6
Alb
izzi
agr
andb
ract
eata
8.4
1.3
642.
91.
00.
01.
80.
010
.81.
382
8.4
Pyg
eum
afri
canu
m13
.00.
05.
92.
523
4.7
2.4
0.0
0.0
0.0
Cel
tisaf
rica
na9.
94.
223
6.0
4.3
0.0
0.0
0.0
1.5
0.0
Chr
ysop
hyyl
lum
1.6
2.6
62.9
4.6
8.8
52.2
2.4
0.0
6.2
47.2
13.0
Mar
kham
iapl
atyc
alyx
9.2
50.0
18.4
3.1
38.8
7.9
0.0
1.3
1.0
8.8
11.7
Bos
quei
aph
ober
os0.
850
.01.
63.
10.
05.
421
.225
.43.
122
.513
.7N
ewto
nia
bucc
hana
ni0.
00.
011
.226
.342
.70.
01.
30.
00.
00.
0M
imus
ops
bags
haw
ei0.
43.
312
.00.
86.
312
.15.
40.
04.
60.
0P
arin
ari
exce
llsa
3.9
2.9
133.
65.
10.
00.
00.
00.
00.
0C
eltis
zenk
eri
0.0
0.0
1.8
1.3
137.
45.
41.
341
4.6
0.0
0.0
Mac
aran
ga1.
30.
04.
80.
00.
60.
00.
00.
0C
roto
nsp
.0.
00.
80.
04.
841
.311
.70.
61.
346
.10.
00.
0C
ola
giga
ntea
0.0
0.0
0.0
0.0
0.0
0.0
5.1
6.3
81.4
Mill
ettia
dura
2.0
8.0
25.4
2.6
3.8
67.1
0.0
0.0
0.0
1.3
0.0
Fic
ussa
nsib
aric
a0.
91.
755
.83.
30.
00.
00.
00.
00.
0F
icus
muc
oso
0.0
0.0
0.0
0.0
4.2
11.3
37.2
0.0
1.3
0.0
Dio
spyr
osab
yssi
nica
0.1
40.0
0.2
0.5
2.5
20.4
3.0
1.3
230.
30.
01.
30.
0D
ombe
yam
ukol
e3.
59.
238
.40.
00.
00.
00.
00.
01.
30.
0F
icus
exas
pera
ta0.
33.
86.
92.
62.
510
2.0
0.0
1.3
0.0
0.0
0.0
Pse
udos
pond
ias
mic
roca
rpa
0.0
1.7
0.0
0.0
0.0
2.4
0.0
0.0
3.8
0.0
Cha
etac
me
aris
tata
0.6
17.1
3.4
0.0
0.0
1.2
0.0
0.5
3.8
13.5
Tre
ma
guin
eens
is0.
00.
00.
00.
00.
00.
02.
10.
0B
eque
rtio
dend
ron
0.0
0.0
0.0
0.0
0.0
0.0
2.1
57.5
3.6
Sapi
um0.
10.
01.
32.
551
.00.
60.
00.
00.
0F
icus
nata
lens
is0.
50.
413
1.8
1.3
0.0
0.0
0.0
0.0
0.0
Stry
chno
sm
itis
0.0
7.5
0.0
0.0
0.0
1.8
0.0
0.0
0.0
Cel
tism
ildbr
aedi
i0.
00.
01.
80.
00.
032
.50.
00.
00.
0B
ride
llia
1.6
0.0
0.0
0.0
0.0
0.0
0.0
0.0
Pre
mna
ango
lens
is0.
04.
60.
60.
00.
01.
21.
392
.10.
02.
50.
0F
agar
opsi
san
gole
nsis
0.0
2.5
0.0
0.0
6.3
0.0
1.2
0.0
0.0
0.0
Red
-tai
led
Gue
nons
Cel
tisdu
rand
ii14
.847
.131
.54.
82.
519
2.8
29.4
33.8
86.9
29.8
63.8
46.7
Chr
ysop
hyyl
lum
0.5
2.6
18.1
12.5
8.8
142.
415
.821
.274
.75.
147
.510
.6C
eltis
afri
cana
7.7
4.2
182.
34.
30.
01.
71.
312
6.9
0.0
0.0
0.0
Bos
quei
aph
ober
os3.
950
.07.
81.
90.
00.
00.
05.
922
.526
.3T
ecle
ano
bilis
7.1
17.1
41.3
0.0
0.0
1.3
0.0
2.3
0.0
Dio
spyr
osab
yssi
nica
7.4
40.0
18.6
1.9
2.5
77.1
1.0
1.3
76.2
0.0
0.0
Pyg
eum
afri
canu
m2.
50.
07.
22.
528
9.2
0.0
0.0
0.0
0.0
War
bugi
ast
uhlm
anni
0.0
0.0
0.0
0.0
7.9
0.0
0.5
0.0
Cro
ton
0.0
0.8
0.0
8.2
41.3
19.8
0.0
1.3
0.0
0.0
0.0
Uva
riop
sis
cong
ensi
s1.
160
.41.
80.
00.
04.
043
.89.
02.
860
.04.
6M
aesa
lano
fola
to1.
60.
06.
00.
00.
00.
00.
00.
0A
lbiz
zia
gran
dbra
ctea
ta0.
91.
372
.54.
60.
00.
00.
01.
01.
380
.4B
eque
rtio
dend
ron
0.0
0.0
0.0
0.0
0.0
0.0
6.3
57.5
10.9
Mim
usop
sba
qsha
wei
1.2
3.3
35.7
0.0
6.3
0.0
0.3
0.0
4.5
0.0
Fic
usex
aspe
rata
1.6
3.8
43.4
2.2
2.5
86.7
2.0
1.3
152.
30.
00.
0C
ynom
etra
0.0
0.0
0.0
0.0
4.3
63.8
6.7
0.0
0.0
Cel
tism
ildbr
aedi
i0.
00.
00.
00.
04.
332
.513
.20.
00.
0F
icus
nata
lens
is0.
00.
40.
00.
00.
00.
00.
03.
80.
0L
inoc
iera
john
soni
i0.
05.
40.
01.
08.
811
.02.
60.
00.
0M
arkh
amia
plat
ycal
yx0.
650
.01.
21.
438
.83.
70.
01.
30.
01.
08.
811
.9St
rych
nos
miti
s0.
87.
511
.00.
50.
01.
30.
00.
00.
0O
lea
wel
wits
chii
2.0
3.3
60.7
0.0
0.0
0.0
0.0
0.3
1.3
26.8
Bri
delli
a0.
80.
01.
40.
00.
00.
00.
00.
0F
untu
mia
latif
olia
0.1
33.8
0.3
0.7
2.5
28.9
0.0
2.5
0.0
1.4
43.8
3.2
Fic
ussa
nsib
aric
a1.
10.
00.
70.
00.
00.
00.
00.
0M
onod
ora
myr
istic
a0.
00.
40.
00.
00.
00.
00.
01.
73.
845
.8F
agar
aan
gole
nsis
0.0
0.0
1.7
0.0
0.0
0.0
0.0
0.0
Pse
udos
pond
ias
mic
roca
rpa
0.1
1.7
6.9
0.5
0.0
0.0
0.0
1.0
3.8
27.5
Lov
oasw
ynne
rton
ni0.
00.
80.
00.
03.
80.
00.
00.
01.
63.
841
.3B
alan
ites
wils
onia
na0.
01.
70.
01.
20.
00.
30.
00.
01.
30.
0N
ewto
nia
bucc
hana
ni0.
00.
01.
426
.35.
50.
00.
00.
03.
80.
0C
haet
acm
ear
ista
ta0.
417
.12.
10.
00.
00.
00.
01.
03.
827
.5C
asea
ria
sp.
0.0
1.3
0.0
0.0
0.0
0.0
0.0
1.4
0.0
Spat
hode
aca
mpa
nula
ta0.
00.
80.
00.
00.
00.
00.
01.
20.
0D
ombe
yam
ukol
e1.
29.
212
.80.
00.
00.
00.
00.
01.
30.
0
a Tre
ede
nsit
yis
inin
divi
dual
s�
10cm
DB
Hpe
rha
.Tim
eis
the
perc
enta
geof
the
tota
lfor
agin
gti
me
spen
teat
ing
item
sfr
omth
attr
eesp
ecie
s.Se
lect
ivit
ype
rcen
tage
ofti
me
feed
ing
ona
spec
ies
divi
ded
byit
sde
nsit
yti
mes
100.
578 Chapman and Chapman
Sebatoli (F � 3.80, P � 0.021, Scheffe P �0.05). At Mainaro, when redcolobus were not feeding on Cynometra alexandri, they had to travel longdistances among feeding sites because food trees were widely dispersedwithin the monodominant stand of Cynometra.
Across the four sites, we counted 28 red colobus groups and 16 red-tailed groups. The number of groups that could be accurately counted ateach site depended on the density of the monkeys and the ease of countingthem. For red colobus, the average group size varied from 14 at Sebatolito 40 at Kanyawara. For red-tailed guenons group size varied among sitesfrom 11 at Sebatoli to 24 at Mainaro.
Relationship between Group Size and Density of Food Trees
For species with stable grouping patterns a major problem when testingthe ecological constraints model is the difficulty of relating changes in groupsize to changes in ecological conditions because of the long time frameinvolved. We attempted to circumvent this problem by conducting a 2-yearstudy at four locations and exploiting interdemic variation. However, weare still limited in the strength of the test we can employ because we onlyhave a sample size of four populations.
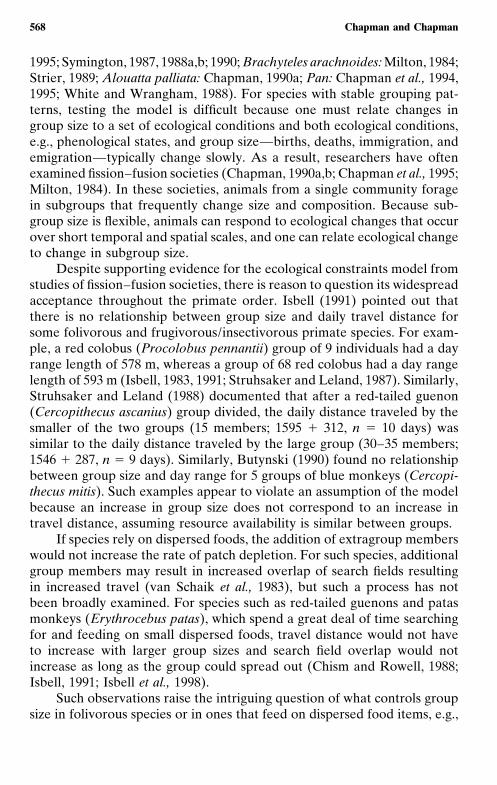
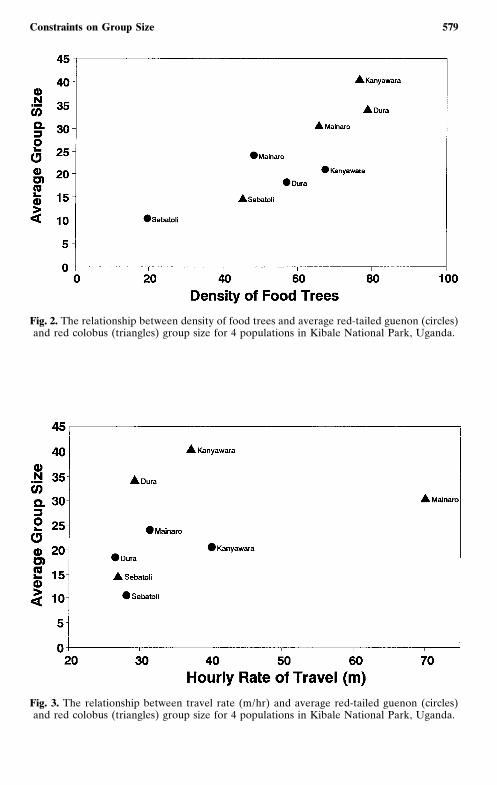
With this limitation in mind, for both red colobus and red-tailed gue-nons there seems to be a general tendency for group size to increase asthe density of potential food resources increases in an area (Fig. 2). Thereis no evidence of a relationship in either species between group size andaverage travel distance (Fig. 3).
DISCUSSION
For both red-tailed guenons and red colobus we documented consider-able variation in diet, density of food trees, rate of travel, and averagegroup size over short distances (�15 km). This variation was of the magni-tude found among populations separated by hundreds or thousands ofkilometers. This high degree of variation permitted us to make a preliminarytest of the ecological constraints model on species that differ markedly indiet. Comparisons over such small spatial scales offer a number of potentialbenefits. (1) Studies can be conducted by the same observer using the samemethodology. This eliminates the possibility that differences found amongpopulations are simply the result of differences in the methods used bydifferent observers. (2) We can control for phylogeny since contrasts canbe made within a species and among subpopulations for which there is
Constraints on Group Size 579
Fig. 2. The relationship between density of food trees and average red-tailed guenon (circles)and red colobus (triangles) group size for 4 populations in Kibale National Park, Uganda.
Fig. 3. The relationship between travel rate (m/hr) and average red-tailed guenon (circles)and red colobus (triangles) group size for 4 populations in Kibale National Park, Uganda.
580 Chapman and Chapman
potentially a high degree of genetic exchange. (3) Unmeasured ecologicalparameters, e.g., composition of the predator community, are less likely todiffer among neighboring populations than would be the case if contrastswere made among widely separated populations.
Areas with a high density of potential food resources tended to havelarger groups than areas where food resources were less abundant. How-ever, there is no evidence that group size and travel distance covaried. Thissuggests that individuals of the two species are attempting to be in the largestgroup possible, e.g., to decrease predation risk or to increase effectiveness inintergroup competition. To do this they travel to the maximum level possi-ble within the constraints of available resources. Accordingly, group sizeincreases with an increase in food availability, but travel may remain con-stant because food per individual remains the same regardless of groupsize, i.e., groups are already travelling to the maximum level possible. Futurestudies may benefit from a multiple regression approach that tests theinteractive effects of food density and travel costs. A question of interestis whether some species alter daily distance traveled, rather than groupsize, in response to changing food density.
Ours is only a preliminary examination of the applicability of theecological constraints model for the two species; however, it suggests thatthe mechanisms by which this model operates are functioning on folivores,such as red colobus, and frugivores/insectivore, such as red-tailed guenons.If further investigations suggest that the model can predict folivore andfrugivore/insectivore group sizes, then we must consider how the constraintsare operating. The ecological constraints model assumes that the additionof new members will lead to increased intragroup feeding competition. Thefactor leading to increased intragroup feeding competition can vary betweenspecies, either animals deplete the patches in which they feed or for speciesthat cannot increase group spread as group size increases, individual searchfields increasingly overlap, reducing per capita encounter rate with food,thereby increasing the area that must be searched to find food. For redcolobus, it seems unlikely that individual search fields will increasinglyoverlap as group size increases. However, red colobus may deplete foodpatches. Theoretically, a patch, or food tree, may be considered depletedwhen the feeding activity of the consumer has led to the disappearance ofall food items. However, as food items become rare within a tree, theybecome progressively harder to obtain. Thus, a patch will be functionallydepleted when the rate of food intake drops to a level equal to the averageintake in the environment (Charnov, 1976; Stephens and Krebs, 1986).
To date, the strongest evidence that red colobus do not deplete thefood patches is that previous studies in Kibale (Isbell 1983; Struhsaker andLeland 1987) indicate no relationship between group size and day range.
Constraints on Group Size 581
It is possible that the large groups could have occupied home ranges wherefood resources were more plentiful than those of smaller groups. However,some of the groups studied previously had overlapping home ranges, sug-gesting that the availability of food resources would be similar (T. T. Struh-saker, pers. comm.). In addition, the distance traveled daily by one groupfor which there were long-term observations did not change when the sizeof the group changed (T. T. Struhsaker, pers. comm.), and food tree densi-ties were similar for the groups studied by Isbell (1983) and by Struhsaker(1975) despite differences in group size and little difference in the dailydistance they traveled (Isbell, pers. comm.). In contrast, a 3-month studyin 1998 demonstrated that a group of 48 traveled significantly further eachday than a group of 24 (Gillespie, unpublished data). These conflictingresults illustrate the need for further investigation that quantifies groupsize, travel distance, and food availability and examines indirect measuresand possible social constraints of group size (Isbell, 1991; Isbell et al., 1998).
We have presented data to suggest that red colobus and red-tailedguenons will respond to an increase in the potential food resources availableto a population by increasing group size. Future studies should also considerthat changes in food availability could have other effects, such as increasingpopulation density. For example, we have previously shown that red colobuspopulation density in Kibale is related to resource availability, when oneapparently anomalous site was excluded (Chapman and Chapman, 1999).When population density increases, neighboring groups may deplete foodresources through exploitation competition. Future studies would benefitfrom taking a multiple regression approach to examine the influence ofincreasing potential food resource availability when controlling for lineareffects of population density.
Although fundamental to several models of primate social organization(Cheney, 1992; Isbell, 1991; van Schaik; 1989), there are little data onpatch depletion in folivores. Chapman (1988a) found that howlers (Alouattapalliata) generally deplete fruit patches, but found little evidence to indicatethat they depleted the trees when they were feeding on their leaves. Itappeared that howler group size may have been constrained during in-stances in which they were feeding on fruit. This howler population spentonly 49% of their time eating leaves (Chapman, 1988b). We know of nostudy on patch depletion in a species that relies more heavily on leaves.The general lack of information on patch depletion in folivores calls fordetailed studies of foraging ecology of folivores addressing questions suchas: Do folivores deplete the patches in which they feed? How should apatch for a folivore be defined? How does the ingestion of secondarycompounds affect the length of time an individual uses a patch and subse-quent group movements?
582 Chapman and Chapman
Red-tailed guenons monkeys may deplete the patches they use, oralternatively, as their group size increases individual search fields mayincreasingly overlap, reducing per capita encounter rate with food, therebyincreasing the area that must be searched to find food. Unfortunately, sincevan Schaik et al. (1983) originally proposed this pushing-forward behavioralmechanism, there has been little research done to understand if and howit operates (Barton et al., 1996; Byrne et al., 1993). This calls for furtherstudies of the ecology of species that feed on dispersed food items, whichaddress questions, such as: Does the pushing forward mechanism operateto influence group movement? Do certain classes of individuals tend to beinfluenced by this mechanism more than others, and, if so, what are theconsequences? What prevents species from increasing group spread toavoid increasing search field overlap?
ACKNOWLEDGMENTS
Funding for this research was provided by the Wildlife ConservationSociety and National Science Foundation (grant number SBR-9617664).Permission to conduct this research was given by the Office of the President,Uganda, the National Council for Science and Technology, the UgandaWildlife Authority, and the Ugandan Forest Department. We would liketo thank J. Kasenene, John Paul, April Randle, J. Micklem, and A. Katendefor help with difficult taxonomic identifications, and Tom Gillespie, LynneIsbell, Daphne Onderdonk, and Tom Struhsaker for helpful comments onthis work.
REFERENCES
Altmann, S. (1974). Baboons, space, time, and energy. Amer. Zool. 14: 221–248.Barton, R. A., Byrne, R. W., and Whiten, A. (1996). Ecology, feeding competition and social
structure in baboons. Behav. Ecol. Sociobiol. 38: 321–329.Bradbury, J. W., and Vehrencamp, S. L. (1976). Social organization and foraging in emballo-
nurid bats. II. A model for the determination of group size. Behav. Ecol. Sociobiol.1: 383–404.
Butynski, T. M. (1990). Comparative ecology of blue monkeys (Cercopithecus mitis) in high-and low-density subpopulations. Ecol. Monogr. 60: 1–26.
Byrne, R. W., Whiten, A., Henzi, S. P., and McCulloch, F. M. (1993). Nutritional constraintson mountain baboons (Papio ursinus): Implications for baboon socioecology. Behav.Ecol. Sociobiol. 33: 233–246.
Chapman, C. A. (1988a). Patch use and patch depletion by the spider and howling monkeysof Santa Rosa National Park, Costa Rica. Behaviour 105: 88–116.
Chapman, C. A. (1988b). Patterns of foraging and range use by three species of neotropicalprimates. Primates 29: 177–194.
Constraints on Group Size 583
Chapman, C. A. (1989). Ecological constraints on group size in three species of neotropicalprimates. Folia Primatol. 73: 1–9.
Chapman, C. A. (1990a). Ecological constraints on group size in three species of neotropicalprimates. Folia Primatol. 73: 1–9.
Chapman, C. A. (1990b). Association patterns of spider monkeys: The influence of ecologyand sex on social organization. Behav. Ecol. Sociobiol. 26: 409–414.
Chapman, C. A., and Chapman, L. J. (2000). Determinants of group size in social primates:The importance of travel costs. In Boinski, S. and Garber, P. (eds.), Group Movementin Social Primates and Other Animals: Patterns, Processes, and Cognitive Implications.University of Chicago Press, Chicago, pp. 24–42.
Chapman, C. A. and Chapman L. J. (1999). Implications of small scale variation in ecologicalconditions for the diet and density of red colobus monkeys. Primate 40: 215–232.
Chapman, C. A. and Chapman L. J. (1999). Forest regeneration in logged and unloggedforests of Kibale National Park, Uganda. Biotropica 29: 396–412.
Chapman, C. A., Chapman, L. J., Wrangham, R, Isabirye-Basuta, G., and Ben-David, K.(1997). Spatial and temporal variability in the structure of a tropical forest. Afr. J. Ecol.35: 287–302.
Chapman, C. A., White, F., and Wrangham, R. W. (1994). Party size in chimpanzees andbonobos: A reevaluation of theory based on two similarly forested sites. In McGrew, W.C., Marchant, L. F., and Nishida T. (eds.), Chimpanzee Cultures, Harvard UniversityPress, Cambridge, pp. 45–57.
Chapman, C. A., Wrangham, R. W., and Chapman, L. J. (1995). Ecological constraints on groupsize: An analysis of spider monkey and chimpanzee subgroups. Behav. Ecol. Sociobiol. 36:59–70.
Chapman, C. A., Wrangham, R. W., Chapman, L. J., Kennard, D. K., and Zanne, A. E.(1999). Fruit and flower phenology at two sites in Kibale National Park, Uganda. J. Trop.Ecol. 15: 189–211.
Charnov, E. L. (1976). Optimal foraging: The marginal value theorem. Theor. Pop. Biol.9: 129–136.
Cheney, D. L. (1992). Intragroup cohesion and intergroup hostility: The relation betweengrooming distributions and intergroup competition among female primates. Behav. Ecol.3: 334–345.
Chism, J., and Rowell, T. E. (1988). The natural history of patas monkeys. In Gautier-Hion,A., Bourliere, F., Gautier, J.-P., and Kingdon, J. (eds.), A Primate Radiation: Evolutionof the African Guenons. Cambridge University Press, Cambridge, pp. 412–438.
Clutton-Brock, T. T., and Harvey, P. H. (1977). Primate ecology and social organization. J.Zool., London 183: 1–39.
Dittus, W. P. J. (1979). The evolution of behaviour regulating density and age-specific sexrations in a primate population. Behaviour 69: 265–302.
Elgar, M. A. (1986). House sparrows establish foraging flocks by giving chirrup calls if theresources are divisible. Anim. Behav. 34: 169–174.
Howard, P. C. (1991). Nature Conservation in Uganda’s Tropical Forest Reserves. IUCN,Gland, Switzerland.
Isbell, L. A. (1983). Daily ranging behavior of red colobus (Colobus badius tephrosceles) inKibale Forest, Uganda. Folia Primatol. 41: 34–48.
Isbell, L. A. (1991). Contest and scramble competition: patterns of female aggression andranging behaviour among primates. Behav. Ecol. 2: 143–155.
Isbell, L. A., Pruetz, J. D., and Young, T. P. (1998). Movements of vervets (Cercopithecusaethiops) and patas monkeys (Erythrocebus patas) as estimators of food resource size,density, and distribution. Behav. Ecol. Sociobiol. 42: 123–133.
Janson, C. H. (1985). Aggressive competition and individual food consumption in wild browncapuchin monkeys (Cebus apella). Behav. Ecol. Sociobiol. 18: 125–138.
Janson, C. H. (1988). Intra-specific food competition and primate social structure: A synthesis.Behaviour 105: 1–17.
Janson, C. H., and Goldsmith, M. L. (1995). Predicting group size in primates: Foraging costsand predation risks. Behav. Ecol. 6: 326–336.
584 Chapman and Chapman
Kingston, B. (1967). Working Plan for Kibale and Itwara Central Forest Reserves. Entebbe,Uganda, Uganda Forest Department.
MacDonald, D. W. (1979). The flexible social system of the golden jackal, Canis aureus.Behav. Ecol. Sociobiol. 5: 17–38.
McDonald, D. W. (1983). The ecology of carnivore social behaviour. Nature 301: 379–384.Milton, K. (1984). Habitat, diet, and activity patterns of free-ranging woolly spider monkeys
(Brachyteles arachnoides E. Geoffroyi 1806). Int. J. Primatol. 5: 491–514.Nicholson, A. J. (1954). An outline of the dynamics of animal populations. Aust. J. Zool. 2: 9–65.Olupot, W., Chapman, C. A., Brown, C. H., and Waser, P. M. (1994). Mangabey (Cercocebus
albigena) population density, group size, and ranging: A twenty-year comparison. Amer.J. Primatol. 32: 197–205.
Osmaston H. A. (1959). Working Plan for the Kibale and Itwara Forests. Uganda Forest Dept.Entebbe, 60 p.
Pulliam H. R., and Caraco, T. (1984). Living in groups: is there an optimal group size? InKrebs, J. R., and Davis, N. (eds.), Behavioural Ecology, Sinauer, Sunderland, pp. 122–147.
Schaik, C. P. van. (1989). The ecology of social relationships amongst female primates. InStanden, V. and Foley, R. A. (eds.), Comparative Socioecology, Blackwell Press, Cam-bridge, pp. 195–218.
Schaik C. P. van, and M. A. van Noordwijk. (1988). Scramble and contest in feeding competitionamong female long-tailed macaques (Macaca fascicularis). Behaviour 105: 77–98.
Schaik C. P. van, M. A. van Noordwijk, R.J. Boer, and I. Den Tonkelaar. (1983). The effectof group size on time budgets and social behaviour in wild long-tailed macaques (Macacafascicularis). Behav. Ecol. Sociobiol. 13: 173–181.
Skorupa, J. P. (1988). The effect of selective timber harvesting on rain-forest primates inKibale Forest, Uganda. Unpublished Ph.D. Dissertation, University of California, Davis,California, USA.
Stephens, D. W., and Krebs, J. R. (1986). Foraging Theory. Princeton University Press,Princeton.
Strier, K. B. (1989). Effects of patch size on feeding associations in muriquis (Brachytelesarachnoides). Folia Primatol. 52: 70–77.
Struhsaker, T. T. (1967). Ecology of vervet monkeys (Cercopithecus aethiops) in the Masai–Amboseli Game Reserve, Kenya. Ecology 48: 891–904.
Struhsaker, T. T. (1975). The red colobus monkey. University of Chicago Press, Chicago.Struhsaker, T. T. (1980). Comparison of the behaviour and ecology of red colobus and red-
tail monkeys in the Kibale Forest, Uganda. Afr. J. Ecol. 18: 33–51.Struhsaker, T. T. (1997). Ecology of an African Rain Forest: Logging in Kibale and the Conflict
between Conservation and Exploitation. Gainesville, Florida, The University Presses ofFlorida.
Struhsaker, T. T., and Leland, L. (1987). Colobines: Infanticide by adult males. In Smuts, B.,Cheney, D. L., Seyfarth, R. M., Wrangham, R. W., and Struhsaker, T. T. (eds.), PrimateSocieties, University of Chicago Press, Chicago, pp. 83–97.
Struhsaker, T. T., and Leland, L. (1988). Group fission in red-tail monkeys (Cercopithecusascanius) in the Kibale Forest, Uganda. In Gautier-Hion, A., Bourliere, F., Gautier,J.-P., and Kingdon, J. A Primate Radiation: Evolution of the African Guenons. CambridgeUniversity Press, Cambridge, pp. 364–388.
Symington, M. M. (1987). Ecological and social correlates of party size in the black spidermonkey. Ateles paniscus chamek. Ph.D. Dissertation, Princeton, New Jersey.
Symington, M. M. (1988a). Food competition and foraging party size in the black spidermonkey (Ateles paniscus chamek). Behaviour 105: 117–134.
Symington, M. M. (1988b). Demography, ranging patterns and activity budgets of black spidermonkeys (Ateles paniscus chamek) in the Manu National Park, Peru. Amer. J. Primatol.15: 45–67.
Symington, M. M. (1990). Fission–fusion social organization in Ateles and Pan. Int. J. Primatol.11: 47–61.
Terborgh, J. (1983). Five New World Primates. Princeton University Press, Princeton.
Constraints on Group Size 585
Terborgh, J., and Janson, C. H. (1986). The socioecology of primate groups. Ann. Rev. Ecol.Syst. 17: 111–135.
Waser, P. M. (1974). Inter-group interactions in a forest monkey the mangabey Cercocebusalbigena. Ph.D. Dissertation, Rockefeller University, New York.
Waser, P. M. (1981). Sociality or territorial defense? The influence of resource renewal. Behav.Ecol. Sociobiol. 8: 231–237.
White, F. J., and Wrangham, R. W. (1988). Feeding competition and patch size in the chimpan-zee species Pan paniscus and Pan troglodytes. Behaviour 105: 148–164.
Whitten, P. (1983). Diet and dominance among female vervet monkeys (Cercopithecus aethi-ops). Amer. J. Primatol. 5: 139–159.
Wrangham, R. W., Gittleman, J. L., and Chapman, C. A. (1993). Constraints on group sizein primates and carnivores: population density and day-range as assays of exploitationcompetition. Behav. Ecol. Sociobiol. 32: 199–210.


![Mineral Resource Availability and Consumption by Colobus in …biology.mcgill.ca/faculty/chapman/articles/100_Mineral.pdf · 2014-06-10 · International Journal of Primatology [ijop]](https://img.pdfslide.us/doc/110x75/5edc7300ad6a402d66671c5b/mineral-resource-availability-and-consumption-by-colobus-in-2014-06-10-international.jpg)