Embed Size (px)
Citation preview

CONSOLIDATION OF CONCRETE WITH
EPOXY-COATED REINFORCEMENT
by
REAGAN SENTELLE HERMAN, B.S.
THESIS
Presented to the Faculty of the Graduate School
of The University of Texas at Austin
in Partial Fulfillment
of the Requirements
for the Degree of
MASTER OF SCIENCE IN ENGINEERING
The University of Texas at Austin
December, 1995


TABLE OF CONTENTS
Chapter 1 Introduction ........................................................................................ 1
1.1 The Problem ...................................................................................................... 1
1.2 Corrosion of Steel in Concrete .......................................................................... 1
1.3 Epoxy-Coated Reinforcement ........................................................................... 4
1.3.1 Damage to Epoxy-Coated Reinforcing Bars .............................................. 5
1.4 Research Objectives .......................................................................................... 8
1.5 Review of Concrete Consolidation .................................................................... 9
1.5.1 Internal Concrete Vibrators ..................................................................... 11
1.5.2 Concrete Placement Procedure ................................................................ 13
1.5.3 Undervibration versus Overvibration ...................................................... 16
1.5.4 Designing for Concrete Placement .......................................................... 17
1.5.5 Selecting an Internal Vibrator .................................................................. 19
1.6 Organization of Research ................................................................................ 20
Chapter 2 Evaluation of Epoxy Coating Damage During Concrete Placement ........................................................................... 21
2.1 General ............................................................................................................ 21
2.2 Damage to Coating Prior to Placement of Concrete ....................................... 22
2.3 Evaluation Tests of Coating Damage During Concrete Placement ................. 24
2.3.1 Test Specimens .......................................................................................... 24
2.3.2 Test Procedure .......................................................................................... 31
2.4 Test Results ..................................................................................................... 38
2.4.1 General Observations ............................................................................... 38
2.4.2 Column Specimens .................................................................................... 39
2.4.3 Footing Specimens .................................................................................... 45
viii

2.4.4 Slab Specimens ......................................................................................... 47
2.5 Discussion of Results ...................................................................................... 49
2.6 Conclusions ..................................................................................................... 55
Chapter 3 Evaluation of Consolidation During Vibration in Fresh Concrete ................................................................................. 60
3.1 Introduction ..................................................................................................... 60
3.1.1 Vibration in Concrete ............................................................................... 60
3.1.2 Mechanical Concrete Vibration ............................................................... 61
3.1.3 Key Factors in Concrete Vibration .......................................................... 62
3.1.4 Effect of Concrete Mix on Consolidation ................................................. 63
3.2 Vibration Test in Fresh Concrete .................................................................... 64
3.2.1 Test Specimens .......................................................................................... 64
3.2.2 Test Procedure .......................................................................................... 66
3.3 Test Results ..................................................................................................... 69
3.3.1 General Observations ............................................................................... 69
3.3.2 Data Recorded During Test ...................................................................... 71
3.3.3 Discussion of Results ................................................................................ 72
3.4 Conclusions ..................................................................................................... 86
Chapter 4 Evaluation of Consolidation in Hardened Concrete After Concrete Vibration ................................................................ 89
4.1 General ............................................................................................................ 89
4.2 Consolidation Test ........................................................................................... 92
4.2.1 Test Specimens .......................................................................................... 92
4.2.2 Test Procedure ........................................................................................ 101
4.2.3 Coring Schedule ..................................................................................... 104
4.3 Test Results ................................................................................................... 109
4.3.1 General Observations ............................................................................. 109
ix

x
4.3.2 Air Void Distribution .............................................................................. 111
4.3.3 Concrete Density and Void Content ....................................................... 119
4.4 Discussion of Results .................................................................................... 120
4.5 Conclusions ................................................................................................... 122
Chapter 5 Summary Conclusions, and Recommendations .......................... 124
5.1 Summary ........................................................................................................ 124
5.1.1 Damage to Epoxy Coating ...................................................................... 124
5.1.2 Measurement of Vibration in Fresh Concrete ........................................ 125
5.1.3 Evaluation of Consolidation in Hardened Concrete .............................. 126
5.2 Conclusions ................................................................................................... 126
5.3 Recommendations ......................................................................................... 128
Appendix ............................................................................................................ 130
A.1 Concrete Used in Column Damage Test ...................................................... 130
A.2 Concrete Used in Footing Damage Test ....................................................... 130
A.3 Concrete used in Slab Damage Test and Hardened Concrete
Consolidation Test ........................................................................................ 131
A.4 Concrete used in Consolidation Test in Fresh Concrete .............................. 131
Bibliography ....................................................................................................... 132
Vita ...................................................................................................................... 136

1
Chapter 1
Introduction
1.1 The Problem
Damage to reinforced concrete structures due to corrosion is an
extraordinary problem that costs millions of dollars per year in the United States
alone. Structural and civil engineers who are responsible for the design,
maintenance, and rehabilitation of reinforced concrete structures are well aware
of the serious effects of reinforcement corrosion, and several different approaches
have been used to attempt to stop, or at least slow, the process of corrosion in
concrete; the use of epoxy-coated reinforcement is one such approach.
1.2 Corrosion of Steel in Concrete
The corrosion resistance of steel in concrete would remain indefinitely if
the concrete cover around the reinforcement was able to keep all air and water
from reaching the steel.1 But, when the concrete cover is thin or porous, or if the
environment to which the concrete is exposed is severe, elements can penetrate
the concrete cover and the reinforcement may begin to corrode.
Concrete is usually a “friendly” environment for the steel. The alkalinity
of the concrete causes the steel to develop a passive condition on its surface, and
because of this passive film there is essentially no corrosion.1 Also, the high
electrical resistance of concrete makes it a low conductive electrolyte, which
limits the flow of ions required in the corrosion process. Furthermore, the high

2
calcium content of concrete’s pore solution causes mineral scales to form on the
surface of the steel, preventing the base metal from reacting with its environment.
However, the protective atmosphere of the concrete may break down due to a loss
of alkalinity in the concrete, or penetration of aggressive ions, such as chlorides,
into the concrete to the reinforcement, or a combination of both these factors. In
the absence of the protective atmosphere the steel will likely corrode, and may do
so very rapidly.
The corrosion of a metal occurs through an electrochemical mechanism.
Corrosion requires two equal and opposite reactions, involving ions and electrons,
that occur simultaneously. The two reactions are called anodic and cathodic
reactions, respectively. The process also requires an electrolyte in which the
reactions will take place, in this instance, the electrolyte is the concrete. The
anodic reaction is an oxidation reaction, in which the valence becomes more
positive as electrons are released. The cathodic reaction is a reduction reaction, in
which the valence becomes more negative as electrons are consumed.1
Chloride ions coming into contact with the reinforcing steel in concrete
lead to the formation of anodic areas. Nearby uncorroding areas of the steel act as
cathodes. Corrosion takes place at the anode where a typical reaction for steel is:
Fe Fe e→ ++ −2 2
Electrons are produced in this reaction and the iron ion goes into solution.
At the cathode, a typical reaction is:

3
12
0 2 22 2O H e OH+ + →− −( )
Electrons generated by the anodic reaction are consumed in this reaction. The
OH- ions produced in the cathodic reaction will react with the iron ion produced
in the anodic reaction to form corrosion products.
A schematic representation of the corrosion process for a single steel bar
in concrete is shown in Figure 1.1.
Figure 1.1: Corrosion Cell in Reinforced Concrete
In an actual reinforced concrete structure, reinforcing bars in one area may act as
the anode in a corrosion reaction while bars elsewhere serve as the cathode.
The overall chemical reaction that occurs for corrosion of steel in concrete
is as follows:
4
Fe O H O Fe OH Fe OH+ + → + →+ −12
22 22
2( ) ( )
The iron hydroxide that forms is insoluble, and subsequently builds up to form the
reddish product commonly know as rust. This rust takes up more space than the
original non-corroded steel, resulting in the creation of expansive forces within
the concrete. The relatively weak tensile strength of the concrete is not enough to
restrain the level of induced stresses, and hence concrete cracking and spalling
results. The new cracks in the concrete allow more chloride ions to penetrate,
aggravating the existing corrosion problem.
1.3 Epoxy-Coated Reinforcement
In the search for an effective method to cope with the corrosion of steel in
concrete, the use of reinforcing bars covered with a barrier type coating emerged
as a promising solution. Fusion bonded-epoxy-coated reinforcement is designed
to resist corrosion when concrete cracking permits chlorides to reach the steel.
The epoxy is usually a bisphenol-amine formulation deposited as a powder on the
heated bars at a temperature near 400°F.2 The epoxy cures on the surface of the
reinforcement, forming a protective layer over the bar.
Epoxy-coated reinforcing steels have been in use since the mid 1970’s,
and their performance on several highway projects has been good. Compared to
black (uncoated) reinforcing bars, the epoxy-coated steels have shown less
corrosion, and, subsequently, less corrosion related damage. However, it has
been shown in laboratory tests and field studies that epoxy coatings will not
completely stop the process of corrosion. In fact, reports on bridges with epoxy-
coated reinforcement in the Florida Keys have reported that the coated steels

5
performed as poorly as uncoated bars and that the presence of the coating was not
helpful in resisting corrosion.3 It is apparent that more research is required to
understand under what circumstances and conditions epoxy-coated reinforcement
serves as a positive aid in the prevention of corrosion.
1.3.1 Damage to Epoxy-Coated Reinforcing Bars
One aspect of epoxy-coated reinforcement that has been shown to be
critical in determining how well it will perform is the number of defects in the
coating. In previous testing at the University of Texas, the level of damage to the
coating has been shown to govern the resistance to corrosion.4 The larger the
areas damaged and the percentage of damage on the surface of the bar, the higher
the rate of corrosion. Subsequently, an investigation was begun into the damage a
typical epoxy-coated reinforcing bar receives during its life: from defects arising
from the coating process, to those obtained during handling, storage, and
transportation, and finally to defects resulting from fabrication and placing. The
results of this investigation are reported in references 4 and 5.
Concrete placement is the last possible procedure during which the
coating on reinforcement will be damaged before the rebar is put into service.
Any damage during concrete placement cannot be seen nor repaired. Figure 1.2
shows the epoxy-coated reinforcing cage of a precast element bounded by metal
formwork, and the same element in the midst of the concrete placement
procedure.

6
a) Precast Element Reinforced with Epoxy-Coated Steel
b) Vibration of Concrete in Precast Element
Figure 1.2: Concrete Placement Procedure in Precast Pier Cap

7
During consolidation the steel vibrator head used to consolidate the concrete
contacts the coated rebar repeatedly. The head rebounds from the metal walls of
the formwork and violently contacts the rebar. Since the extent of coating
damage resulting from procedures of this sort was not known, but was likely
significant, an initial investigation of damage due to vibration was undertaken.
The initial damage investigation showed that a significant amount of
damage was done to the epoxy coating on reinforcing bars during the placement
of concrete. When the steel head vibrator used to consolidate the concrete came
into contact with the coating, substantial amounts of damage resulted. As a result
of this finding, a more detailed study of concrete vibrators used with epoxy coated
reinforcing bars was scheduled.
Earlier work on this project showed further that corrosion activity is of
great concern at locations where damaged spots are adjacent to voids in the
concrete. Wetting and drying of voids, as well as the concentration of oxygen and
chlorides in voids, promote corrosion at damaged spots on the coated bars. When
a damaged spot is exposed to corrosive agents, the localized area of steel cannot
passivate, and the process of corrosion will progress. Especially at larger
damaged spots on the bottom of a coated bar where voids are adjacent to the
surface, localized corrosion may be extensive. Since the degree and quality of
concrete consolidation determine the void content of the concrete, the
consolidating ability of concrete vibrators was another factor of great interest in
this study. Concrete consolidation, particularly in the area surrounding
reinforcement, has been shown to play a significant role in the corrosion
performance of coated bars, so the ability of the new rubber vibrator heads to

8
adequately consolidate concrete specimens and remove as many air pockets as
possible required investigation.
1.4 Research Objectives
Based on the amount of damage that resulted from the use of steel head
vibrators with epoxy-coated reinforcement, it was decided that damage tests be
conducted on new “soft” (rubber) head vibrators. Promotional literature for soft
head vibrators indicated that they will “not damage epoxy coatings.”6
Furthermore, the soft head was reported to be more “effective” than the steel
head. Preliminary results of this project had shown that the amount of damage to
the epoxy coating and the quality of concrete consolidation, particularly that
around the reinforcing bars, were both important factors in determining how well
the epoxy-coated reinforcement would perform. Accordingly, the performance of
the soft head vibrator with respect to both coating damage and consolidation was
examined in the current investigation.
The specific objectives of this testing are as follows:
1) Assess the damage introduced to epoxy coated reinforcing bars by
metallic head and rubber head vibrators through a visual examination of
the bars.
2) Assess the quality of consolidation obtained with a rubber head vibrator
as compared to a metallic head vibrator based on measurements in fresh
concrete during vibration.
9
3) Determine the degree and quality of consolidation obtained with the
rubber head vibrator as compared to metallic head vibrator through both a
visual examination and density of cores from vibrated specimens.
4) Make recommendations on the appropriate type of internal vibrator to be
used in conjunction with epoxy-coated reinforcement.
1.5 Review of Concrete Consolidation
Fresh concrete may contain as much as 20% entrapped air after initial
placement into the forms. The precise amount of entrapped air will vary with
concrete workability and slump, form configuration, amount of reinforcement,
and the method of concrete placement.7,8 If the concrete is allowed to harden
without removing the entrapped air, the concrete will be nonuniform and will
have a high permeability. Furthermore, the concrete will be weak and poorly
bonded to the reinforcing steel. In order for the concrete to develop acceptable
properties and performance in service, the freshly placed concrete must be
consolidated. Consolidation, or compaction, is the process of removing entrapped
air from freshly placed concrete. By consolidating the concrete, the entrapped air
is driven out and the concrete’s permeability is decreased. Better consolidation
has also been shown to increase the strength of the bond between the
reinforcement and the concrete, and the overall strength of the concrete.7 Poor
consolidation can lead to frost damage and reinforcement corrosion as aggressive
matters, such as water and chlorides, penetrate the concrete.9 Thus, achieving
well consolidated concrete is important both in limiting negative characteristics,
and increasing positive aspects of the concrete’s performance.
10
There are manual and mechanical methods available to consolidate a
concrete mixture, but the approach of interest in this report is the use of concrete
vibrators. A concrete vibrator delivers a fast oscillatory motion to the fresh
concrete. The oscillation is essentially a simple harmonic motion, and is
commonly described in terms of a frequency (oscillations or vibrations per unit
time) and an amplitude (deviation from point of rest). Acceleration is another
useful measure, giving the intensity of vibration in the concrete.7
Vibration of concrete involves subjecting the fresh concrete to rapid
impulses which liquify the mortar and reduce internal friction among the
concrete’s components.7,10 As the vibrator moves the particles within its area of
influence, the entrapped air bubbles rise to the surface and escape. During
vibration, the freshly placed concrete becomes unstable and seeks a denser, lower
energy level. Subsequently, the mounds or piles of concrete will flatten out as the
concrete flows away from the vibrator and out into the form.
In it’s liquified state the concrete can move through the reinforcing cage
and into crevices in the formwork. Large void areas are eliminated as the
concrete spreads out into the available space. Additionally, while the concrete is
flowable, the entrapped air bubbles in the concrete are able to rise to the surface
as the liquified concrete offers less resistance to their escape. The larger air
bubbles will escape first, due to their greater buoyancy. Also, the air bubbles
nearer to the vibrator will be removed before those on the fringes of the vibrator’s
area of influence. The deaeration of the concrete continues as the concrete is
vibrated, even after the concrete flattens out.11 If the vibrator is removed from the
concrete too quickly, the smaller air bubbles will not have enough time to rise to
the surface of the concrete and escape. Vibration should continue until most of

11
the entrapped air is removed from the concrete. The final amount of entrapped air
drops from about 20% prior to vibration to 1 to 3% after adequate consolidation.
1.5.1 Internal Concrete Vibrators
The most common type of concrete vibrator is the internal (spud or poker)
vibrator. All internal vibrators used today are of the rotary type which means the
vibrating head follows an orbital path due to the eccentric, or unbalanced, weight
in the head of the vibrator. The concrete vibrators used most often are of the
flexible shaft type. This vibrator has a vibrating head attached to a flexible shaft,
which is powered by an electric or pneumatic motor, or by a portable combustion
engine. Figure 1.3 shows a flexible shaft vibrator being used to consolidate
concrete in a bridge deck.
Figure 1.3: Consolidation of Concrete in Bridge Deck
12
In the electric vibrator, the flexible drive shaft leads from the motor to the
head of the vibrator where it turns the eccentric weight. The frequency of the
vibrator affects the amount of time required to satisfactorily complete the
consolidation of the concrete. With an electric vibrator, the frequency is
controlled by the voltage of the motor. The frequency should be checked
periodically to ensure optimum operating performance of a particular piece of
equipment.7
In the past, the frequencies of concrete vibrators were much lower,
requiring extended periods of time to vibrate the concrete. To compact concrete
with a 1/2 in slump takes 90 seconds at 4,000 vibrations per minute (vpm), 45
seconds at 5,000 vpm, and 25 seconds at 6,000 vpm. But with a modern vibrator
having a frequency of 15,000 it takes only 5 to 15 seconds of vibration time to
adequately consolidate the concrete. Internal vibrators in common use today have
a frequency between 12,000 vpm and 17,000 vpm in air. This frequency is
reduced by about 20% when the vibrator is immersed in concrete.7
When an internal vibrator is inserted in fresh concrete, a definite area of
concrete around the point of insertion is affected. The zone of concrete around
the head that is adequately consolidated during vibration is called the area of
influence of the vibrator, as shown in Figure 1.4. The area of influence is also
referred to as the area of action, or circle of action. The radius of action of a
vibrator is the distance from the vibrator head within which the concrete is
consolidated.8
The radius of action of a vibrator is affected by the amplitude, frequency,
and head size of the vibrator, as well as properties of the concrete, such as its

13
slump and mix proportions.7,12 A specific vibrator’s reported radius of action is
an approximate guideline, but the actual radius of action in a specific batch of
concrete will be affected by the resistance of that concrete to movement and its
mix proportions, as well as the way in which the reinforcement is laid out.
Figure 1.4: Area of Influence for Concrete Vibrator
1.5.2 Concrete Placement Procedure
During concrete placement, the concrete should be placed in layers, as
close as possible to its final position in the form. The depth of each layer should
be limited to ensure that it can be properly consolidated. The Texas Department

14
of Transportation Standard Specifications for Construction of Highways, Streets
and Bridges requires that each layer of concrete be less than 0.9 m (36”) in
depth.13 The ACI Guide for Consolidation of Concrete suggests a more stringent
limitation of 500 mm (20”) as the maximum layer depth.7 In general, the layer
depth should be nearly equal to the length of the vibrator head. The concrete
layers should be as level as possible to minimize lateral movement of the
concrete, as this may lead to segregation. Minor leveling of the concrete can be
accomplished by placing the vibrator in the center of high spots to flatten them
out.
In a proper vibration procedure, the vibrator is inserted vertically in the
concrete at regularly spaced intervals. The distance between points of insertion
should be about 1 times the radius of action of the vibrator, so that the area of
influence of adjacent areas overlap several centimeters (a few inches) as shown in
Figure 1.5. The overlapping of the areas of influence ensure that all of the
concrete, including the area adjacent to the form, is vibrated.7
1 2
As discussed, the concrete should be placed in layers into the formwork.
If placement is proceeding properly, the vibrator should penetrate quickly to the
bottom of the layer and at least 6” into the layer below. The vibrator is moved up
and down for 5 to 15 seconds to vibrate the freshly placed concrete, and to blend
the new concrete with underlying layers. The down motion of the vibrator should
be a rapid drop into the concrete to apply force to the concrete and release internal
pressure. The vibrator will initially flatten out any mounds of concrete and
liquify the concrete. Continued vibration will allow the entrapped air bubbles to
escape, see Figure 1.6. The larger air bubbles will escape first, due to their

15
greater buoyancy. Also, the air bubbles nearer to the vibrator will be removed
before those on the fringes of the vibrator’s area of influence.7
Figure 1.5: Overlap of Areas of Influence
After the concrete has been vibrated sufficiently, the vibrator should be
removed gradually in a series of up and down motions. When the head is only
partly immersed in the concrete, it should be quickly extracted to avoid
segregation at the surface. The concrete should flow back into the open space left
by the head, but in a stiff mix the hole may not completely close after withdrawal
of the vibrator. If this is the case, inserting the vibrator several centimeters (a few
inches) away from the hole will likely solve the problem. If this procedure does
not eliminate the hole, the mix design and/or vibrator should be changed.7

16
Figure 1.6: Action of Internal Vibrator8
1.5.3 Undervibration versus Overvibration
A key point in the use of a concrete vibrator is vibrating the concrete long
enough to ensure that it is adequately consolidated. Inexperienced vibrator
operators tend to undervibrate concrete.7,14 They vibrate long enough to flatten
the concrete out, but not long enough to deaerate the concrete. Furthermore,
efforts to keep up with the pace of concrete placement can result in an operator
moving quickly and not allowing enough time for the entrapped air to be removed
from the concrete.
The operator can determine when the concrete has been vibrated
sufficiently by watching the surface of the concrete. After the initial flattening of
the concrete, large air bubbles can be seen escaping from the surface of the

17
concrete. This escape of air bubbles will continue as the operator keeps vibrating
the concrete. After the coarse aggregate has been embedded and a thin film of
mortar develops on the top surface, and when no more large air bubbles rise to the
surface, the concrete has been adequately consolidated. Another aid experienced
operators use in judging when the concrete has been satisfactorily vibrated is the
pitch or tone of the vibrator’s motor. When the immersion vibrator is initially
inserted in the concrete, the frequency will momentarily drop, then increase,
reaching a constant frequency when the concrete has been freed of entrapped air.7
Undervibration is a far more common occurrence than is overvibration. A
well designed concrete mix is not susceptible to overvibration, so when the
quality of consolidation is in doubt, the concrete should be vibrated more. If the
mix is not well designed and if it is overvibrated, the concrete may segregate and
excessive amounts of entrained air may be lost. But, overvibration should not be
of concern unless the mix has a high slump and is improperly proportioned, or if
the vibrating equipment is grossly oversized or recklessly operated. But, in the
absence of this sort of negligence, overvibration should not be a problem.7
1.5.4 Designing for Concrete Placement
Consideration should be given to the ease with which concrete can be
placed in an element when the formwork and reinforcement of the member is
detailed. For example, to ensure adequate consolidation is possible with an
internal vibrator, obstruction free vertical access with a 4 in x 6 in minimum
opening should be available. Furthermore these openings should be spaced less
than 24 in, roughly 11 2 times the radius of action of an internal vibrator.11
Attention should be given to factors that affect the placement and consolidation of
concrete from the point of view of the constructor. The member size, and bar

18
size, location, and spacing should be critiqued based on ease of concrete
consolidation. Problem areas should be recognized by the designer and
appropriate modifications made, such as staggering splices, modifying spacing, or
grouping bars to assist the constructor in obtaining adequate consolidation. If
conditions seem to indicate the consolidation will be inadequate it may be
necessary to redesign a member or its steel, modify the concrete mix, conduct a
consolidation test, or alert the constructor that special care must be given to
ensure the member is adequately consolidated.7,9
In the design of a concrete mixture, consideration should also be given to
the placement conditions. It should be possible to readily work the concrete into
form corners and around reinforcement without segregation or excessive
bleeding. If thorough vibration is not possible in an area due to crowded
reinforcement or other obstructions, it may be advantageous to increase the slump
with admixtures to produce a flowable mix that can be consolidated under the
congested conditions. Additionally, the use of form vibration may be effective in
supplementing the consolidation in areas where internal vibration cannot, or
should not, be used.
When the concrete is not effectively vibrated, imperfections will likely
result. As presented in the Guide to Consolidation, the most serious
imperfections are honeycombs, excessive entrapped air voids or bugholes, sand
streaks, subsidence cracking, and pour lines. In this research, the presence of
excessive entrapped air voids, especially air voids beneath reinforcing bars, is of
particular interest.
19
The amount of entrapped air after vibration is affected by the vibrator
equipment and procedure, the concrete mix constituents, properties of the mix,
configuration of the form and reinforcement, as well as other factors. To reduce
air voids in the concrete, the distance between vibration insertions should be
reduced, and the amount of time at each insertion point should be increased. In
some situations, it may also be advantageous to use a more powerful vibrator.
1.5.5 Selecting an Internal Vibrator
Choosing a vibrator that can effectively consolidate concrete is the main
requirement, but there are also other features that should be considered. First, the
vibrator chosen should have an adequate radius of action and should be able to
quickly consolidate the concrete. Additionally, the vibrator should be reliable,
relatively lightweight, easy to use, and resistant to wear. Some of these features
are mutually exclusive, so it is necessary to compromise to a certain extent. The
need for compromise on desirable features becomes even greater when the use of
a rubber head vibrator is considered.
The steel head of the typical internal vibrator is very hard and is not easily
worn down by the concrete, formwork, and reinforcement it comes in contact
with during use. The rubber of the soft head vibrator, however, is obviously a
softer material, that is more readily worn by use. Subsequently, the rubber head
will need to be replaced more often than a steel head would. It is not reasonable,
however, to think of greatly increasing the rigidity of the soft head, as it is its soft
nature that makes it less damaging to epoxy-coated reinforcement.15 The
increased wear rate of the head is a tradeoff that must be made to protect the
coating of the reinforcement.

20
1.6 Organization of Research
A literature review and field visits were conducted to gather information
for this study. The phenomenon of corrosion in reinforced concrete was
reviewed, as were past studies on the performance of epoxy-coated reinforcement.
Of specific interest in this review were indications of the amount and significance
of the level of damage to the epoxy coating of the reinforcement.
Through consultation with the sponsors of this project, appropriate test
sections were chosen and damage to coating due to concrete placement with
rubber and steel vibrators was evaluated. Consolidation with the two vibrators
was assessed in both fresh and hardened concrete. A summary of the study,
conclusions, and recommendations are presented.

21
Chapter 2
Evaluation of Epoxy Coating Damage
During Concrete Placement
2.1 General
As discussed in the introduction to this report, vibration is used in the
placement of concrete to reduce the amount of entrapped air and to consolidate
the concrete in the forms and around the reinforcement. Internal or immersion
vibrators are widely used in construction. The head of the vibrator imparts energy
to the concrete, and the concrete momentarily “liquifies” and flows out into the
formwork. In its flowable state, the concrete offers less resistance to the escape
of entrapped air, and subsequently large air bubbles rise to the surface as the
concrete is vibrated. This process consolidates or densifies the concrete, with the
aim of producing good quality, relatively impermeable concrete.
During the placement and vibration of concrete, the aggregate particles
and vibrator head will, inevitably, come in contact with the epoxy-coated
reinforcement. Subsequently, damage to the coating will occur. This damage,
unlike that from transportation and handling, cannot be inspected or repaired and
may cause the coating on the reinforcement to perform poorly. In particular,
extensive damage to the coating close to the concrete surface, or damage spots
adjacent to voids in the concrete, may serve as sites for initiation of corrosion in
the concrete.

22
In an earlier study in this project, the damage that resulted when a typical
steel head concrete vibrator was used to consolidate several concrete specimens
was investigated. Significant damage resulting from the placement operation was
observed. Subsequently an investigation of new “soft” rubber head vibrators was
proposed. These rubber head concrete vibrators were advertised as doing no
damage to the epoxy coating during concrete placement, and therefore were
reported to be superior to the metal head vibrators normally used in construction.
In this chapter, an experimental study conducted to evaluate the degree of damage
caused by concrete placement with both steel and rubber head internal concrete
vibrators is summarized. Recommendations on vibrator use with coated
reinforcement are presented.
2.2 Damage to Coating Prior to Placement of Concrete
The last occasion for the coating on steel reinforcement to be damaged is
during the concrete placement procedure. Sometimes the level of damage just
prior to concrete placement is given as the condition of the in-place epoxy-coated
bar, but this neglects the last possible opportunity for damage. Damage resulting
during placement adds to any existing damage, producing the true damage
condition for the coated reinforcement.
The damaged condition of a coated bar is expressed as a percentage
measurement. The area of damaged coating in a linear foot is given as a
percentage of the total bar surface area in that foot. Thus a damaged area of 1.2
(0.19 ) in 0.3 m (a foot) of 13 mm (#4) bar would be labeled as 1%
damage, since the surface area of this bar section is 121.6 (18.85 in ).
cm2 in2
cm2 2

23
Specifications limit the permissible percentage of damage on projects where
epoxy-coated reinforcement is used.
To weigh the amount of damage during concrete placement, with respect
to prior damage, it is necessary to establish the amount of damage prior to
placement. A previous investigation done through this project located two
applicable surveys in this area. Surveys were conducted in Kentucky and Iowa to
establish the amount of damage to the coating of reinforcing bars prior to the
placement of concrete.4 In the Kentucky study, 2.3 m2 (25 ft2) areas of 16 bridge
decks were inspected. On some of the bridges, several areas were inspected to
obtain more data. In this inspection, coated bars that had been prepared with
different percentages of damage were used as an aid in cataloguing the damage.
Twelve decks had an average damage between 0.0 and 0.010%, while
three others showed average damage between 0.011 and 0.04%. The worst
damaged area on a particular deck was 0.4%. When one looks at these results it
should be remembered that field inspections of epoxy coating damage are difficult
to perform and these results cannot be viewed as precise. The biggest problem in
these field inspections is detecting damage on the undersides of bars. Therefore it
is likely that the actual damage percentage on these decks is greater than reported.
In the Iowa study, 36 bars were randomly chosen from a construction site
immediately prior to their installation as column reinforcement. The damage
estimation in this study was based on area representation cards. Each damaged
area on the bars were compared to 18 shaded rectangles ranging in area from 2.5
to 60.6 mm2 (0.0039 to 0.094 in2). The maximum percentage of damage in any

24
0.3 m (1 ft) length was 1.08% of the surface area for the 48 mm (#15) bars and
0.88% for the 35 mm (#11) bars.
These, and other, surveys show that the amount of damage prior to
placement of concrete varies considerably. The level of damage can be minimal,
if adequate care is taken during production, transportation and handling, and
construction stages. However, when improper procedures occur during any of
these stages the amount of damage may be significantly increased. At one time, it
was assumed that good practices would result in negligible levels of coating
damage, on the order of 0.1%. However, recent inspection of substructures in the
Florida Keys have shown that 1% may be a more reasonable approximation of
coating damage before concrete placement.3
2.3 Evaluation Tests of Coating Damage During Concrete Placement
2.3.1 Test Specimens
The purpose of the tests conducted in this portion of the study was to
examine and compare the damage produced during placement of concrete with
steel and rubber head concrete vibrators. Three types of test specimens were
constructed, representing sections of various reinforced concrete elements. These
elements were a column or bridge pier, a footing, and a deck slab. Two identical
forms and reinforcement cages were constructed for each type of specimen - one
for use with the metal head vibrator, and the other for the rubber head vibrator.
All reinforcement in the test specimens was epoxy-coated and had a parallel rib,
or bamboo, deformation pattern. The mix proportions of the concrete used in
each test are presented in the Appendix.

25
Column Specimens
The first pair of test specimens modeled a column or bridge pier.
Duplicate specimens were prepared. The vertical reinforcement in the columns
consisted of 36 mm (#11 bars) at 20 cm (8 in) spacing, and the stirrups were 13
mm (#4) bars, spaced at 18 cm (7 in). Additional straight segments of #4 bars
were included to simulate cross ties in the column. Figure 2.1 shows the details
of the column and Figure 2.2 shows the layout of the reinforcement in the test
specimens. Black bars, used to lift the cage from the concrete after the vibration
test, were welded near the top of the cage as shown in Figure 2.1. The epoxy-
coated reinforcement was carefully examined and the damage prior to placement
of concrete was marked. The reinforcing cages were tied with plastic coated tie
wire to minimize assembly damage.
50 mm coveron stirrupsCage supported
on uncoatedlifting bars
Form
Figure 2.1: Details of Column Specimen

26
Figure 2.2: Details of Column Reinforcement
1145
18013 mm
36 mm
uncoated lifting bar
13 mm stirrup
13 mm crosstie13 mm crosstie (only at bottom stirrup)
635
635
a) Elevation View
b) Plan View
All dimensionsare in mm

27
Footing Specimens
The second pair of test specimens modeled a bridge footing. These
specimens were each reinforced with two mats of coated bars. The top mat of
reinforcement in each specimen consisted of 13 mm (#4) bars spaced at 15 cm (6
in). The lower mat was made up of 19 mm (#6) bars spaced at 28 cm (11 in).
Figure 2.3 shows the position of the reinforcing mats in the form, and Figure 2.4
gives the layout and arrangement of the bars. All reinforcing bars in these
specimens were epoxy-coated, and all damage existing prior to the vibration test
was located and marked. Ropes were attached to both the upper and lower
reinforcing mats in each specimen during construction. These ropes were used to
pull the reinforcing mats out of the concrete after the vibration was completed.
75
130
685All dimensions
are in mm
75 75
1370
Figure 2.3: Details of Footing Specimen

28
Figure 2.4: Details of Footing Reinforcement
1220
1220
15013 mm
1220
1220
19 mm 280
a) Upper Reinforcement Mat
b) Lower Reinforcement Mat
All dimensionsare in mm

29
Deck Specimens
The final set of specimens were constructed to represent sections of
typical bridge decks. Figure 2.5 shows the position of the deck mats in the
formwork, and the layout of reinforcement in the deck specimens is presented in
Figure 2.6. As shown in the figure, half of the test section had a 10 cm (4”)
depth, while the other half was 20 cm (8”) deep. The shallow section of the test
specimen modeled conditions where a cast-in-place section with epoxy-coated
reinforcement is placed over a precast panel. The deep section of the specimen
modeled the casting situation when the bridge deck is fully cast-in-place. All
reinforcement in each of the deck specimens was epoxy-coated, and existing
damage was marked.
40
35
Form
40100
205
All dimensionsare in mm
Figure 2.5: Details of Deck Specimen

30
1370
130
610
230
Spliced 13 mm Bars
16 mm
1370
1370
230
130
13 mm
16 mm
All dimensions
are in mm
a) Upper Mat of Reinforcement
b) Lower Mat of Reinforcment
Figure 2.6: Details of Deck Reinforcement

31
2.3.2 Test Procedure
Column Vibration Test
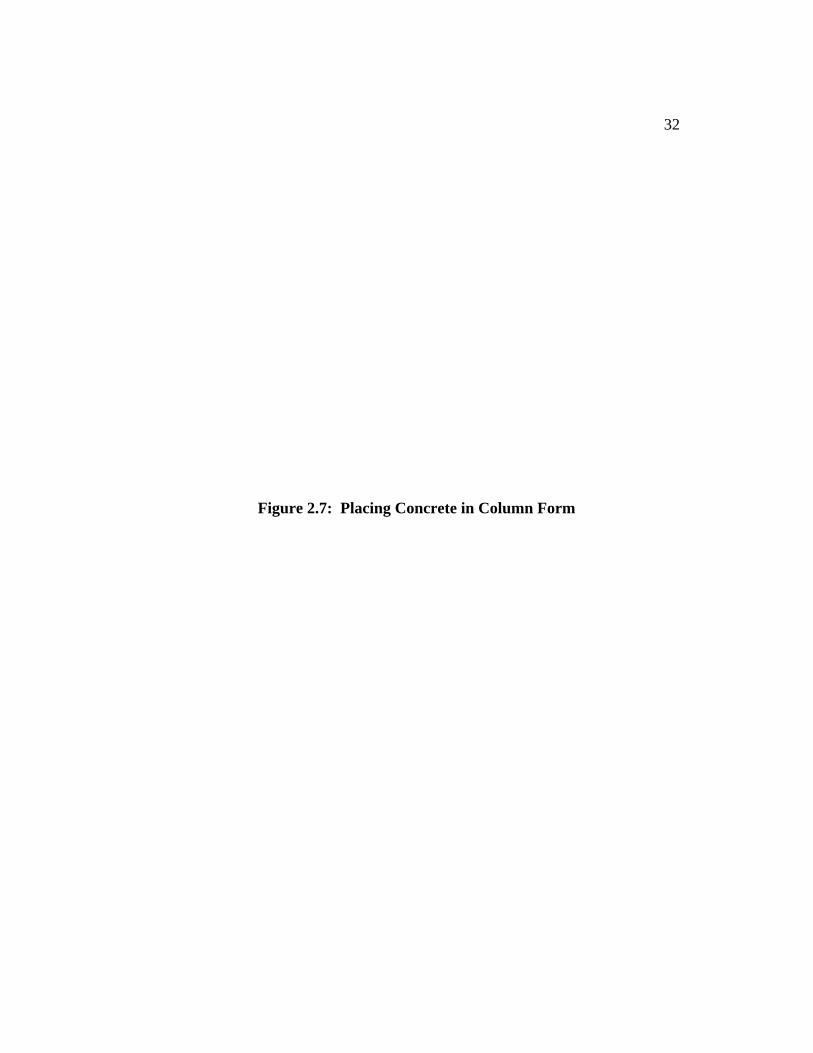
Concrete was placed in the forms directly from the ready-mix truck.
Figure 2.7 shows a picture of the concrete placement procedure. The concrete
was placed in the form in three equal lifts. . A concrete vibrator with a metal head
was used to consolidate the first specimen, and one with a rubber head was used
to vibrate the second specimen. The metal head used in the column test was 4.4
cm (1 3 4 in) in diameter and 35.5 cm (14 in) in length. The rubber head was 4.8
cm (1 7 8 in) in diameter and 35.5 cm (14 in) in length. The same model of
concrete vibrator with an electric 17 amp motor was used in each test. Flexible
shafts from the same manufacturer, each 2.1 m (7 ft) in length, were used in the
two tests.
The vibrator was inserted at sixteen points in each lift. A picture of the
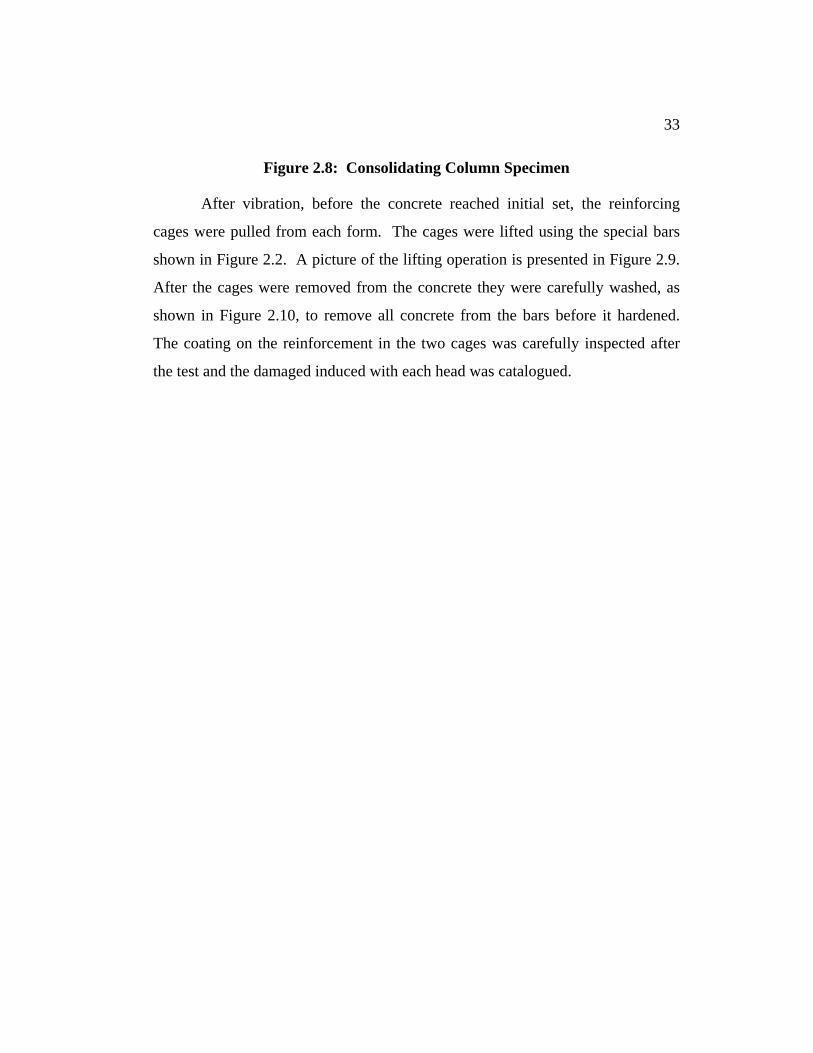
metal head specimen during vibration is shown in Figure 2.8. During each test,
the head of the vibrator was purposely inserted between the formwork and the
stirrup at eight locations to simulate the damage that results when the vibrating
head is forced to operate in a very confined area. At each insertion point the
concrete was vibrated for 4-5 seconds. The same operator consolidated the
concrete with both the metal and rubber head vibrators to eliminate differences
that might occur between operators. The same procedure and schedule of
insertion points was followed with each type of vibrator head.
32
Figure 2.7: Placing Concrete in Column Form
33
Figure 2.8: Consolidating Column Specimen
After vibration, before the concrete reached initial set, the reinforcing
cages were pulled from each form. The cages were lifted using the special bars
shown in Figure 2.2. A picture of the lifting operation is presented in Figure 2.9.
After the cages were removed from the concrete they were carefully washed, as
shown in Figure 2.10, to remove all concrete from the bars before it hardened.
The coating on the reinforcement in the two cages was carefully inspected after
the test and the damaged induced with each head was catalogued.

34
Figure 2.9: Lifting Column Reinforcement Cage from Concrete

35
Figure 2.10: Washing Column Cages after Vibration
Footing Vibration Test
Concrete was placed in each footing form directly from the ready-mix
truck, as shown in Figure 2.11. The concrete was placed in three equal lifts and
the vibrator was inserted at sixteen points in each lift. A concrete vibrator with a
metal head was used to consolidate the first specimen, and one with a rubber head
was used to vibrate the second specimen. Figure 2.12 shows a picture of the
rubber head specimen during consolidation. The metal head used in the footing
test was 4.4 cm (1 3 4 in) in diameter and the rubber head was 4.8 cm (1 7 8 in) in
diameter. Both heads were 35.5 cm (14 in) in length. The concrete was vibrated
for 4-5 seconds at each insertion point. The same operator conducted the test of
each type of vibrator head, and the same procedure was followed with each of the
heads.

36
Figure 2.11: Placing Concrete in Footing Form

37
Figure 2.12: Consolidating Footing Specimen
After vibration was completed, all reinforcing mats were pulled from the
concrete using the lifting ropes noted in the footing specimen description. Figure
2.13 shows a picture of the lifting operation. The rubber head vibrator was
inserted in each form during the lifting operation to make it easier to remove the
mats. Upon removal, each reinforcement mat was thoroughly washed with water,
as shown in Figure 2.14. After the tests, the damage on each of the mats was
inspected and catalogued.

38
Figure 2.13: Lifting Footing Reinforcement Mat from Concrete
Figure 2.14: Washing Footing Reinforcement Mat
Slab Vibration Test
Concrete was placed in the slab forms in one lift directly from the ready-
mix truck. The vibrator was inserted at thirty-six points in each slab form and the
concrete was vibrated for 4-5 seconds at each insertion point. A picture of the
vibration operation is shown in Figure 2.15. The metal head used in the slab test
was 4.4 cm (1 3 4 in) in diameter and the rubber head was 7.0 cm (2 3 4 in) in
diameter. Both heads were 22.9 cm (9 in) in length. The head of the vibrator was
purposely inserted at an angle at several points throughout each form, to closely
model typical field vibration procedures. The same operator conducted both of
the slab vibration tests and the same procedure was followed with each type of

39
head. After vibration was completed the reinforcement mats were pulled out of
the slab forms and washed with water. The coating damage on each mat was
subsequently inspected and cataloged.
Figure 2.15: Consolidating Slab Specimen
2.4 Test Results
2.4.1 General Observations
Most of the damage from concrete placement appeared to have been
caused by abrasion between the vibrator head and the reinforcing bars. Bars
located close to the edge of the form, where the vibrating head was most tightly
confined, were subject to the largest amount of damage. Abrasion of the coating

40
was seen with both the rubber and metal vibrator heads, but the severity of the
abrasions was worse with the metal head.
Some roughening of the epoxy coating was seen, particularly in the
column specimens, from contact with the concrete. Two sources probably
contributed to this damage. First, some abrasion was caused as the concrete was
placed into the form and rubbed the surface of the bars. Second, during vibration
the aggregate particles are forcefully propelled away from the vibrating head.
These particles likely mar the coating of the reinforcement as they come into
contact with it.
Damage was also seen at several locations where reinforcing bars were in
contact with each other. Particularly in the column specimens, where the stirrup
was in contact with the vertical reinforcement, there were often large damage
spots on both the stirrup and the vertical bar. This sort of contact damage was
seen in specimens consolidated with both metal and rubber head vibrators.
2.4.2 Column Specimens
Damage caused by each vibrator during the concrete placement operation
seemed to have resulted from abrasion between the vibrator head and the coated
reinforcement. Both the metal and rubber heads abraded the surface of the
coating when they came into contact with it. The areas where the head contacted
the coating were roughened. Depending on the length of time the head was in
contact with the reinforcement, and the degree to which the vibration of the head
was constrained, the condition of the coating ranged from slightly roughened to
severely abraded. Under severe conditions, the coating was completely removed
from areas of the bar. Typically, only the coating on the ribs was removed,
41
especially on the smaller diameter bars. However, there were areas where the
metal head removed the coating from the ribs and from the area between the ribs.
As previously discussed, the damaged condition of a coated bar is
expressed by a percentage measurement. The area of damaged coating in a linear
foot is given as a percentage of the total bar surface area in that foot. In the
damage inspection carried out during this study, each bar section was broken
down into 0.3 m (one foot) sections and the percentage of damage in each section
was determined. Additionally, the worst percentage of damage in a single foot of
each individual bar was evaluated. In all following discussion, the percentages of
damaged discussed refer to the percentage of damage in a 0.3 m (1 foot) length of
bar.
The total damaged area of coating on bars in the column specimen ranged
from 0.01 to 1.9% for the rubber head test specimen, and 0.01 to 6.3% for the
metal head test specimen. Figure 2.16 shows a picture of a severely damaged
area of produced with the metal vibrator head. For ease of analysis and
comparison, the bars in the reinforcing cages were divided into three types:
vertical bars, stirrups, and cross ties. The amount of damage produced on each
bar type with the two different vibrator heads was assessed, and comparisons
between the two heads were made. In general, the difference between the rubber
head and metal head vibrators was more noticeable, and significant, on stirrups
and cross-ties than on vertical bars.

42
Figure 2.16: Damage to Epoxy Coating from Metal Vibrator Head
Vertical Bars
In general, with both the metal and rubber vibrator heads, the amount of
damage to the vertical bars in the cages was relatively insignificant. The average
amount of damage was only 0.064% with the metal head and 0.052% with the
rubber head. The average damage with the metal head was about 20% greater
than that with the rubber head. The largest percentage of damage in any 0.3 m (1
ft) length was 0.21% for the metal and 0.16% for the rubber head. With the metal
vibrator head, the largest single damage spot was 6 x 13 mm (1/4 x 1/2 in). The
largest damage spot was 6 by 6 mm (1/4 x 1/4 in) with the rubber head.
The damage on the vertical column bars seemed to have been caused more
by contact between the stirrup and the vertical bars than by direct contact between
the vibrator head and the vertical bar. The side of the vertical bars facing the

43
interior of the column cage were generally damage free. There were a few small
knicks that seemed to have been caused by cursory contact with the head, but
since there was no constraint forcing the head of the vibrator to remain in contact
with the rebar, it seemed to have deflected from the bar before doing significant
damage. It is quite impossible, in fact, to even purposely force the head to remain
in contact with the vertical bar, especially as the operator continues to move the
head in the up and down vibrating motion. The head seemed to gravitate away
from the solid obstruction of the vertical reinforcement, and did no significant
damage through the momentary contact it did make. There was more, albeit
relatively minor, damage on the sides of the vertical reinforcement facing the
forms.
The outer side of the vertical bars was in contact with the stirrups
encircling the reinforcing cage. This contact with the stirrups seemed to be the
greatest source of damage for the vertical reinforcement. At many locations, the
stirrups were tightly pressed against the vertical bars. Subsequently, when the
vibrator head was inserted between the edge of the cage and the form, and the
stirrups were violently shaken, damage was produced on the vertical bars. The
stirrups rubbed against the vertical bars, removing coating from both the stirrup
and the vertical reinforcement. Damage was also produced at a few locations
where the end of the head seemed to momentarily wedge between the stirrup and
the vertical bar. For the most part, though, the damage resulting from such
contact was small and localized. Again, as on the interior of the cage, the vibrator
head contacted the vertical reinforcement less often than the horizontal, and the
resulting percentage of damage was small.
44
A final point concerning the vertical reinforcement is the impact of bar
size on the percentage of reported damage. Though there were several significant
damage spots on the bars on the order of 6 x 6 mm (1/4 x 1/4 in) with each head
type, compared to the large surface area of the vertical bars these spots were
relatively minor. Thus, the same size of damage spot was much more significant
on the 13 mm (#4) than on the 36 mm (#11) vertical bar. The size of the bars, in
addition to those factors mentioned earlier, resulted in the production of relatively
insignificant amounts of damage to the vertical bars with both the metal and
rubber head.
Stirrups
The next group of bars examined were the stirrups. Again, the metal head
produced more damage than did the rubber head. The percentage of damage for
the stirrups was much more significant than for the vertical bars. The average
percentage damage for all sections of stirrup examined was 0.96% with the metal
head and 0.30% with the rubber head. Comparing these percentages shows that
the metal head did over three times as much damage as the rubber head vibrator
did. A further comparison can be made by looking at the percentage of damage
produced on the stirrups where the vibrator head was inserted between the stirrup
and the form. The average percentage of damage on these stirrups was 1.49%
with the metal head and 0.43% with the rubber. Again, the metal head did over
three times as much damage as the rubber head. Comparing the single worse side
for the stirrups, there was 2.58% damage with the metal head and 0.43% with the
rubber. In this instance the metal head did over five times as much damage as the
rubber head.
45
The maximum size of damaged area produced with the metal head was 6 x
38 mm (1 4 x 11 2 in) in size. The largest single damage spot with the rubber
head was 6 x 13 mm (1 2 x 1 4 in). In addition to producing the largest damage
spot, the metal head also produced more large damage spots on the stirrups than
did the rubber head. Only one large 6 x 13 mm (1 4 x 1 2 in) and one 6 x 6 mm
(1 4 x 1 4 in) spot were produced with the rubber head. The rest of the rubber
head damage spots were smaller in size. The metal head, however, produced
many large damage spots. There was the one 6 x 38 mm (1 4 x 11 2 in) spot and
a 6 x 13 mm (1 4 x 1 2 in) spot, and also many 6 x 6 mm (1 4 x 1 4 in) spots. The
metal head thus not only produced greater percentages of damage, the size of
individual damage spots was on average greater than that produced with the
rubber head.
Cross Ties
Damage in the final bar group, the ones simulating cross ties in the
column, again was worse with the metal than with the rubber vibrator head. The
average percent damage was 0.64% with the metal head, almost five times the
0.13% damage with the rubber head. Comparing damage on only the 13 mm (#4)
bars, there was 0.66% with the metal and 0.12% with the rubber. For the 16 mm
(#5) bars, there was 0.59% damage with the metal and 0.15% with the rubber.
The largest damage spot produced by the metal head on the cross ties was
a spot 6 x 13 mm (1 4 x 1 2 in). The largest damage area with the rubber head
was 6 x 6 mm (1 4 x 1 4 in). As with the stirrups, the metal vibrator head
produced more and larger damage spots than did the rubber head.
46
2.4.3 Footing Specimens
Damage to the coating in the footing specimens seems to have been
caused by abrasion between the vibrator head and the reinforcement. Damage
occurred at random locations where the vibrator head struck the coated bars.
Much of the damage was simply abrasion of the surface, without exposing large
areas of the steel surface. There were locations, however, where both vibrator
heads removed coating from the surface of the steel. The most damage occurred
at centrally located interior bars with both the rubber and metal vibrator heads.
In addition to the damage done through direct contact between a vibrator
head and the coating, there was also damage that resulted from bar to bar contact.
There were numerous locations where the coating on the reinforcement was
damaged where a bar contacted another bar in the reinforcing mat.
Comparing the upper reinforcing mats, with the 13 mm (#4) bars, there
was an average of 0.19% damage with the metal head, and 0.14% with the rubber
head. For the 19 mm (#6) mats, the metal head produced an average of 0.48%
damage, while the rubber head did only 0.17% damage. The largest damage spot
on the upper reinforcing mat was 3 x 3 mm (1 8 x 1 8 in) with both the metal and
rubber vibrator heads. The largest damage spot on the lower mat was 6 x 13 mm
(1 4 x 1 2 in) with the metal head, and 3 x 3 mm (1 8 x 1 8 in) with the rubber
head. Thus, based on both the percentage of damage and size of individual
damaged areas, there was relatively little difference between the two heads for the
upper mat with the 13 mm (#4) bars, but more appreciable differences between
the damage results for the lower mat with the 19 mm (#6) bars.
47
A further comparison that can be made of the lower reinforcement mat
was the single worst damaged 0.3 m (1 ft) of bar with each type of vibrator head.
With the metal head, there was one bar that had 2.0% damage due to vibration.
The worst case with the rubber head had only 0.38% damage, less than one-fifth
of that done with the metal head. Thus on the lower mat, the metal vibrator head
produced worse damage based on the overall percentage of damage, the size of
damaged spots, and the single worst damaged 0.3 m (1 ft) length.
The location of damage on the bars in the footing specimen seemed to
vary with the location of the bar. The damage on edge bars in the upper
reinforcing mat was located mainly on the sides of the reinforcing bars, with little
damage on the top of the bars. Bars located near the interior of the mat, though,
had more damaged areas on their top surface. There were also more damaged
areas from vibrator contact on the bottom surface of interior bars than on exterior
bars. These differences probably can be attributed to the vibration procedure near
the edge of the form, versus that at the interior area. At the edge of the form, the
operator was very close to the insertion point, and the head of the vibrator could
be inserted vertically, or very nearly so. Nearer the center of the form, however,
the operator had to reach out to insert the vibrator, and subsequently the vibrator
tended to be at more of an angle upon insertion. The angle of the head made it
more likely the top of the bar would be contacted on insertion of the vibrator
head. Similarly on removal of the head, there was greater opportunity for contact
with the bottom of interior bars. Thus, more damage occurred on the tops and
bottoms of the interior bars.
For both heads, the bottom mat underwent more damage than did the
upper mat. There was relatively little difference between the damage on the 13
48
mm (#4) mats between the two types of vibrator head, but the amount of damage
produced with the metal head on the 19 mm (#6) mat was almost three times that
produced with the rubber head. Based on both the percentage of damage and size
of individual damaged areas, there was relatively little difference between the two
heads for the upper mat with the 13 mm (#4) bars, with more appreciable
differences between the damage readings for the lower mat.
As noted, with both vibrator heads, there was more damage on lower mats
than upper mats. This occurrence is possibly due to the fact that the test
specimens were relatively deep, and subsequently when the vibrator head was
immersed into the concrete to consolidate concrete in the vicinity of the lower
mat, the vibrator operator had less control over the action of the head than when
the concrete near the upper mat was vibrated.
2.4.4 Slab Specimens
Damage to the epoxy-coated reinforcement in the slab specimens seemed
to come from two main sources. First, from abrasion of the vibrator heads against
the reinforcement, and second, rubbing between places where reinforcing bars
crossed each other. Damage spots were distributed over various locations on both
the upper and lower reinforcement mats. Greater amounts of damage were seen
on the upper mat than on the lower mat.
The fact that the lower mat received less damaged than the upper mat, in
contrast to the results in the footing specimen, can probably best be attributed to
the shallow depth of the deck member. Since the two reinforcing mats of the
deck were so close together, the upper mat provided a significant degree of

49
protection to the mat below it. Particularly, when the vibrator head was dragged
through the specimen, the upper mat received most, if not all, of the abuse.
The average percentage of damage on the upper mat was 0.51% with the
metal head, over two and a half times the 0.20% damage with the rubber head.
The largest single damage spot with the metal head was 6 x 13 mm (1 4 x 1 2 in),
and the largest spot with the rubber head was 6 x 6 mm (1 4 x 1 4 in). However,
most of the damage spots on the slabs produced with each of the heads were of
smaller size, on the order of 2 x 2 mm (1 16 x 1 16 in). The vibrator heads were
purposely inserted at an angle at some locations in the slab and were dragged over
the reinforcement. However, the heads were only in contact at any one location
for 4-5 seconds. If the heads were allowed to remain on the rebars for longer
periods, larger damage spots would have been more common, but under the
testing conditions smaller size damaged areas were produced.
The bars in the lower reinforcing mat were broken into two types for
analysis. These were the spliced sections of 13 mm (# 4) bar and the 0.6 m (2 ft)
segments of 16 mm (#5) bar. The spliced bars had an average damage of 0.19%
with the metal head, and about half that, 0.10%, with the rubber head. The 16
mm (#5) bars showed average damage of 0.20% with the metal head vibrator, and
0.12% with the rubber head. The largest single damaged spot on the spliced bars
was 3 x 3 mm (1 8 x 1 8 in) with both the metal and rubber heads. The largest
spot on the 16 mm (#5) bars was 6 x 6 mm (1 4 x 1 4 in) with both the metal and
rubber vibrator heads.
As the figures above show, the average amount of damage on the lower
slab reinforcement mat was relatively small with both the metal and rubber
50
vibrator heads. The upper mat seemed to help protect the lower mat from
damage. The vibrator head contacted reinforcing bars in the upper mat more
often than those in the lower mat, especially when the head was inserted at an
angle. At several insertion points it seems the head scraped across the upper mat
without contacting the lower mat. Furthermore, when the head did penetrate to
the lower mat the extent of damage caused was less than that experienced by the
upper mat. At contact points on the lower mat, the metal head still produced more
significant damage than did the rubber head.
2.5 Discussion of Results
All three pairs of specimens showed that the vibration of concrete during
placement can produce significant damage to coated reinforcing bars. Typical
damage resulted from the abrasion of the vibrator head against the coating on the
bar. Damage also resulted at places where reinforcing bars crossed each other
and abraded each other during vibration. Vibrator damage was generally located
on the ribs since they protrude from the bar’s surface and are most readily
contacted. However, in severely damaged locations the coating was completely
removed from the surface of the ribs and from the area between them.
Coating damage was worst where the space available for the vibrator head
was limited. In confined areas, the head of the vibrator was forced to contact the
coated bars repeatedly. Contact of this sort, with both the metal and rubber
vibrator heads, removed areas of coating from the reinforcing bars. However, the
amount of coating removed was less with the rubber vibrator head than with an
equivalent metal one.

51
Combining the average damage from the three specimens for horizontal
bars (reinforcement in all test specimens except vertical bars in columns) shows
an average damage percentage of 0.64% with the metal head, and 0.22% with the
rubber head. Thus, the metal head did almost three times as much damage,
overall, as did the rubber head. If the vibrator procedure had been more careless,
or if the period of vibration was lengthened, the disparity is expected to be even
greater.
Histograms of vibrator damage with both the metal and rubber heads were
prepared to demonstrate the occurrences of different levels of damage. Only the
damage percentages for horizontal bars were included in the histograms because,
as previously discussed, the damage to the vertical bars in the column specimens
was so minor with both metal and rubber heads. Figure 2.17 shows the damage
histograms for both the metal and rubber heads. The histograms contain the
damage percentages for all 0.3 m (1 foot) horizontal bar sections from each of the
column, footing, and slab tests. Comparison of the two histograms readily reveals
that the metal head does more damage than the rubber vibrator head. With the
metal head, vibrator damage alone was greater than the current 1% total
acceptable damage limit for 6.2% of the test sections evaluated. With the rubber
head, this number dropped to 1.5%. With the metal head another 5.8% of the test
sections fell in the 0.70-0.99% damage group. With even minor levels of
fabrication, handling, and transportation damage, on the order of 0.3% or less, the
damage on these bars would exceed acceptable limits. With the rubber head
vibrator, however, only 0.39% of the test sections fell in the 0.70-0.99% damage
group.

52
If the fabrication, handling, and transportation damage was on the order of
0.3 to 0.65% another 29% of the bars vibrated with the metal head would be
unacceptable, while only an additional 5.8% of those vibrated with the rubber
head would be over the acceptable limit.
The vast majority, 92%, of test sections vibrated with the rubber head had
less than 0.35% damage. Even with up to 0.65% damage from fabrication,
transportation, and handling, these bars would still have a final damage condition
of less than 1% in their true in place condition. For the metal vibrator head, with
damage prior to vibration at levels of 0.65%, over 40% of the test sections would
have damage greater than the 1% limit, versus only 8% over this limit with the
rubber head.
A further breakdown of damage figures in the 0-0.34% range for the metal
and rubber heads is presented in Figure 2.18. As in the other figure, data for all
0.3 m (1 foot) bar sections from the three test specimens is included. The
smallest damage group, from 0-0.050% would definitely be considered negligible,
especially when field evaluation is considered. Damage of 0.050% on a 13 mm
(#4) bar is less than one 3 x 3 mm (1 8 x 1 8 in) spot in 0.3 m (one foot) of bar.
Damaged areas smaller than this size are only located through close scrutiny in a
controlled laboratory environment where the bar can be moved and rotated to aid
the inspection. In the field, damage of this order would not even be noted.

53

54
55
Damage in the next range, 0.051-0.09% is also considered negligible, in
that it is again very unlikely damaged percentages this low would even be
noticed. A damage percentage of this order equates to one 3 x 3 mm (1 8 x 1 8 in)
spot in 0.3 m (one foot) of a 13 mm (#4) bar. Again, damage as insignificant as
one small spot, or several very small spots, on a bar could easily be missed in a
field investigation. Damage in the next range, 0.10-0.19%, is still very minor, but
some of the damage might be noticed in field investigations. The area of
damaged spots producing 0.20-0.34% is small, but probably would be at least
partially noted in field studies.
Comparing the two heads, 4.2% of all (0.3 m) one foot bar sections from
the metal head specimens fell in the 0-0.050% damage range, while 11% of the
rubber head sections had this negligible level of damage. Thus, there were almost
three times as many bar sections in this very negligible category after vibration
with the rubber head as compared to that with the metal head. An additional 12%
of the metal head sections were in the 0.051-0.099% range, while 26% of the
rubber head sections fell in this group.
Examining the 0.10-0.19% damage group, 14 % of the metal head and
36% of the rubber head sections were in this category. And 28% of the metal
head, and 19% of the rubber head bars were in the final 0.20-0.34% damage
range. More bars from the metal head specimens fall in the 0.20-0.34% damage
range than from the rubber head specimens. Larger numbers of bars from the
rubber head test were grouped in the very low damage ranges than were bars from
the metal head specimens.

56
Regardless of damage prior to casting, the rubber vibrator head does less
damage to epoxy coatings during concrete placement than the metal head.
Acknowledging that contact between the vibrator head and specimen
reinforcement is inevitable, the quality of epoxy-coated reinforcement as it exists
in a cast specimen will be better if a rubber vibrator head is used instead of a
metal one.
2.6 Conclusions
The most important conclusion of the vibration damage testing is that even
if the bars reach the concrete placement stage free of damage, they may still
receive considerable damage during the placement operation. But, the use of a
rubber head concrete vibrator will result in less damage than metal head vibrators.
Close-up pictures of vibrator damage with both metal and rubber heads are shown
in Figure 2.19. As the pictures shows, the metal vibrator head has totally
removed the coating from a large area of the bar while the rubber head roughened
the coating during vibration, but only removed the coating in a few small spots.
Figure 2.20 shows two other pictures of the significant coating damage resulting
from vibration with a metal head. Whether a metal or rubber vibrator head is
used, epoxy-coated bars can be damaged through contact with the head.
However, in all instances the metal vibrator head did more damage, on average,
than did the rubber head. In some instances, the average damage produced with
the metal head was over five times that done by the rubber head.

57
a) Metal Vibrator Head

58
b) Rubber Vibrator Head
Figure 2.19: Vibration Damage to Epoxy Coating
a) Damage to Stirrup Coating

59
b) Damage to Stirrup Coating and Coated Tie
Figure 2.20: Coating Damage with Metal Vibrator Head
Based on the results of this study, damage due to concrete vibration with
metal heads was over 5% of the bar area in a 0.3 m (1 ft) length of bar at the worst
locations, while the worst single performance by the rubber head produced 1.9%
damage. On average, a metal head did almost three times the amount of damage
done by a rubber head.
The levels of damage produced with both the metal and rubber head might
seem relatively insignificant to someone not well versed in the area of epoxy-
coated reinforcement. One might question whether it is worth the extra expense
and complication in construction for just 2 or 3% less damage. Tests at the
University of Texas have shown that differences in the damage condition of
coated bars on the order of only 1% do have a significant effect on the
performance of the bars from the corrosion point of view. Thus, changing
procedures and equipment when consolidating concrete with epoxy-coated
reinforcement to include the use of rubber head vibrators is definitely warranted,
based on the expected reduction in coating damage.
Damage due to vibration can be reduced by 1) proper vibrating procedures
and training of operators, and 2) using “soft” rubber vibrator heads. The operator
must be trained to follow prescribed procedures. The vibrator should be inserted
vertically, and should not be dragged across the coated bars. The vibrator head
should be carefully inserted in the concrete and contact with coated reinforcement
should be avoided. Especially in tightly confined areas, great care should be
exercised to limit the duration and severity of contact between the head and the
coated rebar. Under no circumstances should the vibrator head purposely be

60
forced into contact with coated reinforcement. In placement operations with
uncoated bars the vibrator may be held against reinforcing bars to “rattle the
cage” and improve consolidation about the bars. This practice must not be
permitted with coated bars as the direct contact between the head and bar will
cause vibrator damage, as will rubbing between bar contact points. Furthermore
the head of the vibrator should not be inserted between the outside of column
stirrups and formwork. Not only is insertion of the vibrator head between the
stirrup and formwork bad vibrating practice in general, such actions will result in
excessive amounts of damage to the coated reinforcement.
A final recommendation for vibration of shallow, deck slab specimens
with coated reinforcement is the importance of using short, slab length vibrator
heads to consolidate the concrete. These shorter heads can be inserted vertically
in the slab, while remaining immersed in the concrete of the deck. When a longer
vibrator head is used it is necessary to insert the head at an angle or completely
horizontally to keep the vibrator head immersed in concrete. Inserting the head at
an angle or horizontally results in larger amounts of damage, as the head is
dragged over the coated bars. Properly using a slab vibrator in a vertical
orientation will minimize coating damage.
In summary, use of rubber vibrator heads will produce less damage than
similar use of metal heads. Proper use of a rubber vibrator head should result in
the least possible amount of damage to coated reinforcement during concrete
placement.

60
Chapter 3
Evaluation of Consolidation During
Vibration in Fresh Concrete
3.1 Introduction
3.1.1 Vibration in Concrete
Vibration is used in virtually all concrete construction, but usually without
a significant knowledge of the theory and mechanism behind the mechanics of
consolidation. This lack of understanding probably explains a good deal of
misuse and insufficient use of vibrating equipment in the field.
The internal concrete vibrators of interest in this report utilize a rotating
eccentric weight to deliver a vibratory force to the concrete. Vibrators of this
type generate a simple harmonic motion that can be described by a sinusoidal
wave equation. The sinusoidal oscillation is of the form:
y = s sin(ωt) = s sin(2πft)
where: s = amplitude, mm (in)
ω = angular velocity, radian/sec
f = frequency, Hz
t = time, sec

61
The first and second derivatives of this equation yield particle velocity and
acceleration, respectively. The later is of the form:
ÿ = 4π2f2s sin(2πft)
The maximum acceleration during the motion is given by 4π2f2s mm/sec2
(in/sec2).
The above equations show the relation between three significant
components of vibration: frequency, amplitude, and acceleration. Vibrators are
usually characterized by the frequency of vibration and the amplitude of
vibration.
3.1.2 Mechanical Concrete Vibration
Early in this century, concrete was generally placed in a very dry
consistency. The concrete was placed in shallow lifts, with the aid of heavy
tampers. This procedure required extensive manual labor, but generally produced
good quality concrete. But as concrete sections became smaller and the amount
of steel reinforcement was increased, it became more difficult to adequately place
very dry and stiff concrete mixes. Subsequently, the amount of water in the
mixes was increased to make them easier to place. Unfortunately, the increased
ease of placement came with a price, and that was the quality of the concrete.
The wetter mixes did not produce as good a concrete as was once obtained. The
concrete had lower strengths, increased cracking, and less durability.11
In the 1920’s the water-cement ratio concept was conceived, confirming
the observation that as the amount of water in the mix was increased, the quality

62
of the concrete decreased. It was evident that the approach of indiscriminately
adding water to the concrete to make it more placeable was not a good one. A
better approach was to find a way to adequately consolidate stiffer concrete in
smaller more congested reinforced sections. In the 1930’s, machines designed to
assist in placing concrete through the use of vibratory motion began to be
developed. In the beginning, these machines had limited frequencies and had
maintenance and design problems. But as time passed the science of concrete
vibration progressed and much work was done on the use of vibration to
consolidate concrete.11
3.1.3 Key Factors in Concrete Vibration
In the 1940’s, researchers began to articulate the key role that friction
played in the consolidation of concrete. Friction between particles in the concrete
was found to be the most important component resisting compaction efforts. It
was found that by vibrating the concrete, this friction was substantially reduced
and the concrete could be compacted.
Through the years of research, important components of vibratory action
in concrete have been highlighted. The magnitude of the acceleration produced
during vibration was found to have a primary responsibility in reducing internal
friction in the concrete. The force applied to the concrete, the amplitude of the
vibration, and the frequency of vibration were also noted as important factors
affecting consolidation.
Past research in concrete vibration has indicated that consolidation of
fresh concrete starts at an acceleration of about 0.5 g, and the compaction effort
increases linearly up to accelerations between 1 g and 4 g. The specific point at

63
which increased acceleration does not produce increased compaction is dependent
on the consistency of the concrete mix. Additionally, there is a minimum
amplitude required to consolidate the concrete. A minimum amplitude of 0.04
mm (0.0015”) was proposed in 1963 by Kolek.11
The American Concrete Institute (ACI) Committee 309 has outlined a set
of four requirements for the consolidation of fresh concrete. These are:
1. Minimum acceleration for concrete of normal consistencies 2. Minimum dynamic pressure for very stiff concrete consistencies 3. Minimum vibratory amplitude for any given mixture 4. Minimum vibratory energy for all mixtures.
In the examination of concrete vibrators, it is helpful to remember these
recommendations and to refer to them when evaluating the efficiency of a
vibrator.
3.1.4 Effect of Concrete Mix on Consolidation
In 1968, Ritchie identified three main characteristics of concrete which
had a significant affect on the ease with which it could be consolidated. These
were stability, compactibility, and mobility. Stability is defined as flow of the
fresh concrete in the absence of external forces. It can be measured by bleeding
and segregation characteristics. Compactibility is the ease with which fresh
concrete can be consolidated. Compactibility tests have been devised to see how
easy it is to expel entrapped air and to reorient the particles in the concrete in a
denser arrangement. Mobility of the concrete relates to its viscosity, cohesion,
and internal shear resistance. Mobility of a mix is affected by proportioning and
the characteristics of the different materials which make up the concrete. These

64
three parameters, stability, compactibility, and mobility, determine the suitability
of a mix for placement.
The overall workability of a mix is affected by the composition of the
mixture, and the amount of each constituent in the mix. The properties of each
ingredient of the concrete, such as particle shape, size, porosity, and surface
texture also have a significant impact on the nature of the mix. Additionally, the
presence and qualities of admixtures and the mixing of the concrete will impact
the compactibility of a given mix. The design of a concrete mix can thus have a
significant effect on concrete placement and the amount of vibration required to
adequately consolidate the concrete through choices made during mix design.
3.2 Vibration Test in Fresh Concrete
3.2.1 Test Specimens
Vibration tests were conducted in two unreinforced, freshly placed
concrete blocks. The forms used for the tests were 91 cm by 91 cm (36” by 36”)
in plan, but were of different heights. The forms had been prepared for a separate
test in which different height specimens were required. The height of the forms
was not critical in this testing since equal amounts of concrete, with a depth of 20
cm (8”), were placed in each form for vibration testing.
A wooden assembly was constructed to support two electrical receptacle
boxes from the top of the forms as shown in Figure 3.1. Each metal box was
immersed in the concrete approximately 4.5 cm (1.75”). The metal boxes were
used as a housing for small size, high sensitivity, high frequency accelerometers.
The boxes protected the accelerometers from the concrete, while permitting

65
measurement of the wave motion in the concrete during vibration. A section was
cut out on one side of each form for attachment of another receptacle box, as
shown in Figures 3.1 and 3.2. The accelerometers were attached with magnets to
the receptacle boxes during the tests.
Figure 3.1: Recording Station Locations
The two receptacle boxes suspended from the top of the formwork were
positioned at 10 cm (4”) and 20 cm (8”) respectively from the vibrator’s point of
insertion, as shown in Figure 3.2. The figure also shows the position of the
receptacle box on the side of the form. The suspended receptacle nearer to the
point of insertion is labeled Station A, the farther one is Station B, and the box
attached to the side of the form is Station C.

66
Figure 3.2: Data Station Positions
The concrete used in this test was relatively stiff with a 5 cm (2”) slump.
The specific mix design of the concrete is given in the appendix.
3.2.2 Test Procedure
Concrete was placed from an overhead bucket into each of the two forms
at the beginning of the test. The concrete was vibrated with a flexible shaft type
internal vibrator with the same electric 2.4 amp motor used in all of the vibration
tests. The same operator vibrated the concrete in each of the tests to attempt to
minimize any effect the operator might have on the results. In the first set of
tests, the concrete in the short form was vibrated with a rubber vibrator head.

67
While the concrete was being vibrated, measurements were taken with the
accelerometers at different stations and in different orientations. Figure 3.3
shows a typical accelerometer used in this test. A drawing of the accelerometer
and a list of some of its useful features are given in Figure 3.4, and accelerometer
orientations used during the testing are shown in Figure 3.5 The data acquisition
system used in this experiment could monitor only 2 channels (Figure 3.6), so it
was necessary to move the accelerometers during the test to take readings at all
desired positions. The first set of measurements were made at Stations A and B
with the accelerometers oriented horizontally. Next, the accelerometers were
oriented vertically at the same stations. The final measurements were made at
Station C, with the accelerometer oriented horizontally, and then vertically.
Figure 3.3: Accelerometer in Receptacle Box
The next test utilized a metal vibrator head in the tall form. The same
schedule of accelerometer placements and orientations described above was used

68
Features:
- Wide dynamic range
(50 g Peak)
- High Sensitivity
(100mv/g, ±5%)
- Wide Frequency Range
- Wide Temperature Range
(-50 to 120°C)
- Hermetically Sealed
Figure 3.4: Accelerometer Features
Vertical Orientation:Accelerometer measures waves
emanating upward throughthe concrete
Waves in concrete travelingupwards towards free surface
of concrete
Horizontal Orientation:Accelerometer measures wavesemanating out from the pointof insertion, perpendicular tothe axis of the vibrator head
Vibratory waves travelingparallel to free surface
of concrete
Figure 3.5: Accelerometer Orientation

69
in this test. The final test involved the use of the rubber vibrator head in the tall
form. Again the placement and orientation schedule was the same, except that in
the final test it was completed in the reverse order.
Figure 3.6: Data Acquisition System
3.3 Test Results
3.3.1 General Observations
The concrete used in this experiment was placed with a relatively low
slump of 5 cm (2”). Subsequently, as the time after placement elapsed and the
time of vibration increased, the concrete became quite stiff. Particularly in the
tall form where the concrete was first vibrated with a metal vibrator head and then
a rubber head, the interparticle friction of the mix was very high during the latter
part of the test. In this form the concrete was overvibrated by the end of the test,
and segregation of the concrete was seen in approximately a 5 cm (2”) area

70
around the head. The area of very visible segregation did not extend, however, to
either Station A, B, or C, so it is felt that this condition did not have a significant
effect on the data obtained from the test. The point that is important in analyzing
the data from the test is the observation that as time passed the concrete in both
forms became stiffer as the concrete set.
Concrete was placed in both of the forms at the beginning of the test, and
the rubber vibrator head was immediately used to vibrate concrete in the short
form. Vibration tests could not be conducted in both forms simultaneously due to
equipment limitations. The concrete was in the tall form for at least 20 minutes
before the metal vibrator head was inserted for consolidation. Subsequently, the
concrete in the tall form was stiffer at the beginning of the metal head test than
was the concrete in the short form at the beginning of the rubber head test. This
conclusion was also validated by observations of the concrete during the vibration
tests. It was noted during the test that when the metal head test was begun the
concrete in the tall form was stiffer than the initial condition of the concrete for
the rubber head test. This is an important observation because properties of the
concrete, particularly its workability or slump, affect the ease with which the
concrete can be vibrated, or in other words, the efficiency of the vibrator.
With a stiffer mix the motion of the vibrating head will be more restrained
than in a looser mix. The metal vibrator head was tested in concrete from the
same batch, but that was less workable than that used with the rubber head.
Therefore, the metal vibrator head was tested in a more severe environment than
that of the rubber head. If the two heads were normally expected to produce
adequate consolidation, in this case the metal head would likely be less efficient
than the rubber head.

71
Observations of the fresh concrete surface appearance during the vibration
test confirmed that all data stations were within the vibrator’s area of influence.
Thus, the data recorded at each station is representative of vibratory motion
within the radius of action of the vibrator.
3.3.2 Data Recorded During Test
Power spectrum records and time records were produced by the data
acquisition system during the vibration test. The power spectrum records contain
(Vrms)2 readings versus the frequency in hertz. The power spectrum record was
constructed by taking five readings and doing a peak hold on the (Vrms)2 reading
at each frequency. The time record contains the accelerometer voltage versus
time at 2048 points over a 400 ms recording period. Several records were taken
of both the time and power spectrum data at each location during the tests.
Frequency Data
Plots of the power spectrum records from the tests had an appearance
similar to that of Figure 3.7. As shown, the (Vrms)2 data has been plotted versus
the frequency. The spikes in the curve represent dominant frequencies in the
concrete during vibration. The frequency of the first spike in the curve, which is
by far the largest spike in Figure 3.7, will be referred to as the dominant or peak
frequency.
Acceleration Data
Plots of the time records from the vibration tests had an appearance
similar to that of Figure 3.8. The graphs show particle acceleration in the

72
concrete through time as the concrete was being vibrated. As previously
described, the acceleration charts have a sinusoidal type appearance.
3.3.3 Discussion of Results
Frequency Results
The power response data from the rubber and metal head vibrator tests
show a difference in frequency between the two vibrator heads. Tables 3.1 and
3.2 summarize frequency data at Stations A and B. Tables 3.3 and 3.4 show the
data from Station C. For ease of comparison, the frequency of the first spike
reading at Stations A, B, and C were averaged and these averages are compared in
the following discussion. The average of all frequency readings for each of the
three tests are presented in Table 3.5.

73

74

75
Table 3.1: Peak Frequency from Horizontal Surface Measurements
Test
Peak Frequency (measured
horizontally) (Hz) (vpm)
(Vrms)2
Rubber Head in Short Form Station A
162.5 9,750 0.29
Rubber Head in Short Form Station B
165.0 9,900 0.05
Metal Head in Tall Form Station A
192.5 11,550 0.33
Metal Head in Tall Form Station B
192.5 11,550 0.05
Rubber Head in Tall Form Station A
177.5 10,650
0.04
Rubber Head in Tall Form Station B
180.0 10,800 0.02
Table 3.2: Peak Frequency from Vertical Surface Measurements
Test
Peak Frequency (measured vertically)
(Hz) (vpm)
(Vrms)2
Rubber Head in Short Form Station A
167.5 10,050 0.94
Rubber Head in Short Form Station B
172.5 10,350 0.40
Metal Head in Tall Form Station A
195.0 11,700 0.74
Metal Head in Tall Form Station B
195.0 11,700 0.22
Rubber Head in Tall Form Station A
177.5 10,650 2.60
Rubber Head in Tall Form Station B
177.5 10,650 0.60

76
Table 3.3: Peak Frequency from Horizontal Side Measurements
Test
Peak Frequency (measured
horizontally) (Hz) (vpm)
(Vrms)2
Rubber Head in Short Form Station C
172.5 10,350 0.24
Metal Head in Tall Form Station C
202.5 12,150 0.07
Rubber Head in Tall Form Station C
175.0 10,500 0.04
Table 3.4: Peak Frequency from Vertical Side Measurements
Test
Peak Frequency (measured vertically)
(Hz) (vpm)
(Vrms)2
Rubber Head in Short Form Station C
175 10,500 0.19
Metal Head in Tall Form Station C
202.5 12,150 0.07
Rubber Head in Tall Form Station C
172.5 10,350 0.06
Table 3.5: Average Peak Frequency
Test
Peak Frequency (average)
(Hz) (vpm) Rubber Head in Short Form Station A,B,C
170 10,200
Metal Head in Tall Form Station A,B,C
195 11,800
Rubber Head in Tall Form Station A,B,C
175 10,600
77
As shown in the table, the average peak frequency with the rubber vibrator
head was 10,200 vibrations per minute (vpm) in the first test in the short box and
11,800 vpm with the metal head in the tall box. The final test frequency with the
rubber head in the tall box was 10,600 vpm. These results suggest that the
frequency in the concrete when vibrating with the rubber head is less than that
obtained with the metal vibrator head. There is about a 10% difference in
frequency between the two heads, with the metal head showing the larger
frequency.
There is a spread in the peak frequency between data records for the same
vibrator head in the same box. In general, the frequency increases as the concrete
continues to be vibrated. As previously discussed, an experienced operator can
listen to the pitch of the motor as an indication of when the concrete has been
sufficiently vibrated. The pitch will momentarily drop, then increase as the
concrete is vibrated, reaching a relatively constant value when the concrete has
been sufficiently vibrated. The increase in pitch heard by the operator agrees with
the increase in frequency seen in successive data readings in the concrete.
Therefore, the frequency in the concrete cannot be given as an exact absolute
number, but is better characterized by an average of data as is shown above.
The important information to gather from the frequency data is that 1) the
average peak frequency in the concrete is about 10% less with the rubber head
than with the metal head, and 2) the range of peak frequencies over the successive
tests is less with the rubber head than the metal head. So even though there is not
a single number that can be set forth as a single frequency produced when using a
specific head, it is still possible to compare the performance of the two heads. In

78
doing so, it has been determined that use of the rubber vibrator head results in a
lower peak frequency than that obtained with the metal head.
Horizontal Acceleration Results
As previously discussed, the concrete was in the tall form for at least 20
minutes before testing began, and as a result that concrete was stiffer at the
beginning of the metal head test than was the concrete at the start of the first
rubber head test. A concrete vibrator will perform less efficiently in a stiff mix
than it will in a looser mix. The concrete in a looser mix is more flowable and the
vibratory action will have greater effect on the surrounding concrete. Thus, a
vibrator will produce more significant horizontal particle accelerations in a
flowable mix than it will in a stiffer mix. Consequently, the metal vibrator head
was working under more difficult conditions than the rubber head, and if
anything, would have been expected to perform less efficiently than the rubber
head.
The time records from the vibration tests show that the horizontal particle
acceleration induced in the concrete with the metal vibrator head is greater than
that obtained with the rubber head. Table 3.6 summarizes the horizontal
acceleration data at Stations A and B. Comparison of the first rubber head test
accelerations at Station A with that of the metal head shows a 12% difference,
with the metal head producing larger horizontal accelerations. The average
acceleration in the concrete was also computed from the data and it showed a
12% difference between the metal and rubber heads too, with the metal head
producing an average of 4.5 g and the rubber head producing 4.0 g.

79
Table 3.6: Horizontal Accelerations at Stations A and B
Test
Max. Horizontal Acceleration
(g)
Avg. Horizontal Acceleration
(g) Rubber Head in Short Form Station A
9.4 4.0
Rubber Head in Short Form Station B
5.5 1.8
Metal Head in Tall Form Station A
10.6 4.5
Metal Head in Tall Form Station B
7.4 2.3
Rubber Head in Tall Form Station A
5.2 1.7
Rubber Head in Tall Form Station B
3.4 1.4
A larger difference was seen between the first rubber head test and the
metal head test at Station B. The data shows a 29% difference in maximum
acceleration, and a 24% difference in average acceleration, with the metal head
vibrator again producing the more substantial horizontal accelerations.
At Station B, the reduction in acceleration was even greater with the
rubber vibrator head compared to the metal head. The percent difference between
the rubber and metal heads at Station B was twice that at Station A. The
increased difference between the two heads suggests that the area of influence for
the rubber vibrator head is less than that of the metal head. At increasing
distances from the point of vibrator insertion, the rubber head produced
increasingly smaller accelerations. This behavior would be expected to continue,
hence, the effective area of the rubber head is less than that of the metal head.

80
A further comparison of the rubber vibrator head to the metal head was
made by revibrating the concrete in the tall form with the rubber head vibrator.
At Station A the maximum horizontal acceleration during the second test in the
tall form was 5.2 g and the average was 1.7 g. The maximum acceleration shows
68% difference from the metal head, and the average is 90% different. At Station
B, the maximum acceleration shows 74% difference and the average is 50%
different. Again, the metal head vibrator produced substantially larger
accelerations.
In the tall form, the rubber head would not necessarily have been expected
to produce quite as large accelerations as the metal head had, since the concrete in
the form had already been adequately vibrated and was quite dense. However, it
was not expected that the horizontal accelerations in the concrete would be so
drastically reduced with the rubber head as compared to the metal head. The last
readings in the concrete with the metal vibrator head immediately prior to testing
of the rubber head show that the metal head was producing substantially more
vibratory force than did the rubber head in relatively similar conditions. Thus, the
rubber head vibrator again is shown to produce less horizontal particle
accelerations in the concrete than does the metal head.
Readings of the horizontal particle acceleration were also made at Station
C in each of the forms. Table 3.7 summarizes the data from this station. Again,
the metal head produced larger horizontal accelerations than the rubber head.
There is an 18% difference between the maximum acceleration between the first
rubber head test and the metal head test, and 33% difference between the metal
and second rubber head tests. The percent difference between the average
accelerations of the rubber head and metal head was 28% in both tests.

81
Table 3.7: Horizontal Accelerations at Station C
Test
Max. Horizontal Acceleration
(g)
Avg. Horizontal Acceleration
(g) Rubber Head in Short Form Station C
8.6 3.2
Metal Head in Tall Form Station C
10.3 4.6
Rubber Head in Tall Form Station C
7.4 3.2
Further information can be gained by comparing the accelerations at
Station B to C. These two stations are at the same distance from the point of
insertion of the vibrator, but Station C is located 13 cm (5 in) from the surface,
while Station B is immersed only 4.5 cm (1.75 in) in the concrete. Comparing the
data from Stations B and C in each test reveals that the horizontal accelerations
are larger at C. There are more significant horizontal accelerations in the middle
of the concrete layer, than there are closer to the surface. In all of the data,
though, the horizontal accelerations produced in the concrete are less with the
rubber vibrator head than with the metal head.
Vertical Acceleration Results
Normally in discussions of concrete vibrators, the acceleration and
amplitudes under examination are related to horizontal motions in the concrete.
The vibrator is supposed to be inserted vertically in the concrete, and the
eccentric weight in the head produces waves that emanate out from the head,
perpendicular to its center line. However there are also vertical accelerations
induced in the concrete. This component of acceleration arises from the operator

82
moving the vibrator head up and down during consolidation of the concrete, and
from the rise of entrapped air bubbles, and the general settling of the concrete
during vibration. A record of the vertical accelerations in the concrete was made
during this vibration test. Table 3.8 summarizes the vertical acceleration readings
at Stations A and B.
Table 3.8: Vertical Accelerations at Stations A and B
Test
Max. Vertical Acceleration
(g)
Avg. Vertical Acceleration
(g) Rubber Head in Short Form Station A
16.5 7.9
Rubber Head in Short Form Station B
10.9 5.2
Metal Head in Tall Form Station A
18.0 7.2
Metal Head in Tall Form Station B
8.6 3.7
Rubber Head in Tall Form Station A
17.3 9.1
Rubber Head in Tall Form Station B
8.7 4.9
Unlike the horizontal accelerations in the concrete, the vertical
accelerations were generally greater with the rubber head than with the metal
vibrator head. The increase in vertical accelerations with the rubber head is
attributed to the physical design of the rubber vibrator head, as will be discussed
later in this section. At Station B, the maximum vertical acceleration was 10.9 g
with the rubber head in the short box, 8.7 g with the rubber head in the tall box,
and 8.6 g with the metal head. Thus, the maximum acceleration of the rubber
head in the first test was a good deal larger (24% different) than that of the metal
head at Station B, and still slightly larger in the second test. The average

83
accelerations at Station A showed a similar relationship, in that the rubber head
was 9% different from the metal head in the first test and 23% different in the
second test, with the rubber head producing greater average accelerations in both
instances. The maximum vertical accelerations at Station A, however, were
greater with the metal head. There was a 9% difference between the first rubber
head test and the metal head test, and a 4% difference for the second rubber head
test.
Since the maximum vertical accelerations at Station A were greater with
the metal head, and the average was greater with the rubber head, it cannot
necessarily be deduced that one outperformed the other at this station. However,
the rubber head produced larger maximum and average accelerations at Station B.
The vertical acceleration readings from Station C are presented in Table 3.9. The
data from this station also shows larger maximum and vertical accelerations with
the rubber vibrator head than the metal head.
Table 3.9: Vertical Accelerations at Station C
Test
Max. Vertical Acceleration
(g)
Avg. Vertical Acceleration
(g) Rubber Head in Short Form Station C
6.9 2.8
Metal Head in Tall Form Station C
6.1 2.0
Rubber Head in Tall Form Station C
5.9 2.1
Since the metal vibrator head produced substantially larger horizontal
accelerations than did the rubber head, it might seem curious that comparison of
vertical accelerations does not yield the same conclusion. This is probably due

84
most to the design of the two vibrator heads. The shape of the metal head could
best be described as a smooth cylindrical shape with a conical tip at the end, as
shown in Figure 3.9. Also shown in the figure is the rubber head which has a
steel core surrounded by rubber. The rubber sheathing on the soft head vibrator is
not continuous, but is made up of several ring segments. Between successive
segments, there is an open area through which the steel core of the head can be
seen. An earlier design of the soft head vibrator did have a continuous plastic cap
over the steel core, but this design did not work well since the concrete could not
effectively cool the vibrating head.
Figure 3.9: Metal (top) and Rubber Vibrator Heads
When an internal concrete vibrator is operated, either in concrete or in air,
the vibrating head quickly becomes very hot. In fact, it is recommended that the
vibrator not be operated in air for more than 5 or 10 seconds since the head will
become too hot. In normal use, the concrete itself serves as a coolant for the

85
head. As the vibrator is operated, the concrete flows around the head, and the
heat from the head is dissipated into the concrete. In this way, the vibrating head
is cooled during its operation. When the entire metal core is coated with a plastic
sheathing, though, the rubber serves as an insulator keeping the heat inside the
core, and the concrete can not serve as a heat sink for the head. When the head is
not cooled by the concrete, first the head, and then the flexible shaft, will become
very hot. It will be uncomfortable, if not dangerous, for the operator to hold the
shaft with bare hands, and the shaft may become so hot that it can not easily be
held with gloved hands, either.
By breaking up the rubber on the soft head into rings, and leaving accesses
through which the concrete can contact the metal core, the vibrating head can be
cooled. The concrete flows between the rings, in and out during vibration,
dissipating the heat of the head. Subsequently the vibrator will work more
efficiently, and will last longer, and the operator will be able to safely use the
equipment. With both the metal and soft head vibrators, though, the operator
should wear gloves since after a relatively short time in operation the shafts of
each may become hot enough to be uncomfortable to hold with bare hands. With
the rubber ring design, though, operation with the soft head is not significantly
different from that of the metal head, with respect to vibrator heat.
The design of the rubber rings, though, have a secondary effect other than
assisting in cooling the head. The design results in the production of larger
vertical accelerations in the concrete than does the smooth, round metal head,
especially farther away from the head. If one were to compare moving a smooth
stick up and down in water to moving a rough stick with several branches on it up
and down in the same water, the same type of relation would occur. The smooth
86
stick would not greatly agitate the water, since there are few horizontal surfaces
available to disturb it. The rough stick, though, would disturb the water much
more, since the appendages projecting out into the water would move the water
about. This relation is true for the metal and rubber heads as well. The smooth,
round metal head will disturb the concrete less as it is moved up and down than
will the rough and uneven surface of the rubber head. The horizontal surfaces of
the rubber rings push the concrete vertically as the vibrator is moved up and
down. Subsequently, larger vertical accelerations are expected with the rubber
head, especially at increased distances from the insertion point. The data from the
vibration tests confirms this supposition.
3.4 Conclusions
The waves that emanate horizontally from a vibrating concrete head lend
energy to entrapped air bubbles, helping them to escape, and thus densifying the
concrete. These waves reduce internal friction in the mix, allowing the concrete
to flatten out and reach a lower energy state. The science of concrete vibration is
based on the characteristics of these horizontal waves, and how effective they are
at consolidating concrete mixes.
Based on the measurements taken in this study, the metal vibrator head
sends out more significant horizontal waves into the concrete than does the rubber
head. Horizontal particle accelerations with the metal head were greater than
those with the rubber head, both close to the insertion point of the vibrator, and
farther from this point. Hence, based on use with the same vibrator motor and
comparable flexible shafts, the metal vibrator head imparted more energy to the
surrounding concrete than did the rubber head.
87
The fact that the rubber head produced less vibratory action in the
concrete than would be expected from a similarly sized metal head vibrator is
attributed to the dampening effect the plastic rings have on the waves emanating
from the metal core of the rubber head. The presence of the plastic sheathing
results in the passage of less energy from the metal core of the rubber head to the
surrounding concrete during vibration. Thus, the rubber heads vibrate the
concrete less efficiently than would be expected from a metal head of the same
size.
Although a significant difference between the metal and rubber head was
seen at data locations near the insertion point, an even larger difference was seen
at data stations farther from the vibrating head. Thus, not only did the metal head
produce more significant accelerations than the rubber head throughout the area
of influence, but also its vibratory action away from the point of insertion is
dropping off at a slower rate than the rubber head’s. The metal vibrator head
produces significant accelerations in a larger area of concrete surrounding the
point of insertion, or in other words, the area of influence of the metal head is
larger than that of the rubber head.
As noted in the discussion of results, the frequency in the concrete during
vibration was about 10% less with the rubber head than with the metal head. The
higher particle frequencies seen with the metal head indicate that the metal head
will consolidate concrete more quickly and efficiently than the rubber head.
The only area of measurement in which the rubber vibrator head produced
more significant action than the metal head was the vertical particle acceleration
readings. But as discussed at length in the previous section, this occurrence is
88
attributed to the physical design of the rubber head, its irregular shape and the
presence of numerous horizontal surface. Some metal vibrator heads are
constructed with a thickened tip at the end and irregular surfaces as it has been
recognized that the design of the head affects the consolidation of the concrete.
The modified shape of a metal vibrator head alters the effect of the vibrator as it is
moved up and down in the concrete during the consolidation process, just as the
irregular shape of the rubber encased heads does. Thus it is reasonable, and
expected, that the vertical accelerations in the concrete vibrated with the rubber
head were larger than those seen with the smooth metal head. This occurrence,
however, does not mean that the rubber head vibrator is better at concrete
consolidation than the metal head. The increased vertical accelerations with the
rubber head instead confirm the fact that altering the shape of the vibrator head
affects the action of the vibrator, particularly with respect to vertical motion in the
concrete.
Based on the tests conducted it is concluded that 1) a metal vibrator head
will more efficiently and rapidly consolidate a concrete mix than will a
comparable rubber head, and 2) that the area of influence with a metal vibrator
head is larger than that of a comparable rubber head. These findings should hold
for vibration of concrete mixes similar to the tested mix, but there may be some
variation with very lean or rich mixes, or concrete mixes with significantly
different workability.

89
Chapter 4
Evaluation of Consolidation in Hardened Concrete
After Concrete Vibration
4.1 General
The effects of concrete consolidation on the corrosion performance of
steel reinforcement has not been strongly emphasized in literature. However, in
earlier work on this project it was found that the condition of the concrete
surrounding epoxy-coated bars plays a significant role in the corrosion process.4
Subsequently, the ability, or inability, of a vibrator head to adequately consolidate
concrete, particularly around reinforcing bars, is of great importance.
During the consolidation of concrete, water migrates towards the top
surface of a specimen. But some bleed water is trapped in the concrete,
particularly below horizontal bars. As the concrete settles, it has been shown that
small gaps form under the coated reinforcing bars. The formation of gaps is
augmented by the lack of interlock between the mortar and the surface of the
coated bar. Free water is able to accumulate in the zone beneath the bar, and
when this water evaporates, air pockets are left under the bar. A test reported by
Kahhaleh4 showed that while the concrete above a coated bar was well
compacted, a gap formed below the bar.
As discussed in Kahahaleh’s work, the gap area beneath the bar may serve
as a trap for water, oxygen, and chlorides. The presence of these agents
encourages the onset of corrosion in the steel. Particularly since these substances

90
are in such close proximity to the bar there will likely be deleterious effects on the
corrosion performance of the coated steel. As the corrosive agents penetrate to
the steel through damaged areas and holidays, corrosion may be initiated and
widespread undercutting of the epoxy film may result.4
In addition to the migration of water, entrapped air bubbles also rise to the
surface of a specimen during vibration. Some of these air bubbles are trapped
below large objects, like horizontal reinforcing bars, during the vibration of
concrete. The existence of these air bubbles below the reinforcement exacerbates
the condition of gap formation described above. Not only can a gap form below
the coated bar, but also large air voids may collect beside and beneath it. Harmful
agents, such as water, oxygen, and chlorides, can collect in these voids.
As a consequence of the migration of water and air bubbles, and their
collection below reinforcing bars as described above, the concrete environment
below the coated bar may be different from that above it. This difference is
expected to negatively impact the corrosion performance of the coated
reinforcement. Water carrying chloride ions may be trapped in voids at damaged
spots in the coating. These spots may be more prone to corrode than areas with
well-compacted more alkaline concrete in contact with the coated bar.
Furthermore, the differences between areas of concrete bordering the
reinforcement may promote the development of concentration cells.
Earlier work on this project has shown that corrosion activity does take
place where voids in the concrete border the steel. Wetting and drying of voids,
as well as the concentration of oxygen and chlorides in voids, promote corrosion
at damage spots on the coated bars. When a damaged spot is exposed to corrosive

91
agents, the localized area of steel cannot passivate, and the process of corrosion
will progress. Especially at larger damaged spots on the bottom of a coated bar
where voids are adjacent to the surface, localized corrosion may be extensive.
Large pits were observed where significant areas of coating damage bordered
voids in the concrete in corrosion specimens evaluated in earlier work on this
project.4 A picture of a blister in the epoxy-coating where it was adjacent to a
void is shown in Figure 4.1 , and an extensively corroded area of reinforcement
on the bottom of an epoxy-coated reinforcing bar is shown in Figure 4.2.
Figure 4.1: Blister at Bottom Side of Coated Bar
Since concrete consolidation, particularly in the area surrounding
reinforcement, has been shown to play a significant role in the corrosion
performance of coated bars, the ability of the new rubber vibrator heads to
adequately consolidate concrete specimens has been investigated. The area of
voids under reinforcing bars in specimens consolidated with rubber and metal
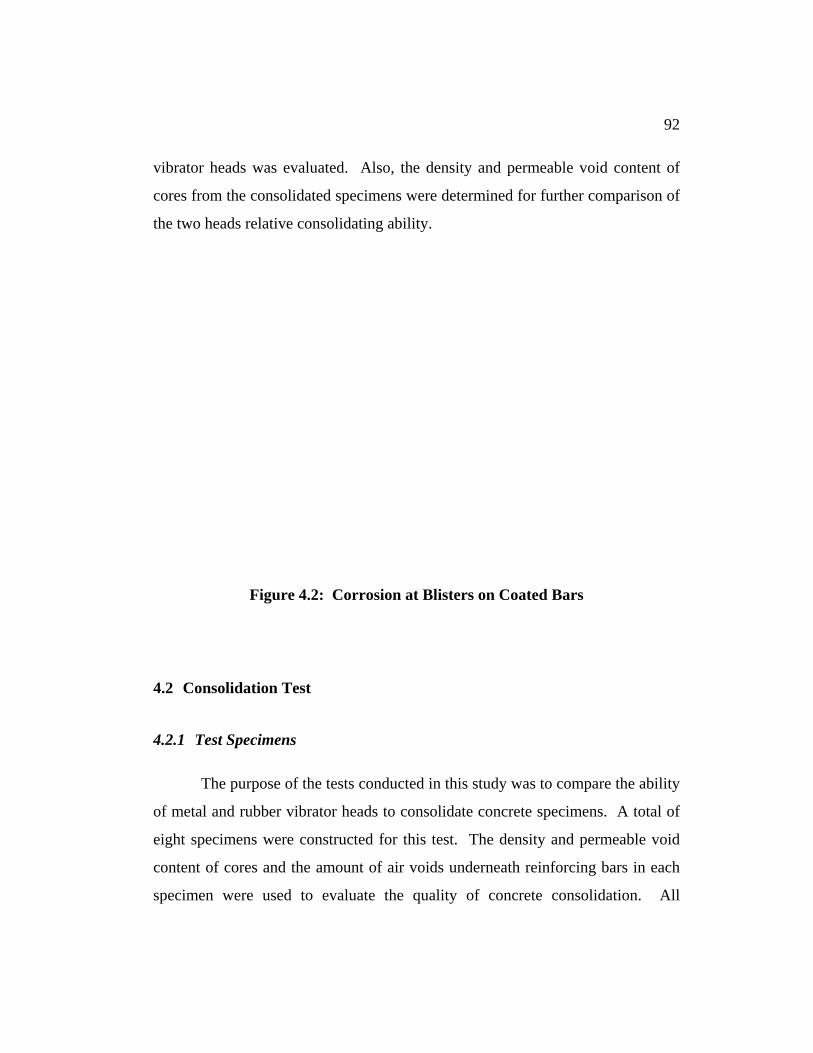
92
vibrator heads was evaluated. Also, the density and permeable void content of
cores from the consolidated specimens were determined for further comparison of
the two heads relative consolidating ability.
Figure 4.2: Corrosion at Blisters on Coated Bars
4.2 Consolidation Test
4.2.1 Test Specimens
The purpose of the tests conducted in this study was to compare the ability
of metal and rubber vibrator heads to consolidate concrete specimens. A total of
eight specimens were constructed for this test. The density and permeable void
content of cores and the amount of air voids underneath reinforcing bars in each
specimen were used to evaluate the quality of concrete consolidation. All

93
reinforcing bars used in this test had a parallel rib, or bamboo, type deformation
pattern. Both epoxy-coated and uncoated bars were used to attempt to identify
any differences in concrete consolidation around coated versus uncoated bars.
The plan size of the concrete blocks was chosen based on the radius of
influence reported for the heads used to consolidate them. In the arrangement
shown in Figure 4.3, all of the concrete specimen is located with the vibrator’s
area of influence. The size of the specimens tested in this study were selected so
that the area of the concrete block was located just inside the suggested radius of
influence of the vibrator used to consolidate the specimen.
Vibration InsertionPoint
Edge of Form
Area of Influence
Figure 4.3: Area of Influence and Specimen Size
Specimens M8 and R8 (Metal 8 in and Rubber 8 in)

94
The formwork and reinforcement for the first two specimens were
identical. A photograph of the specimen formwork and reinforcement prior to
vibration is shown in Figure 4.4. Both specimens were 205 mm (8 in) in height,
610 x 610 mm (24 x 24 in) in plan, and the layout of reinforcement in the
specimens was as shown in Figure 4.5. As noted in the figure, all reinforcing bars
in the two mats were 13 mm (#4) bars. Some reinforcing bars in each specimen
were epoxy-coated, while others were uncoated.
Figure 4.4: Reinforcement of Specimens M8 and R8
Specimens M17 and R17
The next two specimens were also companion samples. These specimens
were 430 mm (17 in) in height, 610 x 610 mm (24 x 24 in) in plan, and were
reinforced as shown in Figure 4.6. Both 13 mm (#4) bars and 19 mm (#6) bars

95
were used in the two reinforcement mats in these specimens. As shown in Figure
4.6, some bars were epoxy-coated, while others were uncoated.
Specimens M28 and R28
The third pair of companion specimens were 710 mm (28 in) in height,
and 610 x 610 mm (24 x 24 in) in plan. The layout of reinforcement and
specimen dimensions were as shown in Figure 4.7. Both 19 mm (#6) bars and 25
mm (#8) bars were used in the three reinforcing mats in these specimens. As
shown in the figure, some reinforcing bars were epoxy-coated while others were
uncoated.
Specimens R18 and R30
The last two specimens were not companion specimens. Both specimens
were 915 x 915 mm (36 x 36 in) in plan, but were of different heights. The first
specimen was 460 mm (18 in) in height and had two reinforcement mats, while
the second was 760 mm (30 in) in height and had three mats of reinforcement.
The layout of reinforcement in these specimens is shown in Figures 4.8 and 4.9,
respectively. In both of these specimens, all of the 16 mm (#5) bars were
uncoated. Half of the 13 mm (#4) and 19 mm (#6) bars in specimen R18 were
epoxy-coated, while the other half were uncoated. Similarly, half of the 19 mm
(#6) and 25 mm (#8) bars in specimen R30 were epoxy-coated, while the other
half were uncoated.
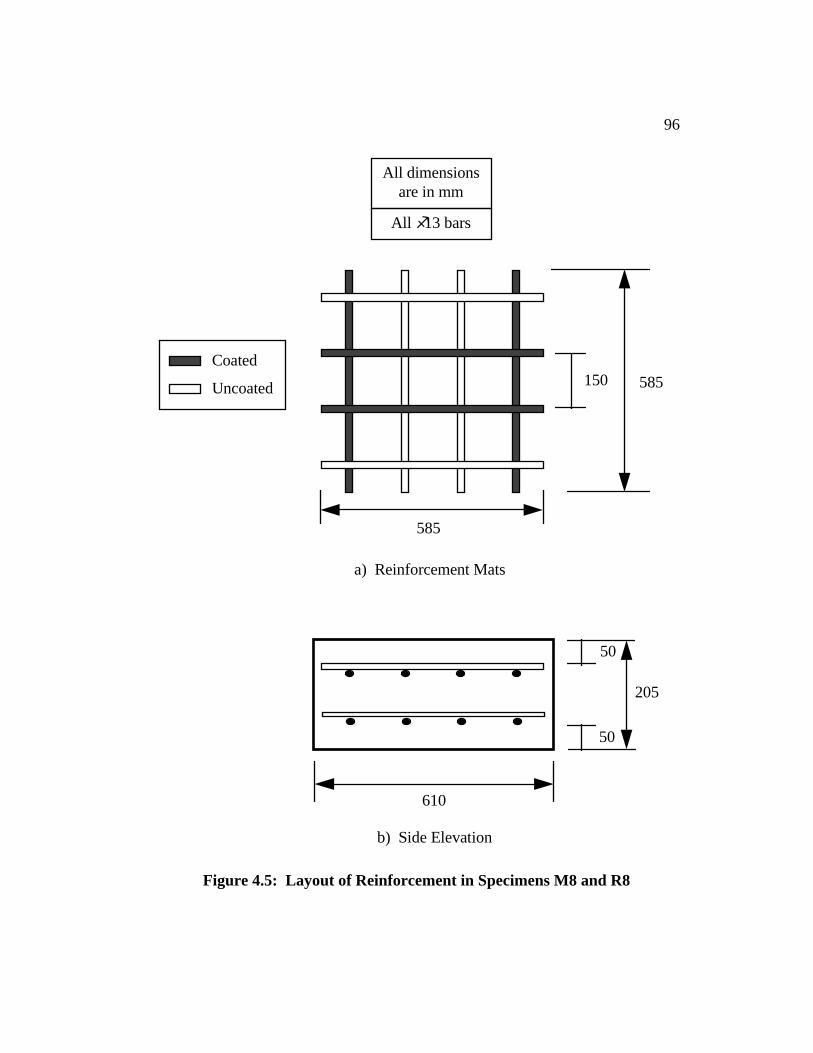
96
585
585
150
a) Reinforcement Mats
All 13 bars
All dimensionsare in mm
50
205
50
610
b) Side Elevation
Coated
Uncoated
Figure 4.5: Layout of Reinforcement in Specimens M8 and R8

97
585
585
150
a) Reinforcement Mats
All dimensionsare in mm
70
430
610
75
b) Side Elevation
Bar
13
13
13 13
19
19
1919
Coated
Uncoated
Figure 4.6: Layout of Reinforcement in Specimens M17 and R17

98
585
585
150
a) Reinforcement Mats
All dimensionsare in mm
70
710
610
75
b) Side Elevation
Bar
19
19
19 19
25
25
2525
255
Coated
Uncoated
Figure 4.7: Layout of Reinforcement in Specimens M28 and R28

99
890
890
180
a) Reinforcement Mats
All dimensionsare in mm
70
455
75
b) Side Elevation
Bar
13
13
13 13
19
19
191916
16
16
16
90
915
Coated
Uncoated
Figure 4.8: Layout of Reinforcement in Specimen R18

100
890
890
180
a) Reinforcement Mats
All dimensionsare in mm
70
760
75
b) Side Elevation
Bar
19
19
19 19
25
25
252516
16
16
16
90
915
280
Coated
Uncoated
Figure 4.9: Layout of Reinforcement in Specimen R30

101
4.2.2 Test Procedure
All of the specimens were cast in Ferguson Structural Engineering
Laboratory with concrete from the same ready-mix truck. Concrete was placed in
each of the test specimen forms from an overhead bucket, as shown in Figure
4.10. Several different concrete vibrators were used during the consolidation of
the test specimens. In all specimens the concrete vibrator was inserted at a single
point in the plan center of the block. The vibrator head was inserted at the center
point, and the concrete was vibrated for a specified period, after which the
vibrator was removed. The surface of the specimens was then finished, and the
blocks were allowed to cure for at least five days before coring began.
Figure 4.10: Placing Concrete in Specimen from Overhead Bucket

102
The length of vibration time for each pair of specimens was selected by
observation of the concrete surface during vibration. First, a rubber head vibrator
was inserted into one of the specimens, and the length of vibration was timed.
The concrete was vibrated until the rapid escape of air bubbles subsided. The
companion specimen was vibrated with the metal head for the same length of
time.
Specimens M8 and R8
The first pair of specimens, 205 mm (8 in) in height, were vibrated with
concrete vibrators with slab length heads. A picture of the vibration operation is
shown in Figure 4.11.
Figure 4.11: Consolidation of Specimen R8

103
Specimen R8 was vibrated with a rubber head 70 mm (2 3 4 in) in diameter, and
M8 was consolidated with a metal head vibrator which was 44 mm (1 3 4 in) in
diameter. Both the metal and rubber heads were 230 mm (14 in) in length. The
concrete was placed in the test specimens in a single lift, and the blocks were
vibrated for eight seconds at the center insertion point.
Specimens M17 and R17
The second pair of specimens, 430 mm (17 in) in height, were
consolidated with vibrator heads 360 mm (14 in) in length. The first specimen
was consolidated with a rubber head 48 mm (1 7 8 in) in diameter. The second
specimen was vibrated with a metal vibrator head 44 mm (1 3 4 in) in diameter.
The concrete was placed in each block in two equal lifts. Both lifts were vibrated
for eight seconds with the head positioned at the center insertion point.. A picture
of the vibration operation is shown in Figure 4.12.
Specimens M28 and R28
The third pair of specimens, 710 mm (28 in) in height, were also
consolidated with the 360 mm (14 in) long vibrator heads. The metal head was
44 mm (1 3 4 in) in diameter, and the rubber head had a diameter of 48 mm (1 7 8
in). The concrete was placed in the block in three equal lifts. Each lift was
vibrated for eight seconds, with the vibrator head at the center insertion point.
Specimens R18 and R30
The final two specimens, 915 x 915 mm (36 x 36 in) in plan, were both
consolidated with a large rubber head vibrator. The rubber head was 70 mm
(2 3 4 in) in diameter, and 380 mm (15 in) in length. The concrete in the shorter,
455 mm (18 in) tall block, was placed in two equal lifts. The concrete in the 760
104
mm (30 in) tall block was placed in three equal lifts. The concrete in each lift was
vibrated for 15 seconds with the head at the center insertion point.
Figure 4.12: Consolidation of Specimen M17
4.2.3 Coring Schedule
The concrete specimens were cored with a portable coring machine. A 98
mm ( 3 7 8 inch) bit was used for all cores. The coring machine is shown in
operation in Figure 4.13. A total of thirty-seven cores were taken from the eight
consolidation specimens. Figure 4.14 shows several cores after extraction from
the concrete. Figure 4.15 is a picture of specimens M8 and R8 after coring. All
but two of the cores were taken through specimen reinforcement. Nineteen of the
cores were taken from specimens M8 and R8. Maps of the core locations in M8

105
and R8 are presented in Figure 4.16. A smaller number of core samples were
taken from each of the other specimens.
Figure 4.13: Coring Reinforced Concrete Test Specimen
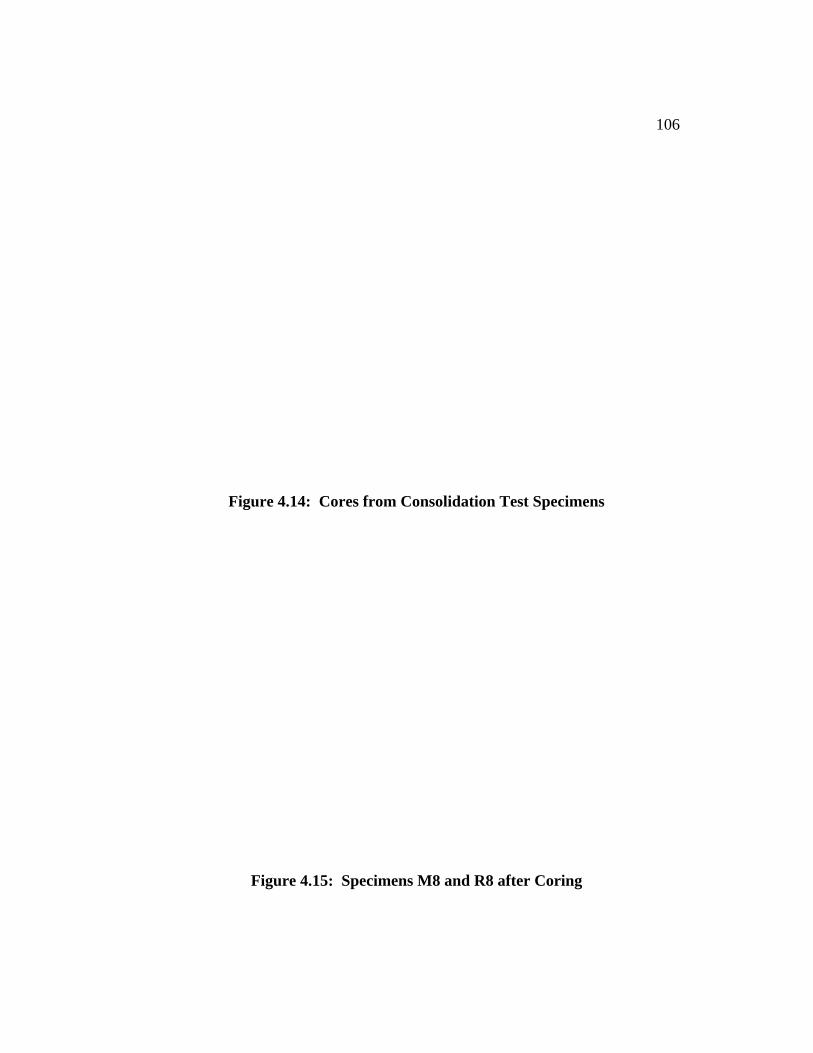
106
Figure 4.14: Cores from Consolidation Test Specimens
Figure 4.15: Specimens M8 and R8 after Coring
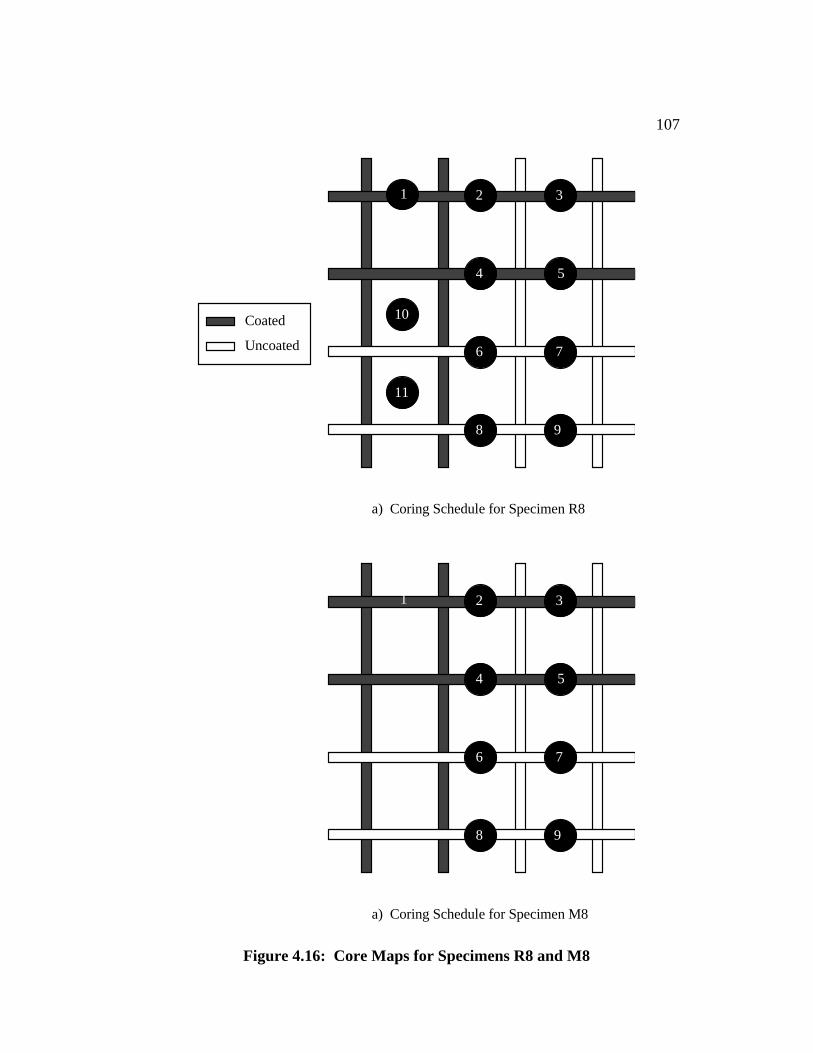
107
Coated
Uncoated
1 2 3
10
6
4 5
7
8 9
11
a) Coring Schedule for Specimen R8
1 2 3
10
6
4 5
7
8 9
11
a) Coring Schedule for Specimen M8
Figure 4.16: Core Maps for Specimens R8 and M8
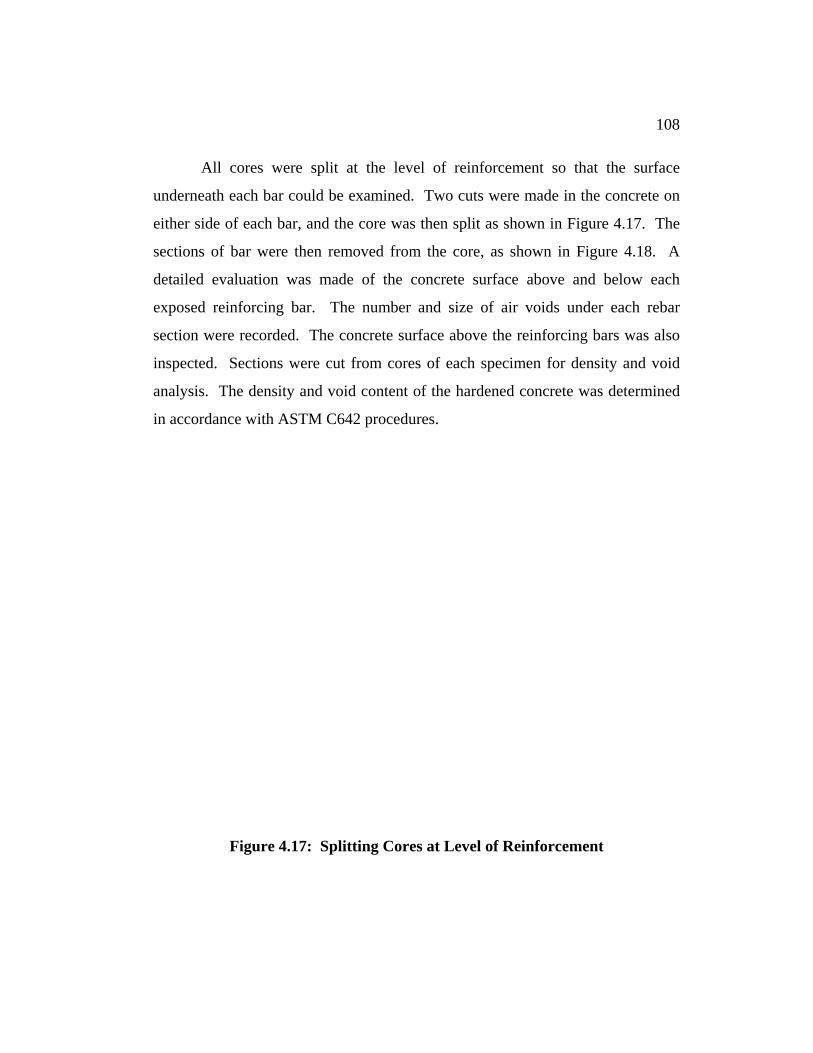
108
All cores were split at the level of reinforcement so that the surface
underneath each bar could be examined. Two cuts were made in the concrete on
either side of each bar, and the core was then split as shown in Figure 4.17. The
sections of bar were then removed from the core, as shown in Figure 4.18. A
detailed evaluation was made of the concrete surface above and below each
exposed reinforcing bar. The number and size of air voids under each rebar
section were recorded. The concrete surface above the reinforcing bars was also
inspected. Sections were cut from cores of each specimen for density and void
analysis. The density and void content of the hardened concrete was determined
in accordance with ASTM C642 procedures.
Figure 4.17: Splitting Cores at Level of Reinforcement
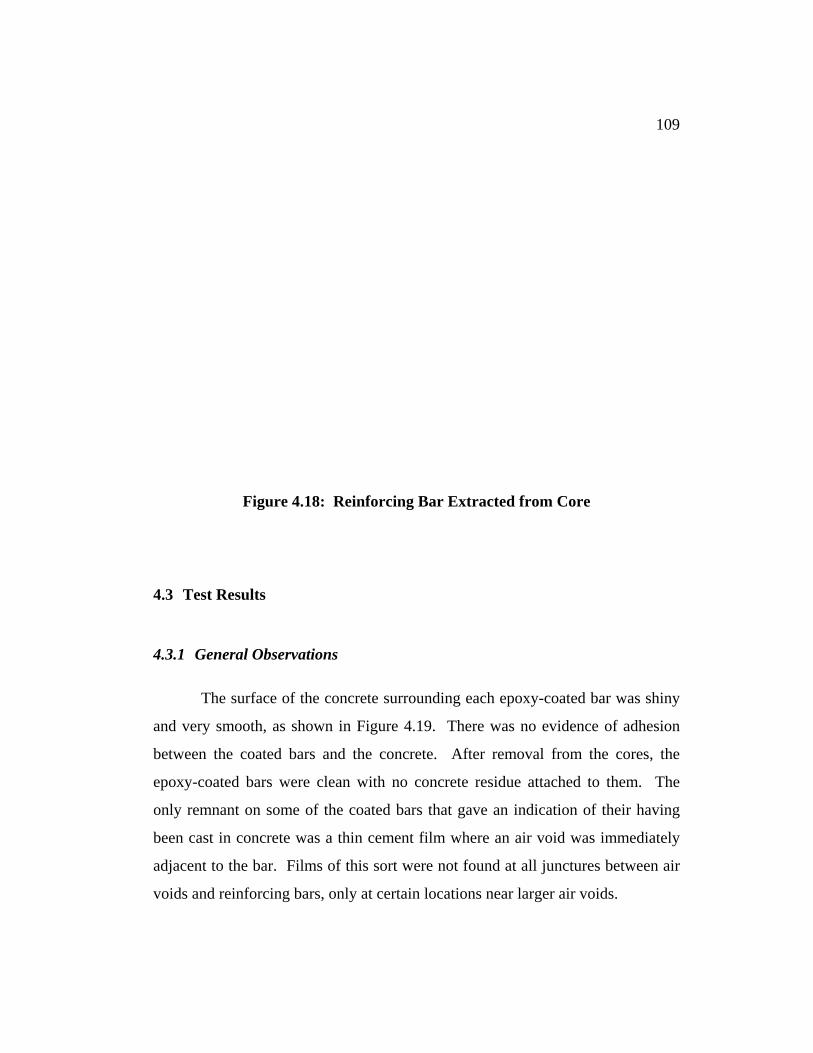
109
Figure 4.18: Reinforcing Bar Extracted from Core
4.3 Test Results
4.3.1 General Observations
The surface of the concrete surrounding each epoxy-coated bar was shiny
and very smooth, as shown in Figure 4.19. There was no evidence of adhesion
between the coated bars and the concrete. After removal from the cores, the
epoxy-coated bars were clean with no concrete residue attached to them. The
only remnant on some of the coated bars that gave an indication of their having
been cast in concrete was a thin cement film where an air void was immediately
adjacent to the bar. Films of this sort were not found at all junctures between air
voids and reinforcing bars, only at certain locations near larger air voids.
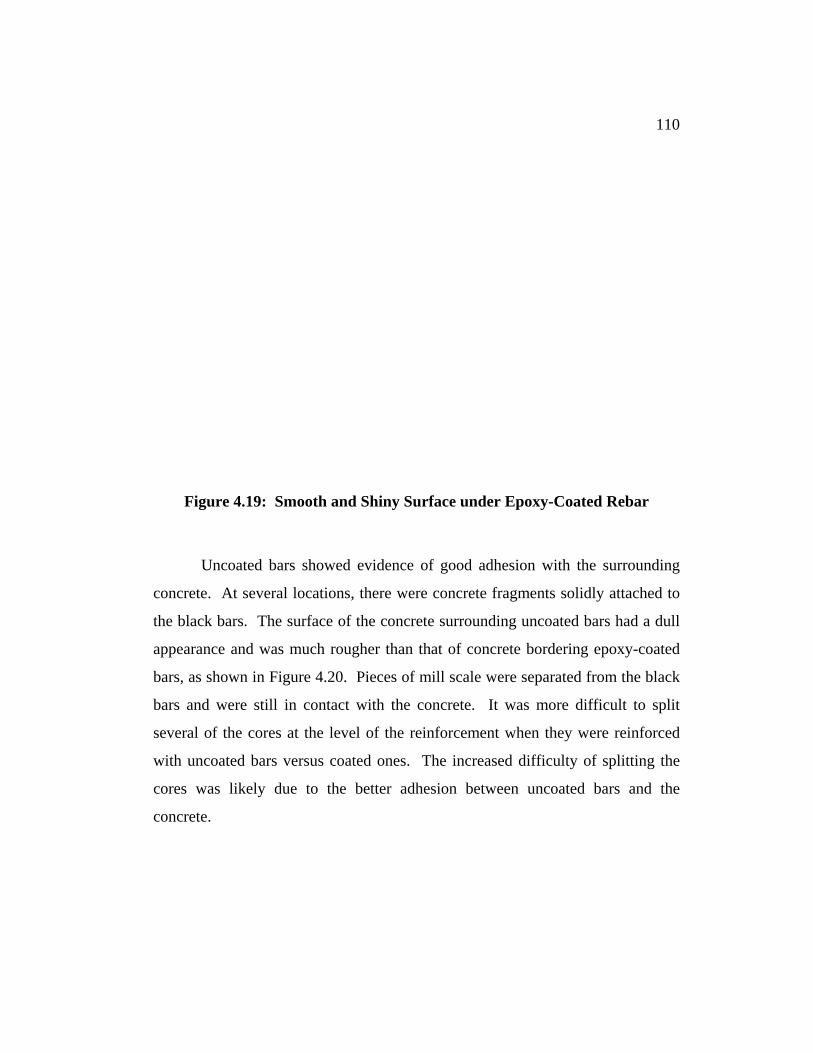
110
Figure 4.19: Smooth and Shiny Surface under Epoxy-Coated Rebar
Uncoated bars showed evidence of good adhesion with the surrounding
concrete. At several locations, there were concrete fragments solidly attached to
the black bars. The surface of the concrete surrounding uncoated bars had a dull
appearance and was much rougher than that of concrete bordering epoxy-coated
bars, as shown in Figure 4.20. Pieces of mill scale were separated from the black
bars and were still in contact with the concrete. It was more difficult to split
several of the cores at the level of the reinforcement when they were reinforced
with uncoated bars versus coated ones. The increased difficulty of splitting the
cores was likely due to the better adhesion between uncoated bars and the
concrete.
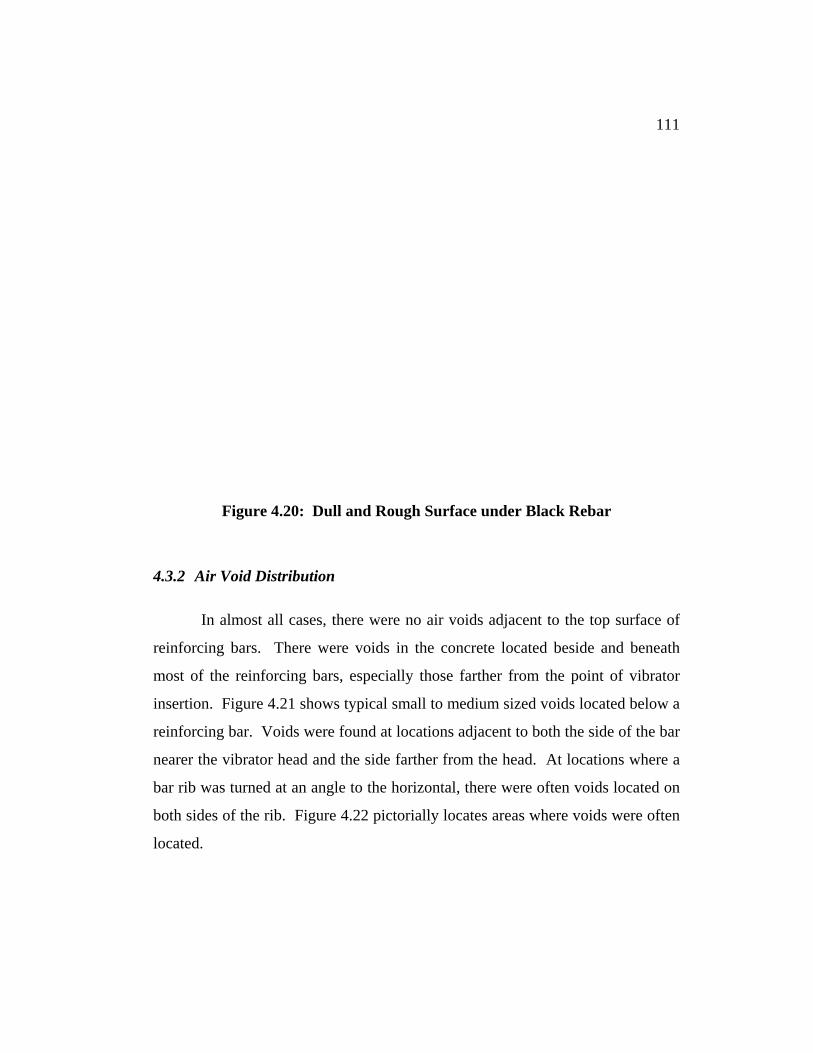
111
Figure 4.20: Dull and Rough Surface under Black Rebar
4.3.2 Air Void Distribution
In almost all cases, there were no air voids adjacent to the top surface of
reinforcing bars. There were voids in the concrete located beside and beneath
most of the reinforcing bars, especially those farther from the point of vibrator
insertion. Figure 4.21 shows typical small to medium sized voids located below a
reinforcing bar. Voids were found at locations adjacent to both the side of the bar
nearer the vibrator head and the side farther from the head. At locations where a
bar rib was turned at an angle to the horizontal, there were often voids located on
both sides of the rib. Figure 4.22 pictorially locates areas where voids were often
located.

112
Figure 4.21: Typical Distribution of Voids under Rebar
Spots next to rib where air voids likely to be located.
Spots next to bar where airvoids likely to be located.
Vibratory Waves
Voids normally locatedbelow reinforcing bars.
Direction of Casting
Figure 4.22: Locations Where Voids Where Often Located

113
Evaluation of the void area under bars in the eight specimens revealed
several trends. First, there was more void area located under reinforcing bars in
the upper mats of a specimen than in lower mats. The average void area under
bars in the top mat varied from 1.6 to 4.8 times the void area under bars in the
lower mats. Figure 4.23 shows the distribution of voids under bars in the upper
and lower mats, respectively, from specimen R17. Note that the number and size
of air voids under the upper bars is greater than that for the lower bars.
The fact that more void areas were observed under upper bars seems
reasonable since, as the concrete continues to be vibrated, air voids rise towards
the surface of the concrete. When vibration ceases, there are air voids that have
risen up towards the top surface of a specimen but have not yet escaped the
concrete. Subsequently, a larger amount of void area was located under the upper
mat of reinforcement.
Analysis of the air void distribution also showed larger void areas were
located below bigger bars. Figure 4.24 shows the area of voids under a 25 mm
(#8) bar in specimen M28. The occurrence of more void areas under larger bars
seems quite logical since larger objects would be expected to interfere with the
escape of entrained air bubbles more than smaller objects would. Subsequently,
more air bubbles were trapped below bigger reinforcing bars.
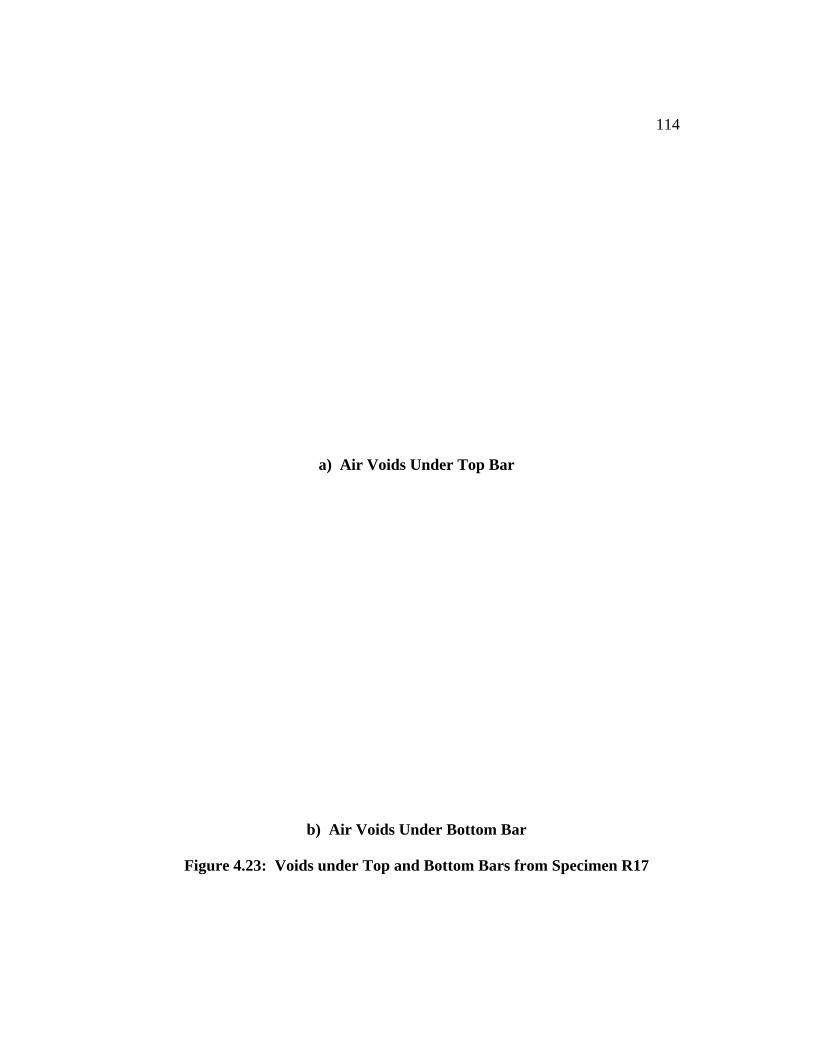
114
a) Air Voids Under Top Bar
b) Air Voids Under Bottom Bar
Figure 4.23: Voids under Top and Bottom Bars from Specimen R17
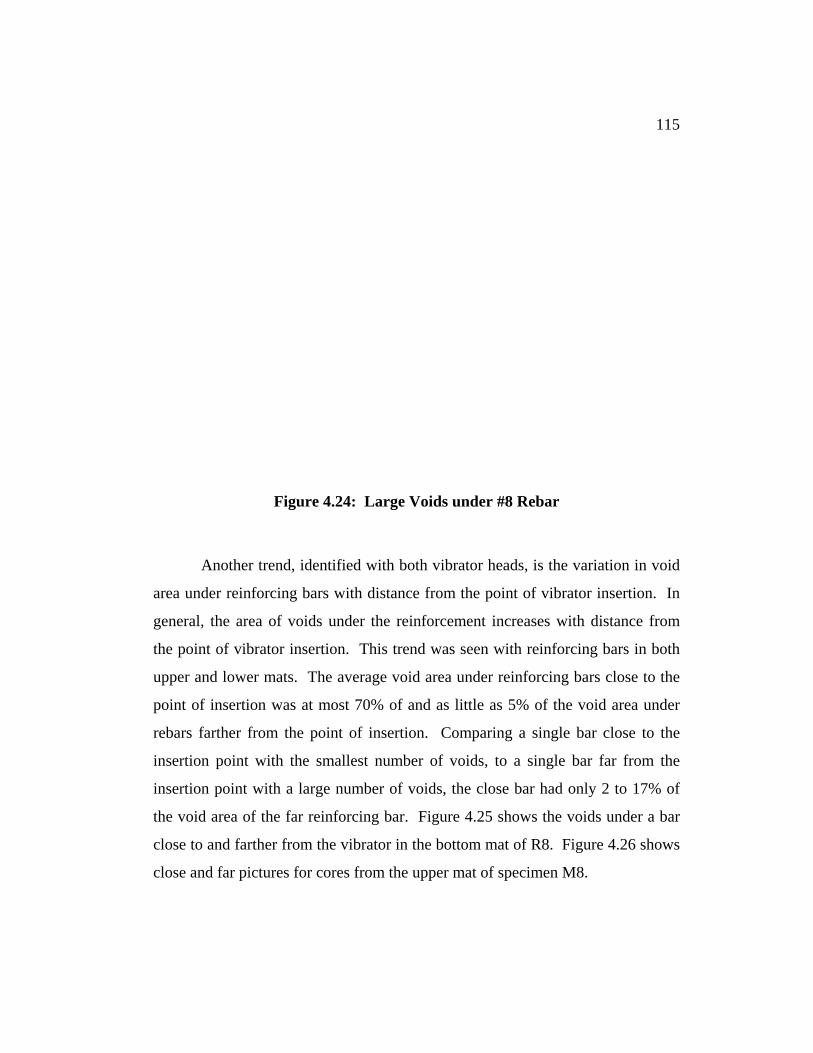
115
Figure 4.24: Large Voids under #8 Rebar
Another trend, identified with both vibrator heads, is the variation in void
area under reinforcing bars with distance from the point of vibrator insertion. In
general, the area of voids under the reinforcement increases with distance from
the point of vibrator insertion. This trend was seen with reinforcing bars in both
upper and lower mats. The average void area under reinforcing bars close to the
point of insertion was at most 70% of and as little as 5% of the void area under
rebars farther from the point of insertion. Comparing a single bar close to the
insertion point with the smallest number of voids, to a single bar far from the
insertion point with a large number of voids, the close bar had only 2 to 17% of
the void area of the far reinforcing bar. Figure 4.25 shows the voids under a bar
close to and farther from the vibrator in the bottom mat of R8. Figure 4.26 shows
close and far pictures for cores from the upper mat of specimen M8.

116
a) Air Voids Close to Point of Vibration Insertion
b) Air Voids Farther Away from Point of Vibrator Insertion
Figure 4.25: Voids under Bars from Specimen R8
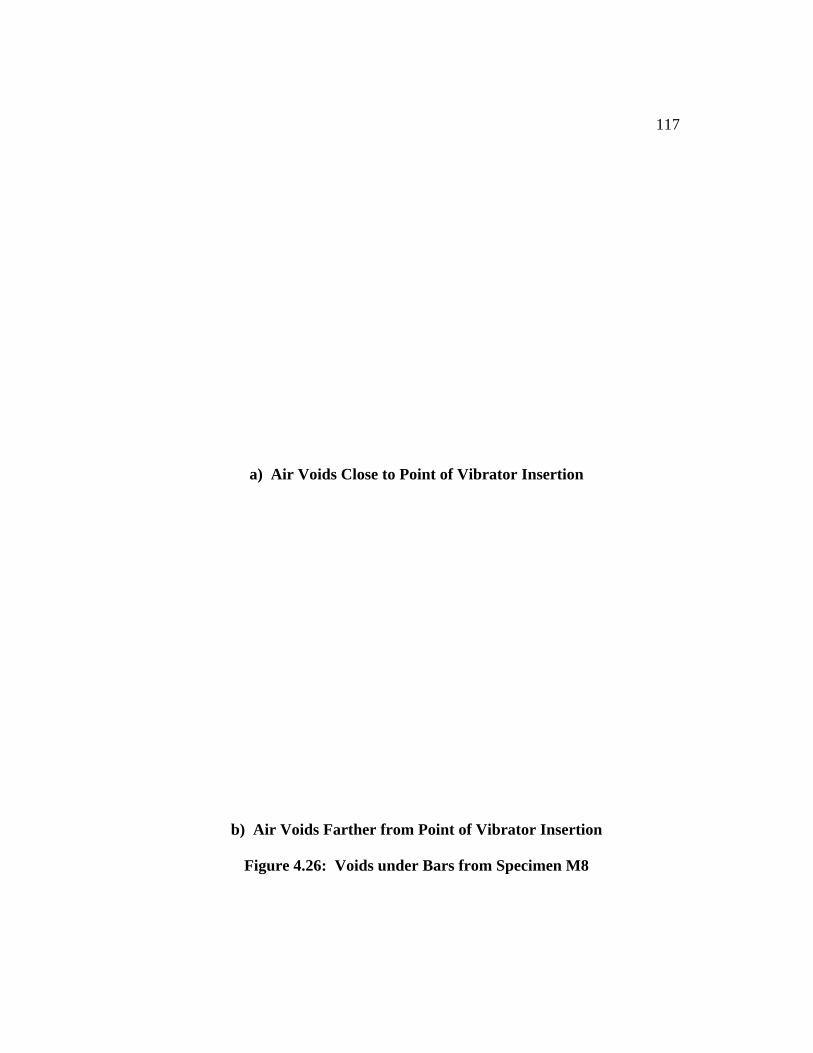
117
a) Air Voids Close to Point of Vibrator Insertion
b) Air Voids Farther from Point of Vibrator Insertion
Figure 4.26: Voids under Bars from Specimen M8
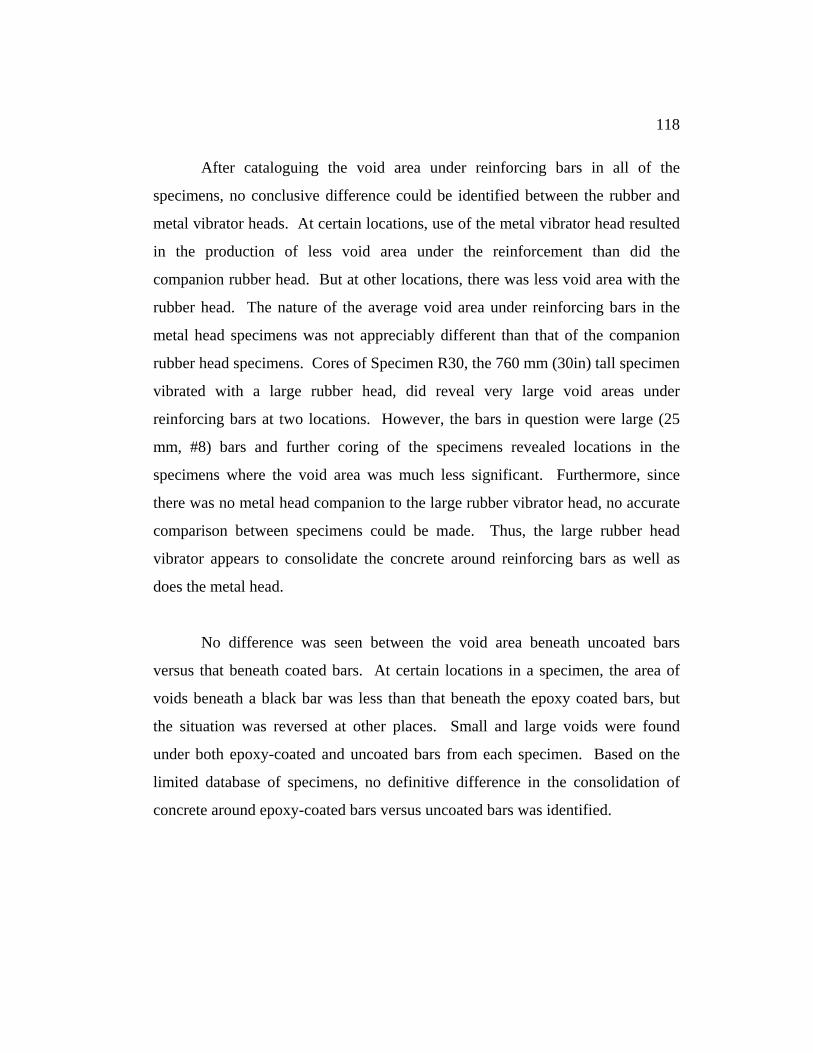
118
After cataloguing the void area under reinforcing bars in all of the
specimens, no conclusive difference could be identified between the rubber and
metal vibrator heads. At certain locations, use of the metal vibrator head resulted
in the production of less void area under the reinforcement than did the
companion rubber head. But at other locations, there was less void area with the
rubber head. The nature of the average void area under reinforcing bars in the
metal head specimens was not appreciably different than that of the companion
rubber head specimens. Cores of Specimen R30, the 760 mm (30in) tall specimen
vibrated with a large rubber head, did reveal very large void areas under
reinforcing bars at two locations. However, the bars in question were large (25
mm, #8) bars and further coring of the specimens revealed locations in the
specimens where the void area was much less significant. Furthermore, since
there was no metal head companion to the large rubber vibrator head, no accurate
comparison between specimens could be made. Thus, the large rubber head
vibrator appears to consolidate the concrete around reinforcing bars as well as
does the metal head.
No difference was seen between the void area beneath uncoated bars
versus that beneath coated bars. At certain locations in a specimen, the area of
voids beneath a black bar was less than that beneath the epoxy coated bars, but
the situation was reversed at other places. Small and large voids were found
under both epoxy-coated and uncoated bars from each specimen. Based on the
limited database of specimens, no definitive difference in the consolidation of
concrete around epoxy-coated bars versus uncoated bars was identified.

119
4.3.3 Concrete Density and Void Content
Sections were cut from cores of each of the specimens for determination
of the concrete’s density and permeable pore space. The test sections cut from the
cores were at least 80 mm (several inches) from the top surface of the concrete, to
ensure that surface finishing did not affect the results. All test sections were
about the same distance (about 18 cm (7 in) to 20 cm (8 in)) from the point of
insertion, and were from similar depths (8 cm (3 in) to 15 cm (6 in)) within the
concrete blocks. The density of the concrete and the volume of permeable pore
space were determined in accordance with ASTM C642.
The density and permeable void content of the rubber and metal head
specimens were almost identical. There was only 2.3% difference between the
largest and smallest test section densities. When the individual test section results
were averaged and rounded, the density for all specimens but Specimen M8 was
2370 kg m3 (148 pcf). The density for Specimen M8 was 2385 kg m3 (149 pcf).
The similarity of these figures reveals that all of the specimens were consolidated
to about the same degree, which was to a well consolidated state.
The volume of permeable pore space for each of the specimens is
presented in Table 4.1. In two of the three companion specimen pairs, the metal
head block had less permeable pore space. M8 had 7.6% less permeable voids
than R8, and M17 had 2.8% less than R17. In the third companion pair, R28 had
1.4% less voids than M28. Overall, vibration with the metal heads seemed to
produce less permeable void space than did vibration with the rubber head. Since
the difference between the two heads was minimal and the test database is quite
limited, results show no conclusive difference.
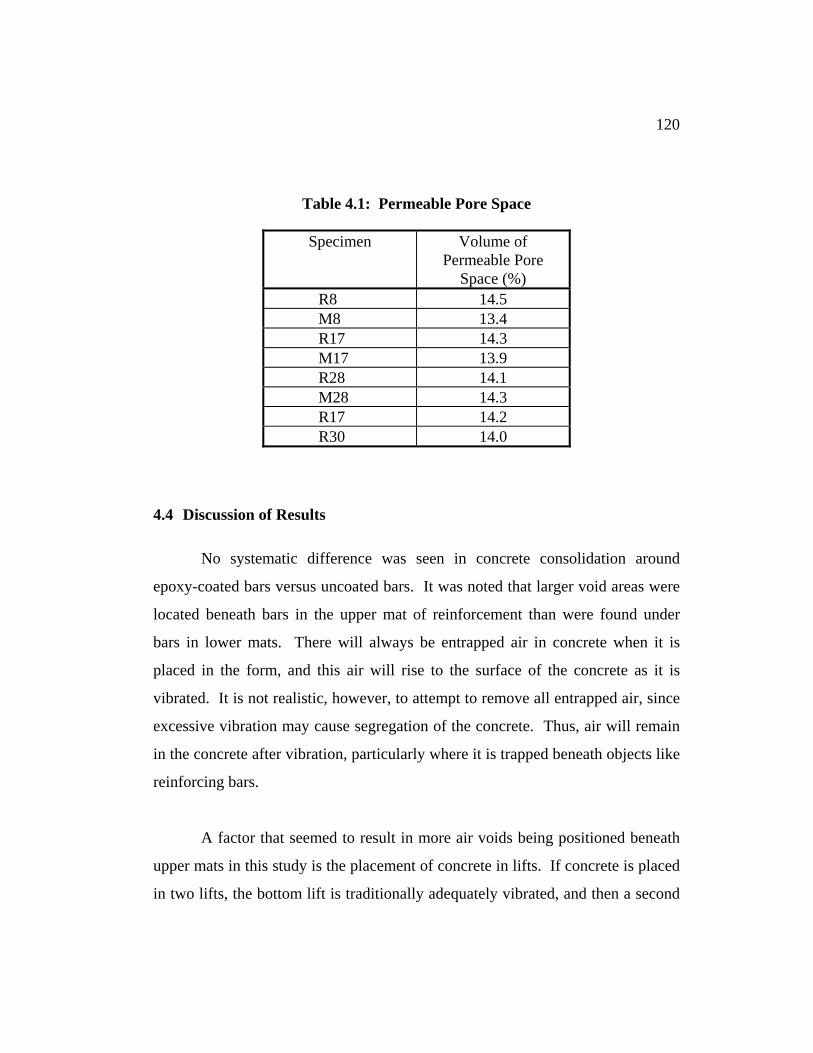
120
Table 4.1: Permeable Pore Space
Specimen Volume of Permeable Pore
Space (%) R8 14.5 M8 13.4 R17 14.3 M17 13.9 R28 14.1 M28 14.3 R17 14.2 R30 14.0
4.4 Discussion of Results
No systematic difference was seen in concrete consolidation around
epoxy-coated bars versus uncoated bars. It was noted that larger void areas were
located beneath bars in the upper mat of reinforcement than were found under
bars in lower mats. There will always be entrapped air in concrete when it is
placed in the form, and this air will rise to the surface of the concrete as it is
vibrated. It is not realistic, however, to attempt to remove all entrapped air, since
excessive vibration may cause segregation of the concrete. Thus, air will remain
in the concrete after vibration, particularly where it is trapped beneath objects like
reinforcing bars.
A factor that seemed to result in more air voids being positioned beneath
upper mats in this study is the placement of concrete in lifts. If concrete is placed
in two lifts, the bottom lift is traditionally adequately vibrated, and then a second

121
lift is placed on top of it. During the vibration of the second lift, the head of the
vibrator should be inserted several centimeters (a few inches) into the preceding
lift. Subsequently, the first lift receives additional vibration during the
consolidation of the top lift. Entrapped air bubbles in the first lift, near lower
reinforcement mats, have a second opportunity to escape. Air bubbles in the top
lift, however, do not have this advantage. And since the top mat of reinforcement
is often located within several centimeters ( a few inches) of the top surface of the
concrete, more air bubbles are left trapped in the vicinity of the upper mat.
Since the penetration of chlorides into concrete is often a top down
operation, particularly in bridge decks, voids beneath the top mat of
reinforcement will be the first ones encountered. Since reinforcing bars with
voids located beneath them have been shown to perform poorly, it would be
advantageous to ensure the bars in the top mat, as well as those in the other mats,
have as few voids beneath them as possible. Since it has been shown that there
are generally more voids located beneath the top layer of reinforcement, it would
be advisable to vibrate the top lift of the concrete, or the whole depth if the
concrete is cast in one lift, for longer periods to ensure air bubbles have sufficient
time to escape. Additionally, inserting the vibrator at more points in the concrete,
on a closer spaced interval, should help to remove the air bubbles from beneath
the top mat.
As noted, the density and permeable void content for specimens vibrated
with the two different heads were very similar. The permeable pore space was,
on average, less with the metal head than with the rubber head, but only slightly
so. Therefore, both heads produced specimens which were consolidated to about
the same degree.
122
4.5 Conclusions
More void areas are located under reinforcing bars farther from the point
of vibration insertion than closer to the insertion point, even when the concrete at
both locations is adequately consolidated. A certain schedule of vibration
insertions may adequately consolidate the concrete in a given area, but the void
area under bars at the edge of the area of influence may be unacceptable. Thus,
the radius of influence for adequate consolidation of concrete may be larger than
the radius of influence for removal of air voids beneath reinforcing bars. A closer
schedule of insertions seems to be required to ensure adequate removal of air
voids from beneath reinforcing bars than is required for consolidation of the
concrete.
Taking the area of influence for removal of void area beneath bars as 75%
of that required for concrete consolidation seems to be adequate. With this
reduced area of influence, the schedule of vibrator insertions will be increased.
With the closer spacing of insertion points, the average void area under
reinforcing bars should be reduced, particularly for those bars on the fringes of
the influence area. The reduction of void area under bars means there will be
fewer places where water can collect in close proximity to the reinforcement, and
as previously discussed, the corrosion performance of the bars should be
improved. Though a larger spacing of insertion points may adequately
consolidate a concrete specimen, a closer schedule of insertions may be required
to ensure that void areas under bars are removed.
The results of this study show that rubber vibrator heads have the ability
to produce well consolidated concrete. Concrete specimens were vibrated with
rubber heads until the rapid exit of air bubbles had ceased. Companion specimens
123
were vibrated with metal vibrator heads for equivalent periods of time. Both the
rubber and metal heads produced concrete which was adequately consolidated.
Both heads removed the large entrapped air bubbles from the concrete and the
density and permeable pore space was similar for specimens vibrated with each of
the heads. Thus, it has been shown that the rubber vibrator heads can produce
adequately consolidated concrete with a density comparable to that produced
using a metal head.
An investigation of concrete consolidation as a function of vibration time
was not performed in this study, but based on the results of Chapter 3, longer
periods of vibration will likely be required to consolidate a specimen with a
rubber vibrator head than with a metal head. This study shows, however, that
when concrete is sufficiently vibrated with a rubber head, i.e. until good
consolidation is observed visually, the rubber vibrator head can produce
adequately consolidated concrete. Based on ACI and PCA guidelines for times of
vibration required to consolidate concrete specimens, the period of vibration
required with the rubber heads was not excessive. Subsequently, the rubber heads
are considered satisfactory in their ability to produce well consolidated concrete.
124
Chapter 5
Summary, Conclusions, and Recommendations
5.1 Summary
The main objective of this study was to investigate the use of soft, rubber
vibrator heads for consolidation of concrete reinforced with epoxy-coated bars.
The rubber heads were appraised alongside typical metal vibrator heads and their
relative performance was compared. The vibrator heads were evaluated based on
1) the amount of damage done to coated bars during concrete placement, 2)
measurements of the vibrator action in fresh concrete during consolidation, and 3)
analysis of cores from hardened concrete after consolidation.
5.1.1 Damage to Epoxy Coating
Several test specimens were constructed in this investigation to aid in
evaluating vibrator damage to coated reinforcing bars. Companion specimen
pairs simulating column, footing, and slab sections were assembled. One
specimen was vibrated with the rubber vibrator head, while the metal head was
used to consolidate the companion specimen. The amount of vibrator damage to
each specimen’s reinforcement was assessed in a thorough visual examination
procedure. The extent of damage for each vibration test specimen with each of
the heads was tabulated and results for the two types of heads were compared.
For each of the specimen types, the rubber vibrator head did less damage
than did the metal head. The amount of damage with the metal head was, in some

125
instances, over five times that done with the rubber head. Generally, the average
amount of damage with the metal vibrator head was almost three times that done
with the rubber head. Additionally, the largest single damaged area on each
specimen’s reinforcement was greater, in almost every case, with the metal head
than with the rubber head. Thus, based on all normal measures of damage, the
metal vibrator heads produced significantly more damage than did their rubber
head companions.
5.1.2 Measurement of Vibration in Fresh Concrete
In this test, companion specimens were vibrated with a rubber and metal
vibrator head, respectively, as accelerometers recorded the vibratory action in the
concrete. The measurements taken in this study showed that during the
consolidation of the specimens, the metal head produced more significant
horizontal waves in the concrete than did the rubber head. Horizontal particle
accelerations with the metal head were greater than those with the rubber head,
both close to the insertion point of the vibrator, and farther out from this point.
More significant differences were noted between the two heads at points farther
from the point of insertion.
It was also observed that the frequency in the concrete during vibration
was about 10% less with the rubber head than with the metal head, but that
vertical particle accelerations were greater with the rubber head than with the
metal head. The larger vertical accelerations produced with the rubber head are
attributed to the physical characteristics of the rubber head.

126
5.1.3 Evaluation of Consolidation in Hardened Concrete
Several sets of companion specimens were prepared for consolidation with
a variety of metal and rubber vibrator heads. The specimens were allowed to cure
and harden after vibration, and then were cored. Cores from both metal and
rubber head specimens revealed that more voids are located under reinforcing
bars farther from the point of vibration insertion than there are closer to the
insertion point, even when the concrete at both locations is adequately
consolidated. The cores also showed more voids under the upper mat of
reinforcement in each specimen than were located beneath lower mats.
Both the rubber and metal heads produced concrete which was adequately
consolidated. Both heads removed the large entrapped air bubbles from the
concrete and the density and permeable pore space was similar for specimens
vibrated with each of the heads.
5.2 Conclusions
Rubber vibrator heads did less damage to coated reinforcement than did
comparable metal heads. Under similar conditions and with the same period of
vibration, metal heads produced more significant percentages of damage on a
coated bar and larger damaged spots than a rubber vibrator head. Based on
damage to epoxy-coated reinforcement, rubber vibrator heads are highly
recommended over typical metal heads.
With both metal and rubber heads, longer periods of vibration and tighter
clearances will result in the production of more damage to the coated bars. Direct

127
contact between either head and a coated bar for even very short periods can
result in significant damage to the epoxy coating.
Metal vibrator heads produced more significant horizontal accelerations
than do companion rubber heads, especially at larger distances from the point of
insertion. The area of influence with a metal vibrator head was larger than that of
a comparable rubber head, and the concrete was more efficiently, and rapidly,
consolidated with the metal head. However, with sufficient periods of vibration
and appropriate spacings of insertion points, a rubber vibrator head can
sufficiently consolidate concrete.
Based on results of consolidation tests with both metal and rubber heads,
it was found that more voids were located under reinforcing bars farther from the
point of vibration insertion than there were closer to the insertion point, even
when the concrete at both locations was adequately consolidated. The radius of
influence for adequate consolidation of concrete thus may be larger than the
radius of influence for removal of air voids beneath reinforcing bars. A closer
schedule of insertions seems to be required to ensure adequate removal of air
voids from beneath reinforcing bars than is required for consolidation of the
concrete. A reduction in air voids under bars should correlate with improved
corrosion performance, as there will be fewer places for water and corrosive
elements to collect in close proximity to the reinforcement.
5.3 Recommendations
Rubber vibrator heads should be specified for consolidation of concrete
with epoxy-coated reinforcement. The use of rubber heads will result in the

128
production of less damage to coated reinforcement, while adherence to proper
vibration procedures will ensure the concrete is adequately consolidated.
With both metal and rubber vibrator heads, the radius of influence for
adequate consolidation may be larger than that for removal of air voids beneath
reinforcement. Taking the area of influence for removing air voids as 75% of that
required for consolidation seems to be adequate. The subsequent increase in the
schedule of vibrator insertions will help to ensure that air voids beneath bars are
adequately removed and that the concrete is well consolidated. The reduction in
insertion point spacings should not have adverse affects, so long as the operator
follows proper procedures and is careful to avoid overvibrating the concrete.
With the use of rubber vibrator heads, the level of damage to the coated bars
should not be significantly worsened with the increased schedule of insertion
points.
Vibrator operators should be well trained in proper consolidation
procedures, especially when the concrete is reinforced with epoxy-coated bars.
Operators should not deliberately contact coated reinforcement with either metal
or rubber heads, and they should avoid cursory contact between the vibrating
head and reinforcing bars. The vibrator should not be dragged over coated bars,
nor should the head be forced into tight areas between a coated reinforcement
cage and formwork. Operators should be instructed on proper spacings of
insertion points for concrete vibrators, and special care should be taken to ensure
concrete reinforced with epoxy-coated reinforcement is adequately consolidated.
Since concrete placement is the last possible procedure during which the
coating on reinforcement can be damaged before it is put into service, and since

129
damage during concrete placement cannot be seen nor repaired, it is important
that all possible means be used to limit vibrator induced damage. Furthermore,
since the quality of concrete consolidation has substantial impact on the corrosion
performance of epoxy-coated reinforcement, it is also important to ensure that the
concrete in place is well consolidated. The proper use of rubber vibrator heads,
with a sufficient schedule of insertion points, should result in the manufacture of
the best possible product of concrete reinforced with epoxy-coated bars.

130
Appendix
Concrete Mix Specifications
A.1 Concrete Used in Column Damage Test
COMPONENT WEIGHT (lbs) Sand 4594
3/4 in Rock 5915 1 1/2 in Rock 2597
Cement 1432 Fly Ash 166 Water 320
Pozzolan 70 oz Air 8 %
NOTE: Additional 64 oz of superplasticizer added on site.
Cylinder Compressive Strength at 28 days = 1170 psi
A.2 Concrete Used in Footing Damage Test
COMPONENT WEIGHT (lbs) Sand 6520
3/4 in Rock 5760 1 1/2 in Rock 3640
Cement 2050 Fly Ash 660 Water 384
Pozzolan 100 Note : Additional 10 gallons of water added on site.
Cylinder Compressive Strength at 28 days = 5630 psi

131
A.3 Concrete used in Slab Damage Test and Hardened Concrete
Consolidation Test
COMPONENT WEIGHT (lbs) Sand 7461
3/4 in Rock 9422 Cement 1350 Fly Ash 400 Water 459
Pozzolan 53 oz Note: Additional 10 gallons of water added on site.
Cylinder Compressive Strength at 28 days = 3360 psi
A.4 Concrete used in Consolidation Test in Fresh Concrete
COMPONENT WEIGHT (lbs) Sand 4920
3/8 in Rock 6060 Cement 2145 Water 322
Pozzolan 130 Note: Additional 15 gallons of water added on site.
Cylinder Compressive Strength at 28 days = 6350 psi