Embed Size (px)
Citation preview


The Florida Institute of Phosphate Research was created in 1978 bythe Florida Legislature (Chapter 378.101, Florida Statutes) andempowered to conduct research supportive to the responsibledevelopment of the state's phosphate resources. The Institute hastargeted areas of research responsibility. These are: reclamationalternatives in mining and processing, including wetlandsreclamation, phosphogypsum storage areas and phosphatic claycontainment areas; methods for more efficient, economical andenvironmentally balanced phosphate recovery and processing;disposal and utilization of phosphatic clay; and environmentaleffects involving the health and welfare of the people, includingthose effects related to radiation and water consumption.
FIPR is located in Polk County, in the heart of the central Floridaphosphate district. The Institute seeks to serve as an informationcenter on phosphate-related topics and welcomes informationrequests made in person, by mail, or by telephone.
Research Staff
Executive DirectorRichard F. McFarlin
Research Directors
G. Michael Lloyd Jr. -Chemical ProcessingJinrong P. Zhang -BeneficiationSteven G. Richardson -ReclamationRobert S. Akins -MiningGordon D. Nifong -Environmental Services
Florida Institute of Phosphate Research1855 West Main StreetBartow, Florida 33830
(863) 534-7160Fax: (863) 534-7165

CONSOLIDATION CHARACTERISTICSDETERMINATION FOR PHOSPHATIC CLAYS
Final Report(FIPR contract No. 90-02-084)
VOLUME 3 : Results of Seepage-Induced ConsolidationTests on Phosphatic Clays
Prepared forFLORIDA INSTITUTE OF PHOSPHATE
1855 West Main StreetBartow, FL 33830
RESEARCH
Submitted by
A. Naser Abu-Hejleh, Dobroslav Znidarcicand Amy Robertson
Department of Civil, Environmentaland Architectural Engineering
University of ColoradoBoulder, CO 80309-0428
October 1992

DISCLAIMER
The contents of this report are reproduced herein as receivedfrom the contractor.
The opinions, findings and conclusions expressed herein are notnecessarily those of the Florida Institute of Phosphate Research,nor does mention of company names or products constitute endorse-ment by the Florida Institute of Phosphate Research.

Contents
1 Introduction 7
2 Tests on samples from C.F Industries ISA 102.1 Experimental results of seepage induced consolidation test . . 102.2 Parameter estimation of the constitutive parameters . . . . . 16
3 Tests on samples from Seminole H2B 193.1 Experimental results of seepage induced consolidation test . . 193.2 Parameter estimation of the constitutive parameters . . . . . 28
4 Tests on samples from Agrico SA-9 384.1 Seepage Induced Consolidation Test . . . . . . . . . . . . . . 384.2 Restricted Flow Consolidation Test . . . . . . . . . . . . . . . 394.3 Self Weight Consolidation Test . . . . . . . . . . . . . . . . . 434.4 Transient Consolidation Test . . . . . . . . . . . . . . . . . . 50
5 Tests on samples from Agrico SA-North 545.1 Seepage Induced Consolidation Test . . . . . . . . . . . . . . 545.2 Transient Consolidation Test . . . . . . . . . . . . . . . . . . 55
6 Tests on samples from Occidental 646.1 Seepage Induced Consolidation Tests . . . . . . . . . . . . . . 656.2 Transient Consolidation Test . . . . . . . . . . . . . . . . . . 65
7 Conclusions 75
8 References 77
1

3

5


Chapter 1
Introduction
This report contains results of the seepage induced consolidation tests on
phosphatic clay samples as well as results of verification tests performed on
the same material. The testing program was executed as a part of a research
project sponsored by FIPR in which the seepage induced consolidation test-
ing and analysis procedures have been implemented for the determination of
consolidation characteristics of phosphatic clays.
A total of five samples were tested in the program with multiple seepage
induced consolidation and verification tests performed on each sample. The
samples are identified by the mine names:
l C.F. Industries ISA
l Seminole H2B
l Agrico SA-9
7

l Agrico SA-North
l Occidental
The results presented here do not necessarily present “typical” properties
for the clays from stated mines since many factors will affect the particular
sample’s consolidation characteristics. A detailed discussion of these factors
is beyond the scope of the research project reported here. The purpose of the
tests presented here is to demonstrate the applicability of the seepage induced
consolidation test for the determination of consolidation characteristics of
phosphatic clays. The verification tests are used as an independent way of
evaluating that the results obtained from the seepage induced consolidation
test indeed represent reliable consolidation characteristics.
The details of the seepage induced consolidation testing and analysis pro-
cedures are given in separate reports that were prepared as a part of this
research project (Abu-Hejleh and Znidarcic, 1992; Znidarcic et al., 1992).
All the seepage induced consolidation tests reported here were performed
and analyzed following procedures described in the stated reports. Details
of these procedures will not be repeated here.
Field work in collecting the samples and some of the laboratory tests were
performed by Bromwell & Carrier, Inc. from Lakeland, Florida who were the
subcontractor in this project. The results of these tests are integrated in this
8

report together with the results of the seepage induced consolidation tests
performed at the University of Colorado at Boulder.
Tests on samples from C.F. Industries ISA and Seminole H2B were used
to determine the optimal testing parameters for the seepage induced consol-
idation tests while the other three samples (Agrico SA-9, Agrico SA-North
and Occidental) were tested with the developed “routine” procedure. For this
to be accomplished multiple tests were performed on the first two samples
while only a single test was performed on each of the other three samples.
Tests on the last three samples were also used in the process of verifying
that the parameters obtained in the seepage induced consolidation test are
the appropriate parameters for the numerical modeling of a consolidation
process in the given soil.
The testing results and analysis for each sample are given in separate
chapters together with the discussion of the results and the verification ex-
periments where appropriate. In the last chapter an overall discussion and
appropriate conclusions are given.
9

Chapter 2
Tests on samples from C.FIndustries ISA
The soil used in this test is designated as “Scientific Mineral Specimen, Sam-
ple C- 1 , Sampling Area 1.” The unit weight of the soil solid particles is
28.65KN and the unit weight of water is 9.81KN . The water used in this test
in designated as "Scientific Mineral Specimen, Sample W- 1 , Sampling Area
1". Liquid limit is 114% and plastic limit is 33%.
2.1 Experimental results of seepage inducedconsolidation test
Prior to performing a seepage-induced consolidation test, the following data
were determined :
l the top effective stress was determined as .392 kPa.
10
m3 m3
l The calibration coefficient was determined for transducer No. 1 as .227
kPa/Volt and for transducer No.2 as .853 kPa/volt.
l A dial reference reading was determined as 511; the sample height
which corresponds to this value is zero.
l The area of the sample container was determined as 82.2 cm2.
l Once the soft clay in the bucket was stirred up completely, the water
content of three samples were determined as 445.3%, 447.8%, 446.4%;
hence the initial void ratio is 13.07. This value also represents the void
ratio at zero effective stress.
11
Figure 2.1: Pressure Difference-Time from Seepage-Induced ConsolidationNo. 1.
All the experimental results of the seepage tests and the loading tests are
listed in Table 2.1. The bottom effective stress due to the self weight and
top effective stress is listed in the first row of the seepage test results. The
dial reference readings which corresponds to zero height is listed in the last
row of step loading test data.
In the seepage tests, the pressure difference response history for different
flow rates are shown in Figures 2.1 and 2.2. The pressure difference response
due to seepage flow under different vertical effective stress are shown in Fig-
ures 2.3 and 2.4.
12

Figure 2.2: Pressure Difference-Time from Seepage-Induced ConsolidationNo. 1.
13

Figure 2.3: Pressure Difference-Time from Seepage-Induced ConsolidationNo. 1. Effective stress=10 kPa.
14

Figure 2.4: Pressure Difference-Time from Seepage-Induced ConsolidationNo. 1. Effective Stress=29.2 kPa.
15

2.2 Parameter estimation of the constitu-tive parameters
The compressibility and permeability characteristics were obtained from pro-
gram SICTA using the following combinations of flow rates and levels of
loading :
l Run No. 1 : in this run the results of seepage induced-consolidation
under flow rate #7 and the step loading test under effective stress of
10 kPa were used.
l Run No. 2 : in this run the results of seepage induced-consolidation
under flow rate #7 and the step loading test under effective stress of
29.2 kPa were used.
l Run No. 3 : in this run the results of seepage induced-consolidation
under flow rate #8 and the step loading test under effective stress of
10 kPa were used.
l Run No. 4 : in this run the results of seepage induced-consolidation
under flow rate #8 and the step loading test under effective stress of
29.2 kPa were used.
Program SICTA results for these combinations are shown in Appendix
A.1.1. The estimated compressibility and permeability relationships for these
16

EFFECTIVE STRESS vs. VOID RATIOTEST NO. 1
Figure 2.5: Compressibility Characteristics of Phosphatic Clay Sample fromC.F Industries ISA.
combinations are shown in graphical form in Figures 2.5 and 2.6, respectively.
17

Figure 2.6: Permeability Characteristics of Phosphatic Clay Sample fromC.F Industries ISA.
18

Chapter 3
Tests on samples fromSeminole H2B
The soil used in this test is designated as “Seminole 7705 Top Slime 1”. The
unit weight of the soil solid particles is 26.6 KN and the unit weight of water
is 9.81 KN . The water used in this test in designated as “Seminole Surface
Water 1”. Liquid limit is 198% and plastic limit is 50%.
3.1 Experimental results of seepage inducedconsolidation test
Three seepage-induced consolidation tests were conducted on top slime semi-
nole soil. The average initial void ratio was measured as 35.8. The average
void ratio at zero effective stress was determined as 32.5. Using the value
of void ratio at zero effective stress and the mass of solid of each sample,
the initial height for each sample was determined and are listed in Tables
19
m3
m3

3.1, 3.2, 3.3. Also listed in these tables, the height of solid, Hs , the bottom
effective stress due to the top effective stress and self weight of the sample
and the results of the seepage and step loading tests.
The transducer used in the first test has a calibration coefficient of .207
kPa/volt and the transducer used in the second and the third test has a
calibration coefficient of .494 kPa/volt.
In the second test, the seepage induced consolidation was triggered with
v = #10 under top effective stress of .034 kPa and the pressure difference
response is shown in Figure 3.1. This figure shows that channelling has
occurred. Hence, the top effective stress was increased to .406 kPa. The
pressure difference under v = 95%#8 is shown in Figure 3.2. The pressure
difference due to different flow rates under different vertical effective stresses
are shown in Figures 3.3, 3.4.
20

Figure 3.1: Pressure Difference-Time Response from Seepage-Induced Con-solidation Test No. 2, Top Effective Stress=.034 kPa
21

Figure 3.2: Pressure Difference-Time Response from Seepage-Induced Con-solidation Test No. 2, Top Effective Stress=.406 kPa
22
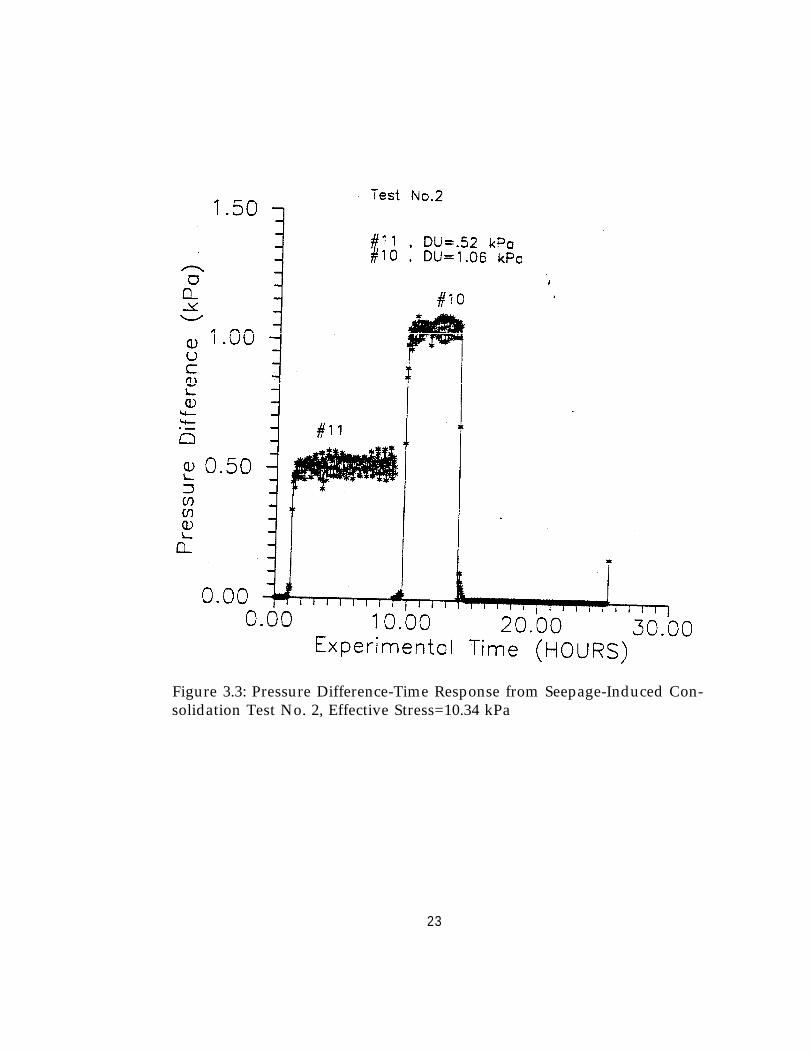
Figure 3.3: Pressure Difference-Time Response from Seepage-Induced Con-solidation Test No. 2, Effective Stress=10.34 kPa
23

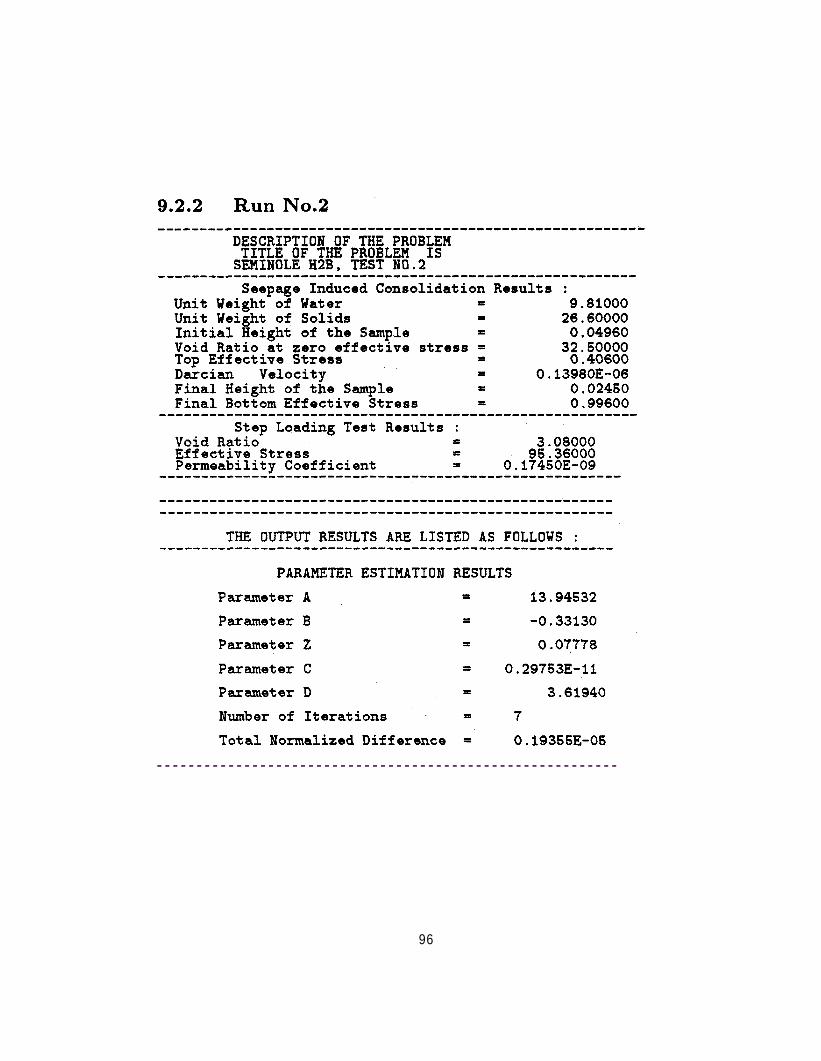
Figure 3.4: Pressure Difference-Time Response from Seepage-Induced Con-solidation Test No. 2, Effective Stress=95.36 kPa
24

Figure 3.5: Pressure Difference-Time Response from Seepage-Induced Con-solidation Test No. 3
In the third test, the seepage induced consolidation was triggered with
v = #9 and v = #8 under top effective stress of .034 kPa and the obtained
pressure difference response is shown in Figure 3.5. The pressure difference
due to different flow rates under different effective stresses are shown in Fig-
ures 3.6, 3.7.
In the fourth test, the seepage induced consolidation was triggered with
v = #8 and v = #7 under top effective stress of .1 kPa and the obtained
pressure difference response is shown in Figures 3.8, 3.9. The pressure dif-
ference due to different flow rates under different effective stresses are shown
25

Figure 3.6: Pressure Difference-Time Response from Seepage-Induced Con- solidation Test No. 3. Effective Stress=7.85 kPa
26
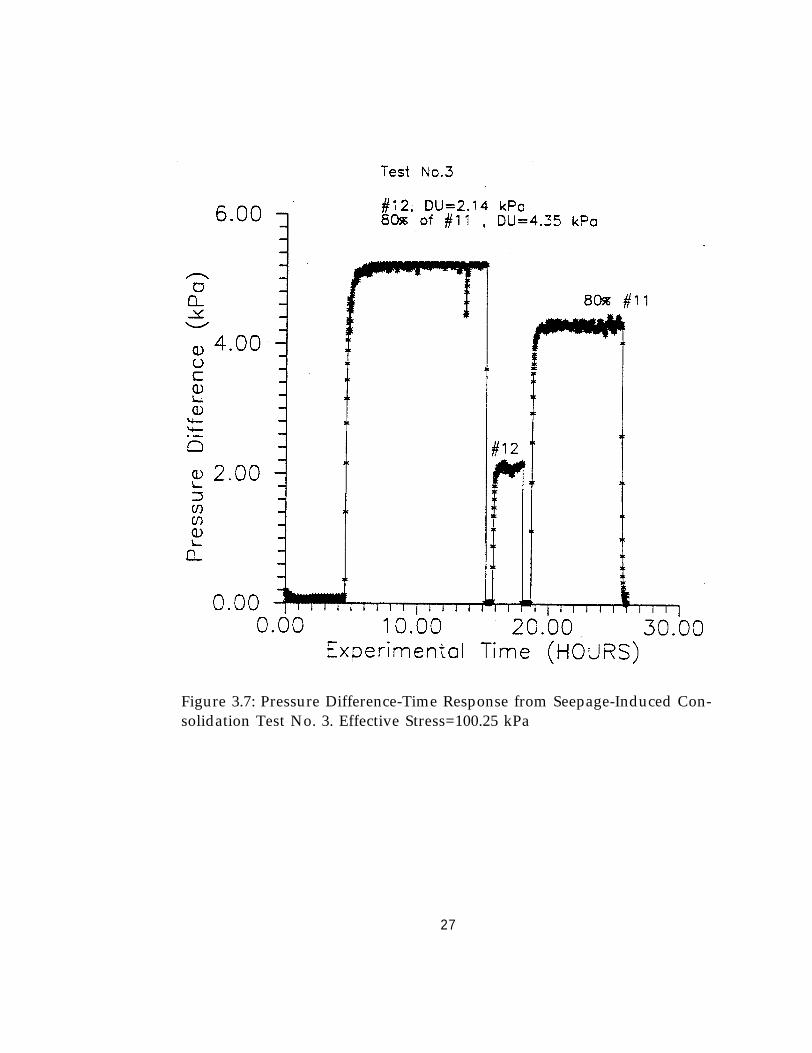
Figure 3.7: Pressure Difference-Time Response from Seepage-Induced Con-solidation Test No. 3. Effective Stress=100.25 kPa
27

3.2 Parameter estimation of the constitu-tive parameters
The compressibility and permeability characteristics were obtained from pro-
gram SICTA using the experimental data of Tests No. 1, No. 2 No. 3 and No. 4
for different combinations of flow rates and levels of loading:
l Run No. 1 : in this run the results of seepage induced-consolidation Test
No. 2 under flow rate 95%#8 and the step loading test under effective
stress of 10.34 kPa were used.
l Run No. 2 : in this run the results of seepage induced-consolidation Test
No. 2 under flow rate 95%#8 and the step loading test under effective
28

Figure 3.8: Pressure Difference-Time Response from Seepage-Induced Con-solidation Test No. 4
29

Figure 3.9: Pressure Difference-Time Response from Seepage-Induced Con-solidation Test No. 4
30
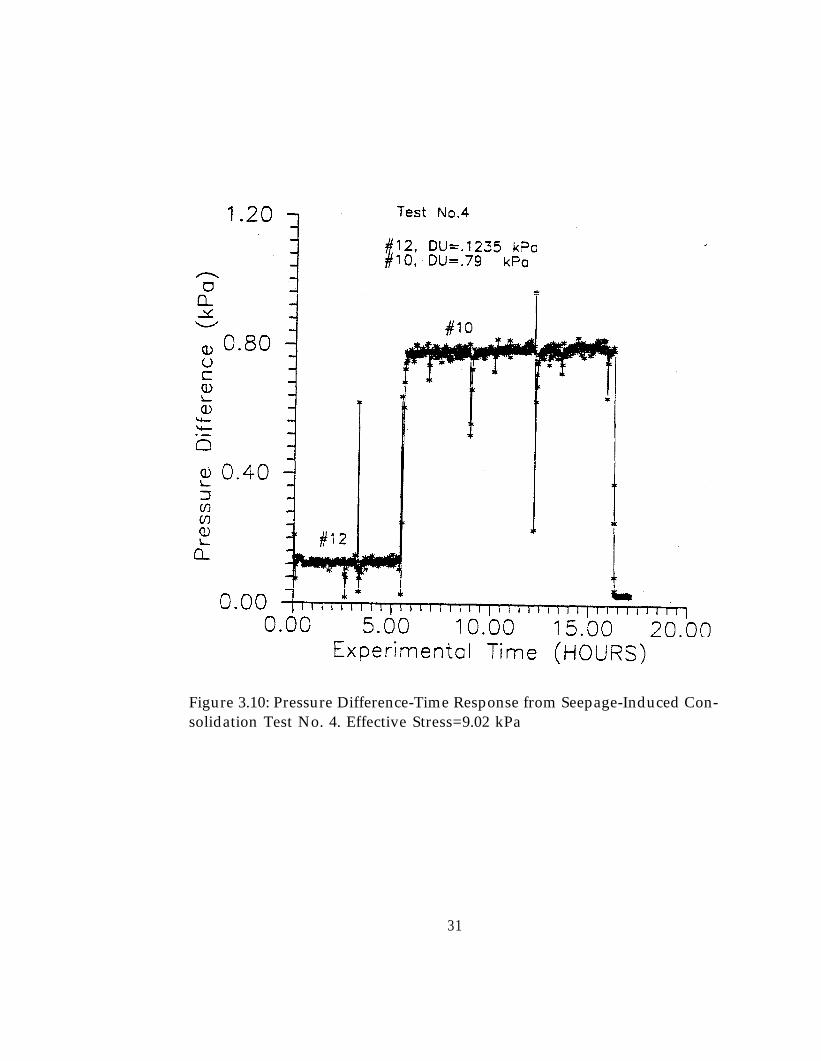
Figure 3.10: Pressure Difference-Time Response from Seepage-Induced Con-solidation Test No. 4. Effective Stress=9.02 kPa
31

Figure 3.11: Pressure Difference-Time Response from Seepage-Induced Con-solidation Test No. 4. Effective Stress=99.47 kPa
32

stress of 95.36 kPa were used.
l Run No. 3 : in this run the results of seepage induced-consolidation Test
No. 3 under flow rate #8 and the step loading test under effective stress
of 7.85 kPa were used.
l Run No. 4 : in this run the results of seepage induced-consolidation
Test No. 3 under flow rate #8 and the step loading test under effective
stress of 100.25 kPa were used.
l Run No. 5 : in this run the results of seepage induced-consolidation Test
No. 4 under flow rate #7 and the step loading test under effective stress
of 9.02 kPa were used.
l Run No. 6 : in this run the results of seepage induced-consolidation Test
No. 4 under flow rate #7 and the step loading test under effective stress
of 99.47 kPa were used.
l Run No. 7 : in this run the results of seepage induced-consolidation Test
No. 4 under flow rate #8 and the step loading test under effective stress
of 9.02 kPa were used.
l Run No. 8 : in this run the results of seepage induced-consolidation Test
No. 4 under flow rate #8 and the step loading test under effective stress
of 99.47 kPa were used.
33

Figure 3.12: Compressibility Characteristics of Phosphatic Clay Sample fromSeminole H2B Using the Results of Tests No. 2, No. 3
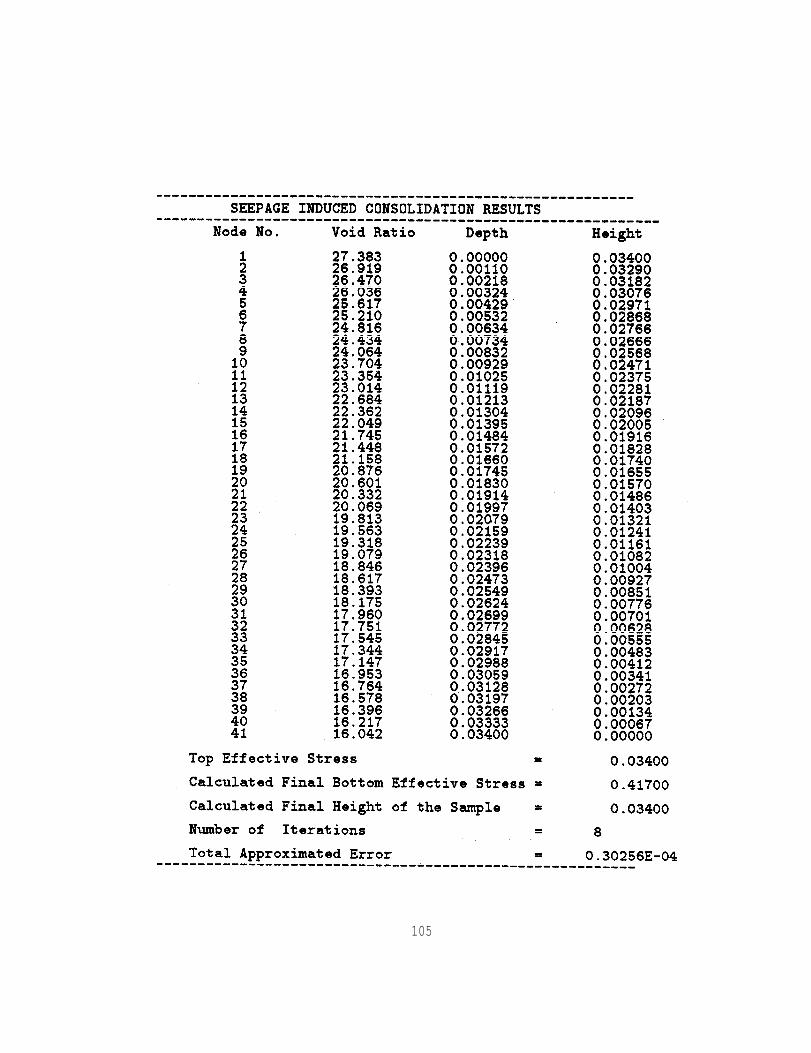
Program SICTA results for these combinations are shown in Appendix
A.1.2 The estimated compressibility and permeability relationships in graph-
ical form for the four first combinations are shown in Figure 3.12 and Figure
3.14, respectively, and for the second four combinations are shown in Figure
3.13 and Figure 3.15, respectively.
34

Figure 3.13: Compressibility Characteristics of Phosphatic Clay Sample fromSeminole H2B Using the Results of Test No. 4
35

Figure 3.14: Permeability Characteristics of Phosphatic Clay Sample fromSeminole H2B Using the Results of Tests No. 2, No. 3
36

Figure 3.15: Permeability Characteristics of Phosphatic Clay Sample fromSeminole H2B Using the Results of Test No. 4
37

Chapter 4
Tests on samples from AgricoSA-9
Several tests were performed on this sample in order to verify that the ma-
terial characteristics obtained from the seepage induced consolidation test
properly represent consolidation properties of the material. The tests in-
cluded seepage induced consolidation, restricted flow consolidation and self
weight consolidation tests. Unit weight of solids for this sample is 27.66
kN/m3, liquid limit is 233% and plastic limit is 49%.
4.1 Seepage Induced Consolidation Test
One seepage induced consolidation test was performed on the soil sample
using the routine procedure developed in this project. Table 4.1 contains
the output of the analysis procedure using SICTA program. The table also
summarizes the essential testing variables. The consolidation characteristics
38

are presented in the form of void ratio - effective stress and void ratio -
permeability relationships in Figures 4.1 and 4.2.
4.2 Restricted Flow Consolidation Test
One restricted flow consolidation test was performed at the BCI laboratory
in Lakeland, Florida on a sample of the same material. The testing tech-
nique and analysis procedure for the restricted flow consolidation test are
documented in the reports by Lee and Sills (1981) and Sills et al (1984). The,
data from this test together with the fitted exponential curves are presented
in Figures 4.3 and 4.4. The compressibility and permeability curves obtained
from the seepage induced consolidation and the restricted flow consolidation
tests are replotted in Figures 4.5 and 4.6 in the same units for an easy com-
parison. A good agreement between the two sets of results is noted with only
notable deviation in the low effective stress range. For that range the data
reported for the restricted flow consolidation test show substantial scatter in-
dicating that the procedure may not be as reliable in the low effective stress
range as it is for higher stress level. This observation is particularly clear in
the void ratio - permeability relationship where for the void ratio of about
20 the permeability varies over more than one order of magnitude for a small
change in the void ratio. A simple power function was fitted to compress-
ibility data from the restricted flow consolidation test while an expanded
39

40

Figure 4.1: Void Ratio - Effective Stress Relationship from SICTA for AgricoSA-9 Sample.
41

Figure 4.2: Void RatioSA-9 Sample.
Permeability Relationship from SICTA for Agrico
42

power function was used in the analysis of the seepage induced consolidation
test. Since the simple function does not recognize the maximum void ratio
for a given sample it extrapolates to the low effective stress from the data
obtained at higher stress level leading to a further disagreement between the
two techniques.
In conclusion it can be stated that despite the noted differences the two
testing techniques, restricted flow consolidation and seepage induced con-
solidation, yield essentially the same consolidation characteristics for soft
phosphatic clays with the seepage induced consolidation test producing less
ambiguous results in the low effective stress range. This statement will be
supported with the additional evidence in the following sections of the report.
4.3 Self Weight Consolidation Test
One self weight consolidation test was performed on a sample of this material.
In the test a column of phosphatic slurry 0.328 m high and initially at a
uniform void ratio of 18.4 was allowed to settle under its own weight for a
month and the slurry height was measured regularly during that time. The
obtained data are plotted in Figure 4.7 together with the prediction from a
consolidation analysis using the soil parameters obtained from the seepage
induced consolidation test. A good agreement between the experiment and
the analysis is noted up to 400 hours of elapsed time while in the later stage
43

Figure 4.3: Void Ratio - Effective Stress Relationship from Restricted FlowTest for Agrico SA-9 Sample.
44

Figure 4.4: Void Ratio - Permeability Relationship from Restricted Flow Testfor Agrico SA-9 Sample.
45

Figure 4.5: Void Ratio - Effective Stress Relationship Comparison for AgricoSA-9 Sample.
46

Figure 4.6: Void Ratio - Permeability Relationship Comparison for AgricoSA-9 Sample.
47

the experimental settlement rate is slower than the numerical prediction.
The height difference at 800 hours is 5 mm. This discrepancy is possibly
caused by the side friction between the soil and the column container. The
height to diameter ratio for this sample was 1.7 which could affect the results
especially in the later part of the experiment when higher effective stresses
develop in the sample and at the soil - container interface.
The presented results clearly demonstrate that the seepage induced con-
solidation test yields reliable consolidation characteristics for phosphatic clays
and especially that the permeability values obtained at the highest void ra-
tio is accurate. Namely, in the self weight consolidation of a slurry with a
uniform initial void ratio the settlement rate is initially constant and it can
be calculated as:
(4.1)
where ST is settlement rate; Gs is specific gravity; eo is the initial void
ratio; and k is the hydraulic conductivity at the initial void ratio. A dotted
line with this slope is indicated in Figure 4.7. This comparison is the only
direct and independent verification of permeability measurement at high void
ratios.
48

Figure 4.7: Self Weight Consolidation Test and Analysis Results.
49

4.4 Transient Consolidation Test
A further verification of the constitutive properties obtained from the seep-
age induced consolidation test can be achieved by modeling any consolidation
process in the soil. In the seepage induced consolidation test the steady state
condition is used as the basis for determining the soil parameters through
the solution of the appropriate inverse problem. However, in order to reach
this steady state the sample initially passes through a transient phase of
consolidation. This phase is routinely monitored in the experiment and the
generated pore pressure is recorded. This consolidation process gives the
opportunity for an independent verification of the obtained parameters. Fig-
ures 4.8 and 4.9 show the measured pore pressure record during the transient
phase of the seepage induced consolidation test as well as the results of the
numerical simulation with the parameters obtained from the steady state
analysis. In Figure 4.8 the seepage induced consolidation process was in-
terrupted several times in order to reset the flow pump that controlled the
induced flow rate. The cumulative time of these interruptions should be sub-
tracted prior to comparing the numerical analysis to the recorded data. This
is accomplished in Figure 4.9 where a good agreement is noted between the
experimental data and the analysis. Again it is emphasized that only the
ultimate pressure difference was used in the analysis and the agreement of
50

the transient portion of the experiment presents an independent verification
of the seepage induced consolidation test.
51

Figure 4.8: Seepage Induced Consolidation Data and Analysis for AgricoSA-9 Sample.
52

Figure 4.9: Corrected Seepage Induced Consolidation Data and Analysis forAgrico SA-9 Sample.
53
Chapter 5
Tests on samples from AgricoSA-North
One seepage induced consolidation test was performed on this sample and the
transient portion of the test was used to verify that the material characteris-
tics obtained from the seepage induced consolidation test properly represent
consolidation properties of the material. Unit weight of solids for this sample
is 25.51 kN/m3, liquid limit is 318 % and plastic limit is 74%.
5.1 Seepage Induced Consolidation Test
The seepage induced consolidation test performed on the soil sample fol-
lowed the routine procedure developed in this project. Table 5.1 contains
the output of the analysis procedure using SICTA program. The table also
summarizes the essential testing variables. The consolidation characteris-
tics are presented in the form of void ratio - effective stress and void ratio -
54

permeability relationships in Figures 5.1 and 5.2.
5.2 Transient Consolidation Test
Again in this test the transient portion of the seepage induced consolidation
test was used for an independent verification of the obtained parameters.
Figures 5.3, 5.4 and 5.5 show the measured pore pressure record during the
transient phase of the seepage induced consolidation test as well as the results
of the numerical simulation with the parameters obtained from the steady
state analysis. The seepage induced consolidation process shown in Figure 5.3
was interrupted several times in order to reset the flow pump that controlled
the induced flow rate. The cumulative time of these interruptions should be
subtracted prior to comparing the numerical analysis to the recorded data.
The experimental data in this figure also show an initial curvature concave
downwards while the analysis indicates that it should be concave upwards
or at best the pore pressure should be represented by a straight line. The
discrepancy is a consequence of assuming in the analysis that the sample
reached a fully consolidated state under the self weight prior to the initiation
of the seepage induced consolidation phase. This is demonstrated in Figure
5.4 in which in addition to subtracting the cumulative time of the flow in-
terruptions the second numerical prediction was added. In this prediction it
was assumed that the sample did not consolidate at all under its own weight
55

56
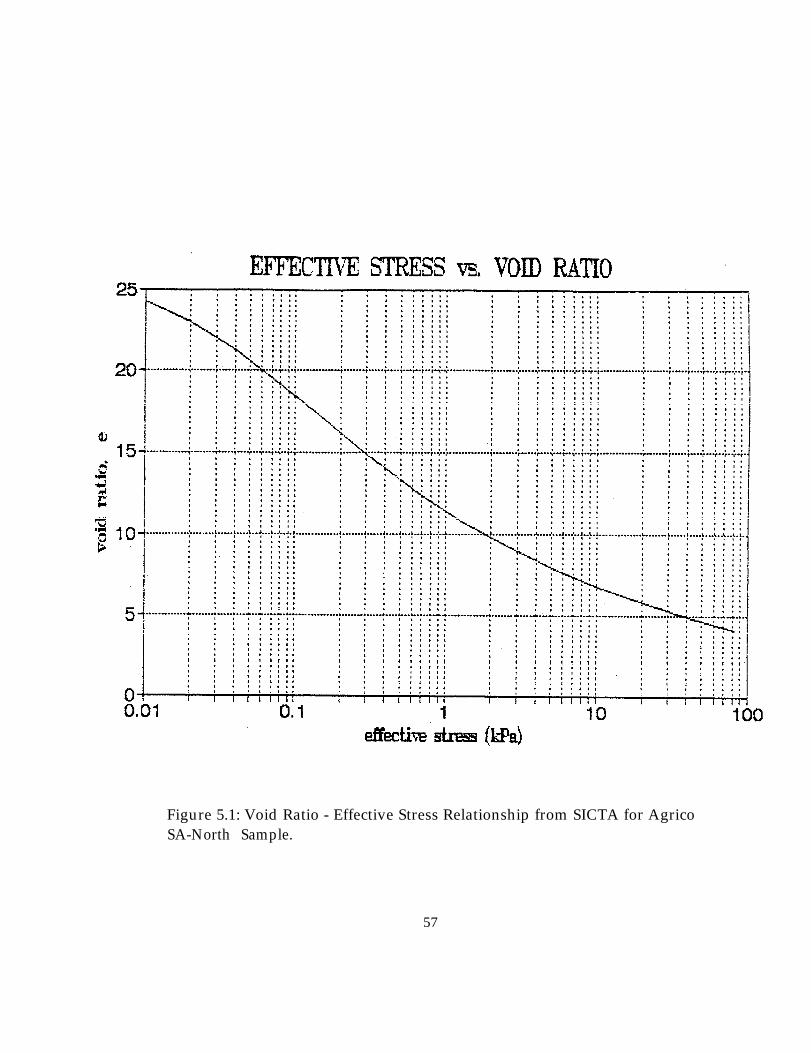
Figure 5.1: Void Ratio - Effective Stress Relationship from SICTA for AgricoSA-North Sample.
57
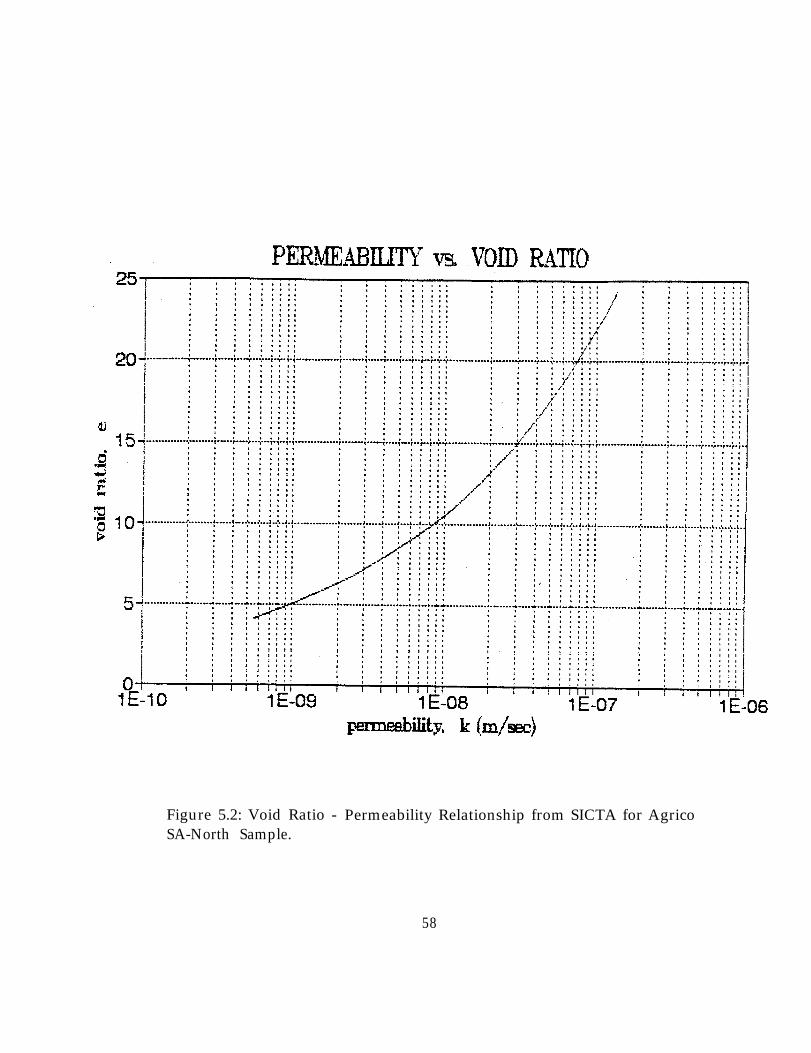
Figure 5.2: Void Ratio -SA-North Sample.
Permeability Relationship from SICTA for Agrico
58

prior to the initiation of the flow process i.e. that the seepage induced consol-
idation test started immediately after placing the specimen in the apparatus.
This second prediction shows a downward concave pore pressure response of
the sample confirming that in the test some excess pore pressure existed prior
to the initiation of the seepage induced consolidation. The two limiting anal-
yses nicely bracket the test results. The seepage induced consolidation test
started after an overnight self weight consolidation that lasted for 16 hours.
A new analysis was performed in which a self weight consolidation lasting 16
hours was followed by the seepage induced consolidation process. The results
of the analysis are compared to the experimental results in Figure 5.5 show-
ing a very good agreement an verifying that parameters obtained from the
seepage consolidation test and analysis accurately represent the consolidation
characteristics of phosphatic clays
This example nicely demonstrates that the complete self weight consolida-
tion of the sample is not needed for a reliable determination of consolidation
characteristics in the seepage induced consolidation test. Thus, irrespectively
of the consolidation characteristics of the sample the seepage induced consol-
idation phase can be started immediately after a full saturation of the system
is assured by an overnight back pressure application. Note that the steady
state was reached in this sample after a substantially longer period of time
than for the sample Agrico 9 presented in Chapter 4. While Agrico - North
59

Figure 5.3: Seepage Induced Consolidation Data and Analysis for AgricoSA-North Sample.
60

Figure 5.4: Corrected Seepage Induced Consolidation Data and Analysis forAgrico SA-North Sample.
61

Figure 5.5: Adjusted Seepage Induced Consolidation Data and Analysis forAgrico SA-9 Sample.
62

sample has somewhat lower permeability the main reason for the large differ-
ence in the consolidation time comes from a much higher initial void ratio of
this sample. The same arguments explain why the self weight consolidation
was completed prior to the seepage induced consolidation test on the Agrico
9 sample, though the elapsed time between the specimen preparation and
the beginning of the test was roughly equal for both samples.
63

Chapter 6
Tests on samples fromOccidental
Two seepage induced consolidation tests were performed on this sample and
the transient portion of the test was used to verify that the material char-
acteristics obtained from the seepage induced consolidation test properly
represent consolidation properties of the material. This sample was received
as a bulk clay with the water content of around 120%. The consistency of
the soil was such that in order to prepare a slurry sample additional water
had to be added to the soil. For the two samples, designated Occidental 1
and Occidental 2 the initial water content was 290% and 342%, respectively.
Unit weight of solids for this sample is 26.78 kN/m3, liquid limit is 174% and
plastic limit is 44%.
64

6.1 Seepage Induced Consolidation Tests
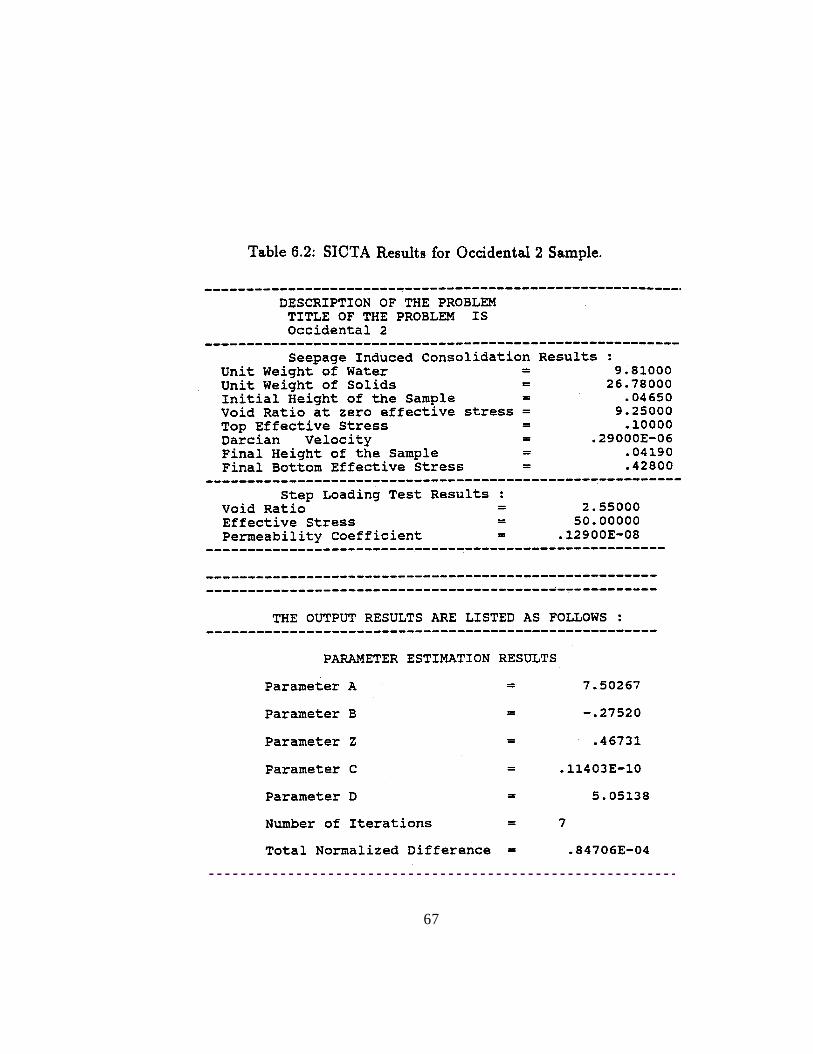
The seepage induced consolidation tests performed on the two soil specimens
followed the routine procedure developed in this project. Tables 6.1 and
6.2 contain the outputs of the analysis procedure using SICTA program.
The tables also summarize the essential testing variables for each test. The
consolidation characteristics are presented in the form of void ratio - effective
stress and void ratio - permeability relationships in Figures 6.1, 6.2, 6.3 and
6.4.
The two tests on the Occidental sample demonstrate the variation of
material properties for phosphatic clays that could be expected when two
samples of the same material have different initial void ratios.
6.2 Transient Consolidation Test
Again in these tests the transient portion of the seepage induced consolida-
tion tests was used for an independent verification of the obtained param-
eters. Figures 6.5 and 6.6 show the measured pore pressure record during
the transient phase of the seepage induced consolidation test as well as the
results of the numerical simulation with the parameters obtained from the
steady state analysis. A good agreement between the data and the analysis
prediction is noted for both experiments verifying again that parameters ob-
65

66
67

Figure 6.1: Void Ratio - Effective Stress Relationship from SICTA for Occi-dental 1 Sample.
68

Figure 6.2: Void Ratio - Permeability Relationship from SICTA for Occiden-tal 1 Sample.
69

Figure 6.3: Void Ratio - Effective Stress Relationship from SICTA for Occi-dental 2 Sample.
70
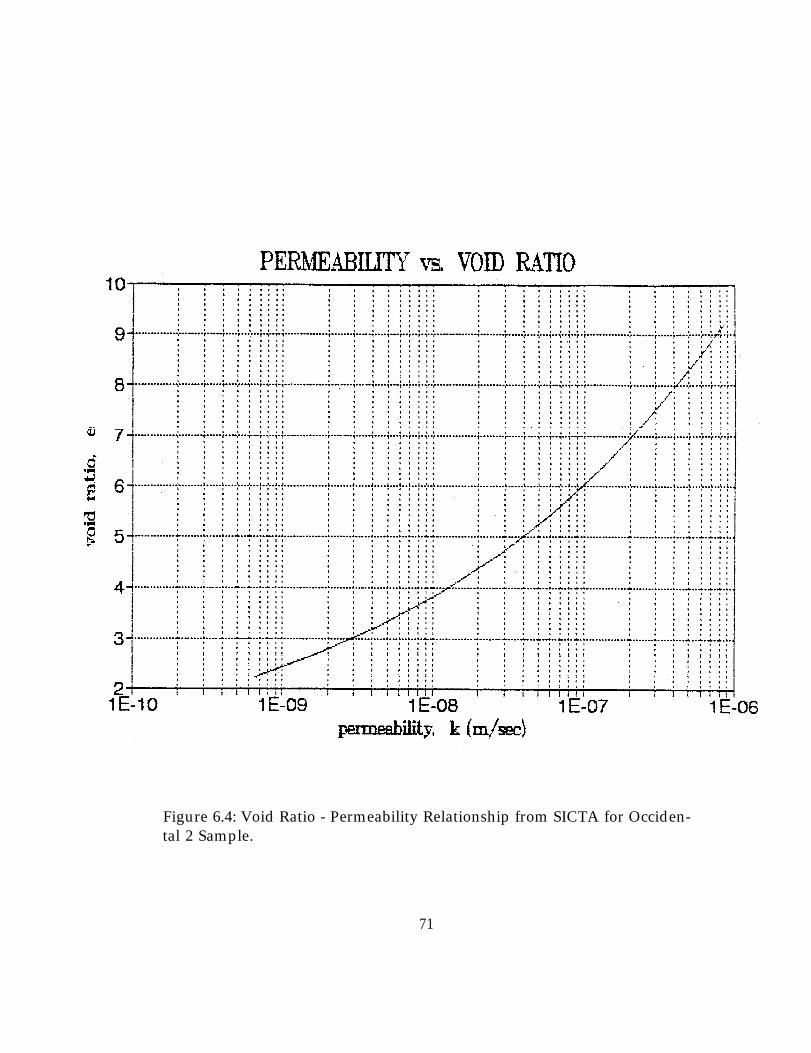
Figure 6.4: Void Ratio - Permeability Relationship from SICTA for Occiden-tal 2 Sample.
71

tained from the seepage consolidation test and analysis accurately represent
the consolidation characteristics of phosphatic clays.
72
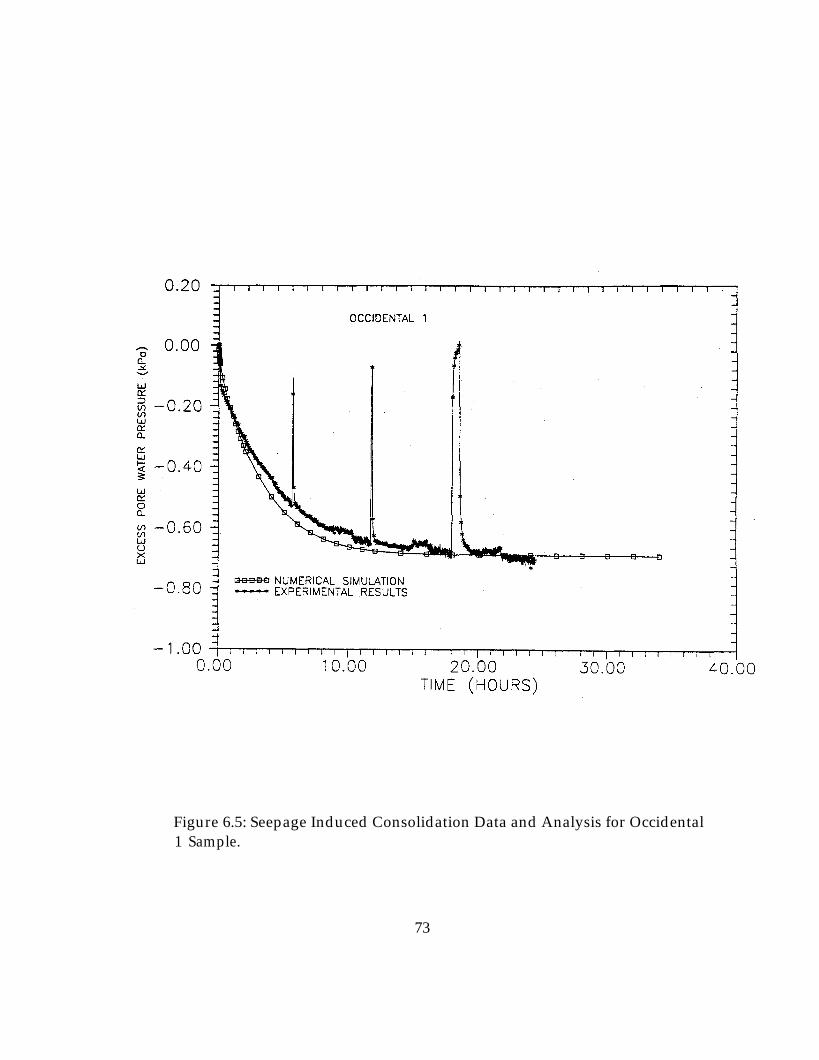
Figure 6.5: Seepage Induced Consolidation Data and Analysis for Occidental1 Sample.
73

Figure 6.6: Seepage Induced Consolidation Data and Analysis for Occidental2 Sample.
74

Chapter 7
Conclusions
The experiments reported here clearly demonstrate that the new testing tech-
nique and analysis procedure based on the seepage induced consolidation test-
ing produce reliable consolidation characteristics for phosphatic clays. The
testing technique does not require significant interventions of the operator
during testing and the analysis is implemented in a user friendly computer
program. The data from the independent experiments further demonstrate
the advantages of the new methodology as well as the level of accuracy of
the new technique.
While all the objectives of the research project have been accomplished
with the experiments reported here, a carefully planned additional test-
ing program could provide valuable information on the influence of vari-
ous factors on the consolidation characteristics of phosphatic clays. The
new methodology provides a convenient and reliable method for evaluating
75
material characteristics necessary for predicting field behavior of potential
reclamation schemes without huge investments required for their field imple-
mentation. Analyses based on the obtained material characteristics could be
used to screen the potential methods and only the most promising one could
then be implemented in the field for the final verification.
76

Chapter 8
References
1. Abu-Hejleh, A. N. and Znidarcic, D., 1992, User Manual for Computer
Program SICTA, Report prepared for FIPR, University of Colorado,
Boulder
2. Lee, K. and Sills, G.C., 1981, One Dimensional Consolidation with
Restricted Drainage, Oxford University Engineering Report
3. Sills, G.C., Hoare, S. D. L. and Baker, N., 1984, An Experimental As-
sessment of the Restricted Flow Consolidation Test, Oxford University
Engineering Report SM052/84
4. Znidarcic, D., Abu-Hejleh, A.N., Fairbanks, T. and Robertson, A.,
1992, Seepage Induced Consolidation Test, Equipment Description and
Users Manual, Report prepared for FIPR, University of Colorado, Boul-
der
77

Chapter 9
Appendix A : Estimation ofthe Compressibility andPermeability Parameters usingthe Results of Seepage Testsand Program SICTA
78

79

80

81

82

83

84

85
86

87
88

89

90

91

92

93

94

95
96

97

98

99

100


102

103

104
105

106

107

108

109

110

111

112

113

114

115

116

117