Embed Size (px)
Citation preview

NREL is a national laboratory of the U.S. Department of Energy Office of Energy Efficiency & Renewable Energy Operated by the Alliance for Sustainable Energy, LLC
National Renewable Energy Laboratory 15013 Denver West Parkway Golden, CO 80401 303-275-3000 • www.nrel.gov
Contract No. DE-AC36-08GO28308
Consolidated Utility Base Energy (CUBE) Model Report Dan Olis, Travis Simpkins, and Mariko Shirazi
Work for Others Report NREL/TP-7A40-62792 November 2014
Photo by Dennis Schroeder, NREL

NREL is a national laboratory of the U.S. Department of Energy Office of Energy Efficiency & Renewable Energy Operated by the Alliance for Sustainable Energy, LLC
Contract No. DE-AC36-08GO28308
National Renewable Energy Laboratory 15013 Denver West Parkway Golden, CO 80401 303-275-3000 • www.nrel.gov
Consolidated Utility Base Energy (CUBE) Model Report Dan Olis, Travis Simpkins, and Mariko Shirazi Produced under direction of Wyle Laboratories, Inc. by the National Renewable Energy Laboratory (NREL) under TSA number TSA-13-566 and Task No WTFA.1000
Work for Others Report NREL/TP-7A40-62792 November 2014

NOTICE
This manuscript has been authored by employees of the Alliance for Sustainable Energy, LLC (“Alliance”) under Contract No. DE-AC36-08GO28308 with the U.S. Department of Energy (“DOE”). This report was prepared as an account of work sponsored by an agency of the United States government. Neither the United States government nor any agency thereof, nor any of their employees, makes any warranty, express or implied, or assumes any legal liability or responsibility for the accuracy, completeness, or usefulness of any information, apparatus, product, or process disclosed, or represents that its use would not infringe privately owned rights. Reference herein to any specific commercial product, process, or service by trade name, trademark, manufacturer, or otherwise does not necessarily constitute or imply its endorsement, recommendation, or favoring by the United States government or any agency thereof. The views and opinions of authors expressed herein do not necessarily state or reflect those of the United States government or any agency thereof.
NREL prints on paper that contains recycled content.

iv
Executive Summary This paper describes a software model that was developed to predict the performance of a photovoltaic (PV)-battery-diesel hybrid power system that was designed, constructed, and tested by the National Renewable Energy Laboratory (NREL) for the U.S. Army Rapid Equipping Force (REF) and Expeditionary Energy and Sustainment Systems (E2S2) to provide power to Forward Operating Bases (FOBs). The hybrid power system is called the Consolidated Utility Base Energy (CUBE) system. This is a companion document to a more detailed report, Consolidated Utility Base Energy (CUBE) Performance Test Report [1], which describes the CUBE features, capabilities, architecture, control scheme, and results of a 24-hour test. Readers should refer to that more extensive report for additional information.
The CUBE architecture was modeled in REopt, an NREL internal modeling platform for energy systems integration and optimization, to benchmark actual CUBE performance against theoretical performance. The REopt model also allows for performance prediction under different load profiles, renewable resources, or system architectures. The CUBE was tested to demonstrate fuel savings as well as power quality relative to a baseline diesel-generator-only system. REopt provided verification that the fuel savings demonstrated in the 24-hour hardware test are as should be expected. Formulated as a mixed-integer linear program, REopt is a techno-economic optimization model that seeks the most fuel-efficient dispatch of the assets to meet the FOB electrical load. The objective function of the REopt model was to minimize fuel consumption while operating energy system assets within their capabilities, based on physical limits or best practice.
A summary of the 24-hour test results and model results is shown in Table 1.
Table 1. Summary of Hybrid System Test Results and Model Results
Test Model
Fuel used, diesel-only system
67.8 gallons 68.04 gallons
Fuel used, hybrid system 46.6 +/- 0.1 gallons 46.99 gallons
Fuel reduction 21.2 +/-0.1 gallons 31%
21.1 gallons 31%
Total runtime for two diesel generators
28 h 26 h
Diesel generated electricity 495 kWh 519 kWh
Battery input energy 9 kWh 33 kWh
Battery discharge energy 8 kWh 31 kWh
Over the 24-hour test, the CUBE achieved a 31% reduction in fuel use and a 42% reduction in overall diesel run-time relative to the diesel-only case. The fuel savings predicted by the model agree with the test, and the model indicates the CUBE performed very well in its initial test. Minor differences in fuel usage are likely attributed to actual versus modeled power converter efficiencies and errors introduced by linearization of the generators’ fuel consumption curves.
This report is available at no cost from the National Renewable Energy Laboratory (NREL) at www.nrel.gov/publications.

v
The results from the model are based on constraints and conditions dictated by the test. Adjustments to reserve requirements, effective battery operating range, or battery initial and final states of charge, for example, may result in improved fuel savings.
The validated model will allow alternative control strategies or modifications to the system configuration to be explored quickly and easily prior to investing in hardware or software modifications or returning to the lab for further testing. The model also provides an analysis tool for determination of hybrid-diesel fuel savings and life-cycle return on investment analysis across any possible FOB deployment location, size, and load profile characteristics.
This report is available at no cost from the National Renewable Energy Laboratory (NREL) at www.nrel.gov/publications.

vi
Table of Contents Executive Summary ................................................................................................................................... iv List of Figures ............................................................................................................................................ vi List of Tables .............................................................................................................................................. vi Introduction ................................................................................................................................................. 1 Power Architecture ..................................................................................................................................... 1 Operating Reserve ...................................................................................................................................... 2 Load and Resource Profiles ...................................................................................................................... 3
Load Profile ............................................................................................................................................ 3 Solar Profile ............................................................................................................................................ 3
Model Description ....................................................................................................................................... 4 Model Inputs and Constraints.................................................................................................................... 4 Results ......................................................................................................................................................... 5 Conclusions ................................................................................................................................................. 9 References ................................................................................................................................................... 9 List of Figures Figure 1. CUBE block diagram. ................................................................................................................. 2 Figure 2. Alignment of load and solar profiles......................................................................................... 3 Figure 3. Fuel burn rate versus generator load. ...................................................................................... 4 Figure 4. Test dispatch to serve load (top plot) and battery dispatch (bottom plot). .......................... 7 Figure 5. Model dispatch to serve load (top plot) and battery dispatch (bottom plot). ....................... 8 List of Tables Table 1. Summary of Hybrid System Test Results and Model Results ................................................ iv Table 2. Fuel Used in Diesel-Only System, Actual and Predicted by Linear Model ............................. 5 Table 3. Test and Modeling Results Summary......................................................................................... 5
This report is available at no cost from the National Renewable Energy Laboratory (NREL) at www.nrel.gov/publications.

1
Introduction This report includes a brief overview of the Consolidated Utility Base Energy (CUBE) architecture and compares CUBE model results to test results. This is a companion document to a more detailed report that describes the CUBE features, capabilities, architecture, control scheme, and results of a 24-hour test [1]. Readers should refer to that more extensive report for additional information.
The CUBE system is an integrated power electronic platform for a photovoltaic (PV)-battery-diesel hybrid power system developed for the U.S. Army Rapid Equipping Force (REF) and the Expeditionary Energy and Sustainment Systems (E2S2) to provide power to Forward Operating Bases (FOBs). The CUBE is based on modular power electronic building blocks and includes power distribution and protection components, magnetics and other filter components, a liquid cooling system, and a control platform. The CUBE is able to integrate four 5–10-kW PV arrays, one 30-kW battery pack, and two 30-kW diesel generator sets to power a 60-kW load. The on-board power electronics include PV maximum power point tracking (MPPT) converters, battery charge/discharge converters, and a three-phase inverter, which is capable of smoothly transitioning between operation as the grid-forming unit and operation in parallel with the diesel generators.
The goal of the CUBE is to minimize diesel fuel use while maintaining reliable and high-quality power. The CUBE was installed at the National Renewable Energy Laboratory's (NREL’s) Energy Systems Integration Facility (ESIF) along with two tactical quiet generators (TQGs), a lithium-ion battery pack, a PV simulator, programmable load banks, and a precision fuel flow meter. Two 24-hour tests were performed, one with the complete CUBE system and one with the TQGs only, to validate fuel savings and demonstrate the CUBE’s ability to deliver reliable and high-quality power. The tests were performed using the load profile of a simulated FOB and measured solar irradiance data. A software model of the system was developed to benchmark the experimental test results and to allow CUBE performance predictions for other loads, solar resources, and system architectures.
Power Architecture The CUBE provides three key functionalities: (1) power conversion, (2) power distribution, and (3) power protection. The power conversion and distribution functionalities are depicted in the block diagram shown in Figure 1.
This report is available at no cost from the National Renewable Energy Laboratory (NREL) at www.nrel.gov/publications.

2
60 kW Hybrid
Inverter / Rectifier
5 – 10 kW PV MPPT Converter
3-phase, 4-wire Grounded Wye AC Bus60 Hz 120/208 Vac (or)
50 Hz 240/416 Vac
Consolidated Utility Base Energy (CUBE)
100 – 350 Vdc
100 – 350 Vdc
100 – 350 Vdc
100 – 350 Vdc
100 – 350 Vdc
5 – 10 kW
5 – 10 kW
5 – 10 kW
5 – 10 kW
30 kWh
60 kW
GS30 kW
GS30 kW
5 – 10 kW PV MPPT Converter
5 – 10 kW PV MPPT Converter
5 – 10 kW PV MPPT Converter
30 kW Battery
Charger / Discharger
60 kW 3-phaseLine Frequency
Transformer
30 kW Future Battery
Charger / Discharger
Figure 1. CUBE block diagram.
The architecture of the system during the test, and replicated in the model, includes:
• Two 30-kW diesel TQGs
• PV power profile supplying the CUBE, which was provided by a PV simulator using 1-minute solar resource data as input. The simulator was programmed to emulate a 26.4-kWdc PV nameplate electric system capable of providing 21.7 kW peak power into the DC-DC converter between the PV system and the DC bus.
• Lithium-ion battery with 40-kWh operating range. The battery was modeled at 50 kWh, with a maximum state of charge (SOC) of 100% and a minimum SOC of 20%, resulting in a 40-kWh battery operating capacity as specified in the test. The actual battery was an 80-kWh A123 battery, but the controller was programmed to allow only 50% of the total battery capacity to be available during the test.
See [1] for more discussion on individual components.
Operating Reserve The required operating reserve in every time step was 20 kW plus the PV power output during that time step. A complete discussion of the selection and impact of this level of reserve is included in [1].
This report is available at no cost from the National Renewable Energy Laboratory (NREL) at www.nrel.gov/publications.

3
Load and Resource Profiles Load Profile One-minute load data were obtained from the Army Material Systems Analysis Activity (AMSSA). The data were collected at the Army Network Integration Evaluation (NIE) 13.2 April to May 2013 at Fort Bliss Texas and consist of measured load data from 18 rigid shelters erected to simulate a typical FOB.
Data were collected from April 24, 2013, to May 20, 2013. The 24-hour period from April 28 at 05:00 through April 29 at 04:59 was selected for the 24-hour test. The original load data peak of 59 kW was scaled to peak at 55 kW. In addition, load values less than 9 kW were set to 9 kW. This reason for these modifications is related to specific operational issues of the test. Further, the load generated by the load banks during the test differed slightly from the commanded load. The actual load profile provided by the load banks in the test was used in the model.
Solar Profile One-minute irradiance and temperature data measured at NREL’s Solar Radiation Research Laboratory (SRRL) were used to program the PV simulator. The data were from August 1, 2009. This day was mostly clear, resulting in a smooth PV production profile that peaked at 21.7 kWdc into the DC-DC converter and generated approximately 159 kWh of electricity delivered to the DC bus (after the DC-DC converter).
Figure 2 shows an overlay of the load and solar resource profiles.
Figure 2. Alignment of load and solar profiles.
05:00 09:00 13:00 17:00 21:00 01:00 05:000
10
20
30
40
50
60
Load
[kW
]
05:00 09:00 13:00 17:00 21:00 01:00 05:000
200
400
600
800
1000
1200
Time
Inso
latio
n [W
/m2 ]
One Minute Load and Solar Profiles
loadsolar
This report is available at no cost from the National Renewable Energy Laboratory (NREL) at www.nrel.gov/publications.

4
Model Description REopt is an energy planning platform with multiple concurrent technology integration and optimization capabilities. The REopt platform provides techno-economic decision support analysis throughout the energy planning process, from agency-level screening and macro planning to project development to energy asset operation. REopt employs an integrated approach to optimizing the energy costs of a site by considering electricity and thermal consumption, resource availability, generator options, and fuel or utility costs. Formulated as a mixed-integer linear program, REopt recommends an optimally sized mix of conventional and renewable generators and energy storage technologies; estimates the net present value associated with implementing those technologies; and provides the cost-optimal dispatch strategy for operating them at maximum economic efficiency. The REopt platform can be customized to address a variety of energy optimization scenarios including policy, microgrid, and operational energy applications. In this analysis, the architecture was fixed and the objective was modified to minimize fuel usage over the 24-hour simulation.
Model Inputs and Constraints The model assumes a first-order (linear) fuel consumption curve for the TQGs. The relationship between generator load and fuel consumption rates is based on the data collected during the diesel-only 24-hour test. See Figure 3.
Figure 3. Fuel burn rate versus generator load.
Table 2 shows actual and predicted fuel consumption to demonstrate the effect of the linearization assumption. These results are for both 30-kW TQG generators running during the entire load day.
This report is available at no cost from the National Renewable Energy Laboratory (NREL) at www.nrel.gov/publications.

5
Table 2. Fuel Used in Diesel-Only System, Actual and Predicted by Linear Model
Case Fuel Consumed (gallons)
Test result 67.8
Modeled linear prediction 68.0
A slight loss in fidelity of predicted fuel consumption occurs by linearizing the fuel burn rate.
Other model details include:
• Objective function of the mixed integer linear program: minimize fuel usage
• Time series resolution: 1-minute time steps
• Diesel generator minimum load: 20% of rated capacity, or 6 kW each
• Initial and final battery SOC: specified to match the 24-hour test
• PV DC derate factor: 0.87
• Assumed unit efficiencies: o AC to DC rectifier: 0.92
o DC to AC inverter: 0.92
o DC to DC converters between PV output and DC bus and between the battery and the DC bus: 0.92
o Battery round-trip efficiency: 0.98.
Results The model results and the actual test results are shown in Table 3.
Table 3. Test and Modeling Results Summary
Metric Test Model
Fuel used, diesel-only system 67.8 gallons 68.04 gallons
Fuel used, hybrid system 46.6 +/- 0.1 gallons 46.99 gallons
Fuel reduction 21.2 +/-0.1 gallons 31%
21.1 gallons 31%
Total runtime for two diesel generators
28 h 26 h
Diesel generated electricity 495 kWh 519 kWh
Battery input energy 9 kWh 33 kWh
Battery discharge energy 8 kWh 31 kWh
This report is available at no cost from the National Renewable Energy Laboratory (NREL) at www.nrel.gov/publications.
6
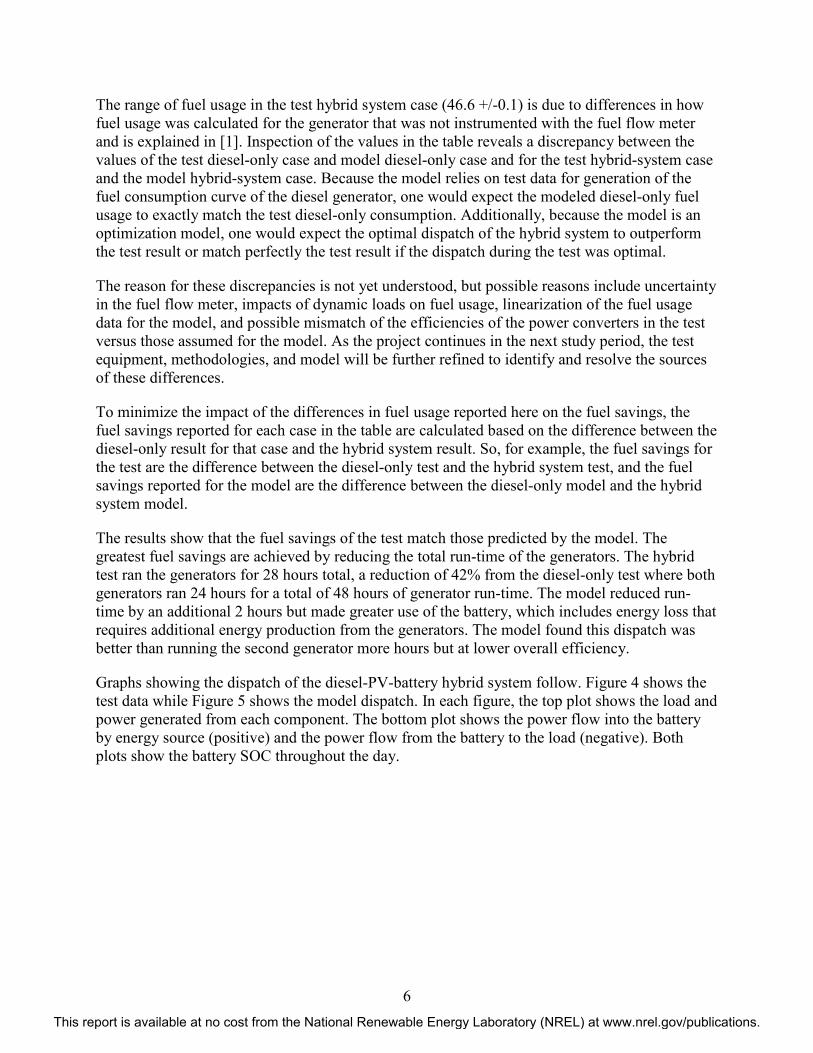
The range of fuel usage in the test hybrid system case (46.6 +/-0.1) is due to differences in how fuel usage was calculated for the generator that was not instrumented with the fuel flow meter and is explained in [1]. Inspection of the values in the table reveals a discrepancy between the values of the test diesel-only case and model diesel-only case and for the test hybrid-system case and the model hybrid-system case. Because the model relies on test data for generation of the fuel consumption curve of the diesel generator, one would expect the modeled diesel-only fuel usage to exactly match the test diesel-only consumption. Additionally, because the model is an optimization model, one would expect the optimal dispatch of the hybrid system to outperform the test result or match perfectly the test result if the dispatch during the test was optimal.
The reason for these discrepancies is not yet understood, but possible reasons include uncertainty in the fuel flow meter, impacts of dynamic loads on fuel usage, linearization of the fuel usage data for the model, and possible mismatch of the efficiencies of the power converters in the test versus those assumed for the model. As the project continues in the next study period, the test equipment, methodologies, and model will be further refined to identify and resolve the sources of these differences.
To minimize the impact of the differences in fuel usage reported here on the fuel savings, the fuel savings reported for each case in the table are calculated based on the difference between the diesel-only result for that case and the hybrid system result. So, for example, the fuel savings for the test are the difference between the diesel-only test and the hybrid system test, and the fuel savings reported for the model are the difference between the diesel-only model and the hybrid system model.
The results show that the fuel savings of the test match those predicted by the model. The greatest fuel savings are achieved by reducing the total run-time of the generators. The hybrid test ran the generators for 28 hours total, a reduction of 42% from the diesel-only test where both generators ran 24 hours for a total of 48 hours of generator run-time. The model reduced run-time by an additional 2 hours but made greater use of the battery, which includes energy loss that requires additional energy production from the generators. The model found this dispatch was better than running the second generator more hours but at lower overall efficiency.
Graphs showing the dispatch of the diesel-PV-battery hybrid system follow. Figure 4 shows the test data while Figure 5 shows the model dispatch. In each figure, the top plot shows the load and power generated from each component. The bottom plot shows the power flow into the battery by energy source (positive) and the power flow from the battery to the load (negative). Both plots show the battery SOC throughout the day.
This report is available at no cost from the National Renewable Energy Laboratory (NREL) at www.nrel.gov/publications.

7
Figure 4. Test dispatch to serve load (top plot) and battery dispatch (bottom plot).
This report is available at no cost from the National Renewable Energy Laboratory (NREL) at www.nrel.gov/publications.

8
Figure 5. Model dispatch to serve load (top plot) and battery dispatch (bottom plot).
This report is available at no cost from the National Renewable Energy Laboratory (NREL) at www.nrel.gov/publications.

9
Conclusions The test of the CUBE demonstrated significant fuel savings and reduction in diesel run-time relative to the diesel-only case. Comparison of the test results and the optimization model results indicates that the control strategy and performance under test are excellent and that fuel savings achieved, for the given system, load, and constraints, are virtually optimal. However, the test results are for one load profile, one solar profile, and one architecture configuration. The validated CUBE model allows fast evaluation and ranking of possible improvements and alternatives, including, for example, modified control strategies, dispatchable load control, architecture modifications, etc., before embarking on resource intensive redesign and testing cycles. The model also provides CUBE performance prediction given FOB loads or climate conditions as they vary from deployment to deployment.
References [1] Shirazi, M., Martin, G., Niebylski, C., Bolton, C.; Consolidated Utility Base Energy (CUBE) Performance Test Report; NREL/TP-5B00-52768, October 2014.
This report is available at no cost from the National Renewable Energy Laboratory (NREL) at www.nrel.gov/publications.


![CUBE-BL-JP-18 CUBE-PK-JP-18 CUBE-YL-JP-18 (JP) …...CUBE-BL-JP-18 CUBE-PK-JP-18 CUBE-YL-JP-18 (JP) 1.2 Litre Capacity [JP] Operating Guide (JP)Please read this entire guide before](https://img.pdfslide.us/doc/110x75/5f0aa9a57e708231d42cb922/cube-bl-jp-18-cube-pk-jp-18-cube-yl-jp-18-jp-cube-bl-jp-18-cube-pk-jp-18-cube-yl-jp-18.jpg)