Embed Size (px)
Citation preview
C O N S O L I D A T E D S T A T E M E N T S
63

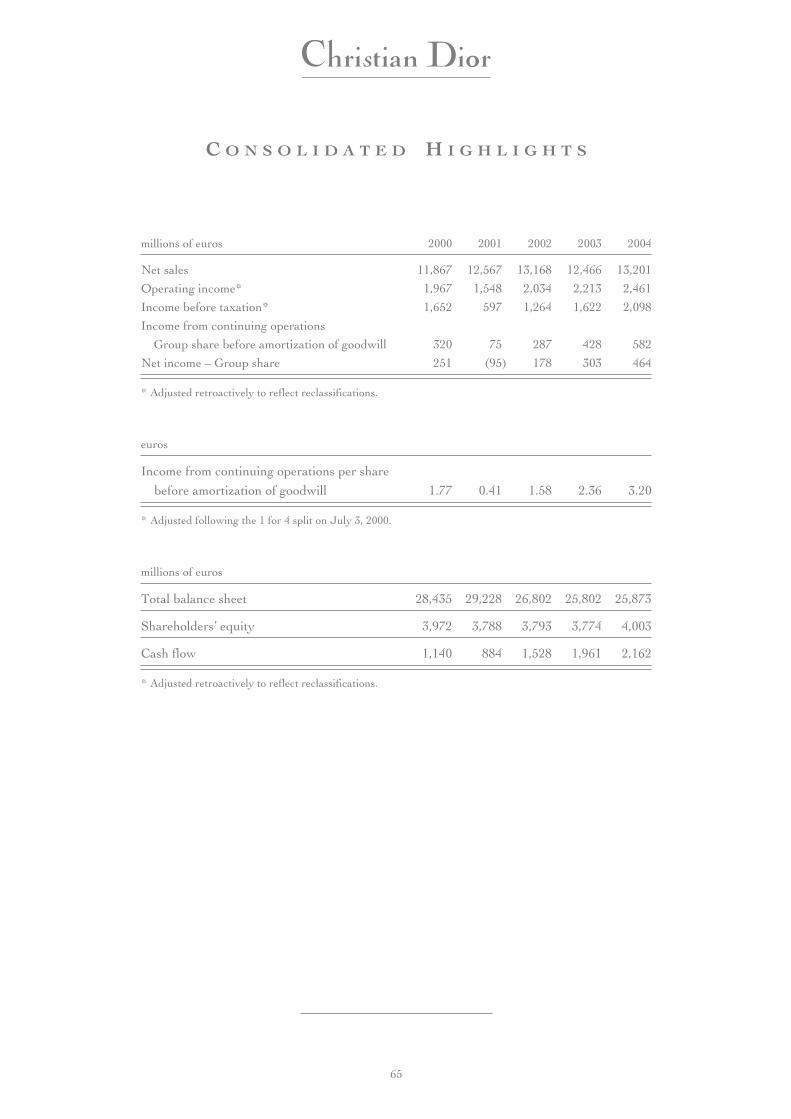
C O N S O L I D A T E D H I G H L I G H T S
millions of euros 2000 2001 2002 2003 2004
Net sales 11,867 12,567 13,168 12,466 13,201
Operating income* 1,967 1,548 2,034 2,213 2,461
Income before taxation* 1,652 597 1,264 1,622 2,098
Income from continuing operations
Group share before amortization of goodwill 320 75 287 428 582
Net income – Group share 251 (95) 178 303 464
* Adjusted retroactively to reflect reclassifications.
euros
Income from continuing operations per share
before amortization of goodwill 1.77 0.41 1.58 2.36 3.20
* Adjusted following the 1 for 4 split on July 3, 2000.
millions of euros
Total balance sheet 28,435 29,228 26,802 25,802 25,873
Shareholders’ equity 3,972 3,788 3,793 3,774 4,003
Cash flow 1,140 884 1,528 1,961 2,162
* Adjusted retroactively to reflect reclassifications.
65
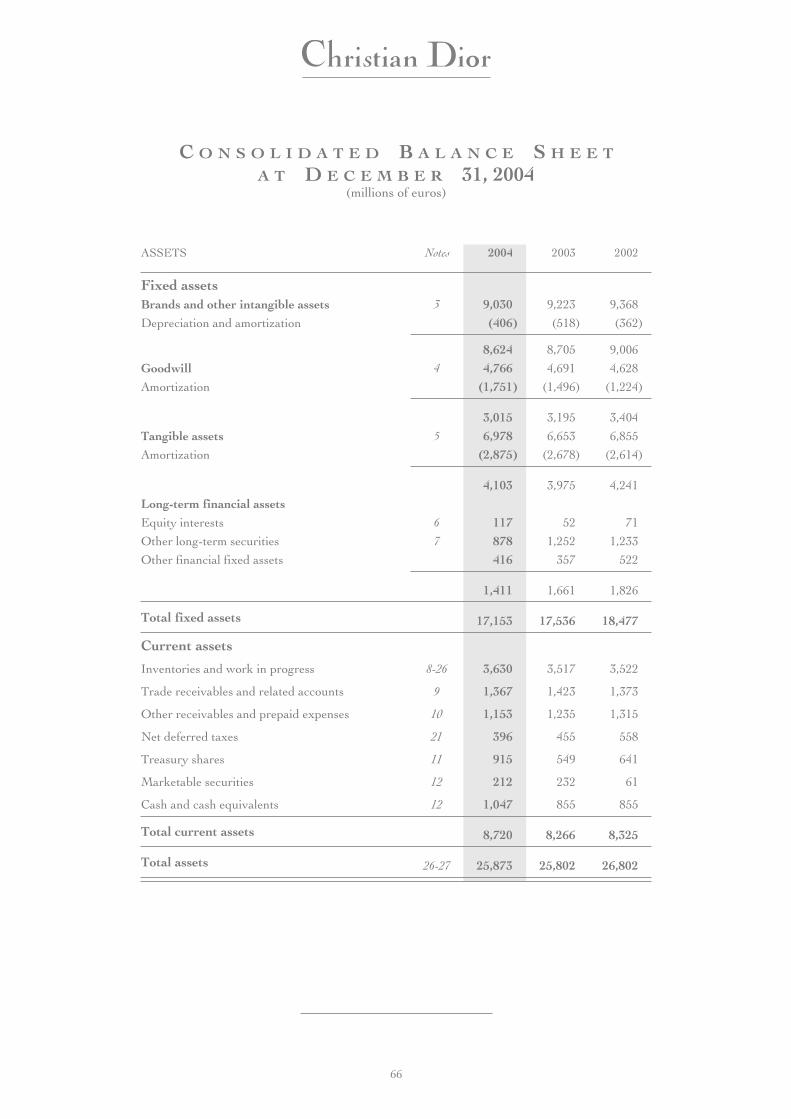
C O N S O L I D A T E D B A L A N C E S H E E T
A T D E C E M B E R 31, 2004(millions of euros)
ASSETS Notes 2004 2003 2002
Fixed assetsBrands and other intangible assets 3 9,030 9,223 9,368
Depreciation and amortization (406) (518) (362)
8,624 8,705 9,006
Goodwill 4 4,766 4,691 4,628
Amortization (1,751) (1,496) (1,224)
3,015 3,195 3,404
Tangible assets 5 6,978 6,653 6,855
Amortization (2,875) (2,678) (2,614)
4,103 3,975 4,241
Long-term financial assets
Equity interests 6 117 52 71
Other long-term securities 7 878 1,252 1,233
Other financial fixed assets 416 357 522
1,411 1,661 1,826
Total fixed assets 17,153 17,536 18,477
Current assets
Inventories and work in progress 8-26 3,630 3,517 3,522
Trade receivables and related accounts 9 1,367 1,423 1,373
Other receivables and prepaid expenses 10 1,153 1,235 1,315
Net deferred taxes 21 396 455 558
Treasury shares 11 915 549 641
Marketable securities 12 212 232 61
Cash and cash equivalents 12 1,047 855 855
Total current assets 8,720 8,266 8,325
Total assets 26-27 25,873 25,802 26,802
66
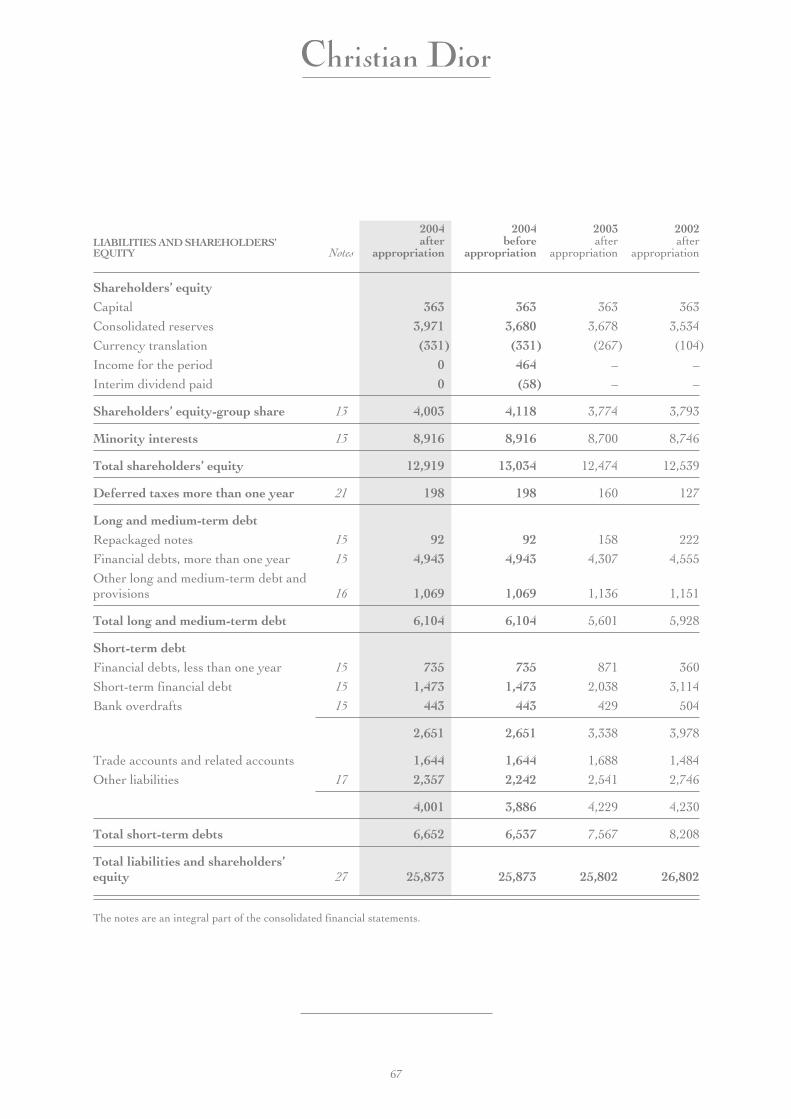
LIABILITIES AND SHAREHOLDERS’EQUITY
2004 2004 2003 2002
Notesafter
appropriationbefore
appropriationafter
appropriationafter
appropriation
Shareholders’ equityCapital 363 363 363 363
Consolidated reserves 3,971 3,680 3,678 3,534
Currency translation (331) (331) (267) (104)
Income for the period 0 464 – –
Interim dividend paid 0 (58) – –
Shareholders’ equity-group share 13 4,003 4,118 3,774 3,793
Minority interests 13 8,916 8,916 8,700 8,746
Total shareholders’ equity 12,919 13,034 12,474 12,539
Deferred taxes more than one year 21 198 198 160 127
Long and medium-term debtRepackaged notes 15 92 92 158 222
Financial debts, more than one year 15 4,943 4,943 4,307 4,555
Other long and medium-term debt andprovisions 16 1,069 1,069 1,136 1,151
Total long and medium-term debt 6,104 6,104 5,601 5,928
Short-term debtFinancial debts, less than one year 15 735 735 871 360
Short-term financial debt 15 1,473 1,473 2,038 3,114
Bank overdrafts 15 443 443 429 504
2,651 2,651 3,338 3,978
Trade accounts and related accounts 1,644 1,644 1,688 1,484
Other liabilities 17 2,357 2,242 2,541 2,746
4,001 3,886 4,229 4,230
Total short-term debts 6,652 6,537 7,567 8,208
Total liabilities and shareholders’equity 27 25,873 25,873 25,802 26,802
The notes are an integral part of the consolidated financial statements.
67
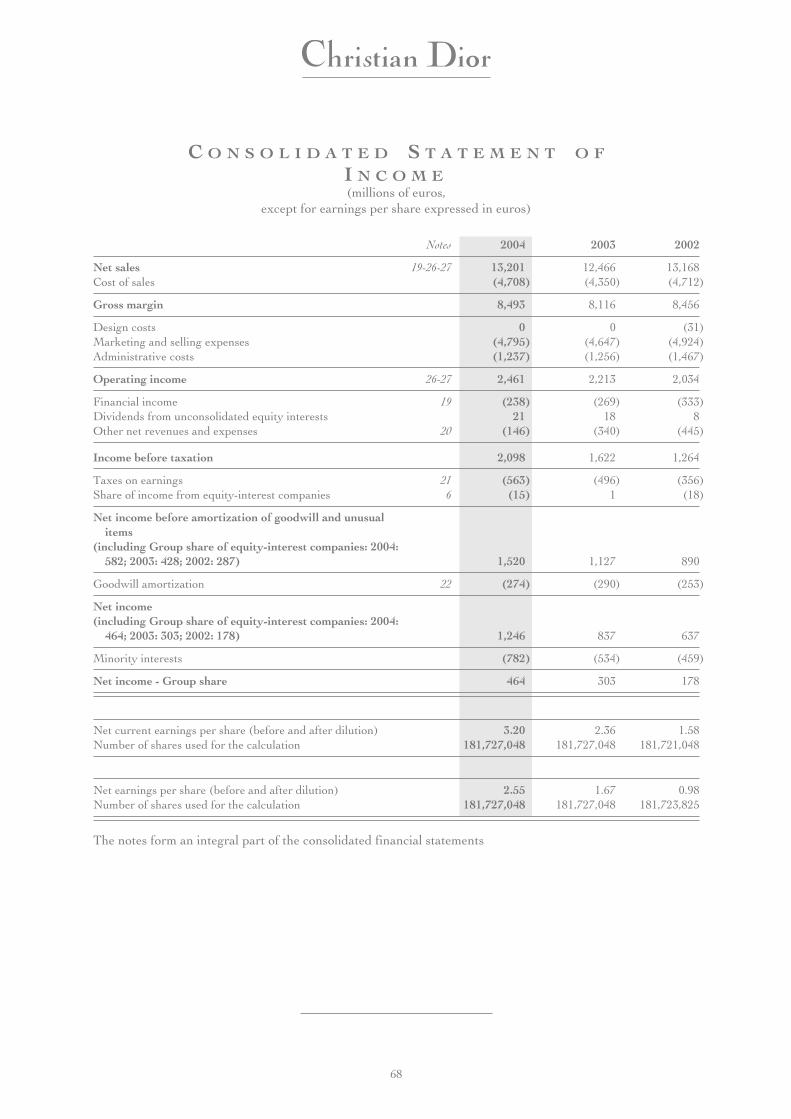
C O N S O L I D A T E D S T A T E M E N T O F
I N C O M E(millions of euros,
except for earnings per share expressed in euros)
Notes 2004 2003 2002
Net sales 19-26-27 13,201 12,466 13,168Cost of sales (4,708) (4,350) (4,712)
Gross margin 8,493 8,116 8,456
Design costs 0 0 (31)Marketing and selling expenses (4,795) (4,647) (4,924)Administrative costs (1,237) (1,256) (1,467)
Operating income 26-27 2,461 2,213 2,034
Financial income 19 (238) (269) (333)Dividends from unconsolidated equity interests 21 18 8Other net revenues and expenses 20 (146) (340) (445)
Income before taxation 2,098 1,622 1,264
Taxes on earnings 21 (563) (496) (356)Share of income from equity-interest companies 6 (15) 1 (18)
Net income before amortization of goodwill and unusualitems
(including Group share of equity-interest companies: 2004:582; 2003: 428; 2002: 287) 1,520 1,127 890
Goodwill amortization 22 (274) (290) (253)
Net income(including Group share of equity-interest companies: 2004:
464; 2003: 303; 2002: 178) 1,246 837 637
Minority interests (782) (534) (459)
Net income - Group share 464 303 178
Net current earnings per share (before and after dilution) 3.20 2.36 1.58Number of shares used for the calculation 181,727,048 181,727,048 181,721,048
Net earnings per share (before and after dilution) 2.55 1.67 0.98Number of shares used for the calculation 181,727,048 181,727,048 181,723,825
The notes form an integral part of the consolidated financial statements
68
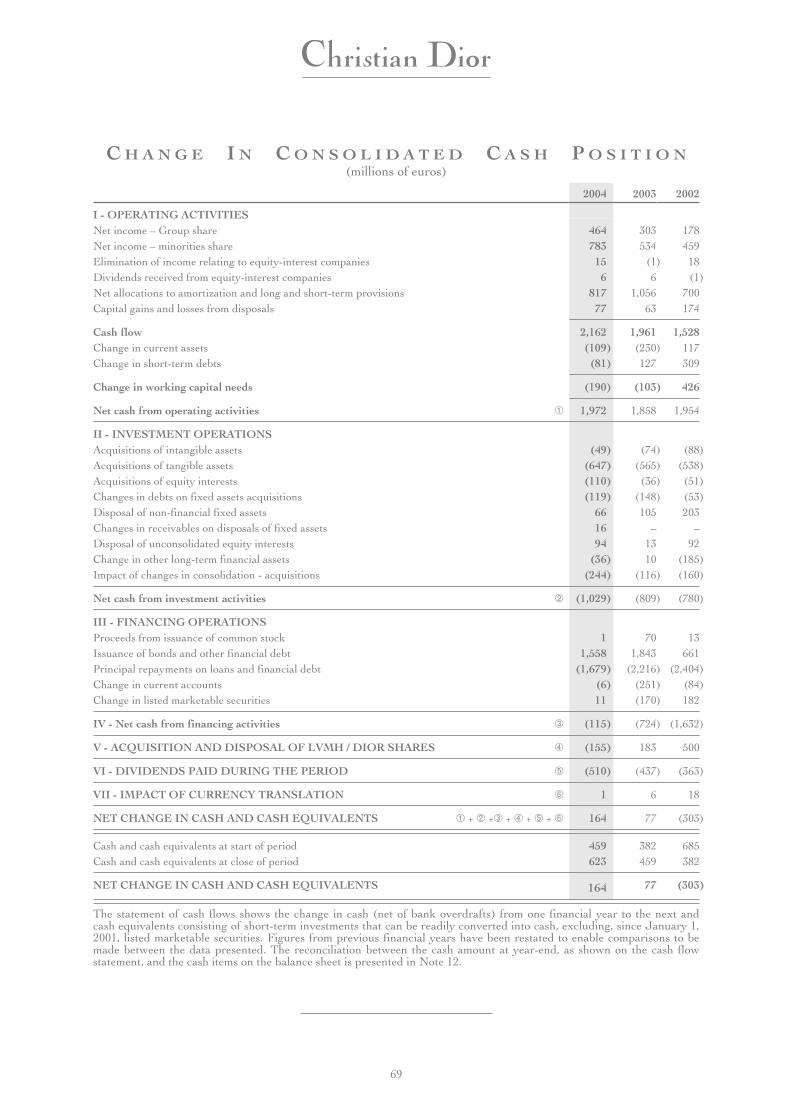
C H A N G E I N C O N S O L I D A T E D C A S H P O S I T I O N(millions of euros)
2004 2003 2002
I - OPERATING ACTIVITIESNet income – Group share 464 303 178Net income – minorities share 783 534 459Elimination of income relating to equity-interest companies 15 (1) 18Dividends received from equity-interest companies 6 6 (1)Net allocations to amortization and long and short-term provisions 817 1,056 700Capital gains and losses from disposals 77 63 174
Cash flow 2,162 1,961 1,528Change in current assets (109) (230) 117Change in short-term debts (81) 127 309
Change in working capital needs (190) (103) 426
Net cash from operating activities ➀ 1,972 1,858 1,954
II - INVESTMENT OPERATIONSAcquisitions of intangible assets (49) (74) (88)Acquisitions of tangible assets (647) (565) (538)Acquisitions of equity interests (110) (36) (51)Changes in debts on fixed assets acquisitions (119) (148) (53)Disposal of non-financial fixed assets 66 105 203Changes in receivables on disposals of fixed assets 16 – –Disposal of unconsolidated equity interests 94 13 92Change in other long-term financial assets (36) 10 (185)Impact of changes in consolidation - acquisitions (244) (116) (160)
Net cash from investment activities ➁ (1,029) (809) (780)
III - FINANCING OPERATIONSProceeds from issuance of common stock 1 70 13Issuance of bonds and other financial debt 1,558 1,843 661Principal repayments on loans and financial debt (1,679) (2,216) (2,404)Change in current accounts (6) (251) (84)Change in listed marketable securities 11 (170) 182
IV - Net cash from financing activities ➂ (115) (724) (1,632)
V - ACQUISITION AND DISPOSAL OF LVMH / DIOR SHARES ➃ (155) 183 500
VI - DIVIDENDS PAID DURING THE PERIOD ➄ (510) (437) (363)
VII - IMPACT OF CURRENCY TRANSLATION ➅ 1 6 18
NET CHANGE IN CASH AND CASH EQUIVALENTS ➀ + ➁ +➂ + ➃ + ➄ + ➅ 164 77 (303)
Cash and cash equivalents at start of period 459 382 685Cash and cash equivalents at close of period 623 459 382
NET CHANGE IN CASH AND CASH EQUIVALENTS 164 77 (303)
The statement of cash flows shows the change in cash (net of bank overdrafts) from one financial year to the next andcash equivalents consisting of short-term investments that can be readily converted into cash, excluding, since January 1,2001, listed marketable securities. Figures from previous financial years have been restated to enable comparisons to bemade between the data presented. The reconciliation between the cash amount at year-end, as shown on the cash flowstatement, and the cash items on the balance sheet is presented in Note 12.
69
N O T E S T O T H E C O N S O L I D A T E DF I N A N C I A L S T A T E M E N T S
NOTE 1 – SIGNIFICANT EVENTS AND CHANGESIN THE GROUP CONSOLIDATION
In 2004:
Wines and Spirits
• In March 2004, the interest in Millennium Import LLC, acquired in July 2002 (seebelow), was increased from 40 to 70%. The related investment, of USD 103 million,generated goodwill of USD 100 million.
• The interest in Millennium, which was accounted for using the equity method, was fullyconsolidated as of the financial year 2004.
Fashion and Leather Goods
• In March 2004, LVMH increased its interest in Donna Karan from 89% to 98% for aninvestment of USD 44 million; and in May 2004, the interest in Fendi was increased from84% to 94% for 112 million euros.
• These investments mainly represent an increase of the Group share in the Donna Karan andFendi brands and additional goodwill of respectively USD 10 million and 39 million euros.
Perfumes and Cosmetics
• In July 2004, LVMH acquired an additional interest of 10% in BeneFit Cosmetics, for anexpense of USD 26 million, raising the Group’s interest to 80% after this operation.
• This investment mainly represents the purchase of the minority interests in the BeneFitbrand, for an investment of USD 10 million and additional goodwill of USD 16 million.
Watches and Jewelry
• The sale of Ebel to the American group, Movado, for 52 million Swiss francs, resultingfrom a memorandum of understanding in December 2003, took effect in February 2004.
• Ebel was deconsolidated on March 1, 2004.
In 2003:
Wines and Spirits
• In June and September 2003, LVMH sold the Hine cognac and the Canard-Duchênechampagnes for 15 and 40 million euros respectively, but Moët-Hennessy kept a portion ofthe Canard-Duchêne inventory.
70
Fashion and Leather Goods
• During the year, LVMH increased its stake in Fendi from 67% to 84% for 191 millioneuros; this investment resulted in the recognition of additional goodwill in the amount of73 million euros.
• In February 2003, LVMH increased its interest in Rossimoda, the Italian manufacturer ofhigh-end shoes, from 45% to 97%; the total investment of 56 million euros was recognized asgoodwill in the amount of 43 million euros.
Perfumes and Cosmetics
• In December 2003, LVMH sold its Bliss beauty centers and cosmetics for15.5 million euros, and the licenses held by LVMH for the Michael Kors, Marc Jacob, andKenneth Cole perfume brands were sold during the year for a total amount of 59 millioneuros.
• LVMH raised its stake in the Laflachère group (La Brosse and Dupont) from 57% to99%; the 42 million euro investment resulted in additional goodwill of 48 million euros.
• The Group’s stake in Acqua di Parma, which was 50%, has been increased to 100%,through an additional investment of 9 million euro.
Watches and Jewelry
• In December 2003, LVMH signed a memorandum of understanding for the sale of theEbel brand and some corresponding operating and industrial assets; the price stipulated inthis memorandum, which became definitive early in 2004, was 52 million Swiss francs.
Other activities
• The auction house Tajan was sold at the end of 2003 for a nominal amount.
• The joint-venture formed with the diamond merchant De Beers (see financial year 2001)was consolidated proportionately as of financial year 2003; prior to that period, it wasaccounted for using the equity method.
• The companies acquired or sold were respectively consolidated or deconsolidated on thedate of completion of the operation.
In 2002:
Wines and Spirits
• In July 2002, LVMH purchased a 40% interest in Millennium Import LLC, a producer ofhigh-end vodkas distributed under the Belvédère and Chopin brands, for USD 76 million.The interest in Millennium was consolidated by the equity method as of that date. Thistransaction was accounted for on the balance sheet as an intangible asset of USD 71 million,amortized over 15 years, representing the rights that Millennium holds for the distribution ofthese brands.
71

• In May 2002 the Group sold the Pommery brand for 152 million euros. This sale alsoincluded the administrative and production sites, the wine cellars, the inventories anddistribution contracts, excluding the vineyards. The Pommery activities have not beenconsolidated since that date.
Fashion and Leather Goods
• Donna Karan International Inc., “DKI”, purchased in December 2001, was fullyconsolidated as of January 1, 2002. The total investment in Gabrielle Studio and DKI wasallocated to the Donna Karan brand for 494 million euros. The consolidated goodwill ofUSD 224 million will be amortized over 20 years.
• During the year, LVMH strengthened its interest in the Fendi group, which increasedfrom 51% to 67%. This investment for 196 million euros generated additional goodwill of75 million euros.
• The Emilio Pucci group, purchased in 2001 for 38 million euros, was fully consolidated asof January 1, 2002. The investment was allocated to the Pucci brand for 17 million euros.The residual consolidated goodwill will be amortized over 20 years.
• Finally, LVMH increased its interest in Thomas Pink from 70% to 100%, for aninvestment of 28 million euros.
Perfumes and Cosmetics
• In December 2002, the Group sold the Hard Candy and Urban Decay brands forUSD 1 million, which could change over the next three years because of an indexing clause;the 2002 results for these entities were included in the consolidated income until their sale.
Other activities
Based on an agreement of May 2002, LVMH’s interest in Phillips was reduced from 75% to27.5%, with LVMH transferring control to its former directors, Daniella Luxembourg andSimon de Pury. With this agreement, LVMH reestablished the financial situation of thePhillips group by writing off its financial loans, and in return received Phillips’ fixed assetsand inventory. Phillips was deconsolidated as of January 1, 2002, and the activity over thefirst months of the year was not significant.
Pro forma data and impact of the consolidation changes on cash flow
Pro forma simplified income statements are presented below for the financial years 2003 and2004 on the basis of the following assumptions:
• 2003 disposals and acquisitions are considered to have been made at January 1, 2003;
• in cases of disposals made in 2004, a comparable number of months of operations is used in2003 and 2004;
• in cases where minority interests were acquired in 2004, these operations are deemed tohave been made in 2003.
72
These pro forma data do not necessarily represent the results that would have effectivelybeen recorded in the consolidated statements if the operations described had taken place onthe date stated. Moreover, they cannot be used to forecast future trends in consolidatedresults.
(millions of euros)2004
pro forma2003
pro forma
Net sales 13,201 12,408
- Christian Dior Couture 595 523
- Wines and Spirits 2,280 2,134
- Fashion and Leather Goods 4,362 4,170
- Perfumes and Cosmetics 2,153 2,144
- Watches and Jewelry 496 457
- Selective retailing 3,378 3,039
Operating income 2,461 2,244
Income before tax 2,090 1,811
Net income before amortization of goodwill and unusual items—Group share 579 509
Net income before unusual items – Group share 461 387
(millions of euros)
Brands and other intangible assets (24) Shareholders’ equity (8)
Goodwill 135 Minority interests (138)
Net tangible assets 19 Net financial debt 248
Net current assets (32) Other long-term liabilities (1)
Other assets (1) Other short-term liabilities (4)
Total 97 97
The impact of the consolidation changes on the Group’s cash flow, as shown in theconsolidated statement of cash flows, net of the cash flow of the purchased or sold companiesbut increased by any deferred payments on these acquisitions, was 244 million euros(209 million euros in 2003).
In 2004, this amount primarily represents the effects of the increase in LVMH’s interests inFendi (112 million euros), Millennium (82 million euros), Donna Karan (35 million euros)and BeneFit Cosmetics (21 million euros); the disposals have made a positive contribution of35 million euros. This amount mainly results from the sale of Ebel.
In 2003, it primarily included the investments in Fendi (191 million euros), Rossimoda(33 million euros), La Brosse & Dupont (42 million euros), and the positive impact of thesales of Hine, Canard-Duchêne, and the Michael Kors, Marc Jacobs and Kenneth Coleperfume licenses, making a total amount of 160 million euros.
73

NOTE 2 - ACCOUNTING PRINCIPLES - RULES - METHODS
The consolidated financial statements of the Christian Dior Group are prepared inaccordance with generally accepted accounting principles in France, defined by the law ofJanuary 3, 1985 and Regulation 99-02 of the Accounting Regulatory Commission publishedon June 22, 1999. These principles have been consistently applied over the last threefinancial years.
2.1 - Principles of consolidation
The subsidiaries in which the Group has direct or indirect exclusive control are fullyconsolidated.
The companies under joint control are consolidated by proportionate consolidation.
For the companies owned jointly with the Diageo group, only those parts of the balancesheet and statement of income relating to LVMH group activity are included in theaccompanying financial statements (see Note 2.15).
Companies in which Christian Dior Group has a significant influence are accounted forusing the equity method.
The Group does not exercise exclusive or joint control, or significant de facto influence withregard to entities or structures in which no legal stake is held (“ad hoc entities”).
2.2 - Foreign currency translation, hedging of exchange and interest rate risks
a - Currency translation
The currency of the consolidated accounts is the euro: subsidiaries’ accounts that use adifferent functional currency are converted into euros:
• at the exchange rate at year-end for balance sheet items;
• at the average rates for the financial year for statement of income items.
Translation adjustments from the application of these rates are recorded in shareholders’equity under “foreign currency translation”.
b - Transactions in foreign currencies
Foreign currency transactions carried out by the consolidated companies are converted intotheir functional currency at the exchange rate on the date of the transaction.
Receivables and liabilities denominated in foreign currencies are converted at the exchangerates on December 31. Unrealized currency gains and losses resulting from this conversionare recorded on the income statement, unless they result from the conversion of loans incurrencies or other instruments allocated to hedge long-term investments in the samecurrency: in this case, the corresponding currency gains and losses are recorded undershareholders’ equity as “currency translation adjustments”.
Exchange gains and losses resulting from the conversion of transactions or intra-groupreceivables and liabilities in foreign currencies, or their elimination, are recorded in theincome statement, unless they come from long-term intra-group financing operations thatcan be classified as quasi-investment securities: in this case, they are recorded undershareholders’ equity as “currency translation adjustments”.
74
c - Currency derivatives
Forward currency contracts, currency options and related contracts still active at the closingof the financial year are revalued at December 31 exchange rates; unrealized gains andlosses from this revaluation are:
• recorded in the income statement as adjustments on unrealized gains or losses on the assetsor liabilities hedged by these instruments;
• deferred, if these instruments have been assigned to hedge operations in the followingfinancial year;
• booked as income if they have not been assigned.
Deferred unrealized gains and losses are included in the balance sheet under “other currentassets” and “other liabilities”.
d - Hedging
Currency gains and losses arising from hedges on an underlying commercial asset arerecorded as operating income or expenses to offset the exchange result related to thisunderlying asset, except for premiums and discounts of forward contracts, which arerecorded on a prorated basis as financial income or expenses. The impact of currency hedgeswith a financial underlying asset or non-allocated exchange instruments is recognized asfinancial income or expense.
e - Interest rate hedging
Gains and losses from interest rate hedging contracts (rate swap contracts, CAP, ForwardRate Agreements, collars, etc.) are accounted for on a prorated basis over the period of therelated contracts.
If the interest rate swaps mature after the maturity of the hedged operations, whereapplicable, the unrealized losses at year-end are recorded in the income statement. Theunrealized gains are not recorded.
2.3 - Brands and other intangible assets
Intangible assets are recorded as assets at their purchase price plus goodwill, if any.
Expenses incurred to create a new brand or to develop an existing one are recorded underexpenses.
Only the acquired brands that are well known and individually identifiable are recorded asassets, using their value at the time of purchase. This value is not amortized.
The book value and current value of brands are determined for each accounting period,using the procedures described in Note 3. When the book value of a brand becomespermanently greater than its current value, a set-aside for depreciation is made for theamount of the difference.
Other intangible assets are amortized over their estimated useful lives:
• leasehold acquisition rights term of lease• software 1 to 5 years
2.4 - Goodwill and related intangible assets
Goodwill is defined as the difference between the purchase price of the securities ofconsolidated companies and the Group’s share in their net assets at the purchase date. This
75
calculation is made after the net assets of the acquired company have been restatedaccording to Group accounting principles and after revaluation at fair value, when fair valuediffers from net book value on the purchase date.
The value of certain intangible assets, such as brands, market share, or business goodwill isnot reported separately from goodwill.
For the changes in the Group consolidation since financial year 2000, goodwill has beenrecorded in the operating currency of the acquired company. It was previously recorded ineuros.
Goodwill is amortized over periods ranging from 5 to 40 years, depending on the estimatedduration when first consolidated: this estimation refers to the purchased company in its ownmarket, in terms of positioning, age and geographic location.
Business goodwill acquired under French law is amortized over a period that may notexceed 18 years.
The book value and current value of goodwill are determined using the proceduresdescribed in Note 4. When the book value of goodwill becomes permanently greater than itscurrent value, a set-aside equal to the difference is made for amortization.
2.5 - Tangible assets
Tangible assets are recorded in the consolidated balance sheet at their acquisition cost. Thisincludes goodwill, if any.
The assets acquired under financial or long-term leases are fixed according to the presentvalue of future rents.
Fixed assets are depreciated on a straight-line basis for their estimated useful economic lifeas follows:
• buildings 20 to 50 years
• technical facilities, equipment and tools 3 to 20 years
• retail fittings 3 to 10 years
• vineyards 18 to 25 years
• other assets 3 to 10 years
Vineyard plantings and development costs are capitalized until the vineyards becomeproductive (generally three years) and are included in “tangible assets in progress”.
2.6 - Unconsolidated Equity interests
Unconsolidated interests are recorded at acquisition cost.
In case of a difference considered to be permanent between the utility value of such a Groupinvestment and its book value, a provision for depreciation of the amount of this difference isbooked.
The utility value is measured based on criteria such as the amount of the Group’s share innet assets, the stock price or the outlook for earnings and cash flow. These criteria areweighted for the effects on the Group of holding the investments, in terms of strategy orsynergies with existing businesses.
76

2.7 - Inventories and work in progress
Products are recorded at their cost price, except for financial costs, which may not exceedthe net realization value; the cost price is made up of the production cost (finished products),or the purchase price plus the accessory costs (raw materials and merchandise).
Changes in inventories are recorded at the weighted average cost or the first-in first-out(FIFO) method.
Considering the ageing process for champagne and cognac, these inventories are often heldfor more than one year. However, in line with industry practice, they are classified ascurrent assets.
Depreciation of inventories is primarily noted in the Fashion and Leather Goods, Perfumesand Cosmetics, Watches and Jewelry and Selective retailing activities. It is often establishedbecause of the obsolescence of the products concerned (the limitation period is near, theseason or collection is finished…) or of their selling perspective.
2.8 - Trade accounts receivable and other receivables
Receivables are recorded at their face value. An allowance for write-down is establishedwhen the inventory value is less than the book value, based on the probability of recovery.
2.9 - Treasury shares
Treasury shares are recorded at acquisition cost.
Shares held under French market regulations governing stock price adjustments, shares heldfor employee stock option plans and shares held by subsidiaries on a short-term basis arerecorded as assets in the balance sheet.
Shares held under stock option plans are attributed to these plans, for their duration; theseshares are recorded as “less than a year” in the balance sheet when the correspondingoptions can be exercised immediately or in a period less than a year, and stay classified as“more than a year” until this date.
When the market value of the treasury shares, calculated as described in 2.10 below,becomes less than the acquisition price, a provision for depreciation equal to the amount ofthe difference is recorded.
For treasury shares allocated to option plans, the calculation of depreciation is made on aper-plan basis when the market value of the share is greater than the option exercise priceand in relation to the average cost price for all plans in question when the market value ofthe share is less than the option exercise price. Moreover, when the value of the sharesallocated to option plans, net of depreciation, is greater than the exercise price stipulated byeach of the plans, a provision for risks and charges is recorded for the amount of thedifference.
In case of disposal of treasury shares, the cost price of the disposed parcel is establishedaccording to the first-in first-out (FIFO) method.
Treasury Shares held for a long-term basis or for the purpose of future cancellation orexchange are deducted from shareholders’ equity, including the realized capital gains andlosses.
2.10 - Short-term investments
The short-term investments are assessed at their cost price or at market value if the latter islower.
77
The market value of traded securities is determined by reference to the average price quotedon the related stock exchange during the last month of the year, translated at the year-endexchange rate if applicable. The market value of non-traded securities is based on theirestimated realizable value.
Shares of mutual funds, cash mutual funds and similar securities are valued at theirpublished net asset value.
The calculation is made by line of securities, without offsetting between the gains and lossesrecorded.
In the event of a partial sale of an investment, the FIFO or weighted average price methodsare used to determine the gain or loss to be recognized.
2.11 - Cash and cash equivalents
Cash and cash equivalents include cash, as well as term deposits which can be immediatelyrealized.
2.12 - Bond loans
The issuing premium of bond loans as well the costs of the issuance facility, are amortizedover the duration of the loan in question.
2.13 - Design costs – Research and Development expenses
As of January 1, 2003, design costs are included in the “cost of sales” line.
Research and development costs, including packaging costs, are recorded as expenses in theyear in which they are incurred.
2.14 - Income taxes; deferred taxes
Deferred income taxes arise out of timing differences between the net book assets ofconsolidated companies as reported in the consolidation and the amount resulting from theapplication of tax rules. These are recorded based on the known tax situation at the end ofthe year.
Tax savings from carried-over fiscal deficits are recorded as deferred taxes only when theirrecovery is deemed probable.
Taxes that would become payable by the Group in the event that retained earnings ofsubsidiaries are distributed are set aside if such a distribution is probable.
2.15 - Product accounting
• Net Sales
The sale revenues of the Group include both retail sales for the Group’s stores and“wholesale” sales to distributors and agents.
Retail sales come basically from Selective retailing and the following lines: Fashion andLeather Goods, certain brands of Perfumes and Cosmetics, and Watches and Jewelry.These sales are recorded at the time of purchase by customers.
“Wholesale” sales come from Wines and Spirits activities and from certain brands ofPerfumes and Cosmetics or Watches and Jewelry. These sales are recorded when ownershipis transferred, that is, most often upon shipping.
78
• Activities in partnership with Diageo
A significant part of the sales revenue from Wines and Spirits is earned through thedistribution agreements with Diageo, which most often consist of joint ventures. These jointventures ensure the delivery and sale of the brands of both groups. The distributionagreements govern the breakdown of the balance sheet and income statement of theseentities between LVMH and Diageo. Because of these agreements, LVMH onlyconsolidates the net sales and share of joint-venture expenses that applies to its own brands.
• Provisions for returned products
Companies in the Perfumes and Cosmetics division, and to a lesser extent in Fashion andLeather Goods and Watches and Jewelry, repurchase unsold or outdated products fromtheir customers or distributors.
In order to cover the loss of margin and the probable depreciation or destruction ofinventory resulting from those returned products, some provisions are constituted whensales are recorded; the rate of return used for the calculation of those provisions is mostoften based on statistics.
• Re-invoiced shipping and transportation costs
Shipping and transportation costs re-invoiced to customers are included in net sales, becausethe associated expenses were recorded under commercial expenses.
• Marketing cooperation agreements and product rights
It is common usage, especially in the marketing of Wines and Spirits, to pay for productreference rights or to participate in advertising agreements with the distributor. Theseexpenses are recorded under commercial expenses.
2.16 - Other income, expenses and non-recurring items
The primary business of the Group is the management and development of its brands andbanners. Operating income derives from these activities, whether they involve recurring ornon-recurring operations, main or incidental.
Other income and expenses reflect income statement items which may not be inherent to theGroup’s operating activity, because of their nature or frequency.
Income before taxes is equivalent to the notion of “net income of consolidated companies”.
Net income is income net of taxes, excluding goodwill amortization expense.
2.17 - Earnings per share
Earnings per share are calculated based on the weighted average number of common sharesoutstanding during the year, after deducting treasury shares recorded against shareholder’sequity.
Fully diluted earnings are computed according to the number of shares described in theprevious paragraph, plus the weighted average number of shares assuming the exercise of alloutstanding options during the year; the funds collected from these options are assumedattributed, in this calculation, to the purchase of shares at market price.
2.18 - Pensions, medical costs and other commitments to current or retiredemployees
When retirement indemnities, pensions, medical costs and other commitments are coveredby contributions paid by the companies of the Group to outside organizations which assume
79
the commitment for the payment of the allocations or the reimbursement of medical costs,these contributions are recognized as expenses for the year in which they are due; no liabilityis shown on the balance sheet.
When the consolidated companies pay pensions, medical costs and other liabilities directly,the related total actuarial commitment appears as a provision on the balance sheet. Changesto this commitment are recorded as expenses for the period.
When this commitment is covered, in whole or in part, by funds paid by the companies ofthe Group to financial agencies, the amount of these dedicated investments is deducted onthe balance sheet from the actuarial commitment.
The actuarial commitment is calculated on the basis of valuations specific to each countryand to each company of the Group; these valuations include assumptions for salaryincreases, inflation, life expectancies, employee turnover and return on dedicatedinvestments.
The cumulative effects of the actuarial differences are amortized when they exceed 10% ofthe total commitment or of the market value of the dedicated investments that cover it. Thesedifferences are amortized beginning in the year following their determination, over theresidual average working life of the employees concerned.
2.19 - Use of estimates
In the normal process of preparing the consolidated financial statements, the determinationof certain accounting balances on the balance sheet or the income statement requires the useof assumptions, estimates or assessments. This includes the valuation of the intangible assets,the determination of the amount of the provisions for liabilities and charges, or provisionsfor depreciation of inventories. These assumptions, estimates or assessments are prepared onthe basis of information or positions existing on the date the statements are prepared whichmay, in the future, prove different from reality.
80
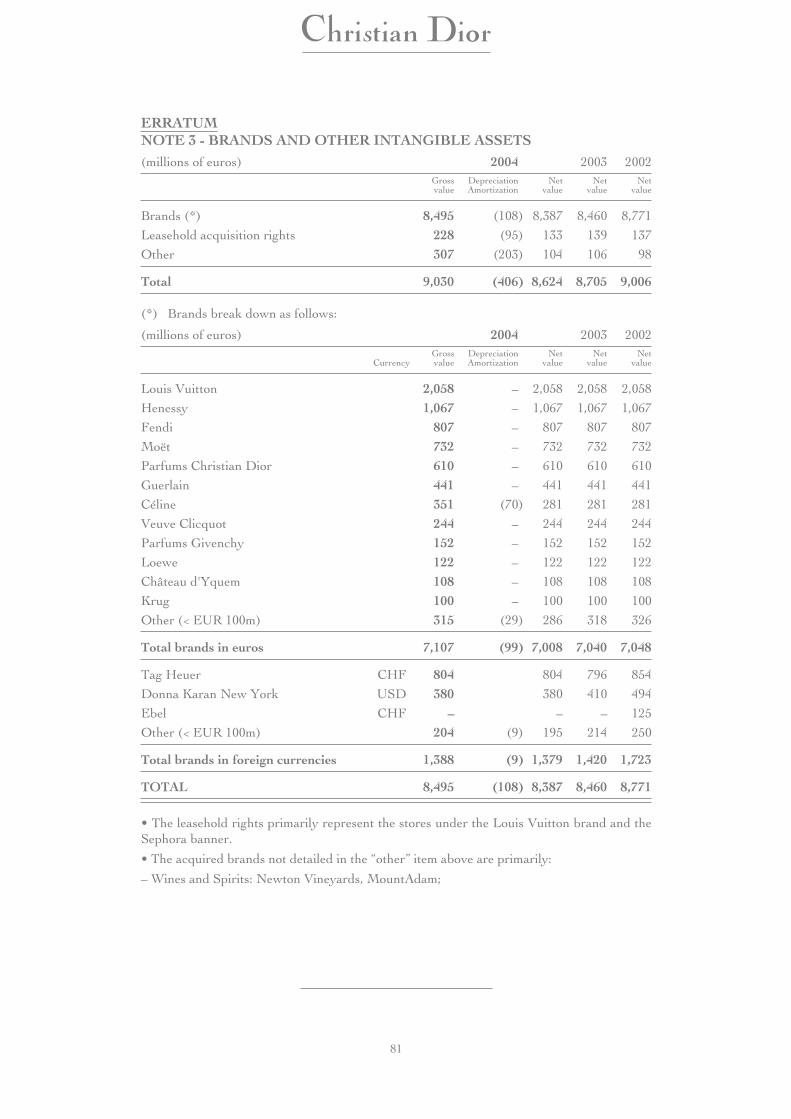
ERRATUMNOTE 3 - BRANDS AND OTHER INTANGIBLE ASSETS(millions of euros) 2004 2003 2002
Grossvalue
DepreciationAmortization
Netvalue
Netvalue
Netvalue
Brands (*) 8,495 (108) 8,387 8,460 8,771
Leasehold acquisition rights 228 (95) 133 139 137
Other 307 (203) 104 106 98
Total 9,030 (406) 8,624 8,705 9,006
(*) Brands break down as follows:
(millions of euros) 2004 2003 2002
CurrencyGrossvalue
DepreciationAmortization
Netvalue
Netvalue
Netvalue
Louis Vuitton 2,058 – 2,058 2,058 2,058
Henessy 1,067 – 1,067 1,067 1,067
Fendi 807 – 807 807 807
Moët 732 – 732 732 732
Parfums Christian Dior 610 – 610 610 610
Guerlain 441 – 441 441 441
Céline 351 (70) 281 281 281
Veuve Clicquot 244 – 244 244 244
Parfums Givenchy 152 – 152 152 152
Loewe 122 – 122 122 122
Château d'Yquem 108 – 108 108 108
Krug 100 – 100 100 100
Other (< EUR 100m) 315 (29) 286 318 326
Total brands in euros 7,107 (99) 7,008 7,040 7,048
Tag Heuer CHF 804 804 796 854
Donna Karan New York USD 380 380 410 494
Ebel CHF – – – 125
Other (< EUR 100m) 204 (9) 195 214 250
Total brands in foreign currencies 1,388 (9) 1,379 1,420 1,723
TOTAL 8,495 (108) 8,387 8,460 8,771
• The leasehold rights primarily represent the stores under the Louis Vuitton brand and theSephora banner.
• The acquired brands not detailed in the “other” item above are primarily:
– Wines and Spirits: Newton Vineyards, MountAdam;
81
– Fashion and Leather Goods: Givenchy, Kenzo, Christian Lacroix, Berluti, Thomas Pink,and Pucci;– Perfumes and Cosmetics: Parfums Kenzo, Make Up for Ever, BeneFit Cosmetics andFresh;– Watches and Jewelry: Zenith, Fred, Chaumet and Omas;– Other activities: La Tribune and Investir newspapers.
The brands are primarily valued by the cash flow method, i.e. based on the provisional cashflows generated by the brands. Other methods are used as a complement: the royaltiesmethod, which gives the brand a value equal to the capitalization of the royalties which mustbe paid to use it; the margin differential method, which applies only to cases where it ispossible to measure the revenue generated by a brand compared to an unbranded product;the replacement cost method for an equivalent brand, especially in terms of advertisingexpenses; finally, the comparison method, which uses multiples of net sales and income fromrecent transactions involving similar brands or multiple markets applicable to the activitiesconcerned.
The provisional data used in the cash flow methods come from the budgets and plansestablished by the management of the company that uses the brand. The provisional cashflows are discounted and, when several scenarios are used, a probability of the occurrence isallocated to each one of them. The discount rate used integrates the rate of return expectedby an investor in the business field in question and the risk premium appropriate to thatbusiness.
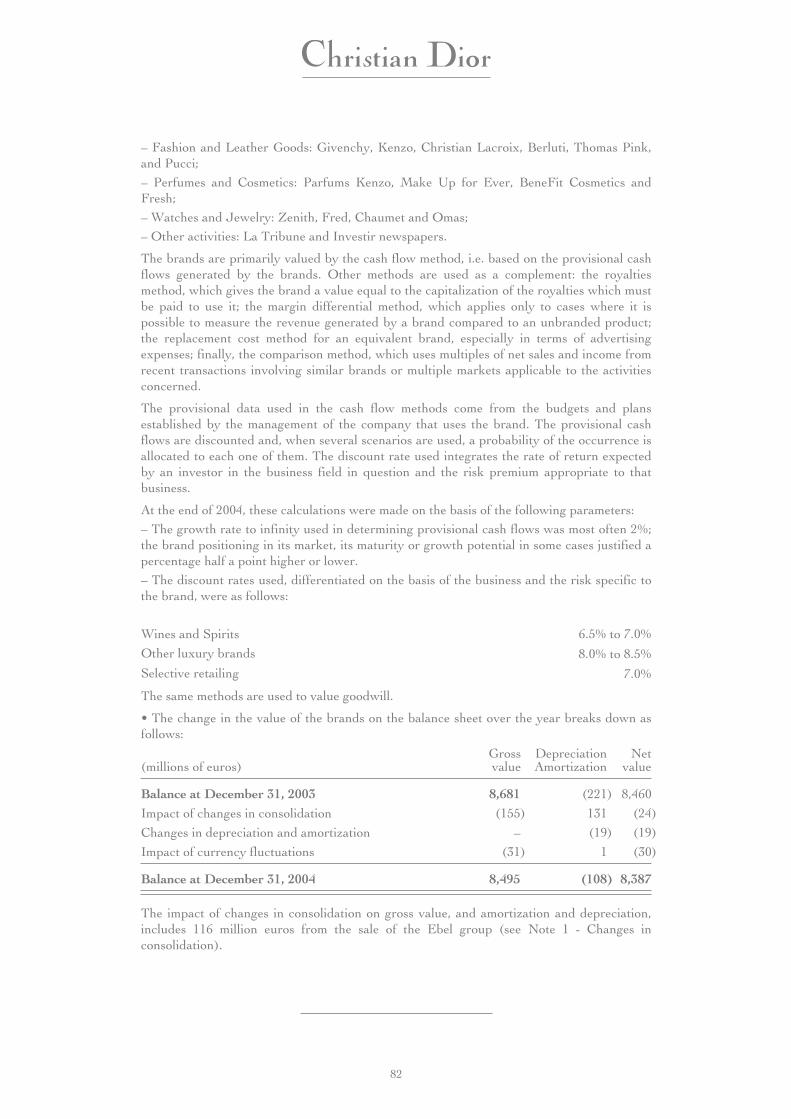
At the end of 2004, these calculations were made on the basis of the following parameters:– The growth rate to infinity used in determining provisional cash flows was most often 2%;the brand positioning in its market, its maturity or growth potential in some cases justified apercentage half a point higher or lower.– The discount rates used, differentiated on the basis of the business and the risk specific tothe brand, were as follows:
Wines and Spirits 6.5% to 7.0%
Other luxury brands 8.0% to 8.5%
Selective retailing 7.0%
The same methods are used to value goodwill.
• The change in the value of the brands on the balance sheet over the year breaks down asfollows:
(millions of euros)Grossvalue
DepreciationAmortization
Netvalue
Balance at December 31, 2003 8,681 (221) 8,460
Impact of changes in consolidation (155) 131 (24)
Changes in depreciation and amortization – (19) (19)
Impact of currency fluctuations (31) 1 (30)
Balance at December 31, 2004 8,495 (108) 8,387
The impact of changes in consolidation on gross value, and amortization and depreciation,includes 116 million euros from the sale of the Ebel group (see Note 1 - Changes inconsolidation).
82
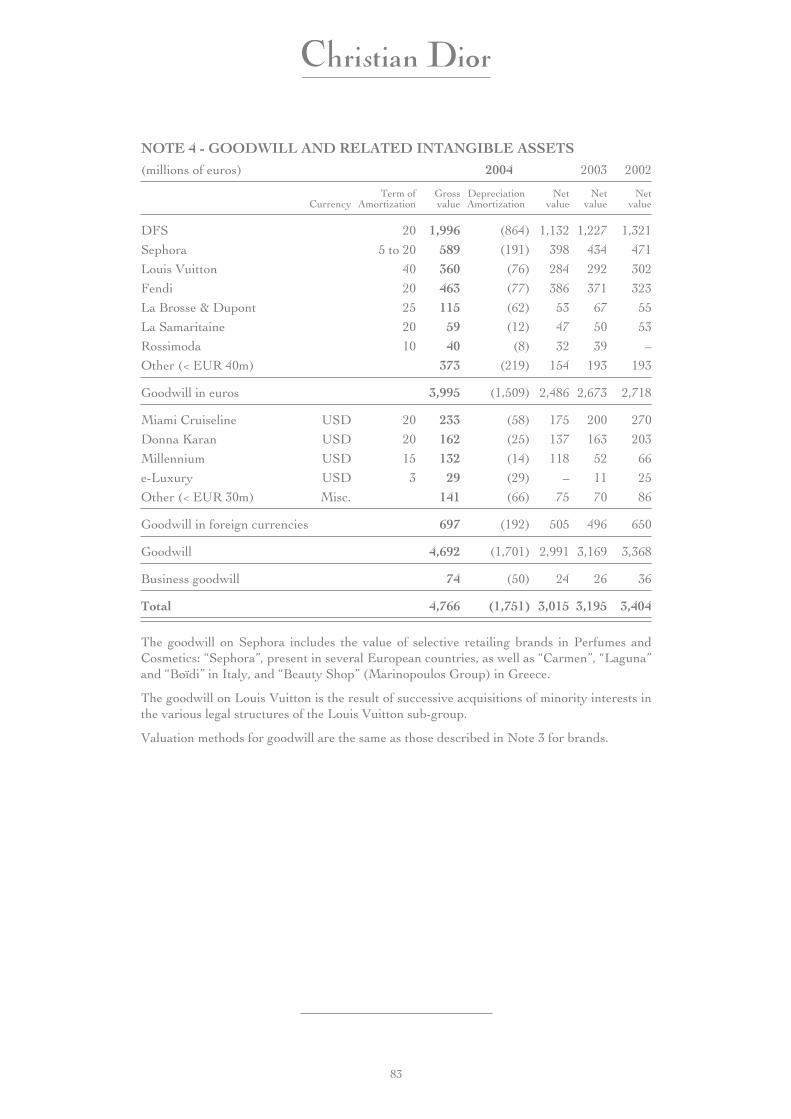
NOTE 4 - GOODWILL AND RELATED INTANGIBLE ASSETS(millions of euros) 2004 2003 2002
CurrencyTerm of
AmortizationGrossvalue
DepreciationAmortization
Netvalue
Netvalue
Netvalue
DFS 20 1,996 (864) 1,132 1,227 1,321
Sephora 5 to 20 589 (191) 398 434 471
Louis Vuitton 40 360 (76) 284 292 302
Fendi 20 463 (77) 386 371 323
La Brosse & Dupont 25 115 (62) 53 67 55
La Samaritaine 20 59 (12) 47 50 53
Rossimoda 10 40 (8) 32 39 –
Other (< EUR 40m) 373 (219) 154 193 193
Goodwill in euros 3,995 (1,509) 2,486 2,673 2,718
Miami Cruiseline USD 20 233 (58) 175 200 270
Donna Karan USD 20 162 (25) 137 163 203
Millennium USD 15 132 (14) 118 52 66
e-Luxury USD 3 29 (29) – 11 25
Other (< EUR 30m) Misc. 141 (66) 75 70 86
Goodwill in foreign currencies 697 (192) 505 496 650
Goodwill 4,692 (1,701) 2,991 3,169 3,368
Business goodwill 74 (50) 24 26 36
Total 4,766 (1,751) 3,015 3,195 3,404
The goodwill on Sephora includes the value of selective retailing brands in Perfumes andCosmetics: “Sephora”, present in several European countries, as well as “Carmen”, “Laguna”and “Boïdi” in Italy, and “Beauty Shop” (Marinopoulos Group) in Greece.
The goodwill on Louis Vuitton is the result of successive acquisitions of minority interests inthe various legal structures of the Louis Vuitton sub-group.
Valuation methods for goodwill are the same as those described in Note 3 for brands.
83
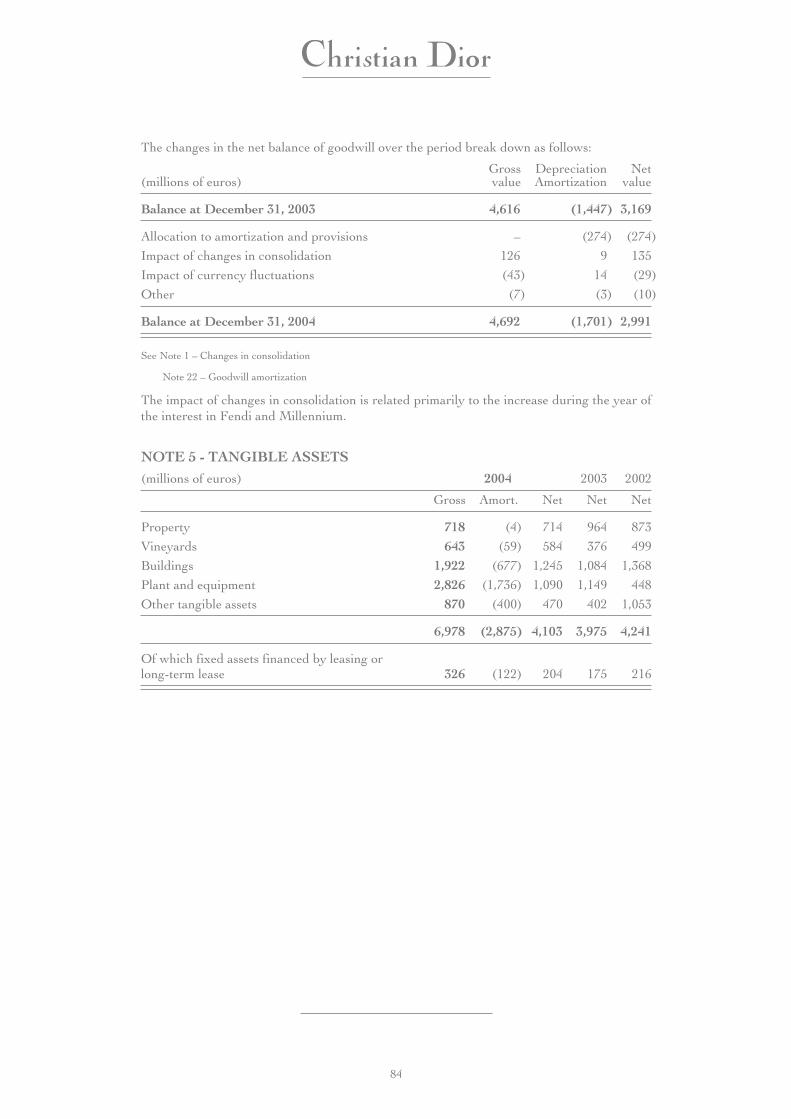
The changes in the net balance of goodwill over the period break down as follows:
(millions of euros)Grossvalue
DepreciationAmortization
Netvalue
Balance at December 31, 2003 4,616 (1,447) 3,169
Allocation to amortization and provisions – (274) (274)
Impact of changes in consolidation 126 9 135
Impact of currency fluctuations (43) 14 (29)
Other (7) (3) (10)
Balance at December 31, 2004 4,692 (1,701) 2,991
See Note 1 – Changes in consolidation
Note 22 – Goodwill amortization
The impact of changes in consolidation is related primarily to the increase during the year ofthe interest in Fendi and Millennium.
NOTE 5 - TANGIBLE ASSETS(millions of euros) 2004 2003 2002
Gross Amort. Net Net Net
Property 718 (4) 714 964 873
Vineyards 643 (59) 584 376 499
Buildings 1,922 (677) 1,245 1,084 1,368
Plant and equipment 2,826 (1,736) 1,090 1,149 448
Other tangible assets 870 (400) 470 402 1,053
6,978 (2,875) 4,103 3,975 4,241
Of which fixed assets financed by leasing orlong-term lease 326 (122) 204 175 216
84
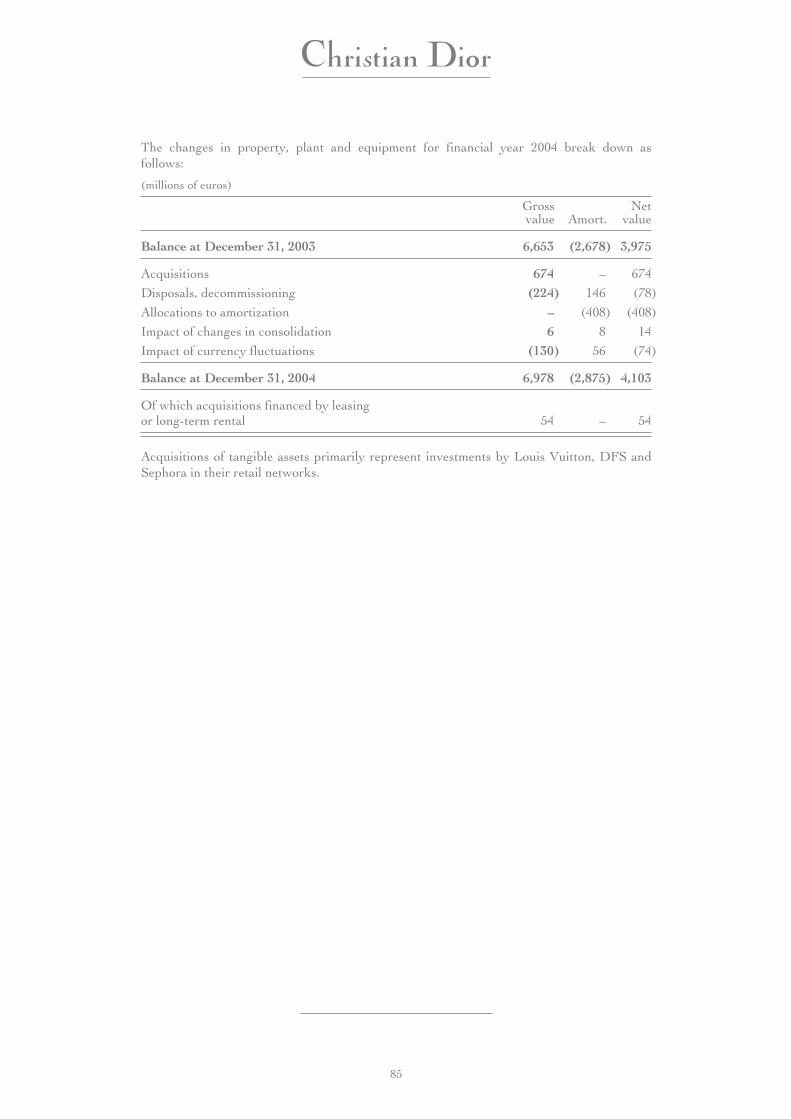
The changes in property, plant and equipment for financial year 2004 break down asfollows:
(millions of euros)
Grossvalue Amort.
Netvalue
Balance at December 31, 2003 6,653 (2,678) 3,975
Acquisitions 674 – 674
Disposals, decommissioning (224) 146 (78)
Allocations to amortization – (408) (408)
Impact of changes in consolidation 6 8 14
Impact of currency fluctuations (130) 56 (74)
Balance at December 31, 2004 6,978 (2,875) 4,103
Of which acquisitions financed by leasingor long-term rental 54 – 54
Acquisitions of tangible assets primarily represent investments by Louis Vuitton, DFS andSephora in their retail networks.
85

NOTE 6 - EQUITY INTERESTS
A - Value of equity interests
(millions of euros)Percentage
holding 2004 2003 2002
Bonhams & Brooks PS&N Ltd (UK) 49 22 37 37
Mongoual SA (France) 40 83 – –
Millennium Import LLC (USA) (*) – – 4 7
De Beers LV Ltd (UK) (**) – – – 9
Other interests – 12 11 18
Asset share of equity interests 117 52 71
B - Income (loss) from equity-interest companies(millions of euros) 2004 2003 2002
Bonhams & Brooks PS&N Ltd (15) NS (4)
Mongoual SA – – –
Millennium Import LLC (*) – 4 2
De Beers LV Ltd (**) – – (9)
Other interests 1 (3) (7)
Income share of equity interests (14) 1 (18)
(*) Company fully consolidated from January 1, 2004.
(**) Company consolidated on a proportionate basis as of 2003.
Mongoual SA is a real estate company and owner of a rental building in avenue Montaignein Paris (France), which is also the head office of LVMH Moët Hennessy Louis Vuitton SA.
The data on the principal equity interests were as follows:
(millions of euros) Net sales Net income Total assetsShareholders’
equity
Bonhams & Brooks PS&N Ltd (*) 73.9 1.4 108.5 56.8
Mongoual SA (**) 13.8 8.7 71.9 43.1
(*) Provisional data at December 31, 2004
(**) Data at December 31, 2003
86
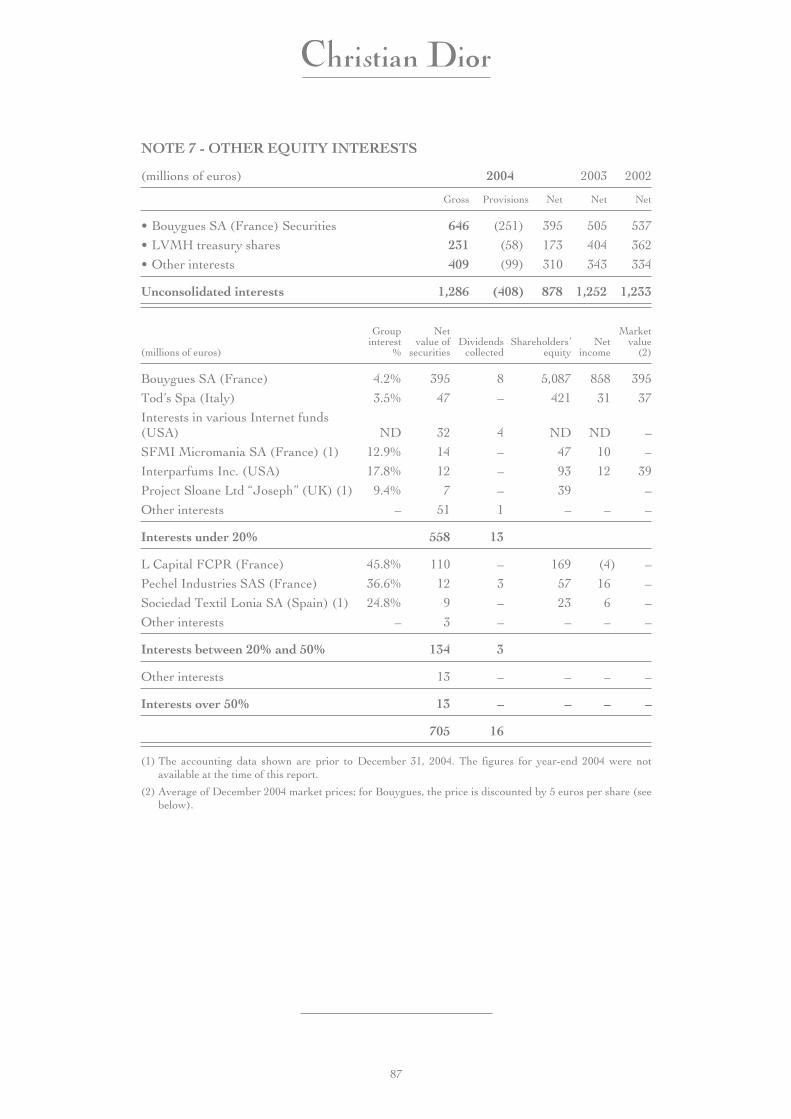
NOTE 7 - OTHER EQUITY INTERESTS
(millions of euros) 2004 2003 2002
Gross Provisions Net Net Net
• Bouygues SA (France) Securities 646 (251) 395 505 537
• LVMH treasury shares 231 (58) 173 404 362
• Other interests 409 (99) 310 343 334
Unconsolidated interests 1,286 (408) 878 1,252 1,233
(millions of euros)
Groupinterest
%
Netvalue of
securitiesDividends
collectedShareholders’
equityNet
income
Marketvalue
(2)
Bouygues SA (France) 4.2% 395 8 5,087 858 395
Tod’s Spa (Italy) 3.5% 47 – 421 31 37
Interests in various Internet funds(USA) ND 32 4 ND ND –
SFMI Micromania SA (France) (1) 12.9% 14 – 47 10 –
Interparfums Inc. (USA) 17.8% 12 – 93 12 39
Project Sloane Ltd “Joseph” (UK) (1) 9.4% 7 – 39 –
Other interests – 51 1 – – –
Interests under 20% 558 13
L Capital FCPR (France) 45.8% 110 – 169 (4) –
Pechel Industries SAS (France) 36.6% 12 3 57 16 –
Sociedad Textil Lonia SA (Spain) (1) 24.8% 9 – 23 6 –
Other interests – 3 – – – –
Interests between 20% and 50% 134 3
Other interests 13 – – – –
Interests over 50% 13 – – – –
705 16
(1) The accounting data shown are prior to December 31, 2004. The figures for year-end 2004 were notavailable at the time of this report.
(2) Average of December 2004 market prices; for Bouygues, the price is discounted by 5 euros per share (seebelow).
87
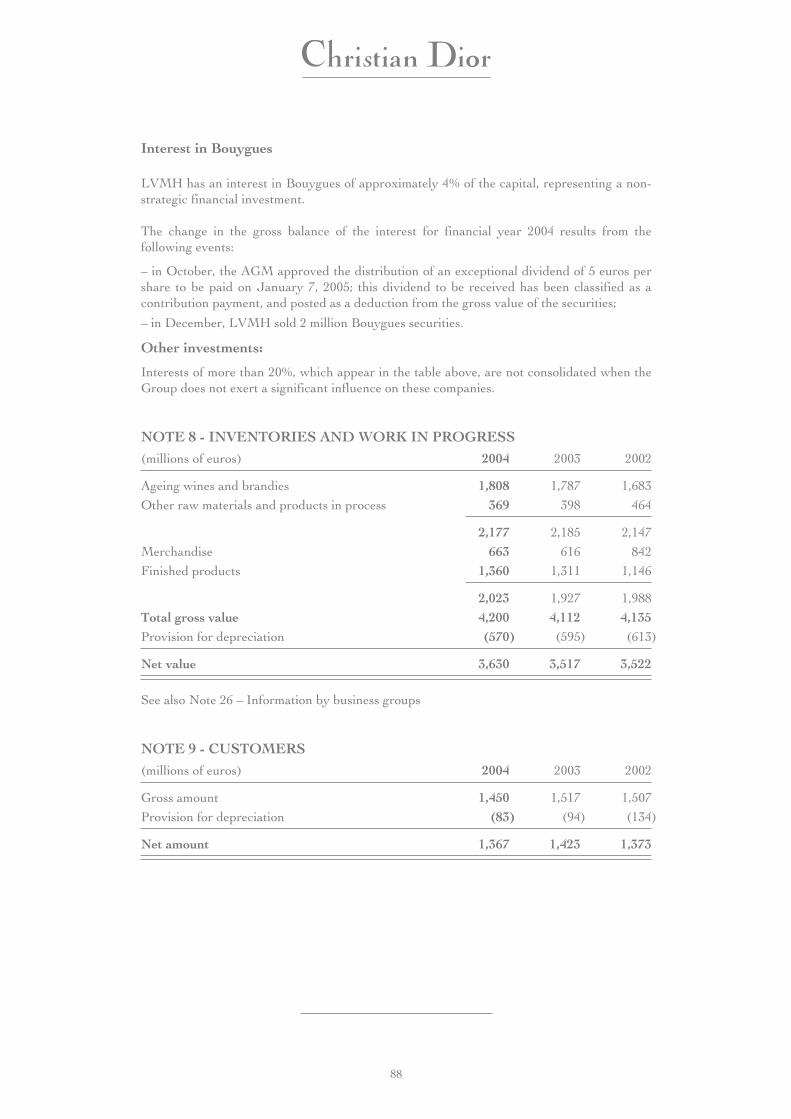
Interest in Bouygues
LVMH has an interest in Bouygues of approximately 4% of the capital, representing a non-strategic financial investment.
The change in the gross balance of the interest for financial year 2004 results from thefollowing events:
– in October, the AGM approved the distribution of an exceptional dividend of 5 euros pershare to be paid on January 7, 2005; this dividend to be received has been classified as acontribution payment, and posted as a deduction from the gross value of the securities;
– in December, LVMH sold 2 million Bouygues securities.
Other investments:
Interests of more than 20%, which appear in the table above, are not consolidated when theGroup does not exert a significant influence on these companies.
NOTE 8 - INVENTORIES AND WORK IN PROGRESS(millions of euros) 2004 2003 2002
Ageing wines and brandies 1,808 1,787 1,683
Other raw materials and products in process 369 398 464
2,177 2,185 2,147
Merchandise 663 616 842
Finished products 1,360 1,311 1,146
2,023 1,927 1,988
Total gross value 4,200 4,112 4,135Provision for depreciation (570) (595) (613)
Net value 3,630 3,517 3,522
See also Note 26 – Information by business groups
NOTE 9 - CUSTOMERS(millions of euros) 2004 2003 2002
Gross amount 1,450 1,517 1,507
Provision for depreciation (83) (94) (134)
Net amount 1,367 1,423 1,373
88

NOTE 10 - OTHER SHORT-TERM RECEIVABLES
(millions of euros) 2004 2003 2002
Currency hedging 362 428 215
Other taxes and duties 215 263 243
Trade accounts: advances and down payments 58 61 132
Prepaid expenses 222 217 212
Other net receivables 296 266 513
Net value 1,153 1,235 1,315
The balance of “currency hedging” consists primarily of unrealized gains from therevaluation of currency hedging contracts at year-end. In the case of an unrealized loss, it isthe prepaid expense resulting from the difference (see Note 17).
NOTE 11 - TREASURY SHARES
At December 31, 2004
• LVMH held 17,279,462 shares, of which 13,985,290 were allocated to stock option plansand the remainder, i.e. 3,294,172 shares, to stock price equalization.
• Dior held 4,087,132 shares, of which 3,574,600 were allocated to stock option plans andthe remainder, i.e. 512,532 shares, to stock price equalization.
LVMH and DIOR stock portfolios are allocated as follows:
2004 2004 2003 2002
(millions of euros) Number Euros Euros Euros
Less than one year:
• stock option plans 17,559,890 714 530 329
• marketable securities:
– gross amount 3,806,704 207 27 449
– provision for depreciation – (6) (8) (137)
21,366,594 915 549 641
Provisions for liabilities and charges – (7) (4) (4)
Net portfolio value 21,366,594 908 545 637
89
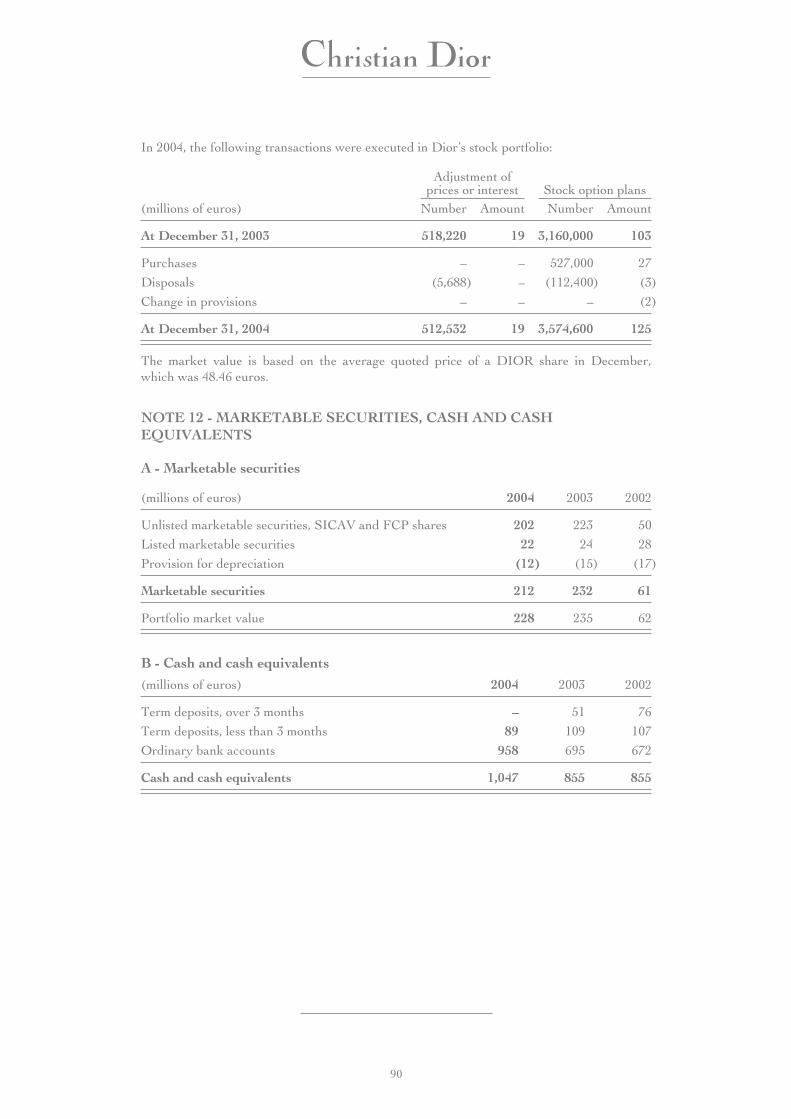
In 2004, the following transactions were executed in Dior’s stock portfolio:
Adjustment ofprices or interest Stock option plans
(millions of euros) Number Amount Number Amount
At December 31, 2003 518,220 19 3,160,000 103
Purchases – – 527,000 27
Disposals (5,688) – (112,400) (3)
Change in provisions – – – (2)
At December 31, 2004 512,532 19 3,574,600 125
The market value is based on the average quoted price of a DIOR share in December,which was 48.46 euros.
NOTE 12 - MARKETABLE SECURITIES, CASH AND CASHEQUIVALENTS
A - Marketable securities
(millions of euros) 2004 2003 2002
Unlisted marketable securities, SICAV and FCP shares 202 223 50
Listed marketable securities 22 24 28
Provision for depreciation (12) (15) (17)
Marketable securities 212 232 61
Portfolio market value 228 235 62
B - Cash and cash equivalents(millions of euros) 2004 2003 2002
Term deposits, over 3 months – 51 76
Term deposits, less than 3 months 89 109 107
Ordinary bank accounts 958 695 672
Cash and cash equivalents 1,047 855 855
90
At December 31, 2004, net cash and cash equivalents at closing shown in the statement ofcash flows, totaled 623 million euros; the reconciliation of this amount with the datapresented above is as follows:
(millions of euros) 2004 2003 2002
Marketable securities (net SICAV and FCP shares) 19 33 31
Cash and cash equivalents 1,047 855 855
Bank overdrafts (443) (429) (504)
Net cash and cash equivalents 623 459 382
NOTE 13 - CAPITAL STOCK - CHANGES IN SHAREHOLDERS’ EQUITYAND MINORITY INTERESTS
A - Capital Stock
On December 31, 2004, capital stock consisted of 181,727,048 shares (including 17,077,129shares with double voting rights).
No shares were created in 2004.
In 2002, 2003 and 2004, Christian Dior respectively acquired 490,200, 514,800 and 521,312of its own shares and sold 26,164 in 2002, 130,900 in 2003 and 112,400 in 2004. The Boardof Directors granted the following stock options for a total of 3,917,900 shares:
• At its meeting of October 14, 1996: 378,400 shares at a unit price of 25.95 euros per share,to be exercised between December 1, 1999 and November 30, 2006 to the company’sexecutives and executives of subsidiaries and sub-subsidiaries;
• At its meeting of May 29, 1997: 391,600 shares at a unit price of 32.01 euros per share, tobe exercised between May 30, 2002 and May 29, 2007 to the company’s executives andexecutives of subsidiaries and sub-subsidiaries;
• At its meeting of November 3, 1998: 393,600 shares at a unit price of 18.29 euros pershare, to be exercised between November 4, 2003 and November 3, 2008 to the company’sexecutives and executives of subsidiaries and sub-subsidiaries;
• At its meeting of January 26, 1999: 358,000 shares at a unit price of 25.36 euros per share,to be exercised between January 25, 2004 and January 24, 2009 to the company’sexecutives and executives of subsidiaries and sub-subsidiaries;
• At its meeting of February 15, 2000: 400,800 shares at a unit price of 56.70 euros pershare, to be exercised between February 15, 2005 and February 14, 2010 to the company’sexecutives and executives of subsidiaries and sub-subsidiaries;
• At its meeting of February 21, 2001: 437,500 shares at a unit price of 45.95 euros pershare, to be exercised between February 21, 2004 and February 20, 2011 to the company’sexecutives and executives of subsidiaries and sub-subsidiaries;
• At its meeting of February 18, 2002: 504,000 shares at a unit price of 33.53 euros pershare, to be exercised between February 18, 2005 and February 17, 2012 to the company’sexecutives and executives of subsidiaries and sub-subsidiaries;
• At its meeting of February 18, 2003: 527,000 shares at a unit price of 29.04 euros pershare, to be exercised between February 18, 2006 and February 17, 2013 to the company’sexecutives and executives of subsidiaries and sub-subsidiaries;
91
• At its meeting of February 17, 2004: 527,000 shares at a unit price of 49.79 euros pershare, to be exercised between February 17, 2007 and February 16, 2014 to the company’sexecutives and executives of subsidiaries and sub-subsidiaries.
B - Change in shareholders’ equity and minority interests
(millions of euros) 2004 2003 2002
GroupMinorityinterests Group
Minorityinterests Group
Minorityinterests
At January 1 3,774 8,700 3,793 8,746 3,788 8,658
Income for the period 464 783 303 534 178 459Dividends and interim dividends
distributed (58) (348) (51) (291) (51) (222)Change in currency translation of the
financial statements of foreigncompanies (64) (92) (166) (258) (36) (86)
Changes in consolidation (1) – (127) – (43) – (96)Change in treasury shares – – 3 12 9 33Other 2 – (3) – 1 –
At December 31 before appropriation 4,118 8,916 3,879 8,700 3,889 8,746
Dividend balance of Christian Dior SA(paid in June) (115) – (105) – (96) –
At December 31 after appropriation 4,003 8,916 3,774 8,700 3,793 8,746
(1) See Note 2 - Changes in consolidation
C - Foreign exchange differences
The currency translation differences recorded in shareholders’ equity at December 31, 2004,and the change over the year, net of the effects of hedging net assets in currencies, breakdown as follows:
(millions of euros) At Dec. 31, 2004 Change
US dollar (346) (61)
Hong Kong dollar (32) (2)
Yen (21) –
Argentine peso (20) (1)
Swiss franc 61 –
Euro 46 –
Other (19) –
Total (331) (64)
The amount in euros recorded in the table above corresponds to the conversion adjustmentof the consolidated reserves of the European subsidiaries at the time of the definitiveconversion of these accounts into euros on January 1, 1999.
92
NOTE 14 - STOCK OPTION PLANS
• Options granted by the Christian Dior parent company
The AGM of May 15, 2003 renewed the authorization given to the Board of Directors togrant, in one or several steps, to employees or company executives of the Group, stockoptions for up to 3% of the capital.
Nine stock option plans were in effect at December 31, 2004. These plans have a term of tenyears; under the plans, the options may be exercised after a period of three or five years afterthe opening date of the plans.
In some circumstances, notably upon retirement from the company, this period of threeyears will be waived.
For all the plans, the parity was one share for one allocated option.
• Options granted by LVMH
The AGM of May 15, 2003 renewed the authorization given to the Board of Directors togrant, in one or several steps, to employees or company executives of the Group, stockoptions for up to 3% of the capital.
Each plan has a term of 10 years, and the options may be exercised after a period of threeyears from the opening of the plan, subject to the following exceptions:
– the purchase plan of May 14, 2001, concerning 1,105,877 options, has a term of eightyears, and the options may be exercised after a period of four years;
– the stock options of the plan of January 21, 2004 can be exercised after a period of fouryears.
In some circumstances, notably upon retirement from the company, this period of threeyears will be waived.
For all the plans, the parity was one share for one allocated option.
A - LVMH Stock option plans
Date of AGM Start date ofthe plan
No. ofoptionsgranted
No. ofbeneficiaries
Purchaseprice
(in euros)
No. ofoptions
exercisedin 2004
Number ofoptions notexercised at
Dec. 31,2004
May 15, 2003 January 21, 2004 2,720,425 873 55.70 2,720,425
// January 21, 2004 27,050 33 58.90 – 27,050
2,747,475 906 – 2,747,475
93
B - Purchase plans
Date of AGM Start date ofthe plan
No. ofoptionsgranted
(1)
No. ofbeneficiaries
Purchaseprice
(in euros)(2) (3)
No. ofoptions
exercisedin 2004
(2)
Number ofoptions
outstanding atDec. 31,2004
(2)
LVMHMay 25, 1992 March 16, 1994 139,031 364 17.84 1,571,635 –
// March 22, 1995 256,903 395 20.89 16,817 400,703
June 8, 1995 May 30, 1996 233,199 297 34.15 80,995 633,940// May 29, 1997 233,040 319 37.50 228,130 800,610// January 29, 1998 269,130 346 25.92 163,205 851,110// March 16, 1998 15,800 4 31.25 – 70,400// January 20, 1999 320,059 364 32.10 82,770 1,574,165// September 16, 1999 44,000 9 54.65 10,000 210,000// January 19, 2000 376,110 552 80.10 – 1,872,800
May 17, 2000 January 23, 2001 2,649,075 786 65.12 – 2,586,975// March 6, 2001 40,000 1 63.53 – 40,000// May 14, 2001 1,105,877 44,669 66.00 – 1,105,877// May 14, 2001 552,500 4 61.77 – 552,500// September 12, 2001 50,000 1 52.48 – 50,000// January 22, 2002 3,256,700 968 43.30 13,000 3,200,250// January 22, 2002 27,400 25 45.70 – 27,400// May 15, 2002 8,560 2 54.83 – 8,560// January 22, 2003 3,155,225 941 37.00 11,700 3,104,825// January 22, 2003 58,500 38 38.73 – 58,500
Subtotal LVMH 2,178,252 17,148,615
Christian DiorMay 30, 1996 October 14, 1996 94,600 21 25.95 10,000 255,200May 30, 1996 May 29, 1997 97,900 22 32.01 70,000 302,400May 30, 1996 November 3, 1998 98,400 23 18.29 2,400 292,700May 30, 1996 January 26, 1999 89,500 14 25.36 30,000 328,000May 17, 2000 February 15, 2000 100,200 20 56.70 – 400,800May 14, 2001 February 21, 2001 437,500 17 45.95 – 437,500May 14, 2001 February 18, 2002 504,000 24 33.53 – 504,000May 14, 2001 February 18, 2003 527,000 25 29.04 – 527,000May 14, 2001 February 17, 2004 527,000 26 49.79 – 527,000
Subtotal Christian Dior 112,400 3,574,600
Total 2,290,652 20,723,215
(1) Number of options at the issuance of the plan, not restated to reflect the subsequentadjustments resulting from the one-for-ten bonus share allotments in July 1994 andJune 1999, the five-for-one splits in March 1994 and July 2000, for LVMH, and thefour-for-one split in July 2000 for Dior.
(2) Adjusted to reflect the transactions referred to in (1) above.(3) Figures prior to 1999 result from the conversion to euros of sums originally accounted
in French francs.
94
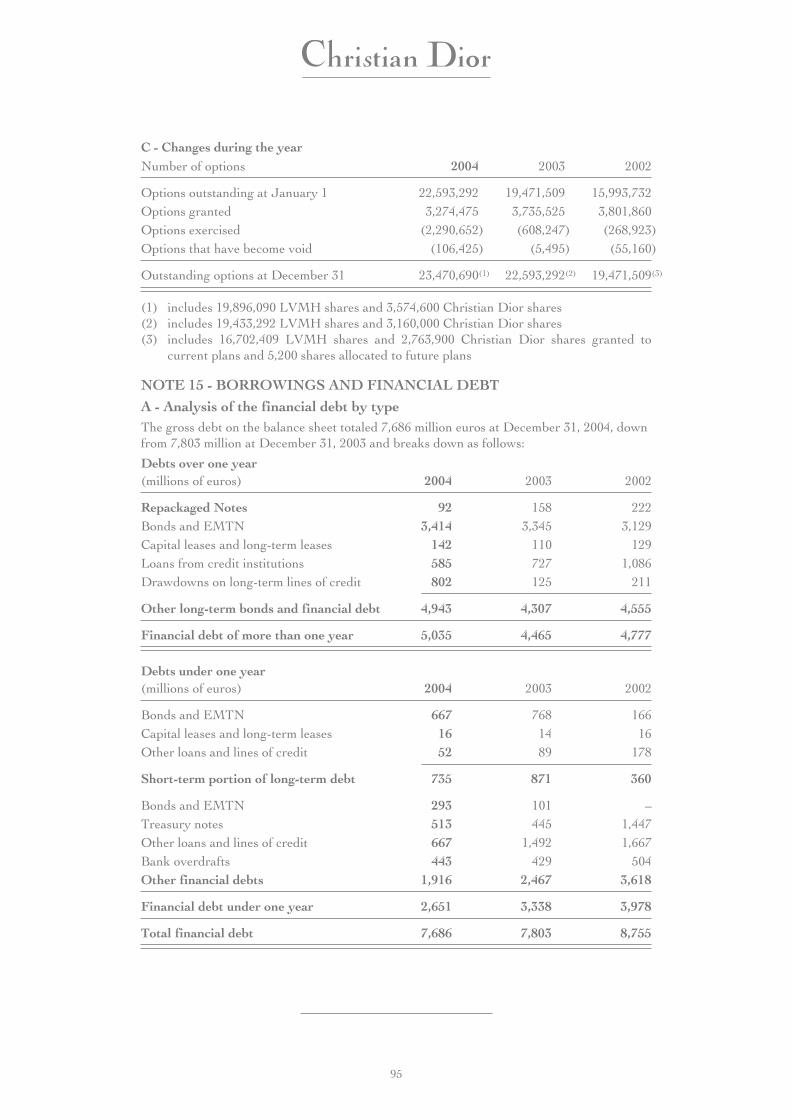
C - Changes during the yearNumber of options 2004 2003 2002
Options outstanding at January 1 22,593,292 19,471,509 15,993,732Options granted 3,274,475 3,735,525 3,801,860Options exercised (2,290,652) (608,247) (268,923)Options that have become void (106,425) (5,495) (55,160)
Outstanding options at December 31 23,470,690(1) 22,593,292(2) 19,471,509(3)
(1) includes 19,896,090 LVMH shares and 3,574,600 Christian Dior shares(2) includes 19,433,292 LVMH shares and 3,160,000 Christian Dior shares(3) includes 16,702,409 LVMH shares and 2,763,900 Christian Dior shares granted to
current plans and 5,200 shares allocated to future plans
NOTE 15 - BORROWINGS AND FINANCIAL DEBT
A - Analysis of the financial debt by typeThe gross debt on the balance sheet totaled 7,686 million euros at December 31, 2004, downfrom 7,803 million at December 31, 2003 and breaks down as follows:
Debts over one year(millions of euros) 2004 2003 2002
Repackaged Notes 92 158 222Bonds and EMTN 3,414 3,345 3,129Capital leases and long-term leases 142 110 129Loans from credit institutions 585 727 1,086Drawdowns on long-term lines of credit 802 125 211
Other long-term bonds and financial debt 4,943 4,307 4,555
Financial debt of more than one year 5,035 4,465 4,777
Debts under one year(millions of euros) 2004 2003 2002
Bonds and EMTN 667 768 166Capital leases and long-term leases 16 14 16Other loans and lines of credit 52 89 178
Short-term portion of long-term debt 735 871 360
Bonds and EMTN 293 101 –Treasury notes 513 445 1,447Other loans and lines of credit 667 1,492 1,667Bank overdrafts 443 429 504Other financial debts 1,916 2,467 3,618
Financial debt under one year 2,651 3,338 3,978
Total financial debt 7,686 7,803 8,755
95
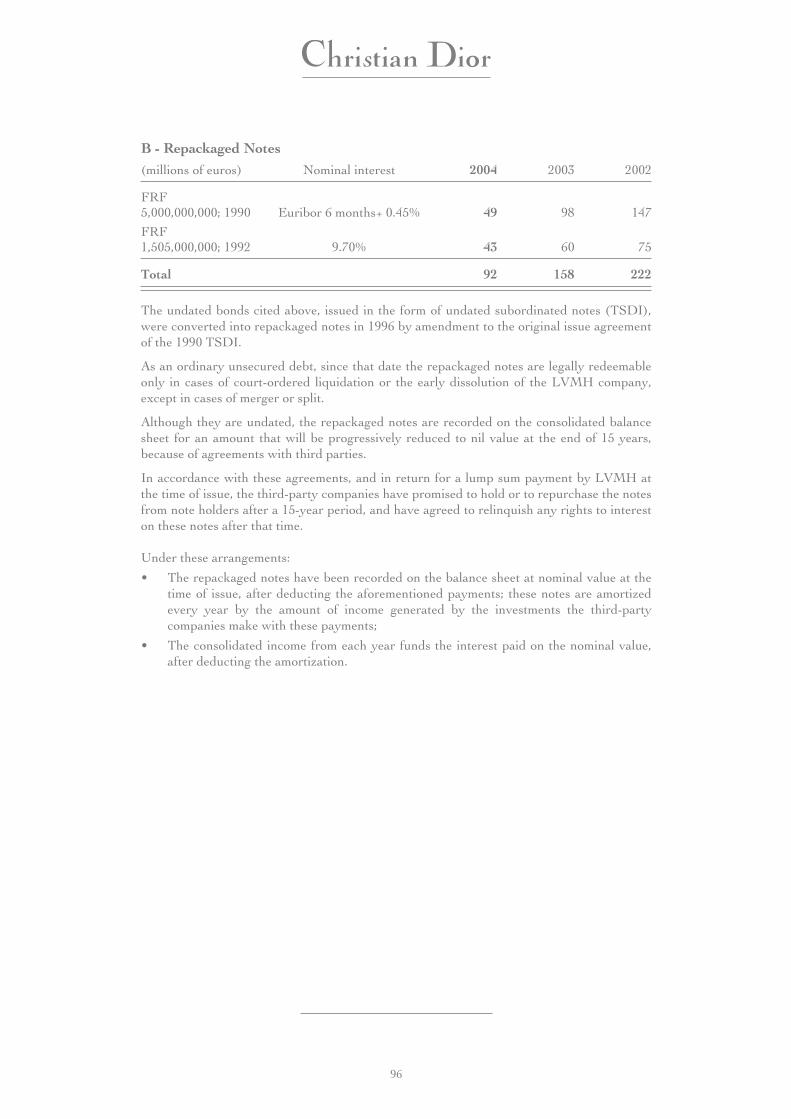
B - Repackaged Notes(millions of euros) Nominal interest 2004 2003 2002
FRF5,000,000,000; 1990 Euribor 6 months+ 0.45% 49 98 147
FRF1,505,000,000; 1992 9.70% 43 60 75
Total 92 158 222
The undated bonds cited above, issued in the form of undated subordinated notes (TSDI),were converted into repackaged notes in 1996 by amendment to the original issue agreementof the 1990 TSDI.
As an ordinary unsecured debt, since that date the repackaged notes are legally redeemableonly in cases of court-ordered liquidation or the early dissolution of the LVMH company,except in cases of merger or split.
Although they are undated, the repackaged notes are recorded on the consolidated balancesheet for an amount that will be progressively reduced to nil value at the end of 15 years,because of agreements with third parties.
In accordance with these agreements, and in return for a lump sum payment by LVMH atthe time of issue, the third-party companies have promised to hold or to repurchase the notesfrom note holders after a 15-year period, and have agreed to relinquish any rights to intereston these notes after that time.
Under these arrangements:
• The repackaged notes have been recorded on the balance sheet at nominal value at thetime of issue, after deducting the aforementioned payments; these notes are amortizedevery year by the amount of income generated by the investments the third-partycompanies make with these payments;
• The consolidated income from each year funds the interest paid on the nominal value,after deducting the amortization.
96
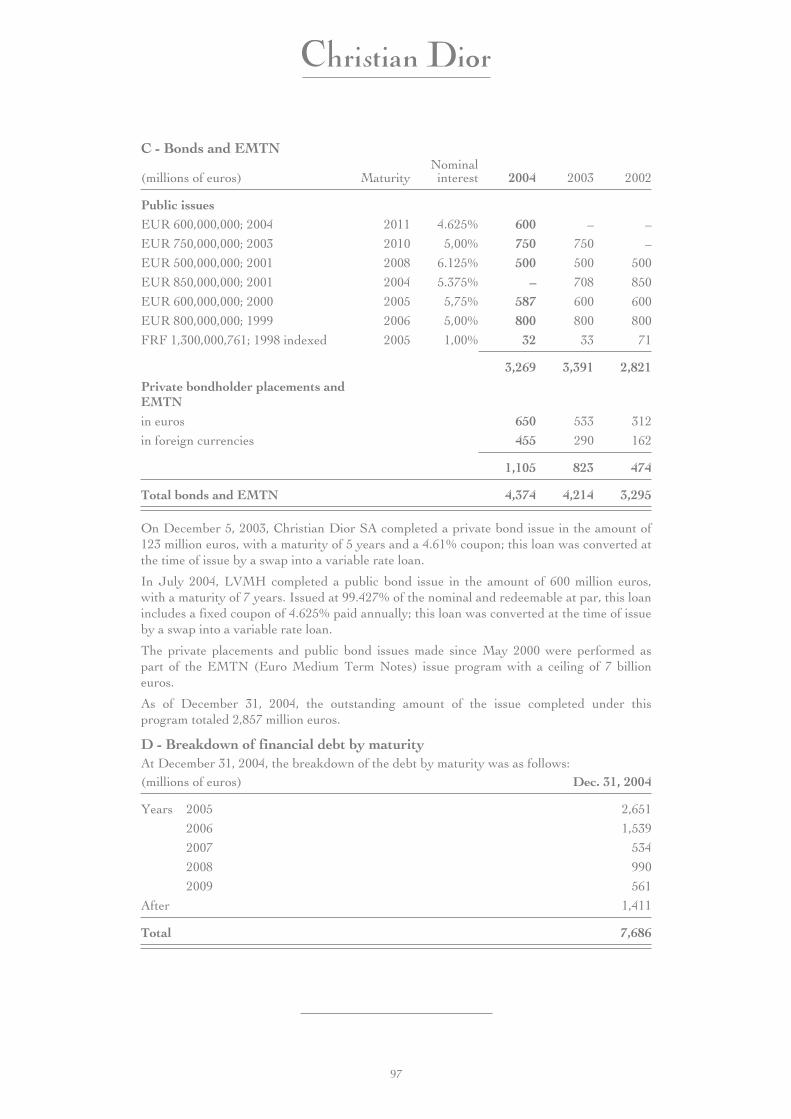
C - Bonds and EMTN
(millions of euros) MaturityNominal
interest 2004 2003 2002
Public issuesEUR 600,000,000; 2004 2011 4.625% 600 – –
EUR 750,000,000; 2003 2010 5,00% 750 750 –
EUR 500,000,000; 2001 2008 6.125% 500 500 500
EUR 850,000,000; 2001 2004 5.375% – 708 850
EUR 600,000,000; 2000 2005 5,75% 587 600 600
EUR 800,000,000; 1999 2006 5,00% 800 800 800
FRF 1,300,000,761; 1998 indexed 2005 1,00% 32 33 71
3,269 3,391 2,821Private bondholder placements andEMTNin euros 650 533 312
in foreign currencies 455 290 162
1,105 823 474
Total bonds and EMTN 4,374 4,214 3,295
On December 5, 2003, Christian Dior SA completed a private bond issue in the amount of123 million euros, with a maturity of 5 years and a 4.61% coupon; this loan was converted atthe time of issue by a swap into a variable rate loan.
In July 2004, LVMH completed a public bond issue in the amount of 600 million euros,with a maturity of 7 years. Issued at 99.427% of the nominal and redeemable at par, this loanincludes a fixed coupon of 4.625% paid annually; this loan was converted at the time of issueby a swap into a variable rate loan.
The private placements and public bond issues made since May 2000 were performed aspart of the EMTN (Euro Medium Term Notes) issue program with a ceiling of 7 billioneuros.
As of December 31, 2004, the outstanding amount of the issue completed under thisprogram totaled 2,857 million euros.
D - Breakdown of financial debt by maturityAt December 31, 2004, the breakdown of the debt by maturity was as follows:(millions of euros) Dec. 31, 2004
Years 2005 2,651
2006 1,539
2007 534
2008 990
2009 561
After 1,411
Total 7,686
97
On November 15, 2004, Christian Dior SA completed the renewal of a syndicated loan of500 million euros which expires on November 15, 2009.
At December 31, 2004, the irrevocable lines of credit not used totaled 4.3 billion euros. Inparticular, the long-term lines totaled approximately 2.2 billion euros.
Because of the existence of renewal authorizations, a portion of the short-term debt wasreclassified as long-term borrowings and financial debt, representing 406 million euros (125and 573 million euros at December 31, 2003 and 2002 respectively).
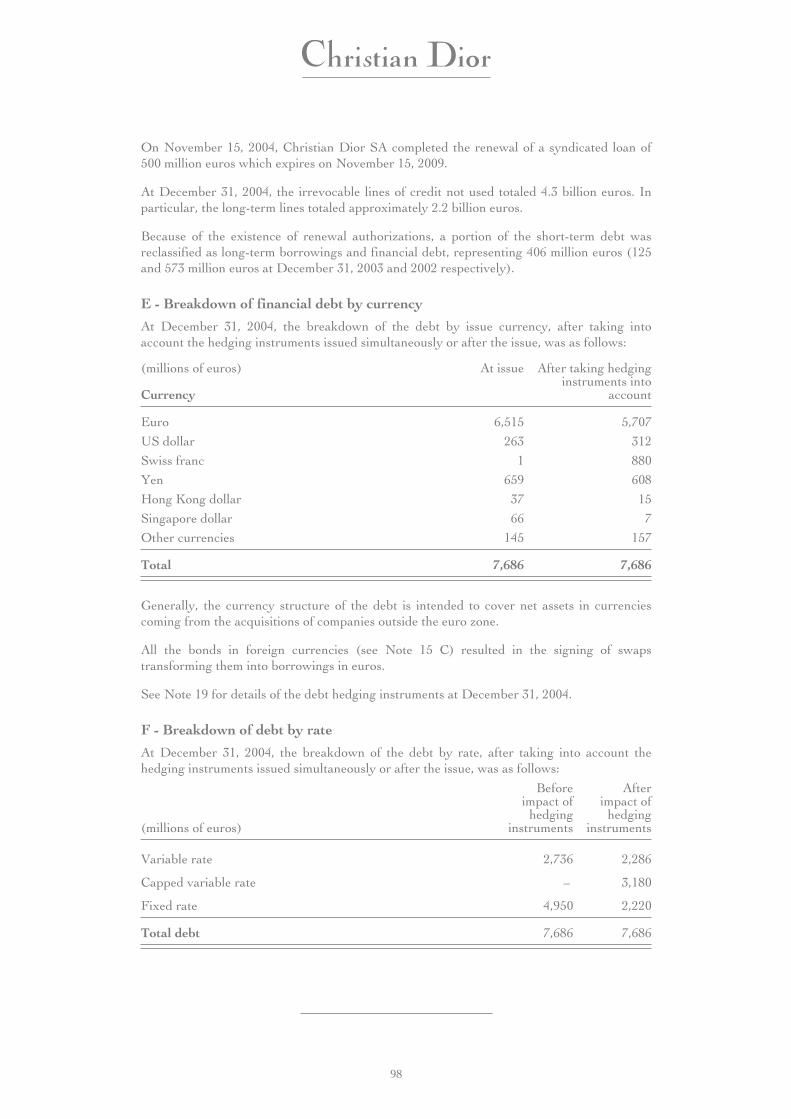
E - Breakdown of financial debt by currency
At December 31, 2004, the breakdown of the debt by issue currency, after taking intoaccount the hedging instruments issued simultaneously or after the issue, was as follows:
(millions of euros) At issue After taking hedginginstruments into
accountCurrency
Euro 6,515 5,707
US dollar 263 312
Swiss franc 1 880
Yen 659 608
Hong Kong dollar 37 15
Singapore dollar 66 7
Other currencies 145 157
Total 7,686 7,686
Generally, the currency structure of the debt is intended to cover net assets in currenciescoming from the acquisitions of companies outside the euro zone.
All the bonds in foreign currencies (see Note 15 C) resulted in the signing of swapstransforming them into borrowings in euros.
See Note 19 for details of the debt hedging instruments at December 31, 2004.
F - Breakdown of debt by rate
At December 31, 2004, the breakdown of the debt by rate, after taking into account thehedging instruments issued simultaneously or after the issue, was as follows:
(millions of euros)
Beforeimpact of
hedginginstruments
Afterimpact of
hedginginstruments
Variable rate 2,736 2,286
Capped variable rate – 3,180
Fixed rate 4,950 2,220
Total debt 7,686 7,686
98
G - Average cost of the debt and information related to sensitivityThe average cost of the debt, after taking into consideration the hedging instruments, was3.2% for financial year 2004 (3.6% for 2003).
Taking into account the debt structure by currency at December 31, 2004, and after takinginto account the existing hedging contracts at this date, an instantaneous increase of 1% onthe curves of debt currencies of the Group would result in a 17 million euro variation of thefinancial income or expenses of the year.
H - Liquidity riskIn addition to local liquidity risks, which are generally not significant, the Group’s exposureto liquidity risk may be assessed through the amount of its short-term net financial debt,which is 2.2 billion euros, or the outstanding amount of its treasury note program, which is0.5 billion euros. With respect to the possible non-renewal of these loans, the Group hasundrawn, confirmed lines of credit in the amount of 4.3 billion euros.
Thus, the Group’s liquidity is based on the size of its investments, on the magnitude of its long-term financing, on the diversity of its investor base (bonds and short-term paper), and on thequality of its bank relations, whether or not these are reflected in confirmed lines of credit.
Covenants
In line with the general practice for syndicated loans, the Group has signed covenants tomeet certain financial ratios. Historically based on the net financial debt-to-equity ratio, asindicated in the financing agreements, these commitments also involve the coverage of netfinancial debt by financial flows for the year.
Confirmed lines of credit not drawn
At December 31, 2004, the total outstanding amount of undrawn confirmed lines of creditwas 4.3 billion euros.
Guarantees and real sureties
At December 31, 2004, the amount of the financial debt secured by real sureties was lessthan 400 million euros.
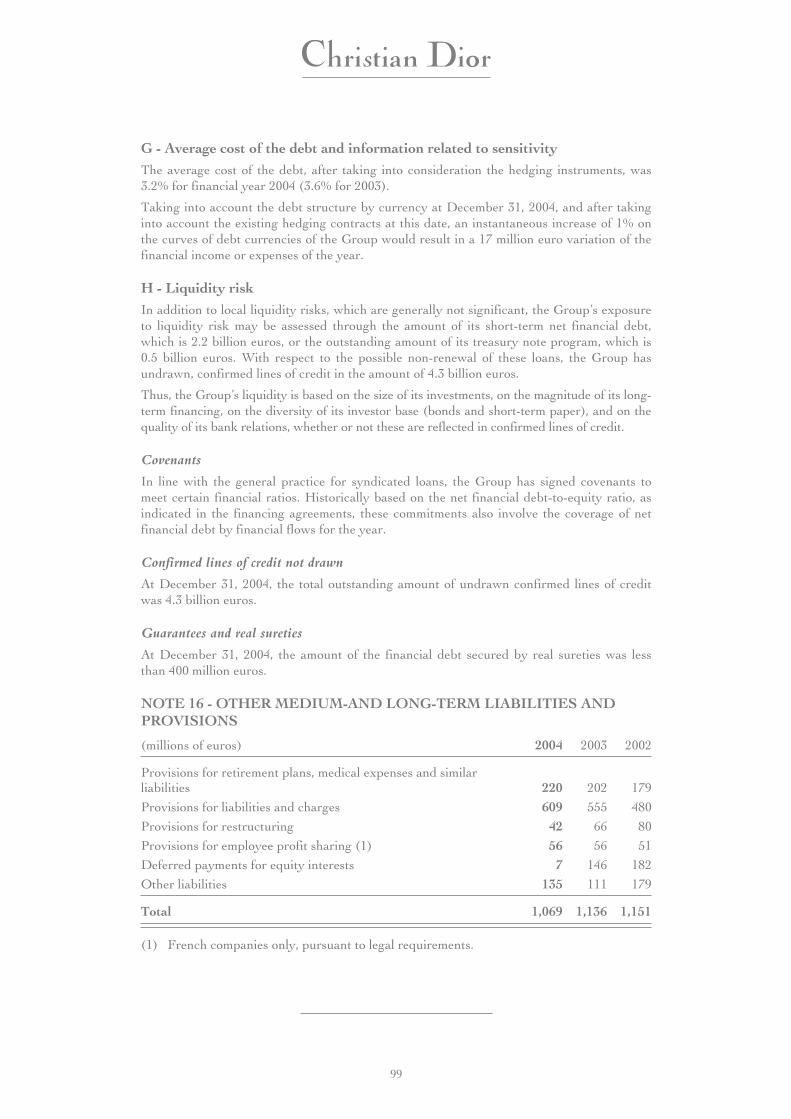
NOTE 16 - OTHER MEDIUM-AND LONG-TERM LIABILITIES ANDPROVISIONS
(millions of euros) 2004 2003 2002
Provisions for retirement plans, medical expenses and similarliabilities 220 202 179
Provisions for liabilities and charges 609 555 480
Provisions for restructuring 42 66 80
Provisions for employee profit sharing (1) 56 56 51
Deferred payments for equity interests 7 146 182
Other liabilities 135 111 179
Total 1,069 1,136 1,151
(1) French companies only, pursuant to legal requirements.
99
Provisions for pensions, medical costs and related commitments are analyzed in Note 25.
The provisions for liabilities and charges represent the estimate of the effects on holdingsfrom risks, litigation, and disputes that exist or are probable, which result from the Group’sactivities: these activities are carried out internationally in a regulatory framework that isoften imprecise, which varies according to the country and over time, and applies to areas asvaried as the composition of products or calculation of taxes.
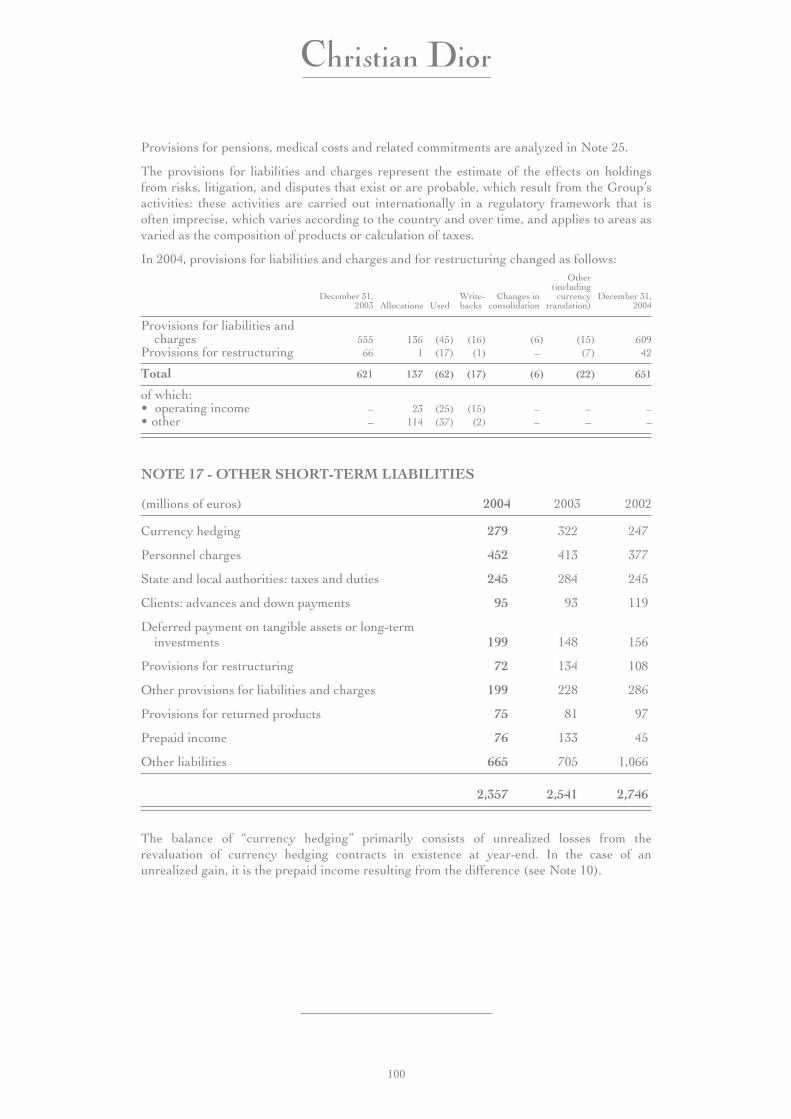
In 2004, provisions for liabilities and charges and for restructuring changed as follows:
December 31,2003 Allocations Used
Write-backs
Changes inconsolidation
Other(including
currencytranslation)
December 31,2004
Provisions for liabilities andcharges 555 136 (45) (16) (6) (15) 609
Provisions for restructuring 66 1 (17) (1) – (7) 42
Total 621 137 (62) (17) (6) (22) 651
of which:• operating income – 23 (25) (15) – – –• other – 114 (37) (2) – – –
NOTE 17 - OTHER SHORT-TERM LIABILITIES
(millions of euros) 2004 2003 2002
Currency hedging 279 322 247
Personnel charges 452 413 377
State and local authorities: taxes and duties 245 284 245
Clients: advances and down payments 95 93 119
Deferred payment on tangible assets or long-terminvestments 199 148 156
Provisions for restructuring 72 134 108
Other provisions for liabilities and charges 199 228 286
Provisions for returned products 75 81 97
Prepaid income 76 133 45
Other liabilities 665 705 1,066
2,357 2,541 2,746
The balance of “currency hedging” primarily consists of unrealized losses from therevaluation of currency hedging contracts in existence at year-end. In the case of anunrealized gain, it is the prepaid income resulting from the difference (see Note 10).
100
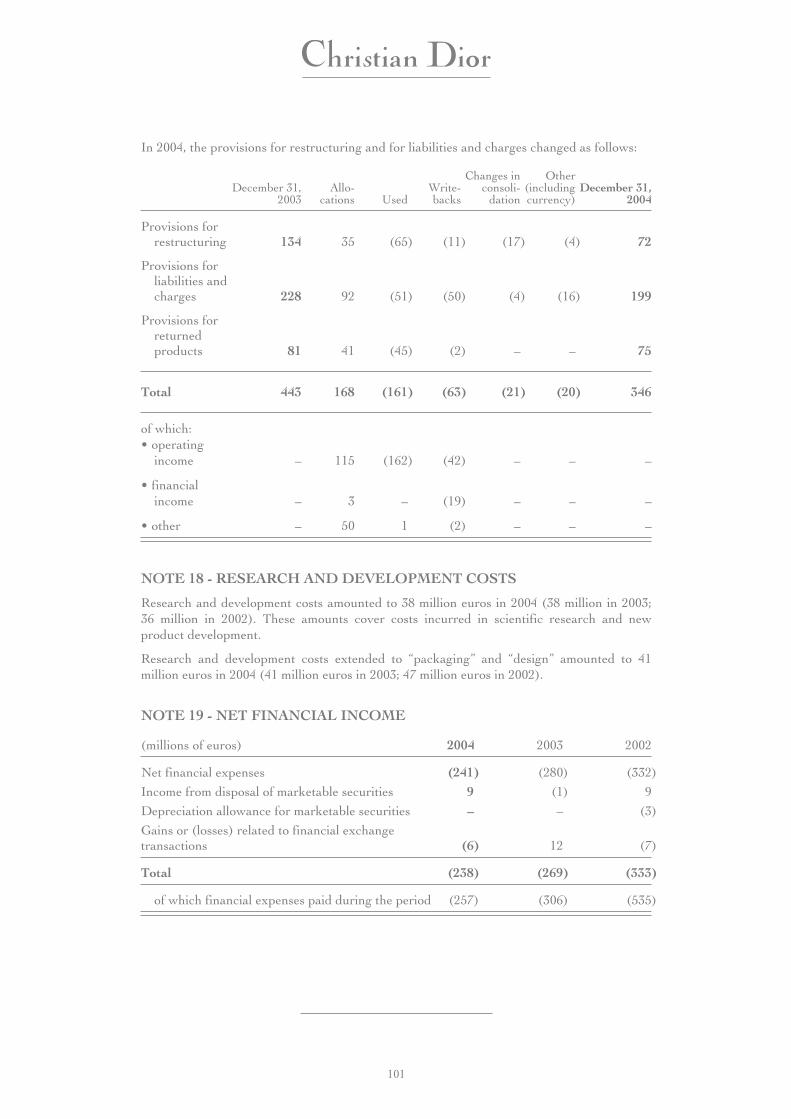
In 2004, the provisions for restructuring and for liabilities and charges changed as follows:
December 31,2003
Allo-cations Used
Write-backs
Changes inconsoli-
dation
Other(includingcurrency)
December 31,2004
Provisions forrestructuring 134 35 (65) (11) (17) (4) 72
Provisions forliabilities andcharges 228 92 (51) (50) (4) (16) 199
Provisions forreturnedproducts 81 41 (45) (2) – – 75
Total 443 168 (161) (63) (21) (20) 346
of which:• operating
income – 115 (162) (42) – – –
• financialincome – 3 – (19) – – –
• other – 50 1 (2) – – –
NOTE 18 - RESEARCH AND DEVELOPMENT COSTS
Research and development costs amounted to 38 million euros in 2004 (38 million in 2003;36 million in 2002). These amounts cover costs incurred in scientific research and newproduct development.
Research and development costs extended to “packaging” and “design” amounted to 41million euros in 2004 (41 million euros in 2003; 47 million euros in 2002).
NOTE 19 - NET FINANCIAL INCOME
(millions of euros) 2004 2003 2002
Net financial expenses (241) (280) (332)
Income from disposal of marketable securities 9 (1) 9
Depreciation allowance for marketable securities – – (3)
Gains or (losses) related to financial exchangetransactions (6) 12 (7)
Total (238) (269) (333)
of which financial expenses paid during the period (257) (306) (535)
101
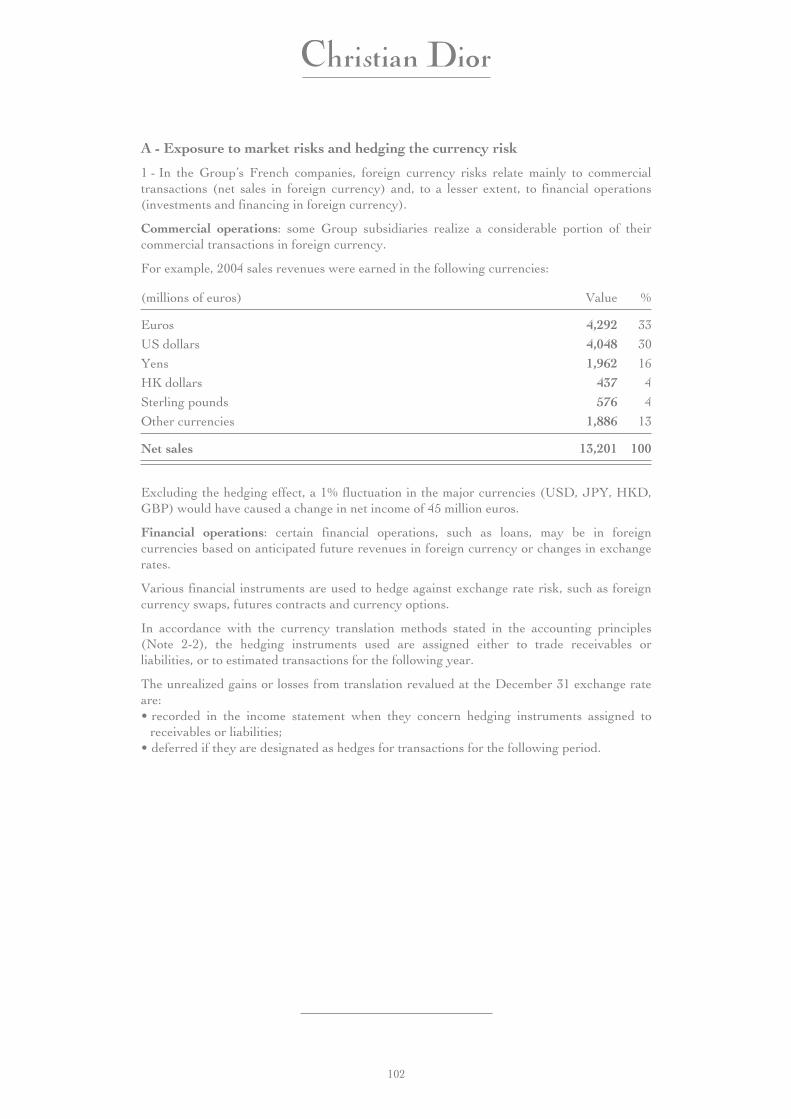
A - Exposure to market risks and hedging the currency risk
1 - In the Group’s French companies, foreign currency risks relate mainly to commercialtransactions (net sales in foreign currency) and, to a lesser extent, to financial operations(investments and financing in foreign currency).
Commercial operations: some Group subsidiaries realize a considerable portion of theircommercial transactions in foreign currency.
For example, 2004 sales revenues were earned in the following currencies:
(millions of euros) Value %
Euros 4,292 33
US dollars 4,048 30
Yens 1,962 16
HK dollars 437 4
Sterling pounds 576 4
Other currencies 1,886 13
Net sales 13,201 100
Excluding the hedging effect, a 1% fluctuation in the major currencies (USD, JPY, HKD,GBP) would have caused a change in net income of 45 million euros.
Financial operations: certain financial operations, such as loans, may be in foreigncurrencies based on anticipated future revenues in foreign currency or changes in exchangerates.
Various financial instruments are used to hedge against exchange rate risk, such as foreigncurrency swaps, futures contracts and currency options.
In accordance with the currency translation methods stated in the accounting principles(Note 2-2), the hedging instruments used are assigned either to trade receivables orliabilities, or to estimated transactions for the following year.
The unrealized gains or losses from translation revalued at the December 31 exchange rateare:• recorded in the income statement when they concern hedging instruments assigned to
receivables or liabilities;• deferred if they are designated as hedges for transactions for the following period.
102
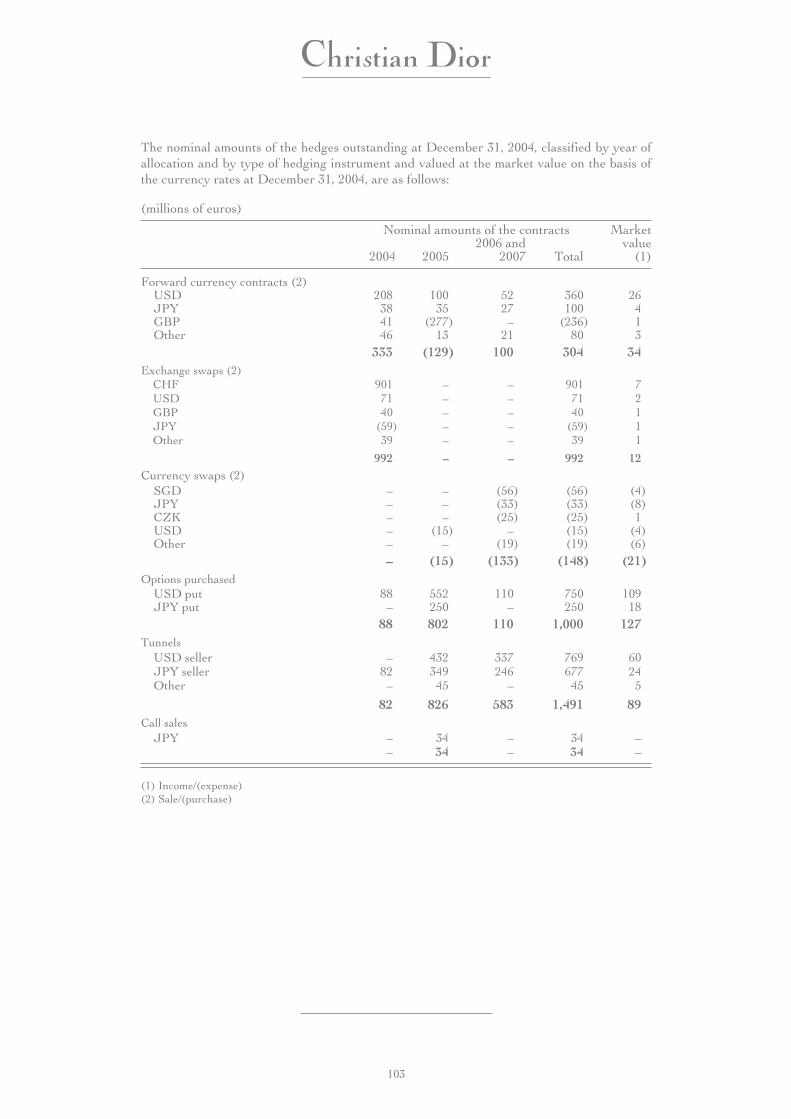
The nominal amounts of the hedges outstanding at December 31, 2004, classified by year ofallocation and by type of hedging instrument and valued at the market value on the basis ofthe currency rates at December 31, 2004, are as follows:
(millions of euros)
Nominal amounts of the contracts Marketvalue
(1)2004 20052006 and
2007 Total
Forward currency contracts (2)USD 208 100 52 360 26JPY 38 35 27 100 4GBP 41 (277) – (236) 1Other 46 13 21 80 3
333 (129) 100 304 34Exchange swaps (2)
CHF 901 – – 901 7USD 71 – – 71 2GBP 40 – – 40 1JPY (59) – – (59) 1Other 39 – – 39 1
992 – – 992 12Currency swaps (2)
SGD – – (56) (56) (4)JPY – – (33) (33) (8)CZK – – (25) (25) 1USD – (15) – (15) (4)Other – – (19) (19) (6)
– (15) (133) (148) (21)Options purchased
USD put 88 552 110 750 109JPY put – 250 – 250 18
88 802 110 1,000 127Tunnels
USD seller – 432 337 769 60JPY seller 82 349 246 677 24Other – 45 – 45 5
82 826 583 1,491 89Call sales
JPY – 34 – 34 –– 34 – 34 –
(1) Income/(expense)(2) Sale/(purchase)
103
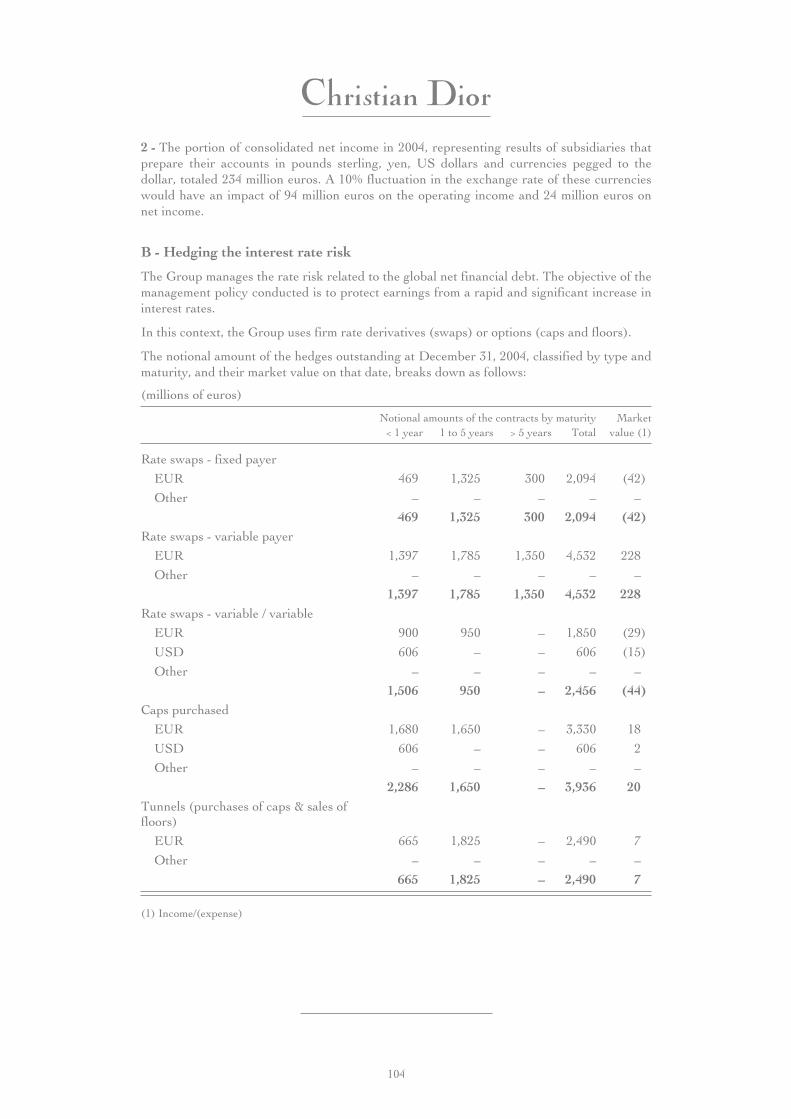
2 - The portion of consolidated net income in 2004, representing results of subsidiaries thatprepare their accounts in pounds sterling, yen, US dollars and currencies pegged to thedollar, totaled 234 million euros. A 10% fluctuation in the exchange rate of these currencieswould have an impact of 94 million euros on the operating income and 24 million euros onnet income.
B - Hedging the interest rate risk
The Group manages the rate risk related to the global net financial debt. The objective of themanagement policy conducted is to protect earnings from a rapid and significant increase ininterest rates.
In this context, the Group uses firm rate derivatives (swaps) or options (caps and floors).
The notional amount of the hedges outstanding at December 31, 2004, classified by type andmaturity, and their market value on that date, breaks down as follows:
(millions of euros)
Notional amounts of the contracts by maturity Marketvalue (1)< 1 year 1 to 5 years > 5 years Total
Rate swaps - fixed payer
EUR 469 1,325 300 2,094 (42)
Other – – – – –
469 1,325 300 2,094 (42)Rate swaps - variable payer
EUR 1,397 1,785 1,350 4,532 228
Other – – – – –
1,397 1,785 1,350 4,532 228Rate swaps - variable / variable
EUR 900 950 – 1,850 (29)
USD 606 – – 606 (15)
Other – – – – –
1,506 950 – 2,456 (44)Caps purchased
EUR 1,680 1,650 – 3,330 18
USD 606 – – 606 2
Other – – – – –
2,286 1,650 – 3,936 20Tunnels (purchases of caps & sales offloors)
EUR 665 1,825 – 2,490 7
Other – – – – –
665 1,825 – 2,490 7
(1) Income/(expense)
104
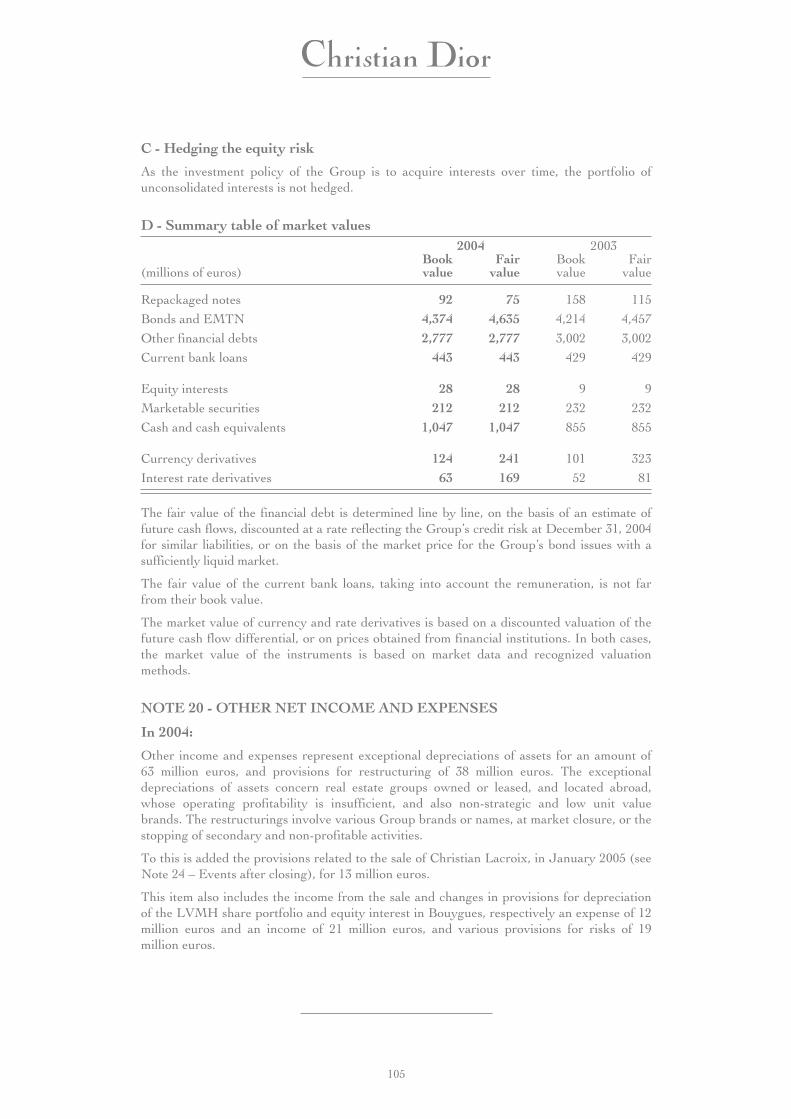
C - Hedging the equity risk
As the investment policy of the Group is to acquire interests over time, the portfolio ofunconsolidated interests is not hedged.
D - Summary table of market values2004 2003
(millions of euros)Bookvalue
Fairvalue
Bookvalue
Fairvalue
Repackaged notes 92 75 158 115
Bonds and EMTN 4,374 4,635 4,214 4,457
Other financial debts 2,777 2,777 3,002 3,002
Current bank loans 443 443 429 429
Equity interests 28 28 9 9
Marketable securities 212 212 232 232
Cash and cash equivalents 1,047 1,047 855 855
Currency derivatives 124 241 101 323
Interest rate derivatives 63 169 52 81
The fair value of the financial debt is determined line by line, on the basis of an estimate offuture cash flows, discounted at a rate reflecting the Group’s credit risk at December 31, 2004for similar liabilities, or on the basis of the market price for the Group’s bond issues with asufficiently liquid market.
The fair value of the current bank loans, taking into account the remuneration, is not farfrom their book value.
The market value of currency and rate derivatives is based on a discounted valuation of thefuture cash flow differential, or on prices obtained from financial institutions. In both cases,the market value of the instruments is based on market data and recognized valuationmethods.
NOTE 20 - OTHER NET INCOME AND EXPENSES
In 2004:
Other income and expenses represent exceptional depreciations of assets for an amount of63 million euros, and provisions for restructuring of 38 million euros. The exceptionaldepreciations of assets concern real estate groups owned or leased, and located abroad,whose operating profitability is insufficient, and also non-strategic and low unit valuebrands. The restructurings involve various Group brands or names, at market closure, or thestopping of secondary and non-profitable activities.
To this is added the provisions related to the sale of Christian Lacroix, in January 2005 (seeNote 24 – Events after closing), for 13 million euros.
This item also includes the income from the sale and changes in provisions for depreciationof the LVMH share portfolio and equity interest in Bouygues, respectively an expense of 12million euros and an income of 21 million euros, and various provisions for risks of 19million euros.
105
In 2003:
Other income and expenses represent restructuring expenses of 127 million euros, losses ondisposals completed or in progress totaling 139 million euros, and 77 million euros inexceptional depreciation of assets; other income and expenses also include net proceeds of 55million euros from the sale of LVMH shares and from changes in provisions on thesesecurities, as well as an additional depreciation of 33 million euros on the Bouygues stake.
The restructurings involve the various businesses of the Group: including the streamlining ofthe distribution networks of Wines and Spirits, primarily in Europe; in Perfumes andCosmetics, an increased selectivity of points of sale, primarily in the United States; theclosing or resizing of industrial units in Italy and Switzerland by the Watches and Jewelrybranch; and, finally, the transfer from San Francisco to Singapore and Hong Kong of theadministrative operations and management of DFS.
The brands and operations sold are described in Note 1 – Changes in consolidation; thelosses from disposals result primarily from the provision funded for the sale of Ebel at theend of December 2003.
The depreciation of assets affects primarily the assets acquired under long-term leases, forwhich the lease payment has become greater than the market value.
In 2002:
Other income and expenses include the following: a net capital gain of 55 million euros fromthe sales of the Pommery, Hard Candy and Urban Decay brands, various real estate assetsand the investments in Fininfo and Grand Marnier; a supplemental provision of 200 millioneuros for the Bouygues securities; a non-recurring write-down of assets for 116 millioneuros, including 41 million euros for inventories and 55 million euros for intangible assets.Other income and expenses also include net income of 17 million euros from the sales ofLVMH shares and changes to the reserves for these securities, and a total of 161 millioneuros primarily related to provisions for the costs of restructuring the distribution networkof Moët Hennessy in certain countries, the complete divesting of Phillips capital and theclosing of some shops.
NOTE 21 - INCOME TAXES
A - Breakdown of income taxes(millions of euros) 2004 2003 2002
Current taxes (489) (377) (502)
Deferred taxes (74) (119) 146
Total tax expense (563) (496) (356)
106
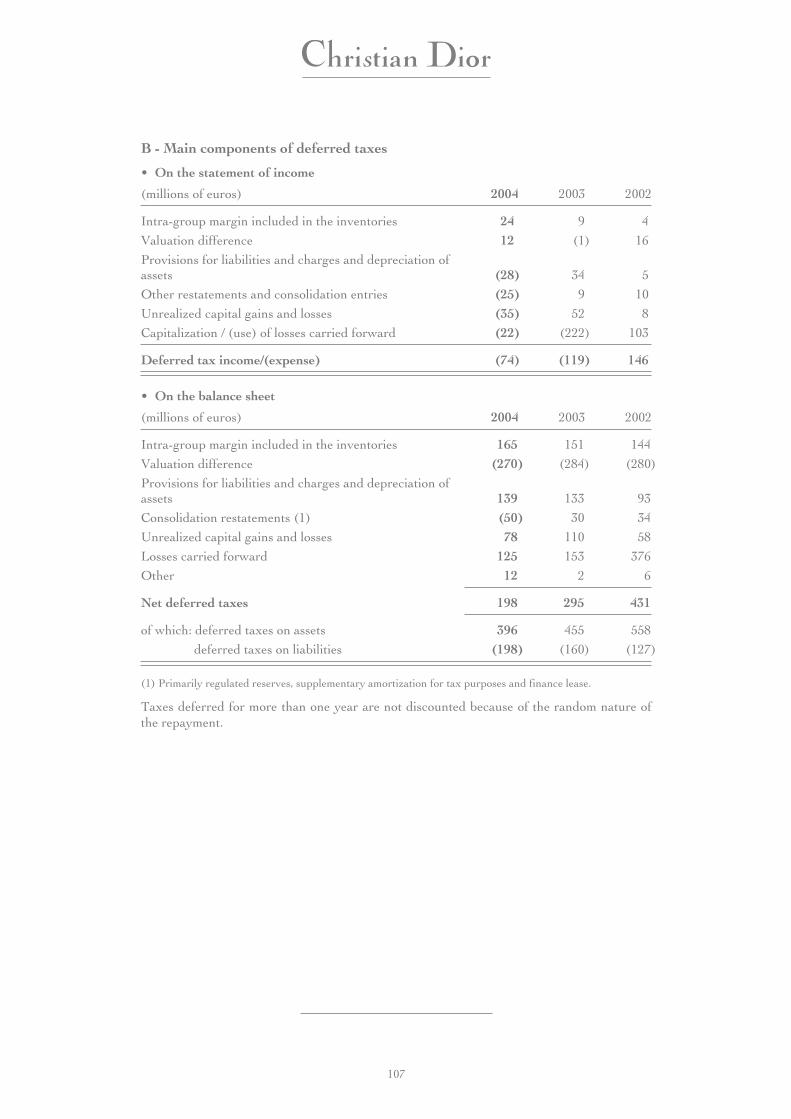
B - Main components of deferred taxes
• On the statement of income
(millions of euros) 2004 2003 2002
Intra-group margin included in the inventories 24 9 4
Valuation difference 12 (1) 16
Provisions for liabilities and charges and depreciation ofassets (28) 34 5
Other restatements and consolidation entries (25) 9 10
Unrealized capital gains and losses (35) 52 8
Capitalization / (use) of losses carried forward (22) (222) 103
Deferred tax income/(expense) (74) (119) 146
• On the balance sheet
(millions of euros) 2004 2003 2002
Intra-group margin included in the inventories 165 151 144
Valuation difference (270) (284) (280)
Provisions for liabilities and charges and depreciation ofassets 139 133 93
Consolidation restatements (1) (50) 30 34
Unrealized capital gains and losses 78 110 58
Losses carried forward 125 153 376
Other 12 2 6
Net deferred taxes 198 295 431
of which: deferred taxes on assets 396 455 558
deferred taxes on liabilities (198) (160) (127)
(1) Primarily regulated reserves, supplementary amortization for tax purposes and finance lease.
Taxes deferred for more than one year are not discounted because of the random nature ofthe repayment.
107
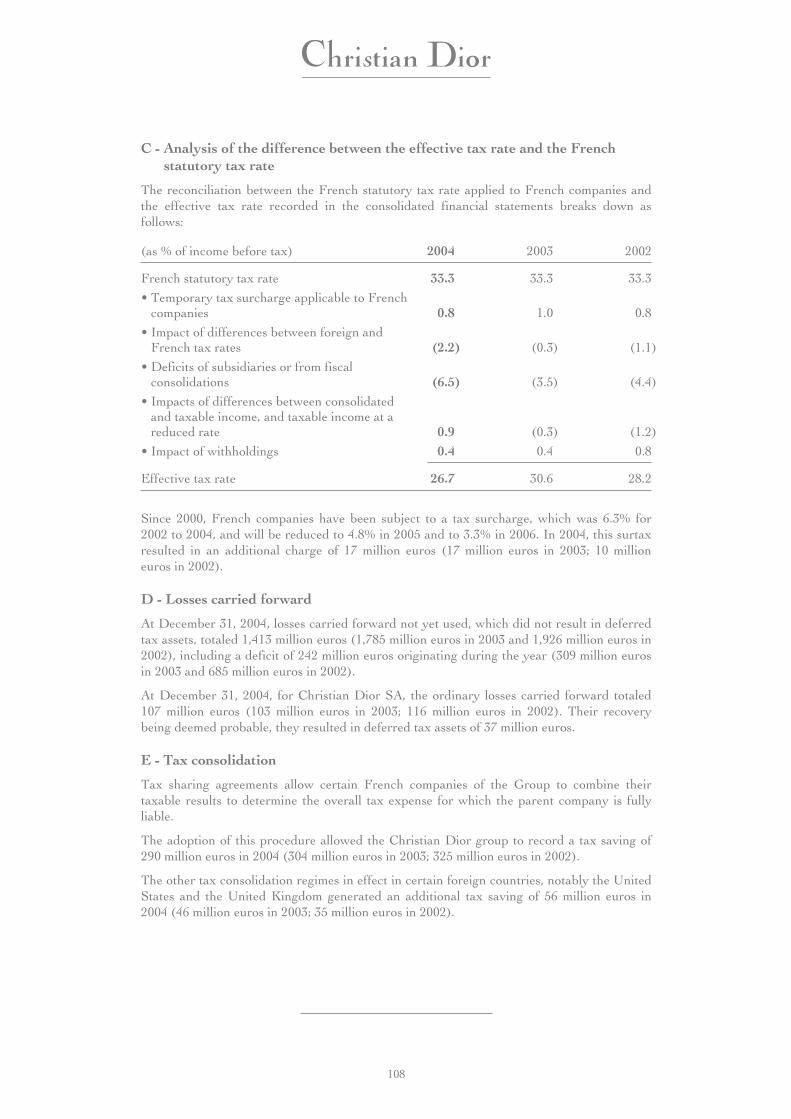
C - Analysis of the difference between the effective tax rate and the Frenchstatutory tax rate
The reconciliation between the French statutory tax rate applied to French companies andthe effective tax rate recorded in the consolidated financial statements breaks down asfollows:
(as % of income before tax) 2004 2003 2002
French statutory tax rate 33.3 33.3 33.3
• Temporary tax surcharge applicable to Frenchcompanies 0.8 1.0 0.8
• Impact of differences between foreign andFrench tax rates (2.2) (0.3) (1.1)
• Deficits of subsidiaries or from fiscalconsolidations (6.5) (3.5) (4.4)
• Impacts of differences between consolidatedand taxable income, and taxable income at areduced rate 0.9 (0.3) (1.2)
• Impact of withholdings 0.4 0.4 0.8
Effective tax rate 26.7 30.6 28.2
Since 2000, French companies have been subject to a tax surcharge, which was 6.3% for2002 to 2004, and will be reduced to 4.8% in 2005 and to 3.3% in 2006. In 2004, this surtaxresulted in an additional charge of 17 million euros (17 million euros in 2003; 10 millioneuros in 2002).
D - Losses carried forward
At December 31, 2004, losses carried forward not yet used, which did not result in deferredtax assets, totaled 1,413 million euros (1,785 million euros in 2003 and 1,926 million euros in2002), including a deficit of 242 million euros originating during the year (309 million eurosin 2003 and 685 million euros in 2002).
At December 31, 2004, for Christian Dior SA, the ordinary losses carried forward totaled107 million euros (103 million euros in 2003; 116 million euros in 2002). Their recoverybeing deemed probable, they resulted in deferred tax assets of 37 million euros.
E - Tax consolidation
Tax sharing agreements allow certain French companies of the Group to combine theirtaxable results to determine the overall tax expense for which the parent company is fullyliable.
The adoption of this procedure allowed the Christian Dior group to record a tax saving of290 million euros in 2004 (304 million euros in 2003; 325 million euros in 2002).
The other tax consolidation regimes in effect in certain foreign countries, notably the UnitedStates and the United Kingdom generated an additional tax saving of 56 million euros in2004 (46 million euros in 2003; 35 million euros in 2002).
108

NOTE 22 - GOODWILL AMORTIZATION
(millions of euros) 2004 2003 2002
Companies consolidated by:
• Full consolidation (250) (240) (251)
• Equity method – (4) (2)
Current amortization (250) (244) (253)
Exceptional amortization (24) (46) –
Total amortization expense (274) (290) (253)
The unusual amortization corresponds:- in 2004, to additional depreciation of goodwill on La Brosse & Dupont for 10 million euros,and to the total depreciation of goodwill on Omas for 14 million euros.- in 2003, to a partial depreciation of goodwill on La Brosse & Dupont for 30 million eurosand on Acqua di Parma for 12 million euros.
NOTE 23 - OTHER COMMITMENTS, POSSIBLE LIABILITIES ANDCURRENT DISPUTES
A - Purchase commitments(millions of euros) 2004 2003 2002
Grapes, wines and distilled alcohol 775 456 429
Industrial or commercial assets 77 81 104
Equity interests (1) 257 470 756
(1) After deduction of post-closing events – See Note 24.
In the Wines and Spirits business group, some companies have contractual agreements withvarious local growers to supply a portion of their future requirements for grapes, light wineand distilled alcohol. Depending on the business, these commitments are based oncontractual terms or the latest known prices and anticipated yields. They primarily cover theyears 2005 and 2006.
The commitments to purchase equity interests represent contractual commitments enteredinto by the Group to purchase minority interests in consolidated subsidiaries or equity andadditional interests in unconsolidated subsidiaries, or additional payments on prices ofrealized transactions.
These amounts do not include the effects of the Memorandum of Understanding of January20, 1994 between LVMH and Diageo, under which LVMH agreed to purchase at Diageo’srequest its 34% interest in Moët Hennessy, with 6 months’ notice, for an amount equal to80% of its value on the date of this request. On the date of the Memorandum, the Diageoinvestment in Moët Hennessy was assessed at more than 1.2 billion euros.
109
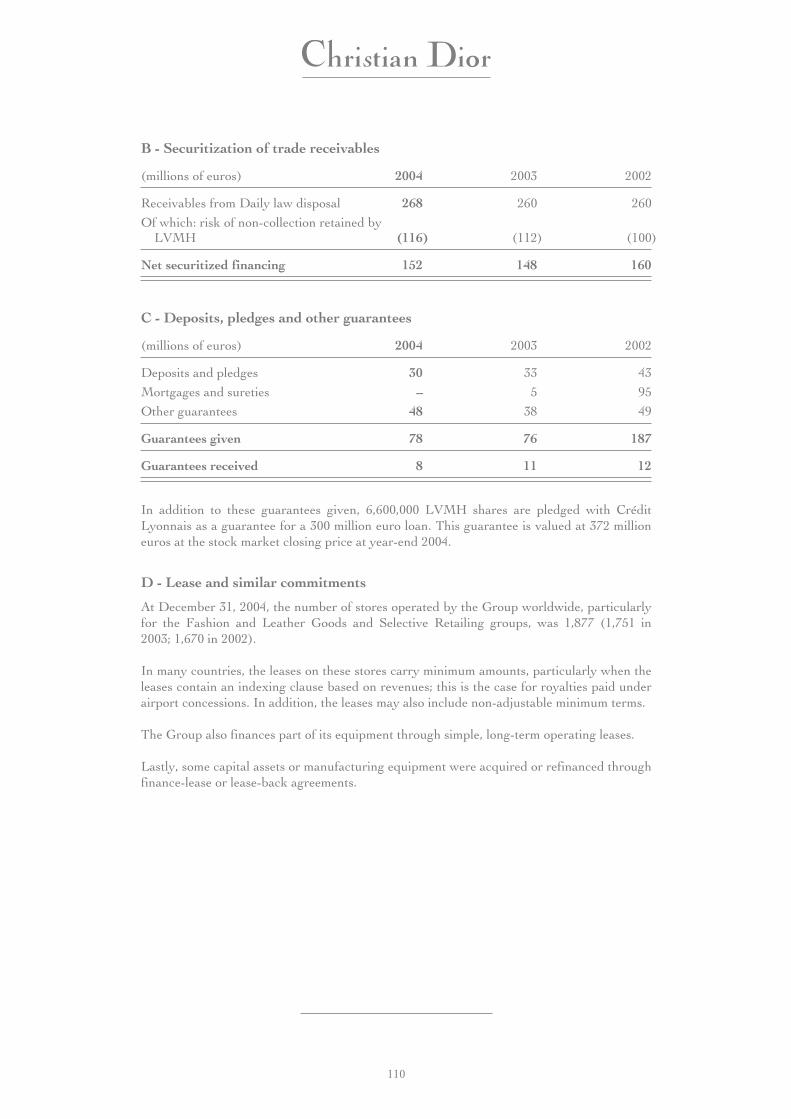
B - Securitization of trade receivables
(millions of euros) 2004 2003 2002
Receivables from Daily law disposal 268 260 260
Of which: risk of non-collection retained byLVMH (116) (112) (100)
Net securitized financing 152 148 160
C - Deposits, pledges and other guarantees
(millions of euros) 2004 2003 2002
Deposits and pledges 30 33 43
Mortgages and sureties – 5 95
Other guarantees 48 38 49
Guarantees given 78 76 187
Guarantees received 8 11 12
In addition to these guarantees given, 6,600,000 LVMH shares are pledged with CréditLyonnais as a guarantee for a 300 million euro loan. This guarantee is valued at 372 millioneuros at the stock market closing price at year-end 2004.
D - Lease and similar commitments
At December 31, 2004, the number of stores operated by the Group worldwide, particularlyfor the Fashion and Leather Goods and Selective Retailing groups, was 1,877 (1,751 in2003; 1,670 in 2002).
In many countries, the leases on these stores carry minimum amounts, particularly when theleases contain an indexing clause based on revenues; this is the case for royalties paid underairport concessions. In addition, the leases may also include non-adjustable minimum terms.
The Group also finances part of its equipment through simple, long-term operating leases.
Lastly, some capital assets or manufacturing equipment were acquired or refinanced throughfinance-lease or lease-back agreements.
110
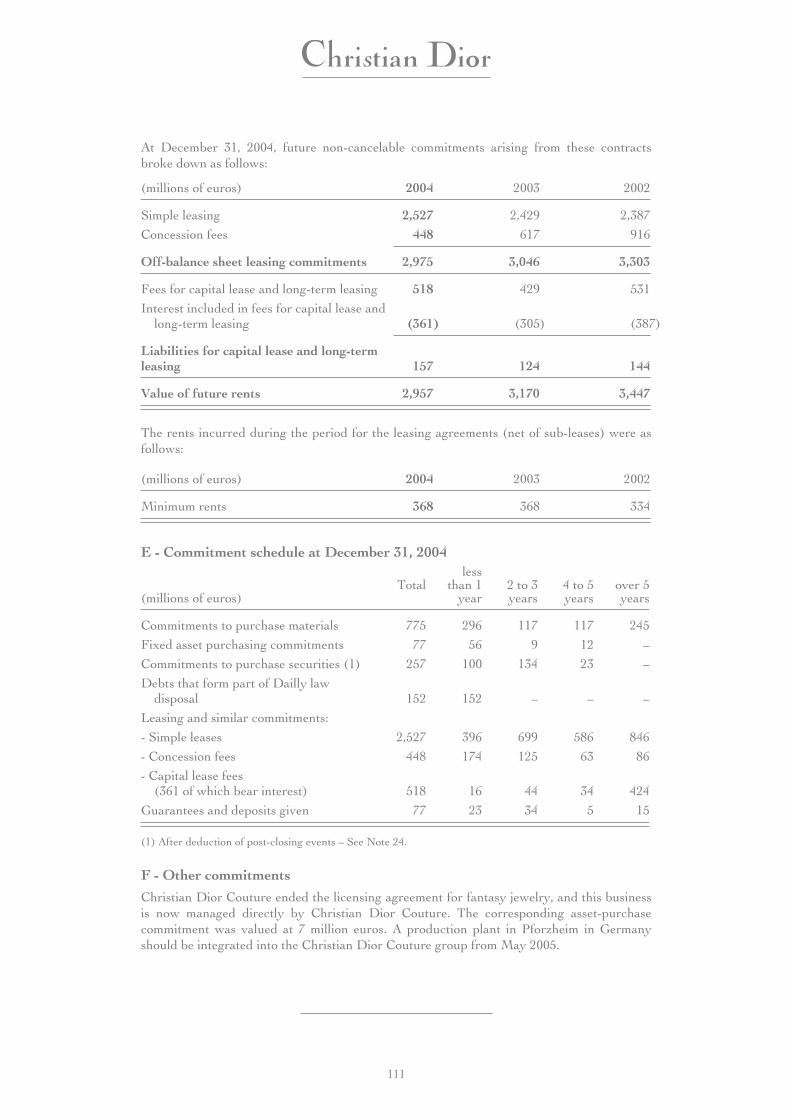
At December 31, 2004, future non-cancelable commitments arising from these contractsbroke down as follows:
(millions of euros) 2004 2003 2002
Simple leasing 2,527 2,429 2,387
Concession fees 448 617 916
Off-balance sheet leasing commitments 2,975 3,046 3,303
Fees for capital lease and long-term leasing 518 429 531
Interest included in fees for capital lease andlong-term leasing (361) (305) (387)
Liabilities for capital lease and long-termleasing 157 124 144
Value of future rents 2,957 3,170 3,447
The rents incurred during the period for the leasing agreements (net of sub-leases) were asfollows:
(millions of euros) 2004 2003 2002
Minimum rents 368 368 334
E - Commitment schedule at December 31, 2004
(millions of euros)Total
lessthan 1
year2 to 3years
4 to 5years
over 5years
Commitments to purchase materials 775 296 117 117 245
Fixed asset purchasing commitments 77 56 9 12 –
Commitments to purchase securities (1) 257 100 134 23 –
Debts that form part of Dailly lawdisposal 152 152 – – –
Leasing and similar commitments:
- Simple leases 2,527 396 699 586 846
- Concession fees 448 174 125 63 86
- Capital lease fees(361 of which bear interest) 518 16 44 34 424
Guarantees and deposits given 77 23 34 5 15
(1) After deduction of post-closing events – See Note 24.
F - Other commitments
Christian Dior Couture ended the licensing agreement for fantasy jewelry, and this businessis now managed directly by Christian Dior Couture. The corresponding asset-purchasecommitment was valued at 7 million euros. A production plant in Pforzheim in Germanyshould be integrated into the Christian Dior Couture group from May 2005.
111
To the knowledge of the Group, there are no significant off-balance sheet commitmentsother than those described above.
G - Possible liabilities and current disputes
In the ordinary course of its business, the Group is a party from time to time to legalproceedings and claims involving trademarks, protection of intellectual property rights,establishing selective retailing agreements, licensing, employee relations, tax audits andother matters inherent in its business. The Group estimates that the provisions included inthe balance sheets related to risks, litigation and disputes known or in-process at the closingdate are sufficient to cover any unfavorable outcome, so that the Group’s financial positionwould not be significantly affected.
NOTE 24 - EVENTS AFTER CLOSING
• Following the friendly Tender Offer closed at the end of December 2004, LVMH acquiredin January 2005, 99% of the capital of Glenmorangie Plc, a UK company publicly tradedin London, and the balance in February and March 2005 through a squeeze-out. Theamount paid for the totality of the capital, and the active options at the date of thetransaction, was 310 million sterling pounds.
In accordance with the terms of the offer, 51 million sterling pounds of this price waspayable in the form of loan notes, bearing interest at LIBOR GBP less 0.80%, redeemableat par at the holders’ request after December 15, 2005, on the interest payment dates ofJune 15 and December 15 each year, and at the latest by December 15, 2012.
The Glenmorangie group most notably owns the whisky brands single malt Glenmorangie,Ardberg and Glen Moray.
Glenmorangie’s published sales revenue and operating income for the financial year endedMarch 31, 2004 were respectively 69 and 12 million sterling pounds, and its netconsolidated assets totaled 82 million sterling pounds, according to current UK accountingstandards.
• In January 2005, LVMH sold the totality of its interest in Christian Lacroix for a symbolicamount (see also Note 20: Other net income and expenses).
• Under a memorandum of understanding agreed in February 2005, LVMH committed toacquire at the latest on April 8, 2005, the remaining 30% of Millennium, for USD 120 million.
112
NOTE 25 - EMPLOYEE INFORMATION
Payroll charges totaled 2,314 million euros (2,261 million in 2003; 2,336 million in 2002).
The average number of employees in 2004 was 58,679 (56,815 in 2003; 55,314 in 2002).
At December 31, the staffing of fully consolidated companies was as follows:
By business group 2004 2003 2002
Christian Dior Couture 2,304 2,004 1,728
Wines and Spirits 4,698 4,757 4,801
Fashion and Leather Goods 18,323 17,177 16,323
Perfumes and Cosmetics 13,490 13,082 13,006
Watches and Jewelry 1,777 2,255 2,366
Selective retailing 20,045 18,091 18,243
Other activities 878 880 1,074
Total 61,515 58,246 57,541
By geographic region
France 20,261 20,201 20,990
Europe (excl. France) 12,053 11,646 10,871
America 14,367 13,106 13,050
Japan 5,160 4,402 4,043
Asia Pacific 9,674 8,891 8,587
Total 61,515 58,246 57,541
By category
Labor and production 9,032 9,156 9,084
Office and clerical 37,022 33,899 32,710
Supervisors 5,905 5,870 5,735
Executives and management 9,556 9,321 10,012
Total 61,515 58,246 57,541
113

Compensation
Compensation paid to Christian Dior directors and officers for their duties in consolidatedcompanies totaled 9,663,000 euros.
Expenses and provisions for retirements, medical costs and similar liabilities
• Expense for the year
(millions of euros) 2004 2003 2002
Cost of services rendered 36 40 34
Impact of discounting 18 18 15
Expected return on dedicated investments (7) (7) (6)
Amortization of actuarial differences 2 1 3
Changes in treatments 24 16 –
Expenses for the period 73 68 46
• Analysis of the commitment
(millions of euros) 2004 2003 2002
Discounted value of entitlements 527 433 373
entitlements not covered by financial assets 157 161 –
entitlements covered by financial assets 370 272 –
Market value of dedicated investments (264) (192) (149)
Items not recognized (43) (34) (38)
Net commitment 220 207 186Of which:
Other long-term liabilities 220 202 179
Other liabilities less than one-year 3 8 7
Long-term financial assets (3) (3) –
Total 220 207 186
114
• Changes in commitments break down as follows:
(millions of euros)
Discountedvalue of
entitlements
Marketvalues of
investments
Items notrecognized
Netcommitments
Balance at December 31, 2003 433 (192) (34) 207
Expense for the period 54 (7) 26 73
Benefits paid to beneficiaries (36) 21 – (15)
Increase in dedicated investments – (41) – (41)
Impact of currency changes (10) 4 – (6)
Impact of changes in consolidation 2 – – 2
Changes in treatment 87 (46) (41) –
Actuarial differences (3) (3) 6 –
Balance at December 31, 2004 527 (264) (43) 220
The actuarial assumptions used to estimate the commitments at December 31, 2004, in theprincipal countries where the commitments are located are as follows:
Discount rate 2.00% in Japan, 4.75% in France,5.75% in the United States.
Expected long-term rate of return oninvestments
4.00% in Japan, 4.75% in France,8.00% in the United States.
Future rate of increase of salaries 2.00% to 4.00%.Rate of increase of medical costs decreasing from 9% to 5% between 2005
and 2009, 5% thereafter in the UnitedStates.
• Analysis of entitlements
The analysis of the discounted value of entitlements by type of plan is as follows:
(millions of euros) 2004 2003
Retirement indemnities and related provisions 77 77
Medical expenses of retirees 57 64
Long-service awards 10 13
Additional retirement payments 334 230
Pre-retirement payments 41 41
Other 8 8
Discounted value of entitlements 527 433
115
NOTE 26 - INFORMATION SPECIFIC TO BUSINESS GROUPS(millions of euros) 2004 2003 2002
Net salesChristian Dior Couture 595 523 492Wines and Spirits 2,280 2,116 2,266Fashion and Leather Goods 4,362 4,149 4,207Perfumes and Cosmetics 2,153 2,181 2,336Watches and Jewelry 496 502 552Selective retailing 3,378 3,039 3,337Other activities and eliminations (63) (44) (22)
Consolidated total 13,201 12,466 13,168
Operating incomeChristian Dior Couture 50 40 33Wines and Spirits 806 796 750Fashion and Leather Goods 1,329 1,311 1,280Perfumes and Cosmetics 181 178 161Watches and Jewelry 13 (48) (13)Selective retailing 244 106 20Other activities and eliminations (162) (170) (197)
Consolidated total 2,461 2,213 2,034
Balance sheet assetsChristian Dior Couture 864 809 747Wines and Spirits 4,996 5,084 4,822Fashion and Leather Goods 6,498 6,092 6,245Perfumes and Cosmetics 2,279 2,446 2,450Watches and Jewelry 1,333 1,444 1,657Selective retailing 4,201 4,189 4,477Other activities and eliminations 5,702 5,738 6,404
Consolidated total 25,873 25,802 26,802
InventoriesChristian Dior Couture 130 113 103Wines and Spirits 2,043 1,999 1,912Fashion and Leather Goods 555 468 462Perfumes and Cosmetics 229 228 225Watches and Jewelry 161 188 196Selective retailing 498 483 524Other activities and eliminations 14 38 100
Consolidated total 3,630 3,517 3,522
116
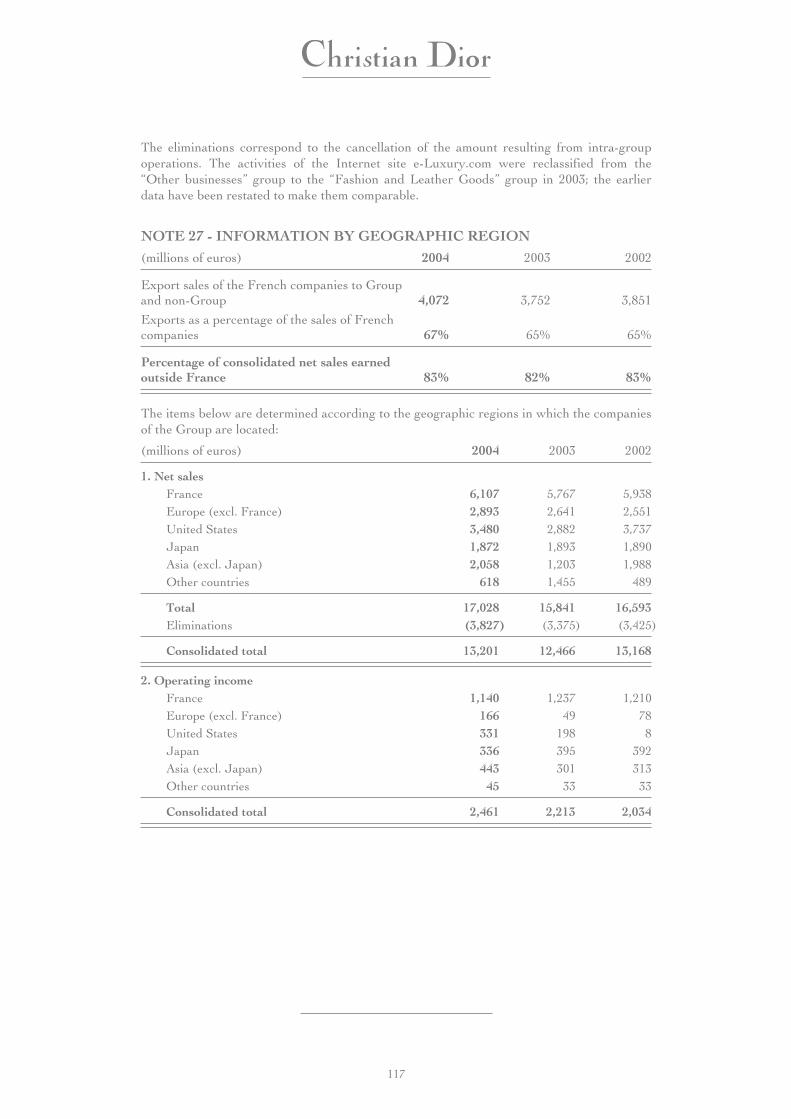
The eliminations correspond to the cancellation of the amount resulting from intra-groupoperations. The activities of the Internet site e-Luxury.com were reclassified from the“Other businesses” group to the “Fashion and Leather Goods” group in 2003; the earlierdata have been restated to make them comparable.
NOTE 27 - INFORMATION BY GEOGRAPHIC REGION(millions of euros) 2004 2003 2002
Export sales of the French companies to Groupand non-Group 4,072 3,752 3,851
Exports as a percentage of the sales of Frenchcompanies 67% 65% 65%
Percentage of consolidated net sales earnedoutside France 83% 82% 83%
The items below are determined according to the geographic regions in which the companiesof the Group are located:
(millions of euros) 2004 2003 2002
1. Net salesFrance 6,107 5,767 5,938Europe (excl. France) 2,893 2,641 2,551United States 3,480 2,882 3,737Japan 1,872 1,893 1,890Asia (excl. Japan) 2,058 1,203 1,988Other countries 618 1,455 489
Total 17,028 15,841 16,593Eliminations (3,827) (3,375) (3,425)
Consolidated total 13,201 12,466 13,168
2. Operating incomeFrance 1,140 1,237 1,210Europe (excl. France) 166 49 78United States 331 198 8Japan 336 395 392Asia (excl. Japan) 443 301 313Other countries 45 33 33
Consolidated total 2,461 2,213 2,034
117

(millions of euros) 2004 2003 2002
3. Balance sheet assetsFrance 15,465 15,351 15,549Europe (excl. France) 4,409 4,458 4,256United States 2,945 3,142 3,989Japan 849 844 773Asia (excl. Japan) 1,788 1,529 1,810Other countries 417 478 425
Consolidated total 25,873 25,802 26,802
4. Balance sheet liabilities (excluding shareholders'equity and minority interests)
France 9,363 9,583 9,929Europe (excl. France) 959 1,067 1,167United States 852 923 1,206Japan 868 743 696Asia (excl. Japan) 622 803 1,076Other countries 175 104 93
Total before appropriation 12,839 13,223 14,167
Dividends paid 115 105 96
Total after appropriation 12,954 13,328 14,263
118
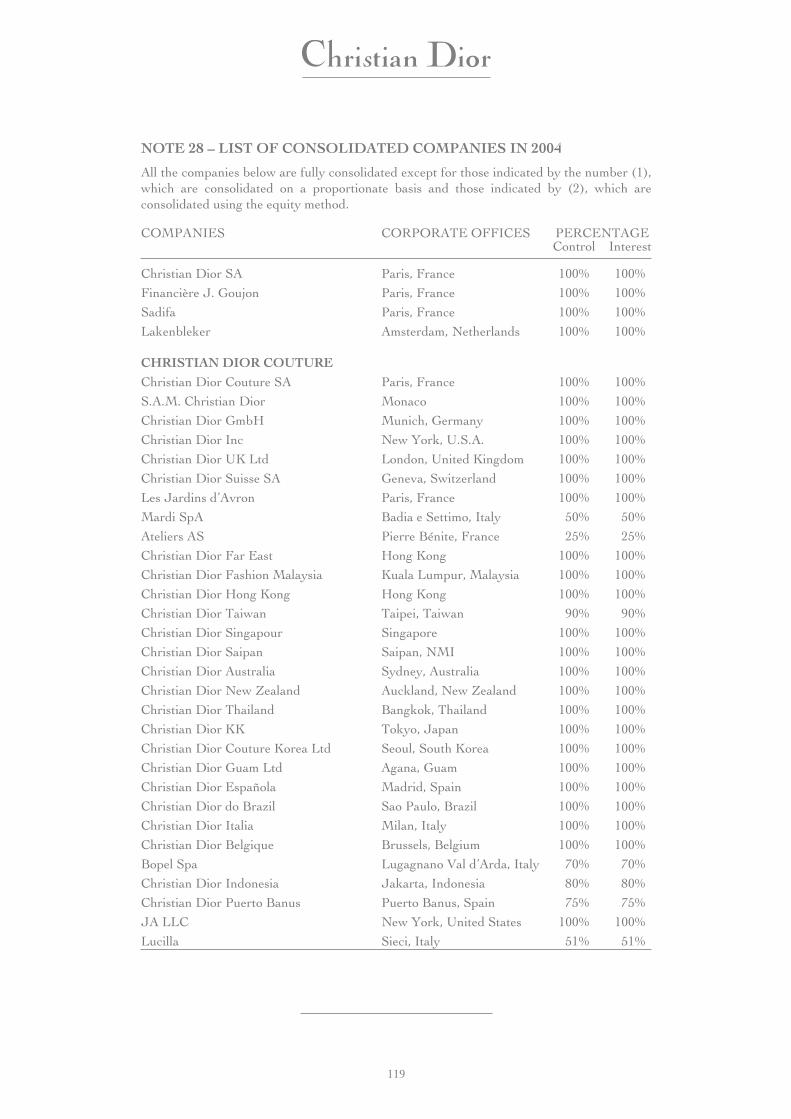
NOTE 28 – LIST OF CONSOLIDATED COMPANIES IN 2004
All the companies below are fully consolidated except for those indicated by the number (1),which are consolidated on a proportionate basis and those indicated by (2), which areconsolidated using the equity method.
COMPANIES CORPORATE OFFICES PERCENTAGEControl Interest
Christian Dior SA Paris, France 100% 100%
Financière J. Goujon Paris, France 100% 100%
Sadifa Paris, France 100% 100%
Lakenbleker Amsterdam, Netherlands 100% 100%
CHRISTIAN DIOR COUTUREChristian Dior Couture SA Paris, France 100% 100%
S.A.M. Christian Dior Monaco 100% 100%
Christian Dior GmbH Munich, Germany 100% 100%
Christian Dior Inc New York, U.S.A. 100% 100%
Christian Dior UK Ltd London, United Kingdom 100% 100%
Christian Dior Suisse SA Geneva, Switzerland 100% 100%
Les Jardins d’Avron Paris, France 100% 100%
Mardi SpA Badia e Settimo, Italy 50% 50%
Ateliers AS Pierre Bénite, France 25% 25%
Christian Dior Far East Hong Kong 100% 100%
Christian Dior Fashion Malaysia Kuala Lumpur, Malaysia 100% 100%
Christian Dior Hong Kong Hong Kong 100% 100%
Christian Dior Taiwan Taipei, Taiwan 90% 90%
Christian Dior Singapour Singapore 100% 100%
Christian Dior Saipan Saipan, NMI 100% 100%
Christian Dior Australia Sydney, Australia 100% 100%
Christian Dior New Zealand Auckland, New Zealand 100% 100%
Christian Dior Thailand Bangkok, Thailand 100% 100%
Christian Dior KK Tokyo, Japan 100% 100%
Christian Dior Couture Korea Ltd Seoul, South Korea 100% 100%
Christian Dior Guam Ltd Agana, Guam 100% 100%
Christian Dior Española Madrid, Spain 100% 100%
Christian Dior do Brazil Sao Paulo, Brazil 100% 100%
Christian Dior Italia Milan, Italy 100% 100%
Christian Dior Belgique Brussels, Belgium 100% 100%
Bopel Spa Lugagnano Val d’Arda, Italy 70% 70%
Christian Dior Indonesia Jakarta, Indonesia 80% 80%
Christian Dior Puerto Banus Puerto Banus, Spain 75% 75%
JA LLC New York, United States 100% 100%
Lucilla Sieci, Italy 51% 51%
119
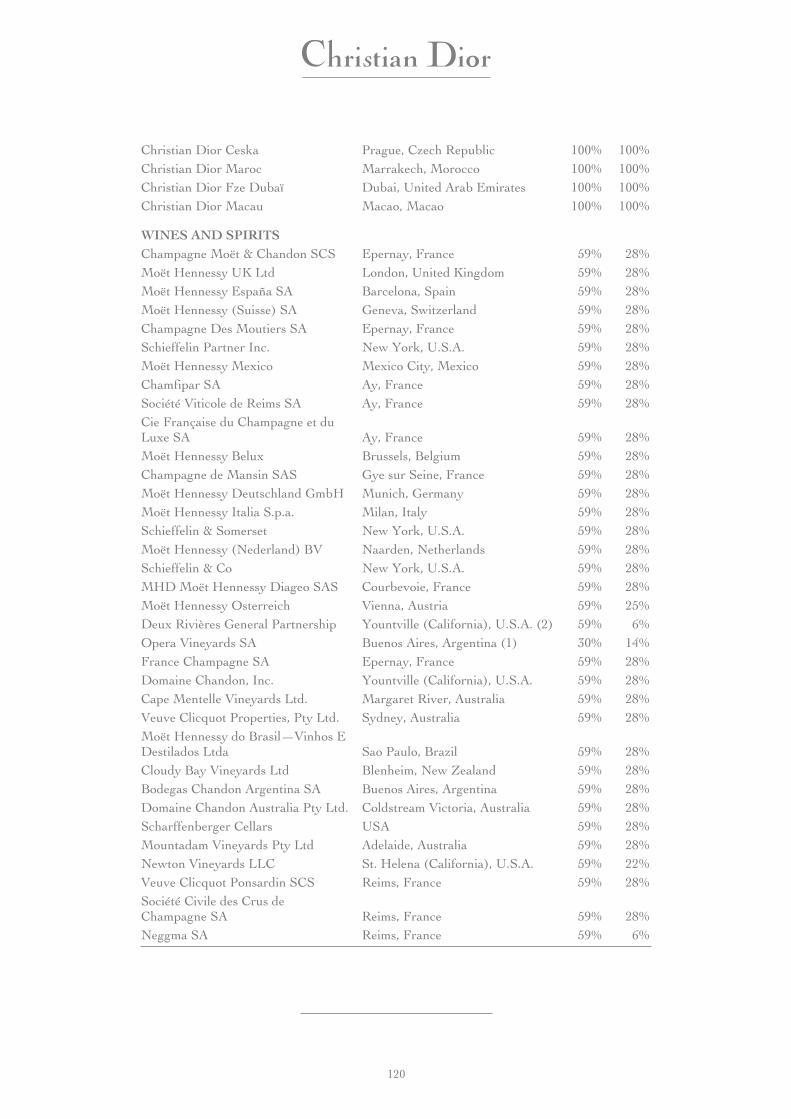
Christian Dior Ceska Prague, Czech Republic 100% 100%Christian Dior Maroc Marrakech, Morocco 100% 100%Christian Dior Fze Dubaï Dubai, United Arab Emirates 100% 100%Christian Dior Macau Macao, Macao 100% 100%
WINES AND SPIRITSChampagne Moët & Chandon SCS Epernay, France 59% 28%Moët Hennessy UK Ltd London, United Kingdom 59% 28%Moët Hennessy España SA Barcelona, Spain 59% 28%Moët Hennessy (Suisse) SA Geneva, Switzerland 59% 28%Champagne Des Moutiers SA Epernay, France 59% 28%Schieffelin Partner Inc. New York, U.S.A. 59% 28%Moët Hennessy Mexico Mexico City, Mexico 59% 28%Chamfipar SA Ay, France 59% 28%Société Viticole de Reims SA Ay, France 59% 28%Cie Française du Champagne et duLuxe SA Ay, France 59% 28%Moët Hennessy Belux Brussels, Belgium 59% 28%Champagne de Mansin SAS Gye sur Seine, France 59% 28%Moët Hennessy Deutschland GmbH Munich, Germany 59% 28%Moët Hennessy Italia S.p.a. Milan, Italy 59% 28%Schieffelin & Somerset New York, U.S.A. 59% 28%Moët Hennessy (Nederland) BV Naarden, Netherlands 59% 28%Schieffelin & Co New York, U.S.A. 59% 28%MHD Moët Hennessy Diageo SAS Courbevoie, France 59% 28%Moët Hennessy Osterreich Vienna, Austria 59% 25%Deux Rivières General Partnership Yountville (California), U.S.A. (2) 59% 6%Opera Vineyards SA Buenos Aires, Argentina (1) 30% 14%France Champagne SA Epernay, France 59% 28%Domaine Chandon, Inc. Yountville (California), U.S.A. 59% 28%Cape Mentelle Vineyards Ltd. Margaret River, Australia 59% 28%Veuve Clicquot Properties, Pty Ltd. Sydney, Australia 59% 28%Moët Hennessy do Brasil—Vinhos EDestilados Ltda Sao Paulo, Brazil 59% 28%Cloudy Bay Vineyards Ltd Blenheim, New Zealand 59% 28%Bodegas Chandon Argentina SA Buenos Aires, Argentina 59% 28%Domaine Chandon Australia Pty Ltd. Coldstream Victoria, Australia 59% 28%Scharffenberger Cellars USA 59% 28%Mountadam Vineyards Pty Ltd Adelaide, Australia 59% 28%Newton Vineyards LLC St. Helena (California), U.S.A. 59% 22%Veuve Clicquot Ponsardin SCS Reims, France 59% 28%Société Civile des Crus deChampagne SA Reims, France 59% 28%Neggma SA Reims, France 59% 6%
120
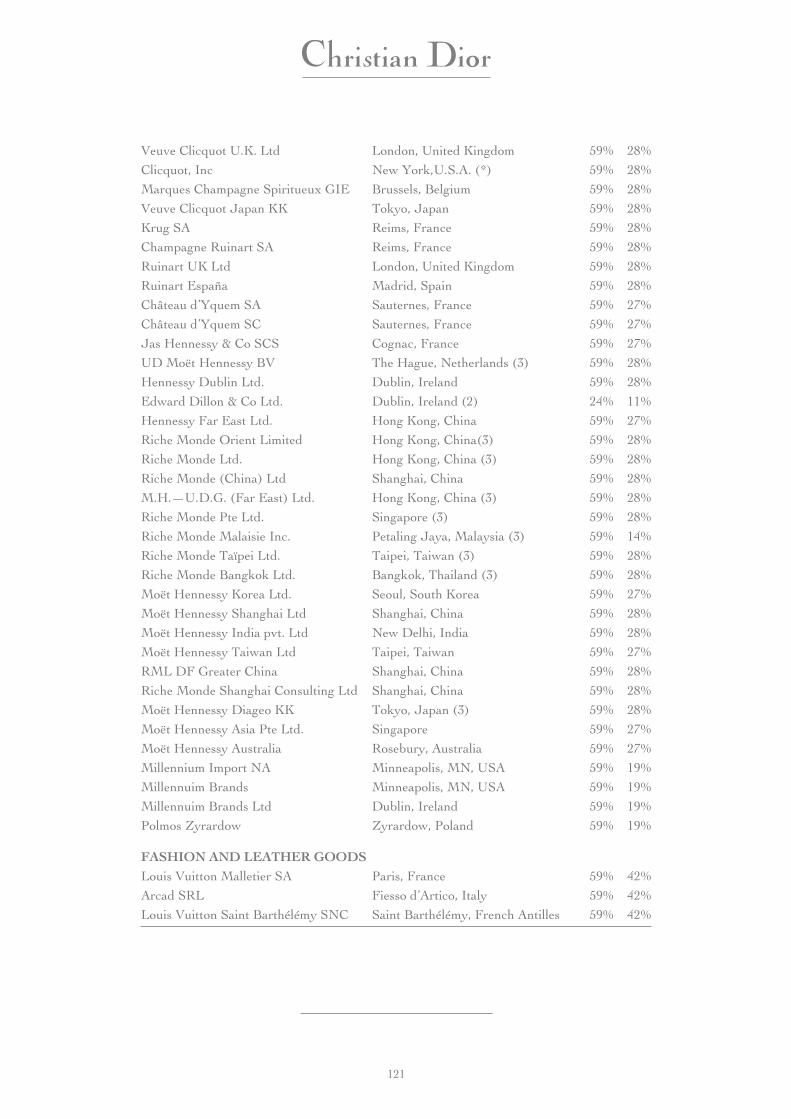
Veuve Clicquot U.K. Ltd London, United Kingdom 59% 28%
Clicquot, Inc New York,U.S.A. (*) 59% 28%
Marques Champagne Spiritueux GIE Brussels, Belgium 59% 28%
Veuve Clicquot Japan KK Tokyo, Japan 59% 28%
Krug SA Reims, France 59% 28%
Champagne Ruinart SA Reims, France 59% 28%
Ruinart UK Ltd London, United Kingdom 59% 28%
Ruinart España Madrid, Spain 59% 28%
Château d’Yquem SA Sauternes, France 59% 27%
Château d’Yquem SC Sauternes, France 59% 27%
Jas Hennessy & Co SCS Cognac, France 59% 27%
UD Moët Hennessy BV The Hague, Netherlands (3) 59% 28%
Hennessy Dublin Ltd. Dublin, Ireland 59% 28%
Edward Dillon & Co Ltd. Dublin, Ireland (2) 24% 11%
Hennessy Far East Ltd. Hong Kong, China 59% 27%
Riche Monde Orient Limited Hong Kong, China(3) 59% 28%
Riche Monde Ltd. Hong Kong, China (3) 59% 28%
Riche Monde (China) Ltd Shanghai, China 59% 28%
M.H.—U.D.G. (Far East) Ltd. Hong Kong, China (3) 59% 28%
Riche Monde Pte Ltd. Singapore (3) 59% 28%
Riche Monde Malaisie Inc. Petaling Jaya, Malaysia (3) 59% 14%
Riche Monde Taïpei Ltd. Taipei, Taiwan (3) 59% 28%
Riche Monde Bangkok Ltd. Bangkok, Thailand (3) 59% 28%
Moët Hennessy Korea Ltd. Seoul, South Korea 59% 27%
Moët Hennessy Shanghai Ltd Shanghai, China 59% 28%
Moët Hennessy India pvt. Ltd New Delhi, India 59% 28%
Moët Hennessy Taiwan Ltd Taipei, Taiwan 59% 27%
RML DF Greater China Shanghai, China 59% 28%
Riche Monde Shanghai Consulting Ltd Shanghai, China 59% 28%
Moët Hennessy Diageo KK Tokyo, Japan (3) 59% 28%
Moët Hennessy Asia Pte Ltd. Singapore 59% 27%
Moët Hennessy Australia Rosebury, Australia 59% 27%
Millennium Import NA Minneapolis, MN, USA 59% 19%
Millennuim Brands Minneapolis, MN, USA 59% 19%
Millennuim Brands Ltd Dublin, Ireland 59% 19%
Polmos Zyrardow Zyrardow, Poland 59% 19%
FASHION AND LEATHER GOODSLouis Vuitton Malletier SA Paris, France 59% 42%
Arcad SRL Fiesso d’Artico, Italy 59% 42%
Louis Vuitton Saint Barthélémy SNC Saint Barthélémy, French Antilles 59% 42%
121
Société des Ateliers Louis VuittonSNC Paris, France 59% 42%Société Louis Vuitton Services SNC Paris, France 59% 42%Sté des Magasins Louis VuittonFrance SNC Paris, France 59% 42%Belle Jardinière SA Paris, France 59% 42%Belle Jardinière Immo SAS Paris, France 59% 42%Sedivem SNC Paris, France 59% 42%SCI Paris, France 59% 42%Les Ateliers Horlogers Louis VuittonSA La Chaux-de-Fonds, Switzerland 59% 42%Louis Vuitton Monaco SA Monte Carlo, Monaco 59% 42%LVMH Fashion Group UK Ltd. London, United Kingdom 59% 42%Louis Vuitton Deutschland GmbH Düsseldorf, Germany 59% 42%Louis Vuitton España SA Madrid, Spain 59% 42%Catalana Talleres Artesanos LouisVuitton SA Barbera del Valles, Spain 59% 42%Louis Vuitton BV Amsterdam, Netherlands 59% 42%LVMH Fashion Group Belgium SA Brussels, Belgium 59% 42%LVMH Fashion Group Italia.SPA Milan, Italy 59% 42%Louis Vuitton Hellas SA Athens, Greece 59% 42%Louis Vuitton Portugal Maleiro, Lda. Lisbon, Portugal 59% 42%Louis Vuitton Ltd Tel Aviv, Israel 59% 42%Louis Vuitton Danmark A/S Copenhagen, Denmark 59% 42%Louis Vuitton Aktiebolag (Suède) SA Stockholm, Sweden 59% 42%LVMH FG Switzerland SA Geneva, Switzerland 59% 42%Louis Vuitton Ceska s.r.o. Prague, Czech Republic 59% 42%Louis Vuitton Osterreich GmbH Vienna, Austria 59% 42%Louis Vuitton Cantacilik Ticaret AS Istanbul, Turkey 59% 42%LV US Manufacturing, Inc. New York, U.S.A. 59% 42%LVMH Fashion Group Hawaii Inc. Honolulu, Hawaii 59% 42%LVNA Finances Corp New York, U.S.A. 59% 42%Atlantic Luggage Company Ltd Hamilton, Bermuda 59% 17%Louis Vuitton Guam, Inc. Guam 59% 42%Louis Vuitton Saipan, Inc. Saipan 59% 42%San Dimas Luggage Company New York, U.S.A. 59% 42%LVMH FG Brasil Ltda Sao Paulo, Brazil 59% 42%Louis Vuitton Mexico S de RL de CV Mexico City, Mexico 59% 42%Blinfar SA Montevideo, Uruguay 59% 42%LV Chile Ltda. Santiago del Chile, Chile 59% 42%LVMH Fashion Group Pacific Ltd. Hong Kong, China 59% 42%Louis Vuitton Hong Kong Ltd. Hong Kong, China 59% 42%Louis Vuitton (Philippines) Co, Inc Makati, Hong Kong, China 59% 42%LVMH Fashion (Singapore) Pte Ltd. Singapore 59% 42%
122
PT Louis Vuitton Indonesia Jakarta, Indonesia 59% 42%Louis Vuitton (Malaysia) SDN Bhd . Kuala Lumpur, Malaysia 59% 42%Louis Vuitton Taïwan Ltd. Taipei, Taiwan 59% 39%Louis Vuitton Australia, PTY Limited. Sydney, Australia 59% 42%LV New Zealand Ltd. Auckland, New Zealand 59% 42%LV Cup New Zealand Ltd Auckland, New Zealand 59% 42%Louis Vuitton Kuweit CSP Safat, Kuwait 59% 25%Louis Vuitton EAU LLC Dubai, United Arab Emirates 59% 27%LV Arabie Saoudite LLC Jeddah, Saudi Arabia 59% 27%Louis Vuitton Korea Ltd. Seoul, South Korea 59% 42%LVMH Fashion Group Trading KoreaLtd Seoul, South Korea 59% 42%LV Argentina SA Buenos Aires, Argentina 59% 42%Louis Vuitton Vostock LLC Moscow, Russia 59% 42%LV Colombia Corp. Santafe de Bogota, Colombia 59% 42%Louis Vuitton Maroc Sarl Casablanca, Morocco 59% 42%LV Venezuela SA Caracas, Venezuela 59% 42%Louis Vuitton South Africa (Pty)Limited Johannesburg, South Africa 59% 42%Louis Vuitton Macau Company Ltd Macao, Macao 59% 42%LVMH Fashion Group (Shanghai)Trading Co Ltd Shanghai, China 59% 42%LVJ Group KK Tokyo, Japan 59% 42%LVMH Fashion Group Americas Inc. New York, U.S.A. (*) 59% 42%LV Canada Inc. Toronto, Canada 59% 42%LVMH Fashion Group Services SAS Paris, France 59% 42%Marc Jacobs International LLC Wilmington (Delaware), U.S.A. 59% 40%Marc Jacobs Trademark LLC Wilmington (Delaware), U.S.A. 59% 14%Loewe SA Madrid, Spain 59% 42%Loewe Hermanos SA Madrid, Spain 59% 42%Loewe Textil SA Madrid, Spain 59% 42%Manufacturas Loewe SL Madrid, Spain 59% 42%LVMH Fashion Group France SNC Paris, France 59% 42%Loewe Hermanos UK Ltd. London, United Kingdom 59% 42%Loewe Saïpan Inc. Saipan, Marianna Islands 59% 42%Loewe Guam Inc Guam, Guam 59% 42%Loewe Hong Kong Ltd. Quarry Bay, Hong Kong 59% 42%Loewe Fashion Pte Ltd. Singapore 59% 42%Loewe Fashion (m) Sdn Bhd Kuala Lumpur, Malaysia 59% 42%Loewe Taïwan Ltd. Taipei, Taiwan 59% 39%Loewe Australia Pty Ltd. Sydney, Australia 59% 42%Berluti SA Paris, France 59% 42%Société Distribution Robert EstienneSNC Paris, France 59% 42%
123

Manifattura Ferrarese SRL Milan, Italy 59% 42%LVMH FG Industria Srl Milan, Italy 59% 42%Caltunificio Rossimoda SPA Vigonza, Italy 59% 41%Rossi Moda Inc New York, U.S.A. 59% 41%Rossi Moda France Paris, France 59% 41%Brenta Suole Vigonza, Italy 59% 41%Somarest SARL Sibiu, Romania 59% 42%Montaigne KK Tokyo, Japan 59% 42%Modulo Italia SRL Milan, Italy 59% 42%Céline SA Paris, France 59% 42%Avenue M International SCA Paris, France 59% 42%Enilec Gestion SARL Paris, France 59% 42%Céline Montaigne SA Paris, France 59% 42%Céline Monte-Carlo SA Monte Carlo, Monaco 59% 42%Céline Production Srl Florence, Greve in Chianti, Italy 59% 42%Céline Suisse SA Geneva, Switzerland 59% 42%Céline UK Ltd. London, United Kingdom 59% 42%Céline Inc. New York, U.S.A. (*) 59% 42%Céline Hong Kong Ltd Hong Kong, China 59% 42%Céline (Singapour) Pte Ltd. Singapore 59% 42%Céline Guam Inc. Tamning, Guam 59% 42%Céline Hawaï Inc Hawaii, U.S.A. 59% 42%Céline Korea Ltd Seoul, South Korea 59% 42%Céline Taïwan Ltd Taipei, Taiwan 59% 41%CPC International Ltd Hong Kong, China 59% 42%Kami SA Montbazon, France 59% 42%Kenzo SA Paris, France 59% 42%Kenzo Homme SA Paris, France 59% 25%Modulo SA Paris, France 59% 42%Kenzo Deutschland GmbH Düsseldorf, Germany 59% 42%Kenzo Belgique SA Brussels, Belgium 59% 42%Kenzo UK Ltd London, United Kingdom 59% 42%Kenzo NA Inc., Corp. New York, U.S.A. (*) 59% 42%Kenzo Fashion Iberica SA Madrid, Spain 59% 42%Kenzo Homme UK Ltd London, United Kingdom 59% 25%Kenzo Japan KK Tokyo, Japan 59% 42%Modulo BV Amstelveen, Netherlands 59% 42%Givenchy SA Paris, France 59% 42%Givenchy Corporation New York, U.S.A. 59% 42%Givenchy Co Ltd Tokyo, Japan 59% 42%Gentleman Givenchy Far East Ltd. Hong Kong, China 59% 42%Givenchy China Co Ltd Hong Kong, China 59% 42%Christian Lacroix SNC Paris, France 59% 42%
124
Gabrielle Studio, Inc. New York, U.S.A. 59% 42%Donna Karan International Inc. New York, U.S.A.(*) 59% 42%The Donna Karan Company LLC New York, U.S.A. 59% 42%Donna Karan Service Company BV Oldenzaal, Netherlands 59% 42%Donna Karan Studio LLC New York, U.S.A. 59% 42%The Donna Karan Company StoreLLC New York, U.S.A. 59% 42%Donna Karan Company Store UKHoldings Ltd London, United Kingdom 59% 42%Donna Karan Management CompanyUK Ltd London, United Kingdom 59% 42%Donna Karan Company Stores UKRetail Ltd London, United Kingdom 59% 42%Donna Karan Company Store (UK)Ltd London, United Kingdom 59% 42%Donna Karan H. K. Ltd Hong Kong, China 59% 42%Donna Karan (Italy) Srl Milan, Italy 59% 42%Donna Karan (Italy) ProductionServices Srl. Milan, Italy 59% 42%Fendi International BV Amsterdam, Netherlands 59% 39%Fendi International SA Paris, France 59% 42%Fendi SA Luxembourg Luxembourg, Luxembourg 59% 39%Fendi Srl Rome, Italy 59% 39%Fendi Adele S.r.l. Rome, Italy 59% 39%Fendi Immobili Industriali Srl Florence, Italy 59% 39%Fendi Italia Srl Rome, Italy 59% 42%Fendi UK Limited London, United Kingdom 59% 42%Fendi France SA Paris, France 59% 42%Fendi Japan KK Inc Tokyo, Japan 59% 42%Fendi Hawaii Inc Wilmington (Delaware), U.S.A. 59% 42%Fendi North America, Inc New York, U.S.A. (*) 59% 39%Fendi Australia Pty Ltd Sydney, Australia 59% 42%Fendi Guam Inc Tumon, Guam 59% 42%Fendi Asia Pacific Ltd Hong Kong, China 59% 42%Fendi Korea Ltd Seoul, South Korea 59% 42%Fendi Taiwan Ltd Taipei, Taiwan 59% 32%Fendi Hong Kong Limited Hong Kong, China 59% 29%Fendi China Boutiques Limited Hong Kong, China 59% 29%Fendi (Singapore) Pte Ltd Singapore 59% 42%Fendi Fashion Malaysia Snd. Bhd. Kuala Lumpur, Malaysia 59% 42%Emilio Pucci Srl Florence, Italy 59% 41%Emilio Pucci International BV Naarden, Netherlands 59% 28%Emilio Pucci, Ltd New York, U.S.A. 59% 41%Thomas Pink Holdings Ltd London, United Kingdom 59% 42%
125
Thomas Pink Ltd London, United Kingdom 59% 42%
Thomas Pink BV Rotterdam, Netherlands 59% 42%
Thomas Pink Inc New York, U.S.A. (*) 59% 42%
Thomas Pink Ireland Ltd Dublin, Ireland 59% 42%
Thomas Pink Belgium SA Brussels, Belgium 59% 42%
Thomas Pink France SAS Paris, France 59% 42%
e-Luxury.com Inc San Francisco (California), U.S.A. 59% 42%
PERFUMES AND COSMETICSParfums Christian Dior SA Paris, France 59% 42%
LVMH P&C Thailand Co Ltd Bangkok, Thailand 59% 21%
LVMH P&C do Brasil Ltda Sao Paulo, Brazil 59% 42%
France Argentine Cosmetics SA Buenos Aires, Argentina 59% 42%
LVMH P&C Shanghai Co Ltd Shanghai, China 59% 42%
Parfums Christian Dior Finland Oy Helsinki, Finland 59% 42%
LVMH P&C Inc. New York, U.S.A. 59% 42%
Seldico Fribourg, Switzerland 59% 42%
Seldico Kiev, Ukraine 59% 42%
Seldico Moscow, Russia 59% 42%
SNC du 33 avenue Hoche Paris, France 59% 42%
Beauté SA Athens, Greece 59% 42%
LVMH Fragrances & Cosmetics(Sinpagore) Pte Ltd Singapore 59% 42%
Parfums Christian Dior (UK) Ltd. London, United Kingdom 59% 42%
Parfums Christian Dior BVNetherlands Rotterdam, Netherlands 59% 42%
Iparkos BV Rotterdam, Netherlands 59% 42%
LVMH Perfumes y CosmeticosIberica SA Madrid, Spain 59% 42%
Parfums Christian Dior S.A.B. Brussels, Belgium 59% 42%
LVMH P&C Holding SPA Pisa, Italy 59% 42%
Parfums Christian Dior Ireland Ltd. Dublin, Ireland 59% 42%
Parfums Christian Dior Hellas S.A. Athens, Greece 59% 42%
Parfums Christian Dior A.G. Zurich, Switzerland 59% 42%
Christian Dior Perfumes LLC New York, U.S.A. 59% 42%
Parfums Christian Dior Canada Inc. Montréal, Canada 59% 42%
LVMH P&C de Mexico SA de CV Mexico City, Mexico 59% 42%
Parfums Christian Dior Japon K.K. Tokyo, Japan 59% 42%
Parfums Christian Dior (Singapour)Pte Ltd. Singapore 59% 42%
Inalux SA Luxembourg 59% 42%
LVMH P&C Asia Pacific Ltd Hong Kong, China 59% 42%
Fa Hua Fragrance & Cosmetic Co Ltd. Kowloon, Hong Kong, China 59% 42%
126
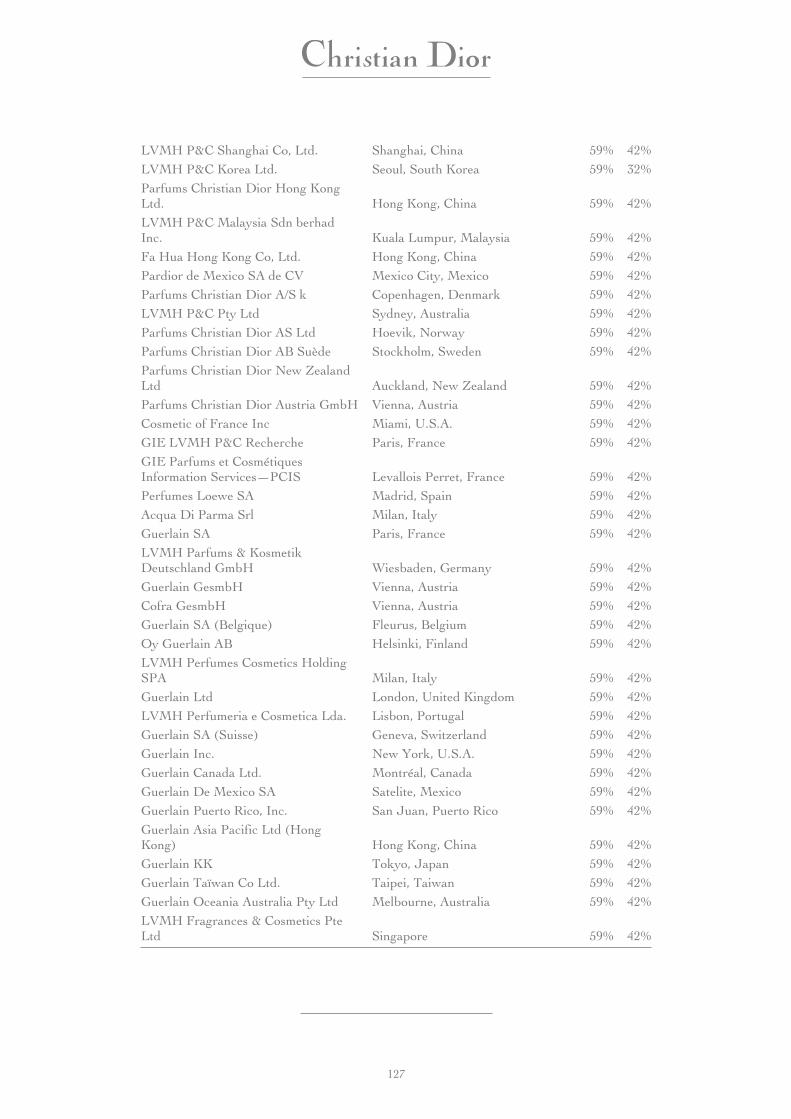
LVMH P&C Shanghai Co, Ltd. Shanghai, China 59% 42%LVMH P&C Korea Ltd. Seoul, South Korea 59% 32%Parfums Christian Dior Hong KongLtd. Hong Kong, China 59% 42%LVMH P&C Malaysia Sdn berhadInc. Kuala Lumpur, Malaysia 59% 42%Fa Hua Hong Kong Co, Ltd. Hong Kong, China 59% 42%Pardior de Mexico SA de CV Mexico City, Mexico 59% 42%Parfums Christian Dior A/S k Copenhagen, Denmark 59% 42%LVMH P&C Pty Ltd Sydney, Australia 59% 42%Parfums Christian Dior AS Ltd Hoevik, Norway 59% 42%Parfums Christian Dior AB Suède Stockholm, Sweden 59% 42%Parfums Christian Dior New ZealandLtd Auckland, New Zealand 59% 42%Parfums Christian Dior Austria GmbH Vienna, Austria 59% 42%Cosmetic of France Inc Miami, U.S.A. 59% 42%GIE LVMH P&C Recherche Paris, France 59% 42%GIE Parfums et CosmétiquesInformation Services—PCIS Levallois Perret, France 59% 42%Perfumes Loewe SA Madrid, Spain 59% 42%Acqua Di Parma Srl Milan, Italy 59% 42%Guerlain SA Paris, France 59% 42%LVMH Parfums & KosmetikDeutschland GmbH Wiesbaden, Germany 59% 42%Guerlain GesmbH Vienna, Austria 59% 42%Cofra GesmbH Vienna, Austria 59% 42%Guerlain SA (Belgique) Fleurus, Belgium 59% 42%Oy Guerlain AB Helsinki, Finland 59% 42%LVMH Perfumes Cosmetics HoldingSPA Milan, Italy 59% 42%Guerlain Ltd London, United Kingdom 59% 42%LVMH Perfumeria e Cosmetica Lda. Lisbon, Portugal 59% 42%Guerlain SA (Suisse) Geneva, Switzerland 59% 42%Guerlain Inc. New York, U.S.A. 59% 42%Guerlain Canada Ltd. Montréal, Canada 59% 42%Guerlain De Mexico SA Satelite, Mexico 59% 42%Guerlain Puerto Rico, Inc. San Juan, Puerto Rico 59% 42%Guerlain Asia Pacific Ltd (HongKong) Hong Kong, China 59% 42%Guerlain KK Tokyo, Japan 59% 42%Guerlain Taïwan Co Ltd. Taipei, Taiwan 59% 42%Guerlain Oceania Australia Pty Ltd Melbourne, Australia 59% 42%LVMH Fragrances & Cosmetics PteLtd Singapore 59% 42%
127
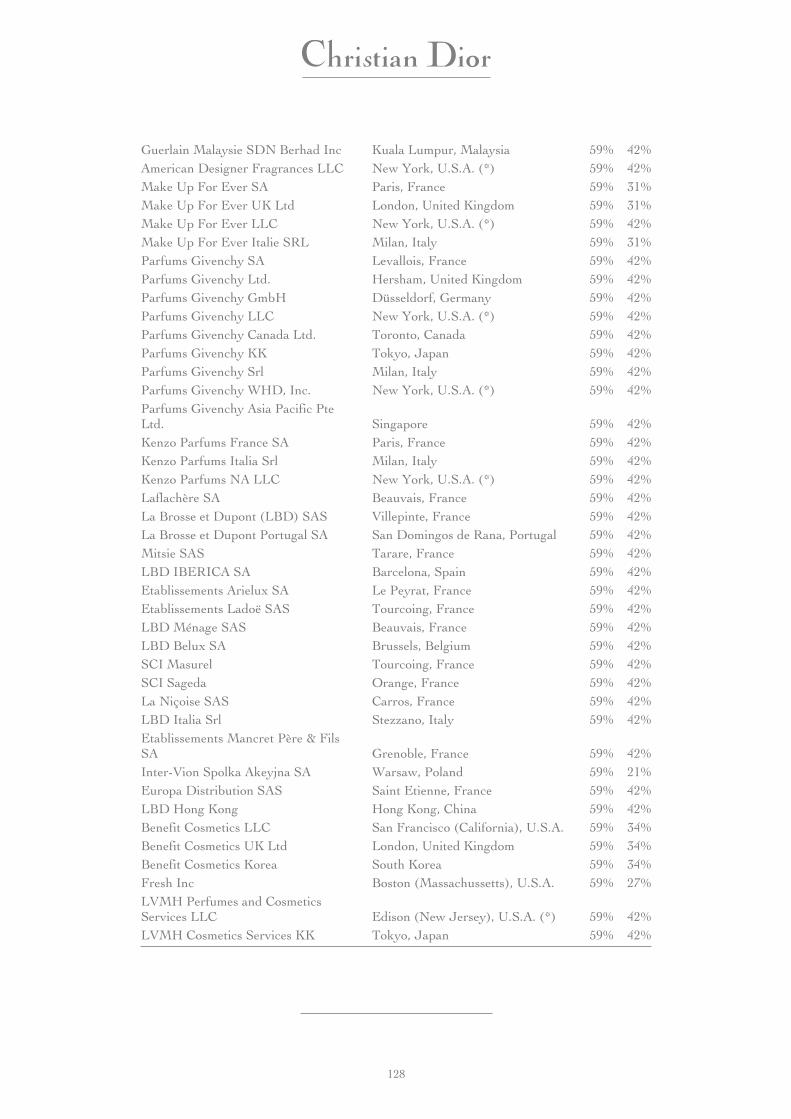
Guerlain Malaysie SDN Berhad Inc Kuala Lumpur, Malaysia 59% 42%American Designer Fragrances LLC New York, U.S.A. (*) 59% 42%Make Up For Ever SA Paris, France 59% 31%Make Up For Ever UK Ltd London, United Kingdom 59% 31%Make Up For Ever LLC New York, U.S.A. (*) 59% 42%Make Up For Ever Italie SRL Milan, Italy 59% 31%Parfums Givenchy SA Levallois, France 59% 42%Parfums Givenchy Ltd. Hersham, United Kingdom 59% 42%Parfums Givenchy GmbH Düsseldorf, Germany 59% 42%Parfums Givenchy LLC New York, U.S.A. (*) 59% 42%Parfums Givenchy Canada Ltd. Toronto, Canada 59% 42%Parfums Givenchy KK Tokyo, Japan 59% 42%Parfums Givenchy Srl Milan, Italy 59% 42%Parfums Givenchy WHD, Inc. New York, U.S.A. (*) 59% 42%Parfums Givenchy Asia Pacific PteLtd. Singapore 59% 42%Kenzo Parfums France SA Paris, France 59% 42%Kenzo Parfums Italia Srl Milan, Italy 59% 42%Kenzo Parfums NA LLC New York, U.S.A. (*) 59% 42%Laflachère SA Beauvais, France 59% 42%La Brosse et Dupont (LBD) SAS Villepinte, France 59% 42%La Brosse et Dupont Portugal SA San Domingos de Rana, Portugal 59% 42%Mitsie SAS Tarare, France 59% 42%LBD IBERICA SA Barcelona, Spain 59% 42%Etablissements Arielux SA Le Peyrat, France 59% 42%Etablissements Ladoë SAS Tourcoing, France 59% 42%LBD Ménage SAS Beauvais, France 59% 42%LBD Belux SA Brussels, Belgium 59% 42%SCI Masurel Tourcoing, France 59% 42%SCI Sageda Orange, France 59% 42%La Niçoise SAS Carros, France 59% 42%LBD Italia Srl Stezzano, Italy 59% 42%Etablissements Mancret Père & FilsSA Grenoble, France 59% 42%Inter-Vion Spolka Akeyjna SA Warsaw, Poland 59% 21%Europa Distribution SAS Saint Etienne, France 59% 42%LBD Hong Kong Hong Kong, China 59% 42%Benefit Cosmetics LLC San Francisco (California), U.S.A. 59% 34%Benefit Cosmetics UK Ltd London, United Kingdom 59% 34%Benefit Cosmetics Korea South Korea 59% 34%Fresh Inc Boston (Massachussetts), U.S.A. 59% 27%LVMH Perfumes and CosmeticsServices LLC Edison (New Jersey), U.S.A. (*) 59% 42%LVMH Cosmetics Services KK Tokyo, Japan 59% 42%
128
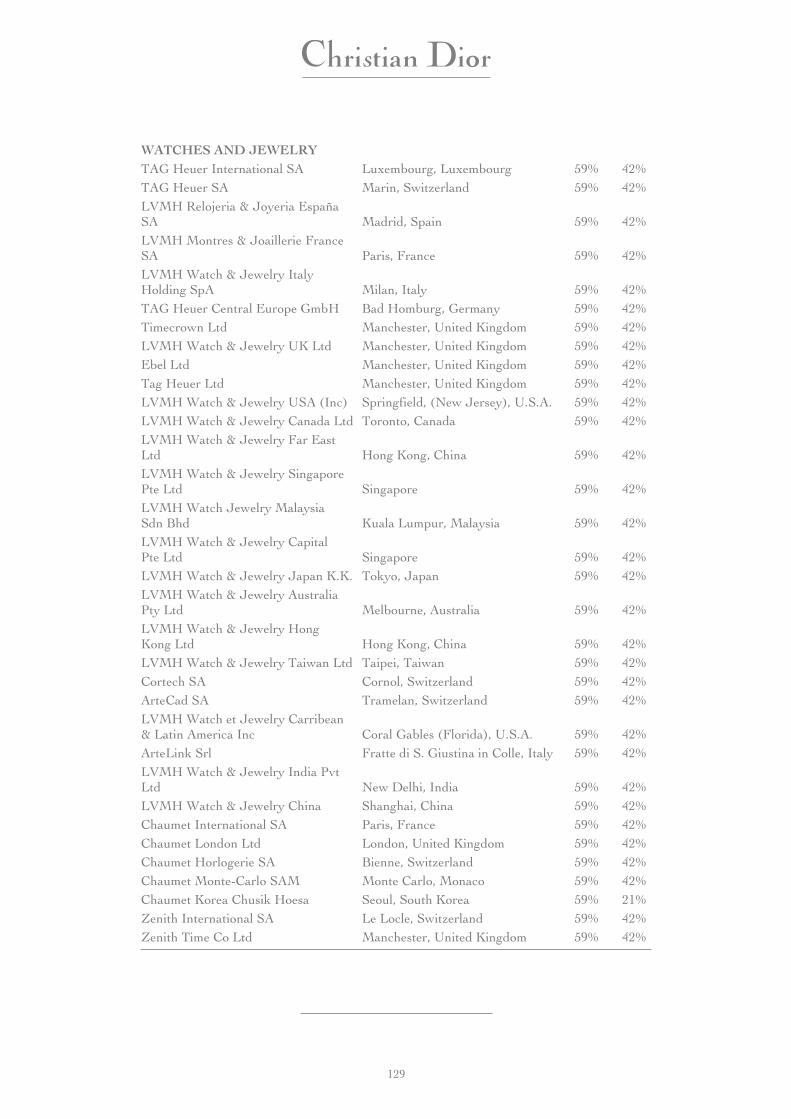
WATCHES AND JEWELRYTAG Heuer International SA Luxembourg, Luxembourg 59% 42%TAG Heuer SA Marin, Switzerland 59% 42%LVMH Relojeria & Joyeria EspañaSA Madrid, Spain 59% 42%LVMH Montres & Joaillerie FranceSA Paris, France 59% 42%LVMH Watch & Jewelry ItalyHolding SpA Milan, Italy 59% 42%TAG Heuer Central Europe GmbH Bad Homburg, Germany 59% 42%Timecrown Ltd Manchester, United Kingdom 59% 42%LVMH Watch & Jewelry UK Ltd Manchester, United Kingdom 59% 42%Ebel Ltd Manchester, United Kingdom 59% 42%Tag Heuer Ltd Manchester, United Kingdom 59% 42%LVMH Watch & Jewelry USA (Inc) Springfield, (New Jersey), U.S.A. 59% 42%LVMH Watch & Jewelry Canada Ltd Toronto, Canada 59% 42%LVMH Watch & Jewelry Far EastLtd Hong Kong, China 59% 42%LVMH Watch & Jewelry SingaporePte Ltd Singapore 59% 42%LVMH Watch Jewelry MalaysiaSdn Bhd Kuala Lumpur, Malaysia 59% 42%LVMH Watch & Jewelry CapitalPte Ltd Singapore 59% 42%LVMH Watch & Jewelry Japan K.K. Tokyo, Japan 59% 42%LVMH Watch & Jewelry AustraliaPty Ltd Melbourne, Australia 59% 42%LVMH Watch & Jewelry HongKong Ltd Hong Kong, China 59% 42%LVMH Watch & Jewelry Taiwan Ltd Taipei, Taiwan 59% 42%Cortech SA Cornol, Switzerland 59% 42%ArteCad SA Tramelan, Switzerland 59% 42%LVMH Watch et Jewelry Carribean& Latin America Inc Coral Gables (Florida), U.S.A. 59% 42%ArteLink Srl Fratte di S. Giustina in Colle, Italy 59% 42%LVMH Watch & Jewelry India PvtLtd New Delhi, India 59% 42%LVMH Watch & Jewelry China Shanghai, China 59% 42%Chaumet International SA Paris, France 59% 42%Chaumet London Ltd London, United Kingdom 59% 42%Chaumet Horlogerie SA Bienne, Switzerland 59% 42%Chaumet Monte-Carlo SAM Monte Carlo, Monaco 59% 42%Chaumet Korea Chusik Hoesa Seoul, South Korea 59% 21%Zenith International SA Le Locle, Switzerland 59% 42%Zenith Time Co Ltd Manchester, United Kingdom 59% 42%
129
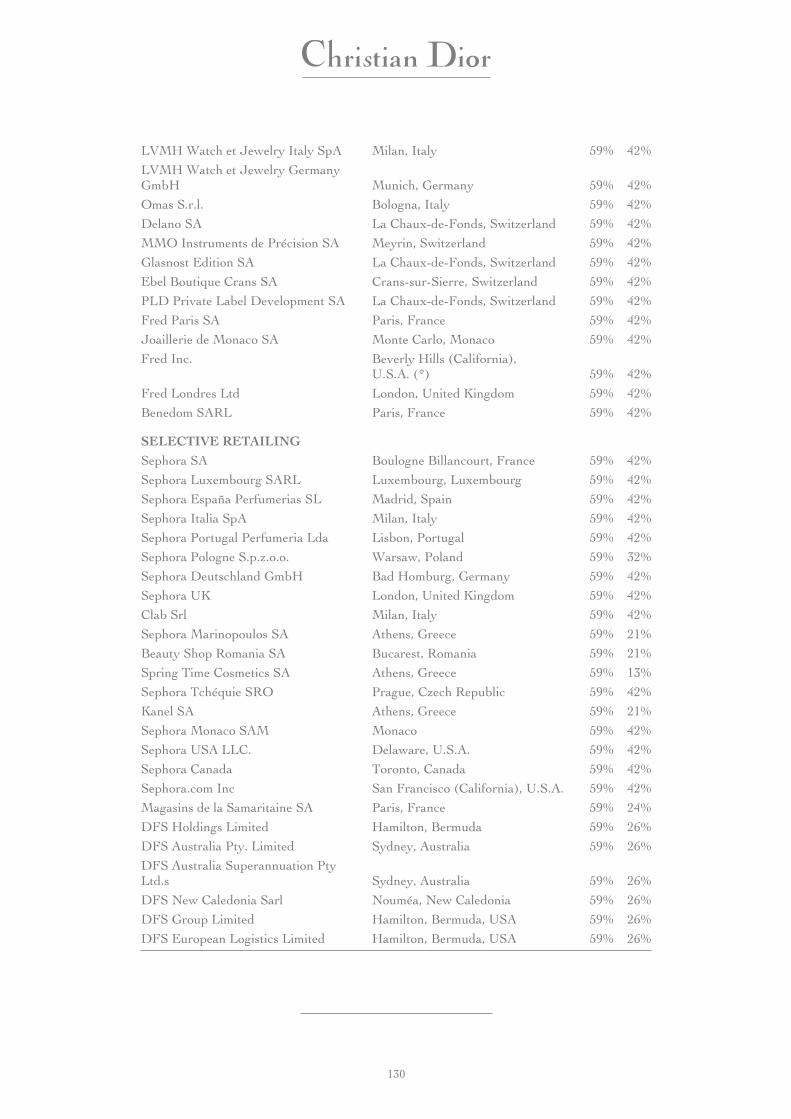
LVMH Watch et Jewelry Italy SpA Milan, Italy 59% 42%
LVMH Watch et Jewelry GermanyGmbH Munich, Germany 59% 42%
Omas S.r.l. Bologna, Italy 59% 42%
Delano SA La Chaux-de-Fonds, Switzerland 59% 42%
MMO Instruments de Précision SA Meyrin, Switzerland 59% 42%
Glasnost Edition SA La Chaux-de-Fonds, Switzerland 59% 42%
Ebel Boutique Crans SA Crans-sur-Sierre, Switzerland 59% 42%
PLD Private Label Development SA La Chaux-de-Fonds, Switzerland 59% 42%
Fred Paris SA Paris, France 59% 42%
Joaillerie de Monaco SA Monte Carlo, Monaco 59% 42%
Fred Inc. Beverly Hills (California),U.S.A. (*) 59% 42%
Fred Londres Ltd London, United Kingdom 59% 42%
Benedom SARL Paris, France 59% 42%
SELECTIVE RETAILINGSephora SA Boulogne Billancourt, France 59% 42%
Sephora Luxembourg SARL Luxembourg, Luxembourg 59% 42%
Sephora España Perfumerias SL Madrid, Spain 59% 42%
Sephora Italia SpA Milan, Italy 59% 42%
Sephora Portugal Perfumeria Lda Lisbon, Portugal 59% 42%
Sephora Pologne S.p.z.o.o. Warsaw, Poland 59% 32%
Sephora Deutschland GmbH Bad Homburg, Germany 59% 42%
Sephora UK London, United Kingdom 59% 42%
Clab Srl Milan, Italy 59% 42%
Sephora Marinopoulos SA Athens, Greece 59% 21%
Beauty Shop Romania SA Bucarest, Romania 59% 21%
Spring Time Cosmetics SA Athens, Greece 59% 13%
Sephora Tchéquie SRO Prague, Czech Republic 59% 42%
Kanel SA Athens, Greece 59% 21%
Sephora Monaco SAM Monaco 59% 42%
Sephora USA LLC. Delaware, U.S.A. 59% 42%
Sephora Canada Toronto, Canada 59% 42%
Sephora.com Inc San Francisco (California), U.S.A. 59% 42%
Magasins de la Samaritaine SA Paris, France 59% 24%
DFS Holdings Limited Hamilton, Bermuda 59% 26%
DFS Australia Pty. Limited Sydney, Australia 59% 26%
DFS Australia Superannuation PtyLtd.s Sydney, Australia 59% 26%
DFS New Caledonia Sarl Nouméa, New Caledonia 59% 26%
DFS Group Limited Hamilton, Bermuda, USA 59% 26%
DFS European Logistics Limited Hamilton, Bermuda, USA 59% 26%
130
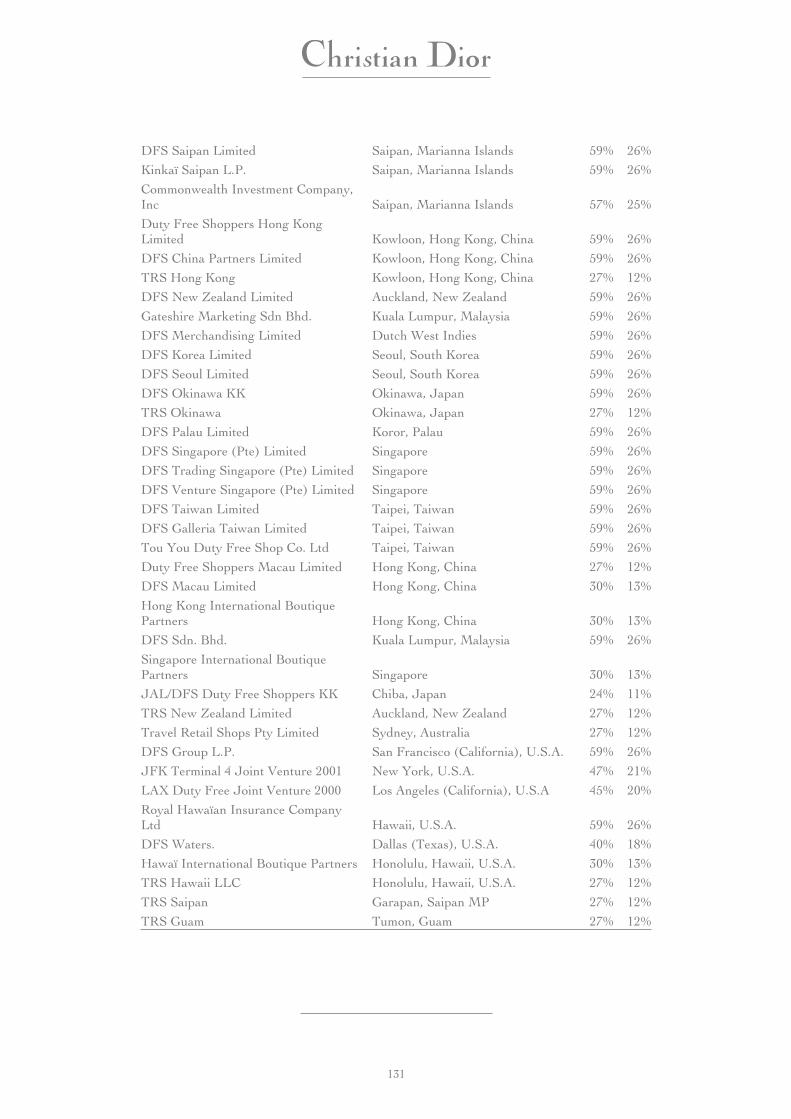
DFS Saipan Limited Saipan, Marianna Islands 59% 26%
Kinkaï Saipan L.P. Saipan, Marianna Islands 59% 26%
Commonwealth Investment Company,Inc Saipan, Marianna Islands 57% 25%
Duty Free Shoppers Hong KongLimited Kowloon, Hong Kong, China 59% 26%
DFS China Partners Limited Kowloon, Hong Kong, China 59% 26%
TRS Hong Kong Kowloon, Hong Kong, China 27% 12%
DFS New Zealand Limited Auckland, New Zealand 59% 26%
Gateshire Marketing Sdn Bhd. Kuala Lumpur, Malaysia 59% 26%
DFS Merchandising Limited Dutch West Indies 59% 26%
DFS Korea Limited Seoul, South Korea 59% 26%
DFS Seoul Limited Seoul, South Korea 59% 26%
DFS Okinawa KK Okinawa, Japan 59% 26%
TRS Okinawa Okinawa, Japan 27% 12%
DFS Palau Limited Koror, Palau 59% 26%
DFS Singapore (Pte) Limited Singapore 59% 26%
DFS Trading Singapore (Pte) Limited Singapore 59% 26%
DFS Venture Singapore (Pte) Limited Singapore 59% 26%
DFS Taiwan Limited Taipei, Taiwan 59% 26%
DFS Galleria Taiwan Limited Taipei, Taiwan 59% 26%
Tou You Duty Free Shop Co. Ltd Taipei, Taiwan 59% 26%
Duty Free Shoppers Macau Limited Hong Kong, China 27% 12%
DFS Macau Limited Hong Kong, China 30% 13%
Hong Kong International BoutiquePartners Hong Kong, China 30% 13%
DFS Sdn. Bhd. Kuala Lumpur, Malaysia 59% 26%
Singapore International BoutiquePartners Singapore 30% 13%
JAL/DFS Duty Free Shoppers KK Chiba, Japan 24% 11%
TRS New Zealand Limited Auckland, New Zealand 27% 12%
Travel Retail Shops Pty Limited Sydney, Australia 27% 12%
DFS Group L.P. San Francisco (California), U.S.A. 59% 26%
JFK Terminal 4 Joint Venture 2001 New York, U.S.A. 47% 21%
LAX Duty Free Joint Venture 2000 Los Angeles (California), U.S.A 45% 20%
Royal Hawaïan Insurance CompanyLtd Hawaii, U.S.A. 59% 26%
DFS Waters. Dallas (Texas), U.S.A. 40% 18%
Hawaï International Boutique Partners Honolulu, Hawaii, U.S.A. 30% 13%
TRS Hawaii LLC Honolulu, Hawaii, U.S.A. 27% 12%
TRS Saipan Garapan, Saipan MP 27% 12%
TRS Guam Tumon, Guam 27% 12%
131

DFS Guam LP Tamuring, Guam NA 26%DFS Liquor Retailing Limited Delaware, U.S.A. NA 26%Twenty Seven—Twenty Eight Corp. Delaware, U.S.A. NA 26%Le Bon Marché SA Paris, France 59% 42%SEGEP SNC Paris, France 59% 42%Franck & Fils SA Paris, France 59% 42%Balthazar SNC Paris, France 59% 42%Tumon Entertainment LLC Tamuring, Guam 59% 42%Comete Guam Inc. Tamuring, Guam 59% 42%Tumon Games LLC Tamuring, Guam 59% 42%Tumon Aquarium LLC Tamuring, Guam 59% 42%Comete Saipan Inc Saipan NMI 59% 42%Cruise Line Holdings Co Delaware, U.S.A. 59% 42%International Cruise Shop Cayman Islands 59% 42%Starboard Holdings Ltd Delaware, U.S.A. 59% 42%Cruise Management International Inc Miami (Florida), U.S.A. 59% 42%On-Board Media Inc Miami (Florida), U.S.A. 59% 42%Starboard Cruise Services Inc Miami (Florida), U.S.A. 59% 42%Fort Lauderdale Partnership Ft Lauderdale, U.S.A. 44% 32%Miami Airport Duty-Free JointVenture Miami (Florida), U.S.A. 39% 28%
OTHER ACTIVITIESDI Group SA Paris, France 59% 42%DI Services SAS Paris, France 59% 42%Imprimerie Desfossés SARL Paris, France 59% 42%Tribune Desfossés SAS Paris, France 59% 42%Radio Classique SAS Paris, France 59% 42%Les Editions Classique Affaires SARL Paris, France 59% 42%DI SAS Paris, France 59% 42%SFPA SARL (Connaissance des Arts) Paris, France 59% 42%D2I SAS Paris, France 59% 42%Investir Publications SAS Paris, France 59% 42%Investir Formation SARL Paris, France 59% 42%Compo Finance SARL Paris, France 59% 42%SID Presse SARL Paris, France 59% 42%SID Développement SAS Paris, France 59% 42%SID Editions SAS Paris, France 59% 42%SID Magazine SA Paris, France 59% 42%SOFPA SA Lausanne, Switzerland 59% 42%JV Bonhams Brooks London, United Kingdom(2) 59% 42%Bonhams Brooks Adjustments London, United Kingdom 59% 42%De Beers LV Ltd London, United Kingdom(2) 30% 21%
132

SCI du 30 de l’avenue Hoche Boulogne Billancourt, France 59% 41%
Société Civile Jacques Gaillard Boulogne Billancourt, France 59% 42%
Ufipar SAS Boulogne Billancourt, France 59% 42%
L Capital Management SAS Paris, France 59% 42%
Sofidiv SAS Boulogne Billancourt, France 59% 42%
GIE LVMH Services Boulogne Billancourt, France 59% 36%
Moët Hennessy SNC Boulogne Billancourt, France 59% 28%
LVMH Fashion Group SA Paris, France 59% 42%
Moët Hennessy International SA Boulogne Billancourt, France 59% 28%
Creare SA Luxembourg, Luxembourg 59% 36%
Delphine SAS Boulogne Billancourt, France 59% 42%
LVMH Finance SA Boulogne Billancourt, France 59% 42%
Primae SA Boulogne Billancourt, France 59% 42%
Eutrope SAS Boulogne Billancourt, France 59% 42%
Flavius Investissements SA Paris, France 59% 42%
LVMH Art & Auction Group SAS Boulogne Billancourt, France 59% 42%
Cie Financière Laflachère SA Boulogne Billancourt, France 59% 42%
LV Capital SA Paris, France 59% 42%
Moët Hennessy Inc. New York, U.S.A. (*) 59% 28%
One East 57th Street LLC New York, U.S.A. (*) 59% 42%
LVMH Moët Hennessy LouisVuitton Inc.
New York, U.S.A. (*) 59% 42%
598 Madison Leasing Corp New York, U.S.A. (*) 59% 42%
1896 Corp. New York, U.S.A. (*) 59% 42%
LVMH Participations BV Naarden, Netherlands 59% 42%
LVMH Moët Hennessy LouisVuitton BV
Naarden, Netherlands 59% 42%
Louis Vuitton Prada Holding BV Amsterdam, Netherlands 59% 42%
Sofidiv UK Ltd London, United Kingdom 59% 42%
LVMH KK Tokyo, Japan 59% 42%
Osaka Fudosan Company Limited Tokyo, Japan 59% 42%
LVMH Asia Pacific Ltd Hong Kong, China 59% 42%
LVMH Moët Hennessy LouisVuitton SA Paris, France Parent company
(*) The address listed is the administrative office of the companies; corporate registration for the company is in theState of Delaware.
(1) Company consolidated by proportionate consolidation
(2) Company consolidated using the equity method
(3) Joint venture with Diageo: only the Moët Hennessy activity is consolidated
133

REPORT OF THE STATUTORY AUDITORS ON THE CONSOLIDATEDFINANCIAL STATEMENTS FOR THE YEAR ENDED DECEMBER 31, 2004
MAZARS & GUERARDLe Vinci
4, allée de l’Arche92075 Paris La Défense
S.A. with capital of €5,900,000
Statutory AuditorMember of Compagnie
Régionale de Paris
ERNST & YOUNG AUDITFaubourg de l’Arche11, allée de l’Arche
92037 Paris-La Défense CedexS.A. with capital of €3,044,220
Statutory AuditorMember of CompagnieRégionale de Versailles
To the shareholders:
Ladies and Gentlemen:
In performing the mission that has been assigned to us by your Annual General Meeting, wehave reviewed the consolidated financial statements of the Christian Dior company for theyear ended December 31, 2004, as they appear in this report.
The consolidated financial statements were drawn up by the Board of Directors. It is ourtask, based on our audit, to express an opinion on these statements.
I. OPINION ON THE CONSOLIDATED FINANCIAL STATEMENTS
We have conducted our audit in accordance with auditing standards generally accepted inFrance. Those standards require that we plan and perform the audit to obtain reasonableassurance that the financial statements are free of material misstatement. An audit includesexamining, by sampling, evidence supporting the amounts and disclosures in the financialstatements. It also includes assessing the accounting principles used and significant estimatesmade by management to prepare the accounts, as well as evaluating the overall financialstatement presentation. We believe that our audits provide a reasonable basis for ouropinion, expressed below.
We certify that, according to French accounting standards, the consolidated financialstatements faithfully and fairly present, in all material respects, the assets, the financialposition and the results of all the companies included in the consolidation.
II. JUSTIFICATION OF OUR ASSESSMENTS
Pursuant to the provisions of Article L.225-235 of the French Commercial Code governingthe justification of our assessment, we provide you with the following information:
The valuation of brands and goodwill has been conducted using the method described inNote 3. We have assessed the legitimacy of the methodology used, which was based on a setof estimates and examined the amounts and assumptions used by the company and itsadvisors to make these valuations. We assessed the reasonableness of these estimates onthese bases.
The assessments we made are part of our audit of the consolidated financial statements intheir entirety and, therefore, contributed to the formation of our opinion without reservationas expressed in the first part of this report.
134
III. SPECIFIC VERIFICATION
Furthermore, we have also performed verifications of information relating to the company,contained in the management report elatives au groupe, in accordance with accountingprinciples generally accepted in France.
We have no comments to make on their accuracy and consistency with the consolidatedfinancial statements.
Paris La Défense April 6, 2005
The Statutory Auditors
M A Z A R S & G U E R A R DDenis Grison
E R N S T & Y O U N G A U D I TChristian Mouillon
135
REPORT OF THE STATUTORY AUDITORS, PREPARED PURSUANT TO THELAST PROVISION OF ARTICLE L.225-235 OF THE FRENCH COMMERCIAL
CODE, ON THE REPORT OF THE CHAIRMAN OF THE BOARD OFDIRECTORS OF THE CHRISTIAN DIOR COMPANY CONCERNING THE
INTERNAL CONTROL PROCEDURES FOR THE PREPARATION ANDSTATEMENT OF THE FINANCIAL AND ACCOUNTING INFORMATION
FOR THE YEAR ENDED DECEMBER 31, 2004
MAZARS & GUERARDLe Vinci
4, allée de l’Arche92035 Paris La Défense
S.A. with capital of €5,900,000
Statutory AuditorMember of Compagnie
Régionale de Paris
ERNST & YOUNG AUDITFaubourg de l’Arche11, allée de l’Arche
92037 Paris-La Défense CedexS.A. with capital of €3.044.220
Statutory AuditorMember of CompagnieRégionale de Versailles
To the shareholders:
Ladies and Gentlemen:
In our capacity as auditors of the Christian Dior company, and pursuant to the provisions ofthe last section of Article L.225-235 of the French Commercial Code, we are presenting ourreport on the report prepared by the Chairman of your Company pursuant to the provisionsof Article L.225-37 of the Commercial Code for the year ended December 31, 2004.
It is the responsibility of the Chairman to report, primarily, on the conditions for thepreparation and organization of the work of the Board of Directors and the internal controlprocedures established within the Company.
It is our responsibility to inform you of our comments on the information provided in theChairman’s report concerning the internal control procedures for the preparation andstatement of the accounting and financial information.
We have performed our audits in accordance with the professional auditing standardsgenerally accepted in France. Those standards require that we conduct our verification inorder to assess the fair presentation of the information provided in the Chairman’s reportconcerning the internal control procedures for the preparation and statement of theaccounting and financial information. This task consisted of:
• Reviewing the objectives and the general organization of the internal control, as well as theinternal control procedures for the preparation and statement of the accounting and financialinformation presented in the Chairman’s report;
• Reviewing the work underlying all information as provided in the report.
136
On the basis of this work, we have no comment to make on the information providedconcerning the company’s internal control procedures for the preparation and statement ofthe accounting and financial information contained in the report of the Chairman of theBoard, prepared pursuant to the provisions of the final section of Article L.225-37 of theCommercial Code.
Paris La Défense April 6, 2005
Statutory Auditors
M A Z A R S & G U E R A R DDenis Grison
E R N S T & Y O U N G A U D I TChristian Mouillon
137