Embed Size (px)
Citation preview
Consolidated Financial Statements2019
Íslandsbanki

Contents
2
3 - 6
7 - 9
10
11
12
13
14 - 15
16 - 84
85 - 91
Appendix - unaudited
Íslandsbanki's Corporate Governance Statement 2019 .............................................................................
Highlights ....................................................................................................................................................
Directors' Report .........................................................................................................................................
Independent Auditor's Report .....................................................................................................................
Notes to the Consolidated Financial Statements ........................................................................................
Consolidated Income Statement ................................................................................................................
Consolidated Statement of Financial Position ............................................................................................
Consolidated Statement of Changes in Equity ...........................................................................................
Consolidated Statement of Cash Flows .....................................................................................................
Consolidated Statement of Comprehensive Income ..................................................................................

24.1%22.2% 22.4%
31.12.17 31.12.18 31.12.19
Profit after tax(ISKm)
Loans to customers(Sector split as of 31.12.19)
Total assets(ISKbn)
Leverage ratio
62.5%66.3%
62.4%
2017 2018 2019
Loans to customers(ISKbn)
Total capital ratio
Cost / income ratio
9.9%
8.0%6.6%
2017 2018 2019
Number of FTEs at Íslandsbanki(Excluding seasonal employees)
16.2%14.6% 14.2%
31.12.17 31.12.18 31.12.19
ISK 900bn
Our profile
A leader in financial services in Iceland, Íslandsbanki is a universal bank withtotal assets of ISK 1,199bn, a total capital ratio of 22.4% and a 25-40% marketshare across all domestic business segments at year-end 2019.
Íslandsbanki's purpose is to move Iceland forward by empowering ourcustomers to succeed. Driven by the vision to be #1 for service,Íslandsbanki's relationship banking business model is propelled by threebusiness divisions that manage and build relationships with the Bank'scustomers.
Íslandsbanki has developed a wide range of online services such as theÍslandsbanki and Kass apps, enabling customers to do their bankinganywhere and anytime. At the same time, the Bank continues to operate themost efficient branch network in Iceland through its strategically located 14branches.
Íslandsbanki has a BBB+/A-2 rating from S&P Global Ratings.
Our bank
Market share*
Credit rating
Individuals39%
Commerce and services14%
Seafood12%
Real estate16%
Industrial and transport
9%
Other10%
13,226
10,645
8,454
2017 2018 2019
Highlights
1,036 1,130 1,199
74.9% 74.8% 73.7%
31.12.17 31.12.18 31.12.19
REA / total assets
755 847 900
133.2%146.2% 145.5%
31.12.17 31.12.18 31.12.19
Customer loans to customer deposits ratio
The information above has not been audited by the Bank's auditor.*Based on Gallup survey regarding primary bank.**Return from regular operations and corresponding ratios on normalized CET1 of 16%, adjusted for risk free interest on excess capital .
32% 35% 34%individuals SMEs large companies
14branches 749
Number of FTEs atÍslandsbanki at year-end
BBB+/A-2Negative outlook
ROE reg. operations CET1 16%**
860 834749
31.12.17 31.12.18 31.12.19
Newunified banking app
Íslandsbanki hf. Consolidated Financial Statements 2019 2

Directors' Report
Íslandsbanki hf. Consolidated Financial Statements 2019 3
The audited consolidated financial statements of Íslandsbanki hf. (“the Bank” or “Íslandsbanki”) for the year 2019 comprise the financial
statements of Íslandsbanki hf. and its subsidiaries, together referred to as "the Group".
Operations in 2019
Íslandsbanki is a universal bank offering comprehensive financial services to households, corporations, and institutional investors in
Iceland. The Group is one of Iceland's largest banking and financial services groups, with a strong domestic market share. The vision is
to make Íslandsbanki #1 for service.
The profit from the Group's operations for the reporting period amounted to ISK 8,454 million, which corresponds to 4.8% return on equity.
The Board of Directors proposes that ISK 4.2 billion will be paid in dividends to shareholders, which is in line with the Bank’s policy of
paying dividends of 40-50% of profit of the year. The Board may convene a special shareholders' meeting later in the year to propose
payment of additional dividends if the Bank's accumulated capital reserves are considered to exceed its long-term capital requirements.
In 2019, the Bank paid ISK 5.3 billion in dividends to the Bank's shareholders, amounting to 50% of the Bank’s profit of the year in 2018.
At the end of the reporting period, the Group employed 984 full-time members of staff, including 749 within the Bank itself, 60% female
and 40% male.
Net interest income increased by 5.4% between years, broadly in line with growth in the loan book. Net fee and commission income
increased by 9.3%, as modest growth in the Bank was supported by strong growth in the Bank’s three main subsidiaries. Other net
operating income was ISK 1.5 billion, where negative net financial income was offset by one-off items in other operating income. The one-
off items were a settlement of the Bank’s claim deriving from the acquisition of Byr savings bank in 2011 and a reversal of previously
expensed contribution to the Depositors' and Investors' Guarantee Fund relating to past changes in the legislation on deposit insurance.
Administrative expenses were up by 1.7% between years. Salary costs were up by 5.0% due to general wage increases and substantial
redundancy payments, offset by reduction in the number of FTE's in the Bank where the number of year-end employees reduced by 10.2%
between years. Net impairments were negative by ISK 3.7 billion, going from a net reversal of ISK 1.6bn in 2018 to a net charge in 2019,
adversely affected by adjustments made to take into account the increased downside risk in the macroeconomic outlook and increased
impairments against a few single-name exposures.
The balance sheet of the Group grew by 6.1% between years on the back of a 6.3% growth in loans to customers, with the largest increase
in Personal banking. Loan book growth was especially strong in the first half of the year and slowed somewhat down in the second half
and especially in the fourth quarter. The ratio of non-performing loans rose from 1.7% to 3.0% during the year due to a less favourable
economic environment, with economic growth close to zero percent due to a drop in tourism.
Deposits from customers increased by 6.8% in 2019, driven by an increase in deposits from individuals and institutional investors. The
Bank issued its first senior unsecured bond in the domestic market in 2019 and the issuance was well received by investors in Iceland and
will serve as a good benchmark for other banks and corporate issuers. The Bank continued to have good access to international capital
markets and fulfilled its funding plans across markets. In the second quarter the Bank issued a Tier 2 bond in the Nordic market and
continues to be well supported by investors in that region. In January the Bank terminated its credit rating contract with Fitch ratings and
was the decision driven primarily from a cost perspective. The Bank's ratings were affirmed by S&P (BBB+), however S&P placed all the
Icelandic banks on negative outlook, mainly due to weaker earnings and competition from the pension funds in the mortgage market.
The Group's total equity amounted to ISK 180.1 billion and total assets were ISK 1,199.5 billion at the end of the reporting period and the
Group's total capital ratio was 22.4%. At the end of September, the Group was presented with the results of the annual SREP process
conducted by the Icelandic Financial Supervisory Authority. The results included the updated capital requirement for the Group. The total
regulatory capital requirement is now 18.8% of the risk exposure amount and did not change from the last SREP process. The composition
of the requirement did however change, as a 50 basis point increase in the counter-cyclical buffer was offset by a reduction in the pillar 2
charge. The countercyclical buffer will increase by further 25 basis points, from 1.75% to 2.00%, as of February 2020, which will then bring
the total regulatory capital requirement up to 19.0%. The Bank’s capital target entails a management buffer of 0.5-2.0% on top of the SREP
requirement and from February 2020 onwards the capital target will therefore be 19.5-21.0%. The Bank's liquidity position remains strong
and well above regulatory requirements.
The Bank engaged BCG Nordics to help to formulate a new strategy for the Bank and the outcome was presented to the Bank's employees
at a strategic summit at the end of March. The strategy work was based on extensive research, industry insights and benchmarks,
identifying the competitive advantages and future strategic positioning in a changing environment. The outcome of the work was an
articulation of the Bank's purpose, values and vision along with a list of strategic initiatives to be implemented in the next five years. The
purpose of “Moving Iceland forward through empowering our customers to succeed” was defined through input from workshops with all
employees. It articulates a more active role of the Bank in a shaping and progressing society. The purpose is further supported by three
values that will serve as a guiding principle for employees in all their efforts: 'Passion, Professionalism, and Collaboration'.
To live the purpose and values, Íslandsbanki continues to be guided by the vision to be '#1 for service', placing the customer at the centre
of gravity for value creation. The Bank will put a strong emphasis on technology to facilitate innovation and development of simple, efficient
solutions for its customers. Going forward, the Bank will be reinforcing its commitment to corporate social responsibility (CSR) by integrating
social and environmental impact as a driver of strategy and value creation within the Bank. As such, the Bank's CSR work will be centred
around four of the United Nations’ seventeen Sustainable Development Goals (SDGs): #4 Quality education; #5 Gender equality; #9
Industry, innovation and infrastructure; and #13 Climate action. As a result of the BCG work, the Bank has also focused on improving its
pricing models and finding efficiency gains, for example with the implementation of robotics.

Directors' Report
Íslandsbanki hf. Consolidated Financial Statements 2019 4
Outlook
Following a long period of robust growth, the Icelandic economy faced headwinds in 2019 as a major airline went bankrupt and the number
of tourists visiting the country declined by 14% year-on-year. However, the tourist sector, as well as the wider economy, seems to be
weathering this setback relatively well so far. The improvement in the balance sheets of both the private and public sector over the past
decade are a major factor in increasing economic resilience to adverse developments such as those Iceland has faced recently.
The Bank's Chief economist expects GDP growth to resume in 2020, following broadly unchanged GDP in 2019, measuring 1.4% this
year and rising to 2.3% in 2021. After a year of contraction, investment is assumed to return to growth as business sentiment recovers
and the public sector steps up infrastructure investments. Buoyed by a sound financial position and ongoing real wage growth, households
are expected to continue increasing private consumption, albeit at a more modest pace than in recent years. Inflation has subsided to the
Central Bank's target after a short-lived inflation spike and the outlook is for moderate inflation in coming quarters, which will increase the
leeway for counter-cyclical economic policy. The Icelandic króna has remained relatively stable following a 10% depreciation in the latter
half of 2018 and there are numerous indications that the current exchange rate will help facilitate a continuation of the historically long
period of current account surplus Iceland has enjoyed in recent years.
The Bank aims to reach a return of equity of 8-10%. To achieve that goal, the Bank will strive to continue to grow revenue on average in
line with GDP, while growing the cost base at a slower pace with strict cost control and efficiency gains, lowering the cost-income ratio
below our target of 55%. The Bank’s capital position remains strong and well above the regulatory requirements, supporting dividend
payments in line with the target of 40-50% payout ratio.
Risk management
The Bank is exposed to various risks. The management of these risks is an integral part of the Bank's operations and the Bank has focused
on building up a responsible internal risk culture among the Bank's employees. The ultimate responsibility for ensuring an adequate risk
management framework lies with the Board of Directors. The Board defines and communicates the acceptable level of risk through the
Bank's risk management policies and the CEO is responsible for ensuring that risks are managed within those limits.
The Board hereby declares that Íslandsbanki has overall satisfactory risk management in relation to the Bank’s profile and strategy.
The Bank's risk management framework and policies are discussed under Notes 45-63 to the consolidated financial statements and in
the unaudited Pillar 3 Report.
Ownership
The Bank is wholly owned by the Icelandic Government and there were no changes in the ownership during the course of 2019. The
shares are administered by the Icelandic State Financial Investments (ISFI) in accordance with Act no. 88/2009 on Icelandic State Financial
Investments.
The Icelandic Government published in July 2017 a general ownership policy for financial institutions with regards to ownership stakes
administered with the Icelandic State Financial Investments (ISFI). In December 2018 the Bank signed an agreement with ISFI on general
and specific goals for the operations, in line with article 2.3 in the policy.
Corporate governance
The Board of Directors of Íslandsbanki is committed to excellence in its governance framework so that it complies with the best corporate
governance practices in the financial market at all times.
Íslandsbanki was first recognised as “Exemplary in Corporate Governance” in March 2014 by the Center of Corporate Governance at the
Institute for Business Research, University of Iceland. The recognition was awarded following a comprehensive review of the practices of
the Board, Board subcommittees and management. The recognition has been renewed annually since.
The Board of Directors comprises seven non-executive directors and two alternates. The Board undertakes the Bank's affairs and is
responsible for setting the Bank's general strategy as well as instructing the CEO on its further implementation and execution. The Board
has a supervisory role overseeing that the Bank's organisation and activities are at all times in accordance with relevant laws, regulations
and good business practices. Furthermore, the Board shall monitor the execution of its policies, the sound control of accounting and
financial management, and ensure that group internal audit, compliance, risk management and internal controls are effective at all times.
Candidates for board membership are nominated through a selection process administered by the Icelandic State Financial Investments
in accordance with Article 7 of the ISFI Act no. 88/2009. At the Bank's Annual General Meeting in March the Board of Directors was elected
for the Bank. The Articles of Association of the Bank provide that the ratio of each gender on the Board of Directors shall not be lower than
40%, currently the Board consists of seven members, three female and four male. The Board has approved a policy on the suitability of
the Board of Directors, the CEO and key function holders. The policy states, among other things, that the composition of the Board shall
at any time be diverse, with regard to educational and professional background, gender and age.
Directors' Report
Íslandsbanki hf. Consolidated Financial Statements 2019 5
The Board appoints subcommittees, each one comprising Board members and operating under the terms of a mandate letter from the
Board as well as the Rules of Procedure of the Board. The mandate letters of Board subcommittees are available on the Bank's website.
The CEO is responsible for the day-to-day operations of the Bank and that the Bank's business is, at all times, in accordance with the
Bank's Articles of Association, policies of the Board and the relevant law. The CEO engages the Bank's Compliance Officer and appoints
members of the Executive Committee and other Senior Management Committees.
The Executive Committee, comprising seven members, including the CEO, is composed of three women and four men. The role of the
Executive Committee is to maintain an overall view of the Bank's operations and to coordinate key aspects of its activities that are not
supervised by other senior management committees. The CEO ensures that the Board is regularly provided with accurate information on
the Bank's finances, development and operations.
The Bank's Finance division is responsible for the preparation of the Group's consolidated financial statements which are prepared in
accordance with the International Financial Reporting Standards (IFRS). The Board's Audit Committee gives its opinion on annual and
interim consolidated financial statements before their submission for Board approval and endorsement. Management reporting is generally
presented to the Board 10 times a year. The external auditors review the second quarter interim consolidated financial statements and
audit annual consolidated financial statements.
The regulatory framework for corporate governance practices within Íslandsbanki consists of the law applicable to its operations, including
those imposed by the FME, Central Bank of Iceland and Nasdaq Iceland. The applicable laws include, inter alia, the Act on Financial
Undertakings no. 161/2002, the Act on Securities Transactions no. 108/2007, the Act on Public Limited Companies no. 2/1995 and the
Act on Competition no. 44/2005, available on the Icelandic legislature's website (www.althingi.is).
The Board of Directors follows the Corporate Governance Guidelines (5th ed.) issued by the Iceland Chamber of Commerce, Nasdaq
Iceland and SA-Business Iceland, available on www.corporategovernance.is (hereinafter the Guidelines). The Bank's practices are
compliant with the guidelines except for Article 1.5.
Article 1.5 of the Guidelines provides that the shareholders' meeting shall appoint members to a nomination committee or decide how they
should be appointed. The Bank's shareholders, as well as the Board, have not deemed it necessary to appoint a nomination committee at
this time given the ownership of the Bank. Candidates for board membership are nominated by the Icelandic Government, sole owner of
the Bank, through a selection process administered by ISFI in accordance with article 7 of the ISFI Act.
A more detailed description of Íslandsbanki's governance framework and associated practices can be found in the Bank's Corporate
Governance Statement enclosed in an unaudited Appendix to the consolidated financial statements and on the Bank's website,
www.islandsbanki.is.
Sustainability
Íslandsbanki's Sustainability Policy was approved by its board in late 2019. The Policy aims at making the Bank a model of exemplary
operations in the Icelandic business community, based on internationally recognised environmental, social, and governance (ESG) criteria.
The ESG criteria are a set of references used by investors to evaluate investments based on responsible investment methodology.
The Bank aims to be a leader in the area of sustainable development and a catalyst for positive social action, moving Iceland forward by
empowering its customers to succeed. To this end, the Bank intends to initiate broad collaboration on responsible business practices that
both contribute to sustainable development in the Icelandic economy and support the Government's Climate Action Plan, while also
supporting the UN SDGs.
Alongside its vision of being a leader in service to customers, the Bank will focus on integrating sustainability considerations into its
activities, in addition to its profit objectives. The Bank will take account of ESG criteria in its risk management and will explore opportunities
to take advantage of green investment opportunities. Íslandsbanki aims to increase the general public's financial knowledge and interest
in the subject and, to this end, it offers interesting and accessible seminars on finance and economics.
Íslandsbanki's Sustainability Policy creates a comprehensive framework for its activities in the area of environmental affairs, respect for
human rights, responsible lending, investments, purchasing, and grants, as well as integrating with and supporting the Bank's other
policies. Íslandsbanki sets quantifiable ESG targets in its operations and discloses its performance relative to targets in a separate report
issued concurrent with the Bank's annual financial statements.
As a signatory to the UN Global compact Íslandsbanki is committed to aligning its operations and strategies with 10 principles covering
human rights, labour, the environment and anti-corruption. The Bank has in place a Code of Conduct and a Conflict of Interest Policy in
order to ensure creditability in business transacted by the Bank and its clients and employees' impartiality in handling and processing
individual cases.
The Bank's sustainability and ESG factors are further described in the unaudited annual and sustainability report.
Directors' Report
Íslandsbanki hf. Consolidated Financial Statements 2019 6
Statement by the Board of Directors and the CEO
The audited consolidated financial statements for the year ended 31 December 2019 have been prepared on a going concern basis in
accordance with the International Financial Reporting Standards (IFRS) as adopted by the European Union; the Act on Annual Accounts,
no. 3/2006; the Act on Financial Undertakings, no. 161/2002; and rules on accounting for credit institutions, where applicable, to the extent
that they are not inconsistent with the requirements of the IFRS as adopted by the EU.
To the best of our knowledge, these consolidated financial statements provide a true and fair view of the Group's operating profits and
cash flows in 2019 and its financial position as of 31 December 2019. Furthermore in our opinion the financial statements and the Director's
report give fair view of the main operational developments and achievements and describe the principal risks and uncertainties that the
Group faces in its operations.
The Board of Directors and the CEO have today discussed and approved the 2019 Consolidated Financial Statements of Íslandsbanki.
Kópavogur, 12 February 2020
Board of Directors:
Friðrik Sophusson, Chairman
Tómas Már Sigurðsson, Vice-Chairman
Anna Þórðardóttir
Auður Finnbogadóttir
Árni Stefánsson
Hallgrímur Snorrason
Heiðrún Jónsdóttir
Chief Executive Officer:
Birna Einarsdóttir

Íslandsbanki hf. Consolidated Financial Statements 2019 7
Independent Auditor's Report To the Board of Directors and shareholders of Íslandsbanki hf.
Opinion
We have audited the consolidated financial statements of Íslandsbanki hf. and its subsidiaries (the Group) which comprise the
consolidated statement of financial position as at 31 December 2019 and the consolidated income statement, consolidated statement
of comprehensive income, consolidated statement of changes in equity and consolidated statement of cash flow for the year then
ended and a summary of significant accounting policies and other explanatory information.
In our opinion, the accompanying consolidated financial statements give a true and fair view of the consolidated financial position of
the Group as at 31 December 2019, and its consolidated financial performance and its consolidated cash flows for the year then
ended, in accordance with the International Financial Reporting Standards, as adopted by the European Union and additional
requirements in the Icelandic Act on Annual Accounts, Act on Financial Undertakings and rules on accounting for credit institutions,
where applicable.
Basis for Opinion
We conducted our audit in accordance with the International Standards on Auditing (ISAs). Our responsibilities are further described
in the Auditor’s Responsibilities for the Audit of the financial statements section of our report. We are independent of the Group in
accordance with the International Ethics Standards Board for Accountants’ Code of Ethics for Professional Accountants (IESBA Code)
together with the ethical requirements that are relevant to our audit of the consolidated financial statements in Iceland, and we have
fulfilled our other ethical responsibilities in accordance with these requirements and the IESBA Code. We believe that the audit
evidence we have obtained is sufficient and appropriate to provide a basis for our opinion.
Key Audit Matters
Key Audit Matters are those matters that, in our professional judgement, were of most significance in our audit of the consolidated
financial statements of the current period. These matters were addressed in the context of our audit of the consolidated financial
statements as a whole, and in forming our opinion thereon, and we do not provide a separate opinion on these matters.
Why significant How our audit addressed the Key Audit Matter
Provision for credit impairment
As described in Notes 2 and 66.3, the provision for credit
impairment is determined in accordance with International Financial Reporting Standard 9, Financial Instruments (IFRS 9).
The provision for credit impairment is dependent on the estimation and judgement of management. Loans to
customers represent ISK 899,632 million or 75% of total assets at 31 December 2019 against which impairment allowances of ISK 10,298 million have been recorded.
Key areas of judgement include:
• the interpretation of the requirements to determine impairment under application of IFRS 9, which is
reflected in the Group’s expected credit loss model;
• the identification of loans with significant deterioration in credit quality;
• assumptions used in the expected credit loss model such as the financial condition of the counterparty, expected future cash flows and forward-looking macroeconomic factors as disclosed in Notes 2 and
66.3. The determination of the provision for credit impairment is
based on estimates and judgement by management. Due to the use of judgement and estimates and the relative size of loans to customers on the balance sheet, we consider the
provision for credit impairment a Key Audit Matter.
Our procedures focused on the following to respond to the Key
Audit Matter, among others:
• Assessing the Group’s expected credit loss model, focusing
on the following areas:
• alignment of the expected credit loss model and its underlying methodology with the requirements of IFRS 9; and
• approach to the incorporation of forward-looking macroeconomic factors.
• Testing the effectiveness of relevant controls relating, among others, to the:
• data used to determine the provision for credit impairment, including transactional data captured at
loan origination and ongoing internal credit quality assessment;
• expected credit loss model, including model build and approval, ongoing monitoring/validation, model
governance and mathematical accuracy;
• registration and valuation of collateral used in the calculation of expected credit loss;
• Examination of a sample of loans and procedures to evaluate the:
• timely identification of loans with significant deterioration in credit quality; and
• expected loss calculation by re-performing and assessing the reasonableness of the ECL model
calculations. In addition, we assessed the adequacy of the disclosures in the consolidated financial statements.
Íslandsbanki hf. Consolidated Financial Statements 2019 8
We have fulfilled our responsibilities described in the ''Auditor´s responsibilities for the audit of the consolidated financial statements''
section, including in relation to the Key Audit Matters above. Accordingly, our audit included the design and performance of procedures
to respond to our assessment of the risks of material misstatement of the consolidated financial statements. The results of our audit
procedures, including the procedures performed to address the matters above, provide the basis for our audit opinion on the
consolidated financial statements.
Other information
This document also contains other information than the consolidated financial statements and our auditor’s report thereon. The other
information are: The unaudited highlights, Directors´ Report, unaudited quarterly statements in note 9 and unaudited Íslandsbanki ´s
Corporate Governance Statement 2019 in appendix. Management and Board of Directors are responsible for the other information.
Our opinion on the consolidated financial statements does not cover the other information and we do not and will not express any
form of assurance conclusion thereon except for confirmation regarding Directors´ Report as stated below.
In connection with our audit of the consolidated financial statements, our responsibility is to read the other information and, in doing
so, consider whether it is materially inconsistent with the consolidated financial statements or our knowledge obtained in the audit or
otherwise appears to be materially misstated. If we, based on the work we have performed concerning this other information, conclude
that there is a material misstatement of this other information, we are required to report that fact. We have nothing to report in this
regard.
Responsibilities of CEO and Board of Directors for the consolidated financial statements
The Chief Executive Officer (CEO) and Board of Directors are responsible for the preparation and fair presentation of the consolidated
financial statements in accordance with International Financial Reporting Standards, as adopted by the European Union and additional
requirements in the Icelandic Act on Annual Accounts, Act on Financial Undertakings and rules on accounting for credit institutions,
where applicable.
The CEO and Board of Directors are responsible for such internal control that management determines is necessary to enable the
preparation of the consolidated financial statements that are free from material misstatement, whether due to fraud or error.
In preparing the consolidated financial statements, management is responsible for assessing the Group's ability to continue as a going
concern, disclosing, as applicable, matters related to going concern and using the going concern basis of accounting unless
management either intends to liquidate the Group or to cease operations, or has no realistic alternative but to do so.
The Board of Directors is responsible for overseeing the Group’s consolidated financial reporting process.
Auditor’s Responsibilities for the Audit of the consolidated financial statements
Our objectives are to obtain reasonable assurance about whether the consolidated financial statements as a whole are free from
material misstatement, whether due to fraud or error, and to issue an auditor’s report that includes our opinion. Reasonable assurance
is a high level of assurance, but is not a guarantee that an audit conducted in accordance with International Standards on Auditing
(ISAs) will always detect a material misstatement when it exists. Misstatements can arise from fraud or error and are considered
material if, individually or in the aggregate, they could reasonably be expected to influence the economic decisions of users taken on
the basis of these consolidated financial statements.
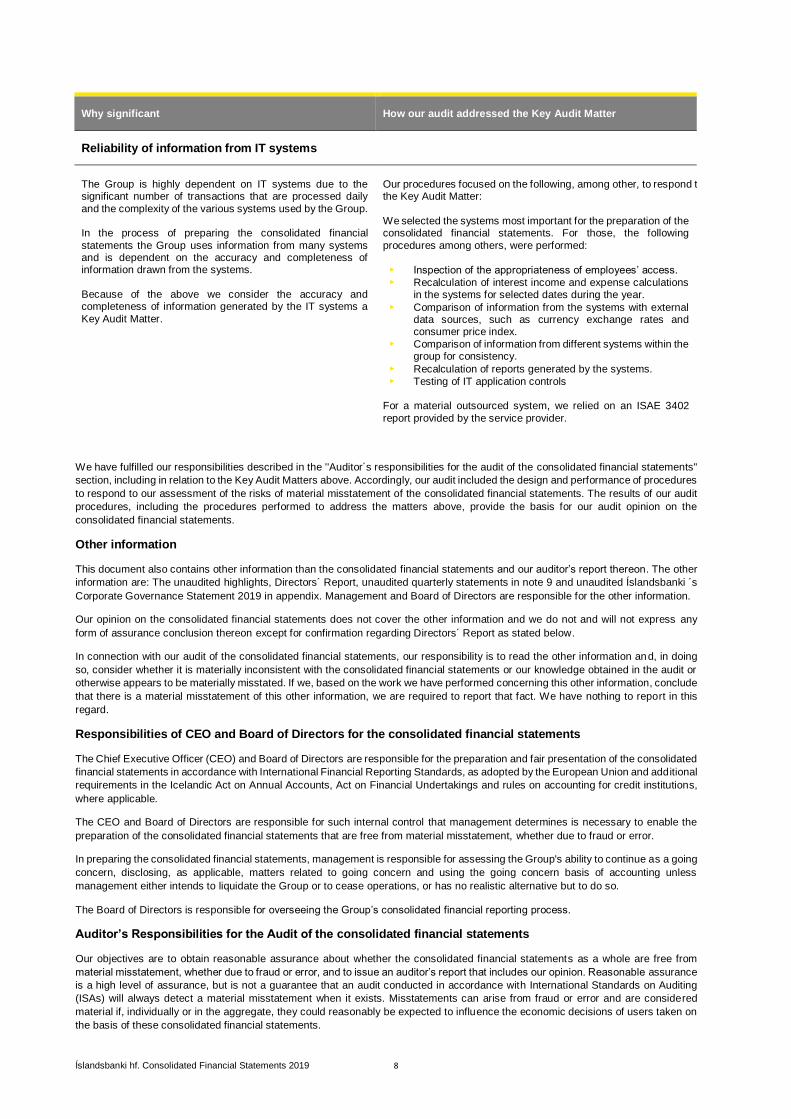
Why significant How our audit addressed the Key Audit Matter
Reliability of information from IT systems
The Group is highly dependent on IT systems due to the significant number of transactions that are processed daily
and the complexity of the various systems used by the Group. In the process of preparing the consolidated financial
statements the Group uses information from many systems and is dependent on the accuracy and completeness of information drawn from the systems.
Because of the above we consider the accuracy and completeness of information generated by the IT systems a
Key Audit Matter.
Our procedures focused on the following, among other, to respond to the Key Audit Matter:
We selected the systems most important for the preparation of the consolidated financial statements. For those, the following
procedures among others, were performed:
• Inspection of the appropriateness of employees’ access.
• Recalculation of interest income and expense calculations in the systems for selected dates during the year.
• Comparison of information from the systems with external data sources, such as currency exchange rates and consumer price index.
• Comparison of information from different systems within the group for consistency.
• Recalculation of reports generated by the systems.
• Testing of IT application controls
For a material outsourced system, we relied on an ISAE 3402
report provided by the service provider.

Íslandsbanki hf. Consolidated Financial Statements 2019 9
As part of an audit in accordance with the International Standards on Auditing (ISAs), we exercise professional judgement and maintain
professional skepticism throughout the audit. We also:
• Identify and assess the risks of material misstatement of the consolidated financial statements, whether due to fraud or
error, design and perform audit procedures responsive to those risks, and obtain audit evidence that is sufficient and
appropriate to provide a basis for our opinion. The risk of not detecting a material misstatement resulting from fraud is higher
than for one resulting from error, as fraud may involve collusion, forgery, intentional omissions, misrepresentations, or the
override of internal control.
• Obtain an understanding of internal control relevant to the audit in order to design audit procedures that are appropriate in
the circumstances, but not for the purpose of expressing an opinion on the effectiveness of the Group’s internal control.
• Evaluate the appropriateness of accounting policies used and the reasonableness of accounting estimates and related
disclosures made by management.
• Conclude on the appropriateness of management’s use of the going concern basis of accounting and, based on the audit
evidence obtained, whether a material uncertainty exists related to events or conditions that may cast significant doubt on
the Group’s ability to continue as a going concern. If we conclude that a material uncertainty exists, we are required to draw
attention in our auditor’s report to the related disclosures in the consolidated financial statements or, if such disclosures are
inadequate, to modify our opinion. Our conclusions are based on the audit evidence obtained up to the date of our auditor’s
report. However, future events or conditions may cause the Group to cease to continue as a going concern.
• Evaluate the overall presentation, structure and content of the consolidated financial statements, including the disclosures,
and whether the consolidated financial statements represent the underlying transactions and events in a manner that
achieves fair presentation.
• Obtain sufficient appropriate audit evidence regarding the financial information of the entities or business activities within
the Group to express an opinion on the consolidated financial statements. We are responsible for the direction, supervision
and performance of the group audit. We remain solely responsible for our audit opinion
We communicate with those charged with governance regarding, among other matters, the planned scope and timing of the audit and
significant audit findings, including any significant deficiencies in internal control that we identify during our audit.
We also provide those charged with governance with a statement that we have complied with relevant ethical requirements regarding
independence, and to communicate with them all relationships and other matters that may reasonably be thought to bear on our
independence, and where applicable, related safeguards.
From the matters communicated with those charged with governance, we determine those matters that were of most significance in
the audit of the consolidated financial statements of the current period and are therefore the Key Audit Matters. We describe these
matters in our auditor’s report unless law or regulation precludes public disclosure about the matter or when, in extremely rare
circumstances, we determine that a matter should not be communicated in our report because the adverse consequences of doing
so would reasonably be expected to outweigh the public interest benefits of such communication.
Report on the Board of Directors Report
Pursuant to the legal requirements of Article 104, Paragraph 2 of the Icelandic Financial Statement Act no. 3/2006, we confirm that,
to the best of our knowledge, the report of the Board of Directors accompanying the consolidated financial statements includes all
information required by the Icelandic Financial Statement Act.
Reykjavík, 12 February 2020
__________________________
Margrét Pétursdóttir
State Authorised Public Accountant
Ernst & Young ehf.
Borgartúni 30
105 Reykjavík

Notes 2019 2018
62,846 61,675
( 29,170) ( 29,738)
10 33,676 31,937
21,026 19,853
( 7,667) ( 7,626)
11 13,359 12,227
12 ( 817) ( 962)
13 143 1
14 2,134 1,784
1,460 823
48,495 44,987
15 ( 16,279) ( 15,500)
16 ( 11,828) ( 12,150)
( 936) ( 1,173)
66.22 ( 3,528) ( 3,281)
( 32,571) ( 32,104)
15,924 12,883
18 ( 3,663) 1,584
12,261 14,467
19 ( 3,682) ( 4,734)
8,579 9,733
20 ( 125) 912
8,454 10,645
*Of which interest income amounting to ISK 60,123 million (2018: ISK 59,741 million) is calculated using the effective interest method.
Profit attributable to:
8,809 11,036
( 355) ( 391)
8,454 10,645
Earnings per share from continuing operations
Basic and diluted earnings per share attributable to the
21 0.89 1.01
The notes on pages 16 to 84 are an integral part of these consolidated financial statements.
Consolidated Income Statement
Interest income* .........................................................................................................
Interest expense ........................................................................................................
Net interest income
Total operating income
Fee and commission income .....................................................................................
Fee and commission expense ...................................................................................
Net fee and commission income
Net financial expense .................................................................................................
Net foreign exchange gain .........................................................................................
Other operating income .............................................................................................
Other net operating income
Total operating expenses
Profit before net impairment on financial assets
Net impairment on financial assets ............................................................................
Salaries and related expenses ...................................................................................
Other operating expenses ..........................................................................................
Contribution to the Depositors' and Investors' Guarantee Fund .................................
Bank tax ....................................................................................................................
Profit before tax
Income tax expense ...................................................................................................
Profit for the year from continuing operations
Discontinued operations, net of income tax ...............................................................
Profit for the year
Shareholders of Íslandsbanki hf. ................................................................................
Non-controlling interests ............................................................................................
Profit for the year
shareholders of Íslandsbanki hf. ................................................................................
Íslandsbanki hf. Consolidated Financial Statements 2019 10 Amounts are in ISK million

2019 2018
8,454 10,645
Items that will not be reclassified to profit or loss
1,272 610
( 677) 1,120
595 1,730
9,049 12,375
Total comprehensive income attributable to:
8,939 12,542
110 ( 167)
9,049 12,375
The notes on pages 16 to 84 are an integral part of these consolidated financial statements.
Consolidated Statement of Comprehensive Income
Profit for the year .......................................................................................................
Shareholders of Íslandsbanki hf. ................................................................................
Non-controlling interests ............................................................................................
Total comprehensive income for the year
Changes in fair value of financial liabilities, net of tax ................................................
Other comprehensive income for the year, net of tax
Total comprehensive income for the year
Changes in fair value of financial assets, net of tax ...................................................
Íslandsbanki hf. Consolidated Financial Statements 2019 11 Amounts are in ISK million
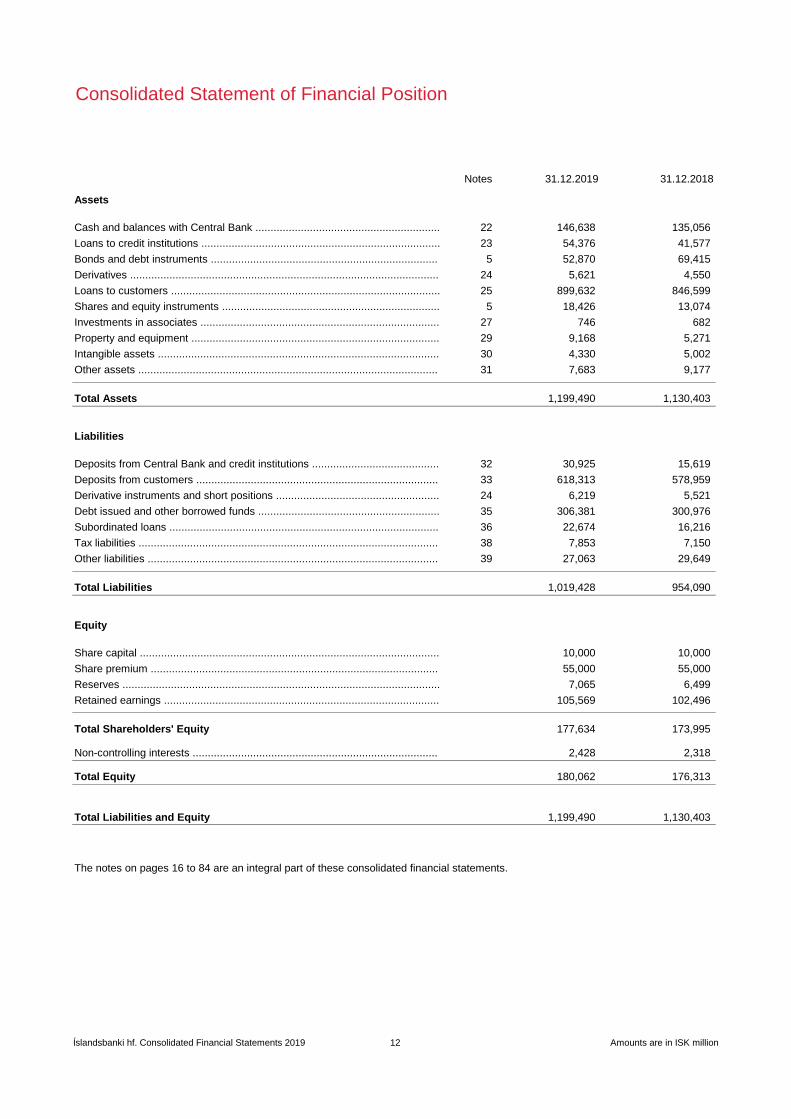
Notes 31.12.2019 31.12.2018
22 146,638 135,056
23 54,376 41,577
5 52,870 69,415
24 5,621 4,550
25 899,632 846,599
5 18,426 13,074
27 746 682
29 9,168 5,271
30 4,330 5,002
31 7,683 9,177
1,199,490 1,130,403
32 30,925 15,619
33 618,313 578,959
24 6,219 5,521
35 306,381 300,976
36 22,674 16,216
38 7,853 7,150
39 27,063 29,649
1,019,428 954,090
10,000 10,000
55,000 55,000
7,065 6,499
105,569 102,496
177,634 173,995
2,428 2,318
180,062 176,313
1,199,490 1,130,403
The notes on pages 16 to 84 are an integral part of these consolidated financial statements.
Investments in associates ...............................................................................
Property and equipment ..................................................................................
Intangible assets .............................................................................................
Consolidated Statement of Financial Position
Cash and balances with Central Bank .............................................................
Assets
Bonds and debt instruments ...........................................................................
Loans to customers .........................................................................................
Derivatives ......................................................................................................
Loans to credit institutions ...............................................................................
Shares and equity instruments ........................................................................
Total Liabilities and Equity
Total Shareholders' Equity
Share capital ...................................................................................................
Non-controlling interests .................................................................................
Share premium ...............................................................................................
Total Equity
Reserves .........................................................................................................
Retained earnings ...........................................................................................
Other assets ...................................................................................................
Derivative instruments and short positions ......................................................
Deposits from customers ................................................................................
Total Assets
Deposits from Central Bank and credit institutions ..........................................
Other liabilities ................................................................................................
Debt issued and other borrowed funds ............................................................
Total Liabilities
Liabilities
Equity
Tax liabilities ...................................................................................................
Subordinated loans .........................................................................................
Íslandsbanki hf. Consolidated Financial Statements 2019 12 Amounts are in ISK million

Liability Total Non-
Share Share Statutory Restricted Fair value credit Retained shareholders' controlling Total
capital premium reserve reserves reserve reserve earnings equity interests equity
Equity as at 1.1.2019 10,000 55,000 2,500 3,750 625 ( 376) 102,496 173,995 2,318 176,313
Profit (loss) for the year ...................................................... 8,809 8,809 ( 355) 8,454
Dividends paid .................................................................... ( 5,300) ( 5,300) ( 5,300)
Net change in fair value of financial assets ......................... 807 807 465 1,272
Net change in fair value of financial liabilities ...................... ( 16) ( 661) ( 677) ( 677)
Restricted due to capitalised development costs ................ ( 551) 551 - -
Restricted due to fair value changes ................................... 308 ( 308) - -
Restricted due to subsidiaries and associates .................... 18 ( 18) - -
Equity as at 31.12.2019 10,000 55,000 2,500 3,525 1,432 ( 392) 105,569 177,634 2,428 180,062
Equity as at 1.1.2018 10,000 55,000 2,500 3,440 239 ( 1,486) 104,760 174,453 2,485 176,938
Profit (loss) for the year ...................................................... 11,036 11,036 ( 391) 10,645
Dividends paid .................................................................... ( 13,000) ( 13,000) ( 13,000)
Net change in fair value of financial assets ......................... 386 386 224 610
Net change in fair value of financial liabilities ...................... 1,110 10 1,120 1,120
Restricted due to capitalised development costs ................ 458 ( 458) - -
Restricted due to fair value changes ................................... 123 ( 123) - -
Restricted due to subsidiaries and associates .................... ( 271) 271 - -
Equity as at 31.12.2018 10,000 55,000 2,500 3,750 625 ( 376) 102,496 173,995 2,318 176,313
The notes on pages 16 to 84 are an integral part of these consolidated financial statements.
Consolidated Statement of Changes in Equity
Authorised share capital of the Bank is 10,000 million ordinary shares of ISK 1 each. At 31.12.2019 paid up share capital totalled ISK 65,000 million which is the total stated share capital of the Bank. The
Bank has one class of ordinary shares which carry no right to fixed income. The Annual General Meeting ("AGM") for the operating year 2018 was held on 21 March 2019. At the AGM shareholders approved
the Board's proposal to pay dividends to shareholders amounting to ISK 5,300 million which is equivalent to ISK 0.53 per share (2018: ISK 1.30 per share). The dividends were paid on 27 March 2019.
Íslandsbanki hf. Consolidated Financial Statements 2019 13 Amounts are in ISK million
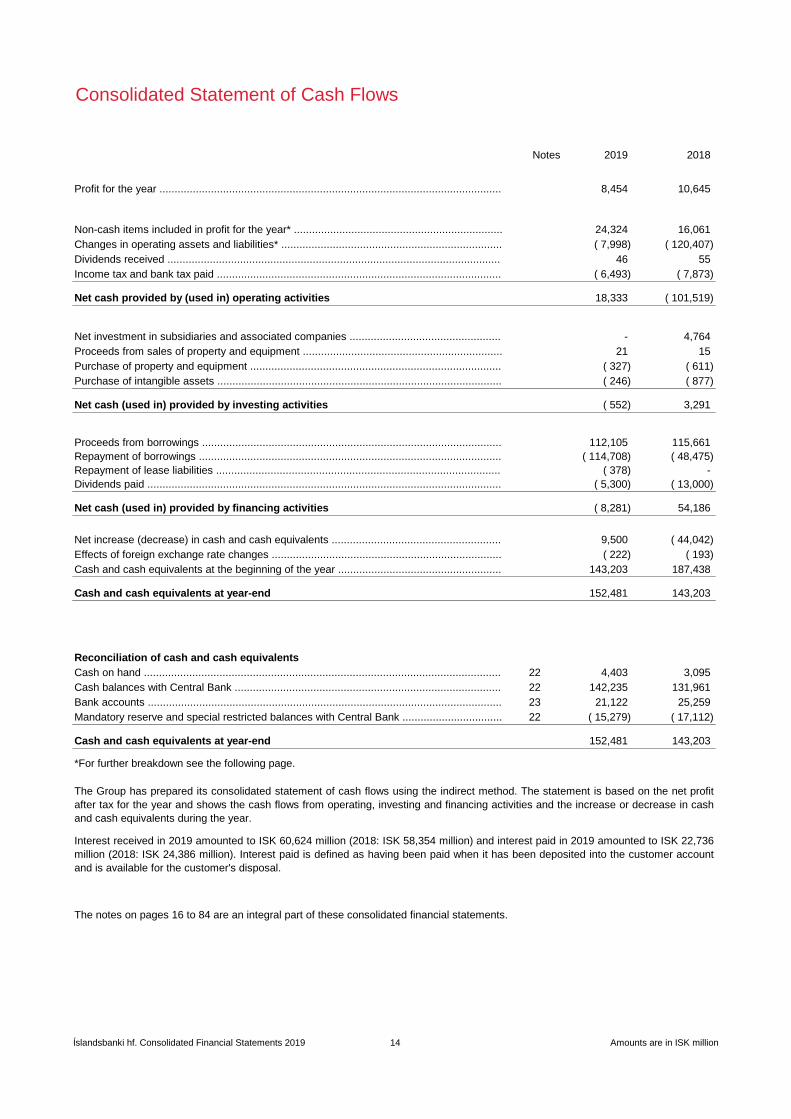
Consolidated Statement of Cash Flows
Notes 2019 2018
8,454 10,645
24,324 16,061
( 7,998) ( 120,407)
46 55
( 6,493) ( 7,873)
Net cash provided by (used in) operating activities 18,333 ( 101,519)
- 4,764
21 15
( 327) ( 611)
( 246) ( 877)
Net cash (used in) provided by investing activities ( 552) 3,291
112,105 115,661
( 114,708) ( 48,475)
( 378) -
( 5,300) ( 13,000)
Net cash (used in) provided by financing activities ( 8,281) 54,186
9,500 ( 44,042)
( 222) ( 193)
143,203 187,438
Cash and cash equivalents at year-end 152,481 143,203
Reconciliation of cash and cash equivalents
22 4,403 3,095
22 142,235 131,961
23 21,122 25,259
22 ( 15,279) ( 17,112)
Cash and cash equivalents at year-end 152,481 143,203
The notes on pages 16 to 84 are an integral part of these consolidated financial statements.
*For further breakdown see the following page.
The Group has prepared its consolidated statement of cash flows using the indirect method. The statement is based on the net profit
after tax for the year and shows the cash flows from operating, investing and financing activities and the increase or decrease in cash
and cash equivalents during the year.
Net investment in subsidiaries and associated companies ..................................................
Proceeds from sales of property and equipment ..................................................................
Purchase of intangible assets ..............................................................................................
Profit for the year .................................................................................................................
Non-cash items included in profit for the year* .....................................................................
Changes in operating assets and liabilities* .........................................................................
Income tax and bank tax paid ..............................................................................................
Dividends received ..............................................................................................................
Purchase of property and equipment ...................................................................................
Cash and cash equivalents at the beginning of the year ......................................................
Repayment of lease liabilities ..............................................................................................
Dividends paid .....................................................................................................................
Effects of foreign exchange rate changes ............................................................................
Net increase (decrease) in cash and cash equivalents ........................................................
Interest received in 2019 amounted to ISK 60,624 million (2018: ISK 58,354 million) and interest paid in 2019 amounted to ISK 22,736
million (2018: ISK 24,386 million). Interest paid is defined as having been paid when it has been deposited into the customer account
and is available for the customer's disposal.
Mandatory reserve and special restricted balances with Central Bank .................................
Cash balances with Central Bank ........................................................................................
Bank accounts .....................................................................................................................
Repayment of borrowings ....................................................................................................
Proceeds from borrowings ...................................................................................................
Cash on hand ......................................................................................................................
Íslandsbanki hf. Consolidated Financial Statements 2019 14 Amounts are in ISK million

Consolidated Statement of Cash Flows
2019 2018
1,960 1,312
( 64) ( 29)
11,450 10,436
3,568 ( 1,634)
( 143) ( 1)
17 ( 1,557)
192 406
125 ( 912)
3,528 3,281
3,682 4,734
9 25
Non-cash items included in profit for the year 24,324 16,061
1,833 454
( 15,268) 767
17,254 ( 38,740)
( 52,638) ( 82,808)
( 3,953) ( 2,411)
1,653 3,455
15,232 4,116
37,678 4,307
( 2,944) ( 2,761)
( 6,845) ( 6,786)
Changes in operating assets and liabilities ( 7,998) ( 120,407)
Non-cash transactions 2019
The notes on pages 16 to 84 are an integral part of these consolidated financial statements.
Accrued interest and fair value changes on debt issued and subordinated loans ...................................
Other changes ........................................................................................................................................
Unrealised fair value loss recognised in profit or loss .............................................................................
Mandatory reserve and special restricted balances with Central Bank ....................................................
Loans to credit institutions ......................................................................................................................
Bonds and debt instruments ...................................................................................................................
Deposits from customers ........................................................................................................................
Shares and equity instruments ...............................................................................................................
Other assets ...........................................................................................................................................
Derivative instruments and short positions .............................................................................................
During the year the Bank repurchased own debt securities amounting to ISK 4,319 million by issuing new debt.
Non-cash transactions 2018
Other liabilities ........................................................................................................................................
The Group recognised right-of-use assets amounting to ISK 4,505 million and the same amount in lease liabilities following the
adoption of IFRS 16 - Leases (see Note 3).
Income tax ..............................................................................................................................................
Net impairment on financial assets .........................................................................................................
Foreign exchange gain ...........................................................................................................................
Net loss (gain) from sales of subsidiaries, property and equipment ........................................................
Depreciation, amortisation and write-offs ................................................................................................
Discontinued operations, net of income tax ............................................................................................
Bank tax .................................................................................................................................................
Share of profit of associates ...................................................................................................................
During the year the Bank repurchased own debt securities amounting to ISK 184 million by issuing new debt.
Loans to customers ................................................................................................................................
Deposits from Central Bank and credit institutions .................................................................................
Íslandsbanki hf. Consolidated Financial Statements 2019 15 Amounts are in ISK million
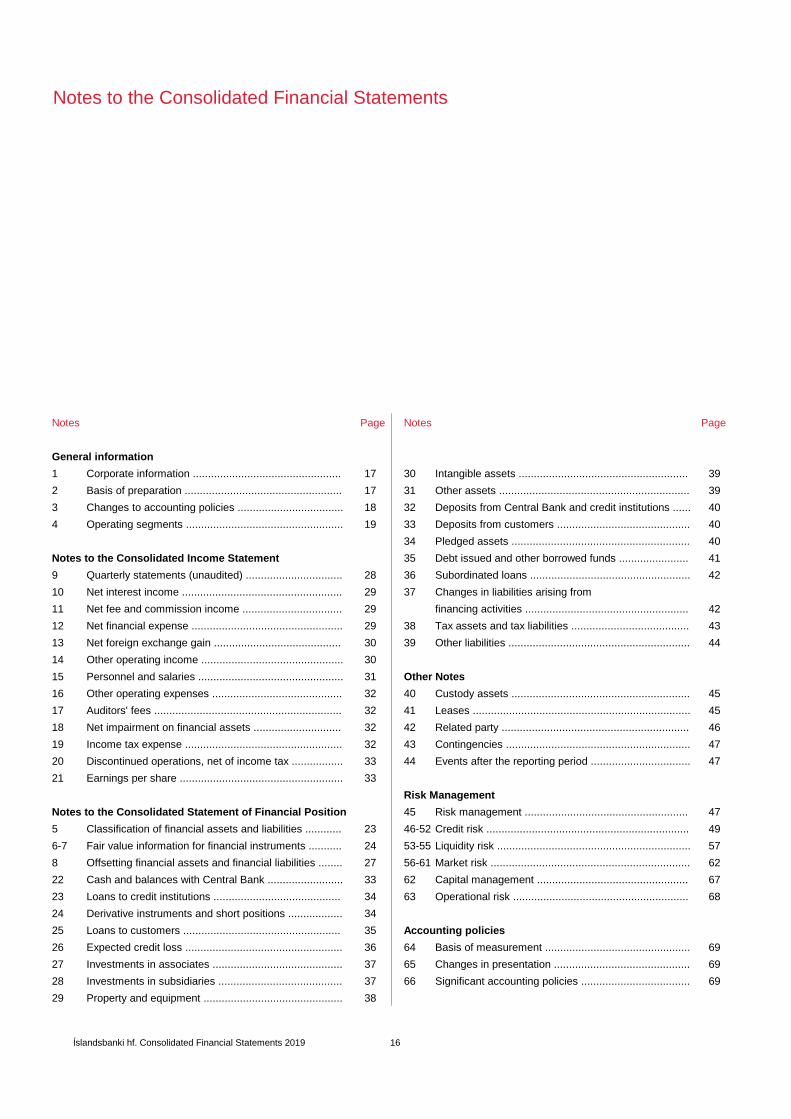
Notes Page Notes Page
General information
1 Corporate information ................................................. 17 30 Intangible assets ........................................................ 39
2 Basis of preparation .................................................... 17 31 Other assets ............................................................... 39
3 Changes to accounting policies ................................... 18 32 Deposits from Central Bank and credit institutions ...... 40
4 Operating segments .................................................... 19 33 Deposits from customers ............................................ 40
34 Pledged assets ........................................................... 40
Notes to the Consolidated Income Statement 35 Debt issued and other borrowed funds ....................... 41
9 Quarterly statements (unaudited) ................................ 28 36 Subordinated loans ..................................................... 42
10 Net interest income ..................................................... 29 37 Changes in liabilities arising from
11 Net fee and commission income ................................. 29 financing activities ...................................................... 42
12 Net financial expense .................................................. 29 38 Tax assets and tax liabilities ....................................... 43
13 Net foreign exchange gain .......................................... 30 39 Other liabilities ............................................................ 44
14 Other operating income ............................................... 30
15 Personnel and salaries ................................................ 31 Other Notes
16 Other operating expenses ........................................... 32 40 Custody assets ........................................................... 45
17 Auditors' fees .............................................................. 32 41 Leases ........................................................................ 45
18 Net impairment on financial assets ............................. 32 42 Related party .............................................................. 46
19 Income tax expense .................................................... 32 43 Contingencies ............................................................. 47
20 Discontinued operations, net of income tax ................. 33 44 Events after the reporting period ................................. 47
21 Earnings per share ...................................................... 33
Risk Management
Notes to the Consolidated Statement of Financial Position 45 Risk management ...................................................... 47
5 Classification of financial assets and liabilities ............ 23 46-52 Credit risk ................................................................... 49
6-7 Fair value information for financial instruments ........... 24 53-55 Liquidity risk ................................................................ 57
8 Offsetting financial assets and financial liabilities ........ 27 56-61 Market risk .................................................................. 62
22 Cash and balances with Central Bank ......................... 33 62 Capital management .................................................. 67
23 Loans to credit institutions .......................................... 34 63 Operational risk .......................................................... 68
24 Derivative instruments and short positions .................. 34
25 Loans to customers .................................................... 35 Accounting policies
26 Expected credit loss .................................................... 36 64 Basis of measurement ................................................ 69
27 Investments in associates ........................................... 37 65 Changes in presentation ............................................. 69
28 Investments in subsidiaries ......................................... 37 66 Significant accounting policies .................................... 69
29 Property and equipment .............................................. 38
Notes to the Consolidated Financial Statements
Íslandsbanki hf. Consolidated Financial Statements 2019 16

Notes to the Consolidated Financial Statements
Íslandsbanki hf. Consolidated Financial Statements 2019 17
18
1. Corporate information
Íslandsbanki hf., the parent company, was incorporated on 8 October 2008 and is a limited liability company domiciled in Iceland. The
address of its registered office is Hagasmári 3, 201 Kópavogur, Iceland.
The consolidated financial statements for the year ended 31 December 2019 ("the consolidated financial statements") comprise the
financial statements of Íslandsbanki hf. ("the Bank" or "Íslandsbanki") and its subsidiaries together referred to as "the Group".
At the end of 2019 the Bank was wholly owned by the Icelandic Government. The shares are administered by the Icelandic State Financial
Investments in accordance with Act no. 88/2009 on Icelandic State Financial Investments.
The Group provides a wide range of financial services such as retail banking, corporate banking, investment banking, wealth
management and asset financing. The Group operates mainly in the Icelandic market.
The consolidated financial statements were approved and authorised for issue by the Board of Directors and the CEO of Íslandsbanki
hf. on 12 February 2020.
2. Basis of preparation
The consolidated financial statements have been prepared in accordance with the International Financial Reporting Standards (IFRS)
as adopted by the European Union and additional requirements in the Act on Annual Accounts no. 3/2006, the Act on Financial
Undertakings no. 161/2002 and rules on accounting for credit institutions.
The consolidated financial statements are presented in Icelandic króna (ISK), which is the functional currency of Íslandsbanki hf. All
amounts presented in ISK have been rounded to the nearest million, except when otherwise indicated. At year-end 2019 the exchange
rate of the ISK against the USD was 121.10 and 135.83 for the EUR (year-end 2018: USD 116.33 and EUR 133.23).
The Group's management has made an assessment of the Group's ability to continue as a going concern and is satisfied that the Group
has the resources to continue in business for the foreseeable future. Therefore, the consolidated financial statements have been prepared
on a going concern basis.
Significant accounting estimates and judgements
The preparation of the consolidated financial statements requires management to make judgements, estimates and assumptions that
affect the application of accounting policies and the reported amounts of assets, liabilities, income and expenses recognised. Actual
results may differ from those estimates.
Estimates and underlying assumptions are regularly review and revised by management as deemed necessary. Changes in accounting
estimates are recognised when they occur.
Impairment of financial assets
The main assumptions used for calculating the allowance for credit losses that are subject to significant judgement include the following:
• Probability of default (PD), loss given default (LGD) and exposure at default (EAD)
• Macroeconomic variables for multiple scenarios build on available information
• Assessment of significant increase in credit risk
The probability of default (PD), exposure at default (EAD), and loss given default (LGD) inputs used to estimate expected credit losses
are modelled based on variables that are most closely related with credit losses in the relevant portfolio. This includes macroeconomic
variables, demographic variables, variables related to past payment history among other variables. These variables are sourced both
internally and externally. Significant judgements required for measuring expected credit loss (ECL) include the following:
• Determining criteria for assessing what constitutes a significant increase in credit risk
• Establishing the forward-looking scenarios and their relative weightings
• Choosing appropriate models and assumptions for the measurement of ECL
The allowance for credit losses is further discussed in Notes 25-26, in Notes 48-50 on risk management and in Note 66.3.
Fair value of financial instruments
The fair value of financial instruments where an active market or quoted prices are not available are decided upon by using estimation
procedures. Financial instruments measured at fair value are classified using a fair value hierarchy that reflects the significance of the
inputs used in making the measurements. Level 3 financial assets are measured at fair value using valuation techniques based on
significant unobservable inputs. The valuation of Level 3 financial assets is subjective as the assumptions on which the valuation is
based on are not easily observable and subject to management's assessment. The valuation techniques are discussed in Notes 6-7 and
in Note 66.3.

Notes to the Consolidated Financial Statements
Íslandsbanki hf. Consolidated Financial Statements 2019 18
18
2. Cont'd
Intangible assets
Intangible assets, except for goodwill, are amortised over four to ten years. Intangible assets are reviewed at each reporting date to
determine whether there is any indication of impairment. The value in use method is used by the Group to determine the recoverable
amount of intangible assets. The following relevant criteria are considered when assessing whether indications of impairment exists:
• A decline in the asset´s market value
• Plans to restructure or liquidate the asset
• The asset generates less income than anticipated
Intangible assets are further discussed in Note 30 and in Note 66.9.
3. Changes to accounting policies
The Group adopted a new IFRS standard, IFRS 16 – Leases, which replaced IAS 17, IFRIC 4, SIC 15 and SIC 27 as of 1 January 2019.
The standard sets out the principles for the recognition, measurement, presentation and disclosure of leases and requires lessees to
account for most leases under a single on-balance sheet model. As a result of the adoption of IFRS 16, the Group has changed its
accounting policy for lease contracts (see Note 66.10).
A number of amendments to IFRS standards were effective from 1 January 2019 but they did not have a material impact on the Group's
consolidated financial statements.
Impact of adoption of IFRS 16
The Group applied IFRS 16 using the modified retrospective approach and therefore the comparative information has not been restated.
The Group's lease liabilities and right-of-use assets at transition were mostly derived from CPI-linked lease commitments for offices,
branches and storage but a small minority stems from lease commitments for land. At transition, ISK 4,505 million were recognised as
lease liabilities and the same amount as right-of-use assets. Lease liabilities were measured at the present value of the remaining lease
payments, discounted with each entity's incremental borrowing rate as at 1 January 2019. The weighted average rate applied by the
Group was 2.14% for CPI-linked leases.
At transition to IFRS 16 the Group elected to apply the practical expedient to apply the standard only to contracts previously identified
as leases under IAS 17. The Group used the following practical expedients; not to recognise right-of-use assets and liabilities for leases
with less than 12 months of lease term and for leases of low-value assets; exclude initial direct costs from measuring right-of-use assets
at the date of initial application, and using hindsight when determining the lease term if the contract contains options to extend or terminate
the lease.
Reconciliation between IAS 17 lease commitments and IFRS 16 lease liabilities as at 1 January 2019
Operating lease commitments at 31 December 2018 as disclosed in the Group's consolidated financial statements ................. 5,143
Effects of discounting operating lease commitments using the incremental borrowing rate ......................................................... ( 593)
Recognition exemption for short-term and low-value asset leases ............................................................................................... ( 61)
Addition for lease commitments for land ........................................................................................................................................ 16
Lease liabilities recognised as at 1 January 2019 4,505
Lessor accounting under IFRS 16 is substantially unchanged from IAS 17. Lessors will continue to classify leases as either operating or
finance leases using similar principles as in IAS 17. Therefore, IFRS 16 did not have an impact on leases where the Group is the lessor.
Changes to IFRS standards issued but not effective at the reporting date
A new IFRS standard and number of amendments to standards have been issued but are not yet effective. The Group did not early
adopt any of them and intends to adopt them when they become effective. Changes that are likely to affect the Group's future financial
reporting are described below, no significant impact is expected.
Interest Rate Benchmark Reform
The Group adopted amendments to IFRS 9 – Financial Instruments, IAS 39 – Financial Instruments: Recognition and Measurement,
and IFRS 7 – Financial Instruments: Disclosures, as of 1 January 2020. The amendments modify certain hedge accounting requirements,
relating to the method that is used to assess the effectiveness of the hedging relationship, to provide relief from potential effect of
uncertainty caused by the Interest Rate Benchmark Reform, prior to the transition to alternative interest rates.
The amendments will not have a significant impact on the Group's consolidated financial statements.

Notes to the Consolidated Financial Statements
Íslandsbanki hf. Consolidated Financial Statements 2019 19
18
3. Cont'd
To manage the transition to alternative interest rates the Bank has set up a working group responsible for the overall transition. A
comprehensive review of legacy contracts has been carried out by the Legal department and new contract language been introduced to
accommodate the benchmark reform. The work on systems and processes, along with education and communication to major
stakeholders, is ongoing. It is expected that financial effects of the transition will be minimal to the Group. The Bank is continually
monitoring developments in the benchmark reform work in jurisdictions affected and will adjust its implementation accordingly, should
the need arise.
4. Operating segments
Segment information is presented in accordance with the Group's management and internal reporting structure. The Bank has three
main business segments: Personal Banking, Business Banking and Corporate & Investment Banking. Operating segments pay and
receive interest to and from Treasury to reflect the allocation of capital, funding costs and the relevant risk premium. The accounting
policies for the reportable segments are in line with the Group's accounting policies. The Group operates mainly in the Icelandic market.
Capital allocation to the business units is 16% of the risk exposure amount (REA) which corresponds to the Bank's CET1 target from the
risk appetite statement. Income tax with breakdown for each segment is according to the current tax rate. Bank tax and contribution to
the Icelandic Depositors' and Investors' Guarantee Fund are shown separately and allocated across segments. The allocation of the
bank tax is based on the expected long-term ratio, as stated in law, or 0.145%.
The Group comprises the following operating segments:
Personal Banking
Personal Banking provides comprehensive financial services to individuals, such as lending, savings and payments. Íslandsbanki's
customers are increasingly taking care of their day-to-day banking via digital solutions such as apps, the online bank and the secure web
chat. Customers can also visit the Bank's efficient branch network for comprehensive consultancy services.
Business Banking
Business Banking provides wide-ranging financial services to small- and medium-sized enterprises. Business Banking is organised
around the branches where it can service its customers close to their own business. In addition, Business Banking operates Ergo, the
asset based financing unit of the Bank.
Corporate & Investment Banking
Corporate & Investment Banking provides universal banking services to large companies, municipalities, institutional investors and
affluent individuals. Services include customised products and services to customers including lending and advisory, risk management,
brokerage and private banking services. The division is sector-focused, building and maintaining relationships with key customer
segments within Iceland. Outside of Iceland, Íslandsbanki has a special focus on the North Atlantic seafood industry, leveraging its
expertise in the domestic market and global contacts.
Treasury and Proprietary Trading
Treasury is responsible for funding the Bank's operations and for managing the internal pricing framework. It is also responsible for the
Bank's balance sheet management and for relations with investors, financial institutions, stock exchanges and rating agencies. Equity
that is not allocated to business units sits within Treasury. Proprietary Trading includes equity and debt investments in the trading book
and banking book.
Cost centres
Cost centres comprise the CEO's office (Human Resources, Marketing & Communications, Strategy, and Legal), Finance excluding
Treasury and Proprietary Trading, IT, Risk Management and Compliance. Group Internal Audit is included in cost centres, however, it is
independent from the Bank and the Chief Audit Executive reports directly to the Bank's Board of Directors.
Subsidiaries, eliminations and adjustments
Subsidiaries include Borgun hf., Íslandssjóðir hf., Allianz Ísland hf. and other less significant subsidiaries (see Note 28).
Following is an overview showing the Group's performance with a breakdown by operating segments. A change from previous years is
that almost all operational results from cost centres have been allocated to the Bank's operating segments. Comparative amounts have
not been restated.

4.
Corporate & Treasury & Subsidiaries,
2019 Personal Business Investment Proprietary Cost The Bank eliminations & The Group
Banking Banking Banking Trading centres total adjustments total
Net interest income .......................................................................... 10,578 10,812 8,397 3,169 ( 251) 32,705 971 33,676
Net fee and commission income ...................................................... 4,504 1,716 3,530 ( 236) 7 9,521 3,838 13,359
Other net operating income ............................................................. 77 25 564 ( 848) 2,197 2,015 ( 555) 1,460
15,159 12,553 12,491 2,085 1,953 44,241 4,254 48,495
Salaries and related expenses ......................................................... ( 2,791) ( 1,993) ( 1,720) ( 253) ( 6,516) ( 13,273) ( 3,006) ( 16,279)
Other operating expenses ................................................................ ( 2,131) ( 1,184) ( 660) ( 257) ( 5,725) ( 9,957) ( 1,871) ( 11,828)
Contribution to the Depositors' and Investors' Guarantee Fund ....... ( 530) ( 314) ( 89) ( 3) - ( 936) - ( 936)
Bank tax .......................................................................................... ( 483) ( 339) ( 486) ( 2,205) ( 15) ( 3,528) - ( 3,528)
Net impairment on financial assets .................................................. ( 547) ( 1,098) ( 1,043) ( 791) - ( 3,479) ( 184) ( 3,663)
Cost allocation ................................................................................. ( 5,606) ( 3,381) ( 3,421) 278 12,130 - - -
3,071 4,244 5,072 ( 1,146) 1,827 13,068 ( 807) 12,261
Income tax expense ......................................................................... ( 924) ( 1,192) ( 1,445) 318 ( 478) ( 3,721) 39 ( 3,682)
Profit (loss) for the year from continuing operations 2,147 3,052 3,627 ( 828) 1,349 9,347 ( 768) 8,579
Net segment revenue from external customers ............................... 18,137 14,492 19,191 ( 9,708) 2,129 44,241 4,254 48,495
Net segment revenue from other segments ..................................... ( 2,978) ( 1,939) ( 6,700) 11,793 ( 176) - - -
Fee and commission income ........................................................... 6,224 1,724 3,574 124 8 11,654 9,372 21,026
Depreciation, amortisation and write-offs ......................................... ( 215) ( 112) ( 21) - ( 1,367) ( 1,715) ( 245) ( 1,960)
At 31 December 2019
Loans to customers ......................................................................... 329,265 230,842 334,788 2 - 894,897 4,735 899,632
Other assets .................................................................................... 3,553 3,085 347 267,384 10,648 285,017 14,841 299,858
Total segment assets 332,818 233,927 335,135 267,386 10,648 1,179,914 19,576 1,199,490
Deposits from customers ................................................................. 290,894 167,623 113,455 49,517 - 621,489 ( 3,176) 618,313
Other liabilities ................................................................................. 1,497 1,822 2,553 374,459 6,209 386,540 14,575 401,115
Total segment liabilities 292,391 169,445 116,008 423,976 6,209 1,008,029 11,399 1,019,428
Allocated equity ............................................................................... 29,981 38,924 58,953 42,882 1,145 171,885 8,177 180,062
Risk exposure amount ..................................................................... 194,601 247,565 367,456 48,063 6,968 864,653 19,897 884,550
The individual segment balance sheet positions are with external customers, and exclude internal transactions thus explaining the differences in total assets and total liabilities and equity.
Cont'd
Notes to the Consolidated Financial Statements
Total operating income
Profit (loss) before tax
Íslandsbanki hf. Consolidated Financial Statements 2019 20 Amounts are in ISK million

4.
Corporate & Treasury & Subsidiaries,
2018 Personal Business Investment Proprietary Cost The Bank eliminations & The Group
Banking Banking Banking Trading centres total adjustments total
Net interest income ........................................................................ 9,946 9,788 7,676 3,649 ( 218) 30,841 1,096 31,937
Net fee and commission income .................................................... 4,564 1,477 3,321 ( 109) 12 9,265 2,962 12,227
Other net operating income ........................................................... 1 41 353 1,070 282 1,747 ( 924) 823
14,511 11,306 11,350 4,610 76 41,853 3,134 44,987
Salaries and related expenses ....................................................... ( 2,585) ( 2,069) ( 1,641) ( 258) ( 6,185) ( 12,738) ( 2,762) ( 15,500)
Other operating expenses .............................................................. ( 2,466) ( 1,062) ( 680) ( 494) ( 5,646) ( 10,348) ( 1,802) ( 12,150)
Contribution to the Depositors' and Investors' Guarantee Fund .... ( 669) ( 395) ( 109) - - ( 1,173) - ( 1,173)
Bank tax ........................................................................................ ( 434) ( 327) ( 470) ( 2,041) ( 9) ( 3,281) - ( 3,281)
Net impairment on financial assets ................................................ 579 955 164 ( 37) - 1,661 ( 77) 1,584
Cost allocation ............................................................................... ( 5,134) ( 2,813) ( 2,660) 423 10,184 - - -
3,802 5,595 5,954 2,203 ( 1,580) 15,974 ( 1,507) 14,467
Income tax expense ....................................................................... ( 989) ( 1,455) ( 1,548) ( 1,280) 411 ( 4,861) 127 ( 4,734)
Profit (loss) for the year from continuing operations 2,813 4,140 4,406 923 ( 1,169) 11,113 ( 1,380) 9,733
14,958 14,996 17,337 ( 5,733) 295 41,853 3,134 44,987
( 447) ( 3,690) ( 5,987) 10,343 ( 219) - - -
5,990 1,612 3,420 133 12 11,167 8,686 19,853
Depreciation, amortisation and write-offs ....................................... ( 275) ( 142) ( 26) ( 38) ( 688) ( 1,169) ( 143) ( 1,312)
At 31 December 2018
Loans to customers ....................................................................... 299,429 219,608 322,974 904 - 842,915 3,684 846,599
Other assets .................................................................................. 1,332 3,151 316 252,085 8,056 264,940 18,864 283,804
Total segment assets 300,761 222,759 323,290 252,989 8,056 1,107,855 22,548 1,130,403
Deposits from customers ............................................................... 275,265 164,738 101,417 42,566 - 583,986 ( 5,027) 578,959
Other liabilities ............................................................................... 1,453 2,811 3,199 345,375 2,317 355,155 19,976 375,131
Total segment liabilities 276,718 167,549 104,616 387,941 2,317 939,141 14,949 954,090
Allocated equity ............................................................................. 24,582 37,304 57,200 48,982 646 168,714 7,599 176,313
Risk exposure amount ................................................................... 164,795 239,073 360,923 61,986 3,316 830,093 15,856 845,949
Fee and commission income .........................................................
Notes to the Consolidated Financial Statements
Cont'd
Total operating income
Profit (loss) before tax
Net segment revenue from external customers ..............................
Net segment revenue from other segments ...................................
Íslandsbanki hf. Consolidated Financial Statements 2019 21 Amounts are in ISK million
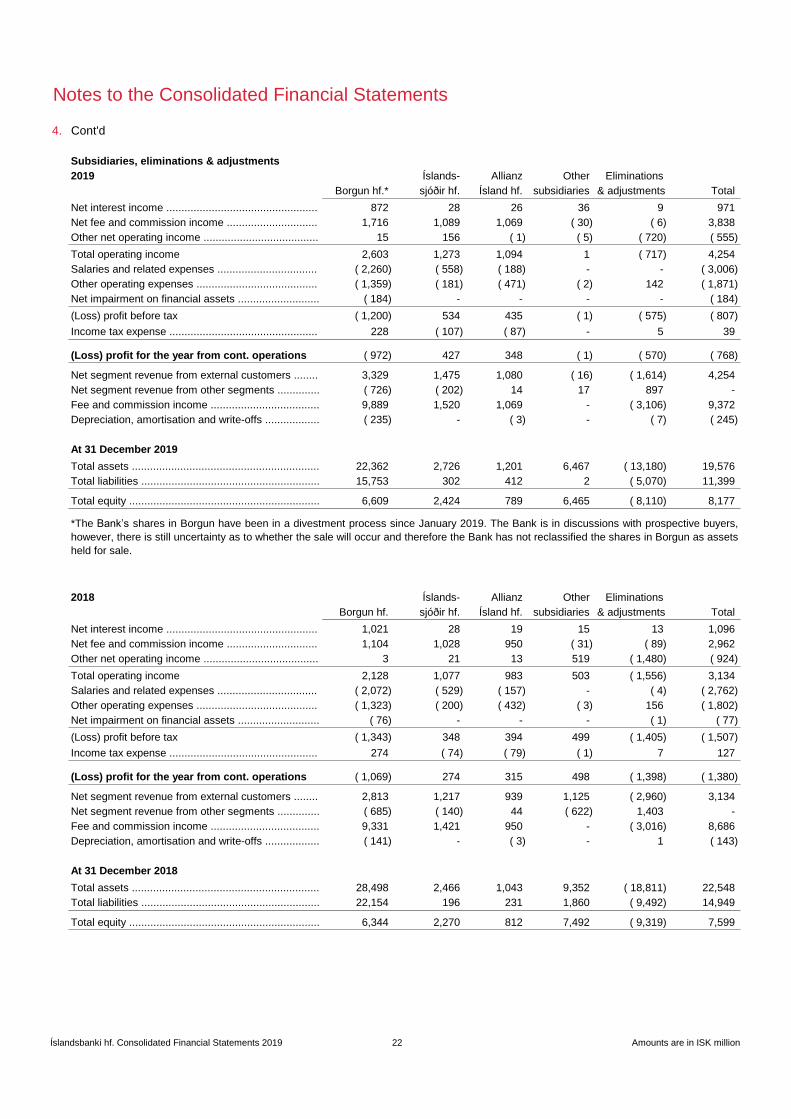
4.
Subsidiaries, eliminations & adjustments
2019 Íslands- Allianz Other Eliminations
Borgun hf.* sjóðir hf. Ísland hf. subsidiaries & adjustments Total
Net interest income .................................................. 872 28 26 36 9 971
Net fee and commission income .............................. 1,716 1,089 1,069 ( 30) ( 6) 3,838
Other net operating income ...................................... 15 156 ( 1) ( 5) ( 720) ( 555)
Total operating income 2,603 1,273 1,094 1 ( 717) 4,254
Salaries and related expenses ................................. ( 2,260) ( 558) ( 188) - - ( 3,006)
Other operating expenses ........................................ ( 1,359) ( 181) ( 471) ( 2) 142 ( 1,871)
Net impairment on financial assets ........................... ( 184) - - - - ( 184)
(Loss) profit before tax ( 1,200) 534 435 ( 1) ( 575) ( 807)
Income tax expense ................................................. 228 ( 107) ( 87) - 5 39
(Loss) profit for the year from cont. operations ( 972) 427 348 ( 1) ( 570) ( 768)
Net segment revenue from external customers ........ 3,329 1,475 1,080 ( 16) ( 1,614) 4,254
Net segment revenue from other segments .............. ( 726) ( 202) 14 17 897 -
Fee and commission income .................................... 9,889 1,520 1,069 - ( 3,106) 9,372
Depreciation, amortisation and write-offs .................. ( 235) - ( 3) - ( 7) ( 245)
At 31 December 2019
Total assets .............................................................. 22,362 2,726 1,201 6,467 ( 13,180) 19,576
Total liabilities ........................................................... 15,753 302 412 2 ( 5,070) 11,399
Total equity ............................................................... 6,609 2,424 789 6,465 ( 8,110) 8,177
2018 Íslands- Allianz Other Eliminations
Borgun hf. sjóðir hf. Ísland hf. subsidiaries & adjustments Total
Net interest income .................................................. 1,021 28 19 15 13 1,096
Net fee and commission income .............................. 1,104 1,028 950 ( 31) ( 89) 2,962
Other net operating income ...................................... 3 21 13 519 ( 1,480) ( 924)
Total operating income 2,128 1,077 983 503 ( 1,556) 3,134
Salaries and related expenses ................................. ( 2,072) ( 529) ( 157) - ( 4) ( 2,762)
Other operating expenses ........................................ ( 1,323) ( 200) ( 432) ( 3) 156 ( 1,802)
Net impairment on financial assets ........................... ( 76) - - - ( 1) ( 77)
(Loss) profit before tax ( 1,343) 348 394 499 ( 1,405) ( 1,507)
Income tax expense ................................................. 274 ( 74) ( 79) ( 1) 7 127
(Loss) profit for the year from cont. operations ( 1,069) 274 315 498 ( 1,398) ( 1,380)
Net segment revenue from external customers ........ 2,813 1,217 939 1,125 ( 2,960) 3,134
Net segment revenue from other segments .............. ( 685) ( 140) 44 ( 622) 1,403 -
Fee and commission income .................................... 9,331 1,421 950 - ( 3,016) 8,686
Depreciation, amortisation and write-offs .................. ( 141) - ( 3) - 1 ( 143)
At 31 December 2018
Total assets .............................................................. 28,498 2,466 1,043 9,352 ( 18,811) 22,548
Total liabilities ........................................................... 22,154 196 231 1,860 ( 9,492) 14,949
Total equity ............................................................... 6,344 2,270 812 7,492 ( 9,319) 7,599
Notes to the Consolidated Financial Statements
Cont'd
*The Bank’s shares in Borgun have been in a divestment process since January 2019. The Bank is in discussions with prospective buyers,
however, there is still uncertainty as to whether the sale will occur and therefore the Bank has not reclassified the shares in Borgun as assets
held for sale.
Íslandsbanki hf. Consolidated Financial Statements 2019 22 Amounts are in ISK million

5. Classification of financial assets and financial liabilities
At 31 December 2019 Mandatorily Held for Designated Fair value Amortised Carrying
at FVTPL hedging as at FVTPL through OCI cost amount
- - - - 146,638 146,638
- - - - 54,376 54,376
33,302 - - - - 33,302
18,220 - - - - 18,220
1,348 - - - - 1,348
4,700 921 - - - 5,621
- - - - 899,632 899,632
3,779 - - - - 3,779
8,681 - - - - 8,681
2,851 - - 3,115 - 5,966
- - - - 5,757 5,757
Total financial assets 72,881 921 - 3,115 1,106,403 1,183,320
- - - - 30,925 30,925
- - - - 618,313 618,313
6,219 - - - - 6,219
- 41,816 49,352 - 215,213 306,381
- - - - 22,674 22,674
- - - - 24,772 24,772
Total financial liabilities 6,219 41,816 49,352 - 911,897 1,009,284
At 31 December 2018 Mandatorily Held for Designated Fair value Amortised Carrying
at FVTPL hedging as at FVTPL through OCI cost amount
- - - - 135,056 135,056
- - - - 41,577 41,577
45,496 - - - - 45,496
22,405 - - - - 22,405
1,514 - - - - 1,514
3,923 627 - - - 4,550
- - - - 846,599 846,599
2,928 - - - - 2,928
5,458 - - - - 5,458
2,846 - - 1,842 - 4,688
- - - - 7,511 7,511
Total financial assets 84,570 627 - 1,842 1,030,743 1,117,782
- - - - 15,619 15,619
- - - - 578,959 578,959
5,521 - - - - 5,521
- 40,714 68,154 - 192,108 300,976
- - - - 16,216 16,216
- - - - 27,186 27,186
Total financial liabilities 5,521 40,714 68,154 - 830,088 944,477
Derivatives ....................................................................................
Listed bonds and debt instruments used for economic hedging ....
Loans to credit institutions ............................................................
Deposits from customers ..............................................................
Notes to the Consolidated Financial Statements
Cash and balances with Central Bank ..........................................
Listed bonds and debt instruments ...............................................
Unlisted bonds and debt instruments ............................................
Derivatives ....................................................................................
Loans to customers ......................................................................
Other financial assets ...................................................................
Deposits from Central Bank and credit institutions ........................
Listed bonds and debt instruments used for economic hedging ....
Other financial liabilities ................................................................
Other financial assets ...................................................................
Deposits from Central Bank and credit institutions ........................
Deposits from customers ..............................................................
Derivative instruments and short positions ....................................
Debt issued and other borrowed funds .........................................
Subordinated loans .......................................................................
Listed shares and equity instruments ............................................
Listed shares and equity instruments used for economic hedging
Unlisted shares and equity instruments ........................................
Loans to credit institutions ............................................................
Listed shares and equity instruments ............................................
Listed shares and equity instruments used for economic hedging
Unlisted shares and equity instruments ........................................
Loans to customers ......................................................................
Derivative instruments and short positions ....................................
Debt issued and other borrowed funds .........................................
Subordinated loans .......................................................................
Other financial liabilities ................................................................
Cash and balances with Central Bank ..........................................
Listed bonds and debt instruments ...............................................
Unlisted bonds and debt instruments ............................................
Íslandsbanki hf. Consolidated Financial Statements 2019 23 Amounts are in ISK million
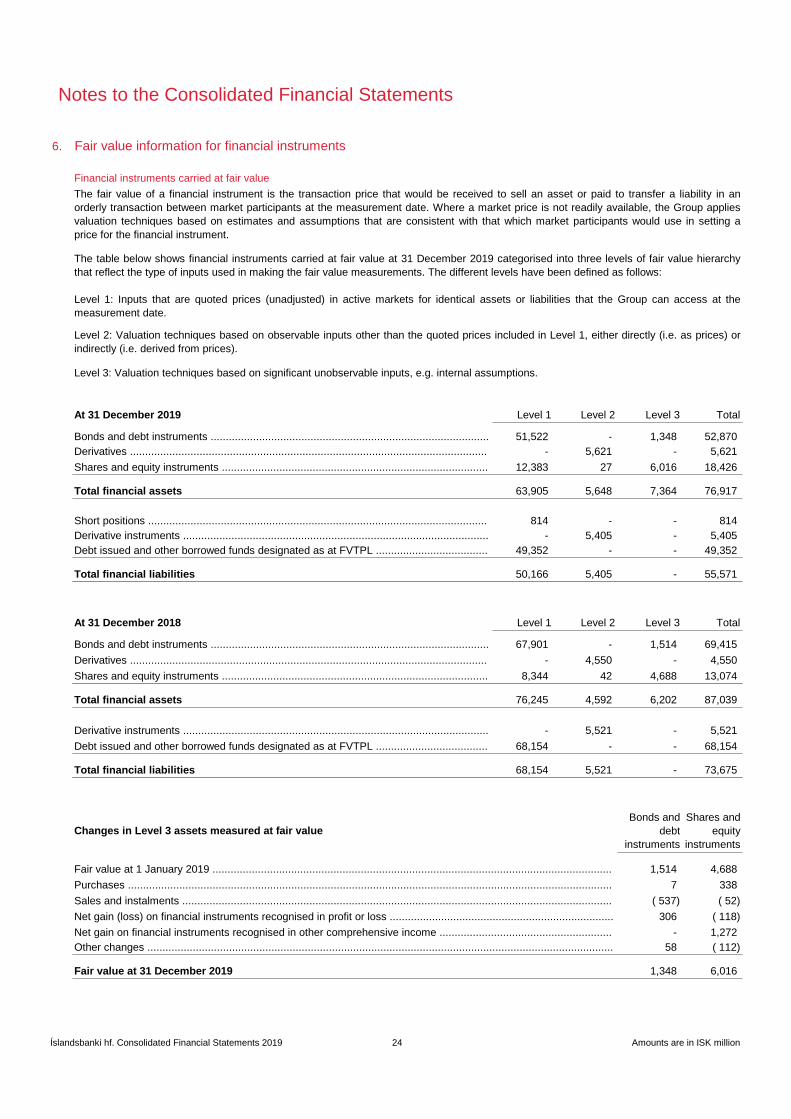
6. Fair value information for financial instruments
At 31 December 2019 Level 1 Level 2 Level 3 Total
51,522 - 1,348 52,870
- 5,621 - 5,621
12,383 27 6,016 18,426
63,905 5,648 7,364 76,917
814 - - 814
- 5,405 - 5,405
49,352 - - 49,352
50,166 5,405 - 55,571
At 31 December 2018 Level 1 Level 2 Level 3 Total
67,901 - 1,514 69,415
- 4,550 - 4,550
8,344 42 4,688 13,074
76,245 4,592 6,202 87,039
- 5,521 - 5,521
68,154 - - 68,154
68,154 5,521 - 73,675
Bonds and
debt
instruments
Shares and
equity
instruments
1,514 4,688
7 338
( 537) ( 52)
306 ( 118)
- 1,272
58 ( 112)
1,348 6,016
Net gain on financial instruments recognised in other comprehensive income .........................................................
Short positions ................................................................................................................
Bonds and debt instruments ............................................................................................
Shares and equity instruments ........................................................................................
Total financial assets
Sales and instalments ..............................................................................................................................................
Derivative instruments .....................................................................................................
Debt issued and other borrowed funds designated as at FVTPL .....................................
Total financial liabilities
Changes in Level 3 assets measured at fair value
Fair value at 1 January 2019 ....................................................................................................................................
Purchases ................................................................................................................................................................
Derivatives ......................................................................................................................
Notes to the Consolidated Financial Statements
Financial instruments carried at fair value
The fair value of a financial instrument is the transaction price that would be received to sell an asset or paid to transfer a liability in an
orderly transaction between market participants at the measurement date. Where a market price is not readily available, the Group applies
valuation techniques based on estimates and assumptions that are consistent with that which market participants would use in setting a
price for the financial instrument.
The table below shows financial instruments carried at fair value at 31 December 2019 categorised into three levels of fair value hierarchy
that reflect the type of inputs used in making the fair value measurements. The different levels have been defined as follows:
Level 1: Inputs that are quoted prices (unadjusted) in active markets for identical assets or liabilities that the Group can access at the
measurement date.
Total financial assets
Level 2: Valuation techniques based on observable inputs other than the quoted prices included in Level 1, either directly (i.e. as prices) or
indirectly (i.e. derived from prices).
Level 3: Valuation techniques based on significant unobservable inputs, e.g. internal assumptions.
Net gain (loss) on financial instruments recognised in profit or loss ..........................................................................
Bonds and debt instruments ............................................................................................
Other changes ..........................................................................................................................................................
Total financial liabilities
Derivatives ......................................................................................................................
Shares and equity instruments ........................................................................................
Derivative instruments .....................................................................................................
Fair value at 31 December 2019
Debt issued and other borrowed funds designated as at FVTPL .....................................
Íslandsbanki hf. Consolidated Financial Statements 2019 24 Amounts are in ISK million
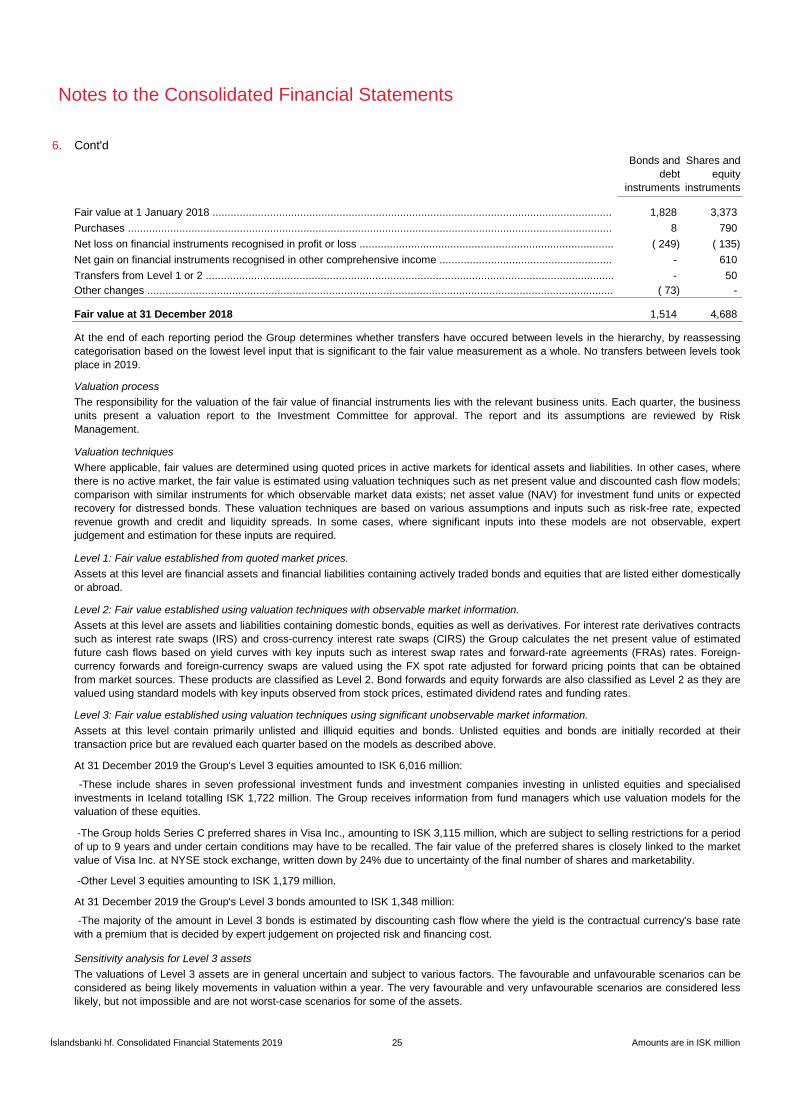
Notes to the Consolidated Financial Statements
6.
Bonds and
debt
instruments
Shares and
equity
instruments
1,828 3,373
8 790
( 249) ( 135)
- 610
- 50
( 73) -
1,514 4,688
Purchases ................................................................................................................................................................
Net loss on financial instruments recognised in profit or loss ....................................................................................
Valuation process
Cont'd
Fair value at 1 January 2018 ....................................................................................................................................
Net gain on financial instruments recognised in other comprehensive income .........................................................
Level 3: Fair value established using valuation techniques using significant unobservable market information.
Assets at this level are assets and liabilities containing domestic bonds, equities as well as derivatives. For interest rate derivatives contracts
such as interest rate swaps (IRS) and cross-currency interest rate swaps (CIRS) the Group calculates the net present value of estimated
future cash flows based on yield curves with key inputs such as interest swap rates and forward-rate agreements (FRAs) rates. Foreign-
currency forwards and foreign-currency swaps are valued using the FX spot rate adjusted for forward pricing points that can be obtained
from market sources. These products are classified as Level 2. Bond forwards and equity forwards are also classified as Level 2 as they are
valued using standard models with key inputs observed from stock prices, estimated dividend rates and funding rates.
Assets at this level contain primarily unlisted and illiquid equities and bonds. Unlisted equities and bonds are initially recorded at their
transaction price but are revalued each quarter based on the models as described above.
Level 2: Fair value established using valuation techniques with observable market information.
Where applicable, fair values are determined using quoted prices in active markets for identical assets and liabilities. In other cases, where
there is no active market, the fair value is estimated using valuation techniques such as net present value and discounted cash flow models;
comparison with similar instruments for which observable market data exists; net asset value (NAV) for investment fund units or expected
recovery for distressed bonds. These valuation techniques are based on various assumptions and inputs such as risk-free rate, expected
revenue growth and credit and liquidity spreads. In some cases, where significant inputs into these models are not observable, expert
judgement and estimation for these inputs are required.
Level 1: Fair value established from quoted market prices.
At the end of each reporting period the Group determines whether transfers have occured between levels in the hierarchy, by reassessing
categorisation based on the lowest level input that is significant to the fair value measurement as a whole. No transfers between levels took
place in 2019.
Fair value at 31 December 2018
-These include shares in seven professional investment funds and investment companies investing in unlisted equities and specialised
investments in Iceland totalling ISK 1,722 million. The Group receives information from fund managers which use valuation models for the
valuation of these equities.
The valuations of Level 3 assets are in general uncertain and subject to various factors. The favourable and unfavourable scenarios can be
considered as being likely movements in valuation within a year. The very favourable and very unfavourable scenarios are considered less
likely, but not impossible and are not worst-case scenarios for some of the assets.
The responsibility for the valuation of the fair value of financial instruments lies with the relevant business units. Each quarter, the business
units present a valuation report to the Investment Committee for approval. The report and its assumptions are reviewed by Risk
Management.
-Other Level 3 equities amounting to ISK 1,179 million.
Other changes ..........................................................................................................................................................
Transfers from Level 1 or 2 .......................................................................................................................................
Assets at this level are financial assets and financial liabilities containing actively traded bonds and equities that are listed either domestically
or abroad.
At 31 December 2019 the Group's Level 3 equities amounted to ISK 6,016 million:
At 31 December 2019 the Group's Level 3 bonds amounted to ISK 1,348 million:
Valuation techniques
-The majority of the amount in Level 3 bonds is estimated by discounting cash flow where the yield is the contractual currency's base rate
with a premium that is decided by expert judgement on projected risk and financing cost.
-The Group holds Series C preferred shares in Visa Inc., amounting to ISK 3,115 million, which are subject to selling restrictions for a period
of up to 9 years and under certain conditions may have to be recalled. The fair value of the preferred shares is closely linked to the market
value of Visa Inc. at NYSE stock exchange, written down by 24% due to uncertainty of the final number of shares and marketability.
Sensitivity analysis for Level 3 assets
Íslandsbanki hf. Consolidated Financial Statements 2019 25 Amounts are in ISK million

Notes to the Consolidated Financial Statements
6.
Carrying
amount
Very
favourable Favourable Unfavourable
Very
unfavour-
able
1,348 330 257 ( 296) ( 1,348)
2,901 2,399 645 ( 762) ( 1,614)
3,115 1,246 623 ( 623) ( 1,246)
7.
Total fair Carrying
At 31 December 2019 Level 1 Level 2 Level 3 value amount
- 146,638 - 146,638 146,638
- 54,376 - 54,376 54,376
- - 902,053 902,053 899,632
- 5,757 - 5,757 5,757
Total financial assets - 206,771 902,053 1,108,824 1,106,403
- 31,027 - 31,027 30,925
- 618,592 - 618,592 618,313
165,044 100,334 - 265,378 257,029
22,626 - - 22,626 22,674
- 24,772 - 24,772 24,772
Total financial liabilities 187,670 774,725 - 962,395 953,713
Subordinated loans .....................................................................................
Other financial liabilities ..............................................................................
Liabilities
Level 3 Bonds and debt instruments ...........................................................
Level 3 Shares and equity instruments .......................................................
Cont'd
Effect on profit or (loss):
Observed market value is used for the fair value of "Debt issued and other borrowed funds" where it is available. Issued bonds and bills with
quoted market prices are classified as Level 1. If there is no quoted market price the fair value of the debt is valued in the same manner as
deposits if it carries a fixed rate. If the debt carries a floating rate its fair value is estimated by comparing the margin with the Group's current
funding premium on similar debt. These liabilities are classified as Level 2. The funding premium is based on the interest margin in the
Group's issued papers including covered bonds, commercial papers as well as foreign currency denominated bonds.
The fair value of a financial liability with a demand feature, such as a demand deposit, is not less than the amount payable on demand,
discounted from the first date that the amount could be required to be paid. Most deposits are on demand or carry floating interest rates and
as such their carrying amount is considered a good approximation of their fair value. The fair value for longer term fixed rate deposits is
calculated with a duration approach, using the difference in each liability's current interest rate from the rate that a similar deposit would carry
today. All deposits are classified as Level 2 based on the use of observable market interest rates to estimate the fair value.
Debt issued and other borrowed funds ........................................................
Cash and balances with Central Bank .........................................................
Other financial assets .................................................................................
Deposits from Central Bank and credit institutions ......................................
The following table shows the fair value measurement and classification of the Group's assets and liabilities not carried at fair value. The
different levels are defined in Note 6.
Deposits from customers ............................................................................
Other financial liabilities mainly include unsettled securities transactions, payments due to leasing contracts and liabilities to retailers for
credit card provisions and they are classified as Level 2 since their value is not observable from active market prices. Due to the short-term
nature of these liabilities their carrying amount is considered a good approximation of their fair value.
Financial instruments not carried at fair value
Assets
The fair value of “Loans to customers” may differ from their net carrying amount because the interest rates they carry may not reflect the
interest rates that similar new loans would carry. The fair value is estimated by subtracting from or adding to the net carrying amount of the
loans the discounted interest rate difference calculated from the reporting date until the next interest reset or maturity, whichever comes first.
Since the interest rate difference is estimated using internal models these assets are classified as Level 3.
For “Cash and balances with Central Bank”, “Loans to credit institutions” and “Other financial assets” the fair value is adequately
approximated by the carrying amount as they are short-term in nature. They are thus classified as Level 2.
Loans to credit institutions ...........................................................................
Loans to customers .....................................................................................
The table below shows how profit (loss) and total comprehensive income would have been affected if one or more of the inputs for fair value
measurement in Level 3 were changed.
Effect on comprehensive income:
Level 3 Shares in Visa Inc. ..........................................................................
Íslandsbanki hf. Consolidated Financial Statements 2019 26 Amounts are in ISK million

Notes to the Consolidated Financial Statements
7.
Total fair Carrying
At 31 December 2018 Level 1 Level 2 Level 3 value amount
- 135,056 - 135,056 135,056
- 41,577 - 41,577 41,577
- - 848,751 848,751 846,599
- 7,511 - 7,511 7,511
Total financial assets - 184,144 848,751 1,032,895 1,030,743
- 15,633 - 15,633 15,619
- 579,232 - 579,232 578,959
151,767 84,476 - 236,243 232,822
16,167 - - 16,167 16,216
- 27,186 - 27,186 27,186
Total financial liabilities 167,934 706,527 - 874,461 870,802
8. Offsetting financial assets and financial liabilities
At 31 December 2019
Financial
assets
before
netting
Netting
with
financial
liabilities
Net financial
assets
Financial
liabilities
Cash
collateral
received
Financial
instruments
collateral
received
Net amount after
consideration of
potential effect
of netting
arrangements
Assets outside
the scope of
offsetting
disclosure
requirements
Total financial
assets
recognised in
the balance
sheet
1,114 - 1,114 - - - 1,114 - 1,114
5,621 - 5,621 ( 1,374) ( 3,146) ( 88) 1,013 - 5,621
6,735 - 6,735 ( 1,374) ( 3,146) ( 88) 2,127 - 6,735
At 31 December 2018
153 - 153 - - - 153 - 153
4,550 - 4,550 ( 1,655) ( 1,383) ( 698) 814 - 4,550
4,703 - 4,703 ( 1,655) ( 1,383) ( 698) 967 - 4,703
At 31 December 2019
Financial
liabilities
before
netting
Netting
with
financial
assets
Net financial
liabilities
Financial
assets
Cash
collateral
pledged
Financial
instruments
collateral
pledged
Net amount after
consideration of
potential effect
of netting
arrangements
Liabilities
outside the
scope of
offsetting
disclosure
requirements
Total financial
liabilities
recognised in
the balance
sheet
Derivative instruments and
6,219 - 6,219 ( 1,374) ( 1,139) - 3,706 - 6,219
At 31 December 2018
Derivative instruments and
5,521 - 5,521 ( 1,655) ( 85) - 3,781 - 5,521
Cash and balances with Central Bank .........................................................
Financial liabilities subject to
netting arrangements
Amounts not set off but subject to master
netting arrangements and similar
agreements
Other financial assets .................................................................................
Derivatives ....................................
Total assets
Subordinated loans .....................................................................................
Other financial liabilities ..............................................................................
Reverse repurchase agreements ..
Reverse repurchase agreements ..
short positions ...............................
short positions ...............................
Derivatives ....................................
Total assets
Debt issued and other borrowed funds ........................................................
Deposits from customers ............................................................................
Deposits from Central Bank and credit institutions ......................................
Loans to customers .....................................................................................
Loans to credit institutions ...........................................................................
Cont'd
The tables below show reconciliation to the net amounts of financial assets and financial liabilities, which are subject to offsetting,
enforceable master netting agreements and similar agreements.
Financial assets subject to
netting arrangements
Amounts not set off but subject to master
netting arrangements and similar
agreements
Íslandsbanki hf. Consolidated Financial Statements 2019 27 Amounts are in ISK million

Notes to the Consolidated Financial Statements
9. Quarterly statements (unaudited)
2019 Q4 Q3 Q2 Q1 Total
8,486 8,412 8,626 8,152 33,676
3,646 3,090 3,406 3,217 13,359
( 840) ( 598) 173 448 ( 817)
97 147 ( 71) ( 30) 143
917 44 29 1,144 2,134
( 4,196) ( 3,720) ( 4,312) ( 4,051) ( 16,279)
( 3,130) ( 2,698) ( 2,961) ( 3,039) ( 11,828)
( 216) ( 210) ( 198) ( 312) ( 936)
( 814) ( 900) ( 934) ( 880) ( 3,528)
( 1,585) ( 230) ( 929) ( 919) ( 3,663)
2,365 3,337 2,829 3,730 12,261
( 611) ( 1,292) ( 626) ( 1,153) ( 3,682)
1,754 2,045 2,203 2,577 8,579
( 95) 41 ( 83) 12 ( 125)
Profit for the period 1,659 2,086 2,120 2,589 8,454
2018 Q4 Q3 Q2 Q1 Total
8,294 8,301 7,602 7,740 31,937
3,478 2,939 3,032 2,778 12,227
( 637) ( 420) 378 ( 283) ( 962)
76 ( 8) ( 57) ( 10) 1
120 64 1,587 13 1,784
( 4,047) ( 3,501) ( 4,026) ( 3,926) ( 15,500)
( 3,418) ( 2,962) ( 2,846) ( 2,924) ( 12,150)
( 299) ( 295) ( 287) ( 292) ( 1,173)
( 740) ( 944) ( 812) ( 785) ( 3,281)
( 297) ( 53) 1,846 88 1,584
2,530 3,121 6,417 2,399 14,467
( 1,118) ( 1,136) ( 1,465) ( 1,015) ( 4,734)
1,412 1,985 4,952 1,384 9,733
( 8) 126 81 713 912
Profit for the period 1,404 2,111 5,033 2,097 10,645
Discontinued operations, net of income tax .................................................
Net interest income .....................................................................................
Net fee and commission income .................................................................
Net financial (expense) income ...................................................................
Net foreign exchange gain (loss) .................................................................
Other operating income ...............................................................................
Salaries and related expenses ....................................................................
Other operating expenses ...........................................................................
Contribution to the Depositors' and Investors' Guarantee Fund ...................
Bank tax ......................................................................................................
Net impairment on financial assets .............................................................
Profit before tax ...........................................................................................
Income tax expense ....................................................................................
Profit for the period from continuing operations ...........................................
Discontinued operations, net of income tax .................................................
Bank tax ......................................................................................................
Net impairment on financial assets .............................................................
Profit before tax ...........................................................................................
Income tax expense ....................................................................................
Profit for the period from continuing operations ...........................................
Salaries and related expenses ....................................................................
Other operating expenses ...........................................................................
Contribution to the Depositors' and Investors' Guarantee Fund ...................
Net foreign exchange gain (loss) .................................................................
Other operating income ...............................................................................
Net fee and commission income .................................................................
Net interest income .....................................................................................
Net financial (expense) income ...................................................................
Íslandsbanki hf. Consolidated Financial Statements 2019 28 Amounts are in ISK million

Notes to the Consolidated Financial Statements
10. Net interest income
2019 2018
4,755 7,279
55,368 52,462
2,630 1,825
93 109
Total interest income 62,846 61,675
( 625) ( 409)
( 15,241) ( 16,539)
( 734) ( 963)
( 9,823) ( 9,035)
( 501) ( 198)
( 2,246) ( 2,594)
Total interest expense ( 29,170) ( 29,738)
Net interest income 33,676 31,937
*Thereof is lease liabilities' interest expense amounting to ISK 94 million.
Net interest margin on total assets 2.8% (2018: 2.9%).
11. Net fee and commission income
2019 2018
2,225 2,116
2,430 2,303
12,783 12,065
1,510 1,467
2,078 1,902
Total fee and commission income 21,026 19,853
( 337) ( 300)
( 7,293) ( 7,302)
( 37) ( 24)
Total fee and commission expense ( 7,667) ( 7,626)
Net fee and commission income 13,359 12,227
Fee and commission income by segment is disclosed in Note 4.
12. Net financial expense
2019 2018
( 419) ( 720)
( 399) ( 240)
1 ( 2)
Net financial expense ( 817) ( 962)
Asset management ..................................................................................................................................................
Investment banking and brokerage ...........................................................................................................................
Payment processing .................................................................................................................................................
Loans and guarantees ..............................................................................................................................................
Other fee and commission income ...........................................................................................................................
Brokerage .................................................................................................................................................................
Clearing and settlement ............................................................................................................................................
Other fee and commission expense .........................................................................................................................
Cash and balances with Central Bank ......................................................................................................................
Loans at amortised cost ...........................................................................................................................................
Financial assets mandatorily at fair value through profit or loss ................................................................................
Other interest expense* ............................................................................................................................................
Deposits from Central Bank and credit institutions ....................................................................................................
Deposits from customers ..........................................................................................................................................
Debt issued and other borrowed funds at fair value through profit or loss .................................................................
Debt issued and other borrowed funds at amortised cost .........................................................................................
Subordinated loans ...................................................................................................................................................
Net gain (loss) on fair value hedges ..........................................................................................................................
Net loss on financial assets and liabilities mandatorily at FVTPL ..............................................................................
Net loss on financial liabilities designated as at FVTPL ............................................................................................
Other assets .............................................................................................................................................................
Íslandsbanki hf. Consolidated Financial Statements 2019 29 Amounts are in ISK million
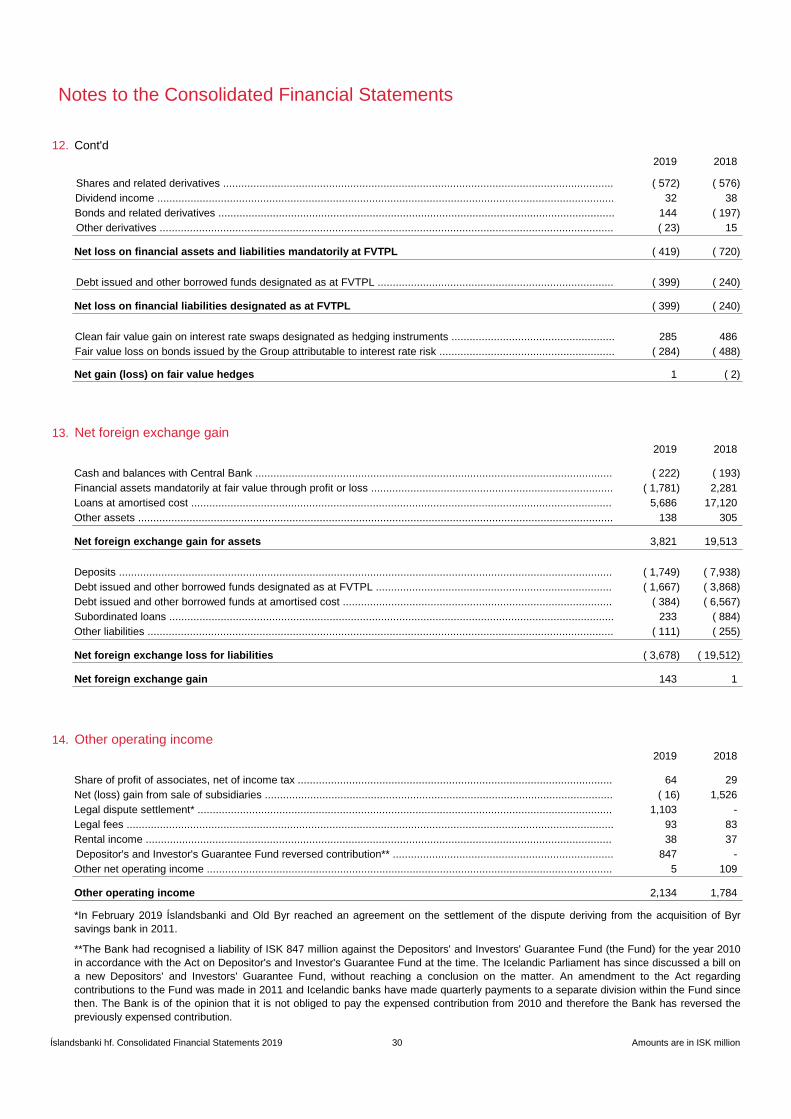
Notes to the Consolidated Financial Statements
12.
2019 2018
( 572) ( 576)
32 38
144 ( 197)
( 23) 15
Net loss on financial assets and liabilities mandatorily at FVTPL ( 419) ( 720)
( 399) ( 240)
Net loss on financial liabilities designated as at FVTPL ( 399) ( 240)
285 486
( 284) ( 488)
Net gain (loss) on fair value hedges 1 ( 2)
13. Net foreign exchange gain
2019 2018
( 222) ( 193)
( 1,781) 2,281
5,686 17,120
138 305
Net foreign exchange gain for assets 3,821 19,513
( 1,749) ( 7,938)
( 1,667) ( 3,868)
( 384) ( 6,567)
233 ( 884)
( 111) ( 255)
Net foreign exchange loss for liabilities ( 3,678) ( 19,512)
Net foreign exchange gain 143 1
14. Other operating income
2019 2018
64 29
( 16) 1,526
1,103 -
93 83
38 37
847 -
5 109
Other operating income 2,134 1,784
*In February 2019 Íslandsbanki and Old Byr reached an agreement on the settlement of the dispute deriving from the acquisition of Byr
savings bank in 2011.
**The Bank had recognised a liability of ISK 847 million against the Depositors' and Investors' Guarantee Fund (the Fund) for the year 2010
in accordance with the Act on Depositor's and Investor's Guarantee Fund at the time. The Icelandic Parliament has since discussed a bill on
a new Depositors' and Investors' Guarantee Fund, without reaching a conclusion on the matter. An amendment to the Act regarding
contributions to the Fund was made in 2011 and Icelandic banks have made quarterly payments to a separate division within the Fund since
then. The Bank is of the opinion that it is not obliged to pay the expensed contribution from 2010 and therefore the Bank has reversed the
previously expensed contribution.
Other net operating income ......................................................................................................................................
Clean fair value gain on interest rate swaps designated as hedging instruments ......................................................
Fair value loss on bonds issued by the Group attributable to interest rate risk ..........................................................
Net (loss) gain from sale of subsidiaries ...................................................................................................................
Cash and balances with Central Bank ......................................................................................................................
Legal dispute settlement* .........................................................................................................................................
Legal fees .................................................................................................................................................................
Rental income ..........................................................................................................................................................
Debt issued and other borrowed funds at amortised cost .........................................................................................
Subordinated loans ...................................................................................................................................................
Other liabilities ..........................................................................................................................................................
Share of profit of associates, net of income tax ........................................................................................................
Financial assets mandatorily at fair value through profit or loss ................................................................................
Loans at amortised cost ...........................................................................................................................................
Other assets .............................................................................................................................................................
Deposits ...................................................................................................................................................................
Debt issued and other borrowed funds designated as at FVTPL ..............................................................................
Shares and related derivatives .................................................................................................................................
Debt issued and other borrowed funds designated as at FVTPL ..............................................................................
Cont'd
Dividend income .......................................................................................................................................................
Bonds and related derivatives ...................................................................................................................................
Other derivatives ......................................................................................................................................................
Depositor's and Investor's Guarantee Fund reversed contribution** .........................................................................
Íslandsbanki hf. Consolidated Financial Statements 2019 30 Amounts are in ISK million
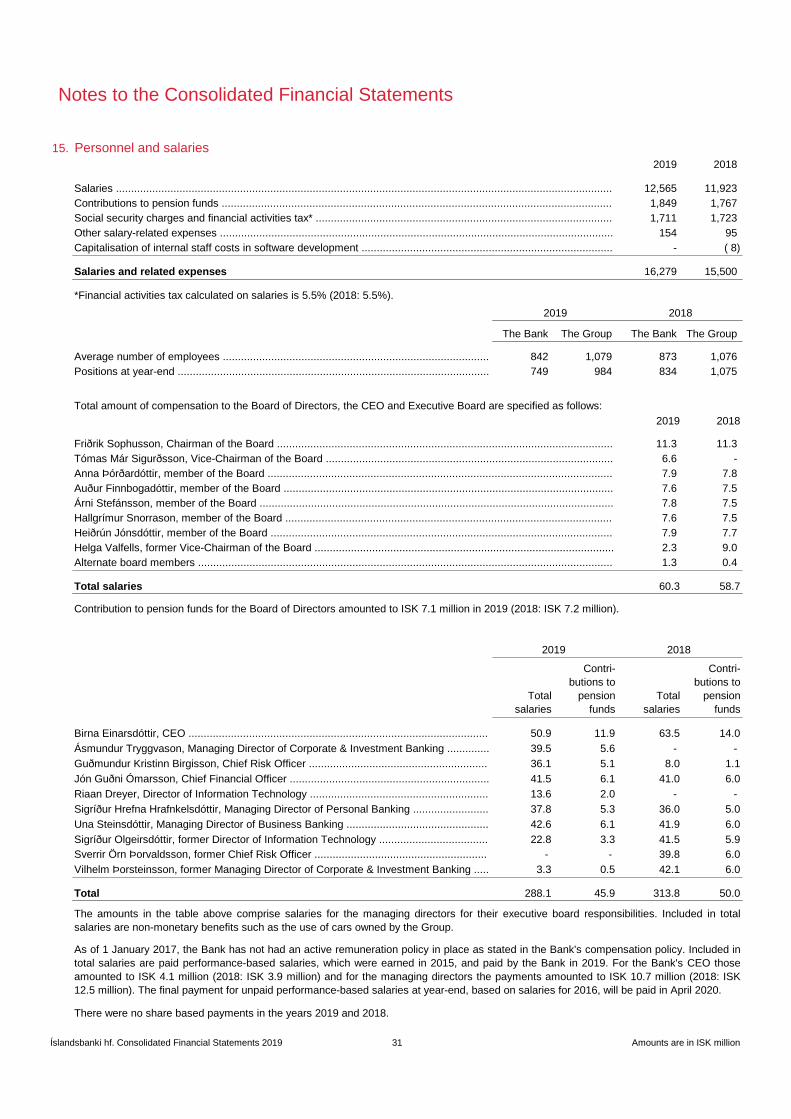
Notes to the Consolidated Financial Statements
15. Personnel and salaries
2019 2018
12,565 11,923
1,849 1,767
1,711 1,723
154 95
- ( 8)
Salaries and related expenses 16,279 15,500
The Bank The Group The Bank The Group
842 1,079 873 1,076
749 984 834 1,075
2019 2018
11.3 11.3
6.6 -
7.9 7.8
7.6 7.5
7.8 7.5
7.6 7.5
7.9 7.7
2.3 9.0
1.3 0.4
Total salaries 60.3 58.7
Total
salaries
Contri-
butions to
pension
funds
Total
salaries
Contri-
butions to
pension
funds
50.9 11.9 63.5 14.0
39.5 5.6 - -
36.1 5.1 8.0 1.1
41.5 6.1 41.0 6.0
13.6 2.0 - -
37.8 5.3 36.0 5.0
42.6 6.1 41.9 6.0
22.8 3.3 41.5 5.9
- - 39.8 6.0
3.3 0.5 42.1 6.0
Total 288.1 45.9 313.8 50.0
Other salary-related expenses ..................................................................................................................................
Capitalisation of internal staff costs in software development ...................................................................................
Tómas Már Sigurðsson, Vice-Chairman of the Board ...............................................................................................
Helga Valfells, former Vice-Chairman of the Board ...................................................................................................
Ásmundur Tryggvason, Managing Director of Corporate & Investment Banking ..............
Guðmundur Kristinn Birgisson, Chief Risk Officer ...........................................................
Jón Guðni Ómarsson, Chief Financial Officer ..................................................................
Sverrir Örn Þorvaldsson, former Chief Risk Officer .........................................................
Vilhelm Þorsteinsson, former Managing Director of Corporate & Investment Banking .....
2019 2018
Salaries ....................................................................................................................................................................
Contributions to pension funds .................................................................................................................................
Social security charges and financial activities tax* ..................................................................................................
Riaan Dreyer, Director of Information Technology ...........................................................
Una Steinsdóttir, Managing Director of Business Banking ...............................................
Sigríður Hrefna Hrafnkelsdóttir, Managing Director of Personal Banking .........................
Average number of employees ........................................................................................
Positions at year-end .......................................................................................................
Total amount of compensation to the Board of Directors, the CEO and Executive Board are specified as follows:
Árni Stefánsson, member of the Board .....................................................................................................................
Hallgrímur Snorrason, member of the Board ............................................................................................................
Heiðrún Jónsdóttir, member of the Board .................................................................................................................
Alternate board members .........................................................................................................................................
2019 2018
Birna Einarsdóttir, CEO ...................................................................................................
Sigríður Olgeirsdóttir, former Director of Information Technology ....................................
The amounts in the table above comprise salaries for the managing directors for their executive board responsibilities. Included in total
salaries are non-monetary benefits such as the use of cars owned by the Group.
As of 1 January 2017, the Bank has not had an active remuneration policy in place as stated in the Bank's compensation policy. Included in
total salaries are paid performance-based salaries, which were earned in 2015, and paid by the Bank in 2019. For the Bank's CEO those
amounted to ISK 4.1 million (2018: ISK 3.9 million) and for the managing directors the payments amounted to ISK 10.7 million (2018: ISK
12.5 million). The final payment for unpaid performance-based salaries at year-end, based on salaries for 2016, will be paid in April 2020.
Contribution to pension funds for the Board of Directors amounted to ISK 7.1 million in 2019 (2018: ISK 7.2 million).
There were no share based payments in the years 2019 and 2018.
*Financial activities tax calculated on salaries is 5.5% (2018: 5.5%).
Friðrik Sophusson, Chairman of the Board ...............................................................................................................
Anna Þórðardóttir, member of the Board ..................................................................................................................
Auður Finnbogadóttir, member of the Board .............................................................................................................
Íslandsbanki hf. Consolidated Financial Statements 2019 31 Amounts are in ISK million

Notes to the Consolidated Financial Statements
16. Other operating expenses
2019 2018
2,051 2,385
4,616 4,568
1,188 1,796
1,960 1,312
2,013 2,089
Other operating expenses 11,828 12,150
17. Auditors' fees
2019 2018
125 117
23 24
5 15
Auditors' fees 153 156
18. Net impairment on financial assets
2019 2018
( 3,524) 529
( 52) 38
( 87) 1,017
Net impairment on financial assets ( 3,663) 1,584
19. Income tax expense
2019 2018
2,610 3,205
642 860
( 6) 196
436 473
Income tax recognised in the income statement 3,682 4,734
Income tax recognised in other comprehensive income ( 233) ( 884)
Changes in deferred tax assets and deferred tax liabilities .......................................................................................
Special financial activities tax ...................................................................................................................................
*The main reasons for the additional expected credit loss allowance are: increased loan impairments for a few customers (ISK 1,178 million),
due to a less favourable economic environment (ISK 992 million), and an unfavourable ruling in a court case (ISK 787 million).
Professional services ................................................................................................................................................
Software and IT expenses ........................................................................................................................................
Expected credit loss, on-balance sheet items* .........................................................................................................
Real estate and office equipment .............................................................................................................................
Depreciation, amortisation and write-offs ..................................................................................................................
Other administrative expenses .................................................................................................................................
Audit of the annual accounts ....................................................................................................................................
Recognised income tax is based on applicable tax laws. The income tax rate for legal entities in 2019 is 20% (2018: 20%). Special financial
activities tax is calculated as 6% of taxable profits exceeding ISK 1 billion in accordance with the Act on Financial Activities Tax no.
165/2011. The effective income tax rate in the Group's income statement for the year 2019 is 30.1% (2018: 32.7%).
Current tax expense excluding discontinued operations ...........................................................................................
Other services ..........................................................................................................................................................
Review of interim accounts .......................................................................................................................................
Expected credit loss, off-balance sheet items ...........................................................................................................
Changes in provision due to court rulings .................................................................................................................
Difference in prior year's calculated income tax ........................................................................................................
Íslandsbanki hf. Consolidated Financial Statements 2019 32 Amounts are in ISK million

Notes to the Consolidated Financial Statements
19.
2019 2018
12,261 14,467
2,452 20.0% 2,893 20.0%
642 5.2% 860 5.9%
( 140) ( 1.1%) 217 1.5%
708 5.8% 657 4.5%
20 0.2% 107 0.8%
Effective income tax expense 3,682 30.1% 4,734 32.7%
20. Discontinued operations, net of income tax
2019 2018
( 199) 58
74 854
Discontinued operations, net of income tax ( 125) 912
21. Earnings per share
2019 2018 2019 2018
8,934 10,124 8,809 11,036
10,000 10,000 10,000 10,000
Basic earnings per share 0.89 1.01 0.88 1.10
22. Cash and balances with Central Bank
31.12.2019 31.12.2018
4,403 3,095
126,956 114,849
1,679 3,049
Included in cash and cash equivalents 133,038 120,993
13,600 14,063
Cash and balances with Central Bank 146,638 135,056
Profit before tax ...............................................................................................................
20% income tax calculated on the profit of the year ........................................................
(Income) expenses not subject to tax ..............................................................................
Excluded
Net (loss) profit from foreclosed assets ....................................................................................................................
Profit attributable to shareholders of the Bank .................................................................
Other differences .............................................................................................................
The Bank is taxed jointly with its subsidiary Íslandssjóðir hf.
Non-deductible expenses ................................................................................................
Weighted average number of outstanding shares ...........................................................
*Balances as defined in Act no. 37/2016 on the treatment of króna-denominated assets subject to special restrictions and rules no. 490/2016
on special reserve requirements for new foreign currency inflows.
Balances with Central Bank ......................................................................................................................................
Mandatory reserve deposits with Central Bank .........................................................................................................
Net profit from disposal groups held for sale .............................................................................................................
Balances with Central Bank subject to special restrictions* ......................................................................................
Discontinued operations
Cash on hand ...........................................................................................................................................................
The Group's basic and diluted earnings per share are equal as the Group has not issued any options, warrants, convertibles, or other
financial instruments that dilute earnings per share (2018: none).
Included
Cont'd
Special financial activities tax ..........................................................................................
Íslandsbanki hf. Consolidated Financial Statements 2019 33 Amounts are in ISK million

Notes to the Consolidated Financial Statements
23. Loans to credit institutions
31.12.2019 31.12.2018
33,254 16,314
21,122 25,259
- 4
Loans to credit institutions 54,376 41,577
24. Derivative instruments and short positions
At 31 December 2019
Assets Liabilities
1,254 114,393 3,575 96,212
3,015 91,950 880 13,073
141 4,664 298 4,001
212 5,460 321 10,217
867 30,990 298 24,928
132 12,756 33 6,219
Derivatives 5,621 260,213 5,405 154,650
- - 814 734
Total 5,621 260,213 6,219 155,384
At 31 December 2018
1,037 102,429 3,422 134,010
1,821 69,691 1,184 28,309
419 4,596 78 1,195
359 9,242 196 3,869
875 35,726 440 13,373
39 3,511 201 19,993
Derivatives 4,550 225,195 5,521 200,749
Foreign exchange swaps .................................................................................................
Bond forwards .................................................................................................................
Equity forwards ...............................................................................................................
Short positions in listed bonds .........................................................................................
Foreign exchange swaps .................................................................................................
Interest rate swaps ..........................................................................................................
Short positions are in Icelandic Government bonds and bonds issued by institutions with government guarantees. As a primary dealer the
Group has access to securities lending facilities provided by the Central Bank and the Housing Financing Fund. Majority of the securities
lending facilities have a maturity of less than a year.
The Group applies hedge accounting only with respect to certain EUR denominated interest rate swaps, whereby the Group pays floating
rate interest and receives fixed rate interest. The interest rate swaps are hedging the exposure of changes in the fair value of certain fixed-
rate EUR denominated bonds (see Note 35) arising from changes in interest rates. The Group applies fair value hedge accounting to the
hedging relationships. At year-end 2019 the total fair value of the interest rate swaps was positive and amounted to ISK 921 million (2018:
ISK 627 million) and their total notional amount was ISK 40,749 million (2018: ISK 39,696).
Foreign exchange forwards .............................................................................................
Bond forwards .................................................................................................................
The Group uses derivatives to hedge currency exposure, interest rate risk in the banking book as well as inflation risk. The Group carries
relatively low indirect exposure due to margin trading with clients and the Group holds collaterals for possible losses. Other derivatives in the
Group held for trading or for other purposes are insignificant.
Cross-currency interest rate swaps .................................................................................
Interest rate swaps ..........................................................................................................
Cross-currency interest rate swaps .................................................................................
Equity forwards ...............................................................................................................
Foreign exchange forwards .............................................................................................
Notional
values
related to
liabilities
Notional
values
related to
assets
Money market loans .................................................................................................................................................
Bank accounts ..........................................................................................................................................................
Other loans ...............................................................................................................................................................
Íslandsbanki hf. Consolidated Financial Statements 2019 34 Amounts are in ISK million
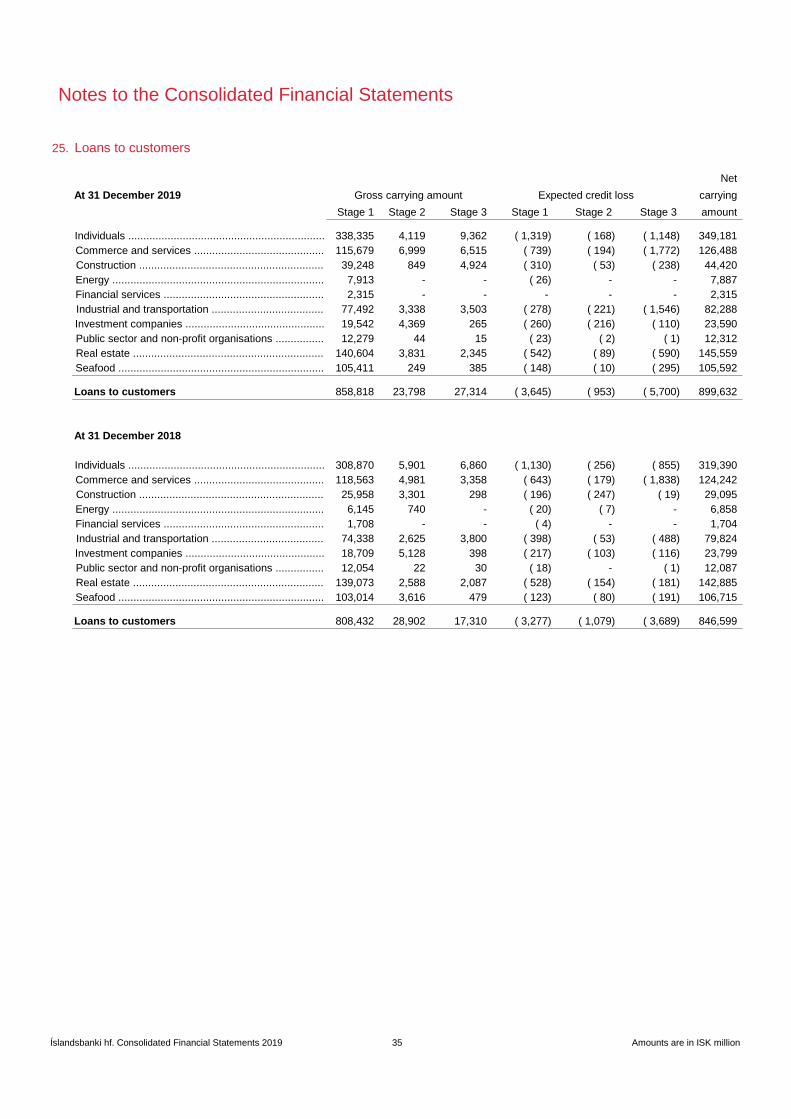
Notes to the Consolidated Financial Statements
25. Loans to customers
Net
At 31 December 2019 carrying
Stage 1 Stage 2 Stage 3 Stage 1 Stage 2 Stage 3 amount
338,335 4,119 9,362 ( 1,319) ( 168) ( 1,148) 349,181
115,679 6,999 6,515 ( 739) ( 194) ( 1,772) 126,488
39,248 849 4,924 ( 310) ( 53) ( 238) 44,420
7,913 - - ( 26) - - 7,887
2,315 - - - - - 2,315
77,492 3,338 3,503 ( 278) ( 221) ( 1,546) 82,288
19,542 4,369 265 ( 260) ( 216) ( 110) 23,590
12,279 44 15 ( 23) ( 2) ( 1) 12,312
140,604 3,831 2,345 ( 542) ( 89) ( 590) 145,559
105,411 249 385 ( 148) ( 10) ( 295) 105,592
Loans to customers 858,818 23,798 27,314 ( 3,645) ( 953) ( 5,700) 899,632
At 31 December 2018
308,870 5,901 6,860 ( 1,130) ( 256) ( 855) 319,390
118,563 4,981 3,358 ( 643) ( 179) ( 1,838) 124,242
25,958 3,301 298 ( 196) ( 247) ( 19) 29,095
6,145 740 - ( 20) ( 7) - 6,858
1,708 - - ( 4) - - 1,704
74,338 2,625 3,800 ( 398) ( 53) ( 488) 79,824
18,709 5,128 398 ( 217) ( 103) ( 116) 23,799
12,054 22 30 ( 18) - ( 1) 12,087
139,073 2,588 2,087 ( 528) ( 154) ( 181) 142,885
103,014 3,616 479 ( 123) ( 80) ( 191) 106,715
Loans to customers 808,432 28,902 17,310 ( 3,277) ( 1,079) ( 3,689) 846,599
Seafood ....................................................................
Industrial and transportation .....................................
Individuals .................................................................
Commerce and services ...........................................
Investment companies ..............................................
Individuals .................................................................
Expected credit loss
Construction .............................................................
Seafood ....................................................................
Energy ......................................................................
Financial services .....................................................
Real estate ...............................................................
Investment companies ..............................................
Public sector and non-profit organisations ................
Commerce and services ...........................................
Construction .............................................................
Energy ......................................................................
Financial services .....................................................
Industrial and transportation .....................................
Gross carrying amount
Public sector and non-profit organisations ................
Real estate ...............................................................
Íslandsbanki hf. Consolidated Financial Statements 2019 35 Amounts are in ISK million

Notes to the Consolidated Financial Statements
26. Expected credit loss
Loans to customers
Stage 1 Stage 2 Stage 3 Total
3,277 1,079 3,689 8,045
1,725 ( 1,343) ( 382) -
( 1,336) 1,687 ( 351) -
( 178) ( 720) 898 -
( 1,216) 145 2,727 1,656
1,803 278 353 2,434
( 430) ( 169) ( 188) ( 787)
- ( 4) ( 1,616) ( 1,620)
- - 249 249
- - 10 10
- - 311 311
At 31 December 2019 3,645 953 5,700 10,298
2,701 1,244 9,151 13,096
2,652 ( 1,733) ( 919) -
( 1,053) 2,317 ( 1,264) -
( 99) ( 1,167) 1,266 -
( 2,073) 126 ( 429) ( 2,376)
1,474 478 711 2,663
( 323) ( 185) ( 618) ( 1,126)
( 2) ( 1) ( 5,254) ( 5,257)
- - 416 416
- - 87 87
- - 542 542
At 31 December 2018 3,277 1,079 3,689 8,045
Total expected credit loss
Stage 1 Stage 2 Stage 3 Total
4 - - 4
67 - - 67
3,645 953 5,700 10,298
9 3 86 98
403 55 231 689
At 31 December 2019 4,128 1,011 6,017 11,156
48 - - 48
62 - - 62
3,277 1,079 3,689 8,045
5 3 83 91
410 142 84 636
At 31 December 2018 3,802 1,224 3,856 8,882
*For further breakdown see Note 39.
Recoveries of amounts previously written off ...................................................................
Cash and balances with Central Bank .............................................................................
Off-balance sheet loan commitments and financial guarantees* .....................................
Loans to customers .........................................................................................................
Cash and balances with Central Bank .............................................................................
Loans to credit institutions ...............................................................................................
Other financial assets ......................................................................................................
Loans to customers .........................................................................................................
Other financial assets ......................................................................................................
Off-balance sheet loan commitments and financial guarantees* .....................................
Loans to credit institutions ...............................................................................................
Derecognitions and maturities .........................................................................................
Foreign exchange ............................................................................................................
Net remeasurement of loss allowance .............................................................................
Transfer to Stage 1 .........................................................................................................
At 1 January 2018 ...........................................................................................................
Transfer to Stage 1 .........................................................................................................
Write-offs ........................................................................................................................
Unwinding of interests .....................................................................................................
Transfer to Stage 3 .........................................................................................................
New financial assets originated or purchased ..................................................................
Transfer to Stage 3 .........................................................................................................
Net remeasurement of loss allowance .............................................................................
Transfer to Stage 2 .........................................................................................................
Write-offs ........................................................................................................................
Transfer to Stage 2 .........................................................................................................
Unwinding of interests .....................................................................................................
Recoveries of amounts previously written off ...................................................................
Foreign exchange ............................................................................................................
New financial assets originated or purchased ..................................................................
At 1 January 2019 ...........................................................................................................
Derecognitions and maturities .........................................................................................
Íslandsbanki hf. Consolidated Financial Statements 2019 36 Amounts are in ISK million
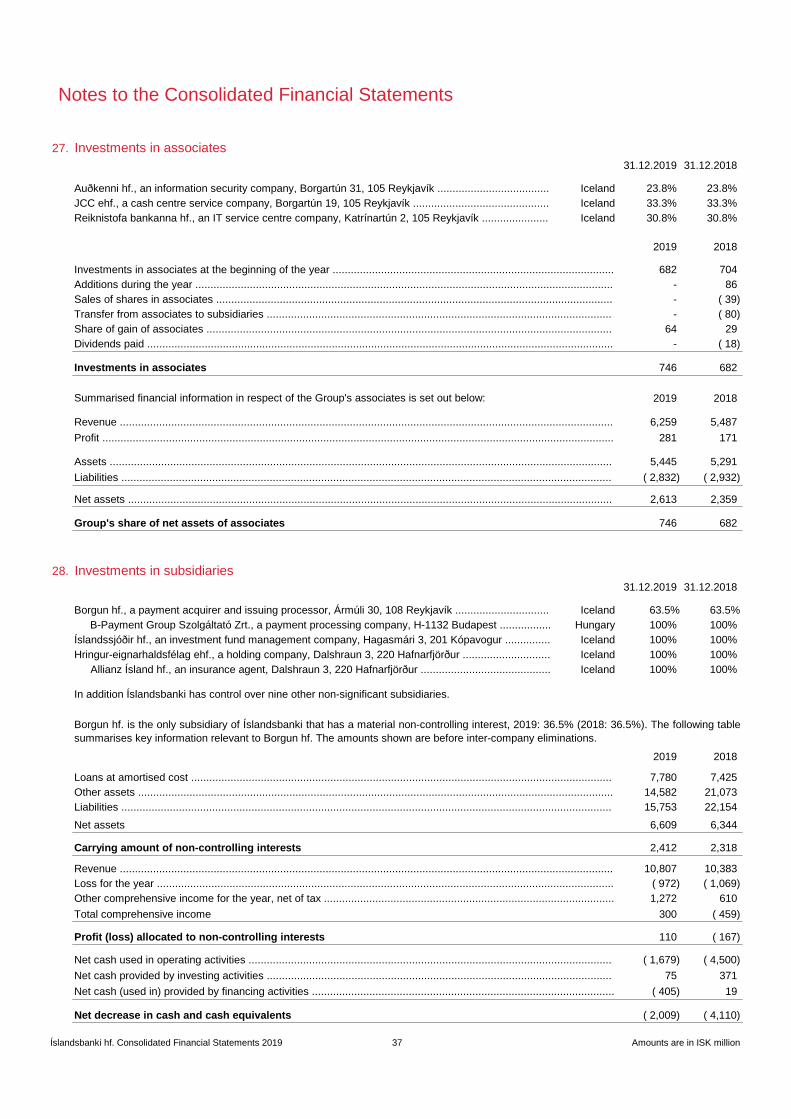
Notes to the Consolidated Financial Statements
27. Investments in associates
31.12.2019 31.12.2018
Iceland 23.8% 23.8%
Iceland 33.3% 33.3%
Iceland 30.8% 30.8%
2019 2018
682 704
- 86
- ( 39)
- ( 80)
64 29
- ( 18)
Investments in associates 746 682
Summarised financial information in respect of the Group's associates is set out below: 2019 2018
6,259 5,487
281 171
5,445 5,291
( 2,832) ( 2,932)
2,613 2,359
Group's share of net assets of associates 746 682
28. Investments in subsidiaries
31.12.2019 31.12.2018
Iceland 63.5% 63.5%
Hungary 100% 100%
Iceland 100% 100%
Iceland 100% 100%
Iceland 100% 100%
2019 2018
7,780 7,425
14,582 21,073
15,753 22,154
Net assets 6,609 6,344
Carrying amount of non-controlling interests 2,412 2,318
10,807 10,383
( 972) ( 1,069)
1,272 610
Total comprehensive income 300 ( 459)
Profit (loss) allocated to non-controlling interests 110 ( 167)
( 1,679) ( 4,500)
75 371
( 405) 19
Net decrease in cash and cash equivalents ( 2,009) ( 4,110)
Loans at amortised cost ...........................................................................................................................................
Other assets .............................................................................................................................................................
Liabilities ..................................................................................................................................................................
Revenue ...................................................................................................................................................................
Loss for the year .......................................................................................................................................................
Other comprehensive income for the year, net of tax ................................................................................................
Net cash used in operating activities ........................................................................................................................
Auðkenni hf., an information security company, Borgartún 31, 105 Reykjavík .....................................
JCC ehf., a cash centre service company, Borgartún 19, 105 Reykjavík .............................................
Reiknistofa bankanna hf., an IT service centre company, Katrínartún 2, 105 Reykjavík ......................
Revenue ...................................................................................................................................................................
Sales of shares in associates ...................................................................................................................................
Investments in associates at the beginning of the year .............................................................................................
Borgun hf. is the only subsidiary of Íslandsbanki that has a material non-controlling interest, 2019: 36.5% (2018: 36.5%). The following table
summarises key information relevant to Borgun hf. The amounts shown are before inter-company eliminations.
Net cash provided by investing activities ..................................................................................................................
Net cash (used in) provided by financing activities ....................................................................................................
Borgun hf., a payment acquirer and issuing processor, Ármúli 30, 108 Reykjavík ...............................
Assets ......................................................................................................................................................................
Liabilities ..................................................................................................................................................................
Net assets ................................................................................................................................................................
Hringur-eignarhaldsfélag ehf., a holding company, Dalshraun 3, 220 Hafnarfjörður .............................
Profit .........................................................................................................................................................................
In addition Íslandsbanki has control over nine other non-significant subsidiaries.
Allianz Ísland hf., an insurance agent, Dalshraun 3, 220 Hafnarfjörður ...........................................
Íslandssjóðir hf., an investment fund management company, Hagasmári 3, 201 Kópavogur ...............
Additions during the year ..........................................................................................................................................
Share of gain of associates ......................................................................................................................................
B-Payment Group Szolgáltató Zrt., a payment processing company, H-1132 Budapest .................
Dividends paid ..........................................................................................................................................................
Transfer from associates to subsidiaries ..................................................................................................................
Íslandsbanki hf. Consolidated Financial Statements 2019 37 Amounts are in ISK million
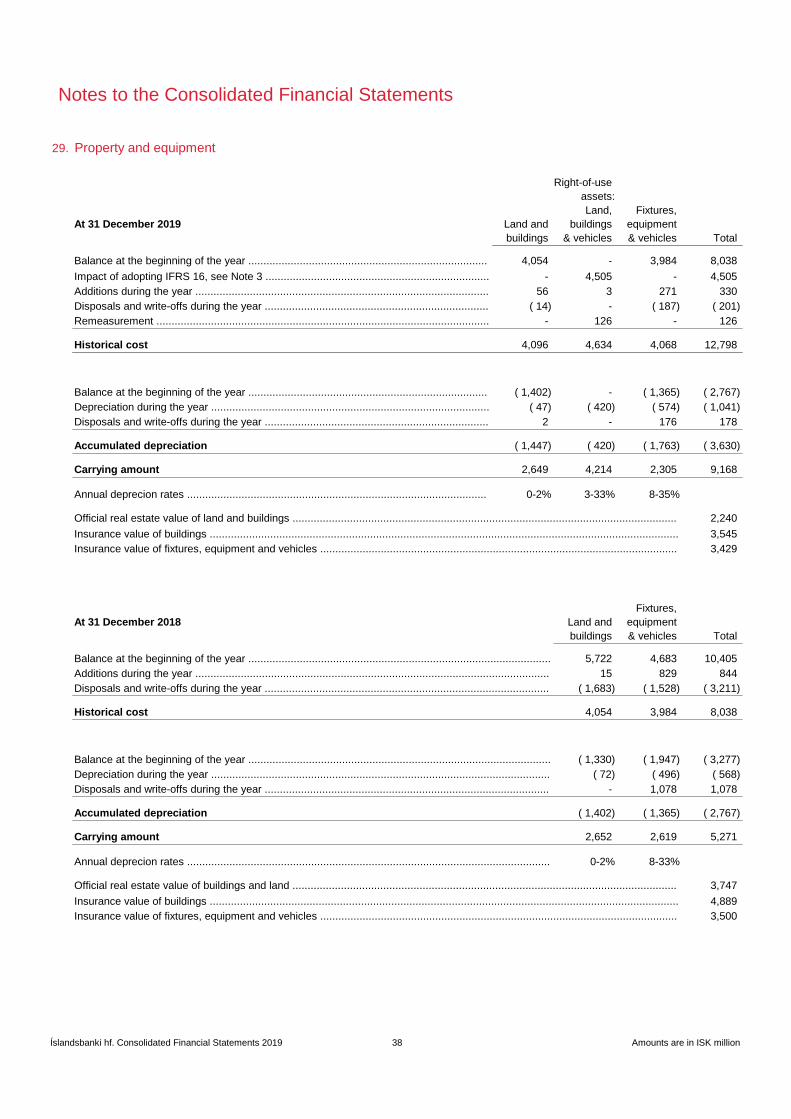
Notes to the Consolidated Financial Statements
29. Property and equipment
Right-of-use
assets:
Land, Fixtures,
At 31 December 2019 Land and buildings equipment
buildings & vehicles & vehicles Total
4,054 - 3,984 8,038
- 4,505 - 4,505
56 3 271 330
( 14) - ( 187) ( 201)
- 126 - 126
Historical cost 4,096 4,634 4,068 12,798
( 1,402) - ( 1,365) ( 2,767)
( 47) ( 420) ( 574) ( 1,041)
2 - 176 178
Accumulated depreciation ( 1,447) ( 420) ( 1,763) ( 3,630)
Carrying amount 2,649 4,214 2,305 9,168
0-2% 3-33% 8-35%
2,240
3,545
3,429
Fixtures,
At 31 December 2018 Land and equipment
buildings & vehicles Total
5,722 4,683 10,405
15 829 844
( 1,683) ( 1,528) ( 3,211)
Historical cost 4,054 3,984 8,038
( 1,330) ( 1,947) ( 3,277)
( 72) ( 496) ( 568)
- 1,078 1,078
Accumulated depreciation ( 1,402) ( 1,365) ( 2,767)
Carrying amount 2,652 2,619 5,271
0-2% 8-33%
3,747
4,889
3,500
Depreciation during the year ................................................................................................................
Annual deprecion rates ...................................................................................................
Balance at the beginning of the year ....................................................................................................
Additions during the year .....................................................................................................................
Balance at the beginning of the year ....................................................................................................
Balance at the beginning of the year ...............................................................................
Additions during the year .................................................................................................
Impact of adopting IFRS 16, see Note 3 ..........................................................................
Disposals and write-offs during the year ..............................................................................................
Disposals and write-offs during the year ..............................................................................................
Balance at the beginning of the year ...............................................................................
Depreciation during the year ............................................................................................
Disposals and write-offs during the year ..........................................................................
Insurance value of buildings ...........................................................................................................................................................
Official real estate value of land and buildings ...............................................................................................................................
Insurance value of fixtures, equipment and vehicles ......................................................................................................................
Remeasurement ..............................................................................................................
Disposals and write-offs during the year ..........................................................................
Insurance value of buildings ...........................................................................................................................................................
Insurance value of fixtures, equipment and vehicles ......................................................................................................................
Official real estate value of buildings and land ...............................................................................................................................
Annual deprecion rates ........................................................................................................................
Íslandsbanki hf. Consolidated Financial Statements 2019 38 Amounts are in ISK million
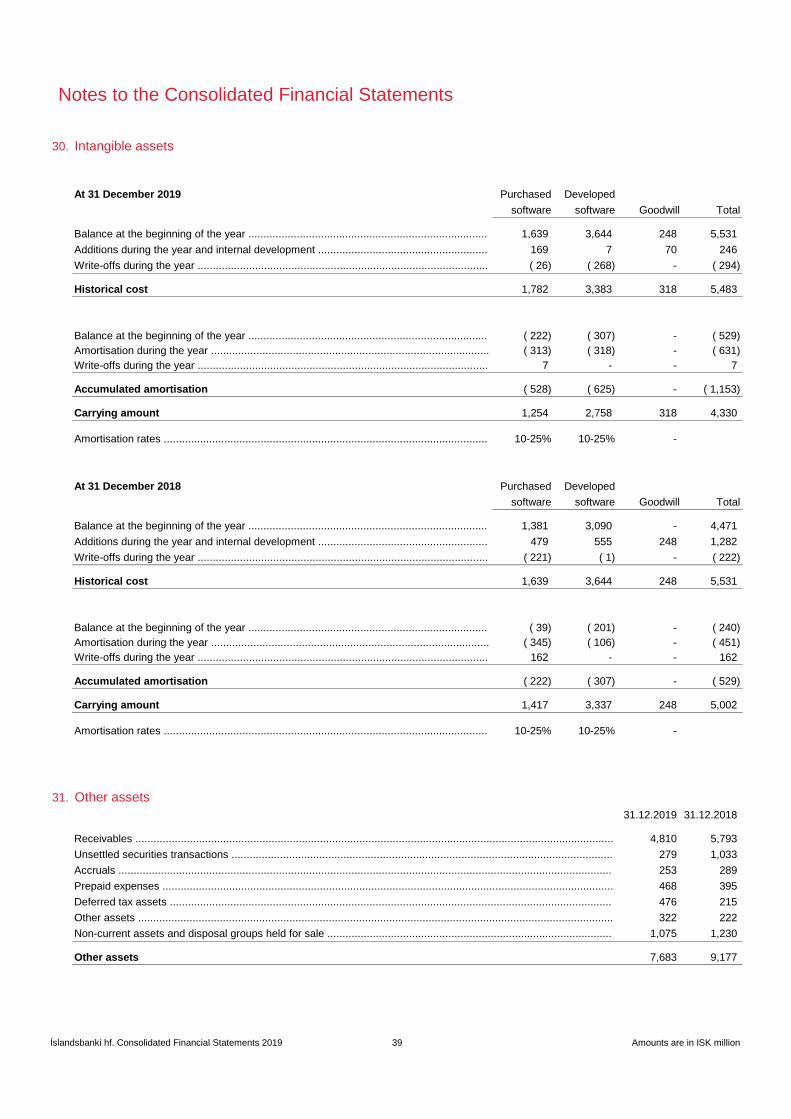
Notes to the Consolidated Financial Statements
30. Intangible assets
At 31 December 2019 Purchased Developed
software software Goodwill Total
1,639 3,644 248 5,531
169 7 70 246
( 26) ( 268) - ( 294)
Historical cost 1,782 3,383 318 5,483
( 222) ( 307) - ( 529)
( 313) ( 318) - ( 631)
7 - - 7
Accumulated amortisation ( 528) ( 625) - ( 1,153)
Carrying amount 1,254 2,758 318 4,330
10-25% 10-25% -
At 31 December 2018 Purchased Developed
software software Goodwill Total
1,381 3,090 - 4,471
479 555 248 1,282
( 221) ( 1) - ( 222)
Historical cost 1,639 3,644 248 5,531
( 39) ( 201) - ( 240)
( 345) ( 106) - ( 451)
162 - - 162
Accumulated amortisation ( 222) ( 307) - ( 529)
Carrying amount 1,417 3,337 248 5,002
10-25% 10-25% -
31. Other assets
31.12.2019 31.12.2018
4,810 5,793
279 1,033
253 289
468 395
476 215
322 222
1,075 1,230
Other assets 7,683 9,177
Non-current assets and disposal groups held for sale ..............................................................................................
Accruals ...................................................................................................................................................................
Amortisation during the year ............................................................................................
Write-offs during the year ................................................................................................
Balance at the beginning of the year ...............................................................................
Other assets .............................................................................................................................................................
Additions during the year and internal development ........................................................
Write-offs during the year ................................................................................................
Balance at the beginning of the year ...............................................................................
Amortisation during the year ............................................................................................
Write-offs during the year ................................................................................................
Balance at the beginning of the year ...............................................................................
Receivables ..............................................................................................................................................................
Unsettled securities transactions ..............................................................................................................................
Prepaid expenses .....................................................................................................................................................
Deferred tax assets ..................................................................................................................................................
Amortisation rates ...........................................................................................................
Amortisation rates ...........................................................................................................
Balance at the beginning of the year ...............................................................................
Additions during the year and internal development ........................................................
Write-offs during the year ................................................................................................
Íslandsbanki hf. Consolidated Financial Statements 2019 39 Amounts are in ISK million

Notes to the Consolidated Financial Statements
31.
Non-current assets and disposal groups held for sale 31.12.2019 31.12.2018
739 995
44 17
292 218
Total 1,075 1,230
32. Deposits from Central Bank and credit institutions
31.12.2019 31.12.2018
30,808 15,527
117 92
Deposits from Central Bank and credit institutions 30,925 15,619
33. Deposits from customers
31.12.2019 31.12.2018
530,960 499,170
87,353 79,789
Deposits from customers 618,313 578,959
Deposits from customers specified by owners
Amount % of total Amount % of total
12,553 2% 9,331 2%
5,619 1% 5,574 1%
299,204 48% 278,209 48%
300,937 49% 285,845 49%
Deposits from customers 618,313 100% 578,959 100%
34. Pledged assets
31.12.2019 31.12.2018
205,773 190,471
402 1,105
1,114 153
Pledged assets against liabilities 207,289 191,729
Repurchase agreements with Central Bank ..............................................................................................................
Municipalities ...................................................................................................................
31.12.2018
Assets of disposal groups classified as held for sale ................................................................................................
Industrial equipment and vehicles ........................................................................................................................
Repossessed collateral:
Land and buildings ..............................................................................................................................................
The Group has pledged assets against the issuance of covered bonds under Icelandic law, which are pledged on a pool of consumer
mortgage loans.
Companies ......................................................................................................................
At year-end 2019 the Group classified the assets and liabilities of Miðengi ehf. (100%) as assets and liabilities of disposal groups held for
sale.
Deposits from credit institutions ................................................................................................................................
Financial assets pledged as collateral in repurchase agreements ............................................................................
Demand deposits and deposits with maturity up to 3 months ...................................................................................
Term deposits with maturity of more than 3 months .................................................................................................
Central government and state-owned enterprises ...........................................................
Cont'd
Individuals .......................................................................................................................
Financial assets pledged as collateral against liabilities ............................................................................................
Financial assets pledged as collateral in foreign banks ............................................................................................
The Group has also pledged cash in foreign banks and financial institutions, mainly as collateral for trades under ISDA agreements to hedge
market risk.
31.12.2019
Íslandsbanki hf. Consolidated Financial Statements 2019 40 Amounts are in ISK million

Notes to the Consolidated Financial Statements
35. Debt issued and other borrowed funds
Issued Interest 31.12.2019 31.12.2018
2014-2017 2019 At maturity Fixed rates - 9,866
2019 2021 At maturity Fixed rates 3,918 -
2015-2019 2023 At maturity Fixed rates 20,170 10,890
2012-2014 2019 At maturity Fixed rates - 8,937
2014-2015 2020 At maturity Fixed rates 4,359 4,248
2015-2017 2022 At maturity Fixed rates 18,512 18,009
2012-2018 2024 At maturity Fixed rates 35,752 35,009
2015-2018 2026 At maturity Fixed rates 27,661 26,992
2019 2028 At maturity Fixed rates 14,228 -
2017-2018 2030 At maturity Fixed rates 25,463 24,862
Covered bonds 150,063 138,813
2015 2019 At maturity Fixed rates - 7,844
2017 2019 At maturity Fixed rates - 4,398
2018 2019 At maturity Fixed rates - 1,302
2016 2020 At maturity Fixed rates 7,782 68,154
2018 2020 At maturity Fixed rates - 3,259
2019 2020 At maturity Floating rates 4,557 -
2018 2021 At maturity Fixed rates 1,308 1,311
2018-2019 2021 At maturity Floating rates 18,913 15,053
2019 2021 At maturity Floating rates 1,559 -
2018 2022 At maturity Floating rates 12,990 12,995
2019 2022 At maturity Fixed rates 41,570 -
2019 2022 At maturity Floating rates 13,856 -
2018 2024 At maturity Fixed rates 41,816 40,714
2019 2024 At maturity Fixed rates 5,709 -
2019 2024 Monthly Floating rates 3,553 -
Bonds issued 153,613 155,030
2,705 6,729
- 404
Other borrowed funds 2,705 7,133
Debt issued and other borrowed funds 306,381 300,976
Bills issued ...............................................................................................................................................................
***The Group applies hedge accounting to this bond issuance and uses certain EUR denominated interest rate swaps as hedging
instruments (see Note 24). The interest rate swaps are hedging the exposure of the Group's changes in the fair value of this fixed-rate EUR
denominated bond arising from changes in interest rates. The Group applies fair value hedge accounting to the hedging relationships. At 31
December 2019 the total carrying amount of the bond issuance amounted to ISK 41,816 million and included in the amount are fair value
changes amounting to ISK 771 million.
Senior unsecured bonds in EUR*** ............................................
Senior unsecured bonds in ISK ..................................................
Covered bonds in ISK - CPI-linked .............................................
Covered bonds in ISK - CPI-linked .............................................
Senior unsecured bonds in NOK ................................................
Senior unsecured bonds in EUR ................................................
Senior unsecured bonds in EUR** .............................................
Senior unsecured bonds in SEK ................................................
Senior unsecured bonds in EUR ................................................
Senior unsecured bonds in SEK ................................................
Senior unsecured bonds in EUR** .............................................
Senior unsecured bonds in SEK* ...............................................
Senior unsecured bonds in SEK ................................................
Senior unsecured bonds in SEK ................................................
Senior unsecured bonds in SEK ................................................
Senior unsecured bonds in SEK ................................................
Senior unsecured bonds in NOK ................................................
Maturity
Covered bonds in ISK* ...............................................................
Covered bonds in ISK ................................................................
Covered bonds in ISK - CPI-linked* ...........................................
Covered bonds in ISK - CPI-linked .............................................
Covered bonds in ISK - CPI-linked .............................................
Covered bonds in ISK - CPI-linked .............................................
Covered bonds in ISK - CPI-linked .............................................
**These bond issuances are classified as being designated as at fair value through profit or loss. At 31 December 2019 the total carrying
amount of the bonds amounted to ISK 49,352 million and included in the amount are fair value changes amounting to ISK 863 million. The
carrying amount of the bond at 31 December 2019 was ISK 367 million higher than the contractual amount due at maturity. Íslandsbanki
repurchased part of the bond issuance maturing in 2020 during the year, amounting to ISK 62,227 million.
Other debt securities ................................................................................................................................................
The Bank has issued additional covered bonds to hold for the purpose of securities lending with regards to market making agreements.
These covered bond amounts are not included in the total.
*The Bank repurchased own bonds during the year amounting to ISK 7,614 million.
Covered bonds in ISK ................................................................
Íslandsbanki hf. Consolidated Financial Statements 2019 41 Amounts are in ISK million

Notes to the Consolidated Financial Statements
36. Subordinated loans
Issued 31.12.2019 31.12.2018
Loans which qualify as Tier 2 capital:
2017 2027 At maturity 9,714 9,724
2018 2028 At maturity 6,485 6,492
2019 2029 At maturity 6,475 -
Subordinated loans 22,674 16,216
37. Changes in liabilities arising from financing activities
1.1.2019 Cash flows
Interest
expense
Foreign
exchange
Fair value
changes 31.12.2019
20,756 2,060 1,272 - - 24,088
118,057 1,263 6,655 - - 125,975
- 3,528 25 - - 3,553
46,162 12,139 1,016 ( 425) - 58,892
68,154 ( 22,509) 734 1,667 1,306 49,352
40,714 ( 465) 497 786 284 41,816
7,133 ( 4,809) 358 23 - 2,705
16,216 6,190 501 ( 233) - 22,674
Total 317,192 ( 2,603) 11,058 1,818 1,590 329,055
Reclassi-
fication &
31.12.2017 remeasure 1.1.2018 Cash flows 31.12.2018
17,589 - 17,589 2,055 1,112 - - 20,756
91,351 - 91,351 20,134 6,572 - - 118,057
37,182 ( 19,003) 18,179 23,275 531 4,177 - 46,162
- 84,563 84,563 ( 20,083) 963 3,868 ( 1,157) 68,154
63,652 ( 63,652) - 37,406 430 2,390 488 40,714
7,974 - 7,974 ( 1,231) 390 - - 7,133
9,505 - 9,505 5,629 198 884 - 16,216
Total 1,908 229,161 67,185 10,196 11,319 ( 669) 317,192
Interest Maturity
Senior unsecured bonds FX .......................................................
Floating, STIBOR + 2.0%
Senior unsecured bonds used for hedging ..
Subordinated loans in SEK .......................................
Subordinated loans in SEK ....................................... Floating, STIBOR + 3.9%
Subordinated loans in SEK .......................................
Senior unsecured bonds in ISK ..................................................
Senior unsecured bonds FX ........................
Senior unsecured bonds FX at fair value ....
Non-cash changes
Covered bonds in ISK ................................................................
Covered bonds in ISK - CPI-linked .............................................
Senior unsecured bonds used for hedging .................................
Other borrowed funds .................................................................
227,253
Subordinated loans .....................................
Other borrowed funds .................................
Non-cash changes
Floating, STIBOR + 2.5%
Covered bonds in ISK .................................
Covered bonds in ISK - CPI-linked .............
Subordinated loans ....................................................................
Senior unsecured bonds FX at fair value ....................................
Foreign
exchange
Fair value
changes
Interest
expense
Íslandsbanki hf. Consolidated Financial Statements 2019 42 Amounts are in ISK million

Notes to the Consolidated Financial Statements
38. Tax assets and tax liabilities
Assets Liabilities Assets Liabilities
- 6,670 - 6,472
476 1,183 215 678
Tax in the balance sheet 476 7,853 215 7,150
Assets Liabilities
4 88
211 3,888
- ( 3,214)
- ( 94)
- 10
Deferred tax assets and tax liabilities 31.12.2018 215 678
256 3,223
- ( 2,535)
9 ( 183)
( 4) -
Deferred tax assets and tax liabilities 31.12.2019 476 1,183
Net Recognised
2019 balance at in profit or Recognised Deferred Deferred
1 January (loss) in equity Net tax assets tax liabilities
( 249) ( 848) - ( 1,097) - ( 1,097)
( 527) 16 - ( 511) - ( 511)
( 264) ( 12) - ( 276) - ( 276)
( 213) ( 213) - ( 426) - ( 426)
194 ( 236) - ( 42) - ( 42)
- 851 - 851 851 -
329 ( 253) 192 268 268 -
( 2) 32 - 30 30 -
269 227 - 496 496 -
( 463) ( 436) 192 ( 707) 1,645 ( 2,352)
Set-off of deferred tax assets together
( 1,169) 1,169
Tax assets (liabilities) ( 463) ( 436) 192 ( 707) 476 ( 1,183)
31.12.2019 31.12.2018
Intangible assets ........................................................................
Assets and liabilities denominated in foreign currency ...............
Deferred foreign exchange difference ........................................
Other items ................................................................................
Debt issued and other borrowed funds .......................................
Derivatives .................................................................................
Income tax recognised in other comprehensive income ...........................................................................................
Prior year's income tax adjustment ...........................................................................................................................
Calculated income tax for 2018 ................................................................................................................................
Deferred tax assets and tax liabilities 1.1.2018 .........................................................................................................
Tax loss carry forwards ..............................................................
with liabilities of the same taxable entities ................................
Income tax recognised in other comprehensive income ...........................................................................................
Movements in temporary differences during the year were as follows:
Lease liabilities ...........................................................................
Income tax payable in 2019 ......................................................................................................................................
Prior year's income tax adjustment ...........................................................................................................................
Current tax ......................................................................................................................
Deferred tax ....................................................................................................................
Balance at 31 December
Property and equipment .............................................................
Calculated income tax for 2019 ................................................................................................................................
Income tax payable in 2020 ......................................................................................................................................
Changes in the deferred tax assets and the tax liabilities were as follows:
Íslandsbanki hf. Consolidated Financial Statements 2019 43 Amounts are in ISK million

Notes to the Consolidated Financial Statements
38.
Net Recognised
2018 balance at in profit or Recognised Deferred Deferred
1 January (loss) in equity Net tax assets tax liabilities
( 79) ( 170) - ( 249) - ( 249)
( 395) ( 132) - ( 527) - ( 527)
( 186) ( 78) - ( 264) - ( 264)
( 202) ( 11) - ( 213) - ( 213)
465 ( 271) - 194 194 -
314 ( 79) 94 329 329 -
( 1) ( 1) - ( 2) - ( 2)
- 269 - 269 269 -
( 84) ( 473) 94 ( 463) 792 ( 1,255)
Set-off of deferred tax assets together
( 577) 577
Tax assets (liabilities) ( 84) ( 473) 94 ( 463) 215 ( 678)
39. Other liabilities
31.12.2019 31.12.2018
3,217 3,906
14,765 20,722
4,256 -
75 -
689 636
1,559 1,733
515 612
229 193
1,758 1,841
- 6
Other liabilities 27,063 29,649
Expected credit loss for off-balance sheet loan commitments and financial guarantees
Stage 1 Stage 2 Stage 3 Total
410 142 84 636
152 ( 81) ( 71) -
( 20) 39 ( 19) -
( 9) ( 18) 27 -
( 455) ( 27) 131 ( 351)
447 20 119 586
( 122) ( 20) ( 40) ( 182)
At 31 December 2019 403 55 231 689
467 101 106 674
595 ( 545) ( 50) -
( 58) 67 ( 9) -
( 6) ( 69) 75 -
( 828) 481 ( 132) ( 479)
521 130 132 783
( 281) ( 23) ( 38) ( 342)
At 31 December 2018 410 142 84 636
Transfer to Stage 3 .........................................................................................................
Transfer to Stage 1 .........................................................................................................
Non-current liabilities and disposal groups held for sale ...........................................................................................
Provision for effects of court rulings ..........................................................................................................................
Transfer to Stage 2 .........................................................................................................
At 1 January 2018 ...........................................................................................................
Net remeasurement of loss allowance .............................................................................
New loan commitments and financial guarantees ............................................................
Derecognitions and maturities .........................................................................................
At 1 January 2019 ...........................................................................................................
Transfer to Stage 1 .........................................................................................................
Transfer to Stage 2 .........................................................................................................
Net remeasurement of loss allowance .............................................................................
Transfer to Stage 3 .........................................................................................................
New loan commitments and financial guarantees ............................................................
Derecognitions and maturities .........................................................................................
Lease liabilities .........................................................................................................................................................
Expected credit loss for off-balance sheet loan commitments and financial guarantees ...........................................
Accruals ...................................................................................................................................................................
Liabilities to retailers for credit cards .........................................................................................................................
Withholding tax .........................................................................................................................................................
Unsettled securities transactions ..............................................................................................................................
Sundry liabilities .......................................................................................................................................................
Deferred income .......................................................................................................................................................
Balance at 31 December
Debt issued and other borrowed funds .......................................
Tax loss carry forwards ..............................................................
with liabilities of the same taxable entities ................................
Other items ................................................................................
Deferred foreign exchange difference ........................................
Cont'd
Property and equipment .............................................................
Intangible assets ........................................................................
Derivatives .................................................................................
Assets and liabilities denominated in foreign currency ...............
Íslandsbanki hf. Consolidated Financial Statements 2019 44 Amounts are in ISK million
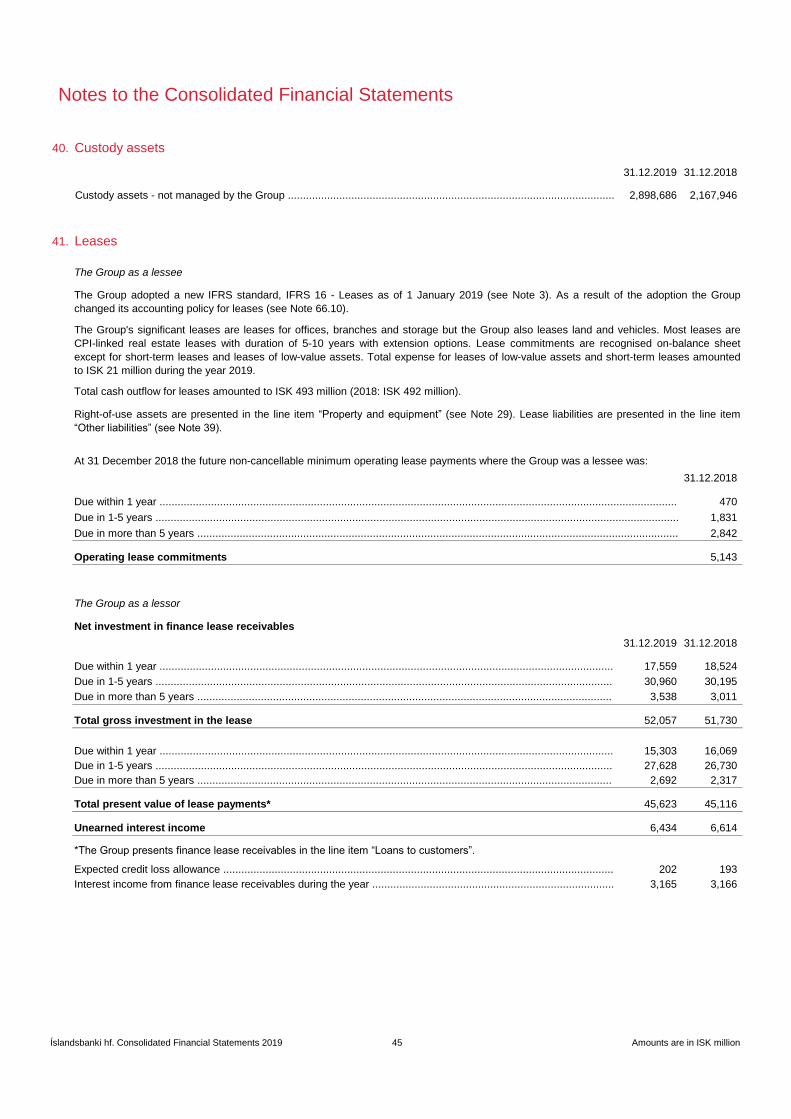
Notes to the Consolidated Financial Statements
40. Custody assets
31.12.2019 31.12.2018
2,898,686 2,167,946
41. Leases
31.12.2018
470
1,831
2,842
Operating lease commitments 5,143
31.12.2019 31.12.2018
17,559 18,524
30,960 30,195
3,538 3,011
Total gross investment in the lease 52,057 51,730
15,303 16,069
27,628 26,730
2,692 2,317
Total present value of lease payments* 45,623 45,116
Unearned interest income 6,434 6,614
202 193
3,165 3,166 Interest income from finance lease receivables during the year ................................................................................
Due within 1 year ......................................................................................................................................................
Due in 1-5 years .......................................................................................................................................................
Expected credit loss allowance .................................................................................................................................
Due within 1 year ......................................................................................................................................................
Due in 1-5 years .......................................................................................................................................................
Due in more than 5 years .........................................................................................................................................
Custody assets - not managed by the Group ............................................................................................................
The Group's significant leases are leases for offices, branches and storage but the Group also leases land and vehicles. Most leases are
CPI-linked real estate leases with duration of 5-10 years with extension options. Lease commitments are recognised on-balance sheet
except for short-term leases and leases of low-value assets. Total expense for leases of low-value assets and short-term leases amounted
to ISK 21 million during the year 2019.
Net investment in finance lease receivables
The Group adopted a new IFRS standard, IFRS 16 - Leases as of 1 January 2019 (see Note 3). As a result of the adoption the Group
changed its accounting policy for leases (see Note 66.10).
The Group as a lessee
The Group as a lessor
Due in more than 5 years .........................................................................................................................................
*The Group presents finance lease receivables in the line item “Loans to customers”.
Right-of-use assets are presented in the line item “Property and equipment” (see Note 29). Lease liabilities are presented in the line item
“Other liabilities” (see Note 39).
Due within 1 year ...........................................................................................................................................................................
Due in 1-5 years .............................................................................................................................................................................
Due in more than 5 years ...............................................................................................................................................................
At 31 December 2018 the future non-cancellable minimum operating lease payments where the Group was a lessee was:
Total cash outflow for leases amounted to ISK 493 million (2018: ISK 492 million).
Íslandsbanki hf. Consolidated Financial Statements 2019 45 Amounts are in ISK million
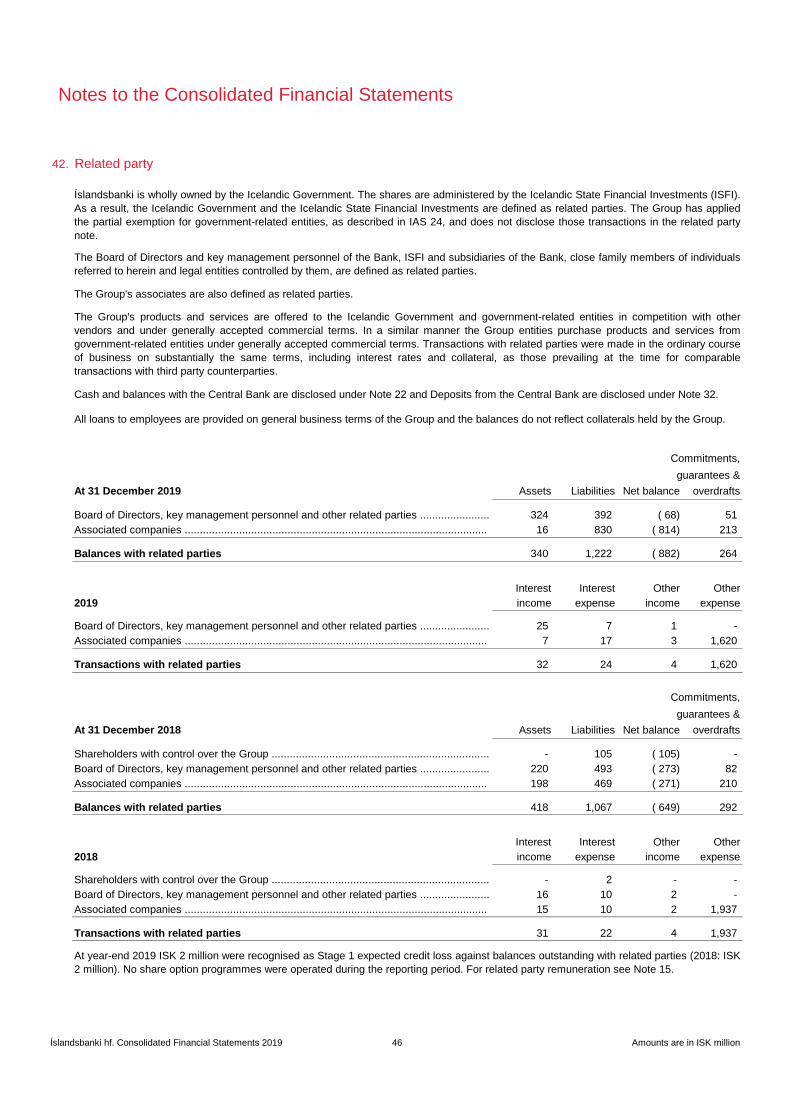
Notes to the Consolidated Financial Statements
42. Related party
Commitments,
guarantees &
At 31 December 2019 Assets Liabilities Net balance overdrafts
324 392 ( 68) 51
16 830 ( 814) 213
Balances with related parties 340 1,222 ( 882) 264
Interest Interest Other Other
2019 income expense income expense
25 7 1 -
7 17 3 1,620
Transactions with related parties 32 24 4 1,620
Commitments,
guarantees &
At 31 December 2018 Assets Liabilities Net balance overdrafts
- 105 ( 105) -
220 493 ( 273) 82
198 469 ( 271) 210
Balances with related parties 418 1,067 ( 649) 292
Interest Interest Other Other
2018 income expense income expense
- 2 - -
16 10 2 -
15 10 2 1,937
Transactions with related parties 31 22 4 1,937
At year-end 2019 ISK 2 million were recognised as Stage 1 expected credit loss against balances outstanding with related parties (2018: ISK
2 million). No share option programmes were operated during the reporting period. For related party remuneration see Note 15.
Board of Directors, key management personnel and other related parties .......................
Associated companies ....................................................................................................
Shareholders with control over the Group ........................................................................
Board of Directors, key management personnel and other related parties .......................
Associated companies ....................................................................................................
The Group's products and services are offered to the Icelandic Government and government-related entities in competition with other
vendors and under generally accepted commercial terms. In a similar manner the Group entities purchase products and services from
government-related entities under generally accepted commercial terms. Transactions with related parties were made in the ordinary course
of business on substantially the same terms, including interest rates and collateral, as those prevailing at the time for comparable
transactions with third party counterparties.
Cash and balances with the Central Bank are disclosed under Note 22 and Deposits from the Central Bank are disclosed under Note 32.
The Board of Directors and key management personnel of the Bank, ISFI and subsidiaries of the Bank, close family members of individuals
referred to herein and legal entities controlled by them, are defined as related parties.
Íslandsbanki is wholly owned by the Icelandic Government. The shares are administered by the Icelandic State Financial Investments (ISFI).
As a result, the Icelandic Government and the Icelandic State Financial Investments are defined as related parties. The Group has applied
the partial exemption for government-related entities, as described in IAS 24, and does not disclose those transactions in the related party
note.
Board of Directors, key management personnel and other related parties .......................
All loans to employees are provided on general business terms of the Group and the balances do not reflect collaterals held by the Group.
Associated companies ....................................................................................................
The Group's associates are also defined as related parties.
Íslandsbanki hf. Consolidated Financial Statements 2019 46 Amounts are in ISK million

Notes to the Consolidated Financial Statements
43. Contingencies
Contingent liabilities
Borgun hf.
44. Events after the reporting period
45. Risk management
Risk governance
Borgun hf., a subsidiary of Íslandsbanki, is a payment acquirer and issuing processor. Landsbankinn hf. sold its 31.2% stake in Borgun in
late 2014. Landsbankinn claims that Borgun's management did not disclose all available information that might have affected the value of
Borgun during the sales process, namely the worth of its stake in Visa Europe which was sold to Visa International shortly after the Borgun
sale. In order to reclaim the alleged loss, Landsbankinn filed a lawsuit against Borgun hf. and others on 12 January 2017, claiming the right
to damages for having been deprived of the true value of the stake involved in the sale. Landsbankinn does not quantify the claim, but its
estimate of the lost profit from having sold its shares in Borgun is approximately ISK 1,930 million. Seeing that the conclusion of the case is
uncertain and the financial effect cannot be estimated the Group has not recognised a provision in relation to this matter. Court appointed
surveyors presented their assessment in November 2019. A reassessment has been demanded. It is uncertain when a ruling is to be
expected.
The ultimate responsibility for ensuring an adequate risk management and internal control framework at the Group lies with the Board of
Directors. The Board defines and communicates the risk governance framework and the acceptable level of risk through risk management
policies and the Risk Appetite Statement. To assist the Board in fulfilling its oversight responsibilities, the Board has appointed three board
subcommittees.
The CEO is responsible for the day-to-day operations of the Bank, pursuant to set policies and resolutions of the Board. Moreover, it is the
task of the CEO to ensure that the Group's operations are consistent with applicable legislation and the Group's Articles of Association which
includes maintaining adequate and effective risk management and internal control functions. The CEO appoints the Chief Risk Officer, the
Compliance Officer as well as other members of the Executive Board. The CEO also engages the members of the senior management
committees.
The Group's management body has a dual structure. The Board of Directors of the Bank has a supervising role in setting and monitoring the
execution of set policies, the sound control of accounting and financial management and ensuring that group internal audit, compliance and
risk management are effective. The Chief Executive Officer (CEO), the Chief Risk Officer (CRO), other members of the senior management
and the senior management committees are responsible for implementing risk management practises and internal monitoring in accordance
with Board authorisation.
The CRO heads the risk management function and is responsible for defining the daily tasks of the department and to assess the adequacy
of its professional skills. In addition, the CRO is responsible for monitoring the risk management framework at the Group and for verifying
that the Bank has the right resources and an appropriate organisation to manage its risks efficiently.
The CRO is selected and appointed by the CEO, subject to Board confirmation. The CRO reports directly to the Board and the Board Risk
Committee on the overall risk profile of the Group and cannot be removed without the Board's prior approval.
No events have arisen after the reporting period that require amendments or additional disclosures in the consolidated financial statements
for the year ended 31 December 2019.
The Group is exposed to various risk factors and managing these risks is an integral part of its operations. The Bank emphasises sound
governance principles. The risk management and internal control framework of the Group is based on a three lines of defence model, as
referred to in the European Banking Authority Guidelines on Internal Governance, and aims for informed decision-making and strong risk
awareness. The framework is intended to ensure effective and efficient operations, adequate control of risks, prudent conduct of business,
reliability of financial and non-financial information reported internally and externally, and compliance with laws, regulations, supervisory
requirements and the Group’s internal rules.
The first line of defence consists of the Bank's business and support units; the second line of defence comprises the Bank's internal control
units, risk management and compliance; and the third line of defence is Internal Audit which gives the Board an independent assessment of
the quality of corporate governance, risk management and internal controls.
Íslandsbanki hf. Consolidated Financial Statements 2019 47 Amounts are in ISK million

Notes to the Consolidated Financial Statements
45.
More information about the Group's risk management and risk assessment processes is available in the unaudited Pillar 3 2019 Report,
which is available on the Bank's website: www.islandsbanki.is.
Cont'd
The Bank's senior management committee structure is twofold. Firstly the two executive committees, the Executive Board and the All Risk
Committee, that are responsible for the implementation of the Board approved business strategy, risk appetite and policies. Secondly the
four business committees, the Asset and Liability Committee (ALCO), the Senior Credit Committee (SCC), the Investment Committee (IC)
and the Operational and Security Committee (OSC), which are responsible for the approval of business or operational proposals subject to
internal rules and guidelines issued by the executive committees and the Board.
The members of the senior management committees are appointed by the CEO, and their mandate and rules of procedure are documented
in a charter issued by the CEO.
Business and support units are, however, responsible for maintaining their independent view on the risks inherent in their operations and
reporting to senior management any foreseeable breaches from limits, policies or strategic direction.
Risk management provides the senior management and the Board with all relevant risk related information to enable it to define the Bank's
risk appetite.
The General Counsel is appointed by and reports directly to the CEO. The General Counsel provides legal advice to the Bank's senior
management, including the Board of Directors, and manages the Bank's legal department which provides comprehensive legal advice to the
Bank's business segments and support units.
The Chief Audit Executive (CAE) is appointed by the Board, reports directly to Board and directs Group Internal Audit with a mandate from
the Board. The CAE is responsible for internal audit matters within the Group, including internal audit tasks which have been outsourced.
The Compliance Officer heads the compliance function and is responsible for defining the daily tasks of the department and assessing the
adequacy of its professional skills. The Compliance Officer is responsible for monitoring the compliance risk management framework for the
Bank and maintaining oversight for compliance risk throughout the Bank.
The Bank's Compliance Officer is selected and engaged by the CEO, subject to Board confirmation. The Compliance Officer cannot be
removed without the Board's prior approval. The Financial Supervisory Authority and Chief Audit Executive shall be notified of the dismissal
or departure of the Compliance Officer.
The Compliance Officer reports directly to the Board on the overall compliance risk profile of the Bank.
Each employee is responsible for understanding the risk related to their day-to-day work, for knowing and understanding the respective
internal and external rules and procedures, for using the alert procedures in the event of possible fraudulent activities and for conducting
business in accordance with the Bank's code of conduct.
The CRO is independent from the business units, is a member of the Executive Board and reports directly to the CEO. The CRO provides an
independent view on the Group's exposure to risk. The CRO has the right but not the responsibility to veto certain risk-taking decisions of the
senior management committees if an internal control unit considers the proposal inconsistent with the Bank's risk appetite, policies or
procedures.
Risk management is mandated to identify, understand, measure and monitor the risks that the Group is exposed to. It provides independent
information, analyses and expert judgement on risk exposures, and advice on proposals and risk decisions made by the management and
business or support units as to whether they are consistent with the risk appetite and risk polices set by the Board.
Where necessary, risk management makes recommendations to senior management and the Board to improve or clarify risk policies,
procedures and limits.
Risk Management provides a holistic view on risk, and compliance to limits to internal and external stakeholders, and ensures an appropriate
escalation in the event of limit breaches.
Íslandsbanki hf. Consolidated Financial Statements 2019 48 Amounts are in ISK million

Notes to the Consolidated Financial Statements
46. Credit risk
Credit concentration risk is the significantly increased risk that is driven by common underlying factors, e.g. industrial sector, economy,
geographical location, type of financial instrument or due to connections or relations among counterparties. This includes exposures to
parties under common control and significant exposures to groups of counterparties whose likelihood of default is driven by common
underlying factors.
The Group has policies and procedures dedicated to accepting, measuring, and managing credit risk. The objective of the Group's credit risk
management is to achieve an appropriate balance between risk and return and to minimise potential adverse effects of credit risk on the
Group's financial performance.
Credit risk is defined as current or prospective risk to earnings and capital arising from an obligor's potential failure to meet the terms of any
financial contract with the Group.
A thorough analysis of the counterparty's financial standing, analysis of past and estimated future cash flows as well as the borrower's
general ability to repay its obligations forms the basis for all credit decisions. The Group structures the levels of credit risk it undertakes by
placing limits on the amount of risk accepted in relation to one borrower, groups of borrowers, countries and industry segments. The Group
measures and consolidates its credit risk for each counterparty or group of connected clients in accordance with internal and external criteria
of connection between parties.
The Group employs a range of policies and practices to mitigate credit risk. The most traditional of these is the taking of security in
borrower's assets. The principal collateral types for loans are properties, vehicles, equipment, vessels and securities. When applicable, other
credit risk mitigants are employed.
Credit risk arises principally from loans and advances to customers and other banks but also from balances with the Central Bank and off-
balance sheet items such as financial guarantees, loan commitments and derivatives.
Íslandsbanki hf. Consolidated Financial Statements 2019 49 Amounts are in ISK million

47.
At 31 December 2019
Individuals
Central
governments
Commerce
and services Construction Energy
Financial
services
Industrial and
transportation
Investment
companies
Public sector
and non-profit
organisations Real estate Seafood Total
Cash and balances with Central Bank ....... - 146,638 - - - - - - - - - 146,638
Loans to credit institutions ......................... - - - - - 54,376 - - - - - 54,376
Bonds and debt instruments ...................... - 33,007 - - 125 16,131 1,296 52 1,027 1,232 - 52,870
Derivatives ................................................ - - 706 - 1,836 5,788 189 530 - 208 228 9,485
Loans to customers: 349,181 - 126,488 44,420 7,887 2,315 82,288 23,590 12,312 145,559 105,592 899,632
Overdrafts ......................................... 12,333 - 14,506 3,425 110 2,289 4,927 654 1,204 3,220 6,270 48,938
Credit cards ....................................... 16,466 - 1,579 271 5 24 437 40 106 63 35 19,026
Mortgages ......................................... 281,450 - 5 - - - - - - 44 - 281,499
Capital leases .................................... 5,774 - 28,422 2,700 15 - 7,322 139 39 1,005 207 45,623
Other loans ....................................... 33,158 - 81,976 38,024 7,757 2 69,602 22,757 10,963 141,227 99,080 504,546
Other financial assets ................................ 532 - 199 7 6 4,803 117 41 10 36 6 5,757
Off-balance sheet items: 33,964 - 24,605 16,035 2,974 6,579 18,865 548 3,461 19,036 9,738 135,805
Financial guarantees ............................ 1,477 - 6,035 4,914 - 1,172 2,907 95 5 2,004 252 18,861
Undrawn loan commitments ................. - - 1,871 8,297 2,442 - 9,726 - - 11,303 1,804 35,443
Undrawn overdrafts .............................. 9,842 - 12,476 2,063 503 5,291 5,135 314 2,733 5,456 7,525 51,338
Credit card commitments ..................... 22,645 - 4,223 761 29 116 1,097 139 723 273 157 30,163
Maximum credit exposure 383,677 179,645 151,998 60,462 12,828 89,992 102,755 24,761 16,810 166,071 115,564 1,304,563
Notes to the Consolidated Financial Statements
Maximum credit exposure
The Group's credit risk exposure comprises both on-balance sheet and off-balance sheet items. Maximum exposure to credit risk for on-balance sheet assets is the net carrying amount as reported in the
statement of financial position. The maximum exposure for off-balance sheet items is the amount that the Group might have to pay out against financial guarantees and loan commitments, less provisions that
have been made because of these items. The maximum credit exposure for a derivative contract is calculated by adding potential future credit exposure to the positive market value of the contract.
The industry breakdown shows the credit exposure by industry classification. The breakdown follows an internal industry classification which is based on the Icelandic ISAT2008 that derives from the European
NACE Rev. 2 classification standard.
The Group's credit exposure, before taking account of any collateral held or other credit enhancements, is as follows:
Íslandsbanki hf. Consolidated Financial Statements 2019 50 Amounts are in ISK million

47. Cont'd
At 31 December 2018
Individuals
Central
governments
Commerce
and services Construction Energy
Financial
services
Industrial and
transportation
Investment
companies
Public sector
and non-profit
organisations Real estate Seafood Total
Cash and balances with Central Bank ....... - 135,056 - - - - - - - - - 135,056
Loans to credit institutions ......................... - - - - - 41,577 - - - - - 41,577
Bonds and debt instruments ...................... - 53,341 - - 447 12,925 1,724 68 724 186 - 69,415
Derivatives ................................................ - - 121 2 2,322 4,687 451 1,090 - 61 205 8,939
Loans to customers: 319,390 - 124,242 29,095 6,858 1,704 79,824 23,799 12,087 142,885 106,715 846,599
Overdrafts ......................................... 11,769 - 11,699 3,304 31 1,509 4,483 780 754 4,501 9,751 48,581
Credit cards ....................................... 15,779 - 1,516 251 4 21 433 33 112 59 34 18,242
Mortgages ......................................... 249,296 - - - - - - - - - - 249,296
Capital leases .................................... 6,504 - 27,552 2,270 5 - 7,166 116 48 1,197 258 45,116
Other loans ....................................... 36,042 - 83,475 23,270 6,818 174 67,742 22,870 11,173 137,128 96,672 485,364
Other financial assets ................................ 409 - 451 5 1 6,532 23 34 3 18 35 7,511
Off-balance sheet items: 33,928 - 24,673 18,703 6,091 8,160 12,413 3,817 4,517 20,850 12,805 145,957
Financial guarantees ......................... 1,494 - 5,863 4,563 12 1,172 2,416 160 5 1,828 508 18,021
Undrawn loan commitments .............. - - 4,986 11,662 5,996 - 4,899 1,100 - 14,629 5,782 49,054
Undrawn overdrafts ........................... 10,187 - 9,908 1,830 63 6,863 4,124 2,433 3,884 4,167 6,374 49,833
Credit card commitments .................. 22,247 - 3,916 648 20 125 974 124 628 226 141 29,049
Maximum credit exposure 353,727 188,397 149,487 47,805 15,719 75,585 94,435 28,808 17,331 164,000 119,760 1,255,054
48. Credit exposure covered by collateral
Collateral and other credit mitigants vary between types of obligors and credit facilities. Loans to credit institutions are usually unsecured. For loans to individuals the principal collateral taken is residential
property against mortgages. In the case of corporate entities the Group takes a charge over assets such as real estate, vessels, cash and securities as well as other collateral including accounts receivables,
inventory, vehicles and equipment. Loans to government entities and to municipalities are more often than not unsecured. Derivative exposures are generally made under ISDA master agreements with Credit
Support Annex or corresponding terms with pledged collateral in the form of cash and government bonds.
In some cases the Group uses guarantees as a credit enhancement but since guarantees effectively transfer credit risk from one counterparty to another they do not represent a reduction in maximum exposure
to credit risk. Covenants in loan agreements are also an important credit enhancement but do not reduce maximum credit exposure.
Notes to the Consolidated Financial Statements
Íslandsbanki hf. Consolidated Financial Statements 2019 51 Amounts are in ISK million

48.
Total credit
Maximum exposure
exposure to Real Cash & Vehicles & Other covered by Net Associated
Collateral held against non credit-impaired exposures credit risk estate Vessels securities equipment collateral collateral exposure ECL
9,485 - - 1,757 - - 1,757 7,728 -
Loans and commitments to customers: 1,012,821 622,021 87,217 7,001 49,865 80,043 846,147 166,674 5,056
374,718 292,701 7 417 13,317 116 306,558 68,160 1,579
146,149 63,151 777 961 27,124 25,891 117,904 28,245 1,030
55,236 40,432 4 653 2,130 3,968 47,187 8,049 495
10,861 5,655 - 366 8 5 6,034 4,827 34
8,894 - - 123 - 3,621 3,744 5,150 7
99,188 49,944 12 107 6,757 18,566 75,386 23,802 534
23,982 7,748 - 3,281 71 11,930 23,030 952 478
15,758 958 - 7 29 - 994 14,764 29
162,795 148,919 5 1,072 301 1,125 151,422 11,373 702
115,240 12,513 86,412 14 128 14,821 113,888 1,352 168
Total 1,022,306 622,021 87,217 8,758 49,865 80,043 847,904 174,402 5,056
Collateral held against credit-impaired exposures
Loans and commitments to customers: 22,616 17,100 1,481 333 846 830 20,590 2,026 5,931
8,427 7,191 17 12 166 2 7,388 1,039 1,245
4,944 2,980 102 22 561 805 4,470 474 1,864
5,219 4,919 - 197 19 7 5,142 77 261
1,965 253 1,331 102 72 16 1,774 191 1,559
156 149 - - - - 149 7 111
15 14 - - - - 14 1 1
1,800 1,567 - - 9 - 1,576 224 595
90 27 31 - 19 - 77 13 295
Total 22,616 17,100 1,481 333 846 830 20,590 2,026 5,931
Public sector and non-profit organisations ..............................................................................
Real estate .............................................................................................................................
Seafood ..................................................................................................................................
Individuals ..............................................................................................................................
Construction ...........................................................................................................................
Energy ....................................................................................................................................
Financial services ...................................................................................................................
Industrial and transportation ...................................................................................................
Investment companies ............................................................................................................
Notes to the Consolidated Financial Statements
Valuation of collateral is based on market price, official valuation for tax purposes or expert opinion of the Group's employees, depending on availability. In the case of fishing vessels the associated fishing
quota is included in the valuation. Collateral is allocated according to the gross carrying amount of loans and nominal off-balance sheet items, and is measured without including the effect of
overcollateralisation. This means that if some loans have collateral values in excess of their gross carrying amount, then the excess is removed in order to reflect the Group's actual maximum exposure to
credit risk. The total value of pledged assets can thus be higher than the cover indicates. The maximum credit risk exposure is measured on net carrying value basis, and therefore collateral allocation can in
some instances be higher. For capital leases the Group remains the owner of the leased object. In total ISK 37,035 million of the collateral are leased objects.
Cont'd
Construction ...........................................................................................................................
Industrial and transportation ...................................................................................................
Investment companies ............................................................................................................
Public sector and non-profit organisations ..............................................................................
Real estate .............................................................................................................................
Seafood ..................................................................................................................................
At 31 December 2019
The following tables show the maximum exposure to credit risk by class of financial asset and collateral held against those exposures. An overview of collateral held by the Group against credit exposure is
shown below for exposures in Stages 1 and 2 (non credit-impaired) and exposures in Stage 3 (credit-impaired):
Derivatives ..............................................................................................................................
Commerce and services .........................................................................................................
Individuals ..............................................................................................................................
Commerce and services .........................................................................................................
Íslandsbanki hf. Consolidated Financial Statements 2019 52 Amounts are in ISK million
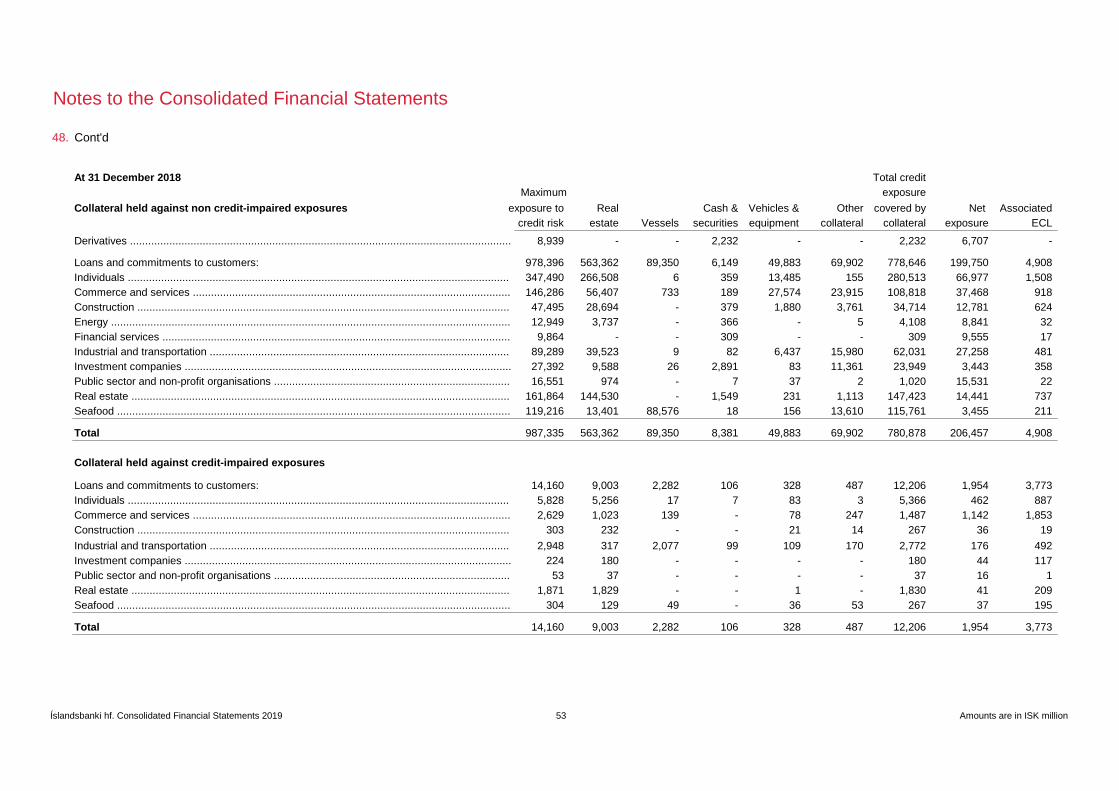
48.
Notes to the Consolidated Financial Statements
Cont'd
Total credit
Maximum exposure
Collateral held against non credit-impaired exposures exposure to Real Cash & Vehicles & Other covered by Net Associated
credit risk estate Vessels securities equipment collateral collateral exposure ECL
8,939 - - 2,232 - - 2,232 6,707 -
Loans and commitments to customers: 978,396 563,362 89,350 6,149 49,883 69,902 778,646 199,750 4,908
347,490 266,508 6 359 13,485 155 280,513 66,977 1,508
146,286 56,407 733 189 27,574 23,915 108,818 37,468 918
47,495 28,694 - 379 1,880 3,761 34,714 12,781 624
12,949 3,737 - 366 - 5 4,108 8,841 32
9,864 - - 309 - - 309 9,555 17
89,289 39,523 9 82 6,437 15,980 62,031 27,258 481
27,392 9,588 26 2,891 83 11,361 23,949 3,443 358
16,551 974 - 7 37 2 1,020 15,531 22
161,864 144,530 - 1,549 231 1,113 147,423 14,441 737
119,216 13,401 88,576 18 156 13,610 115,761 3,455 211
Total 987,335 563,362 89,350 8,381 49,883 69,902 780,878 206,457 4,908
Collateral held against credit-impaired exposures
Loans and commitments to customers: 14,160 9,003 2,282 106 328 487 12,206 1,954 3,773
5,828 5,256 17 7 83 3 5,366 462 887
2,629 1,023 139 - 78 247 1,487 1,142 1,853
303 232 - - 21 14 267 36 19
2,948 317 2,077 99 109 170 2,772 176 492
224 180 - - - - 180 44 117
53 37 - - - - 37 16 1
1,871 1,829 - - 1 - 1,830 41 209
304 129 49 - 36 53 267 37 195
Total 14,160 9,003 2,282 106 328 487 12,206 1,954 3,773
Industrial and transportation ...................................................................................................
Individuals ..............................................................................................................................
Commerce and services .........................................................................................................
Construction ...........................................................................................................................
Energy ....................................................................................................................................
Financial services ...................................................................................................................
Derivatives ..............................................................................................................................
Real estate .............................................................................................................................
Seafood ..................................................................................................................................
Investment companies ............................................................................................................
Public sector and non-profit organisations ..............................................................................
Real estate .............................................................................................................................
Seafood ..................................................................................................................................
Public sector and non-profit organisations ..............................................................................
Industrial and transportation ...................................................................................................
Investment companies ............................................................................................................
At 31 December 2018
Íslandsbanki hf. Consolidated Financial Statements 2019 53 Amounts are in ISK million
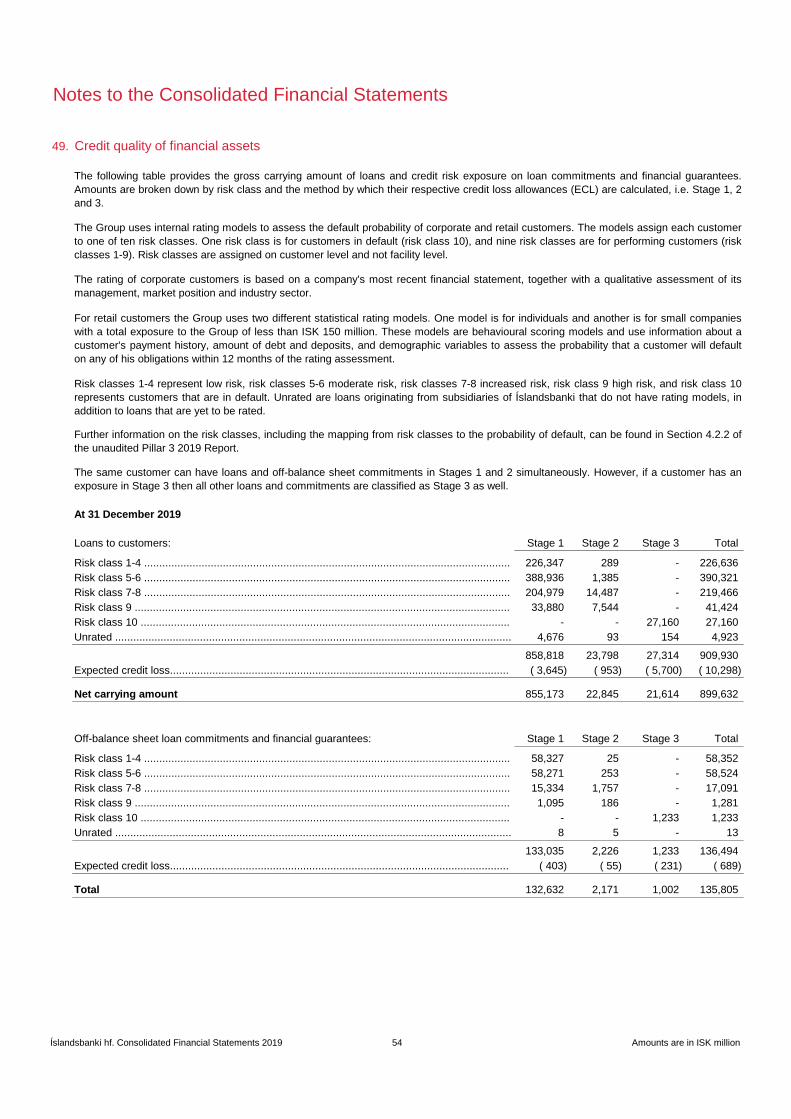
49.
At 31 December 2019
Loans to customers: Stage 1 Stage 2 Stage 3 Total
226,347 289 - 226,636
388,936 1,385 - 390,321
204,979 14,487 - 219,466
33,880 7,544 - 41,424
- - 27,160 27,160
4,676 93 154 4,923
858,818 23,798 27,314 909,930
( 3,645) ( 953) ( 5,700) ( 10,298)
Net carrying amount 855,173 22,845 21,614 899,632
Off-balance sheet loan commitments and financial guarantees: Stage 1 Stage 2 Stage 3 Total
58,327 25 - 58,352
58,271 253 - 58,524
15,334 1,757 - 17,091
1,095 186 - 1,281
- - 1,233 1,233
8 5 - 13
133,035 2,226 1,233 136,494
( 403) ( 55) ( 231) ( 689)
Total 132,632 2,171 1,002 135,805
Notes to the Consolidated Financial Statements
Credit quality of financial assets
The following table provides the gross carrying amount of loans and credit risk exposure on loan commitments and financial guarantees.
Amounts are broken down by risk class and the method by which their respective credit loss allowances (ECL) are calculated, i.e. Stage 1, 2
and 3.
The Group uses internal rating models to assess the default probability of corporate and retail customers. The models assign each customer
to one of ten risk classes. One risk class is for customers in default (risk class 10), and nine risk classes are for performing customers (risk
classes 1-9). Risk classes are assigned on customer level and not facility level.
The rating of corporate customers is based on a company's most recent financial statement, together with a qualitative assessment of its
management, market position and industry sector.
Risk class 5-6 .........................................................................................................................
Risk class 7-8 .........................................................................................................................
Risk class 9 ............................................................................................................................
Risk class 10 ..........................................................................................................................
Unrated ...................................................................................................................................
Expected credit loss................................................................................................................
For retail customers the Group uses two different statistical rating models. One model is for individuals and another is for small companies
with a total exposure to the Group of less than ISK 150 million. These models are behavioural scoring models and use information about a
customer's payment history, amount of debt and deposits, and demographic variables to assess the probability that a customer will default
on any of his obligations within 12 months of the rating assessment.
Risk classes 1-4 represent low risk, risk classes 5-6 moderate risk, risk classes 7-8 increased risk, risk class 9 high risk, and risk class 10
represents customers that are in default. Unrated are loans originating from subsidiaries of Íslandsbanki that do not have rating models, in
addition to loans that are yet to be rated.
Further information on the risk classes, including the mapping from risk classes to the probability of default, can be found in Section 4.2.2 of
the unaudited Pillar 3 2019 Report.
The same customer can have loans and off-balance sheet commitments in Stages 1 and 2 simultaneously. However, if a customer has an
exposure in Stage 3 then all other loans and commitments are classified as Stage 3 as well.
Risk class 1-4 .........................................................................................................................
Expected credit loss................................................................................................................
Risk class 1-4 .........................................................................................................................
Risk class 5-6 .........................................................................................................................
Risk class 7-8 .........................................................................................................................
Risk class 9 ............................................................................................................................
Risk class 10 ..........................................................................................................................
Unrated ...................................................................................................................................
Íslandsbanki hf. Consolidated Financial Statements 2019 54 Amounts are in ISK million

Notes to the Consolidated Financial Statements
49.
Risk Risk Risk Risk Risk
At 31 December 2019 class class class class class
1-4 5-6 7-8 9 10 Unrated ECL Total
Loans and commitments to customers:
76,119 151,224 115,042 29,537 9,517 4,530 ( 2,824) 383,145
29,718 81,536 31,572 3,968 6,810 383 ( 2,894) 151,093
3,354 33,345 17,924 1,120 5,468 - ( 756) 60,455
5,045 3,846 2,004 - - - ( 34) 10,861
8,848 30 17 - - 6 ( 7) 8,894
26,474 59,108 11,775 2,363 3,526 - ( 2,093) 101,153
2,803 9,198 11,090 1,367 268 1 ( 589) 24,138
12,761 2,733 268 11 15 15 ( 30) 15,773
52,934 64,623 42,304 3,631 2,400 - ( 1,297) 164,595
66,932 43,202 4,561 708 389 1 ( 463) 115,330
Total 284,988 448,845 236,557 42,705 28,393 4,936 ( 10,987) 1,035,437
At 31 December 2018
Loans to customers: Stage 1 Stage 2 Stage 3 Total
213,012 104 - 213,116
367,843 1,055 - 368,898
184,807 15,339 - 200,146
38,633 12,363 - 50,996
- - 17,215 17,215
4,137 41 95 4,273
808,432 28,902 17,310 854,644
( 3,277) ( 1,079) ( 3,689) ( 8,045)
Net carrying amount 805,155 27,823 13,621 846,599
Off-balance sheet loan commitments and financial guarantees: Stage 1 Stage 2 Stage 3 Total
68,712 30 - 68,742
55,112 194 - 55,306
16,913 1,899 - 18,812
1,517 1,460 - 2,977
- - 623 623
130 3 - 133
142,384 3,586 623 146,593
( 410) ( 142) ( 84) ( 636)
Total 141,974 3,444 539 145,957
Risk Risk Risk Risk Risk
At 31 December 2018 class class class class class
1-4 5-6 7-8 9 10 Unrated ECL Total
Loans and commitments to customers:
74,325 135,721 101,859 33,354 6,955 3,499 ( 2,395) 353,318
33,700 84,690 23,538 5,455 3,718 585 ( 2,771) 148,915
3,387 21,930 21,711 1,024 336 53 ( 643) 47,798
11,472 544 965 - - - ( 32) 12,949
9,450 419 8 - - 4 ( 17) 9,864
34,253 41,922 8,331 4,930 3,705 69 ( 973) 92,237
5,709 6,976 10,751 4,241 414 - ( 475) 27,616
13,150 3,119 240 - 52 66 ( 23) 16,604
41,768 73,484 44,312 2,909 2,172 36 ( 946) 163,735
54,644 55,399 7,243 2,060 486 94 ( 406) 119,520
Total 281,858 424,204 218,958 53,973 17,838 4,406 ( 8,681) 992,556
Cont'd
Individuals .......................................................
Commerce and services ..................................
Construction ....................................................
Energy .............................................................
Financial services ............................................
Risk class 1-4 .........................................................................................................................
Risk class 5-6 .........................................................................................................................
Risk class 7-8 .........................................................................................................................
Risk class 9 ............................................................................................................................
Risk class 10 ..........................................................................................................................
Unrated ...................................................................................................................................
Industrial and transportation ............................
Investment companies .....................................
Public sector and non-profit organisations .......
Real estate ......................................................
Seafood ...........................................................
Unrated ...................................................................................................................................
Expected credit loss ...............................................................................................................
Individuals .......................................................
Commerce and services ..................................
Construction ....................................................
Energy .............................................................
Expected credit loss ...............................................................................................................
Risk class 1-4 .........................................................................................................................
Risk class 5-6 .........................................................................................................................
Risk class 7-8 .........................................................................................................................
Risk class 9 ............................................................................................................................
Risk class 10 ..........................................................................................................................
Financial services ............................................
Industrial and transportation ............................
Investment companies .....................................
Public sector and non-profit organisations .......
Real estate ......................................................
Seafood ...........................................................
Íslandsbanki hf. Consolidated Financial Statements 2019 55 Amounts are in ISK million
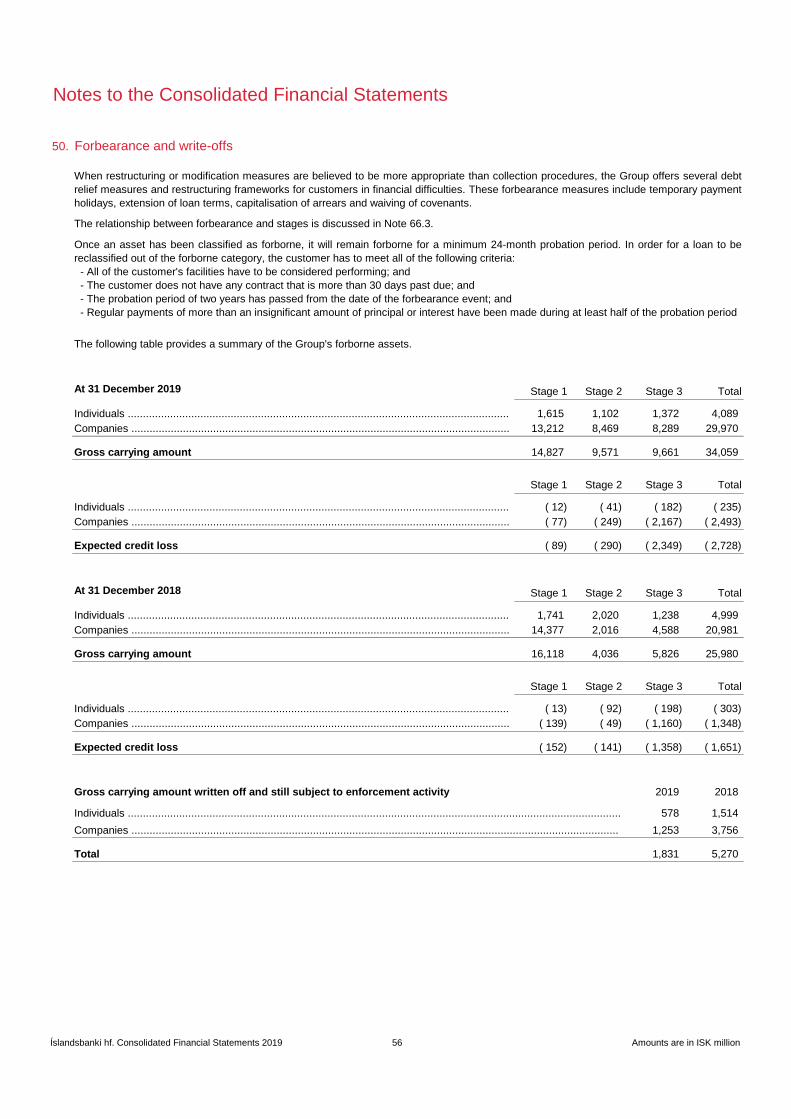
Notes to the Consolidated Financial Statements
50.
At 31 December 2019 Stage 1 Stage 2 Stage 3 Total
1,615 1,102 1,372 4,089
13,212 8,469 8,289 29,970
Gross carrying amount 14,827 9,571 9,661 34,059
Stage 1 Stage 2 Stage 3 Total
( 12) ( 41) ( 182) ( 235)
( 77) ( 249) ( 2,167) ( 2,493)
Expected credit loss ( 89) ( 290) ( 2,349) ( 2,728)
At 31 December 2018 Stage 1 Stage 2 Stage 3 Total
1,741 2,020 1,238 4,999
14,377 2,016 4,588 20,981
Gross carrying amount 16,118 4,036 5,826 25,980
Stage 1 Stage 2 Stage 3 Total
( 13) ( 92) ( 198) ( 303)
( 139) ( 49) ( 1,160) ( 1,348)
Expected credit loss ( 152) ( 141) ( 1,358) ( 1,651)
2019 2018
578 1,514
1,253 3,756
Total 1,831 5,270
Forbearance and write-offs
When restructuring or modification measures are believed to be more appropriate than collection procedures, the Group offers several debt
relief measures and restructuring frameworks for customers in financial difficulties. These forbearance measures include temporary payment
holidays, extension of loan terms, capitalisation of arrears and waiving of covenants.
The relationship between forbearance and stages is discussed in Note 66.3.
Once an asset has been classified as forborne, it will remain forborne for a minimum 24-month probation period. In order for a loan to be
reclassified out of the forborne category, the customer has to meet all of the following criteria:
- All of the customer's facilities have to be considered performing; and
- The customer does not have any contract that is more than 30 days past due; and
- The probation period of two years has passed from the date of the forbearance event; and
- Regular payments of more than an insignificant amount of principal or interest have been made during at least half of the probation period
The following table provides a summary of the Group's forborne assets.
Individuals ..............................................................................................................................
Individuals ..............................................................................................................................
Companies .............................................................................................................................
Gross carrying amount written off and still subject to enforcement activity
Individuals ...................................................................................................................................................................
Companies .................................................................................................................................................................
Companies .............................................................................................................................
Individuals ..............................................................................................................................
Companies .............................................................................................................................
Individuals ..............................................................................................................................
Companies .............................................................................................................................
Íslandsbanki hf. Consolidated Financial Statements 2019 56 Amounts are in ISK million

Notes to the Consolidated Financial Statements
51.
31.12.2019 31.12.2018
378 1,072
81 41
Total 459 1,113
52.
At 31 December 2019
Groups of connected clients: Before After
75% -
At 31 December 2018
Groups of connected clients: Before After
73% -
12% 12%
12% 11%
11% 11%
13% 11%
53. Liquidity risk
Large exposures disclosure
Group 1 ......................................................................................................................................................................
Group 2 ......................................................................................................................................................................
Group 3 ......................................................................................................................................................................
Group 4 ......................................................................................................................................................................
When the Group's total exposure to a group of connected clients is 10% or higher of the Group's capital base it is considered a large
exposure. Both on-balance sheet and off-balance sheet items from all types of financial instruments are included in the exposure as defined
by regulation no. 233/2017. The Group has internal criteria that define connections between clients. These criteria reflect the Group's
interpretation of Article (1)(a) of the Act on Financial Undertakings no. 161/2002, where groups of connected clients are defined.
The exposure is evaluated both before and after credit risk mitigating effects. After mitigating effects, the Group currently has no large
exposures, a decrease of four since the last reporting date. No large exposure is therefore above the maximum 25% single large exposure
limit set by the law.
The following tables show the Group's large exposures as a percentage of the Group's capital base, before and after eligible credit risk
mitigating effects.
Group 1 ......................................................................................................................................................................
Group 5 ......................................................................................................................................................................
The Group defines liquidity risk as the risk of not being able to fund its financial obligations or planned growth, or only being able to do so
substantially above the prevailing market cost of funds.
The Group's main source of funding is customer deposits. Treasury is responsible for the Bank's funding and liquidity management in line
with internal and regulatory limits and policies. Treasury manages the Bank's intraday liquidity. Risk Management, as the second line of
defence, is responsible for independent reporting on the liquidity position to internal and external stakeholders and providing a holistic view
on liquidity risk on a consolidated basis.
Assets obtained by taking possession of collateral
Details of non-financial assets obtained by the Group during the year by taking possession of collateral held as security against loans.
Property and land .......................................................................................................................................................
Industrial equipment and vehicles ...............................................................................................................................
The Group pursues realisation of the collateral in an orderly manner. The Group does not generally use the non-cash collateral for its own
operations. The Group's employees are not permitted to purchase foreclosed assets.
Íslandsbanki hf. Consolidated Financial Statements 2019 57 Amounts are in ISK million

Notes to the Consolidated Financial Statements
54. Liquidity coverage and Net stable funding ratio
Net stable funding ratio 31.12.2019 31.12.2018
119% 114%
156% 149%
Liquidity coverage ratio 31.12.2019 31.12.2018
155% 172%
325% 544%
Unweighted Weighted Unweighted Weighted
157,080 157,080 31,858 31,858
11,942 6,271 3,727 520
169,022 163,351 35,585 32,378
482,322 139,354 78,089 33,961
1,361 1,361 650 650
81,493 30,997 18,012 5,248
565,176 171,712 96,751 39,859
54,203 52,335 51,343 50,261
33,984 14,213 6,287 3,558
- - - ( 23,925)
88,187 66,548 57,630 29,894
155% 325%
Unweighted Weighted Unweighted Weighted
169,217 169,217 42,608 42,608
2,754 775 2,754 775
171,971 169,992 45,362 43,383
455,883 127,018 67,513 25,191
875 875 875 875
72,598 32,095 15,277 5,849
529,356 159,988 83,665 31,915
39,718 39,718 39,716 39,716
42,739 21,443 9,702 7,950
- - - ( 23,730)
82,457 61,161 49,418 23,936
172% 544%
For all currencies ........................................................................................................................................................
Foreign currencies ......................................................................................................................................................
At 31 December 2019 For all currencies Foreign currencies
Key measures for the assessment of liquidity risk are the Liquidity Coverage Ratio (LCR) and Net Stable Funding Ratio (NSFR). The Central
Bank of Iceland, which is the main supervisory authority regarding liquidity risk, has incorporated the LCR and the NSFR based on the CRD
IV standards into the rules on liquidity ratio and the rules on funding ratio in foreign currencies. In addition, the Group complies with the
Financial Supervisory Authority's guidelines no. 2/2010 on best practices in liquidity management and liquidity coverage ratio rules no.
266/2017.
The following tables show the NSFR and the LCR for the Group at year-end 2019 and 2018.
For all currencies Foreign currencies
Other outflows ........................................................................................................................
Total outflows
Short-term deposits with other banks** ...................................................................................
Other inflows ...........................................................................................................................
Restrictions on inflows ............................................................................................................
Liquid assets level 1* ..............................................................................................................
Liquid assets level 2 ...............................................................................................................
Total liquid assets
Deposits .................................................................................................................................
Debt issued ............................................................................................................................
Total inflows
Liquidity coverage ratio
At 31 December 2018
Total inflows
Liquidity coverage ratio
*Level 1 liquid assets include cash and balances with the Central Bank, domestic bonds eligible as collateral against borrowing at the Central
Bank and foreign government bonds in accordance with rules no. 266/2017 on liquidity ratio.
**Short-tem deposits with other banks with maturity less than 30 days.
Other outflows ........................................................................................................................
Total outflows
Short-term deposits with other banks** ...................................................................................
Other inflows ...........................................................................................................................
Restrictions on inflows ............................................................................................................
Íslandsbanki hf. Consolidated Financial Statements 2019 58 Amounts are in ISK million

Notes to the Consolidated Financial Statements
54.
Deposits by liquidity coverage ratio category
At 31 December 2019Less
stable
Weight
(%) Stable
Weight
(%)
Term
deposits
Total
deposits
228,447 12% 83,773 5% 78,870 391,090
2,446 25% - 5% - 2,446
73,739 40% 337 20% 24,589 98,665
6,813 40% 253 20% 620 7,686
35,405 100% - - 24,869 60,274
28,494 100% - - 46,371 74,865
8,038 100% - - 6,174 14,212
Total 383,382 84,363 181,493 649,238
At 31 December 2018Less
stable
Weight
(%) Stable
Weight
(%)
Term
deposits
Total
deposits
216,428 12% 80,804 5% 78,476 375,708
2,572 25% - 5% - 2,572
63,887 40% 341 20% 22,809 87,037
7,613 40% 246 20% 591 8,450
30,686 100% - - 26,987 57,673
27,467 100% - - 24,622 52,089
3,242 100% - - 7,807 11,049
Total 351,895 81,391 161,292 594,578
55. Maturity analysis of assets and liabilities
Maturity analysis 31 December 2019
Carrying On Up to 3 3-12 1-5 Over No
amount demand months months years 5 years maturity Total
30,925 1,992 16,363 8,468 4,580 - - 31,403
618,313 453,959 78,232 54,994 16,612 62,222 - 666,019
306,381 - 6,991 24,861 267,776 90,610 - 390,238
22,674 - 158 463 2,865 26,482 - 29,968
Other financial liabilities: 24,772 17,581 2,124 1,276 1,759 2,448 - 25,188
4,256 - 116 349 1,759 2,448 - 4,672
20,516 17,581 2,008 927 - - - 20,516
Total 1,003,065 473,532 103,868 90,062 293,592 181,762 - 1,142,816
Cont'd
Pension funds .....................................................................................
Domestic financial entities ...................................................................
Foreign financial entities ......................................................................
Deposits maturing within 30 days
Retail ...................................................................................................
Operational relationships .....................................................................
The Group's deposits are categorised by counterparty according to the Liquidity Coverage Ratio (LCR) standard. The groups are listed in
order of estimated stability and the respective LCR outflow weight. Deposits are also classified as stable if the customer has an established
business relationship with the Bank and is covered by an effective insurance scheme.
Deposits maturing within 30 days
Retail ...................................................................................................
Operational relationships .....................................................................
Corporations ........................................................................................
Sovereigns, Central Bank and public sector entities ............................
For dated financial liabilities the amounts are grouped into maturity buckets according to contractual maturities of principal and estimated
contractual payments of interest. For demand deposits or other non-dated liabilities, the figures are grouped according to the first possible
required payment date.
Financial liabilities
Deposits from CB and credit institutions ..........
Corporations ........................................................................................
Sovereigns, Central Bank and public sector entities ............................
Pension funds .....................................................................................
Domestic financial entities ...................................................................
Foreign financial entities ......................................................................
The following tables show the contractual payments of principal and interest for the Group's financial liabilities. Thus, the total figures for
each liability class are higher than the respective balance sheet amount. Cash flows for payments of unknown nature, such as for floating
rate, CPI-linked or foreign currency denominated instruments, are based on internal yield curves and forecasts.
Deposits from customers .................................
Debt issued and other borrowed funds ............
Subordinated loans ..........................................
Lease liabilities .........................................
Other liabilities ..........................................
Íslandsbanki hf. Consolidated Financial Statements 2019 59 Amounts are in ISK million
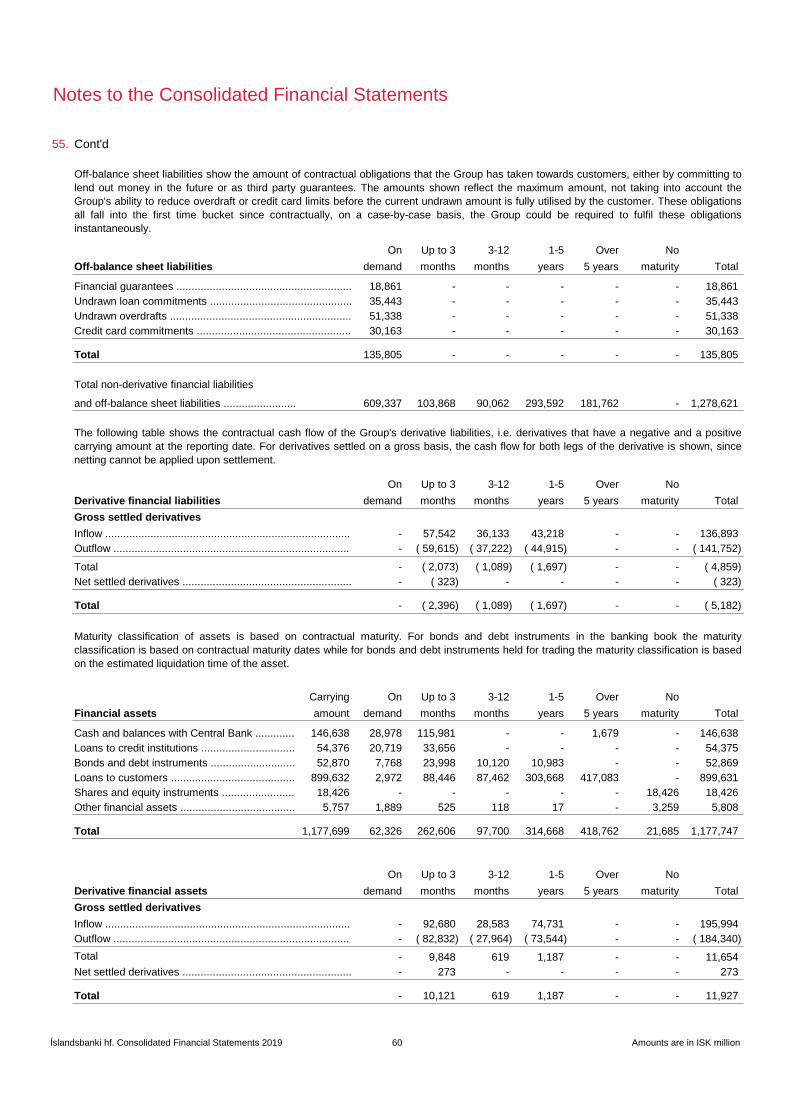
Notes to the Consolidated Financial Statements
55.
On Up to 3 3-12 1-5 Over No
demand months months years 5 years maturity Total
18,861 - - - - - 18,861
35,443 - - - - - 35,443
51,338 - - - - - 51,338
30,163 - - - - - 30,163
Total 135,805 - - - - - 135,805
609,337 103,868 90,062 293,592 181,762 - 1,278,621
On Up to 3 3-12 1-5 Over No
demand months months years 5 years maturity Total
- 57,542 36,133 43,218 - - 136,893
- ( 59,615) ( 37,222) ( 44,915) - - ( 141,752)
- ( 2,073) ( 1,089) ( 1,697) - - ( 4,859)
- ( 323) - - - - ( 323)
Total - ( 2,396) ( 1,089) ( 1,697) - - ( 5,182)
Carrying On Up to 3 3-12 1-5 Over No
amount demand months months years 5 years maturity Total
146,638 28,978 115,981 - - 1,679 - 146,638
54,376 20,719 33,656 - - - - 54,375
52,870 7,768 23,998 10,120 10,983 - - 52,869
899,632 2,972 88,446 87,462 303,668 417,083 - 899,631
18,426 - - - - - 18,426 18,426
5,757 1,889 525 118 17 - 3,259 5,808
Total 1,177,699 62,326 262,606 97,700 314,668 418,762 21,685 1,177,747
On Up to 3 3-12 1-5 Over No
demand months months years 5 years maturity Total
Gross settled derivatives
- 92,680 28,583 74,731 - - 195,994
- ( 82,832) ( 27,964) ( 73,544) - - ( 184,340)
Total - 9,848 619 1,187 - - 11,654
- 273 - - - - 273
Total - 10,121 619 1,187 - - 11,927
Off-balance sheet liabilities show the amount of contractual obligations that the Group has taken towards customers, either by committing to
lend out money in the future or as third party guarantees. The amounts shown reflect the maximum amount, not taking into account the
Group's ability to reduce overdraft or credit card limits before the current undrawn amount is fully utilised by the customer. These obligations
all fall into the first time bucket since contractually, on a case-by-case basis, the Group could be required to fulfil these obligations
instantaneously.
Off-balance sheet liabilities
Financial guarantees ..........................................................
Undrawn loan commitments ...............................................
Undrawn overdrafts ............................................................
Credit card commitments ...................................................
Cont'd
Outflow ..............................................................................
Total
Net settled derivatives ........................................................
Maturity classification of assets is based on contractual maturity. For bonds and debt instruments in the banking book the maturity
classification is based on contractual maturity dates while for bonds and debt instruments held for trading the maturity classification is based
on the estimated liquidation time of the asset.
Financial assets
Total non-derivative financial liabilities
and off-balance sheet liabilities ........................
The following table shows the contractual cash flow of the Group's derivative liabilities, i.e. derivatives that have a negative and a positive
carrying amount at the reporting date. For derivatives settled on a gross basis, the cash flow for both legs of the derivative is shown, since
netting cannot be applied upon settlement.
Derivative financial liabilities
Gross settled derivatives
Inflow .................................................................................
Derivative financial assets
Inflow .................................................................................
Outflow ..............................................................................
Net settled derivatives ........................................................
Cash and balances with Central Bank .............
Loans to credit institutions ...............................
Bonds and debt instruments ............................
Loans to customers .........................................
Shares and equity instruments ........................
Other financial assets ......................................
Íslandsbanki hf. Consolidated Financial Statements 2019 60 Amounts are in ISK million
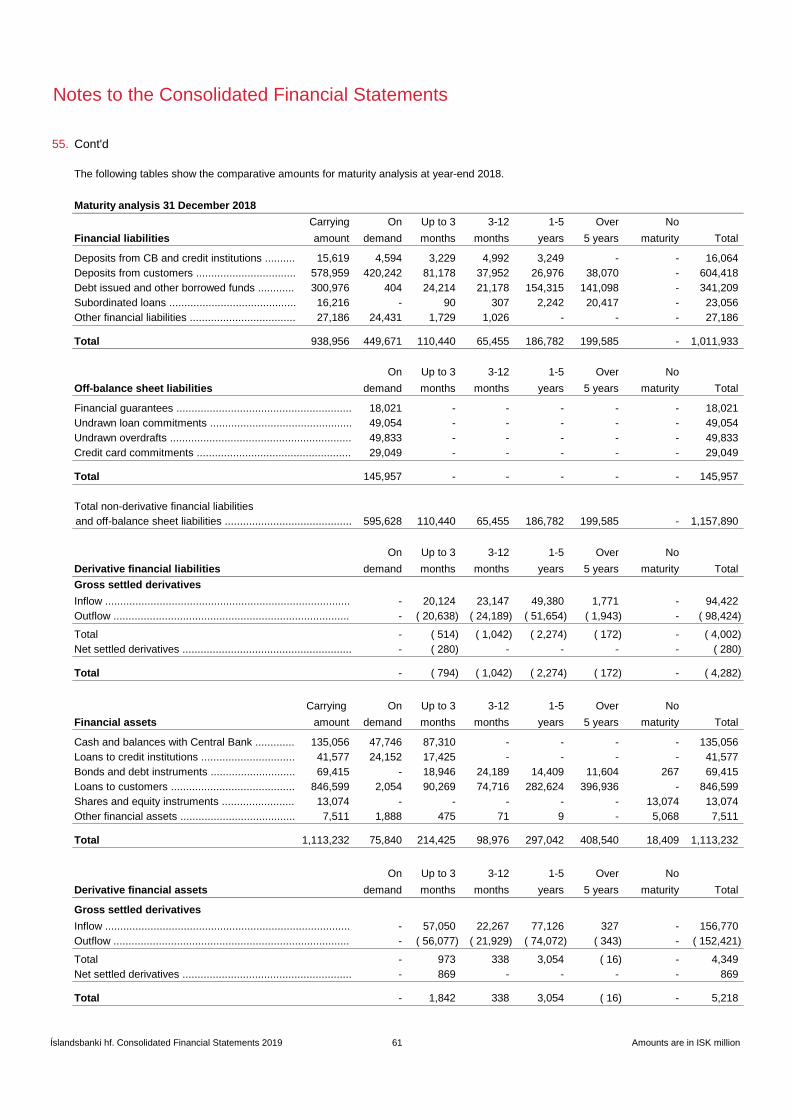
Notes to the Consolidated Financial Statements
55.
Maturity analysis 31 December 2018
Carrying On Up to 3 3-12 1-5 Over No
amount demand months months years 5 years maturity Total
15,619 4,594 3,229 4,992 3,249 - - 16,064
578,959 420,242 81,178 37,952 26,976 38,070 - 604,418
300,976 404 24,214 21,178 154,315 141,098 - 341,209
16,216 - 90 307 2,242 20,417 - 23,056
27,186 24,431 1,729 1,026 - - - 27,186
Total 938,956 449,671 110,440 65,455 186,782 199,585 - 1,011,933
On Up to 3 3-12 1-5 Over No
demand months months years 5 years maturity Total
18,021 - - - - - 18,021
49,054 - - - - - 49,054
49,833 - - - - - 49,833
29,049 - - - - - 29,049
Total 145,957 - - - - - 145,957
595,628 110,440 65,455 186,782 199,585 - 1,157,890
On Up to 3 3-12 1-5 Over No
demand months months years 5 years maturity Total
- 20,124 23,147 49,380 1,771 - 94,422
- ( 20,638) ( 24,189) ( 51,654) ( 1,943) - ( 98,424)
- ( 514) ( 1,042) ( 2,274) ( 172) - ( 4,002)
- ( 280) - - - - ( 280)
Total - ( 794) ( 1,042) ( 2,274) ( 172) - ( 4,282)
Carrying On Up to 3 3-12 1-5 Over No
amount demand months months years 5 years maturity Total
135,056 47,746 87,310 - - - - 135,056
41,577 24,152 17,425 - - - - 41,577
69,415 - 18,946 24,189 14,409 11,604 267 69,415
846,599 2,054 90,269 74,716 282,624 396,936 - 846,599
13,074 - - - - - 13,074 13,074
7,511 1,888 475 71 9 - 5,068 7,511
Total 1,113,232 75,840 214,425 98,976 297,042 408,540 18,409 1,113,232
On Up to 3 3-12 1-5 Over No
demand months months years 5 years maturity Total
Gross settled derivatives
- 57,050 22,267 77,126 327 - 156,770
- ( 56,077) ( 21,929) ( 74,072) ( 343) - ( 152,421)
- 973 338 3,054 ( 16) - 4,349
- 869 - - - - 869
Total - 1,842 338 3,054 ( 16) - 5,218
Cont'd
The following tables show the comparative amounts for maturity analysis at year-end 2018.
Other financial liabilities ...................................
Off-balance sheet liabilities
Financial guarantees ..........................................................
Undrawn loan commitments ...............................................
Undrawn overdrafts ............................................................
Credit card commitments ...................................................
Financial liabilities
Deposits from CB and credit institutions ..........
Deposits from customers .................................
Debt issued and other borrowed funds ............
Subordinated loans ..........................................
Total
Net settled derivatives ........................................................
Financial assets
Cash and balances with Central Bank .............
Loans to credit institutions ...............................
Total non-derivative financial liabilities
and off-balance sheet liabilities ..........................................
Derivative financial liabilities
Gross settled derivatives
Inflow .................................................................................
Outflow ..............................................................................
Outflow ..............................................................................
Total
Net settled derivatives ........................................................
Bonds and debt instruments ............................
Loans to customers .........................................
Shares and equity instruments ........................
Other financial assets ......................................
Derivative financial assets
Inflow .................................................................................
Íslandsbanki hf. Consolidated Financial Statements 2019 61 Amounts are in ISK million

Notes to the Consolidated Financial Statements
56. Market risk
57. Interest rate risk
Interest rate risk in the trading book
MV Duration BPV MV Duration BPV
1,143 6.84 ( 0.78) 1,872 6.13 ( 1.15)
31,855 0.41 ( 1.29) 43,550 0.32 ( 1.40)
Total 32,998 0.63 ( 2.07) 45,422 0.56 ( 2.55)
MV Duration BPV MV Duration BPV
150 6.00 0.10 - - -
615 4.00 0.28 198 5.00 0.09
Total 765 4.39 0.38 198 5.00 0.09
32,233 0.54 ( 1.69) 45,224 0.54 ( 2.46)
The Group defines market risk as the current or prospective risk to earnings and capital arising from adverse movements in the level or
volatility of prices of market instruments, such as those that arise from changes in interest rates, foreign exchange rates, equity prices, CPI-
indexation and commodity prices. Sources of market risk are imbalances in the Group's balance sheet and open positions in bonds,
currencies and equities. Derivative contracts are also potential sources of market risk.
Market risk within the Group can broadly be split into two categories, trading book and banking book. The trading book includes market risk
exposures related, directly or indirectly, to the Group's short- and medium-term trading in securities, currencies and other capital market
instruments and derivatives. All financial assets and liabilities in the trading portfolio are recognised at fair value and all resulting changes are
immediately reflected in the income statement. The banking book includes market risk exposures related to securities held for long-term
investment purposes, unlisted securities or holdings in subsidiaries or affiliates. A large part of the banking book market risk is due to
mismatches in the composition of assets and liabilities, for example with respect to currencies, interest rates, CPI-indexation or other factors
that can affect the Group's earnings or earnings volatility. These mismatches are reported to management and are subject to internal and
regulatory limits.
Indexed ...............................................................................................
Non-indexed ........................................................................................
31.12.2019 31.12.2018
Trading bonds and debt instruments, short positions
Indexed ...............................................................................................
Interest rate risk is defined as the current or prospective risk to earnings or capital arising from adverse movements in interest rates.
Sensitivity measures like Basis Point Value (BPV) are used to measure and manage risk arising from its fixed income exposures. The BPV
measures the effect of a 0.01 percentage point upward parallel shift in the yield curve on the fair value of these exposures.
The fixed income trading unit invests mainly in government bonds, bonds issued by the Housing Financing Fund (HFF) which are guaranteed
by the Icelandic Government, domestic municipality bonds, and covered bonds issued by other Icelandic banks. Bonds and bills in the
Group's liquidity portfolio are also categorised in the trading book. In the following table the total market value (MV) of long and short
positions may not be the same as reported in Note 5 since netting between short and long positions is not applied here.
31.12.2019 31.12.2018
Trading bonds and debt instruments, long positions
Non-indexed ........................................................................................
Net position of trading bonds and debt instruments
Íslandsbanki hf. Consolidated Financial Statements 2019 62 Amounts are in ISK million
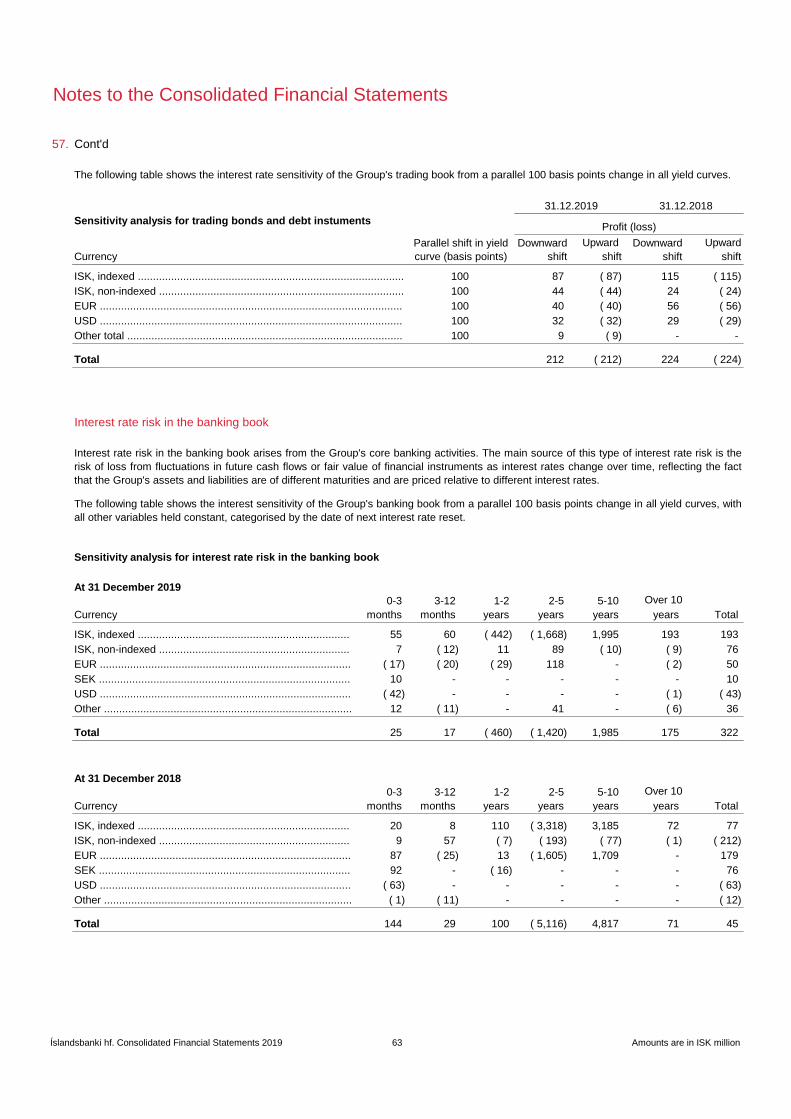
Notes to the Consolidated Financial Statements
57.
Sensitivity analysis for trading bonds and debt instuments
Upward Upward
shift shift
87 ( 87) 115 ( 115)
44 ( 44) 24 ( 24)
40 ( 40) 56 ( 56)
32 ( 32) 29 ( 29)
9 ( 9) - -
Total 212 ( 212) 224 ( 224)
At 31 December 2019
0-3 3-12 1-2 2-5 5-10 Over 10
months months years years years years Total
55 60 ( 442) ( 1,668) 1,995 193 193
7 ( 12) 11 89 ( 10) ( 9) 76
( 17) ( 20) ( 29) 118 - ( 2) 50
10 - - - - - 10
( 42) - - - - ( 1) ( 43)
12 ( 11) - 41 - ( 6) 36
Total 25 17 ( 460) ( 1,420) 1,985 175 322
At 31 December 2018
0-3 3-12 1-2 2-5 5-10 Over 10
months months years years years years Total
20 8 110 ( 3,318) 3,185 72 77
9 57 ( 7) ( 193) ( 77) ( 1) ( 212)
87 ( 25) 13 ( 1,605) 1,709 - 179
92 - ( 16) - - - 76
( 63) - - - - - ( 63)
( 1) ( 11) - - - - ( 12)
Total 144 29 100 ( 5,116) 4,817 71 45
Profit (loss)
Parallel shift in yield
curve (basis points)
Downward
shift
Downward
shiftCurrency
ISK, indexed ........................................................................................ 100
Cont'd
The following table shows the interest rate sensitivity of the Group's trading book from a parallel 100 basis points change in all yield curves.
31.12.2019 31.12.2018
Interest rate risk in the banking book
Interest rate risk in the banking book arises from the Group's core banking activities. The main source of this type of interest rate risk is the
risk of loss from fluctuations in future cash flows or fair value of financial instruments as interest rates change over time, reflecting the fact
that the Group's assets and liabilities are of different maturities and are priced relative to different interest rates.
The following table shows the interest sensitivity of the Group's banking book from a parallel 100 basis points change in all yield curves, with
all other variables held constant, categorised by the date of next interest rate reset.
Sensitivity analysis for interest rate risk in the banking book
ISK, non-indexed ................................................................................. 100
EUR .................................................................................................... 100
USD .................................................................................................... 100
EUR ...................................................................................
SEK ...................................................................................
USD ...................................................................................
Other ..................................................................................
USD ...................................................................................
Other ..................................................................................
Currency
ISK, indexed ......................................................................
ISK, non-indexed ...............................................................
Currency
ISK, indexed ......................................................................
ISK, non-indexed ...............................................................
EUR ...................................................................................
SEK ...................................................................................
Other total ........................................................................................... 100
Íslandsbanki hf. Consolidated Financial Statements 2019 63 Amounts are in ISK million

58. Currency risk
Currency analysis at 31 December 2019
Assets EUR USD GBP CHF JPY SEK NOK DKK CAD
Other foreign
currencies
Total foreign
currencies
Cash and balances with Central Bank ............... 942 319 210 52 24 51 73 114 58 123 1,966
Loans to credit institutions ................................. 11,689 25,740 1,650 378 534 116 9,707 1,294 272 687 52,067
Bonds and debt instruments .............................. 12,930 10,937 3 - - - 8,232 - - - 32,102
Loans to customers ........................................... 112,185 29,486 2,037 581 3,185 3 3,408 635 6,005 33 157,558
Shares and equity instruments .......................... 31 3,371 419 - - - 27 - - - 3,848
Other assets ...................................................... 390 1,866 338 6 - 73 2 20 - 458 3,153
Total assets 138,167 71,719 4,657 1,017 3,743 243 21,449 2,063 6,335 1,301 250,694
Liabilities
Deposits from credit institutions ......................... 9,145 558 1 - - - - - - - 9,704
Deposits from customers ................................... 32,247 27,939 3,810 385 395 874 3,317 3,617 453 42 73,079
Debt issued and other borrowed funds .............. 91,809 - - - - 37,768 19,565 - - - 149,142
Subordinated loans ........................................... - - - - - 22,674 - - - - 22,674
Other liabilities ................................................... 1,728 944 558 35 3 162 5 47 2 665 4,149
Total liabilities 134,929 29,441 4,369 420 398 61,478 22,887 3,664 455 707 258,748
Net on-balance sheet position 3,238 42,278 288 597 3,345 ( 61,235) ( 1,438) ( 1,601) 5,880 594 ( 8,054)
Net off-balance sheet position ( 4,344) ( 41,574) ( 231) ( 610) ( 3,345) 61,127 1,255 1,726 ( 5,840) ( 203) 7,961
Net position ( 1,106) 704 57 ( 13) - ( 108) ( 183) 125 40 391 ( 93)
Notes to the Consolidated Financial Statements
Currency risk is the risk that earnings or capital may be negatively affected from the fluctuations of foreign exchange rates, due to transactions in foreign currencies or due to a mismatch in the currency
composition of assets or liabilities.
The analysis of the Group's foreign currency exposure presented below is based on the contractual currency of the underlying balance sheet items. Additionally, there are off-balance sheet items that carry
currency risk and are included in the total currency imbalance. The off-balance sheet amounts below represent the notional amounts of derivatives and unsettled spot agreements.
Íslandsbanki hf. Consolidated Financial Statements 2019 64 Amounts are in ISK million
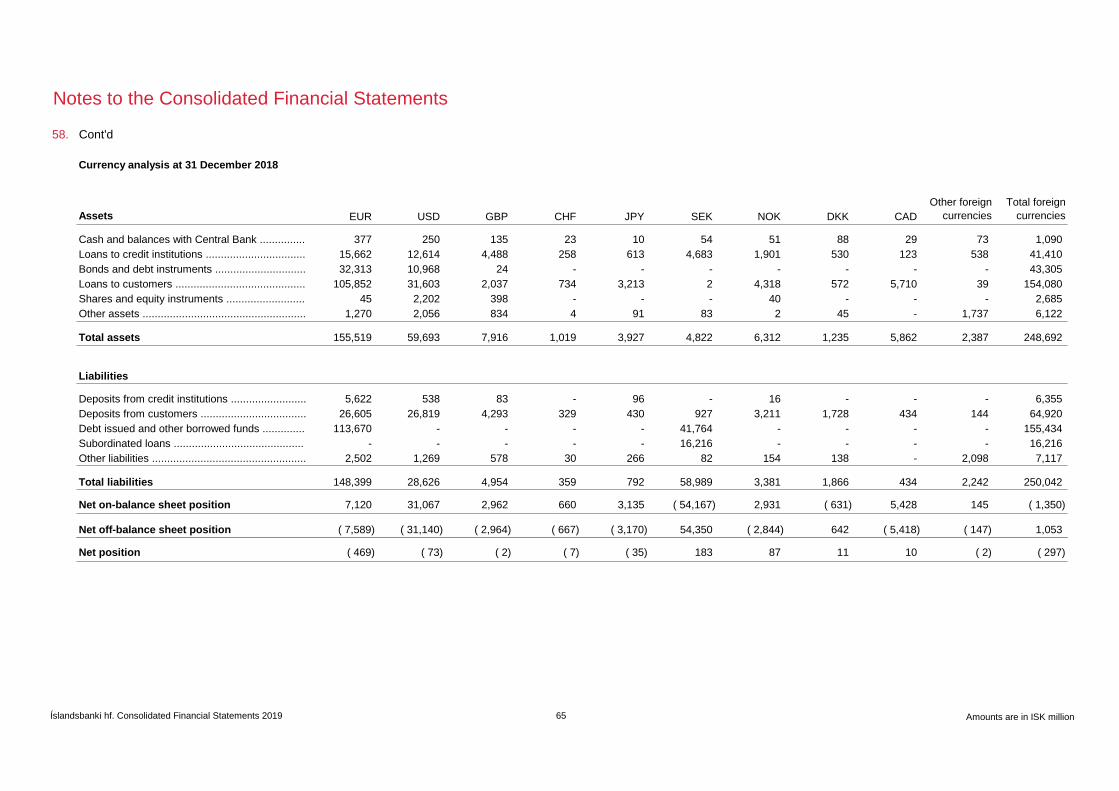
Notes to the Consolidated Financial Statements
58. Cont'd
Currency analysis at 31 December 2018
Assets EUR USD GBP CHF JPY SEK NOK DKK CAD
Other foreign
currencies
Total foreign
currencies
Cash and balances with Central Bank ............... 377 250 135 23 10 54 51 88 29 73 1,090
Loans to credit institutions ................................. 15,662 12,614 4,488 258 613 4,683 1,901 530 123 538 41,410
Bonds and debt instruments .............................. 32,313 10,968 24 - - - - - - - 43,305
Loans to customers ........................................... 105,852 31,603 2,037 734 3,213 2 4,318 572 5,710 39 154,080
Shares and equity instruments .......................... 45 2,202 398 - - - 40 - - - 2,685
Other assets ...................................................... 1,270 2,056 834 4 91 83 2 45 - 1,737 6,122
Total assets 155,519 59,693 7,916 1,019 3,927 4,822 6,312 1,235 5,862 2,387 248,692
Deposits from credit institutions ......................... 5,622 538 83 - 96 - 16 - - - 6,355
Deposits from customers ................................... 26,605 26,819 4,293 329 430 927 3,211 1,728 434 144 64,920
Debt issued and other borrowed funds .............. 113,670 - - - - 41,764 - - - - 155,434
Subordinated loans ........................................... - - - - - 16,216 - - - - 16,216
Other liabilities ................................................... 2,502 1,269 578 30 266 82 154 138 - 2,098 7,117
Total liabilities 148,399 28,626 4,954 359 792 58,989 3,381 1,866 434 2,242 250,042
Net on-balance sheet position 7,120 31,067 2,962 660 3,135 ( 54,167) 2,931 ( 631) 5,428 145 ( 1,350)
Net off-balance sheet position ( 7,589) ( 31,140) ( 2,964) ( 667) ( 3,170) 54,350 ( 2,844) 642 ( 5,418) ( 147) 1,053
Net position ( 469) ( 73) ( 2) ( 7) ( 35) 183 87 11 10 ( 2) ( 297)
Liabilities
Íslandsbanki hf. Consolidated Financial Statements 2019 65 Amounts are in ISK million
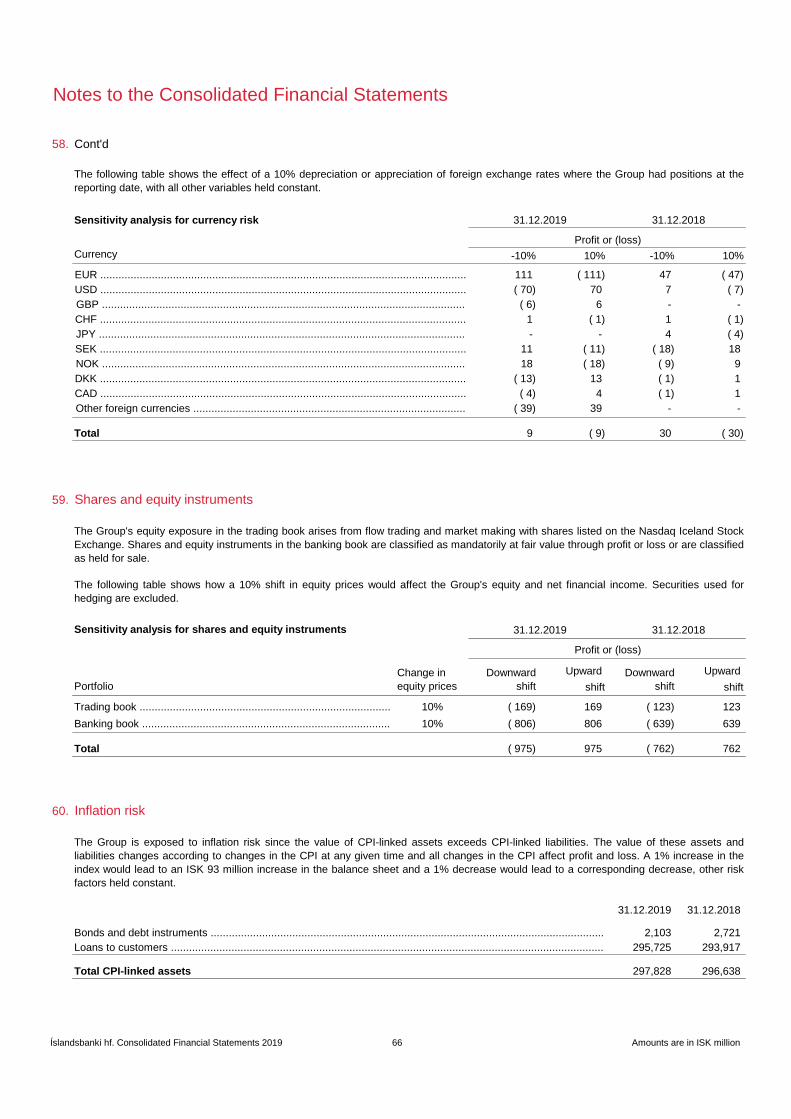
58.
-10% 10% -10% 10%
111 ( 111) 47 ( 47)
( 70) 70 7 ( 7)
( 6) 6 - -
1 ( 1) 1 ( 1)
- - 4 ( 4)
11 ( 11) ( 18) 18
18 ( 18) ( 9) 9
( 13) 13 ( 1) 1
( 4) 4 ( 1) 1
( 39) 39 - -
Total 9 ( 9) 30 ( 30)
59. Shares and equity instruments
Upward Upward
shift shift
( 169) 169 ( 123) 123
( 806) 806 ( 639) 639
Total ( 975) 975 ( 762) 762
60. Inflation risk
31.12.2019 31.12.2018
2,103 2,721
295,725 293,917
Total CPI-linked assets 297,828 296,638
Notes to the Consolidated Financial Statements
Cont'd
The following table shows the effect of a 10% depreciation or appreciation of foreign exchange rates where the Group had positions at the
reporting date, with all other variables held constant.
Sensitivity analysis for currency risk 31.12.2019 31.12.2018
CAD .........................................................................................................................
Profit or (loss)
Currency
EUR .........................................................................................................................
USD .........................................................................................................................
GBP ........................................................................................................................
CHF .........................................................................................................................
JPY .........................................................................................................................
SEK .........................................................................................................................
NOK ........................................................................................................................
DKK .........................................................................................................................
Other foreign currencies ..........................................................................................
The Group's equity exposure in the trading book arises from flow trading and market making with shares listed on the Nasdaq Iceland Stock
Exchange. Shares and equity instruments in the banking book are classified as mandatorily at fair value through profit or loss or are classified
as held for sale.
The following table shows how a 10% shift in equity prices would affect the Group's equity and net financial income. Securities used for
hedging are excluded.
Sensitivity analysis for shares and equity instruments 31.12.2019 31.12.2018
Loans to customers ...............................................................................................................................................
Change in
equity prices
Profit or (loss)
Downward
shift
Downward
shiftPortfolio
Trading book ................................................................................... 10%
Banking book .................................................................................. 10%
The Group is exposed to inflation risk since the value of CPI-linked assets exceeds CPI-linked liabilities. The value of these assets and
liabilities changes according to changes in the CPI at any given time and all changes in the CPI affect profit and loss. A 1% increase in the
index would lead to an ISK 93 million increase in the balance sheet and a 1% decrease would lead to a corresponding decrease, other risk
factors held constant.
Bonds and debt instruments ..................................................................................................................................
Íslandsbanki hf. Consolidated Financial Statements 2019 66 Amounts are in ISK million

Notes to the Consolidated Financial Statements
60.
31.12.2019 31.12.2018
98,766 95,917
125,975 118,103
63,827 70,617
Total CPI-linked liabilities 288,568 284,637
CPI imbalance 9,260 12,001
61. Derivatives
62. Capital management
31.12.2019 31.12.2018
CET1 capital
10,000 10,000
55,000 55,000
7,065 6,499
105,569 102,496
2,428 2,318
392 376
( 476) ( 215)
( 4,330) ( 5,002)
Total CET1 capital 175,648 171,472
Tier 2 capital
22,674 16,216
Total capital base 198,322 187,688
Ordinary share capital ...........................................................................................................................................
Cont'd
Deposits from customers ......................................................................................................................................
Debt issued and other borrowed funds ..................................................................................................................
Off-balance sheet position .....................................................................................................................................
The following table shows the capital base, risk exposure amount, the resulting capital ratios, and leverage for the Group at 31 December
2019 and 31 December 2018.
The Group's regulatory capital requirement is calculated according to CRD IV as implemented through Act no. 161/2002 on Financial
Undertakings and regulation no. 233/2017 on prudential requirements for financial undertakings. Capital requirement calculations for credit
risk and market risk are based on the standardised approach whereas the capital requirement calculations for operational risk are based on
the basic indicator approach.
Article 501 of the capital requirements regulation (EU) no. 575/2013 of the European parliament came into effect in Iceland on 1 January
2020. This article stipulates capital requirements deduction for credit risk on exposures to SMEs and is expected to lower the risk exposure
amount by ISK 15.6 billion, which corresponds to a 40 basis point increase in the Group's capital ratio.
The Group aims at managing its capital position and the corresponding capital ratios above the overall regulatory capital requirement.
According to the latest SREP report from the Financial Supervisory Authority, applicable as of 30 September 2019, the overall capital
requirement is 18.8%. The Group's capital target includes a 0.5-2.0% management buffer on top of the overall capital requirement.
The minimum leverage ratio for Icelandic financial institutions is 3%.
The Group uses derivatives to hedge currency exposure, interest rate risk in the banking book as well as inflation risk. However, the Group is
subject to indirect exposure through customers' margin trading. Margin trading is subject to continuous monitoring and collateral
requirements. Other derivatives held for trading or for other purposes are insignificant.
Share premium .....................................................................................................................................................
Reserves ...............................................................................................................................................................
Retained earnings .................................................................................................................................................
Non-controlling interests ........................................................................................................................................
Fair value changes due to own credit standing ......................................................................................................
Tax assets .............................................................................................................................................................
Intangible assets ...................................................................................................................................................
Qualifying subordinated liabilities ..........................................................................................................................
Íslandsbanki hf. Consolidated Financial Statements 2019 67 Amounts are in ISK million

Notes to the Consolidated Financial Statements
62.
31.12.2019 31.12.2018
Risk exposure amount
789,180 750,801
7,919 7,622
6,488 6,649
1,431 973
2,027 2,385
85,424 85,141
Total risk exposure amount 884,550 845,949
Capital ratios
19.9% 20.3%
22.4% 22.2%
Leverage ratio
Exposure amount
1,189,062 1,120,637
38,849 47,119
9,461 8,935
Leverage ratio total exposure measure 1,237,372 1,176,691
175,648 171,472
Leverage ratio 14.2% 14.6%
63. Operational risk
Cont'd
On-balance sheet exposures .................................................................................................................................
- due to credit risk .................................................................................................................................................
- due to market risk ..............................................................................................................................................
Market risk, trading book ..................................................................................................................................
Currency risk ....................................................................................................................................................
- due to credit valuation adjustment ......................................................................................................................
- due to operational risk ........................................................................................................................................
Tier 1 ratio .............................................................................................................................................................
Total capital ratio ...................................................................................................................................................
Off-balance sheet exposures .................................................................................................................................
Derivative exposures .............................................................................................................................................
Tier 1 capital .........................................................................................................................................................
Operational risk is the risk of loss resulting from inadequate or failed internal processes, people and systems or from external events. The
Goup’s definition of operational risk includes reputational risk, legal risk, model risk, conduct risk and compliance risk among other risk
factors.
The ultimate responsibility for ensuring an adequate operational risk management and internal control framework at Íslandsbanki lies with the
Board of Directors. The Board has approved an Operational Risk Policy which outlines the Bank's framework for operational risk
management. Risk Management is responsible for implementing the Bank’s operational risk framework, for developing, maintaining the
Operational Risk Policy and for communicating the policy to the Bank‘s employees.
Íslandsbanki hf. Consolidated Financial Statements 2019 68 Amounts are in ISK million
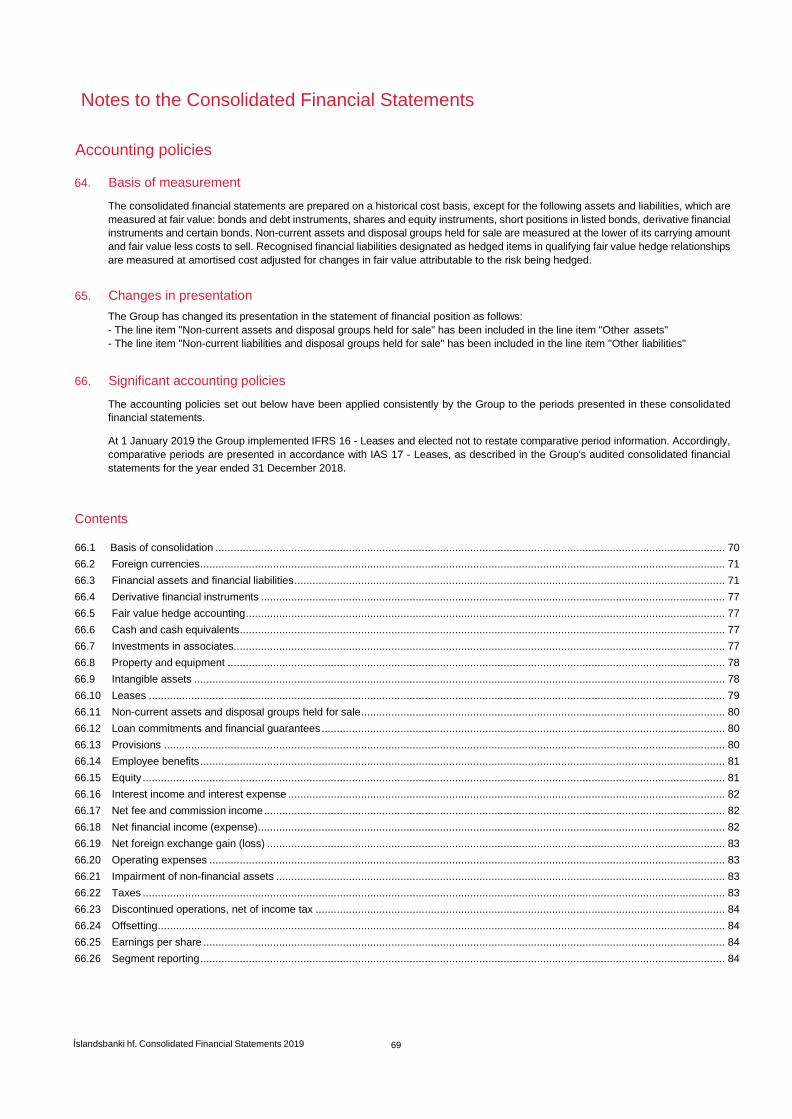
Notes to the Consolidated Financial Statements
Íslandsbanki hf. Consolidated Financial Statements 2019 69
Accounting policies
64. Basis of measurement
The consolidated financial statements are prepared on a historical cost basis, except for the following assets and liabilities, which are
measured at fair value: bonds and debt instruments, shares and equity instruments, short positions in listed bonds, derivative financial
instruments and certain bonds. Non-current assets and disposal groups held for sale are measured at the lower of its carrying amount
and fair value less costs to sell. Recognised financial liabilities designated as hedged items in qualifying fair value hedge relationships
are measured at amortised cost adjusted for changes in fair value attributable to the risk being hedged.
65. Changes in presentation
The Group has changed its presentation in the statement of financial position as follows:
- The line item "Non-current assets and disposal groups held for sale" has been included in the line item "Other assets"
- The line item "Non-current liabilities and disposal groups held for sale" has been included in the line item "Other liabilities"
66. Significant accounting policies
The accounting policies set out below have been applied consistently by the Group to the periods presented in these consolidated
financial statements.
At 1 January 2019 the Group implemented IFRS 16 - Leases and elected not to restate comparative period information. Accordingly,
comparative periods are presented in accordance with IAS 17 - Leases, as described in the Group's audited consolidated financial
statements for the year ended 31 December 2018.
Contents
66.1 Basis of consolidation ........................................................................................................................................................................ 70
66.2 Foreign currencies ............................................................................................................................................................................. 71
66.3 Financial assets and financial liabilities .............................................................................................................................................. 71
66.4 Derivative financial instruments ......................................................................................................................................................... 77
66.5 Fair value hedge accounting .............................................................................................................................................................. 77
66.6 Cash and cash equivalents ................................................................................................................................................................ 77
66.7 Investments in associates.................................................................................................................................................................. 77
66.8 Property and equipment .................................................................................................................................................................... 78
66.9 Intangible assets ............................................................................................................................................................................... 78
66.10 Leases .............................................................................................................................................................................................. 79
66.11 Non-current assets and disposal groups held for sale ........................................................................................................................ 80
66.12 Loan commitments and financial guarantees ..................................................................................................................................... 80
66.13 Provisions ......................................................................................................................................................................................... 80
66.14 Employee benefits ............................................................................................................................................................................. 81
66.15 Equity ................................................................................................................................................................................................ 81
66.16 Interest income and interest expense ................................................................................................................................................ 82
66.17 Net fee and commission income ........................................................................................................................................................ 82
66.18 Net financial income (expense) .......................................................................................................................................................... 82
66.19 Net foreign exchange gain (loss) ....................................................................................................................................................... 83
66.20 Operating expenses .......................................................................................................................................................................... 83
66.21 Impairment of non-financial assets .................................................................................................................................................... 83
66.22 Taxes ................................................................................................................................................................................................ 83
66.23 Discontinued operations, net of income tax ....................................................................................................................................... 84
66.24 Offsetting ........................................................................................................................................................................................... 84
66.25 Earnings per share ............................................................................................................................................................................ 84
66.26 Segment reporting ............................................................................................................................................................................. 84
Notes to the Consolidated Financial Statements
Íslandsbanki hf. Consolidated Financial Statements 2019 70
66.1 Basis of consolidation
The consolidated financial statements of the Group comprise the financial statements of Íslandsbanki hf., as the parent company, and
its subsidiaries presented as those of a single economic entity. The Group consolidates its subsidiaries on the basis of control whereas
subsidiaries are entities controlled by the Group.
Control
Subsidiaries are investments that the Group has control over. The Group controls an investment when the Group is exposed, or has
rights, to variable returns from its involvement with the investment and has the ability to affect those returns through its power over
the investment. The Group has power over an entity when the Group has existing rights that give it the current ability to direct the
relevant activities and the ability to exercise its right.
Generally, there is a presumption that a majority of voting rights results in control. To support this presumption and when the Group
has less than a majority of the voting or similar rights of an entity, the Group considers all relevant facts and circumstances in assessing
whether it has power over an entity, including the contractual arrangements with the other vote holders of the entity, rights arising from
other contractual arrangements, the Group's voting rights and potential voting rights.
When the Group assesses whether it controls an entity, it also determines whether it is a principal or an agent. If the Group has the
power to direct the activities of the entity to generate returns for itself, then it is a principal. If the Group is primarily engaged to act on
behalf and for the benefit of other parties, then it is an agent and it does not control the entity when exercising its decision-making
rights delegated to it. In assessing whether the Group is a principal or an agent it considers the overall relationship between itself, the
entity and other parties involved with the entity. In particular, the Group considers the scope of its decision-making authority over the
entity, the rights held by other parties, the remuneration to which it is entitled in accordance with any remuneration agreements and
the Group's exposure to variability of returns from other interests that it holds in the entity. Different weightings are applied to each of
these factors on the basis of particular facts and circumstances.
The Group reassesses whether or not it controls an entity if facts and circumstances indicate that there are changes to one or more
of the elements of control.
Funds management
The Group acts as a manager for Undertakings for Collective Investment in Transferable Securities (UCITS) and investment funds as
well as other funds for collective investment that accept capital from investors. Such funds are financed by issuing unit share
certificates or shares. The Group does not have any contractual financial responsibility with respect to such custom units. The funds
are not consolidated unless they are under the control of the Group.
The Group reviews all the facts and circumstances in order to decide if these funds should be consolidated. The Group is deemed to
be a principal and hence controls and consolidates the funds, when it acts as fund manager and cannot be removed without cause,
has variable returns through significant unit holdings and/or guarantee, and is able to influence the returns of the funds by exercising
its power.
Consolidation
Consolidation of a subsidiary begins when the Group obtains control of the subsidiary and ceases when the Group loses control of
the subsidiary.
In preparing the consolidated financial statements, Íslandsbanki combines its financial statements with those of its subsidiaries, line
by line, by adding together like items of assets, liabilities, equity, income, expenses and cash flows. When necessary, adjustments
are made to the financial statements of subsidiaries to bring their accounting policies in line with the Group's accounting policies. All
intra-group assets and liabilities, equity, income, expenses and cash flows relating to transactions between group entities are
eliminated in full on consolidation. The carrying amount of Íslandsbanki's investment in each subsidiary and Íslandsbanki's portion of
equity of each subsidiary are eliminated and any related goodwill is recognised as an asset.
If the Group loses control of a subsidiary, it derecognises the related assets (including goodwill), liabilities, non-controlling interests
and other components of equity, while any resultant gain or loss is recognised in profit or loss in the line item "Other operating income".
Any investment retained by the Group in the former subsidiary is recognised at its fair value at the date when control is lost.
A change in the Group's ownership interest in a subsidiary, without a loss of control, is accounted for as an equity transaction.
When the Group is committed to a sale plan involving the loss of control of a subsidiary and the criteria for classification as held for
sale are met (see Note 66.11), it classifies all the assets and liabilities of that subsidiary as held for sale in its consolidated financial
statements. This is regardless of whether the Group will retain a non-controlling interest in the subsidiary after the sale. The gain or
loss from the sale is recognised in profit or loss in the line item "Profit (loss) from discontinued operations, net of income tax".
Notes to the Consolidated Financial Statements
Íslandsbanki hf. Consolidated Financial Statements 2019 71
66.1 Cont'd
Non-controlling interests
Non-controlling interests represent equity in subsidiaries not attributable, directly or indirectly, to the Group.
For each business combination, the Group measures at the acquisition date components of non-controlling interests in the acquiree
that are present ownership interests and entitle their holders to a proportionate share of the entity's net assets in the event of
liquidation, at either fair value or the present ownership instruments' proportionate share in the acquiree's identifiable net assets. All
other components of non-controlling interests are measured at their acquisition-date fair values, unless another measurement basis
is required by the International Financial Reporting Standards.
The Group presents non-controlling interests within equity in the statement of financial position, separately from the equity attributable
to equity holders of Íslandsbanki. Profit or loss and each component of other comprehensive income are attributed to equity holders
of Íslandsbanki and to non-controlling interests, even if this results in the non-controlling interests having a deficit balance.
When the proportion of the equity held by non-controlling interests changes, the Group adjusts the carrying amounts of the controlling
and non-controlling interests to reflect the changes in their relative interests in the subsidiary. Any difference between the amount by
which the non-controlling interests are adjusted and the fair value of the consideration paid or received is recognised directly in equity
and attributed to equity holders of Íslandsbanki hf. No adjustments are made to goodwill and no gain or loss is recognised in profit or
loss.
Business combinations and goodwill
The Group accounts for each business combination by applying the acquisition method. Under the acquisition method, the Group
identifies itself as the acquirer, determines the acquisition date, recognises and measures the identifiable assets acquired, the liabilities
assumed and any non-controlling interests in the acquiree, and recognises and measures any goodwill or gain from a bargain
purchase.
66.2 Foreign currencies
The financial statements of each of the Group's entities are measured using the functional currency of the respective entity.
On initial recognition transactions in foreign currencies are translated into functional currencies at the spot exchange rate at the date
of the transactions. At the end of each reporting period monetary assets and liabilities denominated in foreign currencies are
retranslated into functional currencies using the closing rate. Non-monetary assets and liabilities that are measured in terms of
historical cost in a foreign currency are translated using the exchange rate at the date of the transaction. Non-monetary assets and
liabilities denominated in foreign currencies that are measured at fair value are translated into the functional currency using the
exchange rate at the date when the fair value was determined.
Foreign currency differences arising on retranslation from one currency to another are recognised in profit or loss (see Note 66.19).
66.3 Financial assets and financial liabilities
Recognition
The Group recognises a financial asset and a financial liability in its statement of financial position on the trade date, which is the date
on which the Group becomes party to the contractual provisions of the instrument, except for loans which are recognised on the date
when cash is advanced by the Group to the borrowers. At initial recognition, the Group measures a financial asset or a financial liability
at its fair value plus, in the case of a financial asset or a financial liability not at fair value through profit or loss, transaction costs that
are directly attributable to the acquisition or issue of the financial asset or the financial liability.
Derecognition
The Group derecognises a financial liability when its contractual obligations are discharged or cancelled, or expire.
The Group derecognises financial assets in the following circumstances:
• When the contractual rights to the cash flows from the financial assets expire, or
• When the Group transfers the rights to receive the contractual cash flows on the financial asset in a transaction in which:
- The Group transfers substantially all the risks and rewards of ownership of the financial assets, or
- The Group neither transfers nor retains substantially all the risks and rewards of ownership of the financial assets and it does not
retain control of the financial assets.
Any interest in transferred financial assets that qualify for derecognition that is created or retained by the Group is recognised as a
separate asset or liability. On derecognition of a financial asset, the difference between the carrying amount of the asset (or the
carrying amount allocated to the portion of the asset transferred), and the sum of (i) the consideration received (including any new
asset obtained less any new liability assumed) and (ii) any cumulative gain or loss that had been recognised in other comprehensive
income is recognised in profit or loss.

Notes to the Consolidated Financial Statements
Íslandsbanki hf. Consolidated Financial Statements 2019 72
66.3 Cont'd
The Group enters into transactions whereby it transfers assets recognised in its statement of financial position, but retains either all
or substantially all risks and rewards of the transferred assets or a portion of them. If all or substantially all risks and rewards are
retained, then the transferred assets are not derecognised from the statement of financial position of the Group. Transfers of assets
with retention of all or substantially all risks and rewards include, for example, repurchase transactions and securities lending.
The Group does not derecognise from its statement of financial position securities which the Group sells under agreements to
repurchase at a specified future date ("repos") at a fixed price or at the sale price plus a lender's return. The Group recognises the
cash received as a liability in its statement of financial position. The difference between the sale and repurchase prices is recognised
as interest expense over the life of the agreement using the effective interest method.
Securities lending and borrowing transactions are usually collateralised by securities or cash. The transfer of securities to
counterparties is only reflected in the statement of financial position if the risks and rewards of ownership are also transferred. Cash
advanced or received as collateral is recorded as an asset or liability.
In transactions in which the Group neither retains nor transfers substantially all the risks and rewards of ownership of a financial asset
and it retains control over the asset, the Group continues to recognise the asset to the extent of its continuing involvement, determined
by the extent to which it is exposed to changes in the value of the transferred asset.
Modifications
Substantial modifications of terms of existing financial assets, or replacements with new ones with significantly different terms, result
in the Group derecognising the original financial assets and recognising new financial assets at fair value.
Classification and measurement of financial assets
For the purpose of measuring its financial assets, the Group classifies them at inception in one of the following categories (see also
Note 5):
• Financial assets at amortised cost
• Financial assets at fair value through other comprehensive income
• Financial assets at fair value through profit or loss
• Derivative assets held for hedging
The measurement basis of individual financial assets is determined based on an assessment of the cash flow characteristics of the
assets and the business models under which they are managed.
The business models
The business models are determined by the Group's key management personnel in the way that assets are managed and their
performance is reported to them. The Group determines its business models at a level that reflects the way groups of financial assets
are managed together to achieve a particular business objective. This condition is not an instrument-by-instrument approach to
classification, but is determined at a higher level of aggregation. The Group's business models fall into the following three categories:
Held to collect, Held to collect and for sale, and Other fair value business models, where assets are held for trading or managed on a
fair value basis and are neither Held to collect nor Held to collect and for sale.
Solely payments of principal and interest (SPPI)
Financial assets held within the business models Held to collect and Held to collect and for sale, are assessed to evaluate if their
contractual cash flows are comprised of solely payments of principal and interest. SPPI payments are those which are consistent with
a basic lending arrangement. Principal is the fair value of the financial asset at initial recognition and changes over the life of the
financial asset, for example if there are repayments of principal. Interest relates to basic lending returns, including compensation for
the time value of money and credit risk associated with the principal amount outstanding over a period of time. Interest can also
include consideration for other basic lending risks (for example, liquidity risk) and costs (for example, servicing or administrative costs),
as well as a profit margin that is consistent with a basic lending arrangement.
Where the contractual terms introduce exposure to risk or variability of cash flows that are inconsistent with a basic lending
arrangement, the related financial asset is classified and measured at fair value through profit or loss.
Financial assets at amortised cost A financial asset is classified as being subsequently measured at amortised cost if the contractual terms of the financial asset give rise to cash flows that are solely payments of principal and interest and the asset is held within a business model whose objective is to collect contractual cash flows, i.e. Held to collect.
Financial assets at amortised cost are measured using the effective interest method. Amortised cost is calculated by taking into
account the amount at which the assets are measured at initial recognition less principal repayments, plus or minus the cumulative
amortisation using the effective interest method of any difference between that initial amount and the maturity amount (such as due
to discounts or premiums on acquisition and fees and costs that are an integral part of the effective interest rate), and minus any
reduction for impairment. Accrued interest is included in the carrying amount of the financial asset in the statement of financial position.
Impairment losses and reversals of impairment losses are recognised in profit or loss in the line item "Net impairment on financial
assets".

Notes to the Consolidated Financial Statements
Íslandsbanki hf. Consolidated Financial Statements 2019 73
66.3 Cont'd
Financial assets at fair value through other comprehensive income (FVOCI)
For shares and equity instruments that are not held for trading, an irrevocable election can be made at initial recognition, to recognise
unrealised and realised fair value gains and losses, including any related foreign exchange component, in other comprehensive
income rather than profit or loss. This election is made on an instrument-by-instrument basis. Shares and equity instruments at FVOCI
are not subject to an impairment assessment. Dividends are to be presented in profit or loss, as long as they represent a return on
investment. On derecognition there is no recycling of fair value gains and losses to profit or loss.
Financial assets at fair value through profit or loss (FVTPL)
Financial assets classified at fair value through profit or loss are all other financial assets which are not classified at amortised cost or
at fair value through other comprehensive income. This includes financial assets classified mandatorily at fair value through profit or
loss and financial assets which are irrevocably designated by the Group at initial recognition as at fair value through profit or loss that
would otherwise meet the requirements to be measured at amortised cost or at FVOCI. The Group designates financial assets as at
fair value through profit or loss if doing so eliminates or significantly reduces an accounting mismatch that would otherwise arise.
During the year the Group did not classify any financial assets as designated at fair value through profit or loss.
Financial assets at fair value through profit or loss are initially recognised and subsequently measured at fair value in the statement
of financial position. Changes in fair value are recognised in profit or loss in the line item "Net financial income (expense)", except for
interest earned, which is recognised in the line item "Interest income" and foreign exchange gains and losses, which are included in
the line item "Net foreign exchange gain (loss)".
Derivative assets held for hedging
Derivative assets held for hedging consist of derivatives with positive fair value which are designated and accounted for as
hedging instruments (see Note 66.5).
Classification and measurement of financial liabilities
For the purpose of measuring its financial liabilities, the Group classifies them at inception in one of the following categories (see also
Note 5), except for loan commitments and financial guarantees (see Note 66.12):
• Financial liabilities at amortised cost
• Financial liabilities mandatorily at fair value through profit or loss
• Financial liabilities designated as at fair value through profit or loss
• Derivative liabilities held for hedging
Financial liabilities at amortised cost
Financial liabilities at amortised cost are non-derivative financial liabilities. Financial liabilities at amortised cost include deposits, debt
issued and other borrowed funds, and subordinated loans.
Financial liabilities at amortised cost are recognised initially at fair value net of transaction costs incurred, and subsequently are carried
at amortised cost using the effective interest method. Amortised cost is calculated by taking into account the amount at which the
financial liabilities are measured at initial recognition minus principal repayments, plus or minus the cumulative amortisation using the
effective interest method of any difference between that initial amount and the maturity amount (such as due to discounts or premiums
and fees and costs that are an integral part of the effective interest rate). Accrued interest is included in the carrying amount of the
liabilities in the statement of financial position.
The amortised cost of certain bonds issued by the Group, which are designated as hedged items in qualifying fair value hedge
relationships, is adjusted for changes in the fair value of the bonds attributable to interest rate risk (see Note 66.5).
Financial liabilities mandatorily at fair value through profit or loss
Financial liabilities mandatorily at fair value through profit or loss are financial liabilities incurred principally for the purpose of
generating profits from short-term price fluctuations or from the dealer's margin. Financial liabilities mandatorily at fair value through
profit or loss consist of short positions in listed bonds and derivatives with negative fair value which are not classified as financial
guarantees or are not designated as hedging instruments.
Financial liabilities mandatorily at fair value through profit or loss are initially recognised and subsequently measured at fair value in
the statement of financial position. Changes in fair value are recognised in profit or loss in the line item "Net financial income
(expense)", except for interest incurred, which is recognised as "Interest expense" on an accrual basis and foreign exchange gains
and losses which are included in the line item "Net foreign exchange gain (loss)".

Notes to the Consolidated Financial Statements
Íslandsbanki hf. Consolidated Financial Statements 2019 74
66.3 Cont'd
Financial liabilities designated as at fair value through profit or loss
Financial liabilities designated as at fair value through profit or loss are recognised at fair value and changes in fair value attributable
to changes in the credit risk of those liabilities are recognised in other comprehensive income and are not subsequently reclassified
to profit or loss. The remaining fair value changes are included in profit or loss in the line item "Net financial income (expense)", except
for interest incurred, which is recognised as "Interest expense" using the effective interest rate method and foreign exchange gains
and losses which are included in the line item "Net foreign exchange gain (loss)".
The Group calculates the fair value attributable to changes in credit risk as the difference between the changes in fair value of the
financial liability and the amount of changes in fair value attributable to changes in market interest rates. The change in fair value
attributable to changes in market interest rates on financial liabilities is calculated by discounting contractual cash flows at the end of
the period with the discount rate of the appropriate market interest rate.
Upon initial recognition, the Group determines if the recognition of gains and losses in other comprehensive income creates or
enlarges an accounting mismatch in profit or loss, if applicable the whole fair value change is presented in profit or loss.
Derivative liabilities held for hedging
Derivative liabilities held for hedging consist of derivatives with negative fair value which are designated and accounted for as hedging
instruments (see Note 66.5).
Reclassification
Financial assets are reclassified between measurement categories if the objective of the business model in which the financial assets
are held changes after initial recognition and if the change is significant to the Group's operations.
Financial liabilities are not reclassified.
Determination of fair value
The fair value of a financial instrument is the transaction price that would be received to sell an asset or paid to transfer a liability in
an orderly transaction between market participants at the measurement date.
When available, the Group measures the fair value of financial assets and financial liabilities using quoted prices in an active market
for that instrument. A market is considered active if quoted prices are readily and regularly available and those prices represent actual
and regularly occurring transactions. The fair value is based on the most recent observed market prices at the reporting date.
If a market for a financial instrument is not active, the Group establishes its fair value using a valuation technique. Valuation techniques
include net present value and discounted cash flow models, comparison with similar instruments for which observable market prices
exist, Black-Scholes option pricing models and other valuation models. Assumptions and inputs used in valuation techniques include
risk-free and benchmark interest rates, credit spreads and other premia used in estimating discount rates, bond and equity prices,
foreign currency exchange rates, equity and equity index prices and expected price volatilities and correlations. Fair values reflect the
credit risk of the instrument and include adjustments to take account of the credit risk of the Group and the counterparty where
appropriate.
Periodically, the Group tests the valuation techniques and calibrates against historical data and using prices from observable current
market transactions for the same instrument, or based on other available observable market data.
Changes in the fair value of financial assets and financial liabilities are recognised in profit or loss in the line item "Net financial income
(expense)".
The Group has an established control framework with respect to the measurement of fair values. The business unit owning the
positions is responsible for their valuations and for submitting the valuation to the Bank's Investment Committee for approval. Risk
Management provides an independent review of the results, the valuation methods used and of the use of significant unobservable
inputs. The final decision on the validity of the valuation is in the hands of the Bank's Investment Committee.
Impairment of financial assets
The impairment model of IFRS 9 is forward-looking and impairment under IFRS 9 should reflect a probability weighted average of
possible outcomes. In addition, the expected credit loss model in IFRS 9 employs a dual measurement approach, under which the
loss allowance for expected credit losses (ECL) is measured at each reporting date as either 12-month expected credit losses or
lifetime expected credit losses, depending on whether there has been a significant increase in credit risk (SICR) of the financial
instrument since initial recognition. To satisfy the provisions of the IFRS 9 standard, a significant amount of modelling must be involved.
The models which the Group uses for the calculation of the impairment amount are developed according to the Group's modelling
framework. This framework imposes structure on the initial model development work, the model documentation including educational
material as needed for users, the approval process for models, the implementation of models and the lifetime support for models,
including validation and back-testing. The Group's impairment process, which encompasses all the steps needed to derive the
appropriate impairment allowance for each accounting period, is documented and approved by the All Risk Committee.
Notes to the Consolidated Financial Statements
Íslandsbanki hf. Consolidated Financial Statements 2019 75
66.3 Cont'd
Stage assignment
At each reporting date, all assets subject to the impairment methodology must be divided into three groups, termed "Stages", reflecting
the extent of credit deterioration since initial recognition. This division then has an effect on how the impairment is measured and how
interest is recognised.
Stage 1
All assets that have not experienced an SICR are assigned to Stage 1. For these assets, an impairment allowance is recognised
which is equal to the expected credit loss arising from credit events occurring within 12 months of the reporting date (12- month ECL).
Interest is recognised on the gross carrying amount of the assets.
Stage 2
Assets that the Group determines to have experienced an SICR, but are not credit-impaired, are classified as Stage 2. For these
assets, an impairment allowance is recognised which is equal to the expected credit loss arising from all credit events occurring within
the expected lifetime of the assets (lifetime ECL). Interest is recognised on the gross carrying amount of the assets.
The Group's definition of an SICR is on the level of an individual asset. The Group assesses that there has been a significant increase
in credit risk of an asset if the probability of a credit impairment event, i.e. transfer to Stage 3, occurring over the lifetime of the asset
has increased significantly from the origination of the assets. For this purpose, origination does not refer to any modification events
which have not resulted in derecognition of the asset. The assessment is based on a defined set of triggers. This includes, as a
backstop, the trigger that the asset is more than thirty days past due. Other triggers are internal assessments of outlook, events such
as forbearance events which are less severe than a credit event, external credit related information and a significant deterioration in
risk assessment compared with the risk assessment done in relation to the origination of the asset. The definition of SICR depends
only on the probability of a credit event occurring, it does not take into account collateralisation or any other information related to the
expected loss arising from the event. As soon as all triggers for Stage 2 for a particular asset are no longer activated then the asset
moves back to Stage 1. Additionally, assets are classed as forborne for two years after a forbearance event has occurred, but
forbearance events only cause assets to be in Stage 2 for six months and then they migrate back to Stage 1 unless other triggers
apply.
The Group does not employ the low credit risk exemption in the Stage assignment process. In alignment with its operating procedures,
the Group has chosen as its accounting policy to measure the impairment allowance for lease receivables at an amount equal to the
lifetime ECL only for those assets which have an SICR or are credit-impaired. For other lease receivables the impairment allowance
is equal to the 12-month ECL.
Stage 3
This Stage is for assets which are credit-impaired according to the Group's assessment. These assets are therefore experiencing an
ongoing credit event. Thus, the 12-month ECL and lifetime ECL are the same amount and this amount is recognised as impairment
allowance. For assets in this Stage, interest is recognised on the carrying amount of assets, i.e. net of impairment allowance.
The Group's definition of being credit-impaired is on a customer level, rather than on the level of an individual asset. According to the
definition, a customer is credit-impaired when either of the following holds:
a) The Group assesses that it is unlikely that the customer can service all of their commitments to the Group in accordance with the
terms of the agreements without recourse to default provisions in the agreements, or
b) The customer is more than 90 days past due on any of their commitments
The assessment in point a) is made based on a defined set of triggers, which includes serious breach of covenants, serious
registrations on an internal watchlist, initiation of serious collection actions and serious external credit related information.
Furthermore, there is a defined set of conditions which must be satisfied so that customers that have been assessed as being credit-
impaired are no longer subject to this assessment. This includes probation periods and a view to the future outlook of the customer.
Expected credit loss (ECL)
The ECL for each asset is calculated using models for the probability of a credit impairment event occurring (PD), the loss percentage
expected in case of such an event (LGD) and the outstanding amount at the time of the event (EAD). In its simplest form the ECL can
be calculated as the product of these factors, however, for several reasons, the actual formula must be more complicated than this.
The Group uses the standardised approach for regulatory capital purposes but has used PD models and LGD models for risk
management purposes for several years. These models have been adapted for IFRS 9 purposes. For EAD, and for LGD to a certain
extent, new models have been developed.

Notes to the Consolidated Financial Statements
Íslandsbanki hf. Consolidated Financial Statements 2019 76
66.3 Cont'd
The PD models are either fully automated statistical models, expert models or hybrid. For the models with a component involving
expert input there is a process in place to ensure proper review of the model outcome and periodic reassessment of obligors. The
inputs into the models include demographic variables, information from financial statements and past payment behaviour, among
other variables.
The effects of the economy on the PD is accounted for with the use of scaling factors which map through-the-cycle PD values to point-
in-time PD values. The Group has a model to predict these scaling factors based on an economic forecast. The economic forecast is
provided by the Group's Chief Economist. The forecast predicts a range of macroeconomic indicators over a horizon of five years.
The model is applied to a subset of these indicators and produces a set of scaling factors. The scaling factors are then reviewed by
the All Risk Committee with respect to all of the indicators and any other relevant information available and the committee approves
their use for the calculation of the impairment. This process is carried out at least quarterly. The Group uses three economic scenarios.
In addition to the base forecast, scaling factors are produced for a bull and bear case. This is done in order to represent the whole
range of possible future economic developments. The actual impairment allowance is the weighted average of the ECL in these
different scenarios.
The table below shows macroeconomic indicators of the Group's Chief Economist's macroeconomic forecast
The LGD model considers several scenarios for how a facility may develop once a credit event has occurred. One possibility is that
the facility cures without a loss. If not, the recoveries may be based on the seizing of collateral and to estimate such recoveries,
several scenarios for the development of the value of the collateral are considered. Finally, there may be recoveries even though a
formal collateral is not in place. These different recovery scenarios are weighted differently depending on the economic scenario under
consideration. This leads to a non-linear interaction and thus a difference between the probability weighted average ECL and the ECL
in the most likely scenario.
For EAD it is necessary to account for expected prepayments on term loans and for the expected utilisation of commitments such as
credit cards, overdrafts, financial guarantees and credit lines. The expected lifetime of agreements may also extend beyond the
contractual lifetime for contracts which are generally extended.
Write-off policy
The Group writes off a financial asset, either partially or in full, when there is no realistic prospect of recovery. Where financial assets
are secured, write-off is generally after receipt of any proceeds from the realisation of security. In subsequent periods, any recoveries
of amounts previously written off are credited to the income statement.
The impairment process
In the Group's impairment framework, the Stage assignment and ECL for each financial asset is calculated from the aforementioned
models. The outcome is reviewed by the business units and they can propose changes if they provide sufficient supporting material.
The impairment and any proposals for changes are reviewed by an Impairment Council appointed by the All Risk Committee and the
impairment allowance is approved by the All Risk Committee on a quarterly basis.
The principle of materiality applies to the above discussion on impairment, whereby exceptions related to non-materiality and
immaterial adjustments are not discussed.
Change in economic indicators % 2019 2020 2021 2022 2023
Economic growth ................................................................... ( 0.1) 1.3 2.8 2.5 2.5
Housing prices in Iceland ....................................................... 3.1 2.8 3.3 3.5 3.5
Purchasing power .................................................................. 1.8 1.9 2.4 2.1 2.2
ISK exchange rate index ........................................................ 8.8 0.3 - - -
Policy rate, Central Bank of Iceland ....................................... 3.9 3.3 3.7 4.0 4.0
Inflation .................................................................................. 3.1 2.6 2.8 2.6 2.5
Capital formation .................................................................... ( 6.5) 5.7 4.5 4.1 4.1
thereof capital formation in industry ................................... ( 16.5) 5.5 4.0 4.5 4.5

Notes to the Consolidated Financial Statements
Íslandsbanki hf. Consolidated Financial Statements 2019 77
66.4 Derivative financial instruments
Derivatives are primarily used in trading activities but are also used to manage the Group's exposure to various risks, such as interest
rate risk, inflation risk and currency risk. Derivatives which do not classify as equity instruments of the Group are classified as financial
assets or financial liabilities, measured at fair value and presented in the statement of financial position in separate line items as
assets or liabilities, depending on whether their fair value at the reporting date is positive (assets) or negative (liabilities).
The Group applies hedge accounting. Accordingly, some of the Group's derivative financial assets and financial liabilities are
accounted for as financial assets or financial liabilities mandatorily at fair value through profit or loss while others are accounted for
as derivative assets or liabilities held for hedging (see Note 66.3 and Note 66.5).
When derivatives are embedded in other financial instruments or host contracts, such combinations are known as hybrid instruments
with the effect that some of the cash flows of a hybrid instrument vary in a way similar to a stand-alone derivative. These embedded
derivatives are measured and presented in the consolidated financial statements as if they were free-standing derivatives. The Group
accounts for an embedded derivative separately from the host contract when, the host contract is not an asset in the scope of IFRS
9, is not carried at fair value through profit or loss, the terms of the embedded derivative would meet the definition of a derivative if
they were contained in a separate contract, and the economic characteristics and risks of the embedded derivative are not closely
related to the economic characteristics and risks of the host contract. When the Group is required to separate and account for
embedded derivatives as if they were stand-alone contracts, the Group presents the fair value of the embedded derivatives in the
statement of financial position in the same line items in which the Group presents the related host contracts.
66.5 Fair value hedge accounting
The Group applies fair value hedge accounting with respect to designated hedging relationships consisting of certain fixed-rate euro
denominated bonds as the hedged items and certain euro denominated interest rate swaps as the hedging instruments, whereby the
Group pays floating rate interest and receives fixed rate interest. The hedging relationships are designated and accounted for as fair
value hedges because the interest rate swaps are hedging the exposure of the Group to changes in the fair value of the bonds arising
from changes in interest rates. The Group recognises the changes in the fair value of the interest rate swaps immediately in profit or
loss together with the changes in the fair value of the bonds which are attributable to the interest rate risk. The changes in the clean
fair value of the swaps and the notes are included in the line item “Net financial income (expense)”, the accrued interest on the notes
and the swaps is included in the line item “Interest expense” and foreign exchange gains and losses on the notes are included in the
line item "Net foreign exchange gain (loss)".
On initial designation of the hedges, the Group formally documented the relationship between the hedging instruments and hedged
items, including the risk management objective and strategy in undertaking the hedge, together with the method that will be used to
assess the effectiveness of the hedging relationships. The Group makes an assessment, both at inception of the hedge relationships
and on an ongoing basis, of whether the hedging instruments are expected to be highly effective in offsetting the changes in the fair
value of the hedged items during the period for which the hedge is designated, and whether the actual results of each hedge are
within the range of 80-125%.
If a hedging derivative expires or is sold, terminated or exercised, or a hedge no longer meets the criteria for fair value hedge
accounting, or the hedge designation is revoked, then hedge accounting for the corresponding hedging relationship is discontinued
prospectively. Any adjustment up to the point of discontinuation to a hedged item for which the effective interest method is used is
amortised to profit or loss as part of the recalculated effective interest rate of the item over its remaining life.
66.6 Cash and cash equivalents
Cash and cash equivalents in the statement of cash flows consist of cash on hand, demand and term deposits with the Central Bank,
demand deposits with credit institutions, and short-term loans to credit institutions. Cash and cash equivalents comprise balances
with less than three months maturity from the date of acquisition, that are subject to an insignificant risk of changes in their fair value
and which are used by the Group in the management of its short-term cash commitments. Cash and cash equivalents are carried at
amortised cost in the statement of financial position and at the reporting date the expected credit loss is considered to be low.
Impairment losses and reversals of impairment losses are recognised in profit or loss in the line item "Net impairment on financial
assets".
66.7 Investments in associates
Associates are entities over which the Group has significant influence to participate in the financial and operating policy decisions of
an entity, but has not control over those policies. It is presumed that the Group has significant influence if the Group holds 20-50% of
the voting power of an entity.
The Group accounts for its investments in associates using the equity method. Under the equity method, investments in associates
are initially recognised at cost. After the acquisition date the carrying amount of each investment is adjusted to recognise changes in
the Group's share of net assets. Distributions received from an associate reduce the carrying amount of the investment. Goodwill
relating to acquisitions of associates is included in the carrying amount of the investments and is not tested for impairment separately.
Notes to the Consolidated Financial Statements
Íslandsbanki hf. Consolidated Financial Statements 2019 78
66.7 Cont'd
The consolidated financial statements of the Group include the Group's share of the profit or loss and other comprehensive income
of associates, from the date that significant influence commences until the date that significant influence ceases.
When the Group's share of losses of an associate exceeds its interest in the associate, the carrying amount of that associate is
reduced to nil and recognition of further losses is discontinued, except to the extent that the Group has incurred legal or constructive
obligations or made payments on behalf of the associate. If the associate subsequently reports profits, the Group resumes recognising
its share of profits only after its share of profits equals the share of losses not recognised.
After application of the equity method, the Group determines whether it is necessary to recognise an impairment loss on its
investments in associates. At each reporting date, the Group determines whether there is objective evidence that individual
investments in associates are impaired. If there is such evidence, the Group calculates the amount of impairment as the difference
between the recoverable amount of the associate and its carrying amount, and the impairment loss is recognised in profit or loss.
Upon loss of significant influence over an associate, the Group measures and recognises any retained investment at its fair value.
Any difference between the carrying amount of the associate upon loss of significant influence and the fair value of the retained
investment and proceeds from disposal is recognised in profit or loss.
Income and expenses from investments in associates are recognised in profit or loss in the line item "Other operating income".
66.8 Property and equipment
Recognition and measurement
Items of property and equipment are measured at cost less accumulated depreciation and impairment losses (see Note 66.21). Where
parts of an item of property and equipment have different useful lives, those components are accounted for and depreciated as
separate items of property and equipment.
Subsequent costs
The Group recognises in the carrying amount of an item of property and equipment the cost of replacing part of such an item when
that cost is incurred, if it is probable that the future economic benefits embodied with the item will flow to the Group and the cost of
the item can be measured reliably. All other costs are recognised in profit or loss as incurred.
Depreciation
Items of property and equipment are depreciated from the date they are available for use, except for land, which is not depreciated.
The depreciable amount of each item of property and equipment is determined after deducting its residual value. Depreciation is
recognised in profit or loss in the line item "Other operating expenses" on a straight-line basis over the estimated useful lives of each
part of an item of property and equipment.
Right-of-use assets are included in the line item "Property and equipment" (see Note 66.10).
The estimated useful lives are as follows:
Buildings ..................................................................................................................................................................
Right-of-use assets .................................................................................................................................................
Fixtures ....................................................................................................................................................................
Equipment ...............................................................................................................................................................
Vehicles ...................................................................................................................................................................
50 years
3-31 years
6-12 years
4-5 years
3 years
The depreciation method, useful lives and residual values are reviewed at each reporting date and adjusted if appropriate.
66.9 Intangible assets
Software
Software acquired by the Group is measured at cost less accumulated amortisation and impairment losses. Expenditure on internally developed software is recognised as an asset when the Group is able to demonstrate its intention and ability to complete the development and use the software in a manner that will generate future economic benefits, and can reliably measure the costs to complete the development. The capitalised costs of internally developed software include all costs directly attributable to developing the software and capitalised borrowing costs, and are amortised over its useful life. Internally developed software is carried at capitalised cost less accumulated amortisation and impairment losses.
Subsequent expenditure on software assets is capitalised only when it increases the future economic benefits embodied in the specific
asset to which it relates. All other expenditure is expensed as incurred. Software is amortised on a straight-line basis over its estimated
useful live from the date that it is available for use. The amortisation is recognised in profit or loss in the line item "Other operating
expenses". The estimated useful life of software is four to ten years.

Notes to the Consolidated Financial Statements
Íslandsbanki hf. Consolidated Financial Statements 2019 79
66.9 Cont'd
Goodwill
The Group recognises any goodwill arising from a business combination as an asset and measures it initially at cost, being the positive
difference between (a) the aggregate of the consideration transferred, the amount of any non-controlling interest and the acquisition-
date fair value of the Group's previously held equity interest in the acquiree and (b) the net of the acquisition-date amounts of the
identifiable assets acquired and the liabilities assumed by the Group. After initial recognition, goodwill is measured at cost less any
accumulated impairment losses. Goodwill is tested by the Group for impairment annually or whenever there is an indication that it
may be impaired.
66.10 Leases
The Group as a lessee
At the inception of a contract, the Group assesses whether a contract is, or contains, a lease. A contract is, or contains, a lease if the
contract conveys the right to control the use of an identified asset for a period of time in exchange for consideration. The Group has
elected not to separate non-lease components and account for lease and non-lease components of a contract as a single lease
component.
The Group recognises a lease liability and a right-of-use asset at the lease commencement date. The Group has elected not to
recognise right-of-use assets and lease liabilities for short-term leases that have a lease term of 12 months or less and leases of low-
value assets. The Group recognises lease payments associated with these leases as an expense on a straight-line basis over the
lease term.
Lease liabilities
The lease liability is initially measured at the present value of the lease payments, both fixed and variable, discounted using the entity's
incremental borrowing rate. The incremental borrowing rate is the rate of interest the Group would have to pay to borrow over a similar
term, and with a similar security, the funds necessary to obtain an asset of a similar value to the right-of-use asset in a similar economic
environment. The incremental borrowing rate is subject to estimation when no observable rates are available. The lease liability is
measured at amortised cost using the effective interest method and remeasured when there is a change in future payments, e.g.
arising from a change in an index or an assessment of whether extension or termination options will be exercised. After the
commencement date, the amount of lease liabilities is increased to reflect the accretion of interest and reduced for the lease payments
made.
The lease term is determined by the Group as the non-cancellable term of the lease, together with any periods covered by an option
to extend the lease if it is reasonably certain to be exercised, or any periods covered by an option to terminate the lease, if it is
reasonably certain not to be exercised. An assessment of whether the entity will exercise an extension or termination option is made
by management annually. If the assessment of whether the Group will exercise an extension or termination option changes after the
commencement date the lease liability is remeasured and a corresponding adjustment is made to the carrying amount of the right-of-
use asset.
Right-of-use assets
The right-of-use asset is initially measured at cost, which comprises the initial amount of the lease liability adjusted for any lease
payments made at or before the commencement date, plus any initial direct costs incurred less any lease incentives received. For any
remeasurement of the lease liability a corresponding adjustment is made to the carrying amount of the right-of-use asset or recorded
in profit or loss if the carrying amount of the right-of-use asset has been reduced to zero. The right-of-use-asset is subsequently
depreciated using the straight-line method from the commencement date to the end of the lease term. Right-of-use assets are subject
to impairment.
If a lease modification increases the scope of the lease by adding a right to use of one or more underlying assets and the consideration
for the lease increases by an amount commensurate with the stand-alone price for the increased scope and any adjustments to the
price that reflects the circumstances of the particular contract, then the modification is accounted for as a separate lease. For lease
modifications that are not accounted for as separate leases the lease term of the modified lease is redetermined and the lease liability
remeasured using the revised lease payments and discounted using the incremental borrowing rate at the effective date of
modification. Any adjustment of the lease liability is then correspondingly made to the right-of-use asset.
The Group presents right-of-use assets in the line item "Property and equipment" and lease liabilities in the line item "Other liabilities"
in the statement of financial position. Maturity analysis of lease liabilities is disclosed in Note 55. Interest on lease liabilities is
recognised in profit or loss in the line item "Interest expense". Depreciation of right-of-use assets is recognised in profit or loss in the
line item "Other operating expenses".

Notes to the Consolidated Financial Statements
Íslandsbanki hf. Consolidated Financial Statements 2019 80
66.10 Cont'd
The Group as a lessor
The Group classifies leases based on the substance of the arrangements and the extent of the transfer of risks and rewards incidental
to ownership of the leased asset. A lease is classified as an operating lease if the lessor does not transfer substantially all the risks
and rewards incidental to ownership. A lease is classified as a finance lease if the lessor transfers substantially all the risks and
rewards incidental to ownership.
When the Group is the lessor in a capital lease, the Group recognises a receivable equal to the net investment in the lease and
presents it in the line item "Loans to customers" in the statement of financial position. The Group applies its accounting policies for
derecognition and impairment of financial assets also to its capital lease receivables. The Group recognises the finance income from
capital lease receivables in profit or loss in the line item "Interest revenue" over the period of the capital lease so as to give a constant
periodic rate of return on the net investment in the capital lease.
When the Group is lessor in arrangements which involve the legal form of capital leases, but which in substance do not involve leases,
the Group classifies them within loans at amortised cost.
66.11 Non-current assets and disposal groups held for sale
Non-current assets and disposal groups are classified as held for sale if the Group expects to recover their carrying amount principally
through a sale transaction rather than through continuing use. For this to be the case, the assets, or disposal groups, must be available
for immediate sale in their present condition subject only to terms that are usual and customary for sales of such assets, or disposal
groups, and their sale must be highly probable. Non-current assets and disposal groups are presented in the line item "Other assets"
and Non-current liabilities and disposal groups are presented in the line item "Other liabilities".
Immediately before the initial classification as held for sale, the assets, or components of disposal groups, are remeasured in
accordance with applicable accounting policies. Thereafter, the assets, or disposal groups, are measured at the lower of their carrying
amount and fair value less costs to sell, except for deferred tax assets and financial assets, which are measured in accordance with
the accounting policies of the Group applicable to those assets. Once classified as held for sale, intangible assets are no longer
amortised, property and equipment are no longer depreciated and investments in associates are no longer equity accounted. Liabilities
associated with assets classified as held for sale are measured in accordance with the accounting policies of the Group applicable to
those liabilities.
Income and expenses of non-current assets and disposal groups held for sale are recognised in profit or loss in the line item
"Discontinued operations, net of income tax" (see Note 66.23).
66.12 Loan commitments and financial guarantees
Loan commitments are firm commitments of the Group to provide credit under pre-specified terms and conditions. Expected credit
loss of loan commitments (see Note 66.3) is recognised in the statement of financial position in the line item "Other liabilities". Loan
commitment fees received by the Group are recognised in profit or loss in the line item "Fee and commission income".
Financial guarantees are contracts that require the Group to make specified payments to reimburse the holder for a loss it incurs
because a specified debtor fails to make payments when due, in accordance with the terms of a debt instrument. Financial guarantees
are issued by the Group to credit institutions and other parties on behalf of its customers so that they can secure loans, overdrafts
and banking facilities.
Liabilities arising from financial guarantees issued by the Group are initially measured at their fair value, being the premium received.
Subsequently the liabilities are carried at the higher of the amount representing the initial fair value of the guarantee and the expected
credit loss allowance of the guarantee (see Note 66.3). Any changes in the liabilities arising from financial guarantees are recognised
in profit or loss. The premium received is recognised in profit or loss in the line item "Fee and commission income".
66.13 Provisions
Provisions are recognised when the Group has a present obligation (legal or constructive) as a result of a past event, if it is probable
that the Group will be required to settle the obligation with an outflow of resources, and a reliable estimate can be made of the amount
of the obligation.
The amount recognised as a provision is the best estimate of the consideration required to settle the present obligation at the reporting
date, taking into account the risks and uncertainties surrounding the obligation. Where a provision is measured using the cash flows
estimated to settle the present obligation, its carrying amount is the present value of those cash flows. When some or all of the
economic benefits required to settle a provision are expected to be recovered from a third party, the receivable is recognised as an
asset if it is virtually certain that the reimbursement will be received and the amount of the receivable can be measured reliably.
Notes to the Consolidated Financial Statements
Íslandsbanki hf. Consolidated Financial Statements 2019 81
66.14 Employee benefits
All Group entities are required to pay, on a mandatory and contractual basis, contributions to public and private pension funds. The
Group has no further payment obligations once these contributions have been paid. The Group recognises these contributions as
salary related expenses when they become due. The Group does not have a defined benefit pension plan.
Short-term employee benefits include salaries, cash bonuses, non-monetary benefits and compensated absences. Short-term
employee benefit obligations are expensed by the Group as the related service is provided. A liability is recognised for the amount
expected to be paid under short-term cash bonus plans if the Group has a present legal or constructive obligation to pay this amount
as a result of past service provided by the employee and the obligation can be estimated reliably.
66.15 Equity
Share capital
The share capital disclosed in the consolidated financial statements represents the total nominal value of ordinary shares issued by
the Bank. Incremental costs directly attributable to the issuance of ordinary shares are recognised as a deduction from equity, net of
any tax effects.
Dividends on shares
Dividends payable to shareholders of the Bank are recognised as a liability and deducted from equity in the period in which the
dividends are approved by the shareholders at the Bank's Annual General meeting. Dividends payable to non-controlling shareholders
in subsidiaries are recognised as a liability and deducted from equity in the period in which the dividends are approved by the
shareholders' meeting of the subsidiaries. Dividends declared after the reporting date are not recognised as a liability at the reporting
date.
Statutory reserve
According to the Act on Public Limited Companies no. 2/1995 the statutory reserve shall amount to 25% of the share capital of the
Bank.
Restricted reserves
The Group is to transfer, if applicable, certain amounts from retained earnings to restricted reserves which can therefore not be
distributed as dividends to shareholders. These restricted reserves are specified as follows:
Restricted reserve due to capitalised development costs
When the Group capitalises development cost it transfers a corresponding amount from retained earnings to a restricted reserve. In
the future the restricted amount is to be transferred back to retained earnings as the capitalised development cost is amortised in
profit or loss.
Restricted reserve due to fair value changes of financial assets
The Group transfers fair value changes of financial assets at fair value through profit or loss, net of tax if applicable, from retained
earnings to a restricted reserve. Amounts recognised in the reserve are transferred back to retained earnings upon sale of the financial
asset.
Restricted reserve due to unrealised profit of subsidiaries and associates
If share of profit of a subsidiary or an associated company is in excess of dividend received or which can be claimed, the Group
transfers the difference to a restricted reserve in equity. If the Group's shareholding in a subsidiary or an associate is sold or written
off the applicable amount recognised in the reserve is transferred to retained earnings.
Fair value reserve
Fair value reserve comprises all unrealised gains or losses related to fair value changes of equity instruments classified at fair value
through other comprehensive income. On derecognition of the equity instruments fair value changes are not reclassified to profit and
loss.
Liability credit reserve
Changes in fair value attributable to changes in the credit risk of financial liabilities designated as at fair value through profit or loss
are recognised in liability credit reserve. On derecognition the fair value changes are not reclassified to profit or loss.

Notes to the Consolidated Financial Statements
Íslandsbanki hf. Consolidated Financial Statements 2019 82
66.16 Interest income and interest expense
For all financial assets and financial liabilities measured at amortised cost, interest income and interest expense are recognised in
profit or loss using the effective interest method.
The effective interest rate is the rate that exactly discounts estimated future cash payments or receipts through the expected life of
the financial instrument or a shorter period, when appropriate, to the net carrying amount of the financial asset or financial liability.
When calculating the effective interest rate, the Group estimates cash flows, considering all contractual terms of the financial
instrument, but does not consider future credit losses. The calculation generally includes all fees and amounts paid or received
between parties to the contract that are an integral part of the effective interest rate, as well as transaction costs and all other premiums
or discounts.
The effective interest rate is established on initial recognition of financial assets and financial liabilities and their carrying amount is
subsequently adjusted if the Group revises its estimates of payments or receipts. The adjusted carrying amount is calculated based
on the original effective interest rate. The change in carrying amount is recorded as interest income or interest expense. For floating
rate instruments, interest income or interest expense is generally recognised based on the current market rate plus or minus
amortisation or accretion of the discount or premium based on the original effective interest rate.
Interest on impaired financial assets is calculated by applying the original effective interest rate of the financial asset. For financial
assets in Stage 1 and Stage 2 interest is recognised on the gross carrying amount of the assets and for financial assets in Stage 3
interest is recognised on the gross carrying amount of the assets, net of impairment allowance (see Note 66.3).
Interest income and interest expense include gains and losses on derecognition of financial assets and financial liabilities measured
at amortised cost.
For financial assets and financial liabilities at fair value through profit and loss, interest income and interest expense are recognised
through profit or loss on an accrual basis, except for financial liabilities at fair value through profit or loss (see Note 66.3).
Accrued interest on interest rate swaps, which are designated and accounted for as hedging instruments in fair value hedges of the
interest rate risk arising from certain fixed-rate euro denominated bonds issued by the Group (see Note 66.5), is recognised in profit
or loss as an adjustment to the interest expense recognised for the bonds.
66.17 Net fee and commission income
Fees and commissions are recognised to reflect the transfer of services to customers at an amount that reflects the consideration that
is expected to be received for such services. Fees and commission income and expenses that are integral to the effective interest
rate on a financial asset or financial liability are included in the measurement of the effective interest rate.
Fees for loan commitments that are likely to be utilised are recognised as an adjustment to the effective interest rate of the loan. When
a loan commitment is not expected to be utilised, fees are recognised in profit or loss on a straight-line basis over the commitment
period.
Loan syndication fees are recognised as revenue in profit or loss when the syndication has been completed and the Group has
retained no part of the loan package for itself or has retained a part at the same effective interest rate as the other participants.
Commission and fees arising from negotiating, or participating in the negotiation of, a transaction for a third party, such as the
arrangement of the acquisition of shares or other securities, or the purchase or sale of businesses, are recognised on completion of
the underlying transaction.
Portfolio and other management advisory and service fees are recognised based on the applicable service contracts, usually on a
time-apportionate basis.
Asset management fees related to investment funds are recognised rateably over the period in which the service is provided. The
same principle is applied for wealth management, financial planning and custody services that are continuously provided over an
extended period of time. Performance-linked fees or fee components are recognised when the performance criteria are fulfilled.
Where it is assessed that the Group is acting as an agent, the consideration is presented on a net basis.
66.18 Net financial income (expense)
Net financial income (expense) consists of net gain (loss) on financial assets and financial liabilities mandatorily at fair value through
profit or loss, net gain (loss) on financial liabilities designated as at fair value through profit or loss and net gain (loss) on fair value
hedges.
Notes to the Consolidated Financial Statements
Íslandsbanki hf. Consolidated Financial Statements 2019 83
66.18 Cont'd
Net gain (loss) on financial assets and financial liabilities mandatorily at fair value through profit or loss
Net gain (loss) on financial assets and financial liabilities mandatorily at fair value through profit or loss includes all realised and
unrealised fair value changes of financial assets and financial liabilities classified by the Group as mandatorily at fair value through
profit or loss, except for interest income and interest expense, which are included in the line items "Interest income" and "Interest
expense", and foreign exchange gains and losses, which are included in the line item "Net foreign exchange gain (loss)". Dividend
income from financial assets is recognised in the income statement when the Group's right to receive payment is established.
Net gain (loss) on financial liabilities designated as at fair value through profit or loss
Net gain (loss) on financial liabilities designated at fair value through profit or loss includes all realised and unrealised fair value
changes of financial liabilities designated by the Group as at fair value through profit or loss, except for changes in fair value attributable
to changes in credit risk which is recognised in other comprehensive income, interest incurred which is recognised as "Interest
expense" using the effective interest rate method, and foreign exchange gains and losses which are included in the line item "Net
foreign exchange gain (loss)".
Net gain (loss) on fair value hedges
Net gain (loss) on fair value hedges includes the changes in the clean fair value of interest rate swaps which are designated and
accounted for as hedging instruments in fair value hedges and the changes in the fair value of certain bonds issued by the Group,
which are attributable to the interest rate risk of the bonds (see Note 66.5).
66.19 Net foreign exchange gain (loss)
Net foreign exchange gain (loss) disclosed as a separate line item in the income statement comprises all foreign exchange differences
arising on the settlement of foreign currency monetary assets and liabilities and on translating foreign currency monetary assets and
liabilities at rates different from those at which they were translated on initial recognition during the year or in previous financial
statements. Net foreign exchange gain (loss) also includes foreign exchange differences arising on translating non-monetary assets
and liabilities which are measured by the Group at fair value in foreign currencies.
66.20 Operating expenses
Operating expenses consist of professional services, information system related expenses, housing expenses, depreciation of
property and equipment, amortisation of intangible assets and other operating expenses, such as advertising expenses, office
expenses and various public expenses.
66.21 Impairment of non-financial assets
The carrying amounts of the Group's non-financial assets, other than deferred tax assets, are reviewed at each reporting date to
determine whether there is any indication of impairment. If any such indication exists, the Group estimates the recoverable amount of
the asset.
An impairment loss is recognised in profit or loss if the carrying amount of an asset or cash-generating unit exceeds its estimated
recoverable amount.
An impairment loss for non-financial assets is reversed if there has been a change in the estimates used to determine the recoverable
amount. An impairment loss is reversed only to the extent that the asset's carrying amount does not exceed the carrying amount that
would have been determined, net of depreciation or amortisation, if no impairment loss had been recognised. An impairment loss in
respect of goodwill is never reversed.
66.22 Taxes
Income tax expense Income tax expense comprises special financial activities tax, current tax and deferred tax and is disclosed as a separate line item in
the income statement. Income tax expense from discontinued operations is included in the income statement in the line item "Profit
(loss) from discontinued operations, net of income tax" (see Note 66.23). Income tax is recognised in profit or loss, except to the
extent that it relates to items recognised directly in equity, consistent with the recognition of the underlying item to which it relates.
Bank tax Bank tax is calculated as 0.376% (2018: 0.376%) of total liabilities at year-end as determined for tax purposes, in excess of ISK 50,000
million, excluding tax liabilities. The Bank tax is considered a non-deductible expense for the calculation of income tax. The Bank tax
is shown in a separate line in the income statement and is included in the statement of financial position in the line item "Tax liabilities".

Notes to the Consolidated Financial Statements
Íslandsbanki hf. Consolidated Financial Statements 2019 84
66.22 Cont'd
Special financial activities tax Special financial activities tax is calculated as 6% of taxable profit exceeding ISK 1,000 million. Special financial activities tax is
included in the statement of financial position in the line item "Tax liabilities".
Current tax Current tax is the expected tax payable on the taxable income for the year, using tax rates enacted or substantially enacted at the
reporting date, and any adjustment to tax payable in respect of previous years. Current tax assets and current tax liabilities are offset
in the statement of financial position if the Group has a legally enforceable right to set off the recognised amounts and intends either
to settle on a net basis, or to realise the asset and settle the liability simultaneously. Current tax is included in the statement of financial
position in the line item "Tax liabilities".
Deferred tax Deferred tax is recognised based on temporary differences arising between the tax bases of assets and liabilities and their carrying
amounts in the consolidated financial statements. However, deferred taxes are not recognised if it arises from the initial recognition
of an asset or liability, in a transaction other than a business combination, that at the time of the transaction affects neither the taxable
profit nor the accounting profit. In addition, deferred taxes are not recognised if the temporary difference arises from the initial
recognition of goodwill.
Deferred tax is measured using tax rates enacted or substantially enacted at the reporting date and are expected to apply when the
deferred tax asset is realised or the deferred tax liability is settled.
A deferred tax asset is recognised only to the extent that it is probable that future taxable profits will be available against which
deductible temporary differences can be utilised. The deferred tax asset is reviewed at each reporting date and reduced to the extent
that it is no longer probable that the related tax benefit will be realised.
Deferred tax liabilities are included in the statement of financial position in the line item "Tax liabilities" and deferred tax assets are
included in the statement of financial position in the line item "Other assets". Deferred taxes that are part of discontinued operations
(see Note 66.11) are included in the line items "Other assets" and "Other liabilities", respectively, in the statement of financial position.
Deferred tax assets and deferred tax liabilities are offset in the statement of financial position if the Group has a legally enforceable
right to set off current tax assets against current tax liabilities, and the deferred taxes relate to taxes levied by the same taxation
authority on either, the same taxable entity, or on different taxable entities which intend to settle the taxes on a net basis or their tax
assets and liabilities will be realised simultaneously.
66.23 Discontinued operations, net of income tax
Discontinued operations, net of income tax, are disclosed as a separate line item in the income statement and consist of (i) the post-
tax profit or loss from foreclosed assets and disposal groups held for sale, (ii) gain or loss recognised on the measurement to fair
value less costs to sell in excess of book value of foreclosed assets, and (iii) profit or loss from sale of foreclosed assets and disposal
groups held for sale.
66.24 Offsetting
Financial assets and financial liabilities are set off and the net amount reported in the statement of financial position when, and only
when, the Group has a legal right to offset the recognised amounts and intends either to settle on a net basis or to realise the asset
and settle the liability simultaneously.
The Group presents income and expenses on a net basis in the income statement only when required or permitted by the accounting
standards.
66.25 Earnings per share
The Group presents basic and diluted earnings per share for its ordinary shares. Basic earnings per share are calculated by dividing
the profit or loss attributable to ordinary shareholders of the Bank by the weighted average number of ordinary shares outstanding
during the period. Diluted earnings per share are determined by adjusting the profit or loss attributable to ordinary shareholders of the
Bank and the weighted average number of ordinary shares outstanding for the effects of all dilutive potential ordinary shares, if any.
66.26 Segment reporting
An operating segment is a distinguishable component of the Group, for which discrete financial information is available, that engages
in business activities from which it may earn revenues and incur expenses, including revenues and expenses that relate to transactions
with any of the Group's other components. Each operating segment is engaged in providing products or services which are subject to
risk and return that are different from those of other operating segments. The segments' operating result are reported to the Board of
Directors and the Chief Executive Officer, for the purpose of resource allocation and assessment of segment performance.
Íslandsbanki'sCorporate Governance Statement2019Unaudited
Consolidated Financial Statements
Unaudited Appendix: Corporate Governance Statement 2019
86
Íslandsbanki hf. Consolidated Financial Statements 2019
The Board of Directors of Íslandsbanki is committed to excellence in corporate governance complying with the applicable regulatory
standards and best international practices in the field of corporate governance.
Íslandsbanki's governance practises are consistent with general corporate governance guidelines for entities regulated by official
supervisors and regulatory instruments. The regulatory framework for corporate governance practices within Íslandsbanki consists of the
law applicable to entities subject to the supervision of the Financial Supervisory Authority (FME) as well as other applicable law and
regulations, including those imposed by the FME and Nasdaq Iceland, available at their respective websites (www.fme.is and
www.nasdaqomxnordic.com). The applicable law includes, inter alia, the Act on Financial Undertakings no. 161/2002, the Act on Securities
Transactions no. 108/2007, the Act on Competition no. 44/2005 and the Act on Public Limited Companies no. 2/1995, which along with
the Íslandsbanki's Articles of Association lay the foundation for the Bank’s existence and activities. The relevant law is available on the
Icelandic legislature’s website (www.althingi.is).
Exemplary in Corporate Governance
Íslandsbanki is committed to maintaining high standards of governance complying with best governance practices. Íslandsbanki was first
recognised as “Exemplary in Corporate Governance” in March 2014 by the Centre of Corporate Governance at the Institute for Business
Research, University of Iceland. The recognition was awarded following a comprehensive review of the practices of the Board, Board
subcommittees and management. The recognition has been renewed annually since.
Íslandsbanki maintains a Matrix for material bank actions, which outlines all major decisions the Bank may wish to take under given
circumstances. The policy is a part of the Bank's effort to improve its material actions and enhance stakeholders' trust. The Matrix for
material bank actions sets specific conditions to all major decision-making and requires that all such decisions be taken after consultation
with the relevant parties within the Bank and on the basis of the best information available at the time.
Compliance with Corporate Governance Guidelines
The Board of Directors follows the Corporate Governance Guidelines (5th ed.) issued by the Iceland Chamber of Commerce, Nasdaq
Iceland and SA-Business Iceland (hereinafter the Guidelines), in accordance with Paragraph 7 of Article 54 of the Act on Financial
Undertakings no. 161/2002. The Guidelines are available on www.corporategovernance.is. Governance practices of the Bank are
consistent with the Guidelines. Íslandsbanki is in full compliance with them except for Article 1.5.
In accordance with Article 1.5 of the Guidelines the shareholders' meeting shall appoint members to a nomination committee or decide
how they should be appointed. The Bank's shareholders, as well as the Board, have not deemed it necessary to appoint a nomination
committee while the Icelandic Government is the sole owner of the Bank. Board members are nominated by the Icelandic State Financial
Investments (ISFI) through a selection process administered by the ISFI in accordance with article 7 of Act no. 88/2009 on the Icelandic
State Financial Investments.
Main aspects of Risk Management and Internal Control
Internal Control
The risk management and internal control framework of the Bank is based on the three-lines-of-defence model, as referred to in the
European Banking Authority’s Guidelines on Internal Governance and aims for informed decision-making and strong risk awareness
throughout the Bank. The framework is intended to ensure effective and efficient operations, adequate control of risks, prudent conduct of
business, reliability of financial and non-financial information reported internally and externally, and compliance with laws, regulations,
supervisory requirements and the Bank's internal rules.
The first line of defence consists of the Bank's business and support units; the second line of defence is comprised of the Bank's internal
control units, Risk Management and Compliance; and the third line of defence is Group Internal Audit which keeps the Board and
management informed of the quality of corporate governance, risk management and internal controls, including by performing independent
and objective audits.
Risk Management
The Board of Directors approves the risk policy, risk appetite statement and procedure for risk management and ensures that internal
procedures for risk management are revised at least annually.
The All Risk Committee, a Senior Management Committee, is comprised of the CEO, all the managing directors of the Bank and other
members of management appointed by the CEO. The committee is responsible for the review and implementation of the risk management
and internal control policies issued by the Board and monitors that the risk profile of the Bank is within the limits of the risk appetite
statement of the Board of Directors. The ARC issues guidelines for risk assessment and individual risk thresholds or limits in accordance
with Board approved risk appetite.
Further information on the Bank's risk management structure and internal control can be found in the Bank's unaudited Pillar 3 Report
which is available on the Bank's website.

Unaudited Appendix: Corporate Governance Statement 2019
87
Íslandsbanki hf. Consolidated Financial Statements 2019
Audit and accounting
The CEO ensures that Directors of the Board are provided with accurate information on the Bank's finances, development and operations
on a regular basis and the Board Audit Committee assists the Board in fulfilling its oversight responsibilities concerning the financial
reporting process, the system of internal control and the audit process.
The Bank's Finance division is responsible for the preparation of the Group's consolidated financial statements in line with the International
Financial Reporting Standards (IFRS) as adopted by the European Union and additional requirements in the Act on Annual Accounts no.
3/2006, the Act on Financial Undertakings no. 161/2002 and rules on accounting for credit institutions. The Board's Audit Committee gives
its opinion on annual and interim consolidated financial statements before their submission for Board approval and endorsement.
Management reporting is generally presented to the Board 10 times a year. The external auditors review the half year consolidated financial
statements and audit the consolidated financial statements.
The consolidated financial statements are published on an annual and quarterly basis.
As is provided for in the Act on Financial Undertakings and the Bank’s Articles of Association, the Bank's external audit firm is elected at
the AGM. At the 2016 AGM the Icelandic National Audit Office (INAO) was elected, for the first time, to serve as Íslandsbanki's independent
external auditing firm, in accordance with Article 4 of Act no. 46/2016 on the Auditor General and the auditing of government accounts for
a term of five years. The INAO has concluded an agreement and trusting Ernst & Young ehf. with carrying out the Bank's external audit
on its behalf.
Group Internal Audit
The Chief Audit Executive is appointed by the Board, reports directly to the Board and directs Group Internal Audit with a mandate from
the Board. Group Internal Audit operates independently from other departments in accordance with Article 16 of the Act on Financial
Undertakings no. 161/2002. The department provides the Board with independent and objective assurance over the effectiveness of risk
management, control and governance processes. The Chief Audit Executive is engaged by the Board and is responsible for internal audit
on a group basis. The responsibilities and authorisations of the CAE and Group Internal Audit are further outlined in the Group Internal
Audit Charter.
Compliance
The Bank's Compliance Officer is hired by the CEO, subject to Board confirmation, conferring the department's mandate. The Compliance
officer maintains an independent position within the Bank's organisation and is responsible for monitoring and assessing regularly whether
the Bank's operations, regarding securities transactions, are in compliance with applicable law. Furthermore, the Compliance Officer is
responsible for assessing and monitoring the Bank's compliance with Act on Measures against Money Laundering and Terrorist Financing
no. 64/2006 and the Bank's responsible officer under the US Foreign Account Tax Compliance Act (FATCA) and the OECD Common
Reporting Standard (CRS). Moreover, the Compliance Officer is responsible for supervision of compliance risk within the Bank.
Íslandsbanki Values, Code of Conduct and Sustainability
In 2019 the Bank's strategy was revised and the employees of the Bank played a key role in its formulation. Our purpose is moving Iceland
forward by empowering our customers to succeed. Íslandsbanki's values are the pillars of the Bank's corporate culture, shaping the conduct
and attitudes of its employees. The values of Íslandsbanki are passion, professionalism and collaboration.
In October 2019 the Board approved a Code of Conduct for the Bank's employees. The aim of the code is to promote good operational
practices. The document is available on the Bank's website.
Íslandsbanki seeks to work in harmony with the communities in which it operates and strives to have a positive impact in society. This
participation in community programmes rests on Íslandsbanki's Sustainability Strategy which is set by the Board. The strategy covers five
key areas: business, education, environment, workplace, and community. In addition, the Bank has decided to focus particularly on four
of the UN world goals in its course of business, i.e. Climate Action, Gender Equality, Quality Education and Industry, Innovation and
Infrastructure. Furthermore, the Bank produces an annual report, Íslandsbanki in the Community: Global Compact, which can be accessed
on the Bank's website. For the last eight years Íslandsbanki has been a signatory to the UN Global Compact on social responsibility. The
compact is a guide for companies on how to be socially responsible in practice.
The Bank has approved a sustainability policy which is focused on making its operations exemplary in the Iceland business environment
based on established international ESG criteria. The Bank aspires to be a leader in sustainable development and to move Iceland forward
by empowering its customers to succeed.
Board of Directors
The Board of Directors comprises seven non-executive directors, and two alternates, elected at each AGM for a term of one year. The
Chairman of the Board is elected by the shareholders' meeting. There are no limitations on duration of Board membership.
The Board undertakes the Bank's affairs in between shareholders' meetings unless otherwise provided by law or the Bank's Articles of
Association. The Board is responsible for setting the Bank's general strategy and instructs the CEO on its further implementation and
execution. The Board has a supervisory role in that it oversees that the Bank's organisation and activities are at all times in accordance
with the relevant law, regulations and good business practices. The CEO and Chief Audit Executive are hired by the Board.

Unaudited Appendix: Corporate Governance Statement 2019
88
Íslandsbanki hf. Consolidated Financial Statements 2019
The Rules of Procedure of the Board are adopted in accordance with Article 70 of the Act on Public Limited Companies no. 2/1995 and
Article 54 of the Act on Financial Undertakings no. 161/2002. The Board's current rules of Procedure are available on the Bank's website.
According to its Rules of Procedure, at meetings of the Board the presence of at least five members of the Board is required to constitute
a quorum. The Board met 19 times in 2019, each time constituting a quorum.
Candidates for board membership are nominated through a selection process administered by ISFI in accordance with Article 7 of Act no.
88/2009 on Icelandic State Financial Investment. The Articles of Association of the Bank provide that the ratio of each gender on the Board
of Directors shall not be lower than 40%, currently the Board is comprised of three women and four men. The Board has approved a policy
on the suitability of the Board of Directors, the CEO and key function holders. The policy states, among other things, that the composition
of the Board shall at any time be diverse, with regard to educational and professional background, gender and age.
The Board subcommittees The Board subcommittees are three in total and they operate under the terms of a mandate letter from the Board as well as the Rules of
Procedure of the Board. The mandate letters of the Board subcommittees are available on the Bank's website. The Board appoints the
members of the subcommittees as well as their Chairman. When appointing the subcommittees, the Board shall take into account the
expertise, skills and experience needed of a member to be appointed to the relevant subcommittee. All of the subcommittees are
constituted of members of the Board.
The Board Audit Committee, comprising three Board members, assists the Board in fulfilling its oversight responsibilities concerning the
financial reporting process, the system of internal control, the audit process and the Bank's process for monitoring compliance with the
relevant laws and regulations and its code of conduct. The committee met 6 times in 2019, each time constituting a quorum.
The Board Risk Management Committee, comprising three Board members, assists the Board in providing oversight of senior
management activities in managing risk relevant to the Bank's operations. This includes credit risk, market risk, operational risk, liquidity
risk, compliance risk and reputational risk. The committee's responsibilities include the parent company, its subsidiaries and the whole
Group. The committee met 10 times in 2019, each time constituting a quorum.
The Board Corporate Governance, Compensation and Human Resource Committee, comprising three Board members, assists the Board in overseeing the development and the regular assessment of the Bank's approach to corporate governance issues and board effectiveness. Furthermore, it is responsible for providing oversight regarding compensation and human resource issues. The committee met 8 times in 2019, each time constituting a quorum.
Structure and composition of Board subcommittees is as follows:
Members of the Board
Friðrik Sophusson, Chairman of the Board, (b. 1943), joined the Board in January 2010. Friðrik has comprehensive experience in fiscal
policy-making, management, and public service in Iceland. He has also served on the board of several companies and institutions. He
was Managing Director of the Icelandic Management Association from 1972 until 1978, when he was elected to Parliament. During his
tenure as an MP, he held the position of Minister of Industry and Energy in 1987-1988 and Minister of Finance in 1991-1998. He was
appointed CEO of Landsvirkjun, the National Power Company of Iceland, in 1999 and held that position for almost 11 years.
Friðrik holds a Cand. Jur. from the University of Iceland.
Sub-Committees: Member of the Board Corporate Governance, Compensation and Human Resource Committee.

Unaudited Appendix: Corporate Governance Statement 2019
89
Íslandsbanki hf. Consolidated Financial Statements 2019
Anna Þórðardóttir (b. 1960) joined the Board in April 2016. She has been a board member of a number of companies and organisations,
including KPMG and the Institute of State Authorised Public Accountants in Iceland. She is currently a member of the board of The Icelandic
Center for Future Studies (Framtíðarsetur Íslands) and is chairman of the Board Audit Committee of Hagar and a member of the Audit
Committee of Heimavellir. Anna was an employee of KPMG in 1988-2015, where she became partner in 1999. While at KPMG, she was
responsible for the audit of the following companies: Reitir, Hagar, 365, Baugur Group, Vodafone, Landfestar, Landey, 10-11 and
Félagsbústaðir.
Anna holds a Cand Oecon. in Business Administration from the University of Iceland and is a Chartered Accountant. She has also studied towards a Cand. Merc in Financial studies from Handelhøjskolen in Aarhus, Denmark.
Sub-Committees: Chairman of the Board Audit Committee.
Auður Finnbogadóttir (b. 1967) joined the Board in April 2016. She is a project manager of strategy at Kópavogur municipality. She has
extensive experience of working in the financial markets and has served on the board of several companies and institutions. She was
Managing Director for MP Bank, Lífsverk pension fund and the pension fund for employees of Kópavogur municipality. She has served as
chairman of the board of the Competition Authority in Iceland and Norðlenska Ltd., a production and marketing firm for agricultural products.
She has been a member of the board of the Iceland Enterprise Investment Fund, Icelandair Group, Nýi Kaupþing banki, RÚV, the Icelandic
National Broadcasting service and Landsnet, the electric transmission grid company of Iceland. She serves as a member of a governmental
committee, the Procurement Complaints Committee.
Auður holds an MBA from Reykjavik University and a B.Sc. in International Business from the University of Colorado at Boulder. She
completed a diploma program in Public Administration in spring 2018 and is a licensed securities broker by the Icelandic Ministry of Finance
and Economic Affairs.
Sub-Committees: Member of the Board Risk Management Committee.
Árni Stefánsson (b. 1966) joined the Board in April 2016. He has extensive management experience in power-intensive industry in Iceland
and is currently manager and member of the executive board at the Rio Tinto primary aluminium plant. Previously, he was a manager of
the Century Aluminium plant Norðurál in Grundartangi; manager and in the executive board with Landsnet, the electric transmission grid
company of Iceland; and manager with Landsvirkjun, the National Power Company of Iceland.
Árni holds an M.Sc. in Electrical Engineering.
Sub-Committees: Chairman of the Board Risk Management Committee.
Hallgrímur Snorrason (b. 1947) joined the Board in April 2016. An independent consultant in official statistics, he was Director-General of
Statistics Iceland in 1985-2007 and Deputy Managing Director of the National Economic Institute of Iceland in 1980-1984. Has been a
member of the board of several companies, including Útvegsbanki Íslands, Skýrr and Auður Capital. He has also chaired or served on a
number of governmental committees, both domestically and in connection with Nordic cooperation, EFTA, EU and the OECD.
Hallgrímur holds a M.Sc. in Economics from the University of Lund in Sweden and a B.Sc. in Economics from the University of Edinburgh, UK.
Sub-Committees: Member of the Board Corporate Governance, Compensation and Human Resource Committee and the Board Audit
Committee.
Heiðrún Jónsdóttir (b. 1969) joined the Board in April 2016. She is an attorney at law with Múli Legal Services and serves as a member of
the board of Icelandair Group and Reginn, real estate company. Previously, she was Managing Director at Eimskipafélag Íslands, Lex
Legal Services, and Legal and Human Resources at KEA. She has been chairman of the board at Norðlenska, Íslensk Verðbréf and Gildi
pension fund and has been a member of the board of Síminn, Olíuverzlun Íslands, the Icelandic Banks' Data Centre (RB), Ístak, the
securities depository Arion Verðbréfavarsla, Þekking, the Icelandic Pension Funds Association. Heiðrún served as a board member of the
board of the Icelandic Bar Association from 2016 -2019 and was the deputy chairman of the board from 2018-2019.
Heiðrún holds a Cand. Jur from the University of Iceland and is a securities broker licensed by the Icelandic Ministry of Finance and Economic Affairs. She completed an Advanced Management Program (AMP) at IESE Business School in Barcelona in 2017.
Sub-Committees: Chairman of the Board Corporate Governance, Compensation and Human Resource Committee and a member of the Board Audit Committee.
Tómas Már Sigurðsson Vice Chairman of the Board, (b. 1968) joined the Board in March 2019. Tómas is currently the Chief Executive
Officer at HS Orka. Prior to that, Tómas was the Senior Vice President, Strategic Alliances for Alcoa Corporation, Pittsburgh, USA, CEO
of Alcoa Fjarðaál and Alcoa in Iceland but moved to Geneva in 2011 where he became the President of Alcoa Europe. From 2014 to year-
end 2018 Tómas was the Executive Vice President and Chief Operating Officer for Alcoa Corporation. He was the chairman of the Iceland
Chamber of Commerce from 2009 to 2012 and served as a member of the Federation of Icelandic Industries in 2005-2011. He was also
a member of the Executive Committees of the European Aluminium Association, Eurometaux, and the American Chamber of Commerce
to the European Union from 2012 to 2014. Tómas sits on a number of boards for Alcoa Corporation and is a member of the Executive
Committee of Europe Aluminium and Business Europe.

Unaudited Appendix: Corporate Governance Statement 2019
90
Íslandsbanki hf. Consolidated Financial Statements 2019
Tómas holds an M.Sc in Planning from Cornell University, United States and a B.Sc. in Civil and Environmental Engineering from the University of Iceland.
Sub-Committees: Member of the Board Risk Management Committee.
Alternate members of the Board are two; Herdís Gunnarsdóttir and Pálmi Kristinsson, both since April 2016.
None of the members of the Board owns shares in the Bank, neither as a direct ownership nor through associated parties. All members of the Board are as well considered independent from the Bank, its main clients, competitors and shareholder.
Board Performance and Suitability Assessment
At least once a year, as provided for in the Board's Rules of Procedure, the Board assesses its work, procedures and practices as well as
each of its members. This performance assessment is intended to improve working methods and increase the efficiency of the Board. The
assessment entails an evaluation of the strengths and weaknesses of the Board's work and practices. This is i.a. based on an assessment
of the necessary number of board directors, the board structure in relation to knowledge and experience, board procedure and practices.
This assessment was last performed by the Board in January 2020.
Furthermore, the Board annually assesses the collective suitability of the Board and individual Board members in accordance with the
Board’s Rules of Procedure and the Bank's policy on the assessment of the suitability of the Board of Directors, the CEO and key function
holders.
The Chief Executive Officer
The Chief Executive Officer (CEO) is responsible for the day-to-day operations of the Bank and that the Bank's business is, at all times, in
accordance with the Bank's Articles of Association, policies of the Board and the relevant law. The CEO engages the Bank's Compliance
Officer and appoints members of the Executive Committee and other Senior Management Committees.
Birna Einarsdóttir (b. 1961) is the CEO of Íslandsbanki. She holds an MBA from the University of Edinburgh, UK and a Cand. Oecon. in
Business Administration from the University of Iceland. Birna first started working with Íslandsbanki’s predecessors in 1987 and has been
CEO since 15 October 2008. Previous to that she was a Senior Product Manager at the Royal Bank of Scotland and marketing manager
for the Icelandic Broadcasting Company Stöð 2 (Channel 2) and Íslensk getspá. Birna is considered independent from the Bank, its main
clients, competitors and shareholder.
The CEO is not a shareholder in the Bank, neither directly nor indirectly. No call-option agreements exist between the CEO and the Bank.
The executive committee
The executive committee consists of seven people, including the CEO: Birna Einarsdóttir, CEO since October 2008, Jón Guðni Ómarsson,
Chief Financial Officer since October 2011, Sigríður Hrefna Hrafnkelsdóttir, Managing Director of Personal Banking since May 2017, Riaan
Dreyer, Director of Information Technology since September 2019, Guðmundur Kristinn Birgisson, Chief Risk Officer since October 2018,
Una Steinsdóttir, Managing Director of Business Banking since May 2017 and, Ásmundur Tryggvason Managing Director of Corporate &
Investment Banking since January 2019. Riian Dreyer succeeded Sigríður Olgeirsdóttir, who served the position from September 2010.
Ásmundur succeeded Vilhelm Már Þorsteinsson, who served the position from May 2017.
Senior Management Committees
Senior Management Committees are advisory committees appointed by the CEO. Senior Management Committees are divided into
Executive Committees and Business Committees. The committees are appointed by the CEO, and their letters of mandate and rules of
procedure are documented in a charter set by the CEO.
The Executive Committee and the All Risk Committee are responsible for the implementation of the Board approved business strategy,
risk appetite and policies and consist of the CEO, all managing directors as well as other members of senior management appointed by
the CEO.
- The Executive Committee, chaired by the CEO, is responsible for implementing the Board approved business strategy.
- The All Risk Committee is responsible for the review and implementation of the risk management and internal control policies
issued by the Board and monitors that the risk profile of the Bank is within the limits of the risk appetite statement of the Board of
Directors.

Unaudited Appendix: Corporate Governance Statement 2019
91
Íslandsbanki hf. Consolidated Financial Statements 2019
The Business Committees decide on individual business proposals in accordance with the rules and procedures issued by the All Risk
Committee, The Executive Committee and the Board. The Bank's Business Committees are The Asset and Liability Committee, the Senior
Credit Committee, the Investment Committee and the Operational and Security Committee
- The Senior Credit Committee decides on proposals on lending and is the formal venue for discussion and review of individual
loan proposals.
- The Asset and Liability Committee decides on proposals regarding market risk, liquidity risk, funding, capital and internal and
external pricing.
- The Investment Committee decides on proposals regarding the purchase, sale and valuation of equity stakes and other
investments of the Bank.
- The Operational and Security Committee decides on proposals regarding new products and services, continuous operation and
material changes in systems and procedures.
Arrangement of communications between shareholders and the Board
The Board communicates with shareholders in accordance with the relevant laws, the Bank's Articles of Association and the Board's Rules
of Procedure. Members of the Board of Directors shall, in their duties and decision-making, safeguard the interests of the Bank and its
shareholders in accordance with the applicable law, rules, regulations and guidelines.
The Bank is wholly owned by the Icelandic Government since January 2016. The shares are administered by Icelandic State Financial
Investments (ISFI) in accordance with the Act on Icelandic State Financial Investments no. 88/2009. Shareholders' meetings, the supreme
authority of the Bank, are the general forum for informing and communicating with shareholders. Following each publishing of financial
results of the Bank a meeting is held with the ISFI to present the relevant financial results. In between meetings of the Bank's shareholders
the Chairman of the Board, on behalf of the Board of directors, is responsible for communications with shareholders.
Information on infringements of laws and regulations that the appropriate supervisory or ruling body has
determined
In its decision no. 49/2019 the Consumer Agency of Iceland came to the conclusion that the Bank had infringed article 7(4)(f., g., i & l) of
Act no. 33/2013 on Consumer loans as its standard information disclosure form for consumer loans was insufficient. A fine was not imposed
on the Bank. This decision has been appealed by the Bank. Information on legal cases relating to Íslandsbanki can be found in the notes
to the consolidated financial statements.
This Corporate Governance Statement was approved by Íslandsbanki’s Board of Directors on 12 February 2020.

Íslandsbanki hf. Hagasmári 3 201 Kópavogur Iceland Reg.no. 491008-0160