Embed Size (px)
Citation preview
Cognitive Effects of College: Differences between African American and Caucasian StudentsAuthor(s): Lamont A. Flowers and Ernest T. PascarellaReviewed work(s):Source: Research in Higher Education, Vol. 44, No. 1 (Feb., 2003), pp. 21-49Published by: SpringerStable URL: http://www.jstor.org/stable/40197264 .Accessed: 28/10/2011 13:33
Your use of the JSTOR archive indicates your acceptance of the Terms & Conditions of Use, available at .http://www.jstor.org/page/info/about/policies/terms.jsp
JSTOR is a not-for-profit service that helps scholars, researchers, and students discover, use, and build upon a wide range ofcontent in a trusted digital archive. We use information technology and tools to increase productivity and facilitate new formsof scholarship. For more information about JSTOR, please contact [email protected].
Springer is collaborating with JSTOR to digitize, preserve and extend access to Research in Higher Education.
http://www.jstor.org
Research in Higher Education, Vol. 44, No. 1, February 2003 (© 2003)
COGNITIVE EFFECTS OF COLLEGE: Differences Between African American and Caucasian Students
Lamont A. Flowers*,** and Ernest T. Pascarellat
In this longitudinal study of African American and Caucasian students from eighteen 4-year institutions, objective tests were used to estimate the cognitive effects of race in college, while applying statistical controls for an extensive set of confounding influ- ences including precollege and background traits, institutional characteristics, and academic and social experiences. Evidence from the study suggests that in the first 3 years of college Caucasian students scored higher than their African American
counterparts on seven standardized tests measuring critical thinking skills, knowl-
edge of mathematics, reading comprehension, science reasoning, and writing skills.
Implications for future research are discussed.
KEY WORDS; African American students; Caucasian students; college outcomes; student
learning; cognitive development.
INTRODUCTION
The fundamental outcome of a college education is to enable students to think critically and develop skills that promote lifelong learning (Bowen, 1977; Gardner, 1994; Hagedorn, Pascarella, Edison, Braxton, Nora, and Terenzini, 1999; Osterlind, 1997; Pascarella and Terenzini, 1991; Tan, 1995). Over the
years, a considerable amount of research has been conducted to assess the extent to which students who attend college learn more than individuals who do not attend college. Overwhelmingly, this body of evidence suggests that college attendance significantly contributes to learning and cognitive development over and above that of expected maturation and life experiences (Pascarella, 1989; Pascarella and Terenzini, 1991). In addition, there is growing evidence that sug-
*Lamont A. Flowers is an Assistant Professor at the Department of Educational Leadership, Policy, and Foundations, University of Florida.
$Ernest T. Pascarella is Mary Louise Petersen Chair in Higher Education, University of Iowa. **Address correspondence to: Dr. Lamont A. Flowers, University of Florida, College of Educa-
tion, Department of Educational Leadership, Policy, and Foundations, 229B Norman Hall, Gaines-
ville, FL 32611-7049. E-mail: [email protected]
21
036 1-0365/03/0200-002 1/0 © 2003 Human Sciences Press, Inc.
22 FLOWERS AND PASCARELLA
gests that college students accumulate significant learning gains by their senior
year in college (Flowers, Osterlind, Pascarella, and Pierson, 2001). Thus, while it appears clear that college attendance promotes learning and intellectual devel-
opment for its intended beneficiaries, what remains a question is whether learn-
ing gains are equally distributed across racial or ethnic lines. Previous research findings on the cognitive effects of race in college are
mixed. Head (1989), analyzing the impacts of race and gender on academic
performance of 1 ,439 university freshmen at a public university, applied a facto- rial design to analyze the influence of race and gender on grade point average. The study revealed racial group differences on grade point averages; however, follow-up tests resulted in nonsignificant results. Myerson, Rank, Raines, and Schnitzler (1998), using data from the National Longitudinal Survey of Youth, found that African American students benefited more from a college education than Caucasian students did. White (1988) used the symbolic interactionist iden-
tity theory to assess the effects of ethnic identity on academic performance. The
symbolic interactionist identity theory, as defined in the study, asserts that an individual identity is shaped and formed by the set of meanings a person attri- butes to his or her perceived social roles. This theory suggests that individuals interact with others and their environment based on their internalized set of roles. Using this theoretical framework as a base, White sought to assess the extent to which ethnic identity influenced college performance. After controlling for confounding influences (e.g., socioeconomic status, high school perfor- mance, self-esteem, educational aspirations, and adjustment to college), the
study found that ethnic identity did not significantly influence academic perfor- mance for Caucasian students or African American students. In another study, Wolfle (1983) examined the cognitive impacts and academic benefits of college attendance as measured by achievement in vocabulary and mathematics knowl-
edge. Controlling for precollege measures of vocabulary achievement and math- ematics achievement, the results of the study revealed that Caucasian students achieved greater gains on standardized measures of vocabulary and mathematics than African American students did.
Taken as a whole, the literature on the effects of race in college on learning outcomes presents three conflicting findings. First, research evidence on the
impact of race on cognitive development in college suggests that African Ameri- can students benefit more from a college education than Caucasian students do
(Myerson et al., 1998). Second, research evidence suggests that Caucasian stu- dents accrue greater cognitive advantages in college than do African American students (Nettles, Thoeny, and Gosman, 1986; Sampel and Seymour, 1971; Wolfle, 1983). Third, research evidence even suggests that ethnic identity does not significantly influence academic performance for Caucasian students or Af- rican American students (White, 1988).
If the collegiate environment is supposed to enliven educational and cognitive
COGNITIVE EFFECTS OF COLLEGE 23
development, presumably then, net outcomes associated with learning should be
equal and evenly balanced with respect to race in such areas as critical thinking, reading comprehension, mathematics, and other cognitive dimensions generally linked to college attendance. Thus, the present study sought to extend previous research on the cognitive effects of race in college by estimating the extent to which African American and Caucasian students are making similar cognitive gains in college using a nationally representative sample of college students. The study had two specific purposes. First, it sought to estimate the unique effects of race on standardized, objective measures of cognitive development while statistically controlling for the influence of an array of background charac-
teristics, institutional characteristics, and in-class and out-of-class experiences in college. Second, the study sought to determine the presence of conditional effects of race on cognitive outcomes in the first, second, and third years of
college. That is, are there racial differences in the factors that influence cogni- tive development in college?
METHODOLOGY
The individuals in the overall student sample participated in the first, second, and third follow-ups of the National Study of Student Learning (NSSL), a longi- tudinal investigation of the factors that influence learning and cognitive develop- ment in college. The initial sample was selected at random from the incoming
first-year class at each of the 18 colleges and universities in the institutional
sample; each institution was given a target sample size relative to the size of its
first-year class. The students received a cash stipend for their participation in
each data collection, and they were informed that any information they provided would be kept confidential and would never become part of their institutional
records.
Institutional Sample
The institutional sample in this study was eighteen 4-year colleges and univer-
sities located in 15 states from all sections of the country. Institutions were
chosen from the National Center on Education Statistics Integrated Postsecond-
ary Education Data System (IPEDS) data to represent differences in colleges and universities nationwide on a variety of characteristics, including institutional
type and control (e.g., private and public research universities, private liberal
arts colleges, public and private comprehensive universities, historically black
colleges), size, location, patterns of student residence, and the ethnic distribution
of the undergraduate student body. The sampling technique produced a sample of institutions with a wide range of selectivity. For example, included were
some of the most selective institutions in the country and some that were essen-
24 FLOWERS AND PASCARELLA
tially open admission. More specifically, the institutional sample included 3
public research universities, 1 private research university, 2 selective liberal arts
colleges, 2 nonselective liberal arts colleges, 2 historically black colleges, and 8 regional colleges and universities.
Initial Data Collection
The initial data collection was conducted in the Fall of 1992 with 3,331 stu- dents from the 18 institutions participating. Data collected included an NSSL
precollege survey of student demographic characteristics and background, stu- dents' aspirations and expectations of college, and students' orientations toward
learning. Participants also completed Form 88A of the Collegiate Assessment of Academic Proficiency (CAAP). The CAAP was developed by the American
College Testing Program (ACT) to assess general intellectual skills typically acquired by students during the first 2 years of college (American College Test-
ing Program, 1990, 1991).
First Follow-Up Data Collection
The first follow-up data collection was conducted in Spring 1993. This data collection included Form 88B of the CAAP reading comprehension, mathemat- ics, and critical thinking modules; the College Student Experiences Question- naire (CSEQ; Pace, 1984); and a follow-up instrument developed for the NSSL
designed to measure aspects of students' first-year experiences not covered by the CSEQ. The CSEQ and the NSSL follow-up instrument were used to measure a wide range of students' curricular and out-of-class experiences in the first year of college.
Of the original sample of 3,331 students involved in the Fall 1992 data collec- tion, 2,416 students participated in the first follow-up (72.53%). To provide at least some adjustment for potential bias by sex, ethnic identity, and institution in the sample of students persisting in the study a weighting algorithm was
developed. Within each of the 18 institutions, participants in the first follow-up data collection were weighted up to the institution's end-of-first-year population by sex (male or female) and ethnic identity (Caucasian, African American, His-
panic, Other). Thus, for example if an institution had 100 African American men in its first-year class and 25 African American men in the sample, each African American man in the sample at that institution was given a weight of 4.00. An analogous weight was computed for participants in each sex x race cell in each institution. Applying sample weights in this manner allowed us to adjust not only for sample bias by sex and ethnic identity but also for sample bias by institution (i.e., differential rates of sample persistence in the study). Precedent for this weighting procedure can be found in other published reports using data
COGNITIVE EFFECTS OF COLLEGE 25
from the NSSL (Goodstein and Ponterotto, 1997; Flowers and Pascarella, 1999; Pascarella, Bohr, Nora, and Terenzini, 1995; Springer, Terenzini, Pascarella, and Nora, 1995).
Second Follow-Up Data Collection
The second follow-up of the NSSL sample was conducted in the spring of 1994. Similar to the first follow-up, extensive measures of students' second-
year experiences were taken from their responses on the CSEQ and the NSSL
follow-up survey. Students also completed Form 88A of the CAAP writing skills and science reasoning modules. Of the 2,416 students who participated in the first follow-up (Spring 1993), 1,613 students participated in the second fol-
low-up (Spring 1994), for a response rate of 66.8%. A second weighting algo- rithm, analogous to the one employed in the first follow-up, was developed to
adjust for end-of-second-year sample bias by sex, race, and institution.
Third Follow-Up Data Collection
The third follow-up of the NSSL sample took place in the Spring of 1995.
Measures of students' third-year experiences were taken from their responses on the CSEQ and the NSSL follow-up survey. Participants also completed Form
88B of the CAAP reading comprehension and critical thinking modules. Of the
1,613 4-year college students who participated in the Spring 1994 data collec-
tion, 1,054 participated in Spring 1995, for a third-year response rate of 65.3%.
A third weighting algorithm, analogous to the one employed in the first and
second follow-ups, was developed to adjust for potential end-of-third-year sam-
ple bias by sex, race, and institution. The student sample consisted of African American and Caucasian students,
from eighteen 4-year institutions, who participated in the first, second, or third
follow-up data collections. Data from other students in the sample were not
used. Thus, the NSSL analyses are based on: 416 African American students
and 1,306 Caucasian students in the first year, which included 1,124 women
and 598 men; 254 African American students and 979 Caucasian students in the
second year, which included 812 women and 421 men; 175 African American
students and 688 Caucasian students in the third year, which included 578
women 285 men.
CONCEPTUAL FRAMEWORK
Currently, research suggests that four categories of variables impact student
development and learning outcomes in college (Terenzini, Pascarella, and Blim-
ling, 1996; Terenzini, Springer, Pascarella, and Nora, 1995). First, precollege
26 FLOWERS AND PASCARELLA
characteristics represent an important predictor of cognitive development in col-
lege (Pascarella and Terenzini, 1991). Also, research suggests that the nature of the institution is a very important determinant of cognitive growth in college (Terenzini and Wright, 1987). Another line of student development research
suggests that student involvement is an important factor in understanding how students develop in college (Astin, 1977, 1993). Specifically, student involve- ment has been shown to be an important predictor of social and academic devel-
opment in college (Astin, 1977, 1993; Pascarella and Terenzini, 1991). Astin
(1993) adds, "the amount of student learning and personal development associ- ated with any educational program is directly proportional to the quality and
quantity of student involvement in that program" (p. 298). Thus, students' aca- demic experiences (e.g., courses taken, hours spent studying, effort spent engag- ing in academic pursuits) are included in the conceptual model of the current
study as a proxy for student involvement. Out-of-class experiences are also in- cluded in the model (e.g., campus residence, participation in intercollegiate ath-
letics, participation in a Greek organization) because of their impact on student
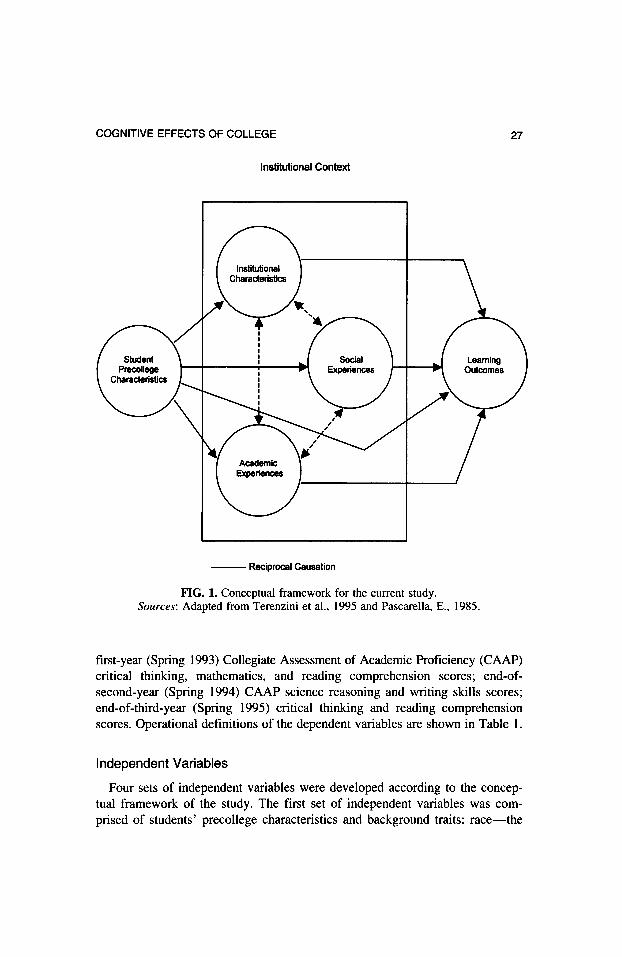
development and cognitive growth (Terenzini et al., 1996). The conceptual framework for the current study was also informed by Pasca-
rella (1985) who, following an extensive review of the literature on the effects of the college environment on cognitive development, articulated and synthesized a causal model that specifies five aspects of the collegiate environment that influ- ence student learning. These sources of influence are: (a) student background/ precollege traits, (b) characteristics of institutions, (c) the institutional envi-
ronment, (d) quality of student effort, and (e) interactions with agents of social- ization. Each source of influence in the model is comprised of separate, yet complementary, variables that interact to shape students' learning and cognitive development in college. The causal model is descriptive and useful for concep- tualizing student learning. In addition, as a conceptual framework, the model
parsimoniously partitions aspects of the collegiate environment that have been shown to influence learning in college. Specific ways in which this conceptual framework informed the research are described in Fig. 1, which diagrams the
conceptual model for the current study, and in the subsequent sections of this
report.
VARIABLES
Dependent Variables
The purpose of the study was to assess the impact of race on learning and
cognitive development in college. As a proxy for learning and cognitive growth, the study employed seven dependent variables from the NSSL - seven standard- ized, objective measures. The standardized, objectives measures were end-of-
COGNITIVE EFFECTS OF COLLEGE 27
FIG. 1. Conceptual framework for the current study. Sources: Adapted from Terenzini et al., 1995 and Pascarella, E., 1985.
Institutional Context
\ I \
I I Social | I Learning | P\ Experiences I
P\ Outcomes I
I \ / \ /
/ Academic \ / I Experiences I /
Reciprocal Causation
first-year (Spring 1993) Collegiate Assessment of Academic Proficiency (CAAP) critical thinking, mathematics, and reading comprehension scores; end-of-
second-year (Spring 1994) CAAP science reasoning and writing skills scores; end-of-third-year (Spring 1995) critical thinking and reading comprehension scores. Operational definitions of the dependent variables are shown in Table 1 .
Independent Variables
Four sets of independent variables were developed according to the concep- tual framework of the study. The first set of independent variables was com-
prised of students' precollege characteristics and background traits: race - the
28 FLOWERS AND PASCARELLA
independent variable of interest; gender; age; socioeconomic status; self-reported grades in high school; a precollege academic motivation variable (e.g., "In high school, I frequently did more reading in a class than was required simply be- cause it interested me"); and precollege critical thinking, precollege mathemat- ics, precollege reading comprehension, and precollege cognitive ability (a com- posite of precollege scores on the CAAP critical thinking, mathematics, and reading comprehension modules) depending on the outcome predicted. The sec- ond set of variables consisted of characteristics of the institution: average pre- college critical thinking, average precollege mathematics, average precollege reading comprehension, and average precollege cognitive ability at the institu- tion attended depending on the outcome predicted, average precollege socio- economic status at the institution attended, average nondiscriminatory racial en- vironment at the institution attended, average scholarly/intellectual emphasis at the institution attended, average supportive relationships at the institution at- tended, and average vocational emphasis of the institution attended.
Students' academic experiences constituted the third set of independent vari- ables: cumulative credit hours taken, average hours spent studying; cumulative number of courses taken in five academic areas: natural sciences and engineer- ing, mathematics, social sciences, technical/preprofessional, and arts and hu- manities; college grades, perceived instructional skill/clarity, perceived instruc- tional organization/preparation, course-related interactions with peers, academic effort/involvement, and computer use. Students' social experiences in the first, second, and third years of college constituted the fourth set of independent vari- ables: hours worked per week, place of residence (on-campus or off-campus), participation in intercollegiate athletics, Greek affiliation, noncourse-related in- teractions with peers, extracurricular involvement, interpersonal involvement, participation in volunteer work, and extent of stressful situations encountered on campus. Detailed composition of all independent measures of NSSL vari- ables used in this study, along with appropriate psychometric characteristics, are shown in Table 1 .
ANALYTICAL PROCEDURES
Data analysis occurred in a two-stage process. In the first stage of the analy- sis, we estimated the net or unique effects of being African American (coded: 1 = African American, 0 = Caucasian) on end-of-first-year (Spring 1993) CAAP critical thinking, mathematics, and reading comprehension scores; end-of- second-year (Spring 1994) CAAP science reasoning and writing skills scores; end-of-third-year (Spring 1995) critical thinking and reading comprehension scores using ordinary least squares regression, while applying statistical controls for the effects of each category of variables in a set-wise manner for each cogni- tive outcome. Thus, five separate regression analyses were conducted for each
COGNITIVE EFFECTS OF COLLEGE 29
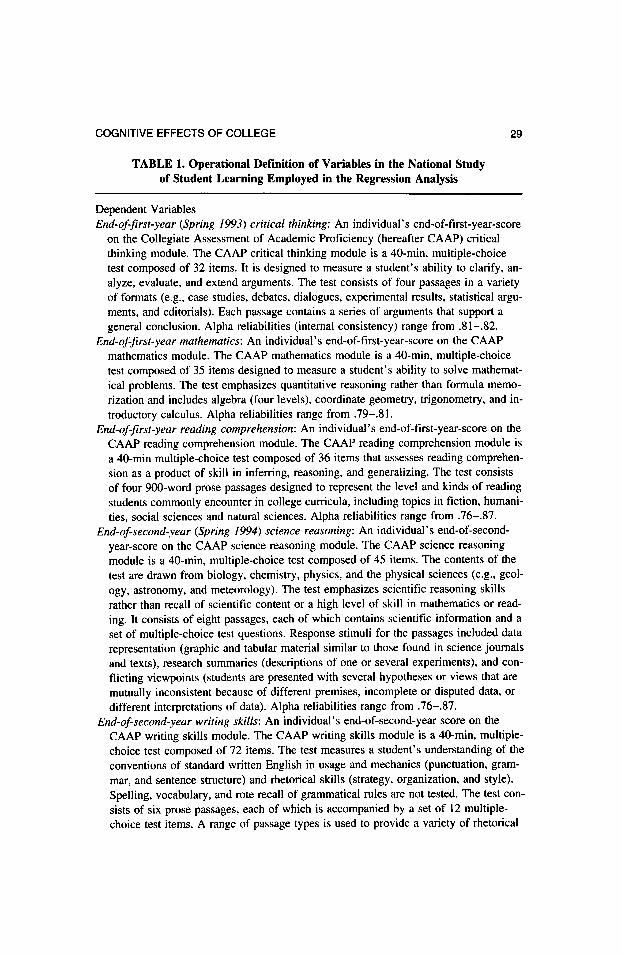
TABLE 1. Operational Definition of Variables in the National Study of Student Learning Employed in the Regression Analysis
Dependent Variables End-of-first-year (Spring 1993) critical thinking: An individual's end-of-first-year-score
on the Collegiate Assessment of Academic Proficiency (hereafter CAAP) critical thinking module. The CAAP critical thinking module is a 40-min, multiple-choice test composed of 32 items. It is designed to measure a student's ability to clarify, an-
alyze, evaluate, and extend arguments. The test consists of four passages in a variety of formats (e.g., case studies, debates, dialogues, experimental results, statistical argu- ments, and editorials). Each passage contains a series of arguments that support a
general conclusion. Alpha reliabilities (internal consistency) range from .81 -.82.
End-of-first-year mathematics: An individual's end-of- first-year-score on the CAAP mathematics module. The CAAP mathematics module is a 40-min, multiple-choice test composed of 35 items designed to measure a student's ability to solve mathemat- ical problems. The test emphasizes quantitative reasoning rather than formula memo- rization and includes algebra (four levels), coordinate geometry, trigonometry, and in-
troductory calculus. Alpha reliabilities range from .79- .81.
End-of-first-year reading comprehension: An individual's end-of-first-year-score on the CAAP reading comprehension module. The CAAP reading comprehension module is a 40-min multiple-choice test composed of 36 items that assesses reading comprehen- sion as a product of skill in inferring, reasoning, and generalizing. The test consists of four 900-word prose passages designed to represent the level and kinds of reading students commonly encounter in college curricula, including topics in fiction, humani-
ties, social sciences and natural sciences. Alpha reliabilities range from .76-. 87.
End-of-second-year (Spring 1994) science reasoning: An individual's end-of-second-
year-score on the CAAP science reasoning module. The CAAP science reasoning module is a 40-min, multiple-choice test composed of 45 items. The contents of the test are drawn from biology, chemistry, physics, and the physical sciences (e.g., geol- ogy, astronomy, and meteorology). The test emphasizes scientific reasoning skills rather than recall of scientific content or a high level of skill in mathematics or read-
ing. It consists of eight passages, each of which contains scientific information and a set of multiple-choice test questions. Response stimuli for the passages included data
representation (graphic and tabular material similar to those found in science journals and texts), research summaries (descriptions of one or several experiments), and con-
flicting viewpoints (students are presented with several hypotheses or views that are
mutually inconsistent because of different premises, incomplete or disputed data, or different interpretations of data). Alpha reliabilities range from .76-.87.
End-of-second-year writing skills: An individual's end-of-second-year score on the CAAP writing skills module. The CAAP writing skills module is a 40-min, multiple- choice test composed of 72 items. The test measures a student's understanding of the conventions of standard written English in usage and mechanics (punctuation, gram- mar, and sentence structure) and rhetorical skills (strategy, organization, and style). Spelling, vocabulary, and rote recall of grammatical rules are not tested. The test con- sists of six prose passages, each of which is accompanied by a set of 12 multiple- choice test items. A range of passage types is used to provide a variety of rhetorical
30 FLOWERS AND PASCARELLA
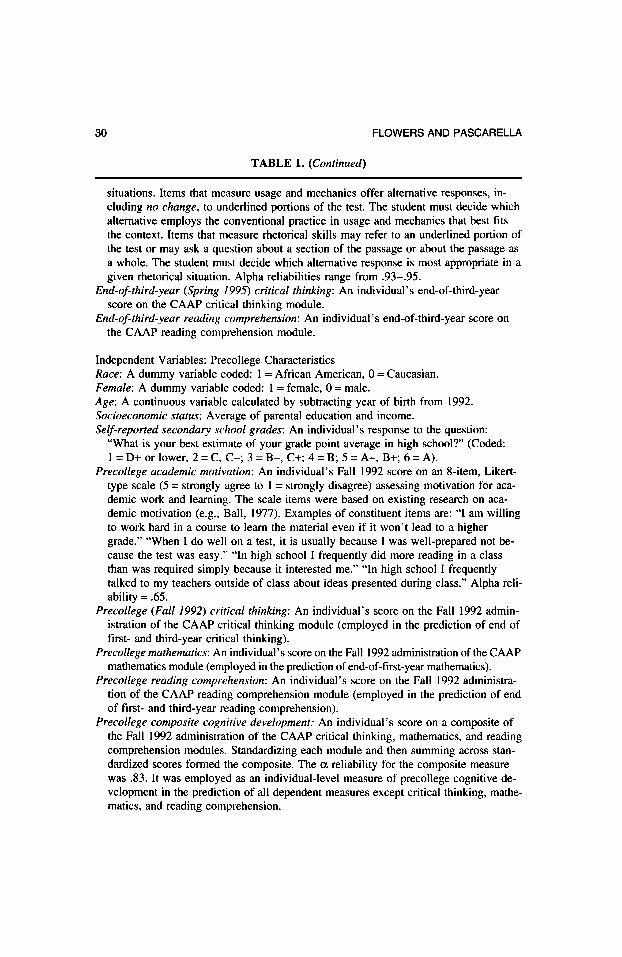
TABLE 1. (Continued)
situations. Items that measure usage and mechanics offer alternative responses, in-
cluding no change, to underlined portions of the test. The student must decide which alternative employs the conventional practice in usage and mechanics that best fits the context. Items that measure rhetorical skills may refer to an underlined portion of the test or may ask a question about a section of the passage or about the passage as a whole. The student must decide which alternative response is most appropriate in a
given rhetorical situation. Alpha reliabilities range from .93-.95.
End-of-third-year (Spring 1995) critical thinking: An individual's end-of-third-year score on the CAAP critical thinking module.
End-of-third-year reading comprehension: An individual's end-of-third-year score on the CAAP reading comprehension module.
Independent Variables: Precollege Characteristics Race: A dummy variable coded: 1 = African American, 0 = Caucasian. Female: A dummy variable coded: 1 = female, 0 = male.
Age: A continuous variable calculated by subtracting year of birth from 1992. Socioeconomic status: Average of parental education and income.
Self-reported secondary school grades: An individual's response to the question: "What is your best estimate of your grade point average in high school?" (Coded: 1 = D+ or lower, 2 = C, C-; 3 = B-, C+; 4 = B; 5 = A-, B+; 6 = A).
Precollege academic motivation: An individual's Fall 1992 score on an 8-item, Likert-
type scale (5 = strongly agree to 1 = strongly disagree) assessing motivation for aca- demic work and learning. The scale items were based on existing research on aca- demic motivation (e.g., Ball, 1977). Examples of constituent items are: "I am willing to work hard in a course to learn the material even if it won't lead to a higher grade." "When I do well on a test, it is usually because I was well-prepared not be- cause the test was easy." "In high school I frequently did more reading in a class than was required simply because it interested me." "In high school I frequently talked to my teachers outside of class about ideas presented during class." Alpha reli-
ability = .65.
Precollege (Fall 1992) critical thinking: An individual's score on the Fall 1992 admin- istration of the CAAP critical thinking module (employed in the prediction of end of first- and third-year critical thinking).
Precollege mathematics: An individual's score on the Fall 1992 administration of the CAAP mathematics module (employed in the prediction of end-of-first-year mathematics).
Precollege reading comprehension: An individual's score on the Fall 1992 administra- tion of the CAAP reading comprehension module (employed in the prediction of end of first- and third-year reading comprehension).
Precollege composite cognitive development: An individual's score on a composite of the Fall 1992 administration of the CAAP critical thinking, mathematics, and reading comprehension modules. Standardizing each module and then summing across stan- dardized scores formed the composite. The a reliability for the composite measure was .83. It was employed as an individual-level measure of precollege cognitive de-
velopment in the prediction of all dependent measures except critical thinking, mathe- matics, and reading comprehension.
COGNITIVE EFFECTS OF COLLEGE 31
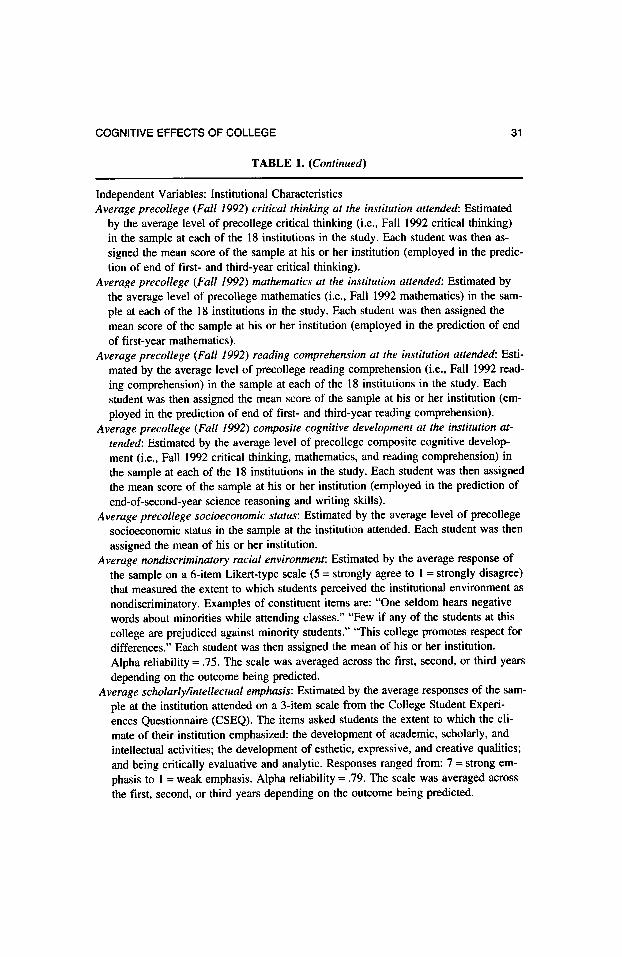
TABLE 1. (Continued)
Independent Variables: Institutional Characteristics
Average precollege (Fall 1992) critical thinking at the institution attended: Estimated
by the average level of precollege critical thinking (i.e., Fall 1992 critical thinking) in the sample at each of the 18 institutions in the study. Each student was then as-
signed the mean score of the sample at his or her institution (employed in the predic- tion of end of first- and third-year critical thinking).
Average precollege (Fall 1992) mathematics at the institution attended: Estimated by the average level of precollege mathematics (i.e., Fall 1992 mathematics) in the sam-
ple at each of the 18 institutions in the study. Each student was then assigned the
mean score of the sample at his or her institution (employed in the prediction of end
of first-year mathematics).
Average precollege (Fall 1992) reading comprehension at the institution attended: Esti-
mated by the average level of precollege reading comprehension (i.e., Fall 1992 read-
ing comprehension) in the sample at each of the 1 8 institutions in the study. Each
student was then assigned the mean score of the sample at his or her institution (em-
ployed in the prediction of end of first- and third-year reading comprehension).
Average precollege (Fall 1992) composite cognitive development at the institution at-
tended: Estimated by the average level of precollege composite cognitive develop- ment (i.e., Fall 1992 critical thinking, mathematics, and reading comprehension) in
the sample at each of the 18 institutions in the study. Each student was then assigned the mean score of the sample at his or her institution (employed in the prediction of
end-of-second-year science reasoning and writing skills).
Average precollege socioeconomic status: Estimated by the average level of precollege socioeconomic status in the sample at the institution attended. Each student was then
assigned the mean of his or her institution.
Average nondiscriminatory racial environment: Estimated by the average response of
the sample on a 6-item Likert-type scale (5 = strongly agree to 1 = strongly disagree) that measured the extent to which students perceived the institutional environment as
nondiscriminatory. Examples of constituent items are: "One seldom hears negative words about minorities while attending classes." "Few if any of the students at this
college are prejudiced against minority students." "This college promotes respect for
differences." Each student was then assigned the mean of his or her institution.
Alpha reliability = .75. The scale was averaged across the first, second, or third years
depending on the outcome being predicted.
Average scholarly/intellectual emphasis: Estimated by the average responses of the sam-
ple at the institution attended on a 3-item scale from the College Student Experi- ences Questionnaire (CSEQ). The items asked students the extent to which the cli-
mate of their institution emphasized: the development of academic, scholarly, and
intellectual activities; the development of esthetic, expressive, and creative qualities; and being critically evaluative and analytic. Responses ranged from: 7 = strong em-
phasis to 1 = weak emphasis. Alpha reliability = .79. The scale was averaged across
the first, second, or third years depending on the outcome being predicted.
32 FLOWERS AND PASCARELLA
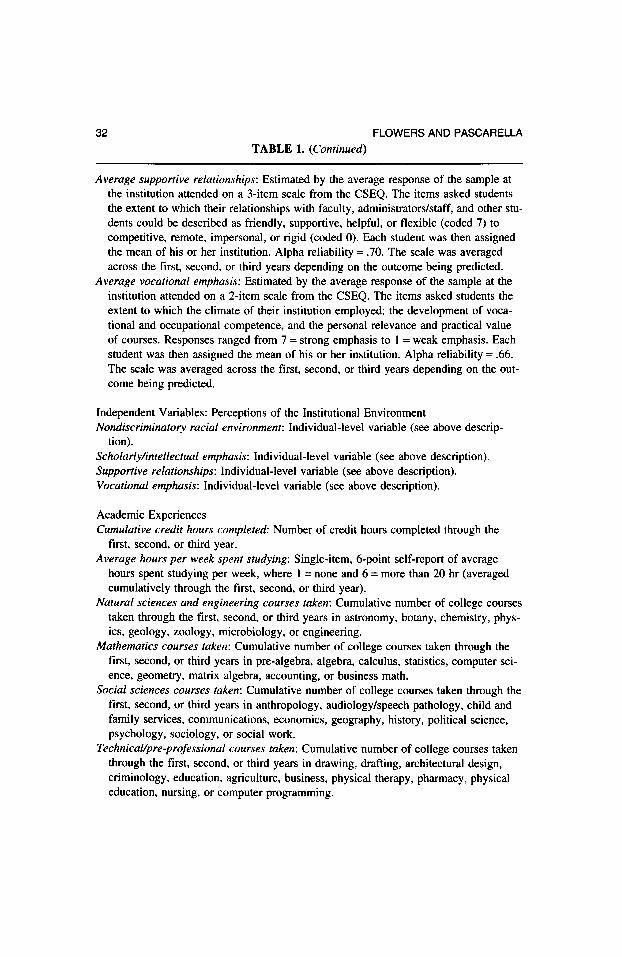
TABLE 1. (Continued)
Average supportive relationships: Estimated by the average response of the sample at the institution attended on a 3-item scale from the CSEQ. The items asked students the extent to which their relationships with faculty, administrators/staff, and other stu- dents could be described as friendly, supportive, helpful, or flexible (coded 7) to
competitive, remote, impersonal, or rigid (coded 0). Each student was then assigned the mean of his or her institution. Alpha reliability = .70. The scale was averaged across the first, second, or third years depending on the outcome being predicted.
Average vocational emphasis: Estimated by the average response of the sample at the institution attended on a 2-item scale from the CSEQ. The items asked students the extent to which the climate of their institution employed: the development of voca- tional and occupational competence, and the personal relevance and practical value of courses. Responses ranged from 7 = strong emphasis to 1 = weak emphasis. Each student was then assigned the mean of his or her institution. Alpha reliability = .66. The scale was averaged across the first, second, or third years depending on the out- come being predicted.
Independent Variables: Perceptions of the Institutional Environment
Nondiscriminatory racial environment: Individual-level variable (see above descrip- tion).
Scholarly/intellectual emphasis: Individual-level variable (see above description). Supportive relationships: Individual-level variable (see above description). Vocational emphasis: Individual-level variable (see above description).
Academic Experiences Cumulative credit hours completed: Number of credit hours completed through the
first, second, or third year. Average hours per week spent studying: Single-item, 6-point self-report of average
hours spent studying per week, where 1 = none and 6 = more than 20 hr (averaged cumulatively through the first, second, or third year).
Natural sciences and engineering courses taken: Cumulative number of college courses taken through the first, second, or third years in astronomy, botany, chemistry, phys- ics, geology, zoology, microbiology, or engineering.
Mathematics courses taken: Cumulative number of college courses taken through the first, second, or third years in pre-algebra, algebra, calculus, statistics, computer sci- ence, geometry, matrix algebra, accounting, or business math.
Social sciences courses taken: Cumulative number of college courses taken through the first, second, or third years in anthropology, audiology/speech pathology, child and
family services, communications, economics, geography, history, political science, psychology, sociology, or social work.
Technical/pre-professional courses taken: Cumulative number of college courses taken
through the first, second, or third years in drawing, drafting, architectural design, criminology, education, agriculture, business, physical therapy, pharmacy, physical education, nursing, or computer programming.
COGNITIVE EFFECTS OF COLLEGE 33
TABLE 1. (Continued)
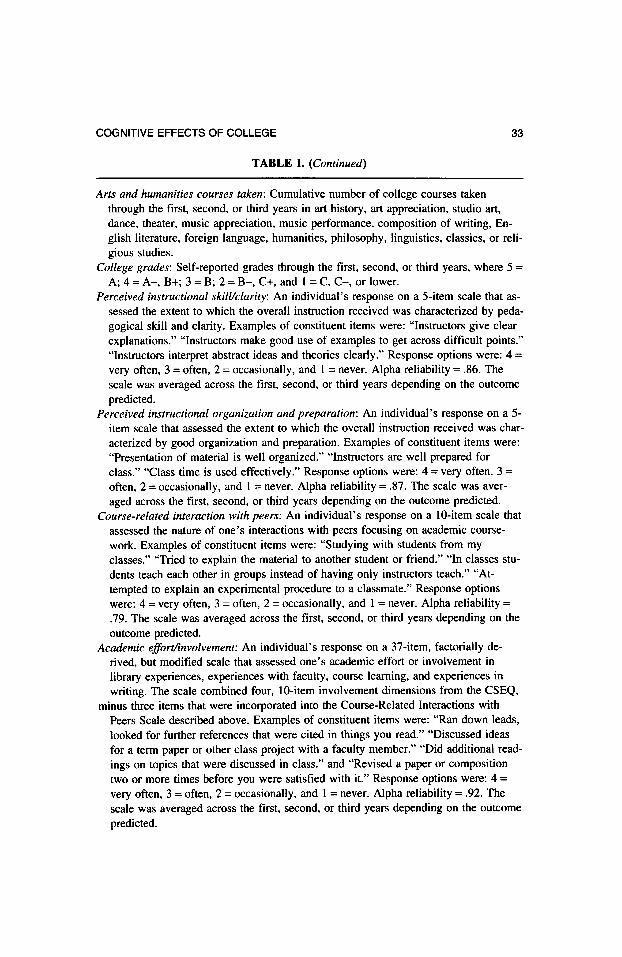
Arts and humanities courses taken: Cumulative number of college courses taken
through the first, second, or third years in art history, art appreciation, studio art, dance, theater, music appreciation, music performance, composition of writing, En-
glish literature, foreign language, humanities, philosophy, linguistics, classics, or reli-
gious studies.
College grades: Self-reported grades through the first, second, or third years, where 5 =
A; 4 = A-, B+; 3 = B; 2 = B-, C+, and 1 = C, C-, or lower. Perceived instructional skill/clarity: An individual's response on a 5-item scale that as-
sessed the extent to which the overall instruction received was characterized by peda- gogical skill and clarity. Examples of constituent items were: "Instructors give clear
explanations." "Instructors make good use of examples to get across difficult points." "Instructors interpret abstract ideas and theories clearly." Response options were: 4 =
very often, 3 = often, 2 = occasionally, and 1 = never. Alpha reliability = .86. The scale was averaged across the first, second, or third years depending on the outcome
predicted. Perceived instructional organization and preparation: An individual's response on a 5-
item scale that assessed the extent to which the overall instruction received was char-
acterized by good organization and preparation. Examples of constituent items were:
"Presentation of material is well organized." "Instructors are well prepared for
class." "Class time is used effectively." Response options were: 4 = very often, 3 =
often, 2 = occasionally, and 1 = never. Alpha reliability = .87. The scale was aver-
aged across the first, second, or third years depending on the outcome predicted. Course-related interaction with peers: An individual's response on a 10-item scale that
assessed the nature of one's interactions with peers focusing on academic course-
work. Examples of constituent items were: "Studying with students from my classes." "Tried to explain the material to another student or friend." "In classes stu-
dents teach each other in groups instead of having only instructors teach." "At-
tempted to explain an experimental procedure to a classmate." Response options were: 4 = very often, 3 = often, 2 = occasionally, and 1 = never. Alpha reliability =
.79. The scale was averaged across the first, second, or third years depending on the
outcome predicted. Academic effort/involvement: An individual's response on a 37-item, factorially de-
rived, but modified scale that assessed one's academic effort or involvement in
library experiences, experiences with faculty, course learning, and experiences in
writing. The scale combined four, 10-item involvement dimensions from the CSEQ, minus three items that were incorporated into the Course-Related Interactions with
Peers Scale described above. Examples of constituent items were: "Ran down leads, looked for further references that were cited in things you read." "Discussed ideas
for a term paper or other class project with a faculty member." "Did additional read-
ings on topics that were discussed in class." and "Revised a paper or composition two or more times before you were satisfied with it." Response options were: 4 =
very often, 3 = often, 2 = occasionally, and 1 = never. Alpha reliability = .92. The
scale was averaged across the first, second, or third years depending on the outcome
predicted.
34 FLOWERS AND PASCARELLA
TABLE 1. (Continued)
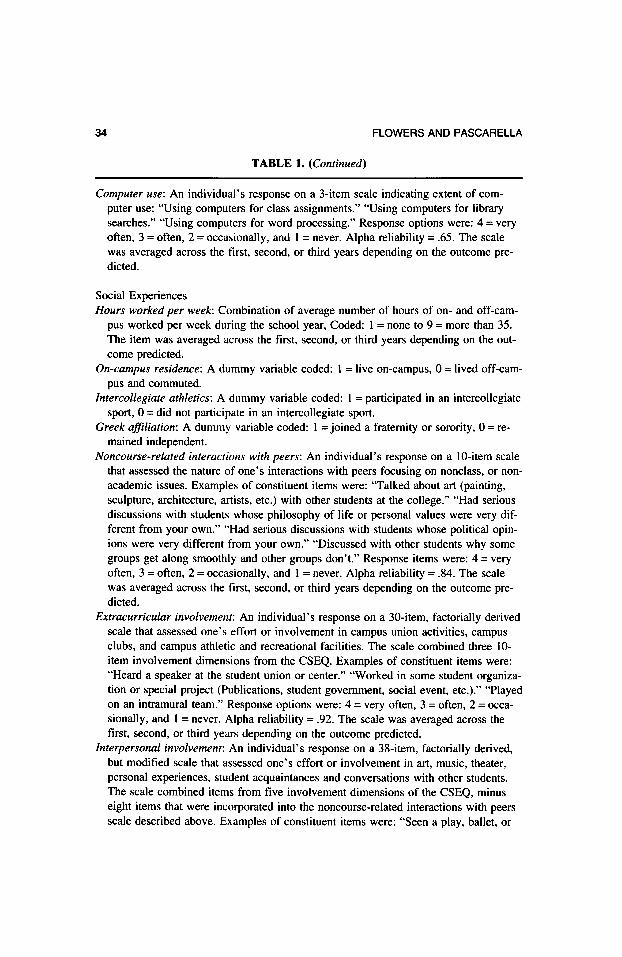
Computer use: An individual's response on a 3-item scale indicating extent of com-
puter use: "Using computers for class assignments." "Using computers for library searches." "Using computers for word processing." Response options were: 4 = very often, 3 = often, 2 = occasionally, and 1 = never. Alpha reliability = .65. The scale was averaged across the first, second, or third years depending on the outcome pre- dicted.
Social Experiences Hours worked per week: Combination of average number of hours of on- and off-cam-
pus worked per week during the school year, Coded: 1 = none to 9 = more than 35. The item was averaged across the first, second, or third years depending on the out- come predicted.
On-campus residence: A dummy variable coded: 1 = live on-campus, 0 = lived off-cam-
pus and commuted.
Intercollegiate athletics: A dummy variable coded: 1 = participated in an intercollegiate sport, 0 = did not participate in an intercollegiate sport.
Greek affiliation: A dummy variable coded: 1 = joined a fraternity or sorority, 0 = re- mained independent.
Noncourse-r elated interactions with peers: An individual's response on a 10-item scale that assessed the nature of one's interactions with peers focusing on nonclass, or non- academic issues. Examples of constituent items were: "Talked about art (painting, sculpture, architecture, artists, etc.) with other students at the college." "Had serious discussions with students whose philosophy of life or personal values were very dif- ferent from your own." "Had serious discussions with students whose political opin- ions were very different from your own." "Discussed with other students why some
groups get along smoothly and other groups don't." Response items were: 4 = very often, 3 = often, 2 = occasionally, and 1 = never. Alpha reliability = .84. The scale was averaged across the first, second, or third years depending on the outcome pre- dicted.
Extracurricular involvement: An individual's response on a 30-item, factorially derived scale that assessed one's effort or involvement in campus union activities, campus clubs, and campus athletic and recreational facilities. The scale combined three 10- item involvement dimensions from the CSEQ. Examples of constituent items were: "Heard a speaker at the student union or center." "Worked in some student organiza- tion or special project (Publications, student government, social event, etc.)." "Played on an intramural team." Response options were: 4 = very often, 3 = often, 2 = occa-
sionally, and 1 = never. Alpha reliability = .92. The scale was averaged across the first, second, or third years depending on the outcome predicted.
Interpersonal involvement: An individual's response on a 38-item, factorially derived, but modified scale that assessed one's effort or involvement in art, music, theater, personal experiences, student acquaintances and conversations with other students. The scale combined items from five involvement dimensions of the CSEQ, minus
eight items that were incorporated into the noncourse-related interactions with peers scale described above. Examples of constituent items were: "Seen a play, ballet, or
COGNITIVE EFFECTS OF COLLEGE 35
TABLE 1. (Continued)
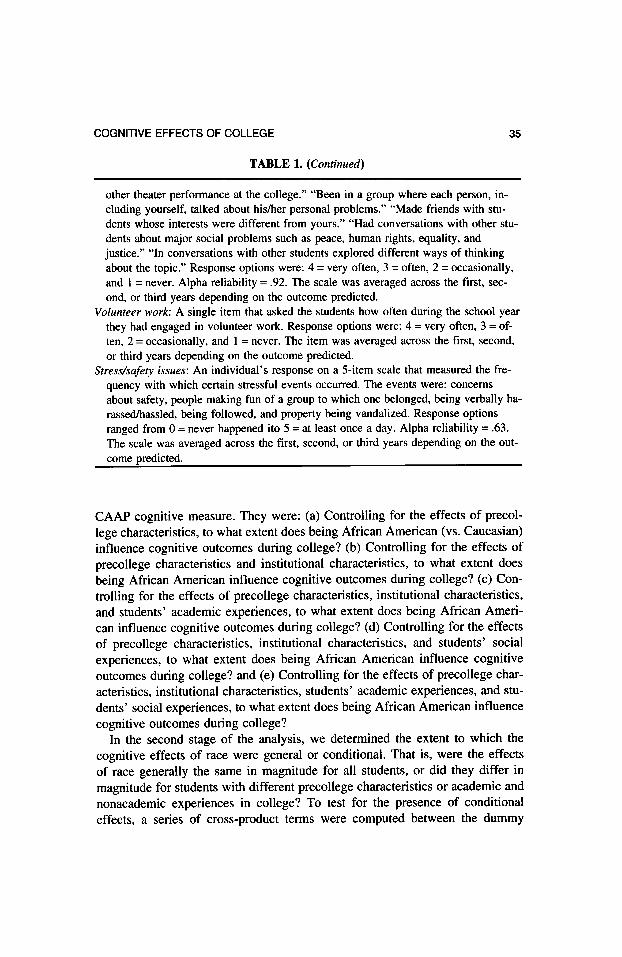
other theater performance at the college." "Been in a group where each person, in-
cluding yourself, talked about his/her personal problems." "Made friends with stu- dents whose interests were different from yours." "Had conversations with other stu- dents about major social problems such as peace, human rights, equality, and
justice." "In conversations with other students explored different ways of thinking about the topic." Response options were: 4 = very often, 3 = often, 2 = occasionally, and 1 = never. Alpha reliability = .92. The scale was averaged across the first, sec-
ond, or third years depending on the outcome predicted. Volunteer work: A single item that asked the students how often during the school year
they had engaged in volunteer work. Response options were: 4 = very often, 3 = of-
ten, 2 = occasionally, and 1 = never. The item was averaged across the first, second, or third years depending on the outcome predicted.
Stress/safety issues: An individual's response on a 5-item scale that measured the fre-
quency with which certain stressful events occurred. The events were: concerns
about safety, people making fun of a group to which one belonged, being verbally ha-
rassed/hassled, being followed, and property being vandalized. Response options
ranged from 0 = never happened ito 5 = at least once a day. Alpha reliability = .63.
The scale was averaged across the first, second, or third years depending on the out-
come predicted.
CAAP cognitive measure. They were: (a) Controlling for the effects of precol-
lege characteristics, to what extent does being African American (vs. Caucasian) influence cognitive outcomes during college? (b) Controlling for the effects of
precollege characteristics and institutional characteristics, to what extent does
being African American influence cognitive outcomes during college? (c) Con-
trolling for the effects of precollege characteristics, institutional characteristics, and students' academic experiences, to what extent does being African Ameri-
can influence cognitive outcomes during college? (d) Controlling for the effects
of precollege characteristics, institutional characteristics, and students' social
experiences, to what extent does being African American influence cognitive outcomes during college? and (e) Controlling for the effects of precollege char-
acteristics, institutional characteristics, students' academic experiences, and stu-
dents' social experiences, to what extent does being African American influence
cognitive outcomes during college? In the second stage of the analysis, we determined the extent to which the
cognitive effects of race were general or conditional. That is, were the effects
of race generally the same in magnitude for all students, or did they differ in
magnitude for students with different precollege characteristics or academic and
nonacademic experiences in college? To test for the presence of conditional
effects, a series of cross-product terms were computed between the dummy
36 FLOWERS AND PASCARELLA
variable indicating race and each of the other independent variables in the pre- diction model for all 3 years separately. The set of cross-product terms was then added to the direct effects equations. A significant increase in explained vari- ance (R2) due to the set of cross-product terms indicated the presence of signifi- cant conditional effects (Pedhazur, 1982). The weighted samples, adjusted to actual sample sizes to obtain correct standard errors, were used in the analyses. Because of the large (unweighted) sample size in Years 1 and 2 of the study, a critical a level of .01 was used. However, because the relatively small sample size reduced statistical power and increased the likelihood of making a Type II error (accepting the null hypothesis when it is false) in Year 3 of the study, we
reported results significant at/? < .05 (Hays, 1994).
RESULTS
Results of the main analyses are presented in two sections: (a) estimates of the effects of being African American (vs. Caucasian) on end-of-first-year, end-
of-second-year, and end-of-third-year cognitive outcomes; and (b) conditional effects of race.
Estimated Cognitive Effects of Being African American (vs. Caucasian)
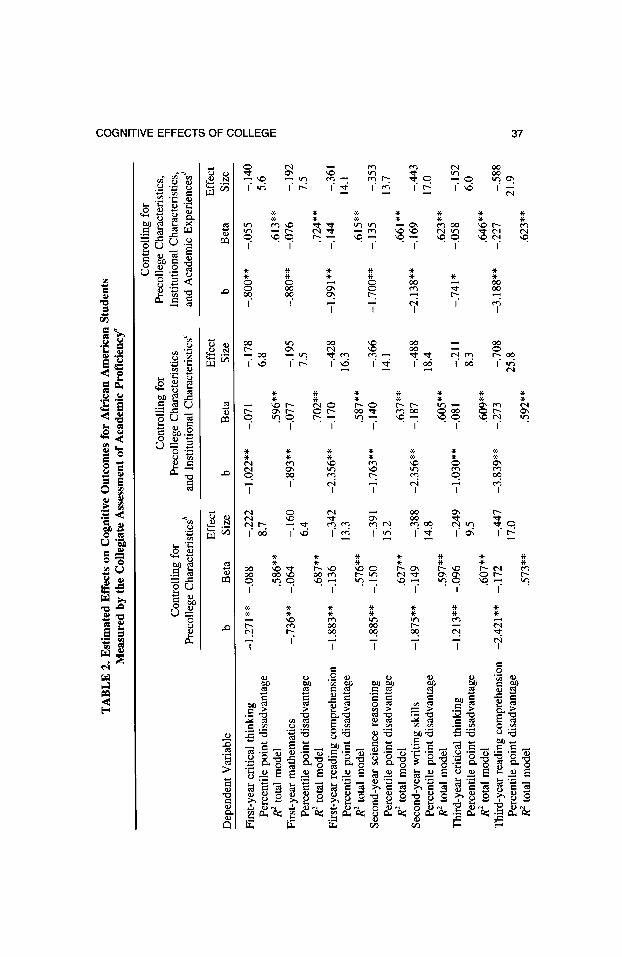
Table 2 reports the estimated causal effects of being African American on the seven cognitive outcomes as measured by the CAAP. As stated earlier, this set of analyses estimated the unique or net effects of race on standardized measures of end-of-first-year, end-of-second-year, and end-of-third-year cognitive out- comes while controlling for an extensive battery of confounding influences in a set-wise manner. Effect sizes were computed by dividing the ratio of the metric
regression coefficients to the respective pooled standard deviations of the out- come measures (Hays, 1994).
Year 1
Table 2 summarizes the set-wise effects of being African American (vs. Cau-
casian) on end-of-first-year cognitive outcomes. As shown in Table 2, in the
presence of precollege controls including gender, age, socioeconomic status, self-reported grades in high school, precollege academic motivation, and precol- lege critical thinking, mathematics, or reading comprehension depending on the outcome predicted, the dummy variable for race yielded significant (p < .01) and negative effects. The unstandardized regression coefficients for race on end-
of-first-year critical thinking, end-of-first-year mathematics, and end-of-first-
year reading comprehension were -1.271, -.736, and -1.883, respectively. In the second set-wise regression equations for end-of-first-year cognitive out-
COGNITIVE EFFECTS OF COLLEGE 37
^Ocn - cocoojoo •> -o u o ^ on vo 10 Tf- *n oo
.a -a o j2 co r >n iv r ^ 2 I'^j - r ^ ̂ r ^ r rj
.2 *C « ^ - ^
u C <5 'C <2£s& * * * * * * *
y is ft # * * * -x- * * 5P2far^ <s »o m vo ^-Tf- «nm -h on moo soh co c c3 2 W fli1^ - r- CN <<t ^ c<) VO SO CN »O Tj-CN CN
S ,c ff* u m° w VOO ' r- ' - \o ' - vo * - VOO * vOCN * vo ouu<s
u w r ' r ' r ' r * r * r * r ts OX) C »rt
rj - .2 « * * * * * *
^2 S B < 00 - 000-^00 a flj*s^ OO oo on O co tj- oo g a
cto^^oo oo on r^ - r^ -
I * £ § * '* -r t "T '" T5
c «^ #«g "oOdjOO »O 00 VO 00 - 00 t 5 „ •- U N ^ ON CN v£> 00 - O
s ic -5 "c w ^ r vo r r-* r vo r ^-' r oo r oo r us
I .a g>g| s s s s s s s >-g S « Cj ^^ vor- (no r-o i>r- m- onco cn 'tss - •£2- "Sr-- ovr- or- oo^- ro oo ooo or- on '^'S o U 13 fflP ^P • ^ "- >n- • vo- • ^P • ^ • °i ^ • I s i a.i r • i- i- • r • I • i- • i- •
«*g *o *S * * * * * * * g° oto ^ * * * * * * S*j PC CNcnvocOvoOON S>3 n*1"1 ,-CN On «n vo »n CO CO ;; v Oh^xjo
n*1"1 ,-CN oo co «n
r^ co p oo
O g « I I I I I I
*SJ2 -fCNOCN - OOONr- •5 ^ -«tJDf>j \O Tt ON 00 Tj- Ti-
o ts '"3 [5 ^ r oo r ^o r co r »n r ^ fo\ r ^ w ox; ^ -c - « O D
°O fenertfrt * * * * * * * c«rj e»- *r{oo vo i- r-vo voo r-ON r-vo r-cN co H .s<« i^oo oovo ooco r-m cN^t onon or- r- 5« - js DQo »no ' vo- ' m- * vo- * »oo ' vo- ' »o m 5 8 u r ' r ' r * r * r ' r ' r -n^ r9<L> * * * * * * * S_- Us * * * * * -X- * *-Tg o - < vo co »r> m co - «r cjor-cooooor- - rN £ 5 ^rit^:00.00.00.riTt S | ^ 7'77777 ^
§ o
jS a>i I 11 if si |i g.1 Cca oca Cc« >-a) w w .5 c« o5*5
,« i§ ^ '§ '"3 8 '-B g "-3 m'-o "S '-3 ° '-3
S c3c'3c3c'3c3c'3^1>5^I'3«s>3wc'3
g. i&l± i&1< i&1* §«£^ 8£^|£^|£^ Q pu '£ '£ co $ H H
38 FLOWERS AND PASCARELLA
I 8 S-c * % S S 8! S S
B W g ^
W) < g, * * * -x- * * w^i? * •* * •* #• *
Sc/jrT; e«oo cotN on m ino ^^t c^on oo
§lS I e«oo
^ cotN
s^ ^2 on m
s:2 ino
^2 ^^t So c^on
s oo
fi'gg o § ^
« o § T3
• s u 2^^T2
* -3* * * * * ^_,2 * * * * -x- *• Co vO On Tf ON Tf CO O-- o^ ^ °° °° "T On Us °9 °^ °>, °9 ^1 °^
•S c« '' '* 7 III 7 7 '*
c« III C
^•- N«n r» vO O On 00 Sea r7 oo o <n cm »n r-
g & j o i' r^ iV f vg i' vo f jn To
<s u a S ^SaSS? * * * * * *
3 ^ n W § ^ ooo or- onvo ^ - • ^O en
c t/5 cd ^c * * * * * •* *z* * * * * * * P X)oooooN»noooo £3 in -^ tj- ra on >o C O On CO O ^O en
5 7 r 7 7 7 7
c i) <u 2 i) d w i)
c c_gc 5c c hue bi) cd cd flt cd o ^ (A A J-« cd C> > C> c«> S3> -^^
C ^ O C/3 C (/) >- C/5 C/3 c/5 .Sc/3
S ""3 '§ "5 S ^ g **3 wo '-o -S ''S
itiJlilts-ltsilslti o^£6i^£^^£c3^Ec3^£o^E
J3c"g S3 cj S3 cfl ^c"3 ^^3 § el $.8 2 g.§ S s.8 S-^ 8 S-^ § 2 ?•§ S I (S-is I £ -is 2 «2^ § £ * 8 £^ I <£^ E E E $ $ i-
COGNITIVE EFFECTS OF COLLEGE 39
1 .Hi I ills I till i Ins-
§• I ?Jl! § !*Sf r« 1 IliS 1 HIb
I | i a 1 o .S&i|
1 1 1 II 1 I I 1 S -s „ I 8* 111! Ill Hi « s i ii?| flfii?
?^C^ g IS? 3 «3
12 ^ § 2 ' *- c jr e c vT p .>; ^ *o *> <*h *- *t2 a) ^ q> c
e 2 § § § ° -s g & g g. a : e 2
1 s -a I §s|§5-§ a
? 1 1 in I*, mis I Mia -SI I si. si
a ! flit ils-SfiJ 7S 5 iji} |lll iff 1 ills l|t;Sli -li fill? !ij! lit
f illil Si .8 1.13.! s § S i a I i a s I 3 :s r.
£ g 3-2.3. 2 .g 53«e°«g ? ! itll! fiff-Hl |f I l:°l! . If ill if |J S ^iltlliiillli
!!!i|li!i|fJU!i!!t
|K £ S-siSliliSifiHil liJ i g^ .1 *^ £ #> liJ SJ i g S,< SJ g^ .s .1 3 g *^
40 FLOWERS AND PASCARELLA
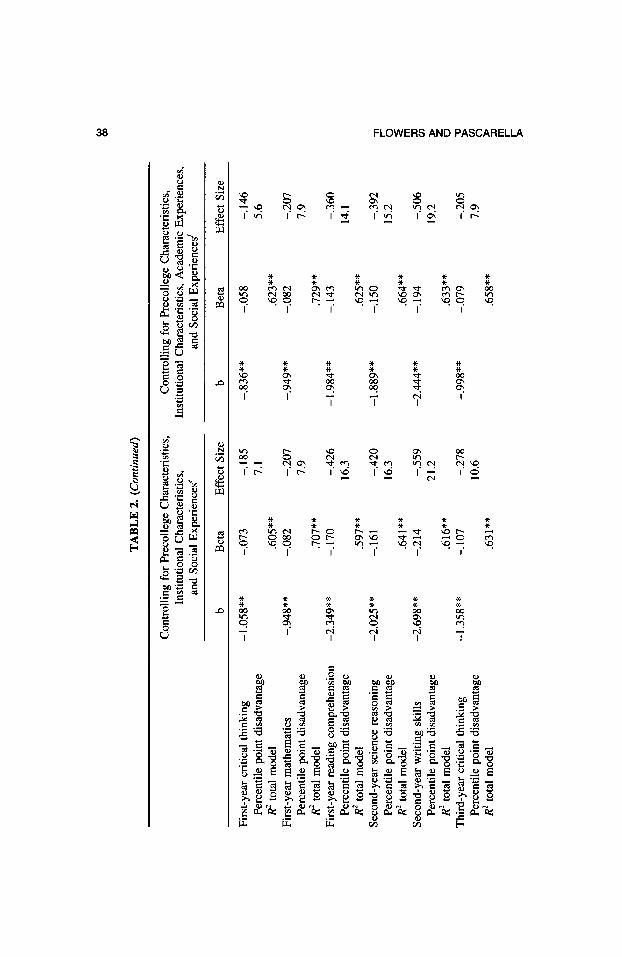
comes, precollege characteristics and institutional characteristics were statisti- cally controlled. After controlling for precollege and institutional characteristics, the unstandardized regression coefficients for race on end-of-first-year critical thinking, end-of-first-year mathematics, and end-of-first-year reading compre- hension were -1.022, -.893, and -2.356, respectively. In the third set-wise re- gression equations for end-of-first-year cognitive outcomes, precollege charac- teristics, institutional characteristics, and academic experiences were statistically controlled. After controlling for precollege characteristics, institutional charac- teristics, and academic experiences the unstandardized regression coefficients for race on end-of-first-year critical thinking, end-of-first-year mathematics, and end-of-first-year reading comprehension were -.800, -.880, and -1.991, respec- tively. In the fourth set-wise regression equations for end-of-first-year cognitive outcomes, precollege characteristics, institutional characteristics, and social ex- periences were statistically controlled. After controlling for precollege character- istics, institutional characteristics, and social experiences, the unstandardized regression coefficients for race on end-of-first-year critical thinking, end-of-first- year mathematics, and end-of-first-year reading comprehension were -1.058, -.948, and -2.349, respectively. In the fifth set-wise regression equations for end-of-first-year cognitive outcomes, precollege characteristics, institutional characteristics, academic experiences, and social experiences were statistically controlled. In the presence of controls for all of the variables in the regression equation, the direct effects of race on cognitive outcomes remained significant and negative for each end-of-first-year cognitive outcome. The unstandardized regression coefficients for race on end-of-first-year critical thinking, end-of- first-year mathematics, and end-of-first-year reading comprehension were -.836, -.949, and -1.984, respectively. Effect sizes resulted in cognitive disadvantages accruing to African American students of .15 of a standard deviation in critical thinking, .21 of a standard deviation in mathematics, and .36 of a standard deviation in reading comprehension. These results translated into average per- centile point disadvantages accruing to African American students of 5.6, 7.9, and 14.1 on end-of-first-year critical thinking, end-of-first-year mathematics, and end-of-first-year reading comprehension, respectively, after controlling for the effects of precollege characteristics, institutional characteristics, academic experiences, and social experiences.
Year 2
Table 2 also summarizes the set-wise effects of being African American (vs. Caucasian) on end-of-second-year cognitive outcomes. As shown in Table 2, in the presence of precollege controls, the dummy variable for race yielded signifi- cant (/? < .01) and negative effects. The unstandardized regression coefficients for race on end-of-second-year science reasoning and end-of-second-year writ-
COGNITIVE EFFECTS OF COLLEGE 41
ing skills were -1.885 and -1.875, respectively. In the second set-wise re-
gression equations for end-of-second-year cognitive outcomes, precollege char- acteristics and institutional characteristics were statistically controlled. After
controlling for precollege and institutional characteristics, the unstandardized
regression coefficients for race on end-of-second-year science reasoning and
end-of-second-year writing skills were -1.763 and -2.356, respectively. In the third set-wise regression equations for end-of-second-year cognitive outcomes,
precollege characteristics, institutional characteristics, and academic experiences were statistically controlled. After controlling for precollege characteristics, in- stitutional characteristics, and academic experiences the unstandardized regres- sion coefficients for race on end-of-second-year science reasoning and end-of-
second-year writing skills were -1.700 and -2.138, respectively. In the fourth set-wise regression equations for end-of-second-year cognitive outcomes, pre- college characteristics, institutional characteristics, and social experiences were
statistically controlled. The unstandardized regression coefficients for race on
end-of-second-year science reasoning and end-of-second-year writing skills were -2.025 and -2.698, respectively. In the presence of controls for all of the variables in the regression equation, the direct effects of race on cognitive out-
comes remained significant and negative for each end-of-second-year cognitive outcome. The unstandardized regression coefficients for race on end-of-second-
year science reasoning and end-of-second-year writing skills were -1.889 and
-2.444, respectively. Effect sizes resulted in cognitive disadvantages accruing to African American students of .39 of a standard deviation in science reasoning and .51 of a standard deviation in writing skills. These results translated into
average percentile point disadvantages accruing to African American students
of 15.2 and 19.2 on end-of-second-year science reasoning and end-of-second-
year writing skills, respectively.
Year 3
Table 2 summarizes the set-wise effects of being African American (vs. Cau-
casian) on end-of-third-year cognitive outcomes. In the presence of precollege variables, the unstandardized regression coefficients for race on end-of-third-
year critical thinking and end-of-third-year reading comprehension were -1.213
and -2.421, respectively. In the second set-wise regression equations for end-
of-third-year cognitive outcomes, precollege characteristics and institutional
characteristics were statistically controlled. After controlling for precollege char-
acteristics and institutional characteristics, the unstandardized regression coeffi-
cients for race on end-of-third-year critical thinking and end-of-third-year read-
ing comprehension were -1.030 and -3.839, respectively. In the third set-wise
regression equations for end-of-third-year cognitive outcomes, precollege char-
acteristics, institutional characteristics, and academic experiences were statisti-
42 FLOWERS AND PASCARELLA
cally controlled. The unstandardized regression coefficients for race on end-of-
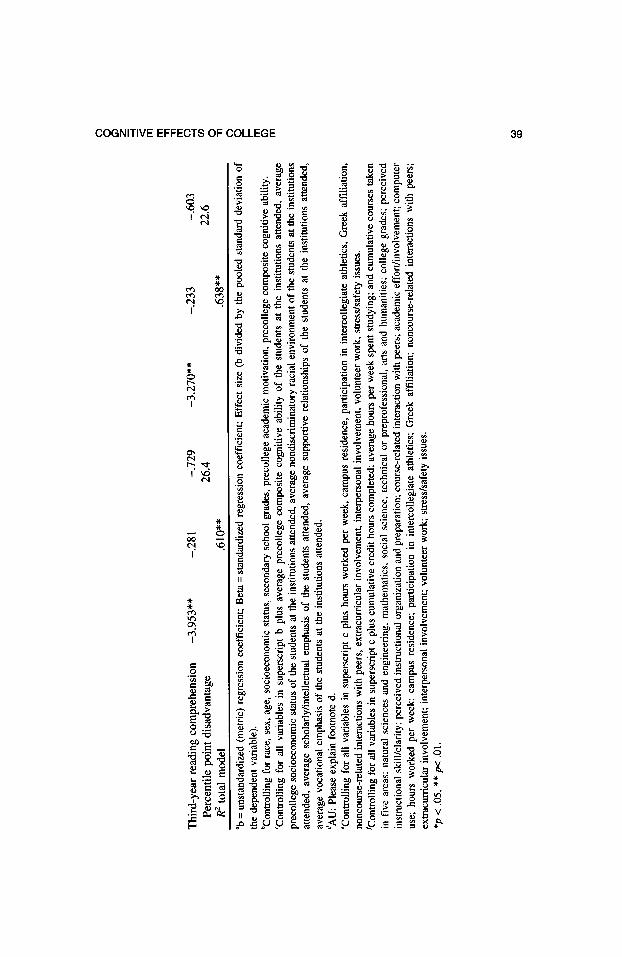
third-year critical thinking and reading comprehension were -.741 and -3.188, respectively. In the fourth set-wise regression equations for end-of-third-year cognitive outcomes, precollege characteristics, institutional characteristics, and social experiences were statistically controlled. After controlling for precollege characteristics, institutional characteristics, and social experiences, the unstan- dardized regression coefficients for race on end-of-third-year critical thinking and end-of-third-year reading comprehension were -1.358 and -.953, respec- tively. In the direct effects equation, the unique effect of race on end-of-third-
year critical thinking and reading comprehension remained significant and nega- tive. The unstandardized regression coefficients for race on end-of-third-year critical thinking and reading comprehension were -.998 and -3.270. Effect sizes resulted in cognitive disadvantages accruing to African American students of .21 and .60 of a standard deviation in critical thinking and reading comprehension, respectively. These results translated into average percentile point disadvantages accruing to African American students of 7.9 and 22.6 on end-of-third-year critical thinking and reading comprehension, respectively.
Conditional Cognitive Effects of Race
To test for the presence of conditional effects, a series of cross-product terms was computed between the dummy variable indicating race and each of the other
independent variables in the prediction model for all three years, separately. The set of cross-product terms was then added to the direct effects equations em-
ployed in the analyses. The set of cross-product terms made significant increases in R2 in slightly over half of the conditional effects analyses conducted. These results indicated that the factors that influence learning outcomes differed in
magnitude for African American and Caucasian students. In the first year of the
study, two significant conditional effects were identified: (a) precollege critical
thinking x race and (b) number of arts and humanities courses taken x race in the prediction of end-of-first-year critical thinking. In the second year of the
study, one significant conditional effect for race was uncovered: volunteer work x race in the prediction of end-of-second-year writing skills. In the third year of the study, seven significant conditional effects were identified: (a) gender x race, (b) age x race, (c) average scholarly/intellectual emphasis at the institution at- tended x race, (d) college grades x race in the prediction of end-of-third-year critical thinking; and (e) average precollege reading comprehension at the insti- tution attended x race, (f ) average precollege socioeconomic status at the institu- tion attended x race, and (g) number of social science courses taken x race in the prediction of end-of-third-year reading comprehension.
To determine the nature of the conditional effects we divided the sample by race (African American and Caucasian) and then reran the direct effects equa-
COGNITIVE EFFECTS OF COLLEGE 43
tions. In the first year, the results indicated that for African American students and Caucasian students, precollege critical thinking ability positively impacted their end-of-first-year critical thinking. For African American students the esti- mated effects of precollege critical thinking on end-of-first-year critical thinking was moderate (b = .488, p < .01). For Caucasian students the estimated effects of precollege critical thinking on end-of-first-year critical thinking were more
pronounced (b = .703, p < .01). It was also found that the number of arts and humanities courses taken by African American students in the first year of col-
lege negatively influenced end-of-first-year critical thinking (b = -.259); in con-
trast, for Caucasian students the estimated effects of arts and humanities courses taken on end-of-first-year critical thinking was slightly positive (b = .042) but
statistically nonsignificant in both samples. In the second year of the study,
participation in volunteer work was found to have significant positive effects on
end-of-second-year writing skills for African American students (b = .498) and
slightly negative, but nonsignificant, effects on end-of-second-year writing skills
for Caucasian students (b = -.117). In the third year of the study, the data revealed that gender differentially
impacted end-of-third-year critical thinking. For Caucasian students being a fe-
male (vs. a male) exerted a positive and significant influence on end-of-third-
year critical thinking (b = 1.20, p < .01), and for African American students the
effect of gender was negative, but nonsignificant (b = -.646). In addition, age
differentially impacted end-of-third-year critical thinking for African American
and Caucasian students. More specifically, for African American students, age exerted a small, negative influence (b = -.09, p < .01) on end-of-third-year criti-
cal thinking, while for Caucasian students the effect of age was positive, but
nonsignificant (b = .004). Also, it was found that the estimated effect of the
average scholarly/intellectual emphasis at the institution attended on end-of-
third-year critical thinking was negative for African American students (b =
-1.261) and Caucasian students (b = -.01), but statistically nonsignificant for
both samples. For African American students, college grades exerted a positive and significant influence (b = .357, p < .01) on their end-of-third-year critical
thinking scores. In contrast, for Caucasian students, college grades resulted in a
nonsignificant result (b = .014). In the third year of the study, the average precollege reading comprehension
at the institution attended had significant negative effects on end-of-third-year
reading comprehension for Caucasian students (b = -.960) and small, nonsignif- icant effects on end-of-third-year reading comprehension for African American
students (b = -.045). Similarly, the average socioeconomic status at the institu-
tion attended had significant positive effects on end-of-third-year reading com-
prehension for Caucasian students (b = 2.120) and moderate, nonsignificant ef-
fects on end-of-third-year reading comprehension for African American students
(b = .462). Also, in the third year of the study, the number of social science
44 FLOWERS AND PASCARELLA
courses taken was found to have significant negative effects on end-of-third-year reading comprehension for African- American students (b = -.17O) and slightly negative, but nonsignificant, effects on end-of-third-year reading comprehension for Caucasian students (b = -.006).
DISCUSSION
The results of this national study of the impacts of race on student learning yielded two major findings. First, this longitudinal study extends previous re- search (Head, 1989; Mackay and Kuh, 1994; Nettles et al., 1986; White, 1988; Wolfle, 1983) by suggesting that even in the presence of an extensive array of controls for background and precollege traits, institutional characteristics, and academic and social experiences, Caucasian students make significantly higher cognitive gains in college than African American students do in the first 3 years of college. This finding held for all of the standardized, objective measures of critical thinking, reading comprehension, mathematics, science reasoning, and
writing skills. The data revealed overwhelmingly that the negative cognitive disadvantages for African American students remained consistent throughout the study, even when statistical controls were introduced for all of the variables in the regression model (i.e., direct effects equation).
Using the ratio of the metric regression coefficient to the pooled standard deviation as a measure of effect size, the magnitude of the learning advantage for Caucasian students was .15 of a standard deviation for end-of-first-year criti- cal thinking, .21 of a standard deviation for end-of-first-year mathematics, .36 of a standard deviation for end-of-first-year reading comprehension, .39 of a standard deviation for end-of-second-year science reasoning, .51 of a standard deviation for end-of-second-year writing skills, .21 of a standard deviation for
end-of-third-year critical thinking, and .60 of a standard deviation for end-of-
third-year reading comprehension. Converting these effect sizes to percentile points under the normal curve, this became a 5.6 percentile point advantage for end-of-first year critical thinking, a 7.9 percentile point advantage for end-of-
first-year mathematics, a 14.1 percentile point advantage for end-of-first-year reading comprehension, a 15.2 percentile point advantage for end-of-second-
year science reasoning, a 19.2 percentile point advantage for end-of-second-
year writing skills, a 7.9 percentile point advantage for end-of-third-year critical
thinking, and a 22.6 percentile point advantage for end-of-third-year reading comprehension. The average percentile point advantage across all of the end-
of-first-year cognitive outcomes was 9.2. The average percentile point advantage across all of the end-of-second-year cognitive outcomes was 17.2. The average percentile point advantage across all of the end-of-third-year cognitive outcomes was 15.3. Taken as a whole, the average percentile point advantage (for Cauca- sian students) across all of the end-of-first-year, end-of-second-year, and end-
COGNITIVE EFFECTS OF COLLEGE 45
of-third-year cognitive outcomes was 13.2. Thus, these estimates suggest that if African American students are functioning at the 50th percentile across all NSSL standardized measures of cognitive development (critical thinking, mathe-
matics, reading comprehension, science reasoning, and writing skills), Cauca- sian students are functioning at the 63rd percentile. Given that the data suggests that African American students change less than their Caucasian counterparts in the first 3 years of college, more remedial education may be a viable option for African American students in the first year of college to counteract this effect. It should be noted, however, the analytical procedures employed in this study do not permit us to definitively suggest direct courses of action. However, the data does supports potential recommendations that may be applicable under cer- tain circumstances.
Second, it was shown that the effects of race on cognitive outcomes were conditional. In each year of the study the impact of race on learning differed in
magnitude for African American and Caucasian students that differed in precol- lege critical thinking ability, the number of arts and humanities courses taken,
participation in volunteer work, gender, age, college grades, and the number of social science courses taken. The results of the conditional effects analyses indi- cate that there are some potential programmatic initiatives available to adminis- trators and student development personnel to help explain and rectify the overall results of the study. For example, in the third year of the study, it was found
that the total number of social science courses taken by the end of that year differentially impacted end-of-third-year reading comprehension for African
American and Caucasian students. For African American students, the number of social science courses taken seemed to negatively impact end-of-third-year reading comprehension outcomes. In contrast, for Caucasian students, the num-
ber of social science courses taken did not significantly impact end-of-third-year reading comprehension outcomes.
Due to methodological limitations inherent in the present study, the statistical results do not provide any specific explanations that clarify directly the findings reported in this study. However, research literature suggests that three primary issues may help to account for the overall results of the study. First, research has shown that African American college students may have had poor elemen-
tary and secondary educational experiences, which may have negative impacts on their performance on standardized tests of academic achievement and cogni- tive outcomes in college (Davis and Jordan, 1994; McElroy- Johnson, 1993). Thus, additional research and policies are needed to improve the elementary and
secondary school experiences of African American students. Second, previous research has suggested that African American students may not respond well to
standardized measures of academic aptitude and that noncognitive measures
may provide better predictors of academic performance or cognitive standing (Fleming, 2000; Tracey and Sedlacek, 1984). If this is true, the dependent vari-
46 FLOWERS AND PASCARELLA
ables employed in this study (objective, standardized measures of learning) may not be the most suitable measures of cognitive development for African Ameri- can students. Third, consistent and accumulating research shows that African American students are more likely than Caucasian students are to perceive the
college environment as unwelcoming and hostile (Ancis, Sedlacek, and Mohr, 2000; D'Augelli and Hershberger, 1993; Gossett, Cuyjet, and Cockriel, 1996; Lewis, Chesler, and Forman, 2000). As such, in attempting to understand the statistical results of this study, it is important to consider the potential negative impacts of feelings of alienation, isolation, and discrimination on African Amer- ican students' cognitive development in college. To date, existing research has not adequately addressed how African American students' perceptions of the
campus environment influence learning in college. To be sure, this needed line of research should include multiple measures assessing African American stu- dents' views of the major aspects of campus life, including student- faculty in-
teractions, residence life, and student involvement in campus organizations. In
addition, longitudinal measures of the campus racial climate must be incorpo- rated into this line of research. Perhaps once several valid and reliable control variables for African American students' perceptions of the campus racial envi- ronment are introduced into a statistical model, differences in cognitive out- comes (as measured by standardized tests) in college by race may be trivial or nonexistent.
IMPLICATIONS FOR FUTURE RESEARCH
The findings of this research investigation uncover some areas of additional research that would inform research and practice related to the effects of race on cognitive development in college. First, additional research may want to
qualitatively assess, among African American students, how their background traits and college experiences in and out of the classroom interact to influence
learning and academic growth in college. Second, since it may also be postu- lated that there are other important predictor variables associated with the insti- tutional environment that influence learning and cognitive development in col-
lege, additional research designed to identify these important characteristics of the institutional environment may also help to explain the findings presented in this report. Perhaps there are other characteristics (unspecified in the regression equations of the current study) of colleges and universities that may also help to explain and account for the learning disadvantages accruing to African Amer- ican students. Finally, since the data analysis in the present study only followed students up to the end of the third year of college (when most of the students were juniors in college), additional research is needed that also takes into ac-
COGNITIVE EFFECTS OF COLLEGE 47
count the senior year of college to determine the extent to which learning out- comes are influenced by race in the senior year of college.
LIMITATIONS OF THE STUDY
This study contains significant limitations the reader should be aware of when
interpreting the results. First, although the overall sample was multi-institutional and comprised a broad range of 4-year institutions located in 15 states, the
generalizability of the findings to all 4-year institutions is tenuous. Second, al-
though we attempted in the initial sample design and subsequent sample weight- ing procedure to make the sample as representative as possible at each institu-
tion, the time commitments required of each student participant undoubtedly led to some self-selection (Pascarella and Terenzini, 1991). The responses of the students who participated in the study might have differed from those who were invited to participate but declined. Although our weighting procedure provides at least some adjustment for bias in the samples that we analyzed, it cannot
adjust for nonresponse bias.
ACKNOWLEDGMENTS
This investigation was conducted as part of the National Study of Student
Learning (NSSL). NSSL was supported by Grant No. R117G10037 from the
US Department of Education to the National Center on Postsecondary Teaching,
Learning, and Assessment.
REFERENCES
American College Testing Program (1990). Report on the Pilot Year 1: 1988-89, Au- thor, Iowa City.
American College Testing Program (1991). CAAP Technical Handbook, Author, Iowa
City. Ancis, J. R., Sedlacek, W. E., and Mohr, J. J. (2000). Student perceptions ot campus
cultural climate by race. J. Couns. Dev. 78: 180-185. Astin, A. W. (1977). Four Critical Years, Jossey-Bass, San Francisco. Astin, A. W. (1993). What Matters in College: Four Critical Years Revisited, Jossey-
Bass, San Francisco. Bowen, H. R. (1977). Investments in Learning, Jossey-Bass, San Francisco. D Augelli, A. R., and Hershberger, S. L. (1993). Atncan Amencan undergraduates on a
48 FLOWERS AND PASCARELLA
predominantly White campus: Academic factors, social networks, and campus climate. J. Nesro Educ.62: 67-81.
Davis, J. E., and Jordan, W. J. (1994). The effects of school context, structure, and experiences on African American males in middle and high school. J. Negro Educ. 63: 570-587.
Fleming, J. (2000). Affirmative action and standardized test scores. J. Negro Educ.69: 27-37.
Rowers, L. A., Osterlind, S. J., Pascarella, E. T., and Pierson, C. T. (2001). How much do students learn in college?: Cross-sectional estimates using the College BASE. J. Higher Educ. 72: 565-583.
Flowers, L. A., and Pascarella, E. T. (1999). The effects of college racial composition on African American college students' orientations toward learning for self-under- standing. Prof. Educ. 22: 33-47.
Gardner, L. F. (1994). Redesigning Higher Education: Producing Dramatic Gains in Student Learning, Clearinghouse on Higher Education, The George Washington Uni- versity, Washington, DC.
Goodstein, R., and Ponterotto, J. G. (1997). Racial and ethnic identity: Their relationship and their contribution to self-esteem. J. Black Psychol. 23: 275-292.
Gossett, B. J., Cuyjet, M. J., and Cockriel, I. (1996). African Americans' and non- African Americans' sense of mattering and marginality at public, predominantly White institutions. Equity Excellence Educ. 29: 37-42.
Hagedorn, L. S., Pascarella, E. T., Edison, M. I., Braxton, J. M., Nora, A., and Terenzini, P. T. (1999). Does institutional context influence the development of critical thinking? A research note. Rev. Higher Educ. 22: 247-263.
Hays, W. L. (1994). Statistics (5th ed), Harcourt Brace College Publications, Fort Worth, TX.
Head, L. Q. (1989). The Effects of Race and Gender on the Academic Performance of First Time University Freshmen (ERIC Document Reproduction Service No. ED 314445).
Lewis, A. E., Chesler, M., and Forman, T. A. (2000). The impact of "colorblind" ideolo- gies on students of color: Intergroup relations at a predominantly White university. J. Negro Educ. 69: 74-91.
Mac Kay, K. A., and Kuh, G. D. (1994). A comparison of student effort and educational gains of Caucasian and African-American students at predominantly White colleges and universities. J. Coll. Stud. Dev. 35: 217-223.
McElroy-Johnson, B. (1993). Giving voice to the voiceless. Harvard Educ. Rev. 63: 85-104.
Myerson, J., Rank, M. R., Raines, F. Q., and Schnitzler, M. A. (1998). Race and general cognitive ability: The myth of diminishing returns to education. Psychol. Sci. 9: 139- 142.
Nettles, M. T., Thoeny, A. R., and Gosman, E. J. (1986). Comparative and predictive analyses of Black and White students' college achievement and experiences. J. Higher Educ. 57: 289-318.
Osterlind, S. J. (1997). A National Review of Scholastic Achievement in General Educa- tion: How Are We Doing and Why Should We Care? (Vol. 25), ASHE-ERIC Higher Education. The George Washington University, Graduate School of Education and Human Development, Washington, DC.
Pace, C. R. (1984). Measuring the Quality of College Student Experiences, University of California, Higher Education Research Institute, Graduate School of Education, Los Angeles.
COGNITIVE EFFECTS OF COLLEGE 49
Pascarella, E. T. (1985). College environmental influences on learning and cognitive development: A critical review and synthesis. In: Smart, J. C. (ed.), Higher Education: Handbook of Theory and Research, Agathon, New York, Vol. 1, pp. 1-61.
Pascarella, E. T. (1989). The development of critical thinking: Does college make a difference? J. Coll. Stud. Dev. 30: 19-26.
Pascarella, E. T., Bohr, L., Nora, A., and Terenzini, P. T. (1995). Cognitive effects of two-year and four-year colleges: New evidence. Educ. Eval. Policy Anal. 17: 83-96.
Pascarella, E. T., and Terenzini, P. T. (1991). How College Affects Students: bindings and Insights from Twenty Years of Research, Jossey-Bass, San Francisco.
Pedhazur, E. J. (1982). Multiple Regression in Behavioral Research: Explanation and Prediction, Holt, Rinehart, & Winston, New York.
Sampel, D. D., and Seymour, W. R. (1971). The academic success of Black students: A dilemma. J. Coll. Stud. Pers. 12: 243-247.
Springer, L., Terenzini, P. T., Pascarella, E. T., and Nora, A. (1995). Influences on college students' orientations toward learning for self-understanding. J. Coll. Stud. Dev. 36: 5-18.
Tan, D. L. (1995). Do students accomplish what they expect out of college? Coll. Stud. J. 29: 449-454.
Terenzini, P. T., Pascarella, E. T., and Blimling, G. S. (1996). Students' out-of-class experiences and their influence on learning and cognitive development: A literature review. J. Coll. Stud. Dev. 37: 149-162.
Terenzini, P. T., Springer, L., Pascarella, E. T., and Nora, A. (1995). Influences affecting the development of students' critical thinking skills. Res. Higher Educ. 36: 23-39.
Terenzini, P. T., and Wright, T. M. (1987). Influences on students' academic growth during four years of college. Res. Higher Educ. 26: 161-179.
Tracey, T. J., and Sedlacek, W. E. (1984). Noncognitive vanables in predicting academic success by race. Meas. Eval. Guid. 16: 171-178.
White, C. L. (1988). Ethnic identity and academic pertormance among Black and White college students: An interactionist approach. Urban Educ. 23: 219-240.
Wolfle, L. M. (1983). Effects of higher education on achievement for Blacks and Whites. Res. Higher Educ. 19: 3-9.
Received September 27, 2001.