Embed Size (px)
Citation preview

Considering Social Distance as an InfluenceFactor in the Process of Process Modeling
Michael Zimoch, Jens Kolb, and Manfred Reichert
Institute of Databases and Information Systems, Ulm University, Germany{michael.zimoch,jens.kolb,manfred.reichert}@uni-ulm.de
Abstract. Enterprise repositories comprise numerous business processmodels either created by in-house domain experts or external businessanalysts. To enable a widespread use of these process models, high modelquality (e.g., soundness) as well as a sufficient level of granularity arecrucial. Moreover, they shall reflect the actual business processes prop-erly. Existing modeling guidelines target at creating correct and soundprocess models, whereas there is only little work dealing with cognitiveissues influencing model creation by process designers. This paper ad-dresses this gap and presents a controlled experiment investigating theconstrual level theory in the context of process modeling. In particu-lar, we investigate the influence the social distance of a process designerto the modeled domain has on the creation of process models. For thispurpose, we adopt and apply a gamification approach, which enablesus to show significant differences between low and high social distancewith respect to the quality, granularity, and structure of the created pro-cess models. The results obtained give insights into how enterprises shallcompose teams for creating and evolving process models.
1 Introduction
Due to the increasing adoption of process-aware information systems (PAIS),contemporary enterprise repositories comprise large collections of process mod-els [1]. Usually, process models vary in respect to their quality and level ofgranularity. Further, they face a wide range of problems affecting model under-standability and error probability [2]. However, high quality of process models iscrucial for enterprises to guarantee proper process implementation and executionin a PAIS [3]. As a prerequisite, process models should reflect the actual busi-ness processes properly and at the right level of granularity [4]. To address thisissue, considerable work on criteria related to process model quality and com-prehensibility has been conducted [5, 6]. In addition, modeling guidelines existthat support process designers in creating process models of high quality [7, 8].
There is only little work evaluating the influence of cognitive aspects on theprocess of process modeling [9] as well as their effects on the resulting processmodels [10, 11]. If we do not understand these cognitive aspects, however, pro-cess modeling projects might not deliver proper artifacts or even fail. This paper

2 Michael Zimoch, Jens Kolb, and Manfred Reichert
investigates a fundamental factor presumably influencing the process of processmodeling, i.e., social distance [12]. The latter is a well-established notion in theConstrual Level Theory (CLT), constituting an important part of psychologicaldistance [13]. In this context, studies have shown that human thinking and actingare both strongly influenced by psychological distance [14]. According to CLT,we experience only the here and now, and form an abstract mental construal ofdistant objects or events [12, 14]. For example, when attending a music festival,one is able to undergo the whole festival atmosphere. In turn, watching the fes-tival on television, the focus is more on the line-up and, hence, the performancesof the bands, i.e., experience is more superordinate.
Sect. 2 introduces CLT. Gamification and the considered process scenarioare described in Sect. 3. Sect. 4 introduces the research question addressed anddefines the experiment setting. Sect. 5 deals with experiment preparation andits execution. Results are presented and analyzed in Sect. 6. Finally, Sect. 7discusses related work and Sect. 8 summarizes the paper.
2 Background on Construal Level Theory
Construal Level Theory (CLT) describes the effects psychological distance hason objects or events [12, 14]. Generally, CLT states that increasing psychologicaldistance affects our mental representation of these objects or events. In turn,this influence on human perception has a strong impact on our actions andthoughts [13]. The reason behind this phenomenon is the so-called level of con-strual (LOC), which describes how individuals interpret and perceive objectsand events. Increasing psychological distance affects the cognitive abilities andleads to a change in the perception of an object or event.
CLT describes two levels of thinking: low- and high-level construal. High-levelconstruals are abstract, decontextualized, coherent, and superordinate represen-tations compared to low-level construals. If an object or event is further away,we think about it in terms of high-level construals. However, the smaller thedistance to objects or events is, the more we think in low-level construals. More-over, these two levels of construals are influenced by psychological distance. Whileobjective distance describes the quantitative spatial distance in the real world,psychological distance describes our feelings, thoughts, and emotions in relationto an object or event. In turn, the latter is considered as psychologically distant,if it is not experienced physically. For this case, a mental representation mustbe constructed.
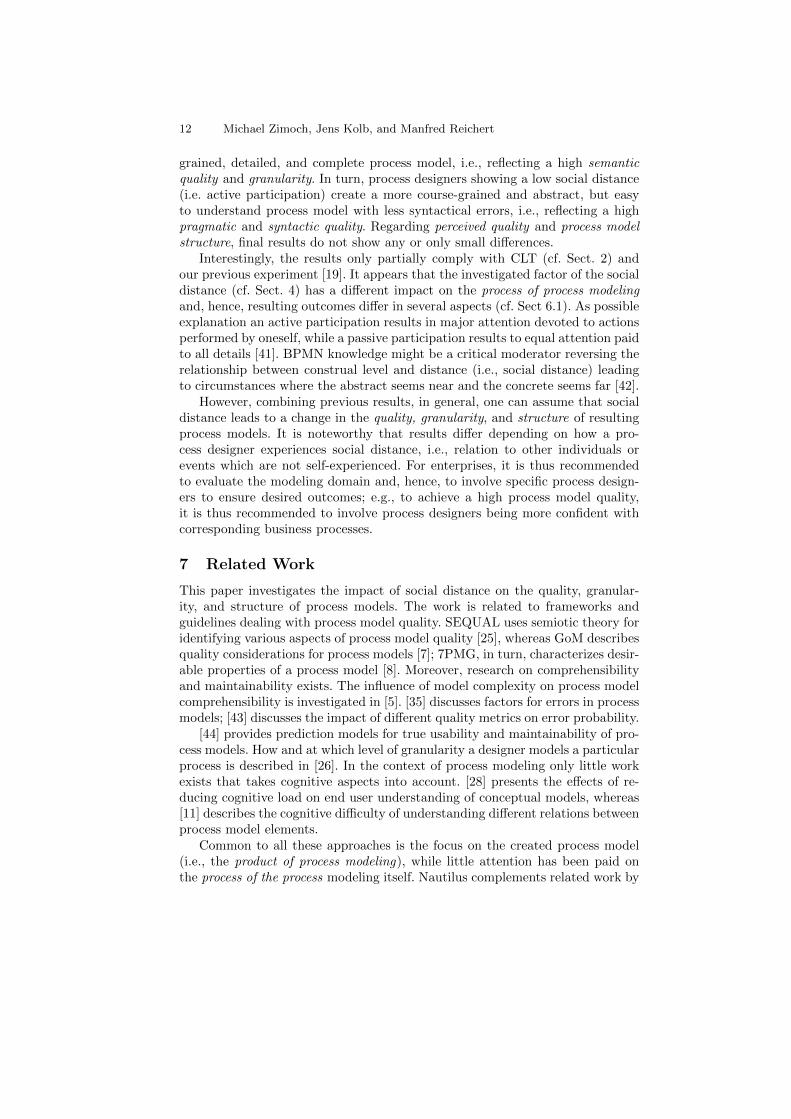
Psychological distance can be further subdivided into social, spatial, temporal,and hypothetical distance [13, 15–17]. Social distance, on which we focus in thispaper, describes our relation to other individuals or accrues for events not beingself-experienced (cf. Fig. 1); e.g., whether or not choosing a seat in a bus beingmore distant from a particular individual is directly reflected by the latter [18].
In previous research we already addressed the first characteristic, i.e., therelation to other individuals [19]. More precisely, results showed a significantinfluence of social distance on the quality and level of granularity of createdprocess models. In accordance with CLT, process models created by process de-

Social Distance in the Process of Process Modeling 3
signers with a low social distance revealed a higher quality as well as granularitycompared to process models created by process designers with a higher socialdistance. Furthermore, process designers were more self-confident about the pro-cess models they had create. Hence, the latter characteristic, i.e., event which isnot self-experienced, is evaluated in this paper.
Low DistanceHigh Distance
abstract, imprecise
specific, precise Person
Fig. 1. Construal Level Theory - Social Distance
3 Gamification, Virtual World, and 3D Scenario
In order to simulate variability with respect to social distance, a gamificationapproach is applied, i.e., the benefits of gamification in a virtual world are usedin the context of process modeling. First, this allows for an adequate reflectionof the real world problem. Second, the motivation of subjects (i.e., participantsof an experiment) may increase. Third, an occurrence of the effects of socialdistance may be ensured.
Gamification is the technique of using game elements, designs, and thinkingsin a non-game context to engage and motivate employees [20]; e.g., achievementsknown from computer games are interpreted in enterprise software. As a con-sequence, work becomes more enjoyable, thus resulting in higher efficiency [21].Moreover, a virtual world constitutes a computer-simulated environment, usingthe metaphor of the real world, but without its physical limitations [22]. In avirtual world, individuals act as textual, 2D, or 3D avatars, i.e., as a controllableproxy in the virtual world. Thus, they experience a degree of telepresence, i.e.,an experience of presence in a remote location [23].
In the context of our experiment, relative to a real-world process from amanufacturer of gardening tools, a process scenario related to the processing ofan order in a warehouse is contrived, which may be either experienced activelyor passively (cf. Sect. 4). The entire process takes place in a full 3D virtualenvironment taking elements of gamification into account; e.g., exploring (i.e.,learning more about the virtual construct) and puzzle elements (i.e., motivatingsubjects to solve a problem). The 3D warehouse scenario is implemented withUnity, a game development platform. In the realized scenario, subjects interactwith a 3D avatar using point and click game mechanics.
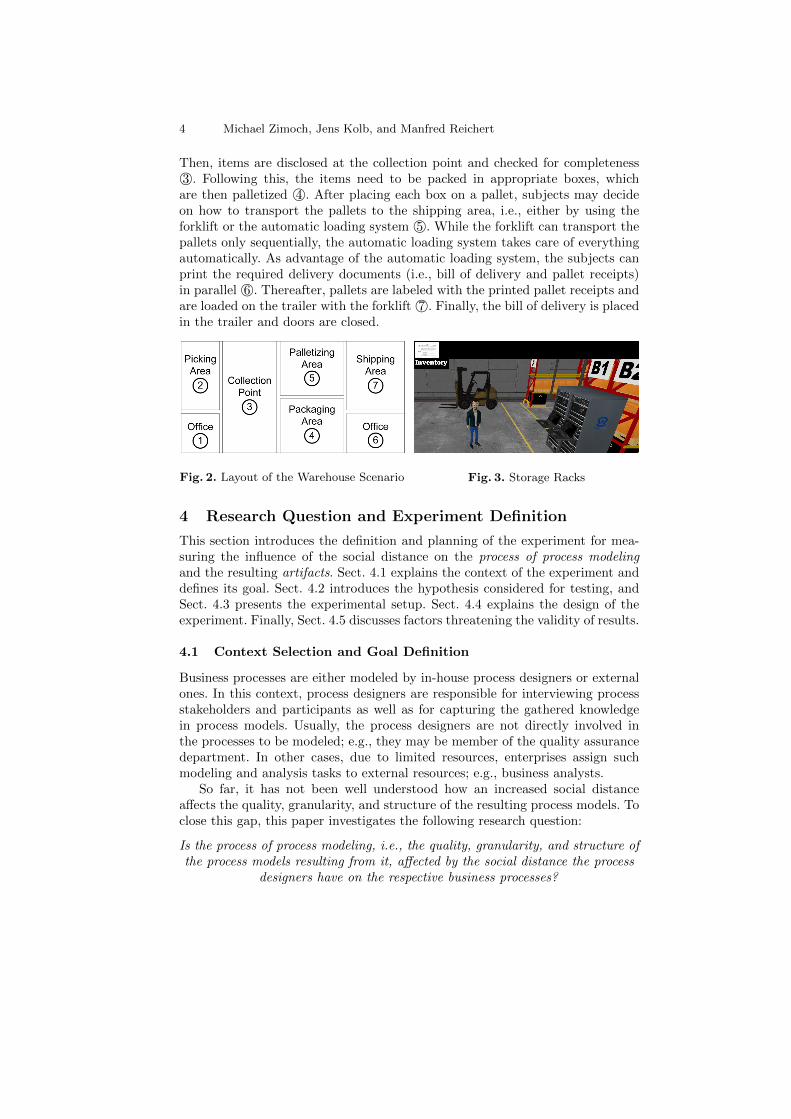
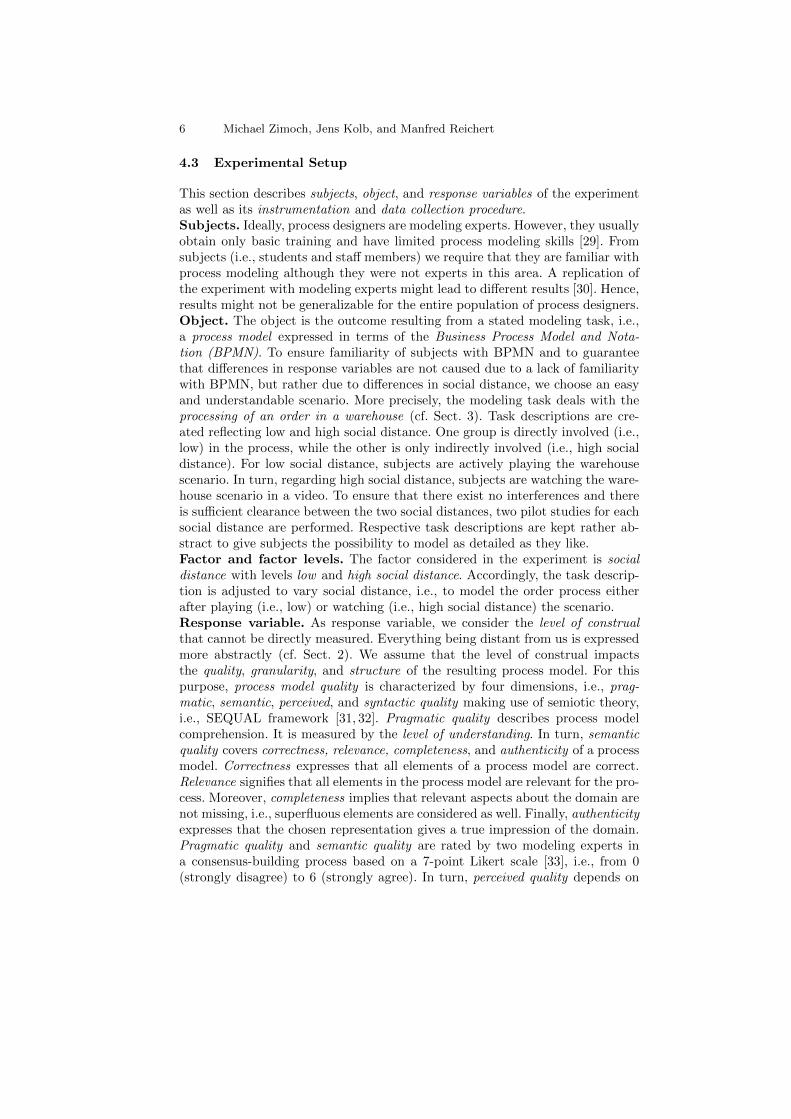
Following this, a description of the processing of an order in the warehouse isprovided. Fig. 2 shows the layout as well as the chronological progress throughthe warehouse. The scenario starts in the office of the warehouse 1©. First, anorder is taken providing information on the items to be processed. Generally,several items need to be processed by subjects in this context. At the storageracks (cf. Fig. 3), subjects have the choice to get the items either with theforklift or the picking system 2©. Since the forklift can carry only one pallet ata time, the items must be collected sequentially. The picking system comprisesseveral grapplers that allow collecting all items either separately or at once.
4 Michael Zimoch, Jens Kolb, and Manfred Reichert
Then, items are disclosed at the collection point and checked for completeness3©. Following this, the items need to be packed in appropriate boxes, whichare then palletized 4©. After placing each box on a pallet, subjects may decideon how to transport the pallets to the shipping area, i.e., either by using theforklift or the automatic loading system 5©. While the forklift can transport thepallets only sequentially, the automatic loading system takes care of everythingautomatically. As advantage of the automatic loading system, the subjects canprint the required delivery documents (i.e., bill of delivery and pallet receipts)in parallel 6©. Thereafter, pallets are labeled with the printed pallet receipts andare loaded on the trailer with the forklift 7©. Finally, the bill of delivery is placedin the trailer and doors are closed.
Fig. 2. Layout of the Warehouse Scenario Fig. 3. Storage Racks
4 Research Question and Experiment Definition
This section introduces the definition and planning of the experiment for mea-suring the influence of the social distance on the process of process modelingand the resulting artifacts. Sect. 4.1 explains the context of the experiment anddefines its goal. Sect. 4.2 introduces the hypothesis considered for testing, andSect. 4.3 presents the experimental setup. Sect. 4.4 explains the design of theexperiment. Finally, Sect. 4.5 discusses factors threatening the validity of results.
4.1 Context Selection and Goal Definition
Business processes are either modeled by in-house process designers or externalones. In this context, process designers are responsible for interviewing processstakeholders and participants as well as for capturing the gathered knowledgein process models. Usually, the process designers are not directly involved inthe processes to be modeled; e.g., they may be member of the quality assurancedepartment. In other cases, due to limited resources, enterprises assign suchmodeling and analysis tasks to external resources; e.g., business analysts.
So far, it has not been well understood how an increased social distanceaffects the quality, granularity, and structure of the resulting process models. Toclose this gap, this paper investigates the following research question:
Is the process of process modeling, i.e., the quality, granularity, and structure ofthe process models resulting from it, affected by the social distance the process
designers have on the respective business processes?

Social Distance in the Process of Process Modeling 5
Despite existing work on the quality [2, 8, 24, 25], granularity [26], and struc-ture [27] of process models there is only little research addressing cognitive as-pects of process modeling [10, 11, 28]. In particular, it is not well understoodwhether certain cognitive aspects lead to minor process quality, i.e., deficienciesregarding the pragmatic, semantic, perceived, and syntactic model quality.
Based on previous research (cf. [19]), this paper continues investigating theinfluence social distance has on the process of process modeling and its outcomes.As opposed to the previous experiment, where social distance was experienced bythe relation to other individuals, the presented experiment varies social distancewith a scenario (i.e., processing of an order in a warehouse) that may eitherbe experienced actively (i.e., low) or passively (i.e., high social distance) usinggamification. The goal can be formulated as:
Analyze process modelsfor the purpose of evaluatingwith respect to their level of construalfrom the point of view of the researchersin the context of students and research staff.
4.2 Hypothesis Formulation
Based on the goal definition and taking CLT into account, six hypotheses arederived. In detail, they investigate whether social distance influences the level ofconstrual during the process of process modeling or, more precisely, the quality,granularity, and structure of the resulting process models:
Does the social distance influence the pragmatic quality when creating process models?
H0,1: There are no significant differences in the pragmatic quality when modeling processes withlow social distance compared to high social distance.H1,1: There are significant differences in the pragmatic quality when modeling processes with lowsocial distance compared to high social distance.
Does the social distance influence the semantic quality when creating process models?
H0,2: There are no significant differences in the semantic quality when modeling processes with lowsocial distance compared to high social distance.H1,2: There are significant differences in the semantic quality when modeling processes with lowsocial distance compared to high social distance.
Does the social distance influence the perceived quality when creating process models?
H0,3: There are no significant differences in the perceived quality when modeling processes with lowsocial distance compared to high social distance.H1,3: There are significant differences in the perceived quality when modeling processes with lowsocial distance compared to high social distance.
Does the social distance influence the syntactic quality when creating process models?
H0,4: There are no significant differences in the syntactic quality when modeling processes with lowsocial distance compared to high social distance.H1,4: There are significant differences in the syntactic quality when modeling processes with lowsocial distance compared to high social distance.
Does the social distance influence the level of granularity when creating process models?
H0,5: There are no significant differences in the level of granularity when modeling processes withlow social distance compared to high social distance.H1,5: There are significant differences in the level of granularity when modeling processes with lowsocial distance compared to high social distance.
Does the social distance influence the process model structure when creating process models?
H0,6: There are no significant differences in the process model structure when modeling processeswith low social distance compared to high social distance.H1,6: There are significant differences in the process model structure when modeling processes withlow social distance compared to high social distance.
6 Michael Zimoch, Jens Kolb, and Manfred Reichert
4.3 Experimental Setup
This section describes subjects, object, and response variables of the experimentas well as its instrumentation and data collection procedure.Subjects. Ideally, process designers are modeling experts. However, they usuallyobtain only basic training and have limited process modeling skills [29]. Fromsubjects (i.e., students and staff members) we require that they are familiar withprocess modeling although they were not experts in this area. A replication ofthe experiment with modeling experts might lead to different results [30]. Hence,results might not be generalizable for the entire population of process designers.Object. The object is the outcome resulting from a stated modeling task, i.e.,a process model expressed in terms of the Business Process Model and Nota-tion (BPMN). To ensure familiarity of subjects with BPMN and to guaranteethat differences in response variables are not caused due to a lack of familiaritywith BPMN, but rather due to differences in social distance, we choose an easyand understandable scenario. More precisely, the modeling task deals with theprocessing of an order in a warehouse (cf. Sect. 3). Task descriptions are cre-ated reflecting low and high social distance. One group is directly involved (i.e.,low) in the process, while the other is only indirectly involved (i.e., high socialdistance). For low social distance, subjects are actively playing the warehousescenario. In turn, regarding high social distance, subjects are watching the ware-house scenario in a video. To ensure that there exist no interferences and thereis sufficient clearance between the two social distances, two pilot studies for eachsocial distance are performed. Respective task descriptions are kept rather ab-stract to give subjects the possibility to model as detailed as they like.Factor and factor levels. The factor considered in the experiment is socialdistance with levels low and high social distance. Accordingly, the task descrip-tion is adjusted to vary social distance, i.e., to model the order process eitherafter playing (i.e., low) or watching (i.e., high social distance) the scenario.Response variable. As response variable, we consider the level of construalthat cannot be directly measured. Everything being distant from us is expressedmore abstractly (cf. Sect. 2). We assume that the level of construal impactsthe quality, granularity, and structure of the resulting process model. For thispurpose, process model quality is characterized by four dimensions, i.e., prag-matic, semantic, perceived, and syntactic quality making use of semiotic theory,i.e., SEQUAL framework [31, 32]. Pragmatic quality describes process modelcomprehension. It is measured by the level of understanding. In turn, semanticquality covers correctness, relevance, completeness, and authenticity of a processmodel. Correctness expresses that all elements of a process model are correct.Relevance signifies that all elements in the process model are relevant for the pro-cess. Moreover, completeness implies that relevant aspects about the domain arenot missing, i.e., superfluous elements are considered as well. Finally, authenticityexpresses that the chosen representation gives a true impression of the domain.Pragmatic quality and semantic quality are rated by two modeling experts ina consensus-building process based on a 7-point Likert scale [33], i.e., from 0(strongly disagree) to 6 (strongly agree). In turn, perceived quality depends on

Social Distance in the Process of Process Modeling 7
the degree to which a subject agrees with the resulting process model. It can besubdivided into agreement, missing aspects, accurate description, mistakes, andsatisfaction [34]. Perceived quality is rated by each subject on a 5-point Likertscale, ranging from 0 (strongly disagree) to 4 (strongly agree), after finishing themodeling task. Agreement expresses to which degree the process model matcheswith the actual business process. Missing aspects rates whether significant as-pects are missing in the resulting process model. In turn, accurate descriptionexpresses how accurately the process model matches the real world process.Mistakes corresponds to the subject rate indicating whether there are seriousmistakes in the resulting process model. Finally, satisfaction expresses the de-gree subjects are satisfied with the process models created by them. Syntacticquality of a process model is measured by counting syntactical rule violationsof the applied modeling language, i.e., BPMN. Process granularity is measuredthrough the complexity of the resulting process models, i.e., simple metrics likenumber of activities, gateways, nodes, edges, elements, and execution paths. Pro-cess model structure is analyzed with the following process metrics: separability,sequentiality, cyclicity, and diameter [3, 35]. Separability is defined as the ratioof the number of cut-vertices to the total number of nodes in the process model.Sequentiality, in turn, is the degree to which the process model is constructed ofpure sequences of tasks. Moreover, cyclicity relates to the number of nodes oncycles to all nodes in the process model. Diameter gives the length of the longestpath from a start node to an end node in the process model. Fig. 4 summarizesthe response variables we consider in a research model.
4.4 Experimental Design
We apply guidelines for designing experiments as described in [36], and conducta randomized, balanced, and blocked single factor experiment. The experimentis randomized since subjects are assigned to groups randomly and it is ensuredthat both groups have same size (i.e., balanced). Moreover, subjects are grouped(i.e., blocked) to not mix social distance. Finally, only a single factor varies, i.e.,the level of construal. Fig. 5 illustrates this setup.Instrumentation and data collection procedure. To precisely measure re-sponse variables in a non-intrusive manner, we use the Cheetah ExperimentalPlatform (CEP) [9]. CEP provides a BPMN modeling environment that recordsmodeling steps and their attributes; e.g., timestamps and type of modeling ac-tion. Resulting process models are then stored. Finally, demographic data andqualitative feedback is gathered from subjects based on questionnaires.
4.5 Risk Analysis
Generally, any experiment bears risks that might affect its results. Thus, its va-lidity or, more precisely, its levels of validity need to be checked, i.e., internalvalidity (“Are effects caused by independent response variables?”) and externalvalidity (“May results be generalized?”).
Risks to internal validity. Risks that might influence the modeling outcome

8 Michael Zimoch, Jens Kolb, and Manfred Reichert
include process modeling experience of involved subjects and uneven distribu-tions of subjects over two groups. Furthermore, post data validation ensures thatin both groups subjects are at least moderately familiar with process modeling(cf. Sect. 5.3). It is assured that both groups show the same or similar familiar-ity level, i.e., median is 3 for both groups on a 5-point Likert scale. Further, thechosen modeling task constitutes a risk to internal validity. To ensure familiarityof subjects and to guarantee that differences in quality, granularity, and struc-ture are due to social distance, we choose an easy and comprehensible scenario(cf. Sect. 3). To further ensure that subjects are not negatively influenced bytiredness, boredom, or hunger, the experiment is conducted at a time of the dayfor which the mentioned frame of mind can be excluded.Risks to external validity. On one hand, the subjects have academic back-ground (i.e., students and research staff), which might limit generalizability ofresults. On the other, they rather have profound knowledge in process modeling(cf. Sect. 5.3). We may consider them as proxies for professionals who have ob-tained basic training so far. Further, process model quality may depend on theappropriateness of the chosen modeling languages and tools. To mitigate thisrisk, both groups use an intuitive process modeling tool as well as an establishedmodeling language (cf. Sect. 4.3). Finally, a potential risk for external validityis that we measure social distance with one modeling task. To mitigate this andto allow for generalizability, varying experiments need to be conducted.
Psychological Distance
F: Syntactic Quality
O: Number of Syntactical Errors
Quality
Legend:
F: Theoretical Factor
O: Factor Operationalization
F: Semantic Quality
O: Correctness
Relevance
Completeness
Authenticity
F: Perceived Quality
O: Agreement
Missing Aspects
Accurate Description
Mistakes
Satisfaction
Granularity
F: Granularity
O: Number of Activities
Number of Gateways
Number of Nodes
Number of Edges
Number of Elements
Number of Exec. Paths
F: Social Distance
O: Level of Social
Distance
F: Pragmatic Quality
O: Level of Understanding
Structure
F: Structure
O: Separability
Sequentiality
Cyclicity
Diameter
Fig. 4. Research Model
Low Social
Distance
(Playing)
Process Model
n S
ub
jects
High Social
Distance
(Watching)
Process Model
Subject n/2+1
Task
... ...Subject nSubject 1
Subject n/2
Subject
Group 1
Subject
Group 2
Facto
rO
bje
ct
Fig. 5. Experiment Design
5 Experiment OperationBased on the provided experiment definition, Sect. 5.1 summarizes the experi-ment preparation. Sect. 5.2 describes the execution of the experiment, and Sect.5.3 deals with the validation of the data collected during the experiment.
5.1 Experiment Preparation
Students and research staff familiar with process modeling are invited to join theexperiment. Subjects are not informed about the aspects we want to investigate.

Social Distance in the Process of Process Modeling 9
However, they are aware that the experiment takes place in the context of athesis. For all subjects, anonymity is guaranteed. Before conducting the experi-ment, for each level of social distance two pilot studies are performed to eliminateambiguities and misunderstandings as well as to improve modeling tasks. Fur-ther, it is checked whether the social distance between the tasks is sufficientlylarge. Finally, an evaluation sheet is created to assess the level of construal byanalyzing quality, granularity, and structure of resulting process models.
5.2 Experiment Execution
The experiment is executed in a computer lab at Ulm University. All in all,95 students and staff members participate. Due to spatial constraints, up to 10subjects conduct the experiment at the same time and several sessions within aperiod of two weeks are offered. Each session lasts about 60 minutes and runs asfollows: The procedure of the experiment is explained and worksheets with taskdescriptions are handed out. Thereby, subjects are randomly assigned to one ofthe subject groups (cf. Sect. 4.4). Then, subjects start playing or watching thewarehouse scenario. Subsequently, they fill out an initial questionnaire capturingtheir modeling experience. This information is used to test whether subjects arefamiliar with process modeling. Then, subjects are asked to model the warehousescenario based on their own experience and in a way they think it is appropriate.Finally, subjects provide their rating for perceived quality and may give feedback.
5.3 Data Validation
In total, data is collected from 95 subjects. One of them is excluded due toinvalidity of the process model obtained, i.e., the process model differs substan-tially from the postulated task description. Hence, 94 subjects are considered fordata analysis, i.e., 84 students and 10 staff members (with 33 female subjects).Further, the median concerning familiarity with BPMN is 3, i.e., above aver-age. Regarding confidence with understanding BPMN process models, a medianvalue of 3 is obtained. Perceived competence in creating BPMN models has amedian value of 3. All values are based on a 5-point Likert scale. Prior to the ex-periment, subjects analyzed 19 process models and created 7 in average.1 Sinceall values range above average and subjects are familiar with process modeling,we conclude that subjects fit to the targeted profile.
5.4 Threats to Validation
Apparently, the experiment conducted faces the limitation that we did not in-volve and compare professional process modelers and IT experts from industry,but prospective ones (i.e. students). Although various investigations have shownthat students are proper substitutes for professionals in empirical studies (e.g.[37, 38]) the results for professionals may differ.
1 The full data set can be found in http://bit.ly/1VB2aS3

10 Michael Zimoch, Jens Kolb, and Manfred Reichert
6 Data Analysis & Interpretation
Sect. 6.1 presents descriptive statistics of the data gathered during the experi-ment. Sect. 6.2 discusses whether a data set reduction is needed. Sect. 6.3 teststhe hypotheses. Finally, Sect. 6.4 discusses results.
6.1 Data Analysis and Descriptive Statistics
Figure 6 displays box plots (i.e., median, min, and max values as well as 1st and3rd quartiles) of measurements for the pragmatic, semantic, perceived, and syn-tactic quality. Further, the items of semantic and perceived quality are combinedinto an aggregated variable [39], i.e., validity & completeness and agreement ofsubjects. As a prerequisite, all response variables must show high reliability. Forthis purpose, Cronbach’s α is calculated.2 For semantic quality, a Cronbach withα = 0.84 and for perceived quality a Cronbach with α = 0.77 results.
Low LowHigh HighLow HighLowHigh0
2
1
3
4
Semantic Perceived SyntacticPragmatic
5
68 8
0
1
2
3
4
Fig. 6. Measurements for Quality
Low HighLow High LowHigh0
0.50
0.25
0.75
1
Separable Cyclic Diameter
High
Sequential
Low0
15
30
45
60
Fig. 7. Measurements for Structure
As shown in Figure 6, process models created by subjects with low social dis-tance present a better level of understanding and contain less syntactical errors.Regarding high social distance, in turn, process models seem to give a betteraccount of the domain. Moreover, perceived quality does not differ between thesubject groups. Further, Figure 7 presents calculated values for the process modelstructure. There are only minimal differences in process model structure betweenthe process models. However, the diameter shows a clear difference dependingon the level of social distance. Process models whose subjects show a high socialdistance contain notable longer paths (median of 23 for low, 30.5 for high).
Figure 8 shows results related to the granularity of process models, i.e., num-ber of activities, gateways, nodes, edges, total process elements, and possible ex-ecution paths. As a result, process model granularity is higher if subjects havea high social distance. Especially, differences in the numbers of total processelements are large. Note that low social distance results have a median of 60,whereas high social distance leads to a median of 82 process elements.
6.2 Data Set Reduction
In general, the results of statistical analyses depend on the quality of the in-put data, i.e., faulty data might lead to incorrect conclusions. Therefore, it is
2 According to [39], α > 0.6 acceptable reliability; 0.7 < α < 0.9 good reliability

Social Distance in the Process of Process Modeling 11
LowLow Low HighLow High LowHigh0
40
20
60
80
#Gateways #Nodes #Edges #Elements
High
#Activities
100
120
High
#Paths
Low High
177
Fig. 8. Measurements for Granularity
important to identify outliers and to evaluate whether these shall be excluded.Note that the latter might be critical due to potential loss of information. Inthe experiment, several outliers can be identified, but we decide to not removethem since we consider them as correct, not being the result of wrong modeling.Hence, removing them would bias results.
6.3 Hypothesis Testing
Response Variable p-value
Pragmatic Quality H1,1
Level of Understanding < 0.01 (< 0.05)
Semantic Quality H1,2
Validity & Completeness < 0.01 (< 0.05)
Perceived Quality H1,3
Agreement of Subjects 0.410 (> 0.05)
Syntactic Quality H1,4
Number of Syn. Errors 0.046 (< 0.05)
Level of Granularity H1,5
Number of Activities < 0.01 (< 0.05)
Number of Gateways 0.039 (< 0.05)
Number of Nodes < 0.01 (< 0.05)
Number of Edges < 0.01 (< 0.05)
Number of Elements < 0.01 (< 0.05)
Number of Paths 0.148 (> 0.05)
Process Model Structure H1,6
Sequentiality 0.326 (> 0.05)
Separability 0.092 (> 0.05)
Cyclicity 0.258 (> 0.05)
Diameter < 0.01 (< 0.05)
Table 1. Results of Hypotheses Testing
Sect. 6.1 indicates differences regard-ing low and high social distance. In thefollowing, we test whether observeddifferences are statistically significant.We test the response variables with theMann-Whitney-U-test [40]. A success-ful u-test (with p < p0 at risk levelα = 0, 05) will reject a null hypoth-esis. Table 1 shows the results of hy-pothesis testing (cf. Sect. 4.2). In sum-mary, hypotheses H1,1, H1,2, and H1,4
can be accepted. Despite the numberof significant results, like H1,6, H1,5
is only partially supported, and thusboth hypotheses cannot be accepted.In addition, H1,3 shows no significanceand, hence, must be rejected. Based onthe results, we may conclude that so-cial distance (i.e., event which is notself-experienced) leads to a change inthe quality, granularity, and structureof resulting process models.
6.4 Discussion
The results indicate that process designers showing a high social distance (i.e.passive participation) to a particular business process tend to create a more fine-
12 Michael Zimoch, Jens Kolb, and Manfred Reichert
grained, detailed, and complete process model, i.e., reflecting a high semanticquality and granularity. In turn, process designers showing a low social distance(i.e. active participation) create a more course-grained and abstract, but easyto understand process model with less syntactical errors, i.e., reflecting a highpragmatic and syntactic quality. Regarding perceived quality and process modelstructure, final results do not show any or only small differences.
Interestingly, the results only partially comply with CLT (cf. Sect. 2) andour previous experiment [19]. It appears that the investigated factor of the socialdistance (cf. Sect. 4) has a different impact on the process of process modelingand, hence, resulting outcomes differ in several aspects (cf. Sect 6.1). As possibleexplanation an active participation results in major attention devoted to actionsperformed by oneself, while a passive participation results to equal attention paidto all details [41]. BPMN knowledge might be a critical moderator reversing therelationship between construal level and distance (i.e., social distance) leadingto circumstances where the abstract seems near and the concrete seems far [42].
However, combining previous results, in general, one can assume that socialdistance leads to a change in the quality, granularity, and structure of resultingprocess models. It is noteworthy that results differ depending on how a pro-cess designer experiences social distance, i.e., relation to other individuals orevents which are not self-experienced. For enterprises, it is thus recommendedto evaluate the modeling domain and, hence, to involve specific process design-ers to ensure desired outcomes; e.g., to achieve a high process model quality,it is thus recommended to involve process designers being more confident withcorresponding business processes.
7 Related Work
This paper investigates the impact of social distance on the quality, granular-ity, and structure of process models. The work is related to frameworks andguidelines dealing with process model quality. SEQUAL uses semiotic theory foridentifying various aspects of process model quality [25], whereas GoM describesquality considerations for process models [7]; 7PMG, in turn, characterizes desir-able properties of a process model [8]. Moreover, research on comprehensibilityand maintainability exists. The influence of model complexity on process modelcomprehensibility is investigated in [5]. [35] discusses factors for errors in processmodels; [43] discusses the impact of different quality metrics on error probability.
[44] provides prediction models for true usability and maintainability of pro-cess models. How and at which level of granularity a designer models a particularprocess is described in [26]. In the context of process modeling only little workexists that takes cognitive aspects into account. [28] presents the effects of re-ducing cognitive load on end user understanding of conceptual models, whereas[11] describes the cognitive difficulty of understanding different relations betweenprocess model elements.
Common to all these approaches is the focus on the created process model(i.e., the product of process modeling), while little attention has been paid onthe process of the process modeling itself. Nautilus complements related work by

Social Distance in the Process of Process Modeling 13
investigating the process of process modeling for tracing model quality back tomodeling strategies resulting in process models of different quality [45].
The effectiveness of gamification based on a quality service model analyzingthe social and psychological motivations of participants is discussed in [46]. Agileand efficient responds to changing requirements and consequential amendmentsto corresponding business processes are provided in [47], based on a gamificationand BPM approach incorporated into a social network. Finally, [48] providespreliminary evidence that blending process management to gamification conceptsmay be beneficial.
Considerable work involving conceptual modeling of processes in a 3D virtualworld can be found in [49]. In addition, [50] provides an approach for collabo-rative process modeling using a 3D environment. A similar use case in a 3Dscenario to visualize storyboards for business process models is proposed in [51].
8 Conclusion
This paper investigated whether social distance affects the process of processmodeling and its outcomes, i.e., the quality, granularity, and resulting processmodel structure. In particular, an experiment using gamification in a virtualworld was conducted showing that there are significant differences dependingon whether a process designer has a low or high social distance to the modeleddomain. While first results look promising, further investigations are desirable.More precisely, their generalization needs to be confirmed by additional empiricalexperiments to obtain more accurate results allowing for such a generalization.
As a next step, we will focus on psychological distance (i.e., social, spatial,temporal, hypothetical) as well as the use of gamification and virtual worldsto learn more about the particular effects on the process of process modeling.Combining experiment results enables us to extract guidelines on how modelingteams in enterprises should be composed and optimal process models can beobtained. Finally, experiments with practitioners are planned to validate resultsin real-world scenarios.
References
1. Weber, B., Reichert, M., Mendling, J., Reijers, H.A.: Refactoring Large ProcessModel Repositories. In: Computers in Industry. (2011) 467–486
2. Mendling, J.: Metrics for Process Models: Empirical Foundations of Verifiation,Error Prediction, and Guidelines for Correctness. Springer (2008)
3. Reijers, H.A, Mendling, J: A Study into the Factors that Influence the Under-standability of Business Process Models. In: Systems, Man and Cybernetics, PartA: Systems and Humans. (2011) 1–14
4. Moody, D.L.: Theoretical and Practical Issues in Evaluating the Quality of Con-ceptual Models: Current State and Future Directions. In: Data & KnowledgeEngineering. (2005) 243–276
5. Mendling, J., Reijers, H.A., Cardoso, J.: What Makes Process Models Understand-able? In: Proc 5th Int’l Conf on Business Process Mgmt. (2007) 48–63
6. Mendling, J., Strembeck, M.: Influence Factors of Understanding Business ProcessModels. In: Proc 11th Int’l Conf on Business Informations Systems. (2008) 142–153
14 Michael Zimoch, Jens Kolb, and Manfred Reichert
7. Becker, J., Rosemann, M., Uthmann, C.V.: Guidelines of Business Process Mod-eling. In: BPM, Models, Techniques, and Empirical Studies. (2000) 30–49
8. Mendling, J., Reijers, H.A., van der Aalst, W.M.: Seven Process Modeling Guide-lines (7PMG). In: Inf & Software Techn. (2010) 127–136
9. BPM Research Cluster: Cheetah Experimental Platform (2016) http://bpm.q-e.at/?page id=56.
10. Figl, K., Weber, B.: Individual Creativity in Designing Business Processes. In:Advanced Information Systems Engineering Workshops. (2012) 294–306
11. Figl, K., Laue, R.: Cognitive Complexity in Business Process Modeling. In: Ad-vanced Information Systems Engineering. (2011) 452–466
12. Trope, Y., Liberman, N., Wakslak, C.: Construal Levels and Psychological Dis-tance: Effects on Representation, Prediction, Evaluation, and Behavior. In: Journalof Consumer Psychology. Volume 17. (2007) 83–95
13. Todorov, A., Goren, A., Trope, Y.: Probability as a Psychological Distance: Con-strual and Preferences. In: J of Exp Social Psychology. Volume 43. (2007) 473–482
14. Trope, Y., Liberman, N.: Construal-level Theory of Psychological Distance. In:Psychological Review. Volume 117. (2010) 440–463
15. Day, S., Bartels, D.: Representation over Time: The Effects of Temporal Distanceon Similarity. In: Cognition. Volume 106. (2008) 1504–1513
16. Liberman, N., Sagristano, M.D., Trope, Y.: The Effect of Temporal Distance onLevel of Mental Construal. In: J of Exp Social Psych. Volume 38. (2002) 523–534
17. Fujita, K., Henderson, M.D., Eng, J., Trope, Y., Liberman, N.: Spatial Distanceand Mental Construal of Social Events. In: Psych Sci. Volume 17. (2006) 278–82
18. Pronin, E., Olivola, C.Y., Kennedy, K.A.: Doing Unto Future Selves As You WouldDo Unto Others: Psychological Distance and Decision Making. In: Personality &Social Psychology Bulletin. Volume 34. (2008) 224–36
19. Kolb, J., Zimoch, M., Weber, B., Reichert, M.: How Social Distance of ProcessDesigners Affects the Process of Process Modeling: Insights from a ControlledExperiment. In: Proc SAC’14. (2014) 1364–1370
20. Deterding, S., Dixon, D., Khaled, R., Nacke, L.: From Game Design Elements toGamefulness: Defining ”Gamification”. In: MindTrek’15. (2011) 9–15
21. Zichermann, G., Cunningham, C.: Gamification by Design: Implementing GameMechanics in Web and Mobile Apps. O’Reilly (2011)
22. Bartle, R, A.: Designing Virtual Worlds. New Riders (2004)23. Davis, A., Khazanchi, D., Murphy, J., Zigurs, I., Owens, D.: Avatars, People, and
Virtual Worlds: Foundations for Research in Metaverses. In: J of the Associationfor Information Sys. Volume 10. (2009) 90–117
24. Moody, D.L.: The ”Physics” of Notations: Toward a Scientific Basis for Construct-ing Visual Notations in Software Engineering. In: Soft Eng. (2008) 756–779
25. Krogstie, J.: Model-Based Development and Evolution of Information Systems.Springer (2012)
26. Holschke, O., Rake, J., Levina, O.: Granularity as a Cognitive Factor in the Effec-tiveness of Business Process Model Reuse. In: LNCS. (2009) 245–260
27. Polyvyanyy, A., Smirnov, S., Weske, M.: On Application of Structural Decompo-sition for Process Model Abstraction. In: Proc BPSC’09. (2009) 110–122
28. Moody, D.L.: Cognitive Load Effects on End User Understanding of ConceptualModels: An Experimental Analysis. In: Advances in Databases and InformationSystems. (2004) 129–143
29. Wolf, C., Harmon, P.: The State of Business Process Management 2012. In:BPTrends Report. (2012)

Social Distance in the Process of Process Modeling 15
30. Petre, M.: Why Looking Isn’t Always Seeing: Readership Skills and GraphicalProgramming. In: Commun ACM. Volume 38. (1995) 33–44
31. Lindland, O.I., Sindre, G., Solvberg, A.: Understanding Quality in ConceptualModeling. In: IEEE Software. (1994) 42–49
32. Krogstie, J., Sindre, G., Jørgensen, H.: Process Models Representing Knowledgefor Action: A Revised Quality Framework. In: J Inf Syst. Volume 15. (2006) 91–102
33. Recker, J., Safrudin, N., Rosemann, M.: How Novices Model Business Processes.In: Proc 9th Int’l Conf on Business Process Management. (2010) 29–44
34. Rittgen, P.: Quality and Perceived Usefulness of Process Models. In: Proc 24thSymp on Applied Computing (SAC’10). (2010) 65–72
35. Mendling, J., Neumann, G.: Error Metrics for Business Process Models. In: ProcCAISE’07. (2007) 53–56
36. Wohlin, C., Runeson, P., Host, M., Ohlsson, M.C., Regnell, B., Wesslen, A.: Ex-perimentation in Software Engineering - An Introduction. Kluwer (2000)
37. Host, M., Regnell, B., Wohlin, C.: Using students as subjects a comparative studyof students and professionals in lead-time impact assessment. Empirical SoftwareEngineering 5 (2000) 201–214
38. Svahnberg, M., Aurum, A., Wohlin, C.: Using students as subjects - an empiricalevaluation. In: ESEM’08, ACM (2008) 288–290
39. Kline, P.: Handbook of Psychological Testing. Volume 2. Routledge (1999)40. Sirkin, M.: Statistics for the Social Sciences. Volume 3. Sage (2005)41. Tversky, A., Kahnemann, D.: Availability: A Heuristic for Judging Frequency and
Probability. In: Cognitive Psychology. Volume 5. (1973) 207–23242. Kyung, E.J., Menon, G., Trope, Y.: Construal Level and Temporal Judgments of
the Past: the Moderating Role of Knowledge. In: Psychonomic Bulletin & Review.Volume 21. (2014) 734–739
43. Mendling, J., Verbeek, H.M.W., van Dongen, B.F., van der Aalst, W.M.P., Neu-mann, G.: Detection and Prediction of Errors in EPCs of the SAP ReferenceModel. In: Data and Knowledge Eng. (2008) 312–329
44. Aguilar, E.R., Sanchez, L., Carballeira, F.G., Ruiz, F., Piattini, M., Caivano, D.,Visaggio, G.: Prediction Models for BPMN Usability and Maintainability. In: ProcCEC’09. (2009) 383–390
45. Pinggera, J., Soffer, P., Fahland, D., Weidlich, M., Zugal, S., Weber, B., Reijers, H.,Mendling, J.: Styles in Business Process Modeling: an Exploration and a Model.In: Soft & Sys Modeling. (2013) 1–26
46. Aparicio, A.F., Vela, F.L.G., Sanchez, J.L.G., Montes, J.L.I.: Analysis and Applica-tion of Gamification. In: New Trends in Interaction, Virtual Reality and Modeling,Human-Computer Interaction Series. (2013) 113–126
47. Santorum, Marco and Front, Agnes and Rieu, Dominique: ISEAsy: A Social Busi-ness Process Management Platform. In: Proc BPM’13. (2013) 125–137
48. Brito, Thaigo P. and Paes, Josias and Moura, Antao B.: Game-Based Learning inIT Service Transition. In: Proc CSEDU’14. (2014) 110–116
49. Brown, Ross A.: Conceptual Modelling in 3D Virtual Worlds for Process Commu-nication. In: Proc APCCM’10. (2010) 25–32
50. West, Stephen and Brown, Ross A. and Recker, Jan C.: Collaborative BusinessProcess Modeling Using 3D Virtual Environments. In: Proc APCCM. (2010) 51–60
51. Kathleen, Nardella and Brown, Ross A. and Kriglstein, Simone: Storyboard Aug-mentation of Process Model Grammars for Stakeholder Communication. In: ProcIVAPP’14. (2014) 114–121