Embed Size (px)
Citation preview
Human–Wildlife Interactions 10(2):169–187, Fall 2016
Infl uence of transmission line construction on winter sage-grouse habitat use in southern UtahE P. H , Department of Wildland Resources, Utah State University, 5230 Old Main
Hill, Logan, UT 84322, USA [email protected]. C S , Wyoming Game and Fish, 432 E Mill Street, Pinedale, WY 82941, USAS. N F , Department of Wildland Resources, Utah State University, 5230 Old Main Hill,
Logan, UT 84322, USA
Abstract: The construction and operation of electric power transmission lines (“power lines”) and their associated infrastructure has been identifi ed as a conservation threat to the greater sage-grouse (Centrocercus urophasianus; sage-grouse). The conservation buff er zones recommended by state and federal agencies to avoid potential impacts on breeding populations diff er because information regarding the eff ects of power lines on sage-grouse is lacking. Little information is available regarding sage-grouse responses to power lines placed in winter habitat. Hence, we evaluated sage-grouse habitat use before and after construction of the Sigurd-Red Butte (SRB) 345-kilovolt (kV) transmission line in winter habitat. The SRB line was constructed in the fall of 2014, and was sited parallel to a pre-existing 500-kV transmission line through salt-desert habitat on the western edge of what is now the Bald Hills Sage-Grouse Management Area (SGMA) in southern Utah. We deployed Global Positioning System (GPS) transmitters on 2 female and 16 male sage-grouse from 2014–2016 and compared collected locations to data independently acquired in the winter of 2011–2012 to determine if the construction of the SRB transmission line altered sage-grouse winter habitat use. Using the 2014–2016 data, we developed a resource selection function (RSF) model to quantify the infl uence of transmission line presence on sage-grouse movements while accounting for low-quality habitat (salt-desert) near the transmission line. Post-construction data were compared to the 2011–2012 data to evaluate whether RSF-predicted changes in relative probability of use were refl ected in actual shifts in habitat use before and after construction. The top RSF model contained a signifi cant negative interaction between distance to transmission line and average salt-desert coverage within a 1-km2 moving window. Although a comparison of pre- and post-construction mapped RSFs predicted a decreased probability of winter habitat use in the vicinity of the transmission line corridor as a result of the new line, we did not detect increased avoidance by sage-grouse when comparing spatial distributions between winters using minimum convex polygons. This suggests that immediate negative eff ects of new transmission line construction can be eliminated by implementing best management practices such as co-locating the transmission line in a preexisting energy corridor where impacts on habitat selection have already occurred, and siting the line in poor-quality habitat that does not fragment existing habitat. However, we caution that there may be other long-term infl uences of transmission line installation that are outside the scope of our 2-year post-construction study design, and more research is required to assess the infl uence of transmission lines on sage-grouse winter habitat use over longer timescales.
Key words: anthropogenic infrastructure, Centrocercus urophasianus, electric power transmission lines, habitat quality, resource selection function, sage-grouse, Utah
The U.S. Fish and Wildlife Service (USFWS) att ributed the historical range wide declines observed in greater sage-grouse (Centrocercus urophasianus; sage-grouse) to continued loss and fragmentation of the sagebrush (Artemisia spp.) ecosystem in their 2010 decision to list the species as a candidate for protection under the Endangered Species Act of 1973 (USFWS 2010). The sagebrush ecosystem on which sage-grouse depend has undergone extensive alteration since European sett lement in the early 1900s as a result of habitat conversion,
degradation, and fragmentation (Connelly et al. 2000, Schroeder et al. 2004). Connelly et al. (2004) suggested that tall structures associated with energy production and transmission may functionally fragment sage-grouse habitat, and thus could have indirect impacts that are more pronounced than direct habitat loss. Tall structures are typically defi ned as power lines, communication towers, wind turbines, and other similar installations (USFWS 2010, Utah Wildlife in Need© 2010, Messmer et al. 2013).
The best management practices for mitigating
170 Human–Wildlife Interactions 10(2)
the impacts of tall structures are largely based on the reasoning that introducing new vertical features and associated infrastructure in a sagebrush landscape where those features are typically rare may increase perching by avian predators, fragment sage-grouse habitat, or promote human traffi c in otherwise undisturbed areas (Messmer et al. 2013). However, the extent of these impacts is not well understood (Utah Wildlife in Need© 2010, Walters et al. 2014). Conservation buff er zones recommended by state and federal agencies to avoid potential eff ects on breeding sage-grouse populations diff er throughout the species’ range because information is lacking regarding the infl uence of power lines on sage-grouse (Messmer et al. 2013, Manier et al. 2014).
Wisdom et al. (2011) compared multiple variables between current and extirpated sage-grouse habitat. They found that, among other factors, distance to transmission lines and distance to cellular towers were strongly
associated with sage-grouse extirpation. However, they concluded that the mechanism of this relationship was unknown at a regional scale. Similarly, Gillian et al. (2013) showed that sage-grouse in Idaho avoided transmission lines by 600 m when comparing telemetry locations to a null model. However, Johnson et al. (2011) did not detect an eff ect of power lines on sage-grouse lek trends between 1997 and 2007 across the species’ range.
An empirical study conducted by Messmer et al. (2013) concluded that much of the available research addressing the impacts of tall structures on sage-grouse was related to oil and gas development, only quantifi ed cumulative eff ects, or did not implicate tall structures themselves as causal agents of negative impacts. Specifi cally, the mechanism of avoidance and the timescale over which it may occur are not well understood (Utah Wildlife in Need© 2010, Messmer et al. 2013, Walters et al. 2014). One long-term study (Nonne et al. 2013)
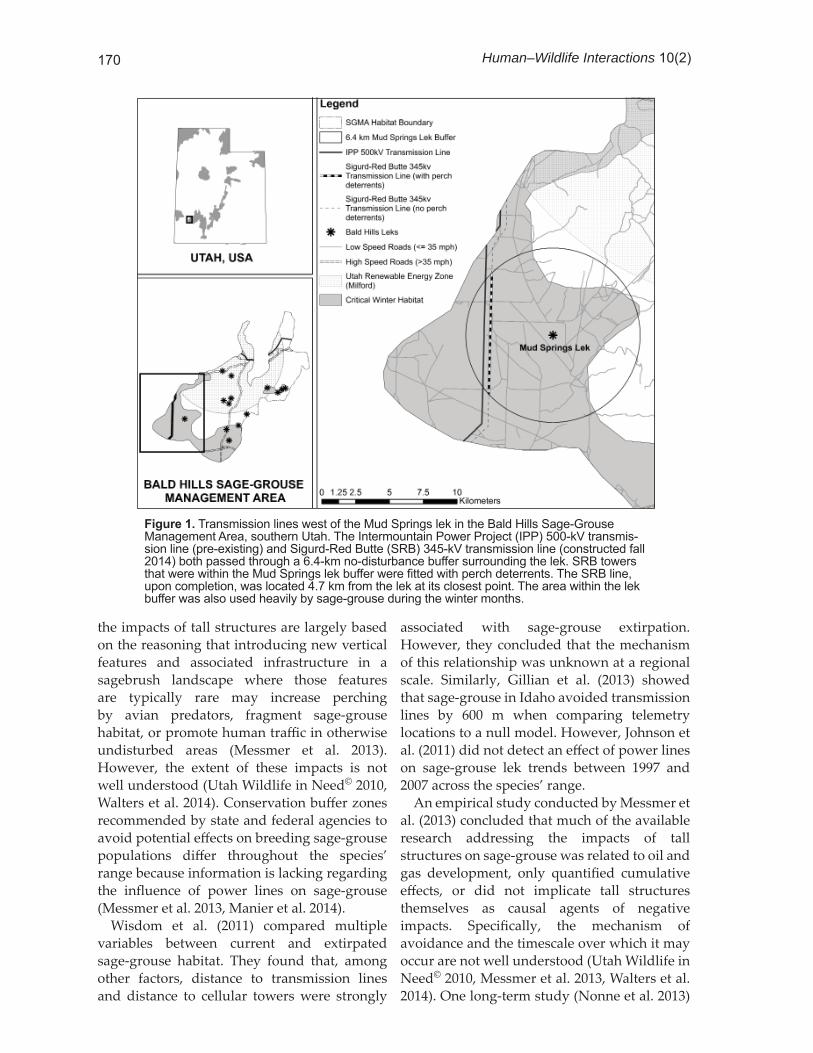
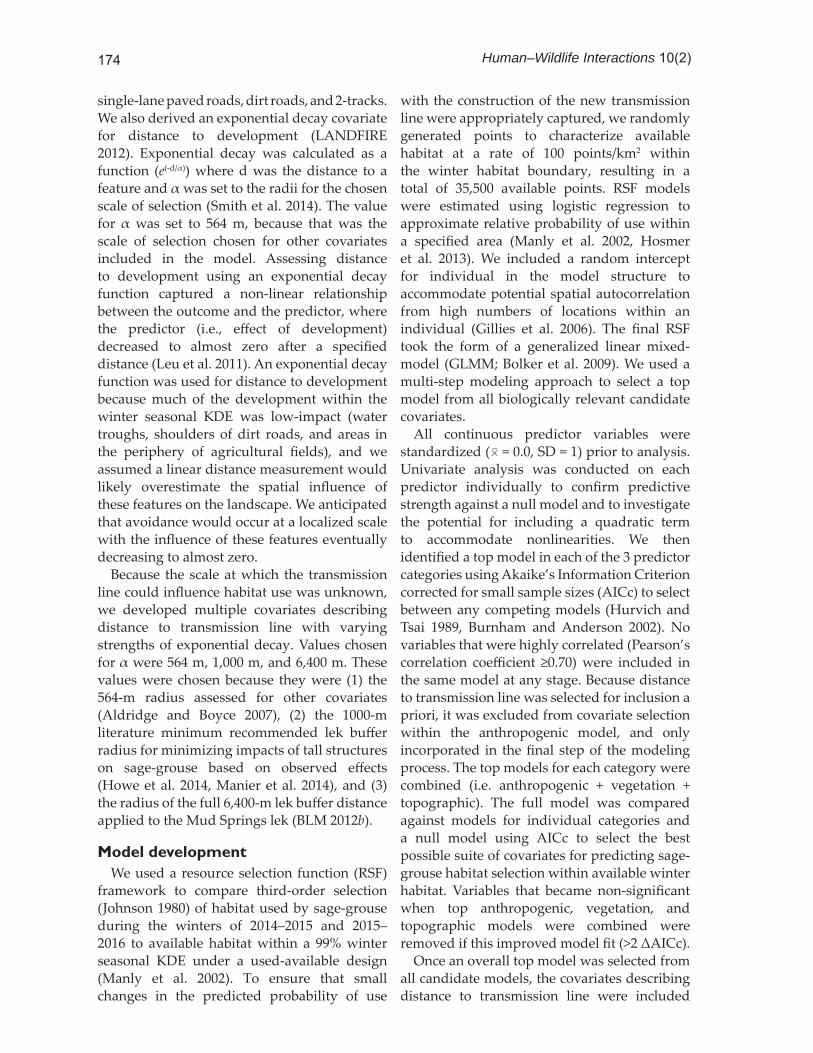
Figure 1. Transmission lines west of the Mud Springs lek in the Bald Hills Sage-Grouse Management Area, southern Utah. The Intermountain Power Project (IPP) 500-kV transmis-sion line (pre-existing) and Sigurd-Red Butte (SRB) 345-kV transmission line (constructed fall 2014) both passed through a 6.4-km no-disturbance buff er surrounding the lek. SRB towers that were within the Mud Springs lek buff er were fi tted with perch deterrents. The SRB line, upon completion, was located 4.7 km from the lek at its closest point. The area within the lek buff er was also used heavily by sage-grouse during the winter months.
171Transmission line construction • Hansen et al.
directly addressed the impact of transmission line presence on sage-grouse population demographics. They reported that distance to transmission line had no eff ect on nest site selection and female nesting propensity, a weak eff ect on male survival, and a strong eff ect on nest survival and female survival. Litt le information is available regarding sage-grouse responses to power lines placed in winter habitat.
In 2013, Utah published a state-wide plan (Plan; State of Utah 2013) to facilitate sage-grouse conservation by protecting all seasonal habitats (USFWS 2010, Dahlgren et al. 2016). Because sage-grouse use large landscapes, there is a need to understand seasonal movements and how these movements may be aff ected by anthropogenic land use such as the construction of power lines in winter range. Hence, we quantifi ed how the addition of a new transmission line to an existing energy corridor infl uenced sage-grouse winter habitat use before and after construction.
Study areaThe Bald Hills Sage-Grouse Management
Area (SGMA; study area) was 1 of 11 designated sage-grouse management areas within the state of Utah (State of Utah 2013). The Bald Hills SGMA consisted of 1,343 km2 and spanned across Beaver and Iron counties in the southwestern portion of the state. It was located at the southern periphery of the sage-grouse distribution in North America (State of Utah 2013, UDWR 2014; Figure 1). The SGMA included land managed by the Bureau of Land Management (BLM) as well as private stakeholders and state agencies (State of Utah 2013). In 2015, a total maximum count of 148 male sage-grouse was obtained at 14 active leks (J. Nicholes, UDWR, unpublished data).
The Bald Hills SGMA was a mountainous area ranging from 1596 m elevation in the southwest corner, at the Mud Springs lek, to 2314 m elevation in the northwest portion. The average annual precipitation was 26 cm. The study area was located in the Great Basin sagebrush ecosystem (West and Young 2000), which was generally arid and desert-like. Specifi cally, shrubs were shorter (generally <1 m in height) than those in sagebrush-steppe, were less densely spaced, and were
interspersed with loamy surface soils, microphytic crusts, and sparsely distributed grasses (West and Young 2000). Sagebrush species in the Bald Hills consisted of mountain big sagebrush (Artemisia tridentata vaseyana) at upper elevations, black sagebrush (A. nova) at lower elevations, and Wyoming big sagebrush (A. tridentata wyomingensis) present at moderate elevations (Burnett 2013). Sand sagebrush (A. fi llifolia) was also present in small quantities in the northwestern portion of the study area. The study area also contained signifi cant patches of mixed pinyon (Pinus spp.) and juniper (Juniperus spp.) forest; salt-desert shrub (dominant species included Artiplex confertifolia, Krascheninnikovia lanata, and Salicornia sp.); agricultural fi elds consisting of alfalfa (Medicago sativa) and corn (Zea sp.); and disturbed areas that were characterized by both native and non-native forbs and grasses.
The study area contained multiple sources of anthropogenic landscape disturbance (Figure 1). Domestic catt le (Bos spp.) and sheep (Ovis spp.) grazing were common, and agricultural development was present in the northern portion of the study area near the town of Minersville (population 907, U.S. Census Bureau 2012) and the unincorporated community of Greenville. Two 2-lane, paved highways bisected the study area in the north-south and east-west directions. Additionally, many maintained and unmaintained dirt roads were present throughout the study area. The Bald Hills SGMA also overlapped the Milford Renewable Energy Development Zone, designated by the Utah Renewable Energy Task Force as a region that had high potential for wind and solar development (Black and Veatch Corporation 2010).
The West-Wide Energy Corridor crossed the study site west of the Mud Springs lek (BLM 2012a). West-Wide Energy Corridors were designated under the Energy Policy Act of 2005 to delineate appropriate regions on federal land for the development of multiple oil, gas, and hydrogen pipelines and electricity transmission and distribution facilities (Barton 2005). At the start of the study in spring 2014, the corridor contained the 500-kV Intermountain Power Project (IPP) transmission line. In August 2014, construction of the Sigurd-Red Butt e (SRB) 345-kV transmission line was initiated, and
172 Human–Wildlife Interactions 10(2)
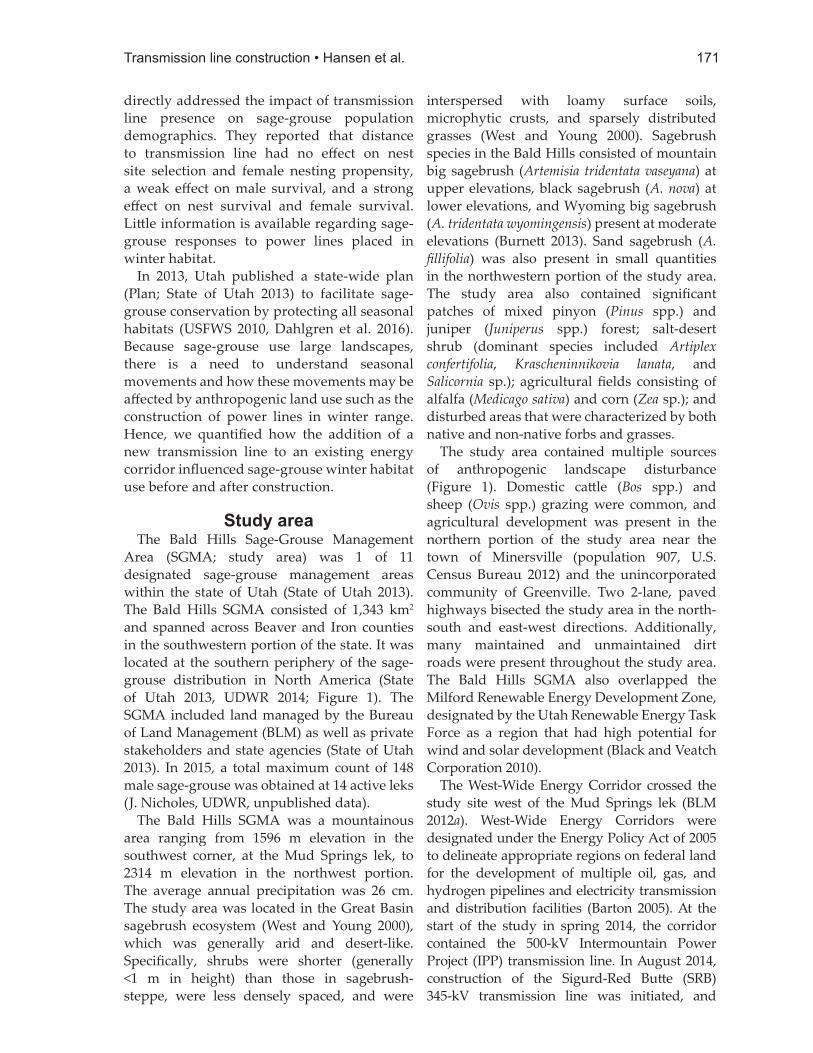
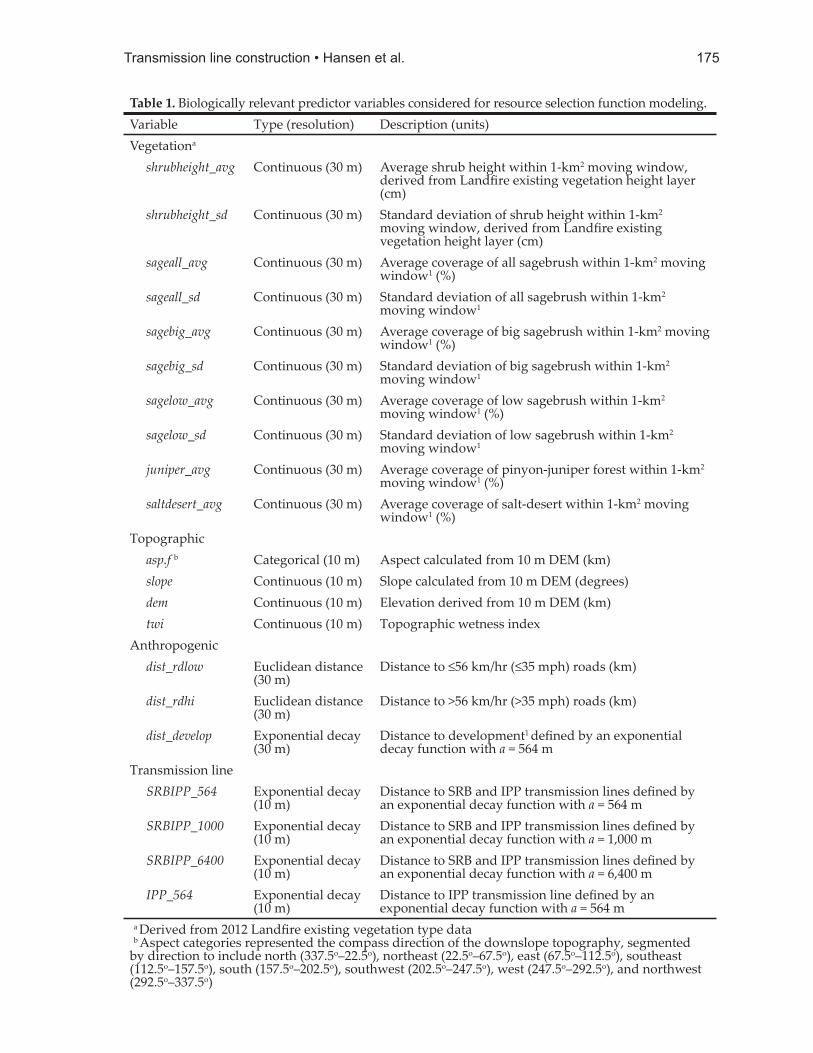
construction was completed in fall of 2014. At the initiation of the scoping process for the SRB line, the proposed location was sited outside of the SGMA boundary. In 2010, however, the Mud Springs lek was discovered, and the SGMA boundary was subsequently adjusted. The lek discovery and boundary adjustment late in the scoping process caused the SRB line to violate a 6.4-km designated buff er of no disturbance around the Mud Springs lek, and pass through 18.8 km of designated sage-grouse habitat within the SGMA (BLM 2012b). The SRB line was located to the east of the IPP line, with a separation distance of approximately 457 m (BLM 2012a; Figure 1). The Mud Springs lek was located 4.7 km from the SRB line at its closest point. The access road under the SRB line was reseeded to promote vegetation growth and to discourage access by recreational vehicles (Figure 2). An established dirt road under the original IPP line was active throughout the study. SRB transmission line towers that were located within the 6.4-km buff er surrounding the Mud Springs lek were fi tt ed with perch deterrents (Figure 2). This corridor was a likely zone for siting additional transmission lines or pipelines in the region in future years.
MethodsSage-grouse capture and data collection
We deployed Global Positioning System (GPS)/Platform Transmitt ing Terminal (PTT) transmitt ers on male and female sage-grouse in the springs of 2014 and 2015 (22-g Model PTT-100, Microwave Telemetry Inc., Columbia, MD, USA). Transmitt ers were programmed to record 4 GPS locations/day for download once weekly through the Argos satellite data collection system (Argos System, CLS America, Lanham, MD, USA). Locations were recorded at 0200, 0700, 1300, and 2100 daily, local time, to ensure habitat use was accurately represented throughout each 24-hour period. Sage-grouse were captured using standard spotlight methodology (Wakkinen et al. 1992). Individuals were captured in the vicinity of the Mud Springs lek and the Litt le Horse Valley lek complex. These 2 areas had the highest numbers of breeding individuals within the study area (J. Nicholes, UDWR, unpublished data), and were the 2 closest lekking areas to the West-Wide Energy Corridor containing the SRB and IPP transmission lines. The PTT-100 transmitt ers used in this study recorded GPS locations as well as additional locations derived from the position of the transmitt er in relation to the Argos receiving satellites (Microwave Telemetry 2016). The Argos location data were qualifi ed by an assigned location class indicating the reliability of each data point. The highest quality locations were assigned a value of LC3, which indicated that the location was accurate to ± 250 m (Collecte Localisation Satellites 2014). Visual examination of these locations in comparison to GPS location data collected at similar times indicated that this error radius was typically much smaller than 250 m. Thus, the GPS data for an individual was supplemented with the highest-quality Argos data (LC3) for analysis in the rare event of a GPS component malfunction.
Spatial and temporal extents of analysis
Sage-grouse locations collected from the winters of 2014–2015 (fi rst season after construction of the SRB line) and 2015–2016
Figure 2. Typical H-frame tower with installed perch deterrents which comprised the Sigurd-Red Butte 345-kV transmission line, constructed fall 2014. (Photo by E. Hansen)
173Transmission line construction • Hansen et al.
(second season after construction of the SRB line) were used for model development. This was supplemented with Very High-Frequency (VHF) sage-grouse location data collected independently from the winter of 2011–2012 (pre-construction; Burnett 2013) for validation. Individuals from the 2011–2012 study were caught across all active leks in the Bald Hills. We assumed that potential avoidance of the transmission line was likely to occur within sage-grouse seasonal winter range (third-order selection, Johnson 1980), because sage-grouse exhibit strong seasonal site fi delity (Connelly et al. 2004). We believed that it was unlikely that construction of the new transmission line would result in dramatic shifts of winter home range placement within the SGMA as a whole (second-order selection) because the IPP line was already present. We defi ned the winter season as November 15 to February 25 for all years. These seasonal dates were chosen because they refl ected seasonal movements to winter habitat (i.e., the last bird arrived in winter habitat just prior to November 15 and birds began lekking after February 25).
We generated a 99% kernel density estimate (KDE) around all pooled 2014–2015 and 2015–2016 winter sage-grouse locations to delineate seasonally available habitat using package adehabitatHR in program R (R version 3.1.3, <htt p://www.r-project.org>, accessed December 12, 2015). We used a smoothing parameter of 0.8 times the reference bandwidth (href), because the commonly used least-squares cross validation (hlscv) bandwidth has been shown to be unreliable for the large numbers of clustered locations present in GPS data sets (Hemson et al. 2005), and 0.8 was the smallest multiplier of href that still resulted in a single, continuous polygon (Kie 2013). A small portion of the KDE polygon extended outside delineated SGMA habitat boundaries into non-habitat, and no presence points were located in this area. To avoid including non-habitat in our assessment of availability, we clipped this portion of the KDE by the SGMA habitat boundary in ArcGIS 10.3 (Environmental Systems Research Institute, Redlands, CA, USA). This resulted in 355 km2 of available winter habitat within the SGMA boundary. The fi nal winter habitat polygon included >95% of all VHF locations collected from the
2011–2012 winter, and thus was determined to be a suitable delineation of available winter habitat for the pre-construction season as well.
Predictor variablesWe derived candidate predictor variables
(Table 1) shown to be strongly associated with winter sage-grouse habitat selection (Carpenter et al. 2010, Burnett 2013, Smith et al. 2014). Variables were divided into 3 categories: (1) vegetation, (2) topographic, and (3) anthropogenic.
Vegetation. Vegetation covariates were derived from Landfi re 2012 existing vegetation type and existing vegetation height data (LANDFIRE 2012) and assessed within a 1-km2 (564-m) radius moving window because selection at this scale was detected in other studies of sage-grouse habitat use (e.g., Aldridge and Boyce 2007, Carpenter et al. 2010, Fedy et al. 2015). For sagebrush covariates, we extracted both mean and standard deviation of coverage within the 1-km2 window, with the assumption that areas with a high standard deviation had more spatial heterogeneity or patchiness (Aldridge and Boyce 2007).
Topographic. We obtained 10-m Digital Elevation Model data (DEM; Utah Automated Geographic Reference Center [AGRC], <htt p://www.gis.utah.gov>, accessed February 1, 2016) and used it to derive slope (degrees), aspect (categorical, 8 categories) and topographic wetness index (TWI) layers in ArcGIS. TWI was calculated using Topography Tools for ArcGIS 10.3 and earlier (Dilts 2015), and is a steady-state wetness index based on upslope topography. TWI values for fl at areas were rare, but extremely large, so TWI was capped at 2500; all values larger than 2500 (<5% of the total area) were reclassifi ed as 2500 to assist with model convergence and increase ease of variable interpretation.
Anthropogenic. We included distance to roads (Road Centerlines; Utah AGRC, accessed March 16, 2014) because this was a strong predictor of winter sage-grouse habitat use in a previous study of this population (Burnett 2013). Roads were categorized into 2 classes; high-speed and low-speed. High-speed roads were roads with posted speeds >56 km/hr, and included paved 2-lane highways. Low-speed roads were roads with posted speeds ≤56 km/hr, and included
174 Human–Wildlife Interactions 10(2)
single-lane paved roads, dirt roads, and 2-tracks. We also derived an exponential decay covariate for distance to development (LANDFIRE 2012). Exponential decay was calculated as a function (e(-d/α)) where d was the distance to a feature and α was set to the radii for the chosen scale of selection (Smith et al. 2014). The value for α was set to 564 m, because that was the scale of selection chosen for other covariates included in the model. Assessing distance to development using an exponential decay function captured a non-linear relationship between the outcome and the predictor, where the predictor (i.e., eff ect of development) decreased to almost zero after a specifi ed distance (Leu et al. 2011). An exponential decay function was used for distance to development because much of the development within the winter seasonal KDE was low-impact (water troughs, shoulders of dirt roads, and areas in the periphery of agricultural fi elds), and we assumed a linear distance measurement would likely overestimate the spatial infl uence of these features on the landscape. We anticipated that avoidance would occur at a localized scale with the infl uence of these features eventually decreasing to almost zero.
Because the scale at which the transmission line could infl uence habitat use was unknown, we developed multiple covariates describing distance to transmission line with varying strengths of exponential decay. Values chosen for α were 564 m, 1,000 m, and 6,400 m. These values were chosen because they were (1) the 564-m radius assessed for other covariates (Aldridge and Boyce 2007), (2) the 1000-m literature minimum recommended lek buff er radius for minimizing impacts of tall structures on sage-grouse based on observed eff ects (Howe et al. 2014, Manier et al. 2014), and (3) the radius of the full 6,400-m lek buff er distance applied to the Mud Springs lek (BLM 2012b).
Model developmentWe used a resource selection function (RSF)
framework to compare third-order selection (Johnson 1980) of habitat used by sage-grouse during the winters of 2014–2015 and 2015–2016 to available habitat within a 99% winter seasonal KDE under a used-available design (Manly et al. 2002). To ensure that small changes in the predicted probability of use
with the construction of the new transmission line were appropriately captured, we randomly generated points to characterize available habitat at a rate of 100 points/km2 within the winter habitat boundary, resulting in a total of 35,500 available points. RSF models were estimated using logistic regression to approximate relative probability of use within a specifi ed area (Manly et al. 2002, Hosmer et al. 2013). We included a random intercept for individual in the model structure to accommodate potential spatial autocorrelation from high numbers of locations within an individual (Gillies et al. 2006). The fi nal RSF took the form of a generalized linear mixed-model (GLMM; Bolker et al. 2009). We used a multi-step modeling approach to select a top model from all biologically relevant candidate covariates.
All continuous predictor variables were standardized ( = 0.0, SD = 1) prior to analysis. Univariate analysis was conducted on each predictor individually to confi rm predictive strength against a null model and to investigate the potential for including a quadratic term to accommodate nonlinearities. We then identifi ed a top model in each of the 3 predictor categories using Akaike’s Information Criterion corrected for small sample sizes (AICc) to select between any competing models (Hurvich and Tsai 1989, Burnham and Anderson 2002). No variables that were highly correlated (Pearson’s correlation coeffi cient ≥0.70) were included in the same model at any stage. Because distance to transmission line was selected for inclusion a priori, it was excluded from covariate selection within the anthropogenic model, and only incorporated in the fi nal step of the modeling process. The top models for each category were combined (i.e. anthropogenic + vegetation + topographic). The full model was compared against models for individual categories and a null model using AICc to select the best possible suite of covariates for predicting sage-grouse habitat selection within available winter habitat. Variables that became non-signifi cant when top anthropogenic, vegetation, and topographic models were combined were removed if this improved model fi t (>2 ΔAICc).
Once an overall top model was selected from all candidate models, the covariates describing distance to transmission line were included
175Transmission line construction • Hansen et al.
Table 1. Biological ly relevant predictor variables considered for resource selection function modeling.Variable Type (resolution) Description (units)Vegetationa
shrubheight_avg Continuous (30 m) Average shrub height within 1-km2 moving window, derived from Landfi re existing vegetation height layer (cm)
shrubheight_sd Continuous (30 m) Standard deviation of shrub height within 1-km2 moving window, derived from Landfi re existing vegetation height layer (cm)
sageall_avg Continuous (30 m) Average coverage of all sagebrush within 1-km2 moving window1 (%)
sageall_sd Continuous (30 m) Standard deviation of all sagebrush within 1-km2 moving window1
sagebig_avg Continuous (30 m) Average coverage of big sagebrush within 1-km2 moving window1 (%)
sagebig_sd Continuous (30 m) Standard deviation of big sagebrush within 1-km2 moving window1
sagelow_avg Continuous (30 m) Average coverage of low sagebrush within 1-km2 moving window1 (%)
sagelow_sd Continuous (30 m) Standard deviation of low sagebrush within 1-km2 moving window1
juniper_avg Continuous (30 m) Average coverage of pinyon-juniper forest within 1-km2 moving window1 (%)
saltdesert_avg Continuous (30 m) Average coverage of salt-desert within 1-km2 moving window1 (%)
Topographic asp.f b Categorical (10 m) Aspect calculated from 10 m DEM (km) slope Continuous (10 m) Slope calculated from 10 m DEM (degrees) dem Continuous (10 m) Elevation derived from 10 m DEM (km) twi Continuous (10 m) Topographic wetness indexAnthropogenic dist_rdlow Euclidean distance
(30 m)Distance to ≤56 km/hr (≤35 mph) roads (km)
dist_rdhi Euclidean distance (30 m)
Distance to >56 km/hr (>35 mph) roads (km)
dist_develop Exponential decay (30 m)
Distance to development1 defi ned by an exponential decay function with a = 564 m
Transmission line SRBIPP_564 Exponential decay
(10 m)Distance to SRB and IPP transmission lines defi ned by an exponential decay function with a = 564 m
SRBIPP_1000 Exponential decay (10 m)
Distance to SRB and IPP transmission lines defi ned by an exponential decay function with a = 1,000 m
SRBIPP_6400 Exponential decay (10 m)
Distance to SRB and IPP transmission lines defi ned by an exponential decay function with a = 6,400 m
IPP_564 Exponential decay (10 m)
Distance to IPP transmission line defi ned by an exponential decay function with a = 564 m
a Derived from 2012 Landfi re existing vegetation type data b Aspect categories represented the compass direction of the downslope topography, segmented by direction to include north (337.5o–22.5o), northeast (22.5o–67.5o), east (67.5o–112.5o), southeast (112.5o–157.5o), south (157.5o–202.5o), southwest (202.5o–247.5o), west (247.5o–292.5o), and northwest (292.5o–337.5o)
176 Human–Wildlife Interactions 10(2)
at each scale of decay strength (SRBIPP_564, SRBIPP_1000, SRBIPP_6400) to determine which best described sage-grouse habitat use. Finally, because we suspected that any avoidance of the transmission line corridor may have been infl uenced by its placement in low-quality habitat (salt-desert) on the western side of the Bald Hills, we included an interaction between distance to transmission line and average salt-desert coverage (SRBIPP*saltdesert_avg) for each strength of transmission line decay to evaluate whether this improved model fi t.
Model validationThe ultimate test for the suitability of an RSF
is how well it predicts species use of landscapes across space and time (Johnson et al. 2006). To assess model fi t, the fi nal RSF was validated both internally through k-fold cross-validation (Boyce et al. 2002), and externally by mapping the RSF across a pre-construction landscape
and validating with independently collected data from the winter of 2011–2012 (Burnett 2013). For k-fold validation, we divided the individuals from the main (2014–2015) data set into 5 randomly assigned folds. The top RSF model was then refi t 5 times, each time withholding a diff erent fold of test data. The refi t RSFs were mapped across available habitat within the 99% winter KDE and divided into 10 quantiles (equal-area bins) of increasing rank (1 = low quality habitat, 10 = high quality habitat). We extracted the frequency of test fold data points that fell in each bin for all 5 refi t RSF models and calculated Spearman rank correlations for each test fold to quantify the relationship between frequency of use by test locations and increasing bin ranks of habitat quality (Boyce et al. 2002, Aldridge and Boyce 2007). We expected that as bin rank increased, frequency of use should also increase.
Although internal validation of an RSF
Table 3. Akaike Information Criterion (corrected for small sample size, AICc) ranked vegetation models for winter sage-grouse habitat selection in the Bald Hills Sage-Grouse Management Area (SGMA), Southern Utah.Model Structure AICc ΔAICc ωi
vg_fi nal sagelow_avg + sagelow_avg2 + sagebig_avg + sagebig_avg2 + sageall_sd + shrubheight_sd + saltdesert_avg + juniper_avg
32935 0.0 1.00
vg4 sagelow_avg + sagelow_avg 2 + sagebig_avg + sagebig_avg2 + sageall_sd + saltdesert_avg + juniper_avg
32956 21.3 ≤0.001
vg2 sagelow_sd + sagelow_sd 2 +sagebig_sd + sagebig_sd 2 + sageall_avg + sageall_avg2 + shrubheight_sd + saltdesert_avg _ juniper_avg
33235 300.4 ≤0.001
vg5 sagelow_sd + sagelow_sd2 + sagebig_sd + sagebig_sd2 + sageall_avg + sageall_avg2 + saltdesrt_avg + juniper_avg
33277 342.3 ≤0.001
vg3 sagelow_avg + sagelow_avg2 + shrubheight_avg +shrubheight_sd +saltdesert_avg + juniper_avg
33538 602.6 ≤0.001
vg8 sagelow_avg + sagelow_avg2 + sagebig_avg + sagebig_avg2 + saltdesert_avg + juniper_avg
33672 737.2 ≤0.001
vg7 sageall_avg + sageall_avg2 + saltdesert_avg + juniper_avg 34234 1299.0 ≤0.001
vg6 shrubheight_avg + saltdesert_avg + juniper_avg 34789 1853.6 ≤0.001
Table 2. Final models selected to represent topographic and anthropogenic categories for winter sage-grouse habitat selection.Model Structureanth_fi nal develop_564 + roadlow_km + roadlow_km2 + roadhi_kmtopo_fi nal twi + twi2 + asp.f + dem + dem2 +slope + slope2
177Transmission line construction • Hansen et al.
provides insight on its eff ectiveness, the best test of an RSF is independent validation with an external data set (Boyce et al. 2002). Because a previous study (Burnett 2013) had collected winter VHF data on sage-grouse locations from the winter of 2011–2012, this allowed us to evaluate model fi t across years and compare how RSF-predicted habitat quality in the vicinity of the West-Wide Energy Corridor diff ered before and after construction of the SRB line. To ensure that temporally dynamic covariates were appropriately applied to this map, we used an input for distance to transmission line that included only the IPP line because only that line was present in the West-Wide Energy Corridor at the time those locations were collected. We also updated vegetation predictor variables using Landfi re 2010 data (LANDFIRE 2010) to more accurately represent vegetation available during the winter of 2011–2012. For external validation, the RSF was mapped across the pre-construction landscape within the same 99% winter seasonal KDE, divided into 10 equal-area bins, and frequencies of use were compared to bin rank using Spearman-rank correlations in a similar fashion as the validation for the post-construction RSF model.
Comparisons of pre- and post-construction data
The development of pre- and post-construction RSF models for winter habitat allowed us to compare how predicted habitat use may have changed with the construction of a new transmission line. This off ered the most conservative estimate of diff erences between pre- and post-construction landscapes, because it assumed that the construction of the new SRB line did not change the strength of avoidance of the West-Wide Energy Corridor (β coeffi cient), only the spatial orientation of transmission lines on the landscape (i.e., the corridor was composed of 2 lines in the post-construction model and 1 line in the pre-construction model). If the addition of the new line was multiplicative (e.g., doubled a negative eff ect), then the pre-construction map we derived would underestimate the probability of use near the single, original transmission line and the change in RSF value would actually be greater than is reported here. However, because the eff ects of adding a new transmission line to a pre-existing transmission line corridor are
not well documented, and the original patt erns of habitat use prior to the construction of any transmission lines in the Bald Hills SGMA were unknown, we chose to estimate changes on the landscape in the most conservative manner possible.
We compared changes in RSF-predicted probability of habitat use and diff erences in the spatial distribution of sage-grouse locations within the vicinity of the transmission line corridor between the pre- and post-construction data sets. We focused on these changes for winter habitat inside the 6.4-km Mud Springs lek buff er, because sage-grouse used this area heavily in the winter months and it was at a high risk of being negatively infl uenced by the construction of the new transmission line due to its close proximity. We quantifi ed changes in RSF-predicted habitat use by calculating the diff erence between the pre- and post-construction mapped RSFs (RSF_post – RSF_pre = ΔRSF). This resulted in a map layer that showed decreased RSF scores from pre-to post-construction as negative values, and increased RSF scores as positive values. To compare sage-grouse spatial distributions between winters, we generated minimum convex polygons (MCPs) for sage-grouse locations within the Mud Springs lek buff er for each winter (2011–2012, 2014–2015, and 2015–2016) and calculated the centroid for each MCP. We anticipated that if the RSF-predicted relative probability of use decreased within the boundaries of the lek buff er after the addition of the new transmission line, this would be refl ected by a corresponding shift in MCP centroids further from the transmission line corridor in the 2 post-construction seasons.
ResultsSage-grouse capture and data collection
The GPS data set for the winters of 2014–2015 and 2015–2016 included locations from 18 individual sage-grouse (2 females, 16 males) and included 7,534 locations. Sexes were pooled because male and female sage-grouse can occupy mixed-sex fl ocks in the winter months (Swanson et al. 2013) and examination of GPS locations indicated this was the case in our study area for the time periods included in our analysis. Birds caught from both the
178 Human–Wildlife Interactions 10(2)
Mud Springs and Litt le Horse Valley leks moved frequently between these 2 locations during the spring, and thus were assumed to be part of the same breeding population. Malfunction of transmitt er GPS components occurred on 2 individuals during the study, and consequently their location data were supplemented with the highest quality Argos location data (class LC3). Number of locations per bird ranged from 54–802, depending on the length of transmitt er deployment for that particular bird. The VHF data set from 2011–
2012 used in external validations contained 85 locations from 19 sage-grouse (11 males, 8 females).
Resource selection function modelingGlobal models for the topographic and
anthropogenic categories indicated that all a priori selected predictors contributed signifi cantly (P ≤ 0.05) and no variables were collinear, so all predictors were included in the fi nal model for each of those groups (Table 2). Because many of the vegetation predictors
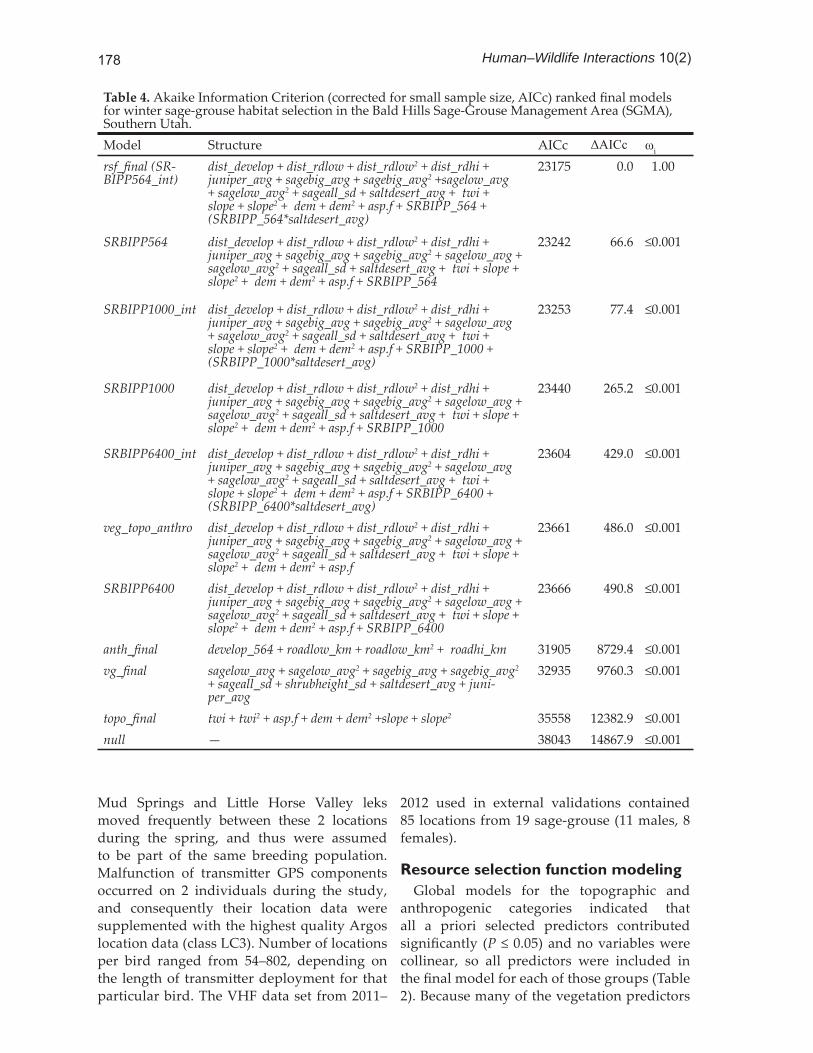
Table 4. Akaike Information Criterion (corrected for small sample size, AICc) ranked fi nal models for winter sage-grouse habitat sel ection in the Bald Hills Sage-Grouse Management Area (SGMA), Southern Utah.Model Structure AICc ΔAICc ωi
rsf_fi nal (SR-BIPP564_int)
dist_develop + dist_rdlow + dist_rdlow2 + dist_rdhi + juniper_avg + sagebig_avg + sagebig_avg2 +sagelow_avg + sagelow_avg2 + sageall_sd + saltdesert_avg + twi + slope + slope2 + dem + dem2 + asp.f + SRBIPP_564 + (SRBIPP_564*saltdesert_avg)
23175 0.0 1.00
SRBIPP564 dist_develop + dist_rdlow + dist_rdlow2 + dist_rdhi + juniper_avg + sagebig_avg + sagebig_avg2 + sagelow_avg + sagelow_avg2 + sageall_sd + saltdesert_avg + twi + slope + slope2 + dem + dem2 + asp.f + SRBIPP_564
23242 66.6 ≤0.001
SRBIPP1000_int dist_develop + dist_rdlow + dist_rdlow2 + dist_rdhi + juniper_avg + sagebig_avg + sagebig_avg2 + sagelow_avg + sagelow_avg2 + sageall_sd + saltdesert_avg + twi + slope + slope2 + dem + dem2 + asp.f + SRBIPP_1000 + (SRBIPP_1000*saltdesert_avg)
23253 77.4 ≤0.001
SRBIPP1000 dist_develop + dist_rdlow + dist_rdlow2 + dist_rdhi + juniper_avg + sagebig_avg + sagebig_avg2 + sagelow_avg + sagelow_avg2 + sageall_sd + saltdesert_avg + twi + slope + slope2 + dem + dem2 + asp.f + SRBIPP_1000
23440 265.2 ≤0.001
SRBIPP6400_int dist_develop + dist_rdlow + dist_rdlow2 + dist_rdhi + juniper_avg + sagebig_avg + sagebig_avg2 + sagelow_avg + sagelow_avg2 + sageall_sd + saltdesert_avg + twi + slope + slope2 + dem + dem2 + asp.f + SRBIPP_6400 + (SRBIPP_6400*saltdesert_avg)
23604 429.0 ≤0.001
veg_topo_anthro dist_develop + dist_rdlow + dist_rdlow2 + dist_rdhi + juniper_avg + sagebig_avg + sagebig_avg2 + sagelow_avg + sagelow_avg2 + sageall_sd + saltdesert_avg + twi + slope + slope2 + dem + dem2 + asp.f
23661 486.0 ≤0.001
SRBIPP6400 dist_develop + dist_rdlow + dist_rdlow2 + dist_rdhi + juniper_avg + sagebig_avg + sagebig_avg2 + sagelow_avg + sagelow_avg2 + sageall_sd + saltdesert_avg + twi + slope + slope2 + dem + dem2 + asp.f + SRBIPP_6400
23666 490.8 ≤0.001
anth_fi nal develop_564 + roadlow_km + roadlow_km2 + roadhi_km 31905 8729.4 ≤0.001vg_fi nal sagelow_avg + sagelow_avg2 + sagebig_avg + sagebig_avg2
+ sageall_sd + shrubheight_sd + saltdesert_avg + juni-per_avg
32935 9760.3 ≤0.001
topo_fi nal twi + twi2 + asp.f + dem + dem2 +slope + slope2 35558 12382.9 ≤0.001null — 38043 14867.9 ≤0.001
179Transmission line construction • Hansen et al.
were collinear (Pearson’s correlation coeffi cient ≥0.70), a set of candidate models for the vegetation category was developed post priori and a top model was selected using AICc (Table 3). Once top models for anthropogenic (anth_fi nal), vegetation (vg_fi nal), and topographic (topo_fi nal) categories
were selected, these models were combined and compared against the individual top models as well as a null model (Table 4) to determine which best described winter habitat use in the Bald Hills. Variables that became non-signifi cant (P > 0.05) when the models were combined (twi2 and shrubheight_sd) were dropped because removing them signifi cantly improved model fi t (>2 ΔAICc; Burnham and Anderson 2002).
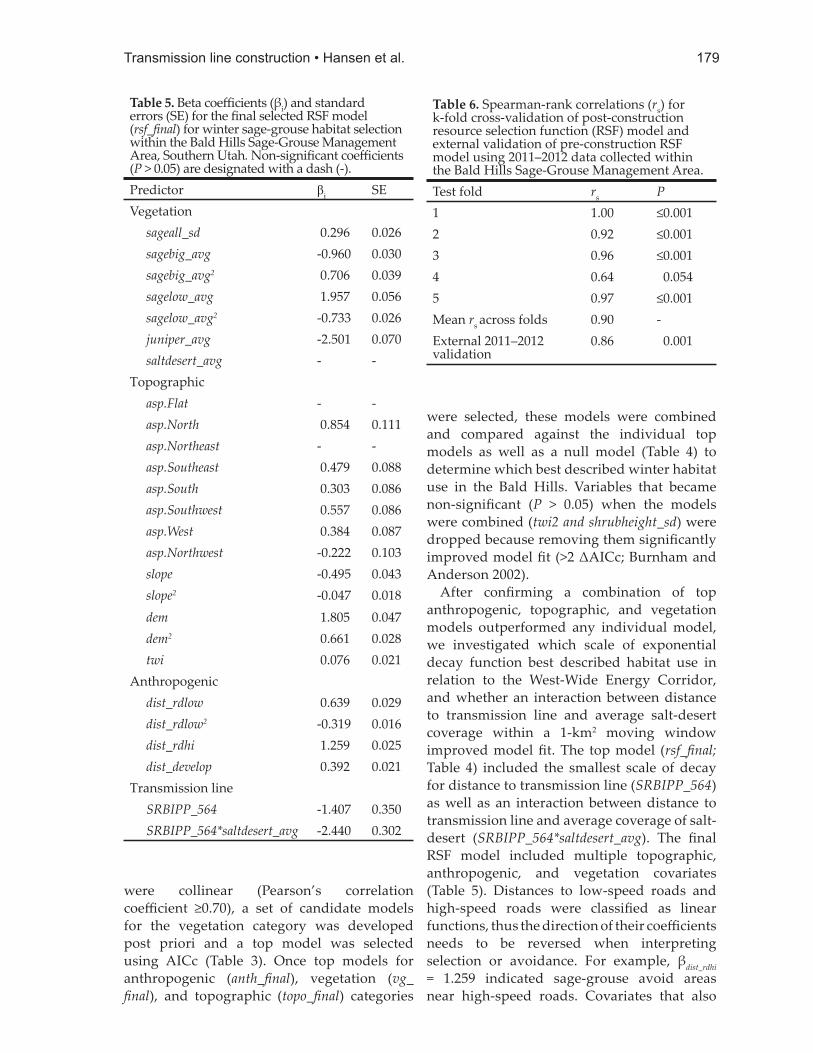
After confi rming a combination of top anthropogenic, topographic, and vegetation models outperformed any individual model, we investigated which scale of exponential decay function best described habitat use in relation to the West-Wide Energy Corridor, and whether an interaction between distance to transmission line and average salt-desert coverage within a 1-km2 moving window improved model fi t. The top model (rsf_fi nal; Table 4) included the smallest scale of decay for distance to transmission line (SRBIPP_564) as well as an interaction between distance to transmission line and average coverage of salt-desert (SRBIPP_564*saltdesert_avg). The fi nal RSF model included multiple topographic, anthropogenic, and vegetation covariates (Table 5). Distances to low-speed roads and high-speed roads were classifi ed as linear functions, thus the direction of their coeffi cients needs to be reversed when interpreting selection or avoidance. For example, βdist_rdhi = 1.259 indicated sage-grouse avoid areas near high-speed roads. Covariates that also
Table 5. Beta coeffi cients (βi) and standard errors (SE) for the fi nal selected RSF model (rsf_fi nal) for winter sage-grouse habitat selection within the Bald Hills Sage-Grouse Management Area, Southern Utah. Non-signifi cant coeffi cients (P > 0.05) are designated with a dash (-).Predictor βi SEVegetation sageall_sd 0.296 0.026 sagebig_avg -0.960 0.030 sagebig_avg2 0.706 0.039 sagelow_avg 1.957 0.056 sagelow_avg2 -0.733 0.026 juniper_avg -2.501 0.070 saltdesert_avg - -Topographic asp.Flat - - asp.North 0.854 0.111 asp.Northeast - - asp.Southeast 0.479 0.088 asp.South 0.303 0.086 asp.Southwest 0.557 0.086 asp.West 0.384 0.087 asp.Northwest -0.222 0.103 slope -0.495 0.043 slope2 -0.047 0.018 dem 1.805 0.047 dem2 0.661 0.028 twi 0.076 0.021Anthropogenic dist_rdlow 0.639 0.029 dist_rdlow2 -0.319 0.016 dist_rdhi 1.259 0.025 dist_develop 0.392 0.021Transmission line SRBIPP_564 -1.407 0.350 SRBIPP_564*saltdesert_avg -2.440 0.302
Table 6. Spearman-rank correlations (rs) for k-fold cross-validation of post-construction resource selection function (RSF) model and external validation of pre-construction RSF model using 2011–2012 data collected within the Bald Hills Sage-Grouse Management Area.Test fold rs P1 1.00 ≤0.0012 0.92 ≤0.0013 0.96 ≤0.0014 0.64 0.0545 0.97 ≤0.001Mean rs across folds 0.90 -External 2011–2012 validation
0.86 0.001
180 Human–Wildlife Interactions 10(2)
included a squared term indicated a non-linear relationship to the response variable (i.e., slope + slope2 indicated sage-grouse selected for moderately steep slopes). The interaction between salt-desert coverage and proximity to transmission line (SRBIPP_564*saltdesert_avg) negatively infl uenced predicted probability of habitat use.
Model validationThe model performed well in both internal
and external validation (Table 6). The average Spearman rank correlation coeffi cient (rs) for k-fold cross-validation was 0.90 across all 5 folds. Four of the 5 iterations of k-fold validation exhibited excellent predictive capacity (rs = 0.92 to 1.00), but 1 fold (Fold 4; Table 6) had a much lower predictive success (rs = 0.64, P = 0.054), which lowered the average overall. Correlations were also high for the 2011–2012 external validation with rs = 0.86 (P = 0.001), which suggested good predictive capacities for
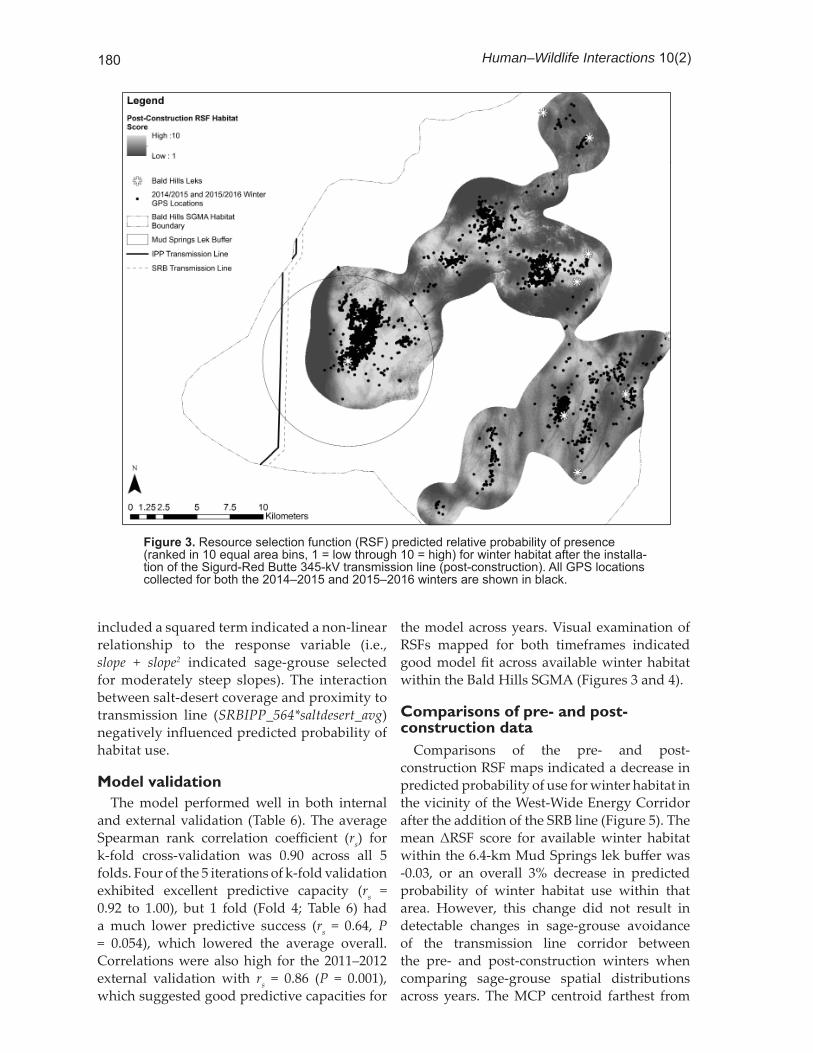
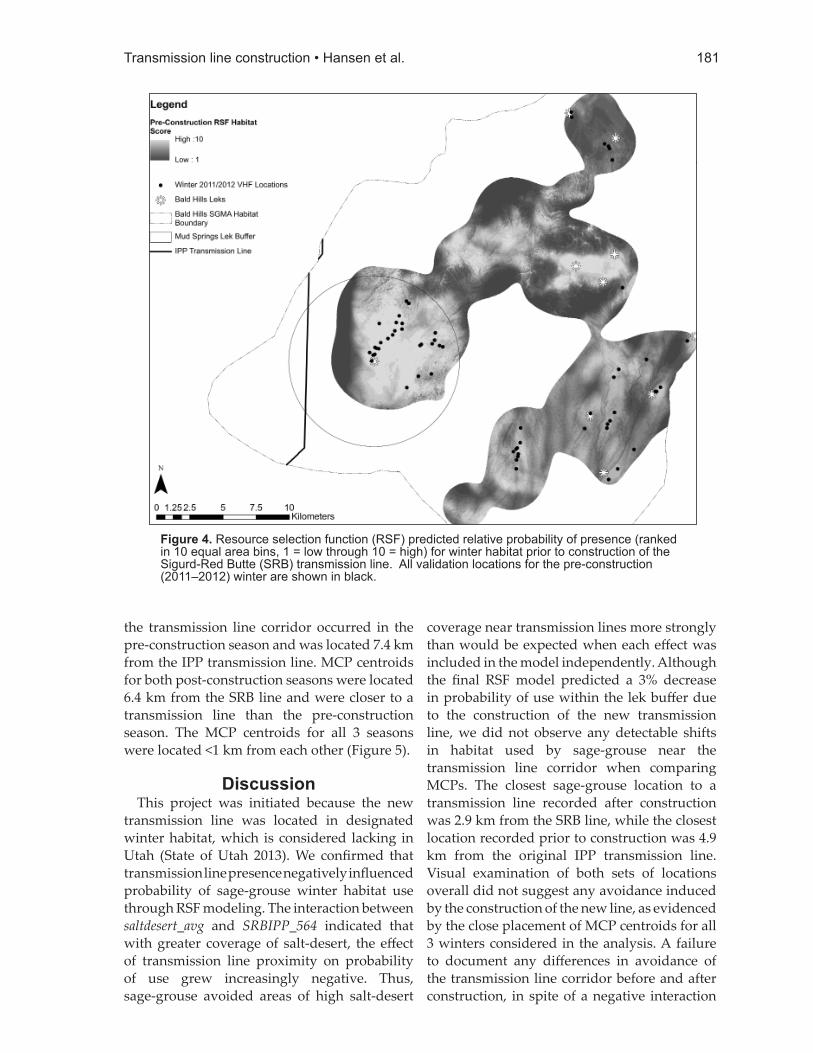
the model across years. Visual examination of RSFs mapped for both timeframes indicated good model fi t across available winter habitat within the Bald Hills SGMA (Figures 3 and 4).
Comparisons of pre- and post-construction data
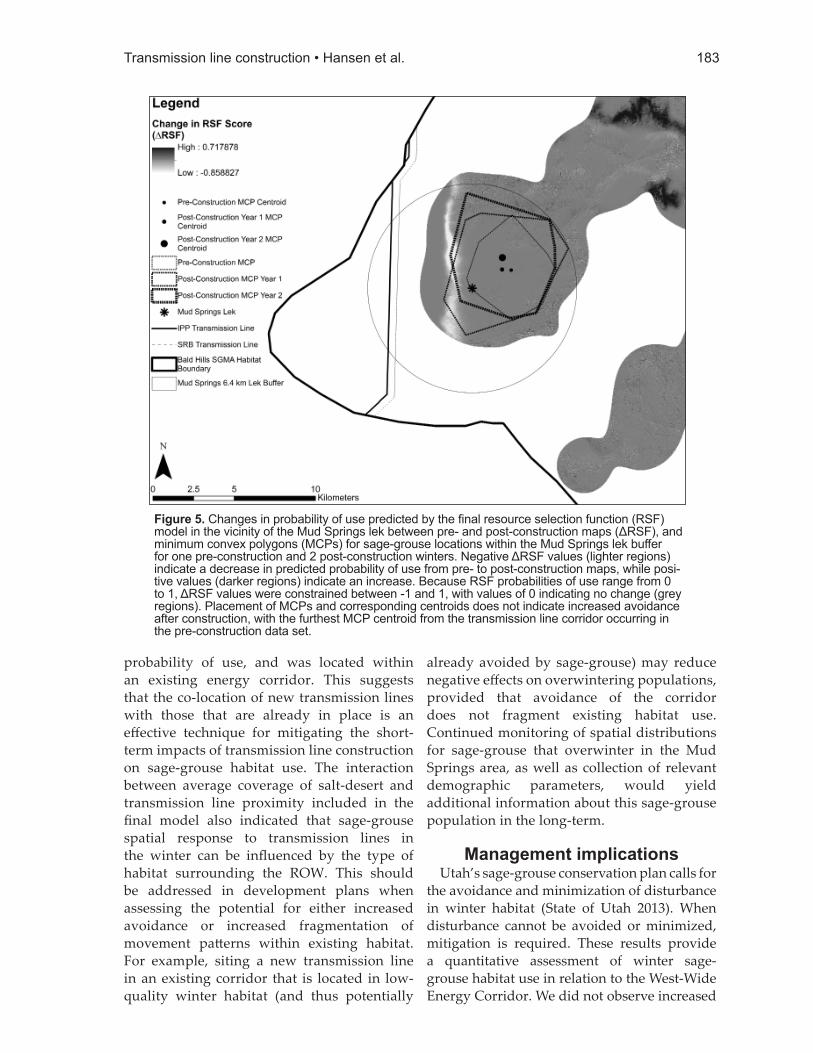
Comparisons of the pre- and post-construction RSF maps indicated a decrease in predicted probability of use for winter habitat in the vicinity of the West-Wide Energy Corridor after the addition of the SRB line (Figure 5). The mean ΔRSF score for available winter habitat within the 6.4-km Mud Springs lek buff er was -0.03, or an overall 3% decrease in predicted probability of winter habitat use within that area. However, this change did not result in detectable changes in sage-grouse avoidance of the transmission line corridor between the pre- and post-construction winters when comparing sage-grouse spatial distributions across years. The MCP centroid farthest from
Figure 3. Resource selection function (RSF) predicted relative probability of presence (ranked in 10 equal area bins, 1 = low through 10 = high) for winter habitat after the installa-tion of the Sigurd-Red Butte 345-kV transmission line (post-construction). All GPS locations collected for both the 2014–2015 and 2015–2016 winters are shown in black.
181Transmission line construction • Hansen et al.
the transmission line corridor occurred in the pre-construction season and was located 7.4 km from the IPP transmission line. MCP centroids for both post-construction seasons were located 6.4 km from the SRB line and were closer to a transmission line than the pre-construction season. The MCP centroids for all 3 seasons were located <1 km from each other (Figure 5).
DiscussionThis project was initiated because the new
transmission line was located in designated winter habitat, which is considered lacking in Utah (State of Utah 2013). We confi rmed that transmission line presence negatively infl uenced probability of sage-grouse winter habitat use through RSF modeling. The interaction between saltdesert_avg and SRBIPP_564 indicated that with greater coverage of salt-desert, the eff ect of transmission line proximity on probability of use grew increasingly negative. Thus, sage-grouse avoided areas of high salt-desert
coverage near transmission lines more strongly than would be expected when each eff ect was included in the model independently. Although the fi nal RSF model predicted a 3% decrease in probability of use within the lek buff er due to the construction of the new transmission line, we did not observe any detectable shifts in habitat used by sage-grouse near the transmission line corridor when comparing MCPs. The closest sage-grouse location to a transmission line recorded after construction was 2.9 km from the SRB line, while the closest location recorded prior to construction was 4.9 km from the original IPP transmission line. Visual examination of both sets of locations overall did not suggest any avoidance induced by the construction of the new line, as evidenced by the close placement of MCP centroids for all 3 winters considered in the analysis. A failure to document any diff erences in avoidance of the transmission line corridor before and after construction, in spite of a negative interaction
Figure 4. Resource selection function (RSF) predicted relative probability of presence (ranked in 10 equal area bins, 1 = low through 10 = high) for winter habitat prior to construction of the Sigurd-Red Butte (SRB) transmission line. All validation locations for the pre-construction (2011–2012) winter are shown in black.
182 Human–Wildlife Interactions 10(2)
between saltdesert_avg and SRBIPP_564 in the modeled RSF, could arise from multiple sources.
Eff orts to minimize project footprint, implement best management practices, and reclaim habitat after construction may have lessened impacts of the project on sage-grouse habitat use (BLM 2012b, APLIC 2015, Fedy et al. 2015). The area within the seasonal winter KDE that was located near the transmission line corridor had a low probability of use in both pre- and post-construction maps. Thus, the area closest to the West-Wide Energy Corridor was avoided by sage-grouse in the winter prior to the addition of the SRB line. The habitat to the west of the energy corridor was not considered high-quality sage-grouse winter habitat; therefore, sage-grouse use of this area was not anticipated. No birds crossed the West-Wide Energy Corridor during the course of our entire study in either the pre- or post-construction time periods (2011–2013, 2014–2016; Burnett 2013, Hansen 2016). The placement of the SRB 345-kV transmission line, in an area of low predicted probability of use that was located on the western periphery of the SGMA, likely refl ects a best-case scenario for minimizing direct impacts to winter habitat use or movement patt erns.
It is also possible that the presence of the new transmission line did negatively infl uence habitat suitability, but that the change was not dramatic enough to override the strong site-fi delity of sage-grouse (e.g., Fischer et al. 1993, Holloran and Anderson 2005), or that site fi delity could cause sage-grouse to continue to use this habitat for multiple years before adjusting movement patt erns (Harju et al. 2010). Time lag delays for negative impacts of energy development on male lek att endance in Wyoming have been suggested to range from 2–10 years (Walker et al. 2007, Harju et al. 2010). Although litt le information is available regarding time lag delays on winter habitat selection or response to transmission line development, our study only included 2 years of post-construction data and thus may not cover a suffi cient temporal scale for this impact to detectably alter spatial distributions of sage-grouse that overwinter in the area.
Alternatively, the infl uence of the transmission line corridor on habitat use as detected by the
RSF may not have been a function of direct avoidance of a tall structure on the landscape, but rather by some associated, indirect impact. These eff ects may not manifest immediately after construction because they require a longer time period for the negative change to occur, and could include increased traffi c due to the addition of ancillary roads, or changes in avian predator abundance as a result of increased perching substrate. It is unlikely that the installation of the access road under the SRB line would result in future increased avoidance by sage-grouse during the winter months. This is because the new road under the SRB line was revegetated to discourage non project-related use of the right-of-way (ROW), and vehicular access to the area in the winter months is diffi cult given its remote location (Hansen 2016).
Increased perching substrate for avian predators of sage-grouse is also a major concern related to power line development (Messmer et al. 2013), and we were not able to incorporate avian predator presence into our RSF model. The portion of the SRB transmission line that passed through the 6.4-km lek buff er around the Mud Springs lek was fi tt ed with perch deterrents, but the eff ectiveness of these can vary widely (Prather and Messmer 2010, Slater and Smith 2010, Dwyer and Doloughan 2014), and historic perching locations were still available on the original IPP transmission line (Hansen 2016). Avian predator species that had winter ranges that overlapped the study area included golden eagles (Aquila chrysaetos; Kochert et al. 2002) and ferruginous hawks (Buteo regalis; Bechard and Schmutz 1995), both of which were observed nesting on the original IPP towers during the breeding season in 2014 and 2015 (Hansen 2016). An assessment of overwintering avian predator presence along the transmission line across years would provide more information about the indirect consequences of energy corridor expansion located adjacent to sage-grouse critical winter habitat.
Within the 2-year post-construction temporal scale covered by our study, we did not observe increased avoidance of the West-Wide Energy Corridor by sage-grouse. This is likely because the SRB line was sited outside of utilized winter habitat, adjacent to an area of low predicted
183Transmission line construction • Hansen et al.
probability of use, and was located within an existing energy corridor. This suggests that the co-location of new transmission lines with those that are already in place is an eff ective technique for mitigating the short-term impacts of transmission line construction on sage-grouse habitat use. The interaction between average coverage of salt-desert and transmission line proximity included in the fi nal model also indicated that sage-grouse spatial response to transmission lines in the winter can be infl uenced by the type of habitat surrounding the ROW. This should be addressed in development plans when assessing the potential for either increased avoidance or increased fragmentation of movement patt erns within existing habitat. For example, siting a new transmission line in an existing corridor that is located in low-quality winter habitat (and thus potentially
already avoided by sage-grouse) may reduce negative eff ects on overwintering populations, provided that avoidance of the corridor does not fragment existing habitat use. Continued monitoring of spatial distributions for sage-grouse that overwinter in the Mud Springs area, as well as collection of relevant demographic parameters, would yield additional information about this sage-grouse population in the long-term.
Management implicationsUtah’s sage-grouse conservation plan calls for
the avoidance and minimization of disturbance in winter habitat (State of Utah 2013). When disturbance cannot be avoided or minimized, mitigation is required. These results provide a quantitative assessment of winter sage-grouse habitat use in relation to the West-Wide Energy Corridor. We did not observe increased
Figure 5. Changes in probability of use predicted by the fi nal resource selection function (RSF) model in the vicinity of the Mud Springs lek between pre- and post-construction maps (ΔRSF), and minimum convex polygons (MCPs) for sage-grouse locations within the Mud Springs lek buff er for one pre-construction and 2 post-construction winters. Negative ΔRSF values (lighter regions) indicate a decrease in predicted probability of use from pre- to post-construction maps, while posi-tive values (darker regions) indicate an increase. Because RSF probabilities of use range from 0 to 1, ΔRSF values were constrained between -1 and 1, with values of 0 indicating no change (grey regions). Placement of MCPs and corresponding centroids does not indicate increased avoidance after construction, with the furthest MCP centroid from the transmission line corridor occurring in the pre-construction data set.
184 Human–Wildlife Interactions 10(2)
avoidance of the transmission line corridor by sage-grouse as distance to transmission line changed after the addition of a new line. Siting the line in an area of poor-quality habitat (salt-desert) on the periphery of the SGMA represents a best-case scenario for reducing the infl uence of new energy development projects. Our results suggest that existing transmission line corridors located in poor-quality winter habitat are likely already avoided by sage-grouse, and co-locating additional lines within these corridors may dampen the eff ects of new tall structures on the landscape in the years immediately following construction. We emphasize that more data collection is required to determine if this technique also minimizes impacts to habitat use across long-term time scales. Because future indirect disturbances are still possible in the project area, we suggest monitoring of avian predator presence along the transmission line corridor, as well as management actions that protect and increase winter habitat. Management actions should include maintaining ≥10% sagebrush cover, maintaining ≤5% tree cover in and adjacent to currently used winter habitat, and protecting designated winter habitat from wildfi re (State of Utah 2013).
AcknowledgmentsFunding for this research was provided by
Rocky Mountain Power. We thank the many volunteers who assisted with sage-grouse trapping and transmitt er deployment. We appreciate assistance and support provided by the Utah State University Quinney College of Natural Resources.
Literature citedAldridge, C. L., and M. S. Boyce. 2007. Linking
occurrence and fi tness to persistence: habitat-based approach for endangered greater sage-grouse. Ecological Applications 17:508–526.
Avian Power Line Interaction Committee (APLIC). 2015. Best management practices for electric utilities in sage-grouse habitat. Edison Electric Institute and APLIC. Washington, D.C., USA.
Barton, J. 2005. Energy policy act of 2005. Wash-ington, D.C., USA, <http://corridoreis.anl.gov/documents/docs/EnergyPolicyAct2005.pdf>. Accessed January 10, 2016.
Bechard, M. J., and J. K. Schmutz. 1995. Ferrugi-
nous hawk (Buteo regalis). No. 172 in A. Poole, editor. The Birds of North America Online. Ithaca: Cornell Lab of Ornithology, <http://bna.birds.cornell.edu/bna/species/172>. Accessed September 7, 2016.
Black and Veatch Corporation. 2010. Utah renew-able energy zone (UREZ) task force, phase II; zone identifi cation and scenario analysis. Final report. Utah Offi ce of Energy Development, Salt Lake City, Utah, USA.
Bolker, B. M., M. E. Brooks, C. J. Clark, S. W. Geange, J. R. Poulsen, M. H. H. Stevens, and J.-S. S. White. 2009. Generalized linear mixed models: a practical guide for ecology and evolution. Trends in Ecology and Evolution 24:127–135.
Boyce, M. S., P. R. Vernier, S. E. Nielsen, and F. K. Schmiegelow. 2002. Evaluating resource selection functions. Ecological Modeling 157:281–300.
Bureau of Land Management (BLM). 2012a. Record of decision for the Sigurd to Red Butte no. 2 345-kV transmission project. U.S. Depart-ment of the Interior, Cedar City Field Offi ce, Ce-dar City, Utah, USA,<http://www.blm.gov/pgda-ta/etc/medialib/blm/ut/cedar_city_fo/planning/sigredbutterod.Par.39757.File.dat/BLM_SRB_ROD_2012.pdf>. Accessed January 10, 2016.
Bureau of Land Management (BLM). 2012b. Appendix F – Compliance with WO IM 2012-043 greater sage-grouse interim management policies and procedures in fi nal environmental impact statement for the Sigurd to Red Butte no. 2 transmission project. Volume 3. U.S. De-partment of the Interior, Cedar City Field Offi ce, Cedar City, Utah, USA.
Burnett, A. C. 2013. Modeling habitat use of a fringe greater sage-grouse population at mul-tiple spatial scales. Thesis, Utah State Univer-sity, Logan, Utah, USA.
Burnham, K. P., and D. R. Anderson. 2002. Model selection and multimodel inference: a practi-cal information-theoretic approach. Second edition. Springer-Verlag, New York, New York, USA.
Carpenter, J., C. L. Aldridge, and M. S. Boyce. 2010. Sage-grouse habitat selection during winter in Alberta. Journal of Wildlife Manage-ment 74:1806–1814.
Collecte Localisation Satellites. 2014. Argos user’s manual. Collecte localisation satellites (CLS), Ramonville-Saint-Agne, France. <http://
185Transmission line construction • Hansen et al.
www.argos-system.org/manual/>. Accessed June 30, 2016.
Connelly, J. W., S. T. Knick, M. A. Schroeder, and S. J. Stiver. 2004. Conservation assessment of greater sage-grouse and sagebrush habitats. Un-published report. Western Association of Fish and Wildlife Agencies, Cheyenne, Wyoming, USA, <http://wgfd.wyo.gov/wtest/Departments/Wildlife/pdfs/SG_CONSVASSESSMENT0000688.pdf>. Accessed November 25, 2013.
Connelly, J. W., M. A. Schroeder, A. R. Sands, and C. E. Braun. 2000. Guidelines to manage sage grouse populations and their habitats. Wildlife Society Bulletin 28:967–985.
Dahlgren, D. K., T. A. Messmer, B. A. Crabb, R. T. Larsen, T. A. Black; S. N. Frey, E. T. Thacker, R. J. Baxter, J. D. Robinson, 2016. Seasonal movements of greater sage-grouse popula-tions in Utah: implications for species conser-vation. Wildlife Society Bulletin 40:288–300.
Dilts, T. E. 2015. Topography tools for ArcGIS 10.3, <http://www.arcgis.com/home/item.html?id=b13b3b40fa3c43d4a23a1a09c5fe96b9>. Accessed June 30, 2016.
Dwyer, J. F., and K. W. Doloughan. 2014. Testing systems of avian perch deterrents on electric power distribution poles in sagebrush habitat. Human–Wildlife Interactions 8:39–55.
Fedy, B. C., C. P. Kirol, A. L. Sutphin, and T. L. Maechtle. 2015. The infl uence of mitigation on sage-grouse habitat selection within an energy development fi eld. PLOS ONE 10(4): e0121603.
Fischer, R. A., A. D. Apa, W. L. Wakkinen, K. P. Reese, and J. W. Connelly. 1993. Nesting-area fi delity of sage-grouse in southeastern Idaho. Condor 95:1038–1041.
Gillian, J. K., E. K. Strand, J. W. Karl, K. P. Reese, and T. Laninga. 2013. Using spatial statistics and point-pattern simulations to as-sess the spatial dependency between greater sage-grouse and anthropogenic features. Wildlife Society Bulletin 37:301–310.
Gillies, C. S., M. Hebblewhite, S. E. Nielsen, M. A. Krawchuk, C. L. Aldridge, J. L. Frair, D. J. Saher, C. E. Stevens, and C. L. Jerde. 2006. Application of random eff ects to the study of resource selection by animals: random eff ects in resource selection. Journal of Animal Ecol-ogy 75:887–898.
Hansen, E. P. 2016. Infl uence of disturbance on greater sage-grouse habitat selection in south-
ern Utah. Thesis, Utah State University, Logan, Utah, USA.
Harju, S. M., M. R. Dzialak, R. C. Taylor, L. D. Hayden-Wing, and J. B. Winstead. 2010. Thresholds and time lags in eff ects of energy development on greater sage-grouse popula-tions. Journal of Wildlife Management 74:437–448.
Hemson, G., P. Johnson, A. South, R. Kenward, R. Ripley, and D. Macdonald. 2005. Are kernels the mustard? Data from global positioning sys-tem (GPS) collars suggests problems for ker-nel home-range analyses with least-squares cross-validation: kernel home-range analyses and LSCV problems. Journal of Animal Ecol-ogy 74:455–463.
Holloran, M. J., and S. H. Anderson. 2005. Spa-tial distribution of sage-grouse nests in rela-tively contiguous sagebrush habitat. Condor 107:742–752.
Hosmer, D. W., S. Lemeshow, and R. X. Sturdivant. 2013. Applied logistic regression. Third edition. John Wiley & Sons, Hoboken, New Jersey, USA.
Howe, K.B., P.S Coates, and D.J., Delehanty. 2014. Selection of anthropogenic features and vegetation characteristics by nesting common ravens in the sagebrush ecosystem. Condor 116:25–49.
Hurvich, C. M. and C. L. Tsai. 1989. Regression and time series model selection in small sam-ples. Biometrika 76:297-307.
Johnson, C. J., S. E. Nielsen, E. H. Merrill, T. L. McDonald, and M. S. Boyce. 2006. Resource selection functions based on use-availability data: theoretical motivation and evaluation methods. Journal of Wildlife Management 70:347–357.
Johnson, D. H. 1980. The comparison of usage and availability measurements for evaluating resource preference. Ecology 61:65–71.
Johnson, D. J., M. J. Holloran, J. W. Connelly, S. E. Hanser, C. L. Amundson, and S. T. Knick. 2011. Infl uences of environmental and anthro-pogenic features on greater sage-grouse pop-ulations, 1997-2007. Chapter 17 in Studies in Avian Biology, No. 38. University of California Press, Berkeley, California, USA.
Kie, J. G. 2013. A rule-based ad hoc method for selecting a bandwidth in kernel home-range analyses. Animal Biotelemetry 1:1–12.
Kochert, M. N., K. Steenhof, C. L. Mcintyre, and
186 Human–Wildlife Interactions 10(2)
E. H. Craig. 2002. Golden eagle (Aquila chry-saetos). No. 694 in A. Poole, editor. The Birds of North America Online. Ithaca: Cornell Lab of Ornithology, <http://bna.birds.cornell.edu/bna/species/684>. Accessed September 7, 2016.
LANDFIRE. 2010. LANDFIRE 1.2.0 existing veg-etation type layer. U.S. Department of Interior, <http://landfi re.cr.usgs.gov/viewer/>. Accessed December 4, 2014.
LANDFIRE. 2012. LANDFIRE 1.3.0 existing veg-etation type and existing vegetation height lay-ers. U.S. Department of Interior, <http://land-fi re.cr.usgs.gov/viewer/>. Accessed December 4, 2014.
Leu, M., S. E. Hanser, C. L. Aldridge, S. E. Nielsen, B. S. Cade, and S. T. Knick. 2011. A sampling and analytical approach to develop spatial dis-tribution models for sagebrush-associated spe-cies. Pages 88-111 in Hanser, S. E., M. Leu, S. T. Knick, and C. L. Aldridge, editors. Sagebrush ecosystem conservation and management: ecoregional assessment tools and models for the Wyoming Basins. Allen Press, Lawrence, Kansas, USA.
Manier, D. J., Z. H. Bowen, M. L. Brooks, M. L. Casazza, P. S. Coates, P. A. Deibert, S. E. Hanser, and D. H. Johnson. 2014. Conser-vation buff er distance estimates for greater sage-grouse- a review. U.S. Geological Sur-vey Open-File Report 2014-1239, Reston, Virginia, USA, <http://dx.doi.org/10.3133/ofr20141239.>. Accessed June 30, 2016.
Manly, B. F. J., L. L. McDonald, D. L. Thomas, T. L. McDonald, and W. P. Erickson. 2002. Re-source selection by animals: statistical design and analysis for fi eld studies. Second edition. Kluwer Academic Publishers, Norwell, Massa-chusetts, USA.
Messmer, T. A., R. Hasenyager, J. Burruss, and S. Liguori. 2013. Stakeholder contempo-rary knowledge needs regarding the poten-tial eff ects of tall-structures on sage-grouse. Human–Wildlife Interactions 7:273–298.
Microwave Telemetry, Inc. 2016. Solar Argos/GPS PTT-100s. Columbia, Maryland, USA, <http://www.microwavetelemetry.com/bird/solarA-rgosGPS.cfm>. Accessed January 18, 2016.
Nonne, D., E. Blomberg, and J. Sedinger. 2013. Dynamics of greater sage-grouse (Centrocer-cus urophasianus) populations in response to transmission lines in central Nevada. Prog-ress report: year 10, <http://www.ag.unr.
edu/sedinger/Sage-grouse/Progress%20Re-port%202013%20-%20Final.pdf>. Accessed December 4, 2015.
Prather, P. R., and T. A. Messmer. 2010. Raptor and corvid response to power distribution line perch deterrents in Utah. Journal of Wildlife Management 74:796–800.
Schroeder, M. A., C. L. Aldridge, A. D. Apa, J. R. Bohne, C. E. Braun, S. D. Bunnell, J. W. Connelly, P. A. Deibert, S. C. Gardner, M. A. Hilliard, G. D. Kobriger, S. M. McAdam, C. W. McCarthy, J. J. McCarthy, D. L. Mitchell, E. V. Rickerson, and S. J. Stiver. 2004. Dis-tribution of sage-grouse in North America. Condor 106:363–376.
Slater, S. J., and J. P. Smith. 2010. Eff ectiveness of raptor perch deterrents on an electrical trans-mission line in southwestern Wyoming. Journal of Wildlife Management 74:1080–1088.
Smith, K. T., C. P. Kirol, J. L. Beck, and F. C. Blomquist. 2014. Prioritizing winter habitat quality for greater sage-grouse in a landscape infl uenced by energy development. Ecosphere 5:1–20.
State of Utah. 2013. Conservation plan for great-er sage-grouse in Utah. Salt Lake City, Utah, USA, <http://wildlife.utah.gov/uplandgame/sage-grouse/pdf/greater_sage_grouse_plan.pdf>. Accessed June 30, 2016.
Swanson, C. C., M. A. Rumble, T. W. Grovenburg, N. W. Kaczor, R. W. Klaver, K. M. Herman-Brunson, J. A. Jenks, and K. C. Jensen. 2013. Greater sage-grouse winter habitat use on the eastern edge of their range. Journal of Wildlife Management 77:486–494.
U.S. Census Bureau. 2012. 2010 Census of popu-lation and housing, population and housing unit counts. United States Census Bureau, U.S. Government Printing Offi ce. Washington D.C., USA, <http://www.census.gov/prod/cen2010/cph-2-46.pdf>. Accessed January 18, 2016.
U.S. Fish and Wildlife Service. 2010. Endangered and threatened wildlife and plants; 12-month fi ndings for petitions to list the greater sage-grouse (Centrocercus urophasianus) as threat-ened or endangered. Department of the Inte-rior; Federal Register, Washington D.C., USA.
Utah Division of Wildlife Resources (UDWR). 2014. 2014 Utah SGMAs. Utah Division of Wildlife Resources index of available GIS data. <http://dwrcdc.nr.utah.gov/ucdc/downloadgis/disclaim.htm>. Accessed December 22, 2014.
187Transmission line construction • Hansen et al.
Utah Wildlife in Need (UWIN©). 2010. Contem-porary knowledge and research needs re-garding the potential eff ects of tall structures on sage-grouse (Centrocercus urophasianus and C. minimus), <http://www.aplic.org/up-loads/fi les/2639/TallStructuresReportSeptem-ber202010.pdf>. Accessed June 30, 2016.
Wakkinen, W. L., K. P. Reese, J. W. Connelly, and R. A. Fischer. 1992. An improved spotlighting technique for capturing sage grouse. Wildlife Society Bulletin 20:425–426.
Walker, B. L., D. E. Naugle, and K. E. Doherty. 2007. Sage-grouse populations and energy development. Journal of Wildlife Management 71:2644–2654.
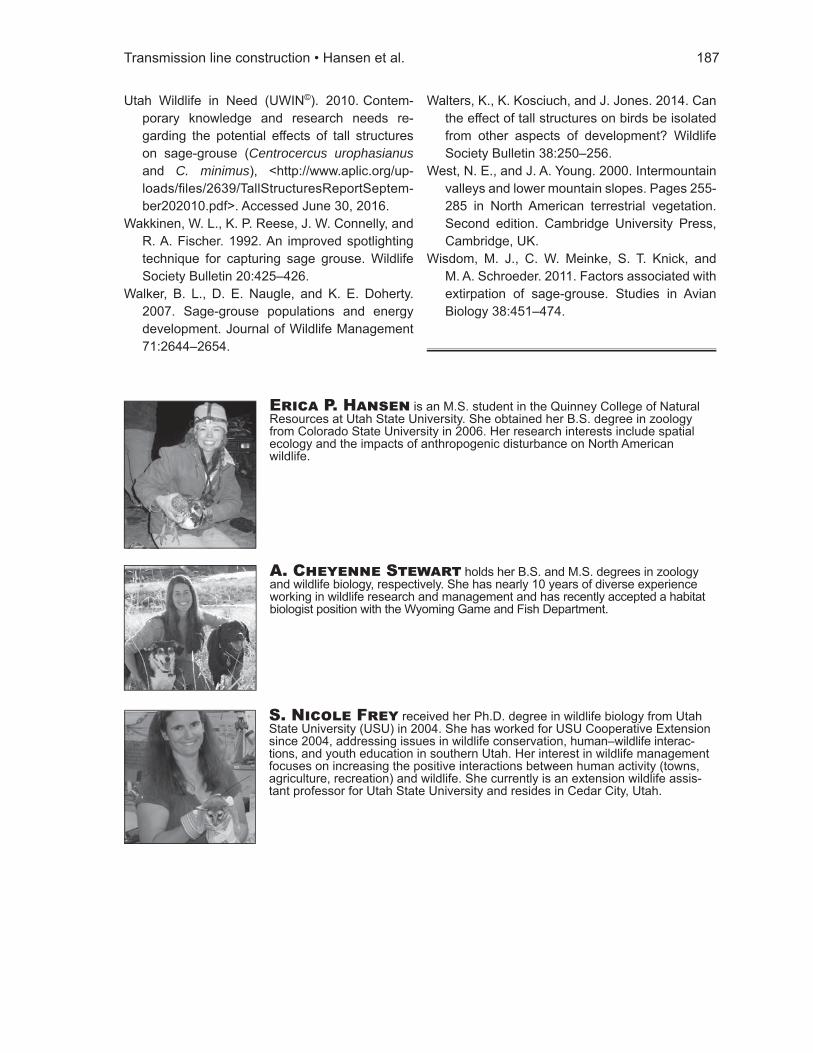
E P. H is an M.S. student in the Quinney College of Natural Resources at Utah State University. She obtained her B.S. degree in zoology from Colorado State University in 2006. Her research interests include spatial ecology and the impacts of anthropogenic disturbance on North American wildlife.
A. C S holds her B.S. and M.S. degrees in zoology and wildlife biology, respectively. She has nearly 10 years of diverse experience working in wildlife research and management and has recently accepted a habitat biologist position with the Wyoming Game and Fish Department.
S. N F received her Ph.D. degree in wildlife biology from Utah State University (USU) in 2004. She has worked for USU Cooperative Extension since 2004, addressing issues in wildlife conservation, human–wildlife interac-tions, and youth education in southern Utah. Her interest in wildlife management focuses on increasing the positive interactions between human activity (towns, agriculture, recreation) and wildlife. She currently is an extension wildlife assis-tant professor for Utah State University and resides in Cedar City, Utah.
Walters, K., K. Kosciuch, and J. Jones. 2014. Can the eff ect of tall structures on birds be isolated from other aspects of development? Wildlife Society Bulletin 38:250–256.
West, N. E., and J. A. Young. 2000. Intermountain valleys and lower mountain slopes. Pages 255-285 in North American terrestrial vegetation. Second edition. Cambridge University Press, Cambridge, UK.
Wisdom, M. J., C. W. Meinke, S. T. Knick, and M. A. Schroeder. 2011. Factors associated with extirpation of sage-grouse. Studies in Avian Biology 38:451–474.


![Veljo Tormis and Urve Lippus: A Legacy...This infl uence is evident in Kolm Betti Alveri luuletust [Three poems by Betty Alver] for male choir (1974). Looking through the score of](https://img.pdfslide.us/doc/110x75/60db1da65ce1000ad648de21/veljo-tormis-and-urve-lippus-a-legacy-this-infl-uence-is-evident-in-kolm-betti.jpg)