Embed Size (px)
Citation preview

CONSERVATION PLANNING WITH CASE STUDIES
Texas Mussel Workshop 14-15 Nov 2017
Dave Smith U.S. Geological Survey Leetown Science Center

Collaborative Conservation 2

Two approaches to decision making*
Advocacy Inquiry
Concept of decision making a contest collaborative problem solving
Purpose of discussion persuasion and lobbying testing and evaluating
Participants’ role spokespeople critical thinkers
Patterns of Behavior strive to persuade others defend your position downplay weakness
present balanced arguments remain open to alternatives accept constructive criticism
Minority views discouraged or dismissed cultivated and valued
Outcome winners and losers collective ownership
*Garvin, DA, and MA Roberto. 2001. What you don’t know about making decisions. Pg.80 in Harvard Business Review. 2013. On making smart decisions. Harvard Business School Publishing.
3

Outline 4
Collaborative decision process Build and maintain trust Joint learning Emphasize objectives Decompose the problem for analysis
Case studies Estuarine restoration – complex multi-stakeholder objectives Eel migration and power generation – search for win-win Upper Tennessee River Basin – knapsack problem applied
to conservation of imperiled aquatic species
Completely
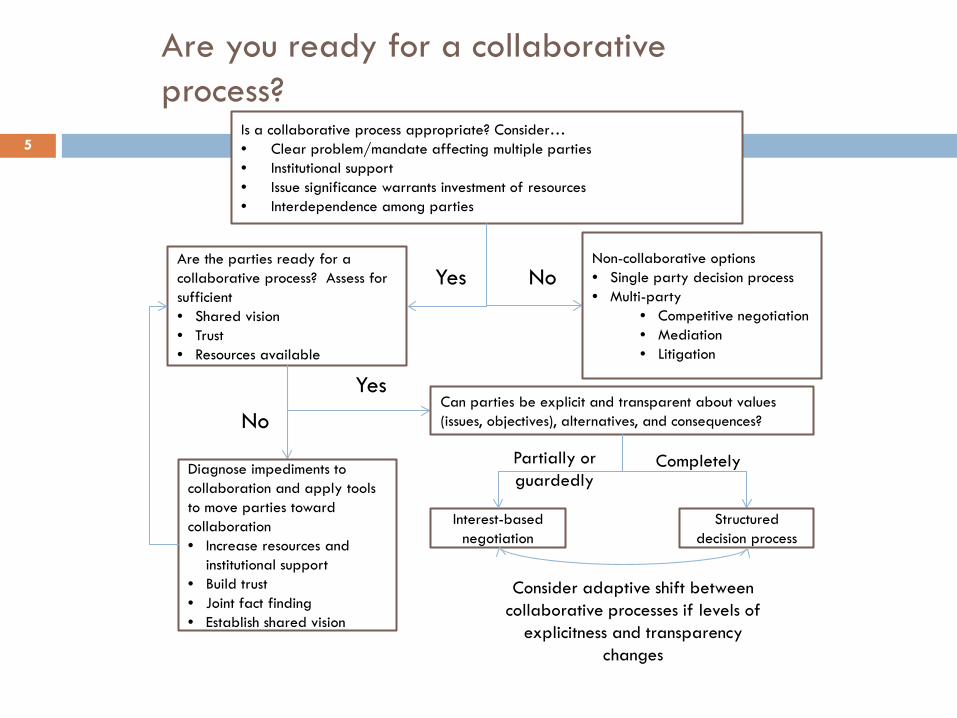
Are you ready for a collaborative process?
Is a collaborative process appropriate? Consider… • Clear problem/mandate affecting multiple parties • Institutional support • Issue significance warrants investment of resources • Interdependence among parties
Non-collaborative options • Single party decision process • Multi-party
• Competitive negotiation • Mediation • Litigation
No Yes
Are the parties ready for a collaborative process? Assess for sufficient • Shared vision • Trust • Resources available
Diagnose impediments to collaboration and apply tools to move parties toward collaboration • Increase resources and
institutional support • Build trust • Joint fact finding • Establish shared vision
No
Yes Can parties be explicit and transparent about values (issues, objectives), alternatives, and consequences?
Interest-based negotiation
Structured decision process
Partially or guardedly
Consider adaptive shift between collaborative processes if levels of
explicitness and transparency changes
5

Decision process
Problem decomposition Values-focused thinking
Gregory et al. 2012. Structured Decision
Making: A Practical Guide to Environmental Choices. Wiley-Blackwell
Clarify the
decision context
Define objectives
and measures
Develop alternatives
Estimate consequences
Evaluate trade-offs and select
Implement, monitor,
and review
6

Decision processes and conflict 7

Gannon, Smith, Eaton. 2016. Managing estuary restoration: an
adaptive framework under uncertainty and risk. INFORMS Annual Meeting, Nashville, TN
Restoration of the Herring River estuary on Cape Cod
8

Herring River estuary: Cape Cod, MA 9
1100-acre in Cape Cod National Seashore and Wellfleet and Truro Chequessett Neck Road dike in 1909
• Current tidal restriction • Low-lying private property • Economically valuable oyster
industry • Native salt marsh • Invasive phragmites

Herring River: On-Going Effects of Tidal Restriction
Degraded Habitat for
River Herring;
Acidification
Poor Water Quality/Low Dissolved Oxygen = Fish Kills
Loss of Estuarine
Productivity
Fecal Coliform Bacteria Pollution = Closed Shellfish Areas

Problem statement
CERF 2017
11
The Executive Council comprised of Cape Cod National Seashore and towns of Truro and Wellfleet
with input from technical and stakeholder advisory committees will decide how to operate tidal gates at the new CNR dike and apply 2o actions to restore the Herring River estuary and minimize adverse impacts over some finite length of time (likely <25 years)

Fundamental objectives (# of subobjectives)
CERF 2017
Restore Herring River Estuary
Restore Hydrography
(7)
Restore Ecological Function/Integrity
(6)
Minimize Adverse Impacts
(13)
Maximize Ecosystem Services
(6)
Minimize Cost (3)
12

Alternative policies for tidal gate management
CERF 2017
13
Structured around restoration through time Policies varied by Time to reach a restored hydrograph, Pace (e.g., slow then fast vs fast then slow) Variations to move sediment or enhance veg growth

Suite of tools 14

Sensitivity Analysis – a search for robust policies
Across 212 combinations of prediction confidence, utility, and weighting schemes Alternative Policies
Rank
5-yr 15-yr 25-yr SF 15yr
2GS Sedi-ment
1 0.67 0.16 0.13 0.01 0 0.03
2 0.04 0.73 0.05 0.01 0.07 0.1
3 0.01 0.11 0.04 0.01 0.78 0.04
4 0.05 0 0.16 0.21 0.14 0.43
5 0.2 0 0.44 0.21 0.01 0.14
6 0.03 0 0.18 0.54 0 0.25
Frequencies
15

Smith, D. R., P. L. Fackler, S. M. Eyler, L Villegas Ortiz, S. A. Welsh. 2017.
Optimization of decision rules for hydroelectric operation to reduce both eel mortality and unnecessary turbine shutdown: a search for a win-win solution. Rivers Research and Applications DOI: 10.1002/rra.3182
Migrating silver eels and hydropower generation
16

Shenandoah River 17

Search for a win-win solution 18

Smith, D. R., R. S. Butler, J. W. Jones, C. M. Gatenby, R. Hylton, M. Parkin, and C. Shultz. 2016. Developing a landscape-scale, multi-species, and cost-efficient conservation strategy for imperiled aquatic species in the Upper Tennessee River Basin, USA. Aquatic Conservation: Marine and Freshwater Ecosystems https://doi.org/10.1002/aqc.2785
Imperiled aquatic species in the Upper Tennessee River Basin
19

Large geographic area (22,360 square miles primarily in VA, NC, and TN)

Mussels and Fishes of Upper Tennessee River Basin INHS
Mussel Species Known: 83 Extant Endangered: 24
Fish Species Known: 172 Extant endangered: 12
Endangered Slabside Pearlymussel Endangered Slender Chub

Current Conditions: Fragmentation and Multiple Stressors…..

Why Develop the Strategy?
Complex situation: Limited FWS staff, many partners, limited budgets, extensive
coordination, large number of species facing a variety of threats, large geographic area
Aspire to provide a cost effective approach to guide
conservation and management of imperiled freshwater fish and mussel species in the UTRB
• FWS team sought to determine which actions to emphasize to best achieve recovery of these species in the UTRB

Challenges to strategy development
Uncertainty in species response to management actions Paucity of data available to evaluate potential
consequences
Budgetary constraints Scale expected conservation benefits from local to
landscape and from single species to multiple species Seek a strategy that
Has greatest chance to achieve conservation objectives Robust to uncertainties in conservation outcomes

Objectives and measures

Alternative approaches Management Actions Alternative Approaches
Type Task Status
Quo Habitat
Emphasis Population Emphasis
Population Management
• Implement ESA Section 7 & 10 • Protect or establish populations • Conduct status assessment • Increase extant populations • Establish new populations • Manage captive populations
0 (100)
− (85)
+ (159)
Habitat Management
• BMPs for habitat mgmt • Land acquisition and easements • Restoration of habitat
0 (100)
+ (136)
− (82)
Monitoring & Research
• Life history • Popn and habitat monitoring • Evaluate and monitor threats • Genetics monitoring & research • Population viability analyses • Evaluate habitat for reintroductions • Propagation and captive management
research • Evaluate ecosystem services
0 (100)
0 (109)
+ (191)
Communication & Partnerships
• Outreach • Work with partners and industry • Intra-agency
0 (100)
+ (169)
+ (131)

Estimate consequences
Existing data provided the species current condition Elicited knowledge and judgment from experts in imperiled fish and
mussel to project consequences over 20 years
Species-specific abundance trend and distribution 12-digit HUC for fishes Important stream reaches for mussels
Habitat quality at 8-digit HUC Genetic diversity Operational costs
Scaled up to basin scale for fishes and mussels

Evaluate trade-offs
Objective Sub-objective Direction
Alternative Approaches
Status Quo
Habitat Emphasis
Popn Emphasis
Species persistence and
viability
Fish abundance trend Maximize 0.04 0 0.46
Fish distribution Maximize 7.83 8 8.92
Mussel abundance trend Maximize -0.13 -0.04 0.58
Mussel distribution Maximize 4.09 4.09 7.83 Genetic diversity Maximize -0.17 -0.17 0.52 Habitat quality Maximize 2.73 3.34 2.68
Operating costs Staff Minimize 9.5 11.5 11.5 Management costs Minimize 4.8 5.4 4.7

Sensitivity analysis

Prioritization: species and watersheds
Conservation benefits are not likely to be achieved equally among all species and watersheds.
Prioritize imperiled fish and mussels based on degree of imperilment, expected gain in abundance trend and distribution, and management costs.
Prioritize watersheds at HUC8 level based on richness of imperiled species and feasibility of implementing habitat management Gain in abundance and distribution
Man
agem
ent c
ost
High imperilment
Med/Low imperilment
Highest priorityLowest priority
Both
Low
OneNeither
Med
HighHigh
Med
Low
Med
High

Species Prioritization – Imperiled Fishes
Prioritization variables included degree of imperilment, expected conservation benefit from management actions, and management cost accrued over the next 20 years.
Expected Conservation
Benefit Relative to Current Status Management Cost Priority
Common Name
Degree of Imperilment
Net Gain in Abundance
Trend Net Gain in Distribution
Cost of Propagation
Cost of Reintroduction
Marbled darter High 1.5 0.3 Low Low 1 Citico darter High 1.0 0.5 Low Low 1 Duskytail darter High 1.0 0.5 Low Medium 2 Laurel dace High 1.0 0.0 Medium Low 2 Pygmy madtom High 0.5 2.0 Medium Medium 3 Smoky madtom High 0.0 1.0 Medium Medium 3 Spotfin chub Low 1.0 0.1 Medium High 4 Yellowfin madtom Medium 0.0 0.1 Low Medium 4 Sicklefin redhorse Low 0.5 0.0 High High 10 Chucky madtom High 0.0 0.0 High Medium 12 Slender chub High 0.0 0.0 High High 15 Snail darter Low 0.0 0.0 High Medium to High 15

Watershed Prioritization
8-digit HUC Species
Richness Standardized Richness Feasibility Standardized
Feasibility Weighted Average
Upper Clinch 24 1.00 2.50 0.7 0.90 Powell 16 0.65 2.33 0.6 0.65 Nolichucky 7 0.26 2.67 0.8 0.47 Upper Little Tennessee 4 0.13 3.00 1.0 0.45 Hiwassee 7 0.26 2.40 0.7 0.41 Tuckasegee 2 0.04 3.00 1.0 0.40 North Fork Holston 6 0.22 2.33 0.6 0.37 Lower Little Tennessee 6 0.22 2.33 0.6 0.37 Emory 3 0.09 2.60 0.8 0.35 Sequatchie 3 0.09 2.40 0.7 0.31 Upper French Broad 1 0.00 2.50 0.7 0.27 Pigeon 1 0.00 2.50 0.7 0.27 South Fork Holston 4 0.13 2.00 0.5 0.25 Lower French Broad 4 0.13 2.00 0.5 0.25 Holston 5 0.17 1.67 0.3 0.21 Watts Bar Lake 6 0.22 1.40 0.1 0.18 Middle Tennessee-Chickamauga 6 0.22 1.25 0.0 0.15 Ocoee 1 0.00 1.80 0.3 0.13 Lower Clinch 1 0.00 1.17 0.0 0.00
Species richness and management feasibility values were standardized and weighted to provide weighted average scores for prioritization.

Overview
Conservation Strategy Emphasize population
management, Prioritize imperiled fish and mussel
species for focused population management, and
Prioritize watersheds for focused habitat management.
Guides project development. Not a rigid management prescription.
Flexibility will help FWS better integrate its efforts internally and with those of partners.
Monitor effectiveness, periodic review, and adapt.

Ongoing or recent SDM efforts on conservation of freshwater mussels
34
Imperiled species in the Roanoke-Dan Basin, including James spinymussel and green floater (Jamie Roberts, Paul Angermeier, Dave Smith)
Range-wide conservation of brook floater (Sean Sterrett and Alison Roy)
Imperiled aquatics in the Upper Tennessee River Basin, including Cumberland combshell and oyster mussel (Dave Smith and Andrew Henderson/Bob Butler)
Dwarf wedgemussel in North Carolina (Dave Smith and Sarah McCrae)
Illinois Natural History Survey mussel restoration (Alison Stodola)