Embed Size (px)
Citation preview

Conservation, Convergence, and Divergence ofLight-Responsive, Circadian-Regulated, andTissue-Specific Expression Patterns duringEvolution of the Arabidopsis GATA Gene Family1[W][OA]
Iain W. Manfield, Paul F. Devlin, Chih-Hung Jen2, David R. Westhead, and Philip M. Gilmartin*
Centre for Plant Sciences, Institute for Integrative and Comparative Biology (I.W.M., P.M.G.), and Institutefor Molecular and Cellular Biology (C.-H.J., D.R.W.), Faculty of Biological Sciences, University ofLeeds, Leeds, LS2 9JT, United Kingdom; and School of Biological Sciences, Royal Holloway,University of London, Egham, TW20 0EX, United Kingdom (P.F.D.)
In vitro analyses of plant GATA transcription factors have implicated some proteins in light-mediated and circadian-regulatedgene expression, and, more recently, the analysis of mutants has uncovered further diverse roles for plant GATA factors. Tofacilitate function discovery for the 29 GATA genes in Arabidopsis (Arabidopsis thaliana), we have experimentally verified genestructures and determined expression patterns of all family members across adult tissues and suspension cell cultures, as wellas in response to light and signals from the circadian clock. These analyses have identified two genes that are stronglydevelopmentally light regulated, expressed predominantly in photosynthetic tissue, and with transcript abundance peakingbefore dawn. In contrast, several GATA factor genes are light down-regulated. The products of these light-regulated genes arecandidates for those proteins previously implicated in light-regulated transcription. Coexpression of these genes with well-characterized light-responsive transcripts across a large microarray data set supports these predictions. Other genes showadditional tissue-specific expression patterns suggesting novel and unpredicted roles. Genome-wide analysis usingcoexpression scatter plots for paralogous gene pairs reveals unexpected differences in cocorrelated gene expression profiles.Clustering the Arabidopsis GATA factor gene family by similarity of expression patterns reveals that genes of recent descentdo not uniformly show conserved current expression profiles, yet some genes showing more distant evolutionary origins haveacquired common expression patterns. In addition to defining developmental and environmental dynamics of GATAtranscript abundance, these analyses offer new insights into the evolution of gene expression profiles following geneduplication events.
Plant GATA-binding proteins were first identifiedduring studies on light-responsive promoters (Lamand Chua, 1989; Buzby et al., 1990; Gilmartin et al., 1990;Lam et al., 1990; Schindler and Cashmore, 1990; Sarokinand Chua, 1992; Borello et al., 1993) following theidentification of conserved GATA motifs within pro-moters that were up-regulated in response to light,
including RbcS and Cab (Dean et al., 1985; Grob andStuber, 1987; Castresana et al., 1988; Giuliano et al.,1988; Gidoni et al., 1989; Gilmartin et al., 1990; Arguello-Astorga and Herrera-Estrella, 1998). Subsequent stud-ies implicated these elements in the regulation ofcircadian-responsive genes, and a number of in vitroanalyses using plant nuclear extracts led to the defini-tion of several proteins with specificity for GATAelements (Carre and Kay, 1995). The presence of se-quences within light-responsive promoters matchingthe GATAAGG motif previously defined as the bindingsite for the fungal GATA-binding proteins AreA (Kudlaet al., 1990) and Nit2 (Fu and Marzluf, 1990) and thevertebrate GATA transcription factors (Evans et al.,1988; Evans and Felsenfeld, 1989; Tsai et al., 1989; Orkin,1992; Merika and Orkin, 1993) created the possibilitythat plant GATA-binding proteins could also be type IVzinc finger proteins (Gilmartin et al., 1990; Daniel-Vedele and Caboche, 1993; Teakle and Gilmartin, 1998).
The identification of a gene, Ntl1, from tobacco(Nicotiana tabacum) encoding a plant type IV zinc fin-ger protein following degenerate PCR (Daniel-Vedeleand Caboche, 1993) provided the first evidence for
1 This work was supported by the European Union Framework VRegulatory Gene Initiative in Arabidopsis consortium and by theBiotechnology and Biological Sciences Research Council.
2 Present address: Genome Research Centre (VYMGC), NationalYang-Ming University, 155 Li-Nong St., Taipei City 112, Taiwan.
* Corresponding author; e-mail [email protected]; fax0044–113–343–3144.
The author responsible for distribution of materials integral to thefindings presented in this article in accordance with the policydescribed in the Instructions for Authors (www.plantphysiol.org) is:Philip M. Gilmartin ([email protected]).
[W] The online version of this article contains Web-only data.[OA] Open Access articles can be viewed online without a sub-
scription.www.plantphysiol.org/cgi/doi/10.1104/pp.106.090761
Plant Physiology, February 2007, Vol. 143, pp. 941–958, www.plantphysiol.org � 2007 American Society of Plant Biologists 941 www.plantphysiol.orgon May 31, 2018 - Published by Downloaded from
Copyright © 2007 American Society of Plant Biologists. All rights reserved.

this class of protein in plants. Subsequent expressedsequence tag (EST) and genome sequence data re-vealed the presence of a gene family of related se-quences in Arabidopsis (Arabidopsis thaliana; Teakleand Gilmartin, 1998). The encoded proteins shareextensive sequence similarity over the zinc fingerdomain to animal and fungal GATA factors but differfrom typical animal GATA factors that typically con-tain two Cx2C-x17-Cx2C zinc finger domains by havinga single zinc Cx2C-x18-Cx2C zinc finger (Teakle andGilmartin, 1998). This configuration is also presentwithin fungal GATA factors WC1 (Ballario et al., 1996)and WC2 (Linden and Macino, 1997) involved in bluelight and circadian responses. Subsequently, an addi-tional plant-specific zinc finger configuration, Cx2C-x20-Cx2C, was identified in Arabidopsis and rice(Oryza sativa; Nishii et al., 2000; Riechmann et al.,2000; Jeong and Shih, 2003; Reyes et al., 2004), and fullgenome sequence analysis confirms the absence of theanimal and fungal type Cx2C-x17-Cx2C zinc fingerdomains in plants (Arabidopsis Genome Initiative,2000; Riechmann et al., 2000). In vitro binding studiesusing recombinant proteins have demonstrated thespecificity of this class of zinc finger protein for DNAsequences containing GATA motifs (Teakle et al., 2002;Jeong and Shih, 2003; Sugimoto et al., 2003).
Although plant GATA factors were initially im-plicated in light-mediated (Castresana et al., 1988;Giuliano et al., 1988; Buzby et al., 1990; Donald andCashmore, 1990; Gilmartin et al., 1990; Lam et al., 1990;Schindler and Cashmore, 1990; Borello et al., 1993) andcircadian-responsive gene expression (Carre and Kay,1995; Teakle and Kay, 1995), they have also beenpredicted to play a role in the control of nitrogen me-tabolism (Daniel-Vedele and Caboche, 1993; Bi et al.,2005) based on the involvement of GATA factors inthe regulation of nitrogen balance in fungi (Fu andMarzluf, 1990; Kudla et al., 1990; Scazzocchio, 2000).However, there is now a growing body of data, bothfrom analysis of mutant phenotypes arising fromdisruption of GATA genes and from expression andbioinformatic analyses of members of this gene familyin wild-type plants, which connects GATA factors to awide range of different biological functions.
The Arabidopsis genome contains 29 GATA factorgenes (Riechmann et al., 2000; this article). Mutationsarising from disruption or overexpression of only fourof these genes have so far been reported. These studieshave identified effects on a range of processes; the ZIM(GATA25) overexpression phenotype shows alteredcell elongation (Nishii et al., 2000; Shikata et al., 2004),mutation of HANABU TARANU (HAN; GATA18) inthe han mutant shows defects in flower and shootapical meristem development (Zhao et al., 2004), anddisruption of BME3 (GATA8) shows defects in seedgermination (Liu et al., 2005). Mutation of GNC (GATA21;Bi et al., 2005) reduces chlorophyll levels and producesdefects in regulation of expression of a range of genesinvolved in sugar metabolism. Interestingly, expres-sion of GNC is nitrate inducible (Bi et al., 2005). Al-
though some of these effects involve light-regulatedprocesses, none of the currently available evidenceconclusively implicates any of these GATA genes askey regulators of photosynthetic gene expression.
With the availability of near full-genome coveragemicroarray platforms and extensive publicly availablemicroarray data sets representing a broad spectrum ofgrowth conditions and mutants, it is possible to iden-tify changes in transcript abundance for those GATAfactor genes represented on the arrays. In addition,Web-based tools, such as NASCArray tools, Geneves-tigator, and others, provide opportunities for data min-ing to characterize expression patterns of individualGATA factor genes (Craigon et al., 2004; Zimmermannet al., 2004; Jen et al., 2006; Manfield et al., 2006) thatmay provide insight into potential biological function.This approach has been used previously to predictroles for other poorly characterized genes in secondarycell wall thickening, leading to the identification ofmutant phenotypes (Persson et al., 2005). Coexpres-sion analysis tools such as the Arabidopsis Coexpres-sion Tool (ACT; Jen et al., 2006), in conjunction withtools such as Genevestigator (Zimmermann et al.,2004), can therefore be used to identify informationfacilitating gene function prediction. However, only 21of the 29 GATA genes are represented by probe sets onthe Affymetrix ATH1 array that is the source of thedata used by NASCArray tools, Genevestigator, andACT. Similarly, some of the GATA factor genes are notrepresented in the extensive datasets generated byMassively Parallel Signature Sequencing (Meyers et al.,2004) and are therefore not amenable to bioinformaticsanalysis of expression patterns.
Bioinformatic analysis of the Arabidopsis GATAfamily (Reyes et al., 2004) has provided insight intothe evolutionary relationships of the different GATAfamily members, but experimentally confirmed genestructures are not available for the majority of thesegenes. As a prerequisite for a comprehensive func-tional genomics analysis of the Arabidopsis GATAfactors, we analyzed the entire GATA gene family toexperimentally confirm predicted gene structures, in-cluding definition of 5# and 3# untranslated regions(UTRs). The identification of transcription start sitesby 5# RACE and discovery of introns within several 5#UTR sequences have provided experimental confirma-tion of the location of upstream regulatory sequences.In addition, as part of our on-going studies to definebiological functions for members of this family, wehave undertaken gene-specific expression analysis us-ing quantitative PCR (qPCR) with different tissues andgrowth conditions to obtain an integrated expressionprofile for the whole family. These data complementextensive bioinformatic analysis of GATA expressionprofiles for those genes represented on the AffymetrixATH1 array and provide new insights into the biolog-ical significance of several members of this gene fam-ily. These results are used to elucidate the divergenceand convergence of expression profiles following geneand genome duplications.
Manfield et al.
942 Plant Physiol. Vol. 143, 2007 www.plantphysiol.orgon May 31, 2018 - Published by Downloaded from
Copyright © 2007 American Society of Plant Biologists. All rights reserved.

RESULTS
Defining Membership of the GATA Factor Family
A number of families of zinc finger transcriptionfactors containing a C2-C2 zinc-binding domain havebeen defined in plants, including the CONSTANSand CONSTANS-LIKE family (Griffiths et al., 2003),the Dof family, which includes DAG1 and DAG2(Gualberti et al., 2002), and the GATA family (Teakleand Gilmartin, 1998). These families of proteins con-tain members that share some common features, forexample, similar spacing between the paired Cys res-idues, and this has sometimes resulted in the consid-eration of members of different families under thegeneral term GATA factors (e.g. Putterill et al., 1995;Nemoto et al., 2003; Umemura et al., 2004). However,for this study, we used conserved features of GATAfactor family members across all kingdoms (Lowryand Atchley, 2000) to identify all GATA factor genefamily members within the Arabidopsis genome. Thecriteria for inclusion based on the zinc finger config-uration C-x2-C-x18/20-C-x2-C are: (1) the presence oftwo pairs of Cys residues within the predicted zincfinger domain that are each separated by two aminoacids; (2) a loop of 18 or 20 amino acids between thetwo pairs of Cys residues; (3) conservation of the aminoacid sequence LCNACG around the second Cys pair;and (4) the presence of conserved TPQWR or TPMMRmotifs within the X18/20 loop.
Table I presents a comparison of selected amino acidsequences from plant, animal, and fungal GATA factorsand highlights differences between the CONSTANSand Dof zinc finger configuration. By these criteria,GATA29 (At3g20750; Table I) is the most divergentgene we consider to encode a GATA factor even thoughthe spacing between the first Cys pair is four aminoacids rather than the classical two. Gene At4g16141(Table I) has been considered by some (Riechmannet al., 2000; Bi et al., 2005) to be a GATA factor. How-ever, this assessment would appear to be based solelyon the presence of the LCNACG motif; it does notmatch any of the other defined criteria, and we havetherefore excluded it from consideration as a GATAfactor. Similarly, At3g17660, used as an outgroup inphylogenetic analyses (Reyes et al., 2004), lacks thenecessary motifs for inclusion in the family (Table I).Our bioinformatics analyses resulted in the identifica-tion of 29 members of the GATA gene family. Duringthe course of our work, similar database searches werereported (Jeong and Shih, 2003), and we have adoptedthe nomenclature defined by these authors for ourexperimental structure and expression analysis of theGATA factor family.
Gene Structures
Bioinformatic analysis of GATA factor genes ingenome sequence has been used to predict transcrip-tion units, including the location of introns (Reyes et al.,2004), but to investigate gene function, accurate and
experimentally defined gene structures are needed toconfirm transcription start sites, as well as to confirmintron splice junctions and delineate 5# and 3# UTRs tofacilitate identification of regulatory sequence motifs.
We used EST database sequence information, whereavailable, to assemble full-length cDNA sequences forthe Arabidopsis GATA genes. No cDNA sequence wasavailable for seven of the predicted genes, and 5# and3# cDNA end sequence was incomplete for eight andnine other genes, respectively. We therefore used re-verse transcription (RT)-PCR with RNA from a rangeof tissues to confirm or identify exon-intron bound-aries and performed 5# and 3# RACE-PCR to determinethe limits of the transcription unit for those geneswhere full-length EST sequences were unavailable.These analyses identified the transcription start andend points, as well as intron splice junctions, for genefamily members. Sequences have been deposited atGenBank under accession numbers DQ875127 toDQ875134. In the case of GATA14, we were unable toobtain any 5# UTR data to confirm the transcriptionstart site of this gene, and for GATA16, we were un-able to obtain 3# UTR information. However, cDNAsequences were identified for all genes, providingevidence that therefore there are no untranscribedpseudogenes in the family. Assembled gene structuresfor the GATA genes are presented in Figure 1. Thephylogenetic relationships of the different family mem-bers, as defined previously (Reyes et al., 2004), are re-presented diagrammatically.
Our analyses have identified features within thegenes that could not have been predicted using insilico analysis alone, including introns within the 5#UTRs of 10 of the GATA genes, as well as the absence ofa predicted short exon in GATA13 (Reyes et al., 2004;Fig. 1). We have not identified any alternative splicingof GATA transcripts, although one gene, GATA28,features a nonconsensus donor-acceptor splice junc-tion, GC-AG. A number of GATA genes contain shortupstream open reading frames (suORFs) in the 5# UTRin addition to motifs involved in modulating RNAstability and translation (Supplemental Table S1). Theaverage lengths of GATA 5# leader and 3# UTR se-quences, 153 6 98 nucleotides (nt) and 217 6 90 nt,respectively, are similar to transcriptome averages of125 nt and 248 nt (Kawaguchi and Bailey-Serres, 2005).Such information and knowledge of 5# leader intronsize and position are prerequisites for the delineationof promoter elements and construction of promoter-reporter constructs. These analyses will also informsearches of T-DNA insertion lines to identify disrup-tions within transcription units as well as support insilico predictions of transcription regulatory motifs.
Gene Expression Patterns
Comprehensive microarray data sets are availablefor some members of the GATA gene family, but sev-eral of the GATA factor genes (indicated by asterisksin Table II) are not represented on the Affymetrix
Arabidopsis GATA Family Gene Expression Patterns
Plant Physiol. Vol. 143, 2007 943 www.plantphysiol.orgon May 31, 2018 - Published by Downloaded from
Copyright © 2007 American Society of Plant Biologists. All rights reserved.

ATH1 microarray. Gene-specific confirmation of mi-croarray expression data and in-depth analyses onindividual genes, using, for example, northern and insitu expression analysis, is available for a very limitednumber of genes in the GATA family. Phylogeneticanalysis of GATA factor genes based on protein se-quence data has identified four subfamilies (Reyeset al., 2004). However, these bioinformatic analyses donot provide any insight into gene function or diver-gence of expression profiles following gene duplicationduring genome evolution. To obtain a comprehensiveoverview of expression dynamics of the GATA familyand evaluate the expression profiles in relation to phy-logenetic relationships, we have undertaken a qRT-PCR analysis of all 29 family members.
We designed primers specific for each of the GATAfactor genes (Supplemental Table S2) and performedRT-qPCR to generate a comprehensive expression anal-ysis of all members of the family. This approach pro-vides the greatest sensitivity and quantitative detectionof genes expressed at low levels (Czechowski et al.,2004). We performed an analysis of cDNA from light-grown and dark-grown etiolated seedlings to definewhich members of the GATA gene family are devel-opmentally light regulated. We then determined theinfluence of circadian regulation on the gene family.We also analyzed cDNA from a clearly defined set ofadult tissues, namely roots, stems, leaves, flowers, andsiliques, as well as cell culture tissue, to generate anexpression dataset that together with the light-grownand dark-grown seedling expression data was used tocompare expression profiles between different familymembers and support the grouping of genes based onthis simple set of expression criteria. The expressiondata are presented as three sets: Figure 2 presentsexpression data derived from light-grown and dark-
grown seedlings, Figure 3 shows the analysis of circa-dian regulation, and Figure 4 presents the develop-mental expression in roots, stems, leaves, flowers,siliques, and cell culture. The cDNAs used for analysisof light- and dark-grown seedlings and dissected or-gans were prepared and analyzed by qPCR in parallel.It was these data that were used in combination toproduce a cladogram, grouping genes by the similar-ities of their expression (Fig. 5). An overview of theresults is initially presented followed by a detailedanalysis of the different expression clades identified byexpression pattern clustering.
Reports of DNA-binding activities in plant nuclearextracts recognizing GATA motifs in the promoters oflight-responsive genes (Lam and Chua, 1989; Buzbyet al., 1990; Gilmartin et al., 1990; Lam et al., 1990;Schindler and Cashmore, 1990; Sarokin and Chua,1992; Borello et al., 1993) and information from pub-lished microarray data indicating light-regulated ex-pression of some GATA genes (e.g. Harmer et al., 2000;Tepperman et al., 2001; Monte et al., 2004) underpinsthe perceived involvement of GATA factors in thecontrol of light-responsive transcription. To identifythose family members that are up- and down-regulatedduring photo- and skotomorphogenesis, we comparedexpression in 7-d-old light-grown seedlings with 7-d-old etiolated seedlings. The majority of genes are ex-pressed during one or both of these growth conditions.Only GATA13, GATA14, and GATA29 show minimalexpression in either sample. A number of genes showgreater than 2-fold higher expression in light-grownthan dark-grown seedlings (Fig. 2), with the greatestdifferences observed for GATA6, GATA7, GATA21(GNC), GATA22, and GATA23, with GATA22 showinga 75-fold difference in expression level. In contrast,four genes show stronger expression in etiolated over
Table I. Comparison of amino acid sequences of zinc finger motifs
Amino acid sequences of zinc finger motifs from selected Arabidopsis GATA factors representing the four subfamilies (Reyes et al., 2004) and relatedrepresentative sequences from chicken (Gallus domestica; Evans and Felsenfeld, 1989), Neurospora crassa (Fu and Marzluf, 1990), and Aspergillusnidulans (Kudla et al., 1990) are compared. Highly conserved residues are shown in bold with conserved Cys residues also underlined. The zinc fingerdomains of other Arabidopsis proteins (encoded by At4g16141, At5g15850, and At3g61850) and previously considered to be GATA factors due to thepresence of conserved Cys pairs (shown in bold and underlined) are also presented. Gene identifiers and database accession numbers are shown.Dashes indicate genes without names.
Species Gene Identifier Gene Name Zinc Finger Motif
Arabidopsis At3g24050 GATA1 CQHCGAE-K-TPQWRAGPAGPKTLCNACG
Arabidopsis At5g49300 GATA16 CADCGTS-K-TPLWRGGPVGPKSLCNACG
Arabidopsis At4g24470 GATA25 (ZIM) CTHCGISSKCTPMMRRGPSGPRTLCNACG
Arabidopsis At4g17570 GATA26 CYHCGVT-N-TPLWRNGPPEKPVLCNACG
Arabidopsis At3g20750 GATA29 CTNMNCNALNTPMWRRGPLGPKSLCNACG
G. domestica P17678 cGATA1-N CVNCGATA--TPLWRRDGTGHY-LCNACG
cGATA1-C CSNCQTST--TTLWRRSPMGDP-VCNACG
A. nidulans X52491 AreA CTNCFTQT--TPLWRRNPEGQP-LCNACG
N. crassa P78714 WC2 CTDCGTLD---SPEWRKGPSGPKTLCNACG
Arabidopsis At4g16141 – CLIDVIMCIHSLGMRALLLLDQSLCNACG
Arabidopsis At3g17660 – CADCRSKAPRWASVNLGIFICMQCS
Arabidopsis At5g15850 CONSTANS-N CDTCRSNACTVYCHADSAYLCMSCD
CONSTANS-C CESCERAPAAFLCEADDASLCTACD
Arabidopsis At3g61850 DAG1 CPRCNSTNTKFCYYNNYSLTQPRYFCKGCR
Manfield et al.
944 Plant Physiol. Vol. 143, 2007 www.plantphysiol.orgon May 31, 2018 - Published by Downloaded from
Copyright © 2007 American Society of Plant Biologists. All rights reserved.

Figure 1. GATA factor gene structure and phylogeny. Genes are numbered following published work (Jeong and Shih, 2003) withArabidopsis Genome Initiative codes and gene names also presented. Gene structure diagrams are presented in the order and inthe subfamilies reported by Reyes et al. (2004). Exons are indicated by black boxes with 5# and 3# UTRs of the mature mRNArepresented by white boxes. Where there is no data for UTR length (GATA14 and GATA16), this is indicated by a dashed line.Introns are represented by lines in dark gray or in light gray where the intron is present in the 5# leader. A nonconsensus splicedonor and acceptor junction is indicated by the appropriate bases. Gene structure diagrams are to scale (see scale bar) except forvery long regions where the length is given in base pairs above the region.
Arabidopsis GATA Family Gene Expression Patterns
Plant Physiol. Vol. 143, 2007 945 www.plantphysiol.orgon May 31, 2018 - Published by Downloaded from
Copyright © 2007 American Society of Plant Biologists. All rights reserved.

light-grown seedlings, namely GATA2, GATA4, GATA9,and GATA12, with GATA2 showing a 5-fold differencein expression.
The identification of GATA genes showing differen-tial regulation between light-grown and dark-grownseedlings, coupled to the implications of GATA factorinvolvement in circadian regulation, led us to performRT-qPCR analysis of circadian regulation of the GATAgene family. We followed published methods (Millaret al., 1995; Harmer et al., 2000) and used primersdesigned to the transcript for CCA1 (Wang et al., 1997)as a control (Fig. 3). Data are presented from twoindependent biological replicates, each containing twotechnical replicates. Dotted lines indicate the biologi-cal replicates and the solid lines represent an averageof the two data sets. A very clear and circadian reg-ulation of CCA1 transcript levels was observed peak-ing at subjective dawn with increases in transcriptlevel preempting subjective dawn (Fig. 3), confirmingclock entrainment of seedlings.
Thirteen GATA genes were expressed at a sufficientlevel in the assays to evaluate their circadian regula-
tion (Fig. 3). Of these 13, nine revealed rhythmic ex-pression. Five genes, GATA1, GATA3, GATA7, GATA8,and GATA25, showed an expression peak coincidingwith CCA1 at 24 h (subjective dawn), while GATA21(GNC) and GATA22 produced a circadian peak at 20 h,preempting dawn. In contrast, expression of GATA9and GATA12 peaked at 28 h, 4 h after subjective dawn.A number of genes, namely GATA1, GATA3, GATA7,GATA21, and GATA22, showed damping in the am-plitude of the second peak of transcript abundance.Analysis of GATA2 revealed rhythmic behavior, butindependent biological replicates showed differentphases of peak transcript abundance; averaging datafrom these duplicate experiments therefore does notportray a single clear rhythm (data not shown). Thedifferent phases of the rhythm in these samples aresurprising, as the assays were done using the sameRNA samples used for the analyses shown in Figure 3.GATA11, GATA24, and GATA28 were arrhythmic.These results identify a set of clock-regulated GATAfactor genes showing different phases of expression. Inaddition, these data reveal that not all light-modulatedGATA genes are under the control of the circadianoscillator and that some of the gene family membersunder strong circadian control are not directly influ-enced by growth in the light and dark.
The analysis of GATA factor gene expression indifferentiated tissues and cell culture material identi-fied six genes that show less than 2-fold expression var-iation in different parts of the plant, namely GATA1,GATA5, GATA11, GATA25 (ZIM), GATA26, andGATA28 (Fig. 4). Other family members reveal differ-ent levels of differential expression in different sam-ples, with some showing enhanced expression levelsin flowers, others predominantly expressed in roots.Only GATA22 is expressed predominantly in leaves.GATA13, GATA14, and GATA29, none of which arerepresented on the ATH1 Affymetrix gene chip, showhighly specific expression in cell culture, roots, andsiliques, respectively.
Analysis of Expression Clades
To facilitate inferences of functional relationships,including potential redundancy between genes, and toinvestigate whether evolved expression profiles cor-relate with previously defined phylogenetic groupingsbased on amino acid sequence, we integrated expres-sion pattern data for all 29 genes across eight differentRNA samples by clustering with respect to similaritiesin expression pattern (Fig. 5). Strikingly, few GATAgenes are expressed in predominantly one specific tis-sue; rather, the expression profiles show expression inmost RNA samples analyzed with the different rela-tive levels of expression revealing major expressiongroupings that we define as seven expression clades(Fig. 5).
All of the samples analyzed, with the exception ofthe suspension culture, consist of complex mixtures of
Table II. Comparison of GATA expression families with subfamiliesbased on coding sequence similarities
Sequence subfamilies (indicated by different numbers in the Se-quence Subfamily column) are presented as previously defined (Reyeset al., 2004), while expression families are based on expressioninformation from Figures 2, 4, and 5. Genes not represented by probesets on the Affymetrix ATH1 array are indicated with an asterisk againstthe gene name.
Expression
Clade
Sequence
Subfamily
GATA
Factor
Mutant
Name
Gene
Identifier
1 1 GATA 8 (BME3) At3g548101 GATA 14* At3g451701 GATA 3 At4g346802 GATA 16* At5g493002 GATA 19 (HANL2) At4g366202 GATA 23 At5g26930
2 1 GATA 9 At4g328901 GATA 2 At2g450501 GATA 4 At3g60530
3 1 GATA 11* At1g080101 GATA 12 At5g258301 GATA 10 At1g080001 GATA 7* At4g362401 GATA 5 At5g663201 GATA 6* At3g510802 GATA 18 (HAN) At3g508702 GATA 20 (HANL1) At2g183802 GATA 15 At3g06740
4 2 GATA 21 (GNC) At5g568602 GATA 22 At4g26150
5 1 GATA 1 At3g240502 GATA 17 At3g168703 GATA 25 (ZIM) At4g244703 GATA 24 (ZML1) At3g211753 GATA 28 (ZML2) At1g516004 GATA 26 At4g17570
6 1 GATA 13* At2g283404 GATA 27* At5g47140
7 2 GATA 29* At3g20750
Manfield et al.
946 Plant Physiol. Vol. 143, 2007 www.plantphysiol.orgon May 31, 2018 - Published by Downloaded from
Copyright © 2007 American Society of Plant Biologists. All rights reserved.

Figure 2. Expression of GATA genes in light- and dark-grown seedlings Transcript abundance for each GATA gene was measuredby qPCR analysis of cDNA from light-grown (photomorphogenetic) and dark-grown (skotomorphogenetic) seedlings. Results forlight-grown and dark-grown samples are indicated by white and black bars, respectively. Values are the result of duplicate analysisof two biological replicates and are shown with SE. The ratio of expression levels in light- and dark-grown tissues is presented.
Plant Physiol. Vol. 143, 2007 947
Arabidopsis GATA Family Gene Expression Patterns
www.plantphysiol.orgon May 31, 2018 - Published by Downloaded from Copyright © 2007 American Society of Plant Biologists. All rights reserved.

cell types with some commonality of cell types be-tween the different tissues. This situation may con-tribute to the broad expression profiles of some genes,but the data clearly illustrate that the clustering offamily members by expression profile does not corre-late precisely with sequence-derived phylogenies. Thesedifferences are summarized in Table II.
Expression clade 1 represents those GATA genesthat are predominantly expressed in roots. The sixgenes in this clade are also expressed to varying de-grees in other tissues, but GATA14 shows the strongestpreferential expression in roots with only limitedexpression in other samples (Fig. 4). GATA14 showsextremely low levels of expression in seedlings (Fig. 2),indicating a difference in expression between adultsoil-grown roots and roots from agar-grown seedlings.
GATA23 and GATA19 are members of sequencesubfamily II (Fig. 1) that have not arisen by geneduplication (Reyes et al., 2004) but show very similarpatterns of expression in relation to organ specificity(Fig. 4) and in response to light (Fig. 2). The keydifference in expression of these two genes is reflectedby different relative expression levels in stems, flow-ers, and roots. Analysis of GATA23 gene expressionpatterns, using ACT (Jen et al., 2006; Manfield et al.,2006) and Genevestigator (Zimmermann et al., 2004)tools (data not shown), also reveals this gene and the20 genes showing strongest coexpression are moststrongly expressed in the root elongation zone. Similarbioinformatic analyses for GATA19 using Genevesti-gator and ACT (Zimmermann et al., 2004; Jen et al.,2006) are compromised by the relatively low level ofexpression of this gene, as detected by microarrayanalysis. However, in agreement with our RT-qPCRanalysis, the 20 genes most strongly coexpressed withGATA19 (data not shown) are expressed in roots andflowers, and, more specifically, stamens. The enhancedexpression in flowers is evident in the heat map shownin Figure 5. This gene pair also shares similar expres-sion profiles in light-grown and dark-grown seedlingswhere the differences in signal intensity possibly re-flect differences in the sizes of the root system in thephotomorphogenic and skotomorphogenic seedlings.GATA3, GATA8 (BME3; Liu et al., 2005), and GATA16also present similar expression profiles within ex-pression clade 1, although GATA3 is not expressed insuspension culture cells and shows slightly higherexpression in seedlings. None of these three genescluster through sequence alignment (Fig. 1); indeed,GATA8 and GATA16 represent members of differentGATA subfamilies (Reyes et al., 2004). GATA29, whichencodes a protein that aligns most closely to thatencoded by GATA16 (Reyes et al., 2004), is the onlyGATA factor gene that shows highly specific expres-sion in siliques and represents the sole member ofexpression clade 7. The GATA29 zinc finger is also themost divergent of all family members, as it contains anunusual Cx4C Cys pair within the zinc finger domain(Table I). Within this clade, only GATA19 and GATA23show differences in expression between light-grown
and etiolated seedlings, and GATA3 and GATA8 are theonly two genes under circadian control.
Expression clade 2 is characterized by the enhancedexpression of the three members, GATA2, GATA4, andGATA9, in dark-grown seedlings and in mature light-grown plants; the strongest expression is in roots andflowers. Phylogenetic analysis identifies GATA2 andGATA4 as having arisen from a common origin via agenome duplication event (Reyes et al., 2004). Ouranalyses also highlight GATA9 and GATA12 as a genepair sharing extensive gene structure and sequencesimilarity (Fig. 1). These four genes cluster as membersof subfamily I (Reyes et al., 2004). The exclusion ofGATA12 from expression clade 2 appears to arise dueto the high levels of expression of this gene in stem, atissue where GATA2, GATA4, and GATA9 expression islimited; GATA12 is grouped in expression clade 3.However, all four of these genes show significantdown-regulation in light-grown as opposed to dark-grown seedlings and share other expression charac-teristics (Figs. 2 and 3). Microarray analyses report thecircadian cycling of transcript abundance of GATA4(Harmer et al., 2000) and of GATA2, GATA4, GATA9,and GATA12 (Edwards et al., 2006). Our qPCR analy-ses reveal circadian regulation of GATA9 and GATA12with a peak of expression 4 h after subjective dawn(Fig. 3). However, we were unable to demonstraterobust circadian control of GATA2 and GATA4. Asdiscussed above, GATA2 expression cycles but thephase is variable, and GATA4 expression in light-grown seedlings (Fig. 2) is too low to reveal a robustrhythm.
Analysis of gene expression patterns using ACTindicates that GATA2 and GATA4 show strong coex-pression with each other as well as a significant num-ber of genes with roles in cell wall assembly, includingexpansins, arabinogalactan proteins, and glycosyl hy-drolases (data not shown). These analyses also revealthat GATA2 and GATA4 are coexpressed with PHYAbut not with genes encoding other phytochromes(shown as black triangles in Fig. 6A); PHYA is theeighth-most strongly coexpressed gene with GATA4(r value, 0.67; P value for the observed correlation oc-curring by chance, 2 3 10244). In addition, a number ofgenes involved in photoresponse signaling, includingtranscription factors PIL5/PIF1, PIF3, SPT, and HFR1that act downstream of PHYA signaling, show corre-lation of expression with GATA4 (P values , 1 3 10214;these genes ranked in the best-correlated 3% of genes).A P value of 1 3 10210 is shown on these graphs as aguideline significance threshold. Experimentation, di-rected by these results, will identify the biologicalsignificance of these correlations. Other genes encod-ing components involved in light and clock signaling,namely HY5, HYH, LHY, and CCA1, showed lowcorrelation r values (between 0.2 and 20.2), indicatinguncorrelated expression with GATA2 and GATA4 (datanot shown). The similar expression of GATA2 andGATA4 (represented by black diamonds in Fig. 6A)over all array experiments in the ACT database is
Manfield et al.
948 Plant Physiol. Vol. 143, 2007 www.plantphysiol.orgon May 31, 2018 - Published by Downloaded from
Copyright © 2007 American Society of Plant Biologists. All rights reserved.

Figure 3. Circadian expression patterns for se-lected GATA genes. The expression of geneswith a significant level of expression in light-grown seedlings collected over a circadian timecourse was analyzed over a time course de-signed to identify genes showing evidence ofclock regulation in the absence of light signal-ing, following standard procedures. Gene ex-pression was measured by qPCR analysis ofcDNA from samples of light-grown seedlingscollected every 4 h. Results presented show twobiological replicates (dashed lines) and the av-erage (with SE bars) of duplicate analysis of thetwo biological replicates.
Arabidopsis GATA Family Gene Expression Patterns
Plant Physiol. Vol. 143, 2007 949 www.plantphysiol.orgon May 31, 2018 - Published by Downloaded from
Copyright © 2007 American Society of Plant Biologists. All rights reserved.

reflected in the alignment of all data points along the45� bisecting dotted line.
Similar analyses of GATA9 and GATA12 using ACTreveals no clear overrepresentation of gene ontologyterms that might have suggested functions for thesegenes (data not shown). GATA2, GATA4, GATA9, andGATA12 all show down-regulation in light-grownseedlings. However, scatter plot analysis for GATA9and GATA12 (Fig. 6B) reveals that genes highlightedin relation to GATA2 and GATA4 (Fig. 6A) show noexpression correlation to GATA9 and GATA12. Theheart-shaped distribution of data points (Fig. 6B) re-veals that there are sets of genes distributed along thex axis and above the 45� bisecting dotted line that showstronger correlation with GATA9 than with GATA12
and vice versa. This divergence of correlation data setssuggests that this conserved gene pair has partiallydiverged not only in their own regulation but inrelation to the genes with which they are coexpressedand potentially regulate.
Expression clade 3 (Fig. 5) represents those genesthat predominantly show strongest expression in flow-ers. GATA12 is the outlier of this group with strongestexpression in stems, and this gene has already beenconsidered in relation to GATA9 above. All other genesin this clade, with the exception of GATA11 andGATA20, show greater than 2-fold higher expressionin light-grown versus dark-grown seedlings, and, withthe exception of GATA5, all show low levels of expres-sion in light-grown leaves. This observation suggests
Figure 4. GATA expression profiles in adult tissues. Transcript abundance for each GATA gene was measured by qPCR analysis ofcDNA from roots, stems, leaves, flowers, siliques, and cell culture (abbreviated as R, St, L, F, Si, and C, respectively). Values arethe result of duplicate analysis of two biological replicates and are shown with SE.
Manfield et al.
950 Plant Physiol. Vol. 143, 2007 www.plantphysiol.orgon May 31, 2018 - Published by Downloaded from
Copyright © 2007 American Society of Plant Biologists. All rights reserved.

that the observed seedling expression profiles in thisclade reflect developmental rather than light-responsiveexpression patterns. The only remaining gene in thisclade under circadian control is GATA7, with expres-sion peaking in phase with CCA1 at subjective dawn.
GATA10 and GATA11 show very similar expressionprofiles (Figs. 4 and 5) across the spectrum of samplesanalyzed and neither is under circadian control (Fig.3). These genes arose via tandem duplication, and thesimilarities in expression suggest that they have notdiverged significantly either in relation to their en-coded proteins or their expression dynamics. Anotherpair of genes within clade 3 with very similar expres-sion profiles is GATA18 (HAN; Zhao et al., 2004) andGATA15. Phylogenetic analysis (Reyes et al., 2004; Fig.1) identifies HAN (GATA18) as one of three closelyrelated genes, with GATA19 (HANL2) and GATA20(HANL1) in subfamily II. GATA20 also forms part ofexpression clade 3 and shows similar expression dy-namics to GATA18, but, as discussed above, GATA19falls within expression clade 1, as this gene is ex-
pressed more strongly in roots than in flowers. Basedon sequence analysis, GATA15 is most similar toGATA17, but these genes do not share expressionprofiles, with GATA17 residing in expression clade 5.The close similarity of expression profiles for GATA18(HAN; Zhao et al., 2004) and GATA15 (Fig. 5) couldprovide insight into the potential site of GATA15function.
The final pair of genes within expression clade 3 isGATA6 and GATA7. These genes, together with GATA5,represent a group of three closely related sequenceswithin subfamily I that arose through two differentsegmental duplication events (Reyes et al., 2004).GATA5 and GATA6 retain greater sequence similarityto each other than either do to GATA7 (Reyes et al.,2004; Fig. 1), yet in terms of expression profiles, GATA5is the most divergent with almost constant expressionacross all adult plant organs analyzed, while neitherGATA6 nor GATA7 show strong expression in leaves,roots, or suspension culture cells.
Expression clade 4 contains only two members,GATA21 (GNC; Bi et al., 2005) and GATA22, and thesegenes are characterized by showing significantly highlevels of expression in light-grown seedlings. Togetherwith GATA23, these genes show the strongest differ-ential expression between light-grown and etiolatedseedlings, with GATA22 showing a 75-fold differencein expression levels (Fig. 2) and the highest level ofexpression of any GATA gene in adult leaf (Fig. 4).These three genes cluster in subfamily II with GATA21and GATA22 arising from a duplication event betweenchromosome 4 and 5 (Reyes et al., 2004). GATA23 is themost divergent of the three as revealed by gene struc-ture (Fig. 1) and also by expression profile (Fig. 5).Notwithstanding the significant differences in expres-sion between light- and dark-grown seedlings forthese three genes, GATA23 is not part of this clade, asits expression in light-grown seedlings is relativelyweak, and in contrast with GATA21 and GATA22, itshows high transcript levels in root and stem (Fig. 5).GATA21 and GATA22 show no expression in roots or innonphotosynthetic cell culture but do show strongexpression in green photosynthetic tissues, and avail-able array data suggests both circadian and diurnalchanges of transcript abundance (Smith et al., 2004;Edwards et al., 2006). Our circadian analyses by RT-PCR (Fig. 3) reveal that GATA21 (GNC) and GATA22are under circadian regulation with peaks of expres-sion preempting subjective dawn by 4 h.
Bioinformatic analysis of GATA21 (GNC) using theGene Ontology tool within ACT (Manfield et al., 2006)reveals coexpression with a number of light-regulatedgenes encoding proteins destined for the chloroplast,including those involved in carotenoid biosynthesis(data not shown). In contrast, GATA22 shows coex-pression with genes showing overrepresentation oftranscription factor and circadian rhythm Gene On-tology terms (data not shown). The ACT scatter plotanalysis of GATA21 (GNC) and GATA22 is shownin Figure 6C. The skew of data points representing
Figure 5. Clustering of Arabidopsis GATA factors based on expressionpatterns. Expression profile data for all GATA genes in roots, stems,leaves, flowers, siliques, light-grown seedlings, dark-grown seedlings,and cell culture was used to construct a cladogram grouping genesaccording to the similarity of their expression patterns. Increasingexpression level is indicated by squares from black to red.
Arabidopsis GATA Family Gene Expression Patterns
Plant Physiol. Vol. 143, 2007 951 www.plantphysiol.orgon May 31, 2018 - Published by Downloaded from
Copyright © 2007 American Society of Plant Biologists. All rights reserved.

coexpressed genes away from the 45� bisecting lineindicates that of those genes that are coexpressed withboth GATA genes, the expression of the majority ismore strongly correlated with GATA21 than withGATA22. Although GATA21 and GATA22 share a com-mon origin and present similar conserved expressionprofiles (Fig. 5), they have diverged in terms of thegenes with which they are coregulated and perhapsregulate. This divergence of expression correlation isless dramatic than seen for GATA9 and GATA12 (Fig.6B) but reveals a number of genes that stand apartfrom the main cluster. These genes include a numberof transcription factor genes involved in or subject tolight and circadian regulation, including CCA1, LHY,CONSTANS-LIKE1, CONSTANS-LIKE2, HY5, andHYH. The probability of these observed expression cor-relations occurring by chance is extremely small (P 58 3 10214), and these genes all rank within the best-correlated 0.5% of genes with GATA22. Several of thesegenes are also coexpressed with GATA21 (GNC) but atmuch lower rankings (Fig. 6C). The expression corre-lation of these morning-phased genes with GATA22contrasts with the anticorrelation of evening-phasedgenes, such as PIF3, TOC1, GI, ELF3, and ELF4, withboth GATA21 and GATA22.
Those GATA genes that are ubiquitously expressedbut more strongly expressed in suspension culturecells are grouped within expression clade 5. Thesegenes also include family members that show the leastdifferential expression across different parts of thewhole plant. This aspect distinguishes them fromgenes in expression clade 6 that are expressed in thesuspension culture cells but show only limited expres-sion in differentiated tissues. Clade 5 contains thethree members of subfamily III (Reyes et al., 2004) thatcontain a 20-amino acid spacer between the Cys pairsof the zinc finger, GATA25 (ZIM), GATA24 (ZML1), andGATA28 (ZML2; Shikata et al., 2004). GATA24 andGATA28 are most closely related based on gene struc-ture and protein sequence (Fig. 1) and also show con-servation of expression dynamics. GATA25 (ZIM) andGATA1 also represent a pair of genes with very similarexpression patterns despite representing very differ-ent GATA factor lineages (Fig. 1). Similarly, GATA17and GATA26 represent different subfamilies indicatingdivergent origins but having overlapping expressionprofiles. Only GATA17 shows greater than 2-foldhigher expression in light- compared to dark-grownseedlings, but both GATA1 and GATA25 (ZIM) showrobust circadian regulation with peaks of expression atsubjective dawn and 2 h prior to subjective dawn,respectively. Expression of the two other members ofsubfamily III, GATA24 and GATA28, is not influencedby the circadian clock, suggesting either that GATA25has come under circadian control since the gene du-plication event or that GATA24 and GATA28, or theirprogenitor gene, have lost this aspect of regulation.Although ZIM, ZIML1, and ZIML2 proteins all containa CCT motif, also present in CCA1, CONSTANS, andTOC1 proteins (Reyes et al., 2004), only GATA25 (ZIM)
shows evidence of regulation by the clock (Figs. 2and 3).
The convergence of expression patterns for genesfrom different sequence subfamilies discussed aboveis also seen for GATA13 and GATA27, comprisingexpression clade 6, with strongest expression in sus-pension culture cells and very little expression in
Figure 6. ACT scatter plot comparison of duplicate gene expression.Scatter plots of r values for correlation of expression of all genes in theACT database against pairs of GATA genes with similar expressionpatterns. A, GATA2 and 4. B, GATA9 and 12. C, GATA22 and GNC.On each diagram, the query genes are represented by black diamonds.In A, phytochrome apoprotein genes and a selection of transcriptionfactor genes (see text for details) are represented by black and whitetriangles. In C, genes encoding clock-related components and othertranscription factor genes are represented by black and white squares,respectively. The position of the r value corresponding to a P value of1 3 10210 is shown as a guideline significance threshold.
Manfield et al.
952 Plant Physiol. Vol. 143, 2007 www.plantphysiol.orgon May 31, 2018 - Published by Downloaded from
Copyright © 2007 American Society of Plant Biologists. All rights reserved.
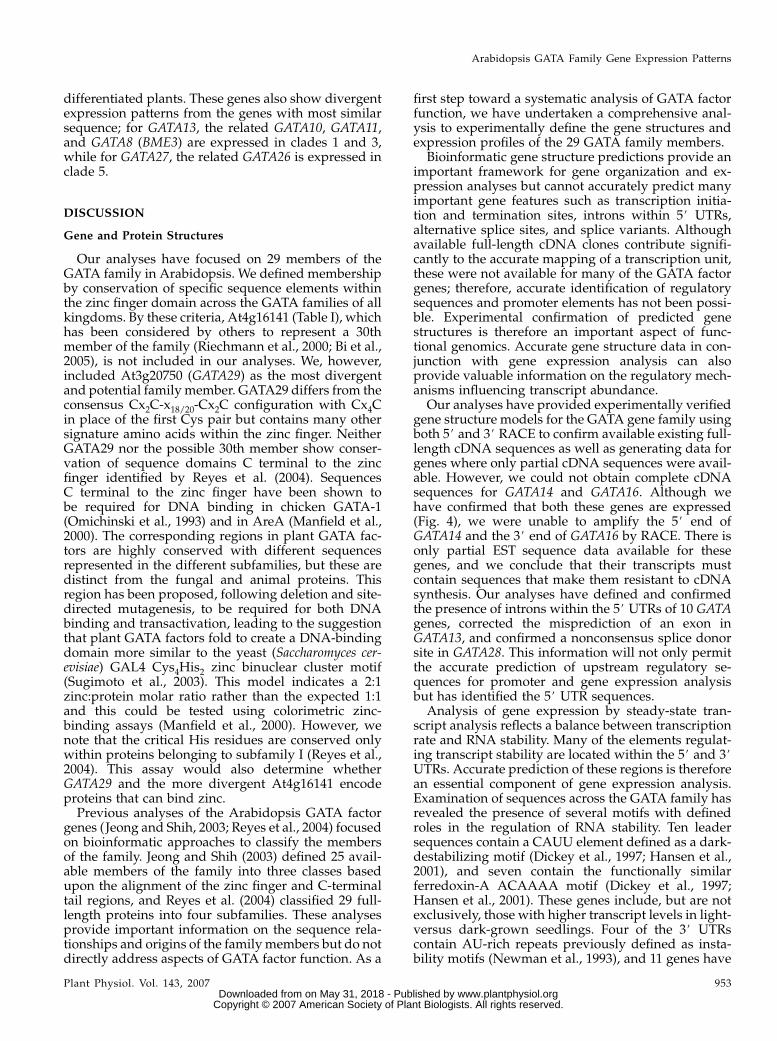
differentiated plants. These genes also show divergentexpression patterns from the genes with most similarsequence; for GATA13, the related GATA10, GATA11,and GATA8 (BME3) are expressed in clades 1 and 3,while for GATA27, the related GATA26 is expressed inclade 5.
DISCUSSION
Gene and Protein Structures
Our analyses have focused on 29 members of theGATA family in Arabidopsis. We defined membershipby conservation of specific sequence elements withinthe zinc finger domain across the GATA families of allkingdoms. By these criteria, At4g16141 (Table I), whichhas been considered by others to represent a 30thmember of the family (Riechmann et al., 2000; Bi et al.,2005), is not included in our analyses. We, however,included At3g20750 (GATA29) as the most divergentand potential family member. GATA29 differs from theconsensus Cx2C-x18/20-Cx2C configuration with Cx4Cin place of the first Cys pair but contains many othersignature amino acids within the zinc finger. NeitherGATA29 nor the possible 30th member show conser-vation of sequence domains C terminal to the zincfinger identified by Reyes et al. (2004). SequencesC terminal to the zinc finger have been shown tobe required for DNA binding in chicken GATA-1(Omichinski et al., 1993) and in AreA (Manfield et al.,2000). The corresponding regions in plant GATA fac-tors are highly conserved with different sequencesrepresented in the different subfamilies, but these aredistinct from the fungal and animal proteins. Thisregion has been proposed, following deletion and site-directed mutagenesis, to be required for both DNAbinding and transactivation, leading to the suggestionthat plant GATA factors fold to create a DNA-bindingdomain more similar to the yeast (Saccharomyces cer-evisiae) GAL4 Cys4His2 zinc binuclear cluster motif(Sugimoto et al., 2003). This model indicates a 2:1zinc:protein molar ratio rather than the expected 1:1and this could be tested using colorimetric zinc-binding assays (Manfield et al., 2000). However, wenote that the critical His residues are conserved onlywithin proteins belonging to subfamily I (Reyes et al.,2004). This assay would also determine whetherGATA29 and the more divergent At4g16141 encodeproteins that can bind zinc.
Previous analyses of the Arabidopsis GATA factorgenes (Jeong and Shih, 2003; Reyes et al., 2004) focusedon bioinformatic approaches to classify the membersof the family. Jeong and Shih (2003) defined 25 avail-able members of the family into three classes basedupon the alignment of the zinc finger and C-terminaltail regions, and Reyes et al. (2004) classified 29 full-length proteins into four subfamilies. These analysesprovide important information on the sequence rela-tionships and origins of the family members but do notdirectly address aspects of GATA factor function. As a
first step toward a systematic analysis of GATA factorfunction, we have undertaken a comprehensive anal-ysis to experimentally define the gene structures andexpression profiles of the 29 GATA family members.
Bioinformatic gene structure predictions provide animportant framework for gene organization and ex-pression analyses but cannot accurately predict manyimportant gene features such as transcription initia-tion and termination sites, introns within 5# UTRs,alternative splice sites, and splice variants. Althoughavailable full-length cDNA clones contribute signifi-cantly to the accurate mapping of a transcription unit,these were not available for many of the GATA factorgenes; therefore, accurate identification of regulatorysequences and promoter elements has not been possi-ble. Experimental confirmation of predicted genestructures is therefore an important aspect of func-tional genomics. Accurate gene structure data in con-junction with gene expression analysis can alsoprovide valuable information on the regulatory mech-anisms influencing transcript abundance.
Our analyses have provided experimentally verifiedgene structure models for the GATA gene family usingboth 5# and 3# RACE to confirm available existing full-length cDNA sequences as well as generating data forgenes where only partial cDNA sequences were avail-able. However, we could not obtain complete cDNAsequences for GATA14 and GATA16. Although wehave confirmed that both these genes are expressed(Fig. 4), we were unable to amplify the 5# end ofGATA14 and the 3# end of GATA16 by RACE. There isonly partial EST sequence data available for thesegenes, and we conclude that their transcripts mustcontain sequences that make them resistant to cDNAsynthesis. Our analyses have defined and confirmedthe presence of introns within the 5# UTRs of 10 GATAgenes, corrected the misprediction of an exon inGATA13, and confirmed a nonconsensus splice donorsite in GATA28. This information will not only permitthe accurate prediction of upstream regulatory se-quences for promoter and gene expression analysisbut has identified the 5# UTR sequences.
Analysis of gene expression by steady-state tran-script analysis reflects a balance between transcriptionrate and RNA stability. Many of the elements regulat-ing transcript stability are located within the 5# and 3#UTRs. Accurate prediction of these regions is thereforean essential component of gene expression analysis.Examination of sequences across the GATA family hasrevealed the presence of several motifs with definedroles in the regulation of RNA stability. Ten leadersequences contain a CAUU element defined as a dark-destabilizing motif (Dickey et al., 1997; Hansen et al.,2001), and seven contain the functionally similarferredoxin-A ACAAAA motif (Dickey et al., 1997;Hansen et al., 2001). These genes include, but are notexclusively, those with higher transcript levels in light-versus dark-grown seedlings. Four of the 3# UTRscontain AU-rich repeats previously defined as insta-bility motifs (Newman et al., 1993), and 11 genes have
Arabidopsis GATA Family Gene Expression Patterns
Plant Physiol. Vol. 143, 2007 953 www.plantphysiol.orgon May 31, 2018 - Published by Downloaded from
Copyright © 2007 American Society of Plant Biologists. All rights reserved.

leader sequences containing C/T-rich motifs that havea role in controlling tissue-specific gene expression(Bonaventure and Ohlrogge, 2002).
Eight transcripts contain suORFs in their 5# UTRs.Upstream AUGs have been reported as overrepre-sented in genes with key regulatory roles (Morris andGeballe, 2000). In plants, the role of suORFs has beenwell documented in relation to Suc control (SC), withSC-suORFs encoding a peptide in the leader sequencesof a subset of bZIP transcription factors (Wiese et al.,2004). Other than the suORFs of related GATA genesthat encode similar peptides, none of the GATAsuORFs show any similarity to each other, to the SC-suORF, or to any other sequence of the genome pre-dicted to be found in a transcript leader sequence. It ispossible that any functional role for the GATA suORFsis mediated not through the specific sequence of thesuORF but rather by having an effect on the efficiencyof translation reinitiation at the downstream authenticAUG (Kozak, 2000). The presence of sequences in-volved in RNA stability and translational control withinsome GATA transcripts suggests potential posttrans-criptional regulation. These analyses are summarizedin Supplemental Table S1.
Light Regulatory Roles for GATA Factors and ExpressionDivergence following Gene Duplication
The consequences of divergence on the expressionof closely related gene pairs are best illustrated byconsideration of three gene pairs: GATA2 and GATA4,GATA9 and GATA12, and GATA21 (GNC) and GATA22.All six of these genes provide multiple lines of evi-dence to implicate them in aspects of light regulation.The first and last of these gene pairs arose followinglarge chromosomal duplications between 53 and 97million years ago (Reyes et al., 2004), whereas GATA9and GATA12 possibly arose from a small duplicationevent not previously identified. Based on sequence,gene structure, and elements of their expression pro-files, GATA2, GATA4, GATA9, and GATA12 could sharea common ancestry. While the best measures of diver-gence of duplicated gene function have come fromanalysis of mutants (e.g. Causier et al., 2005), theavailability of databases of microarray data has al-lowed the comparison of paralogs by expression pat-terns (Casneuf et al., 2006). Similarly, our scatter plotanalyses reveal the correlations of expression patternsof two query genes with 21,890 other genes over 322arrays comprising 52 experiments using the ATH1Affymetrix array.
GATA2, GATA4, GATA9, and GATA12 all showhigher expression levels in dark-grown over light-grown seedlings (Fig. 2), and this is supported byanalysis of publicly available microarray data from asystematic analysis of a range of light treatments(Schmid et al., 2005). Down-regulation of GATA2 andGATA4 expression in light-grown seedlings was ob-served following a 4-h treatment with far-red, red,blue, and white light, but not UV-A. However, for all
wavelengths of light, a 45-min treatment did not pro-duce any changes in transcript levels. GATA9 showedsimilar but less marked responses to far-red and bluelight but not red or UV-A, whereas GATA12 showsno such transcript responses to these various wave-lengths of light. These responses to light suggest reg-ulation by phyA (and possibly cryptochrome) action.Published array analyses identified circadian regula-tion of all four of these genes (Harmer et al., 2000;Edwards et al., 2006), although the amplitude forGATA2 and GATA4 is weaker than for GATA9 andGATA12. Our qPCR analyses support the strong rhyth-mic behavior of GATA9 and GATA12 with peaks ofexpression 4 h after subjective dawn. GATA2 showedrhythms with different phases between replicates,whereas for all other genes tested using these samecDNA samples, the replicates were superimposed.The low level of GATA4 expression did not permitcircadian analysis of this gene. These four genes showconsiderable similarities in their developmental ex-pression profiles (Fig. 4); however, GATA12 does notgroup within expression clade 2 due to the high levelsof expression seen in stems (Fig. 5). This differencesuggests that one aspect of the divergence of GATA9and GATA12 is reflected by a gain of expression instems by GATA12.
Scatter plot analysis using ACT reveals that GATA2and GATA4 are coexpressed with each other, as indi-cated both by the close proximity of the data pointsrepresenting these two genes (Fig. 6A) and by the closealignment of data points for coexpressed genes alongthe 45� diagonal. This observation indicates that fol-lowing the gene duplication, GATA2 and GATA4 havemaintained similar expression relationships with coex-pressed genes, including potential target genes, sug-gesting some conservation of function and potentialfunctional redundancy. We have also shown previ-ously (Teakle et al., 2002) that recombinant GATA2 andGATA4 interact with the same DNA sequence motifs.GATA2 and GATA4 are also tightly coexpressed withPHYA, and a range of genes encoding bHLH tran-scription factors, including PIL5/PIF1, SPT, PIF3, andHFR1, which have defined roles in light-responsivesignaling. We note that none of the other PHY genesare coexpressed with GATA2 and GATA4. The lightdown-regulation of GATA2 and GATA4 suggests thatthese GATA genes may have a role in repression ofphotomorphogenesis. Analysis of the promoters ofgenes coexpressed with GATA2 and GATA4 showsoverrepresentation of G-box and abscisic acid responseelement-like motifs, the elements recognized by bHLHand bZIP transcription factors (data not shown) sup-porting common regulation of these coexpressed genes.PIL5/PIF1 and SPT have been shown to have rolesintegrating light, hormonal, and environmental sig-nals during seed germination and etiolation (Oh et al.,2004; Penfield et al., 2005; Shen et al., 2005). Wespeculate that GATA2 and GATA4 may play a role inseed germination and seedling establishment, eitherwithin the light signaling pathway (Penfield et al.,
Manfield et al.
954 Plant Physiol. Vol. 143, 2007 www.plantphysiol.orgon May 31, 2018 - Published by Downloaded from
Copyright © 2007 American Society of Plant Biologists. All rights reserved.

2005) or through mobilization of lipid reserves byenzymes such as isocitrate lyase and malate synthase(Eastmond et al., 2000; Penfield et al., 2005).
In contrast, the ACT scatter plot analysis for GATA9and GATA12 reveals significant divergence of regula-tion for these two genes. The heart-shaped patternseen for GATA9 and GATA12 and the distance betweenthe data points for these two genes suggest that thesegenes have diverged sufficiently in function that theyare now regulated with, and potentially regulate,different sets of genes. We are currently investigatingif there is a feature of the regulation of the genes bestcorrelated with GATA 9 that distinguishes them fromthe genes best correlated with GATA 12 (Fig. 6B). Fur-thermore, although GATA9 and GATA12 share manyexpression characteristics with GATA2 and GATA4,including down-regulation in light-grown seedlings,they do not show coexpression with any of the genesinvolved in light signaling highlighted for GATA2and GATA4 (Fig. 6B). These observations suggest thatGATA9 and GATA12 have not only diverged fromGATA2 and GATA4, but they are also diverging inexpression from each other and would not be predic-ted to show functional redundancy.
GATA21 (GNC) and GATA22 represent a gene pairwith similar expression profiles with strong up-regulation in light-grown seedlings (Fig. 2) and circa-dian regulation. ACT scatter plot analysis reveals thatthe majority of genes represented by the data pointsare located above the 45� bisecting line. This observa-tion suggests that more genes are more closely corre-lated with GATA21 (GNC) than with GATA22. Thisobservation suggests a greater divergence in expres-sion patterns following gene duplication than betweenGATA2 and GATA4, but not as great as observed forGATA9 and GATA12. Two genes showing greatestcorrelation of expression with GATA21 (GNC) andGATA22 are the key circadian transcriptional regula-tors LHY and CCA1. Our analyses and those of others(Edwards et al., 2006) reveal circadian regulation ofthese two GATA genes, but their expression is approx-imately 4 h out of phase with CCA1 (Fig. 3). Mutationof GATA21 (GNC) results in a 20% reduction in chlo-rophyll biosynthesis and reduces expression of anumber of genes involved in carbon metabolism. Nomutant phenotype was observed for the two GATA22T-DNA insertion lines characterized (Bi et al., 2005);either the positions of insertions, which do not abol-ish GATA22 transcripts, do not disrupt gene function,or GATA22 functions form a subset of those under-taken by GATA21 (GNC) creating partial functionalredundancy (Figs. 1 and 5). GATA22 is the most highlyup-regulated gene in light-grown over dark-grownseedlings, and along with GATA21 (GNC) shows a cir-cadian peak preempting dawn. The stronger correla-tion of expression of genes defined in light responses,including HYH and HY5, with GATA22 than withGATA21 (GNC; Fig. 6C) leads us to speculate thatGATA22 may also play a role in photoregulation alongwith GATA21 (GNC; Bi et al., 2005).
Additional microarray data reveals that cytokinininduces expression of both GATA22 and GATA21(GNC; Kiba et al., 2005) and that expression of bothgenes is induced by red light in a PIF3-dependentmanner (Monte et al., 2004). We also note that pro-moters of genes coexpressed with GATA22 and GATA21(GNC) show overrepresentation of G boxes (data notshown), and we speculate that these might be amongthe direct targets of PIF3 or a related bHLH transcrip-tion factor. A group of genes, including LHY, CCA1,COL1, and COL2, HY5, and TOC1 have been identifiedas red light responsive and independent of or slightlydependent on PIF3 for this induction (Monte et al.,2004). Our bioinformatic analysis of microarray ex-pression data using ACT allows the dissection of thisgroup of genes reporting that LHY (Schaffer et al.,1998), CCA1 (Wang et al., 1997), COL1 (Ledger et al.,2001), and COL2 (Ledger et al., 2001) are all coex-pressed with both GATA21 (GNC) and GATA22 butmore highly ranked with GATA22. Calculation ofcorrelation values using different data sets and usingdifferent statistical algorithms further supports thesecorrelations (data not shown). In addition to PIF3,roles have been identified for TOC1, ELF3, and ELF4 inthe regulation of LHY and CCA1 (Kikis et al., 2005).Analysis of the expression of GATA22 and GATA21(GNC) in mutants for these regulatory proteins mightreveal whether these are upstream regulators of theseGATA genes. Furthermore, the integration of hormonalsignaling with light signals (Chen et al., 2004; Cluiset al., 2004; Kiba et al., 2005) suggests that hormonesmay also play roles in regulation of these GATA genes.
CONCLUSION
Functional genomic approaches to define GATAfactor function using T-DNA insertion lines (Bi et al.,2005; I.W. Manfield and P.M. Gilmartin, unpublisheddata) have shown that many T-DNA insertion lines donot lead to disruption of gene function, perhaps dueto insertion in 5# and 3# UTRs, introns, or sequencesflanking the transcription unit. The availability of ex-perimentally confirmed gene structures will assistfuture identification of insertion lines that are likelyto lead to perturbation of gene function. Many of theavailable T-DNA lines do not present obvious mutantphenotypes, possibly because the insertion does notlead to loss of the associated GATA transcript (Bi et al.,2005; I.W. Manfield and P.M. Gilmartin, unpublisheddata), possibly because of functional redundancy, orpossibly suggesting that mutations in some of GATAgenes lead to subtle mutant phenotypes. However, it isalso likely that many phenotypes will be apparent onlyunder specific environmental conditions, and the re-sults we report here will help define conditions whereGATA function defects may be expected. For example,our comprehensive expression analyses identified geneswith a range of light-regulated responses in etiolatedversus light-grown seedlings, some of which had not
Arabidopsis GATA Family Gene Expression Patterns
Plant Physiol. Vol. 143, 2007 955 www.plantphysiol.orgon May 31, 2018 - Published by Downloaded from
Copyright © 2007 American Society of Plant Biologists. All rights reserved.

been predicted, namely, light down-regulation. Thissuggests that defects in skotomorphogenesis may bepossible for GATA mutants. Similarly, the informationabout the tissue-specific expression of GATA genes,especially for genes not represented by probe sets onAffymetrix arrays, may be valuable in analyzing ap-propriate GATA mutants.
Our RT-PCR expression and bioinformatics coex-pression analyses identified pairs of genes with verysimilar behavior and other groups of genes, for exam-ple HAN and HAN-LIKE genes, which may showoverlapping roles but each with some unshared func-tions. The use of ACT and associated scatter plotsrepresents a useful approach for comparing the ex-pression and regulation of highly similar genes andoffers a new route for charting the acquisition or dif-ferentiation of functions for duplicated genes viachanges in their coexpression patterns.
In parallel to our bioinformatic analyses and GATAgene expression studies, we have analyzed a range ofT-DNA insertion lines, promoter: b-glucuronidase fu-sions, and undertaken microarray analysis of knock-out and overexpression lines for several GATA factorgenes. These studies that provide further insight intothe role of plant GATA factors will be reported sepa-rately.
MATERIALS AND METHODS
Plant Growth
Arabidopsis (Arabidopsis thaliana) Columbia (Lehle seeds) plants were
grown in compost:sand:perlite (3:3:1 [v/v]; Sinclair Horticulture) containing
the insecticide Intercept (0.28 g/L) in a glasshouse at 22�C without supple-
mentary light. Cell cultures were grown as described previously (Hadden
et al., 2006). Seedlings for light-grown and dark-grown analysis were grown
on one-half Murashige and Skoog media (Duchefa) containing 1% (w/v) Suc
and 0.9% agar. Plates were placed at 22�C and 16:8 h light:dark for 7 d with
plates for etiolated seedlings wrapped in two layers of aluminum foil.
Seedlings were harvested under dim green light into liquid nitrogen 4 h after
dawn. Seedlings for analysis of circadian patterns of gene expression were
grown according to Harmer et al. (2000) in a growth chamber at 24�C with a
12:12 h light:dark cycle for 7 d. After dawn on the 7th d, lights were switched
to constant light, and from subjective dawn on the 8th d, seedlings were
harvested into liquid nitrogen at 4-h intervals.
RNA Purification and cDNA Synthesis
Total RNA was purified using an SDS-based extraction buffer followed by
phenol/chloroform extraction, LiCl precipitation, and purification on Qiagen
RNeasy spin columns with a DNase I digestion to remove contaminating
genomic DNA (Hadden et al., 2006). RNA concentrations were determined by
UV absorbance spectrophotometry and RNA integrity confirmed by agarose
gel electrophoresis. RNA (2 mg) was converted to cDNA using an oligo(dT)
primer and Moloney murine leukemia virus reverse transcriptase (Superscript
II, Invitrogen) in a 40-mL reaction volume but otherwise following manufac-
turer’s instructions. For qPCR, reaction products were diluted 8-fold before
analysis. Due to variation in reference gene expression across these diverse
samples, to control for differences in efficiency of cDNA synthesis, the yield of
cDNA product was measured directly. Concentration of nucleic acids and
nucleotide removal were performed using centrifugal concentration devices
(Microcon PCR, Millipore) followed by quantitation of nucleic acids by
spectrophotometry (ND 1000 spectrophotometer, Nanodrop Technologies).
For the results reported here, the SD was ,20% of the average yield for each set
of samples.
PCR Amplification of cDNA Products
To confirm exon positions, primers were designed around the predicted
start and termination codons and used in a PCR under standard conditions
with a pool of cDNAs from a range of tissues as the template. PCR products
were ligated to pGEM T-easy cloning vector (Promega) and ligation products
used to transform Escherichia coli DH5a to ampicillin resistance. The sequence
of inserts was determined using dye-labeled M13 forward and reverse
primers in a LI-COR sequencer.
5# and 3# RACE PCR
For 5# RACE, first-strand cDNA was synthesized with an oligo(dT) primer
and an adapter-tagged primer for second-strand synthesis (RLM-RACE,
Ambion). For 3# RACE, first-strand cDNA synthesis was primed with an
adapter-tagged oligo(dT) primer. Gene-specific primary and nested primers
were designed around 200 bp from the predicted end and used in a PCR with
the adapter primer. Reaction products were cloned and sequenced, as de-
scribed above.
qPCR and Primer Design
Primers (with optimal length of 20 nt and predicted melting temperature of
60�C) for qPCR were designed using the Primer 3 software at http://frodo.
wi.mit.edu./cgi-bin/primer3/primer3.cgi (Rozen and Skaletsky, 2000) to give
amplicons of around 100 bp. Regions of each GATA gene with similarity to
other regions of the genome were identified by BLAST analysis with an E
value of 1.0, and these were excluded from the regions used for primer
selection. The sequence of each expected amplicon was then used in a BLAST
analysis against the Arabidopsis genome, with an E value of 10, to identify any
regions of weak similarity to the primers. Any amplicons with sequence
similarity to untargeted regions at the primer or immediately 3# bases were
discarded. These bases were in turn excluded for selection of additional
primers, with BLAST analysis again until wholly specific amplicons were
predicted.
Reactions were prepared using 100 pmol of each primer and cDNA
products equivalent to 50 ng of template RNA in a 20-mL reaction with PCR
master mix (Eurogentec or Bio-Rad). A standard curve was prepared from a
pool of cDNA samples diluted through five 5-fold steps and analyzed in
duplicate. Samples were analyzed using a Bio-Rad iCycler with an annealing
temperature of 60�C over 40 cycles. Following the PCR, melt curve analysis
was performed to distinguish the expected amplicon from primer dimers. The
amount of template in unknown samples was calculated from the threshold
value by the iCycler software using the standard curve results. Amplification
efficiencies were typically .75%. Measured transcript levels were normalized
to the average level for each gene across all eight samples tested. Data
presented is from analysis in duplicate of two independent biological repli-
cates.
Bioinformatics
DNA sequence comparisons were performed using BLAST programs
available at the National Center for Biotechnology Information Web site
(www.ncbi.nlm.nih.gov/BLAST). Sets of genes showing the strongest coex-
pression with each GATA factor were obtained using ACT (www.arabidopsis.
leeds.ac.uk/ACT). Probe set identifications for GATA factors and genes co-
expressed with each GATA factor were pasted into the Genevestigator
MetaAnalyzer tool (Zimmermann et al., 2004) to identify tissues where each
gene is expressed. Expression data were clustered using Java Treeview
(http://sourceforge.net/projects/jtreeview) to produce Figure 5.
Sequence data from this article can be found in the GenBank/EMBL data
libraries under accession numbers DQ875127 to DQ875134.
Supplemental Data
The following materials are available in the online version of this article.
Supplemental Table S1. Gene structure information for Arabidopsis
GATA genes.
Supplemental Table S2. Sequences of primers used for quantitative PCR
analysis of GATA gene expression patterns.
Manfield et al.
956 Plant Physiol. Vol. 143, 2007 www.plantphysiol.orgon May 31, 2018 - Published by Downloaded from
Copyright © 2007 American Society of Plant Biologists. All rights reserved.

ACKNOWLEDGMENTS
We thank Denise Ashworth for DNA sequencing and Susan Marcus for
growing and providing the Arabidopsis cell culture samples. We thank
Tobias Joyce for assistance with BLAST searches to define the family and
Ioannis Michalopoulos for plotting data producing Figure 5. We are grateful
to the numerous researchers who contributed the array data upon which
tools such as ACT and Genevestigator are dependent.
Received October 11, 2006; accepted December 10, 2006; published January 5,
2007.
LITERATURE CITED
Arabidopsis Genome Initiative (2000) Analysis of the genome sequence of
the flowering plant Arabidopsis thaliana. Nature 408: 796–815
Arguello-Astorga G, Herrera-Estrella L (1998) Evolution of light-regulated
plant promoters. Annu Rev Plant Physiol Plant Mol Biol 49: 525–555
Ballario P, Vittorioso P, Magrelli A, Talora C, Cabibbo A, Macino G (1996)
White collar-1, a central regulator of blue light responses in Neurospora,
is a zinc finger protein. EMBO J 15: 1650–1657
Bi YM, Zhang Y, Signorelli T, Zhao R, Zhu T, Rothstein S (2005) Genetic
analysis of Arabidopsis GATA transcription factor gene family reveals a
nitrate-inducible member important for chlorophyll synthesis and glu-
cose sensitivity. Plant J 44: 680–692
Bonaventure G, Ohlrogge JB (2002) Differential regulation of mRNA levels
of acyl carrier protein isoforms in Arabidopsis. Plant Physiol 128:
223–235
Borello U, Ceccarelli E, Giuliano G (1993) Constitutive, light-responsive
and circadian clock-responsive factors compete for the different L-box
elements in plant light-regulated promoters. Plant J 4: 611–619
Buzby JS, Yamada T, Tobin EM (1990) A light-regulated DNA-binding
activity interacts with a conserved region of a Lemna gibba-rbcS pro-
moter. Plant Cell 2: 805–814
Carre IA, Kay SA (1995) Multiple DNA-protein complexes at a circadian-
regulated promoter element. Plant Cell 7: 2039–2051
Casneuf T, De Bodt S, Raes J, Maere S, Van de Peer Y (2006) Nonrandom
divergence of gene expression following gene and genome duplications
in the flowering plant Arabidopsis thaliana. Genome Biol 7: R13
Castresana C, Garcia-Luque I, Alonso E, Malik VS, Cashmore AR (1988)
Both positive and negative regulatory elements mediate expression of a
photoregulated Cab gene from Nicotiana plumbaginifolia. EMBO J 7:
1929–1936
Causier B, Castillo R, Zhou JL, Ingram R, Xue YB, Schwarz-Sommer Z,
Davies B (2005) Evolution in action: following function in duplicated
floral homeotic genes. Curr Biol 15: 1508–1512
Chen M, Chory J, Fankhauser C (2004) Light signal transduction in higher
plants. Annu Rev Genet 38: 87–117
Cluis CP, Mouchel CF, Hardtke CS (2004) The Arabidopsis transcription
factor HY5 integrates light and hormone signaling pathways. Plant J 38:
332–347
Craigon DJ, James N, Okyere J, Higgins J, Jotham J, May S (2004)
NASCArrays: a repository for microarray data generated by NASC’s
transcriptomics service. Nucleic Acids Res 32: D575–D577
Czechowski T, Bari RP, Stitt M, Scheible WR, Udvardi MK (2004) Real-
time RT-PCR profiling of over 1400 Arabidopsis transcription factors:
unprecedented sensitivity reveals novel root- and shoot-specific genes.
Plant J 38: 366–379
Daniel-Vedele F, Caboche M (1993) A tobacco cDNA clone encoding a
GATA-1 zinc finger protein homologous to regulators of nitrogen
metabolism in fungi. Mol Gen Genet 240: 365–373
Dean C, van den Elzen P, Tamaki S, Dunsmuir P, Bedbrook J (1985)
Differential expression of the 8 genes of the Petunia ribulose bisphos-
phate carboxylase small subunit multi-gene family. EMBO J 4:
3055–3061
Dickey LF, Petracek ME, Sowinski DA, Hansen ER, Nguyen TT, Allen
GC, Thompson WF (1997) Light effects on ferredoxin mRNA stability
are mediated by translation. Plant Physiol 114: 1213–1227
Donald RGK, Cashmore AR (1990) Mutation of either G-Box or I-Box
sequences profoundly affects expression from the Arabidopsis Rbcs-1a
promoter. EMBO J 9: 1717–1726
Eastmond PJ, Germain V, Lange PR, Bryce JH, Smith SM, Graham IA
(2000) Postgerminative growth and lipid catabolism in oilseeds lacking
the glyoxylate cycle. Proc Natl Acad Sci USA 97: 5669–5674
Edwards KD, Anderson PE, Hall A, Salathia NS, Locke JCW, Lynn JR,
Straume M, Smith JQ, Millar AJ (2006) FLOWERING LOCUS C
mediates natural variation in the high-temperature response of the
Arabidopsis circadian clock. Plant Cell 18: 639–650
Evans T, Felsenfeld G (1989) The erythroid-specific transcription factor
Eryf1: a new finger protein. Cell 58: 877–885
Evans T, Reitman M, Felsenfeld G (1988) An erythrocyte-specific DNA-
binding factor recognizes a regulatory sequence common to all chicken
globin genes. Proc Natl Acad Sci USA 85: 5976–5980
Fu YH, Marzluf GA (1990) Site-directed mutagenesis of the zinc finger
DNA-binding domain of the nitrogen-regulatory protein Nit2 of Neu-
rospora. Mol Microbiol 4: 1847–1852
Gidoni D, Brosio P, Bond-Nutter D, Bedbrook J, Dunsmuir P (1989) Novel
cis-acting elements in Petunia Cab gene promoters. Mol Gen Genet 215:
337–344
Gilmartin PM, Sarokin L, Memelink J, Chua NH (1990) Molecular light
switches for plant genes. Plant Cell 2: 369–378
Giuliano G, Pichersky E, Malik VS, Timko MP, Scolnik PA, Cashmore
AR (1988) An evolutionarily conserved protein-binding sequence up-
stream of a plant light-regulated gene. Proc Natl Acad Sci USA 85:
7089–7093
Griffiths S, Dunford R, Coupland G, Laurie D (2003) The evolution of
CONSTANS-like gene families in barley, rice and Arabidopsis. Plant
Physiol 131: 1855–1867
Grob U, Stuber K (1987) Discrimination of phytochrome dependent light
inducible from non-light inducible plant genes: prediction of a common
light-responsive element (Lre) in phytochrome dependent light induc-
ible plant genes. Nucleic Acids Res 15: 9957–9973
Gualberti G, Papi M, Bellucci L, Ricci L, Bouchez D, Camilleri C,
Costantino P, Vittorioso P (2002) Mutations in the Dof zinc finger genes
DAG2 and DAG1 influence with opposite effects the germination of
Arabidopsis seeds. Plant Cell 14: 1253–1263
Hadden DA, Phillipson BA, Johnston KA, Brown L-A, Manfield IW,
El-Shami M, Sparkes IA, Baker A (2006) Arabidopsis PEX19 is a
dimeric protein that binds the peroxin PEX10. Mol Membr Biol 23:
325–336
Hansen ER, Petracek ME, Dickey LF, Thompson WF (2001) The 5# end of
the pea ferredoxin-1 mRNA mediates rapid and reversible light-
directed changes in translation in tobacco. Plant Physiol 125: 770–778
Harmer SL, Hogenesch LB, Straume M, Chang HS, Han B, Zhu T, Wang X,
Kreps JA, Kay SA (2000) Orchestrated transcription of key pathways in
Arabidopsis by the circadian clock. Science 290: 2110–2113
Jen CH, Manfield IW, Michalopoulos I, Pinney JW, Willats WGT,
Gilmartin PM, Westhead DR (2006) The Arabidopsis co-expression
tool (ACT): a WWW-based tool and database for microarray-based
gene expression analysis. Plant J 46: 336–348
Jeong MJ, Shih MC (2003) Interaction of a GATA factor with cis-acting
elements involved in light regulation of nuclear genes encoding chlo-
roplast glyceraldehyde-3-phosphate dehydrogenase in Arabidopsis.
Biochem Biophys Res Commun 300: 555–562
Kawaguchi R, Bailey-Serres J (2005) mRNA sequence features that con-
tribute to translational regulation in Arabidopsis. Nucleic Acids Res 33:
955–965
Kiba T, Naitou T, Koizumi N, Yamashino T, Sakakibara H, Mizuno T
(2005) Combinatorial microarray analysis revealing Arabidopsis genes
implicated in cytokinin responses through the His -. Asp phosphorelay
circuitry. Plant Cell Physiol 46: 339–355
Kikis EA, Khanna R, Quail PH (2005) ELF4 is a phytochrome-regulated
component of a negative feedback loop involving the central oscillator
components CCA1 and LHY. Plant J 44: 300–313
Kozak M (2000) Do the 5# untranslated domains of human cDNAs
challenge the rules for initiation of translation (or is it vice versa)?
Genomics 70: 396–406
Kudla B, Caddick MX, Langdon T, Martinez-Rossi NM, Bennett CF,
Sibley S, Davies RW, Arst HN (1990) The regulatory gene AreA
mediating nitrogen metabolite repression in Aspergillus nidulans—
mutations affecting specificity of gene activation alter a loop residue
of a putative zinc finger. EMBO J 9: 1355–1364
Lam E, Chua NH (1989) ASF-2: a factor that binds to the cauliflower mosaic
virus-35S promoter and a conserved GATA motif in Cab promoters.
Plant Cell 1: 1147–1156
Arabidopsis GATA Family Gene Expression Patterns
Plant Physiol. Vol. 143, 2007 957 www.plantphysiol.orgon May 31, 2018 - Published by Downloaded from
Copyright © 2007 American Society of Plant Biologists. All rights reserved.

Lam E, Kano-Murakami Y, Gilmartin P, Niner B, Chua NH (1990) A metal-
dependent DNA-binding protein interacts with a constitutive element
of a light-responsive promoter. Plant Cell 2: 857–866
Ledger S, Strayer C, Ashton F, Kay SA, Putterill J (2001) Analysis of the
function of two circadian-regulated CONSTANS-LIKE genes. Plant J 26:
14–22
Linden H, Macino G (1997) White collar 2, a partner in blue-light signal
transduction, controlling expression of light-regulated genes in Neuros-
pora crassa. EMBO J 16: 98–109
Liu PP, Koizuka N, Martin RC, Nonogaki H (2005) The BME3 (blue
micropylar end 3) GATA zinc finger transcription factor is a positive
regulator of Arabidopsis seed germination. Plant J 44: 960–971
Lowry JA, Atchley WR (2000) Molecular evolution of the GATA family of
transcription factors: conservation within the DNA-binding domain.
J Mol Evol 50: 103–115
Manfield IW, Jen C-H, Pinney JW, Michalopoulos I, Bradford JR,
Gilmartin PM, Westhead DR (2006) Arabidopsis co-expression tool
(ACT): web server tools for microarray-based gene expression analysis.
Nucleic Acids Res 34: W504–W509
Manfield IW, Reynolds LA, Gittins J, Kneale GG (2000) The DNA-binding
domain of the gene regulatory protein AreA extends beyond the
minimal zinc-finger region conserved between GATA proteins. Biochim
Biophys Acta 1493: 325–332
Merika M, Orkin SH (1993) DNA-binding specificity of GATA family
transcription factors. Mol Cell Biol 13: 3999–4010
Meyers BC, Vu TH, Tej SS, Ghazal H, Matvienko M, Agrawal V, Ning JC,
Haudenschild CD (2004) Analysis of the transcriptional complexity of
Arabidopsis thaliana by massively parallel signature sequencing. Nat
Biotechnol 22: 1006–1011
Millar AJ, Carre IA, Strayer CA, Chua NH, Kay SA (1995) Circadian clock
mutants in Arabidopsis identified by luciferase imaging. Science 267:
1161–1163
Monte E, Tepperman JM, Al-Sady B, Kaczorowski KA, Alonso JM, Ecker
JR, Li X, Zhang YL, Quail PH (2004) The phytochrome-interacting
transcription factor, PIF3, acts early, selectively, and positively in light-
induced chloroplast development. Proc Natl Acad Sci USA 101: 16091–
16098
Morris DR, Geballe AP (2000) Upstream open reading frames as regulators
of mRNA translation. Mol Cell Biol 20: 8635–8642
Nemoto Y, Kisaka M, Fuse T, Yano M, Ogihara Y (2003) Characterization
and functional analysis of three wheat genes with homology to the
CONSTANS flowering time gene in transgenic rice. Plant J 36: 82–93
Newman TC, Ohme-Takagi M, Taylor CB, Green PJ (1993) DST sequences,
highly conserved among plant SAUR genes, target reporter transcripts
for rapid decay in tobacco. Plant Cell 5: 701–714
Nishii A, Takemura M, Fujita H, Shikata M, Yokota A, Kohchi T (2000)
Characterization of a novel gene encoding a putative single zinc-finger
protein, ZIM, expressed during the reproductive phase in Arabidopsis
thaliana. Biosci Biotechnol Biochem 64: 1402–1409
Oh E, Kim J, Park E, Kim JI, Kang C, Choi G (2004) PIL5, a phytochrome-
interacting basic helix-loop-helix protein, is a key negative regulator of
seed germination in Arabidopsis thaliana. Plant Cell 16: 3045–3058
Omichinski JG, Clore GM, Schaad O, Felsenfeld G, Trainor C, Appella E,
Stahl SJ, Gronenborn AM (1993) NMR structure of a specific DNA
complex of Zn-containing DNA-binding domain of GATA-1. Science
261: 438–446
Orkin SH (1992) GATA-binding transcription factors in hematopoietic
cells. Blood 80: 575–581
Penfield S, Josse EM, Kannangara R, Gilday AD, Halliday KJ, Graham IA
(2005) Cold and light control seed germination through the bHLH
transcription factor SPATULA. Curr Biol 15: 1998–2006
Persson S, Wei HR, Milne J, Page GP, Somerville CR (2005) Identification
of genes required for cellulose synthesis by regression analysis of public
microarray data sets. Proc Natl Acad Sci USA 102: 8633–8638
Putterill J, Robson F, Lee K, Simon R, Coupland G (1995) The CONSTANS
gene of Arabidopsis promotes flowering and encodes a protein showing
similarities to zinc-finger transcription factors. Cell 80: 847–857
Reyes JC, Muro-Pastor MI, Florencio FJ (2004) The GATA family of
transcription factors in Arabidopsis and rice. Plant Physiol 134: 1718–
1732
Riechmann JL, Heard J, Martin G, Reuber L, Jiang CZ, Keddie J, Adam L,
Pineda O, Ratcliffe OJ, Samaha RR, et al (2000) Arabidopsis transcrip-
tion factors: genome-wide comparative analysis among eukaryotes.
Science 290: 2105–2110
Rozen S, Skaletsky HJ (2000) Primer3 on the WWW for general users and
for biologist programmers. In S Krawetz, S Misener, eds, Bioinformatics
Methods and Protocols: Methods in Molecular Biology. Humana Press,
Totowa, NJ, pp 365–386
Sarokin LP, Chua NH (1992) Binding-sites for 2 novel phosphoproteins,
3AF5 and 3AF3, are required for Rbcs-3a expression. Plant Cell 4:
473–483
Scazzocchio C (2000) The fungal GATA factors. Curr Opin Microbiol 3:
126–131
Schaffer R, Ramsay N, Samach A, Corden S, Putterill J, Carre IA,
Coupland G (1998) The late elongated hypocotyl mutation of Arabidop-
sis disrupts circadian rhythms and the photoperiodic control of flower-
ing. Cell 93: 1219–1229
Schindler U, Cashmore AR (1990) Photoregulated gene-expression may
involve ubiquitous DNA-binding proteins. EMBO J 9: 3415–3427
Schmid M, Davison TS, Henz SR, Pape UJ, Demar M, Vingron M,
Scholkopf B, Weigel D, Lohmann JU (2005) A gene expression map of
Arabidopsis thaliana development. Nat Genet 37: 501–506
Shen H, Moon J, Huq E (2005) PIF1 is regulated by light-mediated
degradation through the ubiquitin-26S proteasome pathway to optimize
photomorphogenesis of seedlings in Arabidopsis. Plant J 44: 1023–1035
Shikata M, Matsuda Y, Ando K, Nishii A, Takemura M, Yokota A, Kohchi
T (2004) Characterization of Arabidopsis ZIM, a member of a novel plant-
specific GATA factor gene family. J Exp Bot 55: 631–639
Smith SM, Fulton DC, Chia T, Thorneycroft D, Chapple A, Dunstan H,
Hylton C, Zeeman SC, Smith AM (2004) Diurnal changes in the
transcriptome encoding enzymes of starch metabolism provide evi-
dence for both transcriptional and post-transcriptional regulation of
starch metabolism in Arabidopsis leaves. Plant Physiol 136: 2687–2699
Sugimoto K, Takeda S, Hirochika H (2003) Transcriptional activation
mediated by binding of a plant GATA-type zinc finger protein AGP1 to
the AG-motif (AGATCCAA) of the wound-inducible Myb gene
NtMyb2. Plant J 36: 550–564
Teakle GR, Gilmartin PM (1998) Two forms of type IV zinc-finger motif
and their kingdom-specific distribution between the flora, fauna and
fungi. Trends Biochem Sci 23: 100–102
Teakle GR, Kay SA (1995) The GATA-binding protein CGF-1 is closely
related to GT-1. Plant Mol Biol 29: 1253–1266
Teakle GR, Manfield IW, Graham JF, Gilmartin PM (2002) Arabidopsis
thaliana GATA factors: organisation, expression and DNA-binding
characteristics. Plant Mol Biol 50: 43–57
Tepperman JM, Zhu T, Chang HS, Wang X, Quail PH (2001) Multiple
transcription-factor genes are early targets of phytochrome A signaling.
Proc Natl Acad Sci USA 98: 9437–9442
Tsai SF, Martin DI, Zon LI, D’Andrea AD, Wong GG, Orkin SH (1989)
Cloning of cDNA for the major DNA-binding protein of the erythroid
lineage through expression in mammalian cells. Nature 339: 446–451
Umemura Y, Ishiduka T, Yamamoto R, Esaka M (2004) The Dof domain, a
zinc finger DNA-binding domain conserved only in higher plants, truly
functions as a Cys2/Cys2 Zn finger domain. Plant J 37: 741–749
Wang ZY, Kenigsbuch D, Sun L, Harel E, Ong MS, Tobin EM (1997) A
Myb-related transcription factor is involved in the phytochrome regu-
lation of an Arabidopsis Lhcb gene. Plant Cell 9: 491–507
Wiese A, Elzinga N, Wobbes B, Smeekens S (2004) A conserved upstream
open reading frame mediates sucrose-induced repression of translation.
Plant Cell 16: 1717–1729
Zhao YX, Medrano L, Ohashi K, Fletcher JC, Yu H, Sakai H, Meyerowitz
EM (2004) HANABA TARANU is a GATA transcription factor that
regulates shoot apical meristem and flower development in Arabidop-
sis. Plant Cell 16: 2586–2600
Zimmermann P, Hirsch-Hoffmann M, Hennig L, Gruissem W (2004)
GENEVESTIGATOR. Arabidopsis microarray database and analysis
toolbox. Plant Physiol 136: 2621–2632
Manfield et al.
958 Plant Physiol. Vol. 143, 2007 www.plantphysiol.orgon May 31, 2018 - Published by Downloaded from
Copyright © 2007 American Society of Plant Biologists. All rights reserved.


![SECTORIAL FORMS AND DEGENERATE DIFFERENTIAL OPERATORS€¦ · SECTORIAL FORMS AND DEGENERATE DIFFERENTIAL OPERATORS 35 [25]. By our approach we may allow degenerate coefficients](https://img.pdfslide.us/doc/110x75/5e921c5c4d7aaf24746c11ab/sectorial-forms-and-degenerate-differential-operators-sectorial-forms-and-degenerate.jpg)