Embed Size (px)
Citation preview

UniversePG l www.universepg.com 22
Consequences of Maternal Mortality in Bangladesh Rural Families an
Experience of Gonoshasthaya Kendra (GK) 2008-2018
M. A Kashem Shaikh1*, Manzur Kadir Ahmed2, and Rezaul Haque2
1Center for Multidisciplinary Research, Gono Bishwabidyalay, Savar, Dhaka, Bangladesh; and 2Gonoshasthaya Kendra,
Savar, Dhaka, Bangladesh.
*Correspondence: [email protected] (M.A Kashem Shaikh, Ph.D; Director, Center for Multidisciplinary Research,
Gono Bishwabidyalay, Savar, Dhaka-1344, Bangladesh).
ABSTRACT
An estimated 529,000 women, from developing countries including Bangladesh, continue to die each year from
maternal causes (www.thelancet.com, 2006). In contrast, progress in reducing levels of maternal mortality,
making pregnancy and childbearing safer for women, despite being a central element of the Millennium
Development Goals (MDGs), has been much slower. To achieve this goal the GK has been working since 1972,
to reduce the maternal mortality and to provide better health services. The objective of this paper is to examine
the success rate and to provide the facts that helping to reduce maternal mortality in GK areas. GK has
increased its coverage to more than 1.2 million rural population with 43 PHC centers in 631 villages across the
country with 5 referral hospitals. This paper discusses maternal mortality in rural Bangladesh, using maternal
mortality registration data from 19 Gonoshasthaya health programme areas along with 10 health sub-centers for
the period from 2008-2018. After registration of pregnant women paramedics follow up by offering antenatal
and post natal care services. The study was conducted by analyzing the panel data in the period of 14th April,
2008 to 13th April, 2018. The findings showed out of 3125236 female population, aged 15-49,16711 died
during the study period yielding an adult death rate 0.64 per 1000 female population. This finding suggests that
maternal mortality would reduce further if women had access to adequate health care during pregnancy and
child birth.
Keywords: Consequences, Maternal Mortality, Rural Families, Experience, MDGs, and Gonoshasthaya Kendra.
INTRODUCTION:
More than 50 million women suffer from poor repro-
ductive health and severe pregnancy related illness all
over the world. In addition to that 500,000 women die
every year from pregnancy complications and child
birth. Of the deaths of the women 99% occur in deve-
loping countries bringing serious consequence for the
family, community and economy as a whole. Many
deaths could be saved if women had access to adequate
care during pregnancy and child birth. Maternal morta-
lity shows the disparities and in equities between men
and women and women’s role in societies (World
Bank, 2003).
Socio-economic condition of women has impact on
maternal death. Pregnant women in developing count-
ries have higher risk of maternal mortality than deve-
loped countries at 80 to 600 times respectively. The
life time risk of dying due to maternal causes includes
pregnancy, delivery and other related complications
are in Asia 1 in 132, in Africa 1 in 19; and in more
British Journal of Arts and Humanities, 3(2), 22-47, 2021
Publisher homepage: www.universepg.com, ISSN: 2663-7782 (Online) & 2663-7774 (Print)
https://doi.org/10.34104/bjah.021022047
British Journal of Arts and Humanities
Journal homepage: www.universepg.com/journal/bjah

Shaikh MAK / British Journal of Arts and Humanities, 3(2), 22-47, 2021
UniversePG l www.universepg.com 23
developed countries only 1 in 2976 (UNFPA, 2002).
Although, the number of births attended by trained
health workers have slightly increased from 48% in
1985 to 55% in 1996, the maternal mortality ratios at
the global level remained moderately constant (World
Bank, 2003). According to Bangladesh Maternal Mor-
tality and Health care survey 2010 the maternal mort-
ality ratio is 193 per 100000 live births (NIPORT,
2010).
From the news published on 23.11.2017, in The
Prothom Alo, it is observed from the survey that the
rate of maternal mortality has been increased in the
country. In the last survey on “The maternal mortality
and the Public Health Services, conducted in 2016,”
the Govt. said the 196 mothers died in producing 1
(one) lac babies. The first survey on the maternal
mortality was held in 2001 in the country while the
mortality rate was 322 but that in 2010 decreased to
194. Researcher said that the lack of the proper steps
with devotion and monitoring of the death rate is
increasing. The results of the survey were published
formally at the joint venture of the national population
control forum and the training organizations under the
Health Ministry. Here the technical supports were
offered by the International Centre for Diarrhoeal
Diseases Research, Bangladesh (ICDDR, B) and the
major Evaluation an Organization based on the popu-
lation Research of the USA, financed by the donors of
the USA (US AID) and the U.K. (U.K AID). While
doing cluster survey in 1(one) thousand and 922 urban
areas of the country where 2,98,284 Households and
3,21,214 women of the age from 13 to 49 were inter-
viewed. The surveys were conducted by the trained
surveyors since 22nd August, 2016 up to the 10th
February, 2017. Where the causes of the death were
ascertained by the physicians. The causes of the
maternal deaths are mainly Post-Partum Hemorrhage
(PPH). Besides, among the other causes there are
eclampsia, obstetric and prolonged labor, complication
due to abortion and others. The survey in the country
conducted on maternal mortality and public health,
shows the 31% babies are caesarians. According to
World Health Organization 10% to 15% may be com-
mon risky cases where caesarian section should be
used for the safety of life. But in Bangladesh more
than double numbers of babies are caesarians than the
number given by the WHO. Now the researchers are
afraid observing commercialized 31% caesarians now
which was 12% in 2010 and 3% in 2001.
According to survey 10 lac babies are caesarians in the
country where 31 lac babies are born in a year. 7 lac 50
thousand babies are caesarians in the private hospitals
and clinics, 43 thousand in NGO and the rest are in the
Govt. hospitals. In the Health Centers situated among
615 villages of 15 upazillas in the 13 districts of the
country, under the study areas of Gonoshasthaya
Kendra, the primary health care services are offered
where the patients of the fatal cases are usually sent to
5 (five) referral hospitals. In the health programme of
the Gonoshasthaya Kendra’s study areas in 2018,
among the total number of 12,54559 people 8181 are
identified as Ultra poor, 634203 as poor 3,62,603 as
lower middle class, 1,50037 as middle class, 67784 as
upper middle class and 31,751 as the rich. The
Demographic and Health services, information have
been collected from among those people are mentioned
below.
METHODOLOGY:
Gonoshasthaya Kendra (GK) is operating since war of
liberation 1971. During that time it was a hospital only
called Bangladesh Field Hospital which used to treat
injured and sick freedom fighters and refugees in the
eastern border of India. Following independence on 16
December, 1971 Bangladesh Field Hospital was re-
named as GK or People’s Health Center with head
office in a Savar Village, 40 km. North of Dhaka the
capital of Bangladesh and was registered as public
Charitable Trust.
During the last four decades, GK has increased its
health care services including reproductive and child
health care from about 50,000 people in 50 villages in
1972 to more than one million rural people in 592
villages (Chowdhury and Chowdhury, 2007). Now the
area further expanded and covers with 29 health
Centers, 13 districts, 17 upazilla’s and 647 villages
across the country with 5 referral hospitals. The
population is divided into 6(six) socioeconomic groups
such as Ultra poor (Aw) Poor (Ka) Lower Middle
Class (Kha) Middle Class (Ga) Upper Middle Class
(Gha) Rich Class (Umo).

Shaikh MAK / British Journal of Arts and Humanities, 3(2), 22-47, 2021
UniversePG l www.universepg.com 24
The health care services provided by GK trained health
workers called Paramedic. Each paramedic is respon-
sible for total health care of 5000 to 6000 population.
Paramedics visit every family once in a month and fill
out the event registration forms. The paramedics also
provide reproductive and health care and family plan-
ning services in its programme areas. These services
include (a) registration of pregnant women to provide
ANC related services like measurement of height,
weight, circumference of the ankle and lower leg, 2-3
inches above the ankle to check the oedema, blood
pressure, and check jaundice and anemia. They also
test urine for sugar, albumin and examine eyes, ears
and teeth, foetal movement and foetal heart sound; (b)
They also distribute iron and calcium tablets and
immunized pregnant women against tetanus and chil-
dren under age one year against six deadly diseases:
diphtheria, whooping cough, tetanus, polio, tuber-
culosis and measles; (c) Identification of high-risk
mothers through regular follow-up for the referral to
medical professional as an when needed; (d) They also
suggested the family members of the mal nutrients and
lactating pregnant women for balanced diet; (e) They
arrange meeting with family members and villagers
about the possible causes of maternal death and how
maternal death could have been prevented; (f) Orga-
nize special camps for treatment of pregnant women.
The works of paramedics are verified by the field
monitoring officer in a routine basis. They also man-
ually prepare a list of those events and send it to Savar
office for the documentation and preparation of
monthly statistical report. If needed the health workers
visit more frequently. Ante Natal Care, Postnatal care
are very important component of universal PHC
Services. During ANC, the paramedics identify high-
risk pregnant women. She is given extra care and
attention. A medical doctor will see all high-risk
mother at least once in their gestation period either in
the clinic or in the community, 76% newborn babies
checked by paramedics within first seven days of
delivery, supervisors could check 50% of new born
within first week of birth. Physician usually could visit
30% newborn in their neonatal period.
ANC and PNC is a very important component of GK’s
service. GK’s trained personnel conduct over 70%
delivery in GK service area. Most paramedics are
young women with 8-12 years of education. GK
brought Traditional Birth Attendants (TBAs) in the
mainstream of its health service delivery system which
further enriched MCH care. Health education with
community participation is one of the major activities
of GK. Every infant and maternal death is discussed in
the community to draw lesson to improve health
service and social and household community action.
Besides integrated health care programmes (Homeo-
pathy, Traditional system of medicine- Ayurvedh and
Physiotherapy (non drug therapy) basic School,
women skill development and health orientated public-
cations, GK runs a number of manufacturing industries
(essential drug related). Profits are invested in social
development programme. GK also provides both home
based and hospital based care. On the basis of stati-
stical report field monitoring officer immediately visit
each village of the events collected to check the incon-
sistency if any. Moreover, after completion of entry of
vital events data across checking is done with statis-
tical report to see any omission or addition of births,
deaths, including neonatal/infant and maternal deaths.
In this study the maternal mortality data used for a
period of 11 years from the 14th April, 2008 to 13th
April 2018 of the G.K health services programme
areas covered 13 districts, 17 upazillas and 647 villa-
ges is now one of the largest health service provider’s
outside the Govt. of Bangladesh (BDS Paper no-14
Dhaka, 2007). The study explains the GK’s experience
in primary health care and examines its impact on
reduction of maternal mortality on the years. This kind
of study on maternal mortality is rare in Bangladesh
that used longitudinal data, in which several cohorts
were followed from the time of conceptions until the
outcome of pregnancies.
RESULTS:
In the present study Table 1 shows the types of
delivery during the last 11(2008-2018) years within
GK working areas. During this time total deliveries
occurred 1,49,337. Of the total deliveries 1,27,816
(85.59%) normal, 19,367(12.97%) Caesarian, 2,089
(1.40%) episiotomy, 27(0.02%) vacuum and only 38
(0.03%) forsafe.

Shaikh MAK / British Journal of Arts and Humanities, 3(2), 22-47, 2021
UniversePG l www.universepg.com 25
Table 1: Type of Delivery (live birth& still birth), 1414-1424(2008-2018)
Table 2: Total Live Birth Delivery Place by Socio-economic Status 1414-1424 (2008-2018)
Delivery
Place
S E S group
Total Destitute
Ultra-
poor Poor
Lower-
Middle class
Middle-
class
Uper Middle-
Class Rich
Home
Delivery
59
(88.06%)
301
(93.19%)
89959
(83.82%)
20563
(58.85%)
1841
(51.68%)
62
(29.11%)
45
(33.58%)
112830
(76.99%)
Institutional
Delivery
8
(11.94%)
22
(6.81%)
17360
(16.18%)
14380
(41.15%)
1721
(48.32%)
151
(70.89%)
89
(66.42%)
33731
(23.01%)
Total 67
(100%)
323
(100%)
107319
(100%)
34943
(100%)
3562
(100%)
213
(100%)
134
(100%)
146561
(100%)
Table 2 shows the number of delivery according to
Socio economic status of the families. Among 146561
deliveries, 67 are in the destitute group of which 59
(88.06%) are home delivery and 8(11.94%) are insti-
tutional delivery. Among the Ultra-poor 323 deliveries
occurred, of them 301(93.19%) are home delivery and
22(6.81%) institutional delivery. In the poor families
out of 107319 deliveries, 89959(83.82%) are home
delivery and 17360(16.18%) are institutional deli-
very. Among 34943 deliveries of lower middle class
families, 20563(58.85%) are home delivery and 14380
(41.15%) are institutional delivery. In the middle class
out of total deliveries 3562, 1841 (51. 68%) are home
delivery and 1721(48.32%) are institutional delivery.
Among the upper middle class total 213 deliveries,
62(29.11%) are home delivery and 151(70.89%) are
institutional delivery. In case of rich families, 45
(33.58%) are home delivery and 89(66.42%) are
institutional delivery. On the whole it is found that the
highest number of 93.19% home deliveries occurred
among the ultra-poor families on the contrary lowest
29% in the Uper middle class.. Among the total
deliveries 76.99% conducted in home delivery and
23.01% are institutional deliveries.
Table 3 and Fig 1 show the year wise maternal
mortality rates (per 100000 live births) by socio-eco-
nomic status of Gonoshasthaya Kendra's Health and
Demographic Surveillance areas in 1414-1424 (2008-
2018). During these 11 years, total live birth 146561
and maternal mortality is 205. According to social
economic status, 2(2985.7) maternal mortality found
in destitute group, 1(309.60) in Ultra poor, 154
(143.12) in poor, 45(330.00) in lower middle class and
3(83.40) maternal death occurred in middle class
families. There were 5 socio-economic groups during
1414-1419 and since 1420 socio-economic groups
have been classified into six.
Yea
r
No
rma
l
To
tal
Deliv
ery
%
Ca
esaria
n
%
Ep
isio-
tom
y
%
Va
cuu
m
%
Fo
rsafe
%
To
tal
Deliv
ery
To
tal
Deliv
ery
%
1414 (2007-2008) 15277 95.03 670 4.17 126 0.78 2 0.01 1 0.01 16076 100
1415 (2008-2009) 13230 95.03 604 4.34 77 0.55 10 0.07 1 0.01 13922 100
1416 (2009-2010) 11901 93.64 685 5.39 114 0.90 7 0.06 2 0.02 12709 100
1417 (2010-2011) 12800 93.08 842 6.12 108 0.79 0 0.00 1 0.01 13751 100
1418 (2011-2012) 12325 92.34 801 6.00 201 1.51 7 0.05 13 0.10 13347 100
1419 (2012-2013) 11404 88.46 1282 9.94 192 1.49 0 0.00 13 0.10 12891 100
1420 (2013-2014) 10630 82.95 2072 16.17 113 0.88 0 0.00 0 0.00 12815 100
1421 (2014-2015) 10540 79.84 2494 18.89 166 1.26 0 0.00 1 0.01 13201 100
1422 (2015-2016) 9524 74.15 3008 23.42 310 2.41 0 0.00 3 0.02 12845 100
1423 (2016-2017) 9343 72.03 3279 25.28 347 2.68 0 0.00 2 0.02 12971 100
1424(2017-2018) 10842 73.21 3630 24.51 335 2.26 1 0.01 1 0.01 14809 100
Total 127816 100 19367 100 2089 100 27 100 38 100 149337 100
Percent 85.59 12.97 1.40 0.02 0.03 100%

Shaikh MAK / British Journal of Arts and Humanities, 3(2), 22-47, 2021
UniversePG l www.universepg.com 26
Table 3: Year wise socio-economic status of maternal mortality rate of GKs health and demographic surveillance areas in Bangladesh, 1414-1424 (2008-2018)
Yea
r
Socio-economic Status
To
tal
Birth
To
tal
Dea
th
MM
R
Birth
Aw
Dea
th
AW
Ra
te
Birth
Ah
Dea
th
Ah
Ra
te
Birth
Ka
Dea
th
Ka
Ra
te
Birth
Kh
a
Dea
th
Kh
a
Ra
te
Birth
Ga
Dea
th
Ga
Ra
te
Birth
Gh
a
Dea
th
Gh
a
Ra
te
Birth
Um
o
Dea
th
Um
o
Ra
te
1414 (2007-2008) 3 0 0.00 133 0 0 13191 27 204.69 2367 7 295.73 180 0 0.00 0 0 0 0 0 0 15874 34 214.19
1415 (2008-2009) 3 0 0.00 75 1 1333.33 11196 15 133.98 2210 1 45.25 99 0 0.00 0 0 0 0 0 0 13583 17 125.16
1416 (2009-2010) 3 0 0.00 44 0 0 10216 13 127.25 2234 0 0.00 109 0 0.00 0 0 0 0 0 0 12606 13 103.13
1417 (2010-2011) 1 0 0.00 18 0 0 10552 14 132.68 2248 2 88.97 137 0 0.00 0 0 0 0 0 0 12956 16 123.49
1418 (2011-2012) 0 0 0.00 31 0 0 11078 9 81.24 1928 3 103.73 159 0 0.00 0 0 0 0 0 0 13196 12 90.94
1419 (2012-2013) 2 0 0.00 22 0 0 10357 14 135.17 2098 4 190.66 256 0 0.00 0 0 0 0 0 0 12735 18 141.34
1420 (2013-2014) 21 0 0.00 0 0 0 8888 12 112.51 3259 3 92.05 427 0 0.00 76 0 0 25 0 0 12696 15 118.15
1421 (2014-2015) 15 1 6666.67 0 0 0 8399 12 142.87 4071 7 171.95 519 1 192.68 21 0 0 34 0 0 13059 21 160.81
1422 (2015-2016) 13 1 7692.31 0 0 0 7693 11 116.99 4140 2 48.31 641 0 0.00 28 0 0 28 0 0 12543 14 111.62
1423 (2016-2017) 6 0 0.00 0 0 0 7830 13 166.03 4440 5 112.61 447 2 447.43 19 0 0 14 0 0 12756 20 156.79
1424(2017-2018) 0 0 0 0 0 0 8201 14 170.71 5621 11 195.69 623 0 0 78 0 0 34 0 0 14557 25 171.74
Total 67 2 2985.07 323 1 309.60 107601 154 143.12 34616 45 330.00 3597 3 83.40 222 0 0 135 0 0 146561 205 139.87
Fig 1: Trend and Pattern of Maternal Mortality Rate of Gonoshasthaya Kendra’s Health and Demographic Surveillance areas in Bangladesh, 1414-1424
(2008-2018).
Note: After spot verification monitoring officers found 5 misreporting cases 1 in 1418(2011-2012), 2 in 1420(2013-2014) and 2 in 1422(2015-2016).

Shaikh MAK / British Journal of Arts and Humanities, 3(2), 22-47, 2021
UniversePG l www.universepg.com 27
According to the information of Gonoshasthaya
Kendra, during the last 11 years (1414-1424) the ratio
of Maternal Mortality was 2007-08: 214.19, 2008-09:
125.16, 2009-10: 103.13, 2010-11: 123.49, 2011-12:
90.94, 2012-13: 141.34, 2013-14: 118.15, 2014-15:
160.81, 2015-16: 111.62, 2016-17: 156.79 and 2017-
18: 171.74. The MMR was 111.62 in GK working
area during 2015-16 which was less than the targeted
rate of MDGs. This achievement is a blessing for the
people of GK working areas. To achieve this, the
health workers of Gonoshasthaya Kendra contacted
with the local TBA and co-ordinate with pregnant
mothers along with timely follow-up, supplying
medicine and all other necessary consultation.
If any complication be seen, at once they take nece-
ssary steps to solve the problems of pregnant mothers
and her children. As a result both of the mother and
her children saved from death. The MMR in 2016-17
was 156.79 increased to 40.47 percent from the
preceding year. The MMR in 2017-18 was 171.74
also increased but the increasing rate is less 9.54%
than the preceding year (Fig 1).
The reasons of increasing MMR are given below –
1) Increase caesarean section deliveries.
2) Influenced by the broker to go in the private
clinic.
3) After conducting Ultra sonography, doctors
of that clinic influence the pregnant mother
and her guardian at once to conduct caesa-
rean delivery otherwise her patient or her
baby may die. It is the business strategy of
private clinic.
4) Unskilled doctors conduct caesarean deli-
very, and sometimes heavy bleeding occurs,
which cannot control the unskilled doctor and
refer to other hospital, and in maximum cases
the patient died on the way.
5) Sometimes trained TBA also takes the
pregnant mother to the private clinic or hos-
pital in spite of a chance of normal delivery
at home. Because in case of normal delivery
at home she may get at best Tk. 500 but if
she takes her in the private clinic, the
authority of the clinic gives her at least
Tk.1000 per delivery. The clinic agents have
contact with the TBA in this respect.
6) Now the financial condition of general
people has increased; they take decision for
caesarean delivery from the beginning. Be-
sides, there are some misconceptions about
caesarian delivery and broker or other agents
mislead the mother and her guardian. This is
one of the main reasons of increasing MMR.
Table 4: Causes of Maternal Deaths by Socio-economic Status, 1414 -1424 (2008-2018)
Ca
uses o
f
dea
th
Socio-economic Status
To
tal
Percen
t of
Direct
cau
ses
Percen
t of
all d
irect
cau
ses of
dea
th
Destitu
te
Ultra
-
po
or
Po
or
Lo
wer-
mid
dle
class
Mid
dle-
class
Up
per
Mid
dle-
class
Rich
Direct causes of
death
PPH without retained
placenta 1 0 42 15 0 0 0 58 35.37 28.29
PPH with retained
placenta 1 0 30 8 0 0 0 39 23.78 19.02
Post partum Eclampsia 0 0 14 8 1 0 0 23 14.02 11.22
Ante partum Eclampsia 0 1 8 5 1 0 0 15 9.15 7.32
Ante pertum
Haemorrhage 0 0 10 0 1 0 0 11 6.71 5.37
Septicemia 0 0 4 2 0 0 0 6 3.66 2.93
Obstructed labour 0 0 5 0 0 0 0 5 3.05 2.44
Ruptured uterus 0 0 3 0 0 0 0 3 1.83 1.46
Pre-Eclampsia 0 0 3 0 0 0 0 3 1.83 1.46
Prolonged labour 0 0 0 1 0 0 0 1 0.61 0.49
Total 2 1 119 39 3 0 0 164 100 80.00
Not directly
related to
maternal death
Anaemia 0 0 7 0 0 0 0 7 17.07 3.41
Hypertension 0 0 6 1 0 0 0 7 17.07 3.41
Cardiac Failure 0 0 5 0 0 0 0 5 12.20 2.44
oedema+Jaundice 0 0 3 1 0 0 0 4 9.76 1.95
Respiratory failure 0 0 4 0 0 0 0 4 9.76 1.95
Typhoid fever 0 0 2 0 0 0 0 2 4.88 0.98
Asthma 0 0 1 1 0 0 0 2 4.88 0.98

Shaikh MAK / British Journal of Arts and Humanities, 3(2), 22-47, 2021
UniversePG l www.universepg.com 28
Blood reaction 0 0 2 0 0 0 0 2 4.88 0.98
Renal failure 0 0 1 1 0 0 0 2 4.88 0.98
Anaesthetic hazard 0 0 1 0 0 0 0 1 2.44 0.49
Hepatic
edima+tuberculosis 0 0 0 1 0 0 0 1 2.44 0.49
Intestinal Obstraction 0 0 0 1 0 0 0 1 2.44 0.49
Post partum DCM with
LVF 0 0 1 0 0 0 0 1 2.44 0.49
Hung to Death 0 0 1 0 0 0 0 1 2.44 0.49
Unknown 0 0 1 0 0 0 0 1 2.44 0.49
Total 0 0 35 6 0 0 0 41 100 20.00
Grand total 2 1 154 45 3 0 0 205 100 100
Table 4 shows the causes of maternal deaths by
socio-economic status. During last 11 years there
were total 205 maternal deaths within the GK work-
ing areas. The first and main cause of maternal death
is Post Partum Hemorrhage (PPH) and the rate is
59.15% among the total death. Second highest
23.17% is the cause of post and pre partum eclam-
psia and the third highest 6.71% is the reason of
Ante Partum Hemorrhage (APH).
Among the total maternal death, 108 have been died
by ante partum hemorrhage and post partum hemo-
rrhage with and without retained placenta. On the
basis of location the most 35(32.41%) have been
died in the government hospital. Besides, 21(19.
44%) in the private hospital, 21(19.44%) on the way
to hospital, 19(17.59%) in the husband`s house,
9(8.33%) in the father`s house and 3(2.78%) mate-
rnal death occurred in the GK hospital (Table 5)
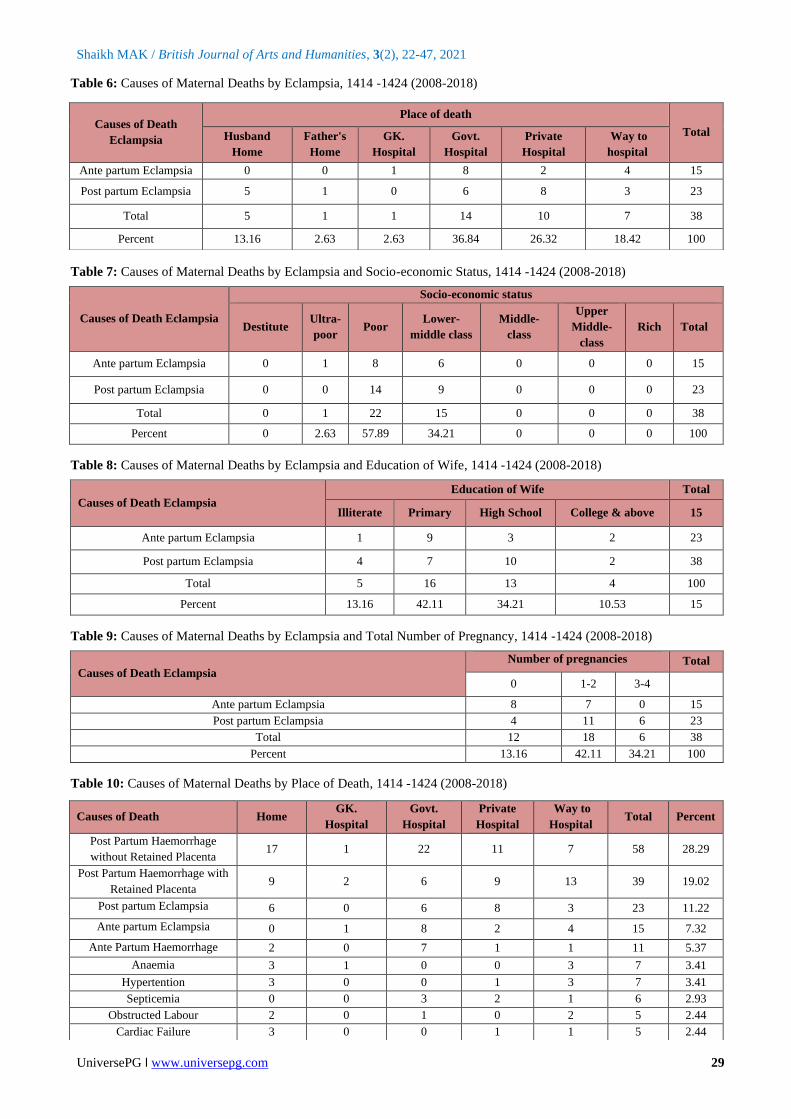
Table 6 show that 38 maternal deaths occurred before
and after delivery for the reason of eclampsia. On the
basis of place of death, the most of 14(36.84%) died
in Government hospital. Besides, second highest
10(26.32%) in the private hospital, 7(18.42%) on the
way to hospital, 5(13.16%) in the husband`s house,
1(2.63%) in the father`s house and 1(2.63%) maternal
death occurred in the GK hospital.
Table 7 show that 38 maternal deaths happened be-
fore and after delivery for the reason of Eclampsia.
On the basis of their economic status, 22(57.89%)
were poor families. 15(39.47%) were lower middle
class and only 1(2.63%) was in the destitute family.
Table 5: Causes of Maternal Deaths by PPH, 1414 -1424 (2008-2018)
Table 8 showed that 38 maternal deaths occurred due
to Eclampsia. Before and after delivery for the reason
of On the basis of their educational qualifications,
5(13.2%) were illiterate. Besides, Primary passed 16
(42.1%), secondary school educated 13(34.2%) and
college and other educated 4(10.5%).
Table 9 showed that 38 maternal deaths occurred
before and after delivery for the reason of Eclampsia.
On the basis of their number of pregnancy, 18
(42.11%) mother died who were 1to 2 times pregnant.
Besides, 12(13.16%) were first pregnant, 6(34.21%)
were 3 to 4 times pregnant and 2(10.53%) were 5 to 6
times pregnant died at the time of delivery.
According to the place of death, at best 63(30.73%)
mothers died in the government hospital, 53(25.85%)
at home, 42(20.49%) on the way to hospital 40 (19.
51%) in private hospital and only 7 (3.41%) died in
GK hospital.
According to the causes of death 108 (52.68%) died
due to postpartum and ante partum hemorrhage.
Second causes of death are eclampsia before and after
delivery. 38 (18.54%) died due to pre and post
eclampsia and the remaining died for other reasons
(Table 10).
Causes of Death PPH
Place of Death
Total Husban
d Home
Father's
Home
GK.
Hospital
Govt.
Hospital
Private
Hospital
Way to
hospital
Ante Partum Haemorrhage 1 1 0 7 1 1 11
Post Partum Haemorrhage with Retained Placenta 7 2 2 6 9 13 39
Post Partum Haemorrhage without Retained Placenta 11 6 1 22 11 7 58
Total 19 9 3 35 21 21 108
Percent 17.59 8.33 2.78 32.41 19.44 19.44 100
Shaikh MAK / British Journal of Arts and Humanities, 3(2), 22-47, 2021
UniversePG l www.universepg.com 29
Table 6: Causes of Maternal Deaths by Eclampsia, 1414 -1424 (2008-2018)
Table 7: Causes of Maternal Deaths by Eclampsia and Socio-economic Status, 1414 -1424 (2008-2018)
Causes of Death Eclampsia
Socio-economic status
Destitute Ultra-
poor Poor
Lower-
middle class
Middle-
class
Upper
Middle-
class
Rich Total
Ante partum Eclampsia 0 1 8 6 0 0 0 15
Post partum Eclampsia 0 0 14 9 0 0 0 23
Total 0 1 22 15 0 0 0 38
Percent 0 2.63 57.89 34.21 0 0 0 100
Table 8: Causes of Maternal Deaths by Eclampsia and Education of Wife, 1414 -1424 (2008-2018)
Causes of Death Eclampsia
Education of Wife Total
Illiterate Primary High School College & above 15
Ante partum Eclampsia 1 9 3 2 23
Post partum Eclampsia 4 7 10 2 38
Total 5 16 13 4 100
Percent 13.16 42.11 34.21 10.53 15
Table 9: Causes of Maternal Deaths by Eclampsia and Total Number of Pregnancy, 1414 -1424 (2008-2018)
Causes of Death Eclampsia
Number of pregnancies Total
0 1-2 3-4
Ante partum Eclampsia 8 7 0 15
Post partum Eclampsia 4 11 6 23
Total 12 18 6 38
Percent 13.16 42.11 34.21 100
Table 10: Causes of Maternal Deaths by Place of Death, 1414 -1424 (2008-2018)
Causes of Death
Eclampsia
Place of death
Total Husband
Home
Father's
Home
GK.
Hospital
Govt.
Hospital
Private
Hospital
Way to
hospital
Ante partum Eclampsia 0 0 1 8 2 4 15
Post partum Eclampsia 5 1 0 6 8 3 23
Total 5 1 1 14 10 7 38
Percent 13.16 2.63 2.63 36.84 26.32 18.42 100
Causes of Death Home GK.
Hospital
Govt.
Hospital
Private
Hospital
Way to
Hospital Total Percent
Post Partum Haemorrhage
without Retained Placenta 17 1 22 11 7 58 28.29
Post Partum Haemorrhage with
Retained Placenta 9 2 6 9 13 39 19.02
Post partum Eclampsia 6 0 6 8 3 23 11.22
Ante partum Eclampsia 0 1 8 2 4 15 7.32
Ante Partum Haemorrhage 2 0 7 1 1 11 5.37
Anaemia 3 1 0 0 3 7 3.41
Hypertention 3 0 0 1 3 7 3.41
Septicemia 0 0 3 2 1 6 2.93
Obstructed Labour 2 0 1 0 2 5 2.44
Cardiac Failure 3 0 0 1 1 5 2.44

Shaikh MAK / British Journal of Arts and Humanities, 3(2), 22-47, 2021
UniversePG l www.universepg.com 30
Table 11: Type of Delivery, 1414 -1424 (2008-2018)
Type of Delivery No. of Maternal Deaths Percent
Died before delivery(Baby not delivered) 35 17.07
Lower Uterine Caesarian Section 48 23.41
Normal vaginal delivery 122 59.51
Total 205 100.
During the last eleven years (1414-1424) total mater-
nal deaths were 205 within the GK catchment areas.
Among them 35(17.07%) mothers died before deli-
very, 48(23.41%) died during and after caesarian
section deliveries. On the other hand 122(59.51%)
died during and after normal vaginal deliveries
(Table 11).
Table 12 Shows the number of live birth and mat-
ernal death during the last eleven years from1414 to
1424. Within these eleven years, total live births and
maternal deaths were 146561 and 205 respectively.
Among these 205 maternal deaths 48(23.4%)
occurred during and/or after caesarean section deli-
veries. The maximum 8 mothers died due to caesa-
rean section deliveries in the year, 1419 and second
highest 7 mothers died in 1424 for the same causes.
35(17.1%) mother died before delivery of the baby
due to various pregnanancy related complications.
The highest number of maternal deaths 7(20%)
occurred before delivery in 1414.
Table 12: Year wise Type of Maternal Death and Year wise Caesarean 1414-1424(2008-2018)
Year Total Live
Birth
No. of Total
Maternal
Death
Percent of
Maternal
Death
Year wise
Maternal
Death by C/S
Percent
of C/S
Death
Died
Before
Delivery
Percent of
Died before
Delivery
1414 (2007-2008) 15874 34 16.59 2 4.17 7 20.00
1415 (2008-2009) 13583 17 8.29 2 4.17 3 8.57
1416 (2009-2010) 12606 13 6.34 1 2.08 4 11.43
1417 (2010-2011) 12956 16 7.80 2 4.17 6 17.14
1418 (2011-2012) 13196 12 5.85 6 12.50 1 2.86
1419 (2012-2013) 12735 18 8.78 8 16.67 0 0.00
1420 (2013-2014) 12696 15 7.32 3 6.25 6 17.14
1421 (2014-2015) 13059 21 10.24 6 12.50 2 5.71
Oedema+Jaundice 0 0 3 1 0 4 1.95
Respiratory Failure 3 0 0 0 0 3 1.46
Ruptured Uterus 0 1 2 0 0 3 1.46
Pre-Eclampsia 1 0 1 0 1 3 1.46
Renal failure 1 0 0 1 0 2 0.98
Typhoid fever 0 0 1 1 0 2 0.98
Asthma 1 0 0 0 1 2 0.98
blood reaction 0 1 0 0 1 2 0.98
Brain stroke 0 0 0 0 1 1 0.49
Prolonged labour 0 0 0 1 0 1 0.49
Unknown 1 0 0 0 0 1 0.49
Livara pani +TB 0 0 1 0 0 1 0.49
Intestinal Obstraction 0 0 0 1 0 1 0.49
Post partum DCM with LVF 0 0 1 0 0 1 0.49
Hung to Death 1 0 0 0 0 1 0.49
Anesthetic hazard 0 0 1 0 0 1 0.49
Total 53 7 63 40 42 205 100
Percent 25.85 3.41 30.73 19.51 20.49 100

Shaikh MAK / British Journal of Arts and Humanities, 3(2), 22-47, 2021
UniversePG l www.universepg.com 31
1422 (2015-2016) 12543 14 6.83 5 10.42 2 5.71
1423 (2016-2017) 12756 20 9.76 6 12.50 1 2.86
1424(2017-2018) 14557 25 12.20 7 14.58 3 8.57
Total 146561 205 100 48 100 35 100
Table 13: No. of Maternal Deaths (Died before delivery of Child) by Place of Death, 1414-1424 (2008-2018)
Place of Death Total Delivery No. of Maternal Deaths Percent of Death
Home 112830 10 28.57
Hospital 33731 13 37.14
Way to Hospital 0 12 34.29
Total 146561 35 100
Table 13 Showed that out of 146561 home deliveries
35 maternal deaths occurred before delivery. Among
the maternal deaths 10 (28.57%) died at home,
13(37.10%) died in the hospital and 12(34.29%) died
on the way to hospital.
Table 14 Showed that of the total146561 deliveries
122 mothers died at the time of normal vaginal
delivery. Among them 44(36.07%) mother died at
home and 78(63.93%) mother died in the hospital.
Table 15 Showed the information of delivery place
and delivery attendants. Among 122 mother, 87
(71.31%) delivered by TBA at home, 10(8.20%) by
doctors at hospital, 9(7.38%) delivered by nurses (1 is
at home and 8 is at hospital), 5(4.10%) by health
workers (I is at home, 4 is at hospital), 5(4.10%) by
themselves and 6(4.92%) by the relatives (5 is at
home and 1 is on the way to hospital).
Table 14: No. of Normal Vaginal Delivery of Maternal Deaths by Place of Death, 1414-1424 (2008-2018)
Place of Death Total Delivery No. of Maternal Deaths Percent of Normal Vaginal Maternal Deaths
Home 112830 44 36.07
Hospital 33731 78 63.93
Total 146561 122 100
Table 15: Maternal Deaths by Place of Delivery and Delivery Attendant 1414-1424 (2008-2018)
Place of normal
vaginal delivery
Attendant of Normal Vaginal Delivery Total vaginal
delivery
Percent
Total
Birth
Percent per
1000 live birth TBAs Doctor Nurse Health worker Self Relatives
At home 87 0 1 1 5 5 99 81.15 112830 0.88
Hospital 0 10 8 4 0 0 22 18.03 33731 0.65
Way to Hospital 0 0 0 0 0 1 1 0.82 0 0.00
Total 87 10 9 5 5 6 122 100 146561 0.83
percent 71.31 8.20 7.38 4.10 4.10 4.92 100
Table 16: Delivery Attendant 1414-1424 (2008-2018)
Attendant
Delivery
Attendant delivery
(live birth+still birth)
Attendant delivery
(live birth)
Total birth (live birth
+ still birth) (%)
Maternal death
attended
Maternal death
per 1000 live birth
TBAs 102920 101509 68.92 87 0.86
Doctor 20471 20100 13.71 58 2.89
Private Nurse 3714 3484 2.49 9 2.58
GK Health worker 7087 6907 4.75 5 0.72
Relatives 9782 9537 6.55 6 0.63
Gov. nurse 4122 3833 2.76 0 0.00
FWV 179 169 0.12 0 0.00
Village doctor 243 234 0.16 0 0.00
Medical assistant 172 151 0.12 0 0.00
NGO health worker 585 581 0.39 0 0.00
Self 62 56 0.04 5 89.29
Died before delivery 0 0 0.00 35 0.00
Total 149337 146561 100 205 1.40

Shaikh MAK / British Journal of Arts and Humanities, 3(2), 22-47, 2021
UniversePG l www.universepg.com 32
Table 16 Shows the delivery attendants information.
During the last eleven years, 1414-1424 total births
were 149337 including 101509 live and 1411 still
births. Out of the total 149337 deliveries, maternal
deaths were 205. Of the 205 maternal deaths, 87
(68.92%) deliveries resulted live births attended by
TBA, 58 (13.83%) by MBBS doctors, 9(2.41%) by
private nurses, 5(4.79%) by GK paramedics, 6 (6.
47%) by relatives and 5 (.04%) by themselves. Of the
205 maternal deaths 35 occurred before delivery.
Table 17 Shows the place of death of the 35 maternal
deaths occurred before delivery. Among them at best
12(34.29%) died on the way to hospital. Second
highest 9(25.71%) died in the Government hospital,
8(22.86%) died in their husbands house, 3 (8.57%)
died in private hospital, 2(5.71 %) died in father’s
house and only 1(2.86%) 3 died in GK hospital.
Table 18 Presents the number of births delivered in
both husband’s and father’s house were 112830 of
which 114 mothers died. Of the 114 maternal deaths
53 died at home, 1 in GK hospital, 22 in Govt. hos-
pital, 12 in Private hospital, and 26 on the way to hos-
pital. The mortality rate was 101.04 at home, 91.04 in
GK hospital, and 798.53 in Private hospital 164.70
and 102.56 in NGO hospital. However, over-all mort-
ality rate was 139.87 during the period 2008-2018.
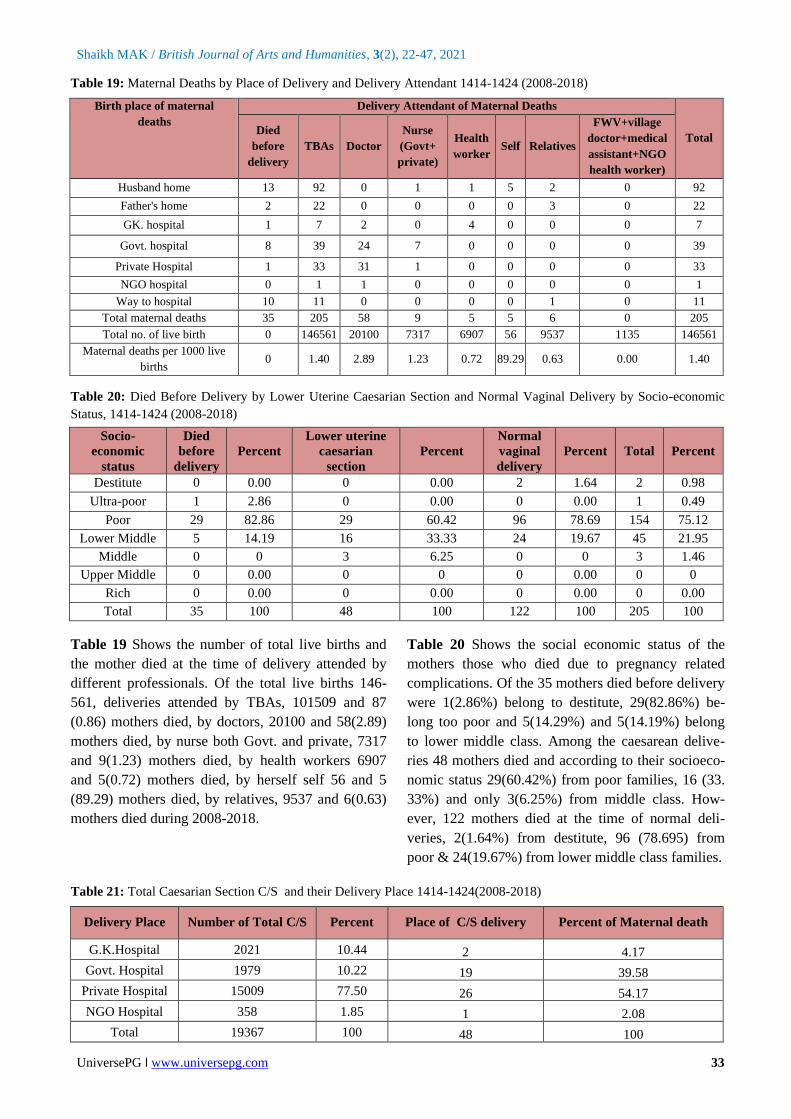
Table 19 Shows the number of total live births and
the mother died at the time of delivery attended by
different professionals. Of the total live births
146561, deliveries attended by TBAs, 101509 and 87
(0.86) mothers died, by doctors, 20100 and 58(2.89)
mothers died, by nurse both Govt. and private, 7317
and 9(1.23) mothers died, by health workers 6907 and
5(0.72) mothers died, by herself self 56 and 5(89.29)
mothers died, by relatives, 9537 and 6(0.63) mothers
died during 2008-2018.
Table 20 Presents the number of births delivered in
both husband’s and father’s house were 112830 of
which 114 mothers died. Of the 114 maternal deaths
53 died at home, 1 in GK hospital, 22 in Govt.
hospital, 12 in Private hospital, and 26 on the way to
hospital. The mortality rates were 101.04 at home,
91.04 in GK hospital, and 798.53 in Private hospital
164.70 and 102.56 in NGO hospital. However,
overall mortality rate was 139.87 during the period
2008-2018.
Table 17: Died Before Delivery (Baby not Delivered) By Place of Deaths, 1414-1424(2008-2018)
Place of Death Maternal death (Died Before Delivery) Percent
Husband’s Home 8 22.86
Father's Home 2 5.71
GK. Hospital 1 2.86
GOVT. Hospital 9 25.71
Private Hospital 3 8.57
Way to hospital 12 34.29
Total 35 100
Table 18: Maternal Deaths by Place of Delivery and Place of Death 1414-1424 (2008-2018)
Place of Delivery
Total Live
Birth
Maternal Death
Place of Birth Place of Maternal Death
Total
Per
100000
Live
Birth Birth % No % Home
GK.
Hospital
GOVT.
Hospital
Private
Hospital
Way to
Hospital
Home 112830 76.99 114 55.61 53 1 22 12 26 114 101.04
GK. Hospital 7689 5.25 7 3.41 0 6 0 1 0 7 91.04
Govt. Hospital 4884 3.33 39 19.02 1 0 34 1 3 39 798.53
Private hospital 20037 13.67 33 16.10 0 0 4 26 3 33 164.70
NGO hospital 975 0.67 1 0.49 0 0 1 0 0 1 102.56
Upazilla hospital 146 0.10 0 0.00 0 0 0 0 0 0 0.00
Way to hospital 0 0.00 11 5.37 0 0 1 0 10 11 0.00
Total 146561 100 205 100 54 7 62 40 42 205 139.87
Shaikh MAK / British Journal of Arts and Humanities, 3(2), 22-47, 2021
UniversePG l www.universepg.com 33
Table 19: Maternal Deaths by Place of Delivery and Delivery Attendant 1414-1424 (2008-2018)
Birth place of maternal
deaths Delivery Attendant of Maternal Deaths
Total Died
before
delivery
TBAs Doctor
Nurse
(Govt+
private)
Health
worker Self Relatives
FWV+village
doctor+medical
assistant+NGO
health worker)
Husband home 13 92 0 1 1 5 2 0 92
Father's home 2 22 0 0 0 0 3 0 22
GK. hospital 1 7 2 0 4 0 0 0 7
Govt. hospital 8 39 24 7 0 0 0 0 39
Private Hospital 1 33 31 1 0 0 0 0 33
NGO hospital 0 1 1 0 0 0 0 0 1
Way to hospital 10 11 0 0 0 0 1 0 11
Total maternal deaths 35 205 58 9 5 5 6 0 205
Total no. of live birth 0 146561 20100 7317 6907 56 9537 1135 146561
Maternal deaths per 1000 live
births 0 1.40 2.89 1.23 0.72 89.29 0.63 0.00 1.40
Table 20: Died Before Delivery by Lower Uterine Caesarian Section and Normal Vaginal Delivery by Socio-economic
Status, 1414-1424 (2008-2018)
Socio-
economic
status
Died
before
delivery
Percent
Lower uterine
caesarian
section
Percent
Normal
vaginal
delivery
Percent Total Percent
Destitute 0 0.00 0 0.00 2 1.64 2 0.98
Ultra-poor 1 2.86 0 0.00 0 0.00 1 0.49
Poor 29 82.86 29 60.42 96 78.69 154 75.12
Lower Middle 5 14.19 16 33.33 24 19.67 45 21.95
Middle 0 0 3 6.25 0 0 3 1.46
Upper Middle 0 0.00 0 0 0 0.00 0 0
Rich 0 0.00 0 0.00 0 0.00 0 0.00
Total 35 100 48 100 122 100 205 100
Table 19 Shows the number of total live births and
the mother died at the time of delivery attended by
different professionals. Of the total live births 146-
561, deliveries attended by TBAs, 101509 and 87
(0.86) mothers died, by doctors, 20100 and 58(2.89)
mothers died, by nurse both Govt. and private, 7317
and 9(1.23) mothers died, by health workers 6907
and 5(0.72) mothers died, by herself self 56 and 5
(89.29) mothers died, by relatives, 9537 and 6(0.63)
mothers died during 2008-2018.
Table 20 Shows the social economic status of the
mothers those who died due to pregnancy related
complications. Of the 35 mothers died before delivery
were 1(2.86%) belong to destitute, 29(82.86%) be-
long too poor and 5(14.29%) and 5(14.19%) belong
to lower middle class. Among the caesarean delive-
ries 48 mothers died and according to their socioeco-
nomic status 29(60.42%) from poor families, 16 (33.
33%) and only 3(6.25%) from middle class. How-
ever, 122 mothers died at the time of normal deli-
veries, 2(1.64%) from destitute, 96 (78.695) from
poor & 24(19.67%) from lower middle class families.
Table 21: Total Caesarian Section C/S and their Delivery Place 1414-1424(2008-2018)
Delivery Place Number of Total C/S Percent Place of C/S delivery Percent of Maternal death
G.K.Hospital 2021 10.44 2 4.17
Govt. Hospital 1979 10.22 19 39.58
Private Hospital 15009 77.50 26 54.17
NGO Hospital 358 1.85 1 2.08
Total 19367 100 48 100

Shaikh MAK / British Journal of Arts and Humanities, 3(2), 22-47, 2021
UniversePG l www.universepg.com 34
Table 21 Shows the number of caesarean section
deliveries in different institutions and died during the
last eleven years (2008-2018). During this time at
best 15009(77.50%) Caesarean deliveries occurred
in private hospital/clinic and 26(54.17%) mothers
had died. Second highest 2021(10.44%) caesarean
deliveries occurred in Gonoshasthaya Kendra hos-
pital and 2(4.17%) mothers died. 1979(10.22%) cae-
sarean deliveries occurred in Government hospital
and among them 19(39.58%) mothers died. Besides,
there were 358(1.85%) caesarean deliveries occurred
in NGO hospital and 1(2.08%) of them died during
this time.
Table 22 Shows the trends of caesarian deliveries
during the last eleven years (2008-2018) within
different institutions. Year wise the caesarean deli-
veries increased every next year and most of the
caesarean deliveries (77.50%) occurred in private
hospital. Second highest (10.44%) caesarean deli-
veries occurred in Gonoshasthaya hospital. Besides,
in government hospital 10.22% and NGO hospital
1.85% caesarean deliveries occurred during the last
eleven years in the GK Catchment areas.
Table 23 Shows the maternal deaths of normal vagi-
nal delivery by Socio-economic status and place of
delivery since last eleven years (2008-2018). Of the
122 mothers died according to place of deliveries
were 79 at husband`s home, 20 father`s home, 4 GK
hospital, 12 govt. hospitals, 6 private hospitals and 1
on the way to hospital and of them 2 from destitute,
96 from poor and 24 from lower middle class fami-
lies respectively.
Table 22: Year wise Total Caesarian C/S and Place of Delivery 1414-1424(2008-2018)
Year wise total C/S G.K. Hospital GOVT.
Hospital Private Hospital
NGO
Hospital Total
1414 (2007-2008) 91 86 478 15 670
1415 (2008-2009) 60 68 457 19 604
1416 (2009-2010) 84 91 495 15 685
1417 (2010-2011) 100 118 621 3 842
1418 (2011-2012) 122 125 554 0 801
1419 (2012-2013) 211 151 879 41 1282
1420 (2013-2014) 213 210 1626 23 2072
1421 (2014-2015) 227 268 1950 49 2494
1422 (2015-2016) 256 236 2441 75 3008
1423 (2016-2017) 325 251 2649 54 3279
1424(2017-2018) 332 375 2859 64 3630
Total 2021 1979 15009 358 19367
Percent 10.44 10.22 77.50 1.85 100
Table 23: Maternal Deaths of Normal Vaginal Delivery by Socio-economic Status and Place of Delivery 1414-1424
(2008-2018)
Socio-economic status
Birth place
Total
Husband
Home
Father's
Home
GK.
Hospital
GOVT.
Hospital
Private
Hospital
Way to
Hospital
Destitute 1 1 0 0 0 0 2
Ultra-poor 0 0 0 0 0 0 0
Poor 62 18 3 7 5 1 96
Lower Middle Class 16 1 1 5 1 0 24
Middle-class 0 0 0 0 0 0 0
Upper Middle class 0 0 0 0 0 0 0
Rich 0 0 0 0 0 0 0
Total 79 20 4 12 6 1 122
Table 24: Normal Vaginal Delivery Cost of Maternal Deaths by Socio-economic Status, 1414-1424(2008-2018)
Treatment
Cost
Socio-economic status
Total Destitute Ultra-poor Poor Lower Middle Middle Upper middle Rich
No treatment 1 0 26 5 0 0 0 32
<500 0 0 10 1 0 0 0 11

Shaikh MAK / British Journal of Arts and Humanities, 3(2), 22-47, 2021
UniversePG l www.universepg.com 35
500-1000 0 0 13 3 0 0 0 16
1001-2000 0 0 8 2 0 0 0 10
2001-3000 0 0 6 1 0 0 0 7
3001-4000 0 0 9 0 0 0 0 9
4001-5000 0 0 5 3 0 0 0 8
5000+ 1 0 19 9 0 0 0 29
Total 2 0 96 24 0 0 0 122
Table 24 Shows the normal vaginal delivery cost of
mothers died at the time of delivery. Among 122
mothers, 32 either not able to take treatment or
didn`t get any chance to have treatment. Delivery
costs were less than Tk.500 for 11 mothers, Tk.500-
1000 for 16 mothers, Tk.1001-2000 for 10 mothers,
Tk.2001-3009 for 7 mothers, Tk.3001-4000 for 9
mothers, Tk.4001-5000 for 8 mothers, and Tk.5000
for 29 mothers respectively.
Table 25 Shows that total 48 mothers died during
and or after caesarean section deliveries and the cost
of deliveries according to their socio-economic
status (SES). Among them there were 29 from poor,
16 from lower, 3 from middle class family’s respect-
ively. Analyzing the delivery cost it is also found
that one mother did not get any treatment and the
remaining 47 mothers’ treatment costs were Tk.
1000-5000 for 5, Tk.6000-15000 for 12, Tk.15001-
25000 for 9, Tk.26000-50000 for another 9 and
Tk.50000 and above for 12 mothers.
Table 26 During and or after caesarean section
deliveries total 48 mothers died. Among them 2
(14.2%) mothers in Gonoshasthaya Kendra hospital,
22(45.8%) in Govt. hospital, 20(41.7%) in private
hospital and 4(8.3%) mothers died on the way to
hospital. According to SES the highest number
29(60.42%) mothers died from poor, Second highest
number 16(33.33%) died from lower middle class
and only 3(6.25%) from middle class families
respectively.
Table 27 Shows that caesarian section deliveries
were highest in number 14(51.85%) among the poor,
the 2nd highest number 10(37.04) from the lower
middle class and only 3(11.11%) from middle class
families respectively.
Table 25: Caesarian Cost of Maternal Deaths by Socio-economic Status, 1414-1424(2008-2018)
Table 26: Maternal Deaths and Socio-economic Status by Place of Death, 1414-1424 (2008-2018)
Socio-economic
status
Place of death Total Percent
GK. Hospital GOVT. Hospital Private Hospital Way to hospital
Destitute 0 0 0 0 0 0
Ultra-poor 0 0 0 0 0 0
Poor 2 16 7 4 29 60.42
Lower middle 0 3 13 0 16 33.33
Middle 0 3 0 0 3 6.25
Upper middle 0 0 0 0 0 0
Rich 0 0 0 0 0 0
Total 2 22 20 4 48 100
Percent 14.17 45.83 41.67 8.33 100
Treatment Cost Socio-economic status
Total Destitute Ultra-poor Poor Lower Middle Middle Upper middle Rich
No treatment cost 0 0 0 1 0 0 0 1
1000-5000 0 0 5 0 0 0 0 5
6000-15000 0 0 9 3 0 0 0 12
15001-25000 0 0 4 4 1 0 0 9
26000-40000 0 0 5 1 1 0 0 7
41000-50000 0 0 0 1 1 0 0 2
50000+ 0 0 6 6 0 0 0 12
Total 0 0 29 16 3 0 0 48

Shaikh MAK / British Journal of Arts and Humanities, 3(2), 22-47, 2021
UniversePG l www.universepg.com 36
Table 27: Total No. of Caesarians and Maternal Deaths by Socio-economic Status and Place of Death, 1420-1424
(2013-2018)
SES Group Total No. of
Caesarian birth
Place of death
Total
Percent GK. Hospital Govt. Hospital
Private
Hospital
Way to
hospital
Destitute 4 0 0 0 0 0 0
Ultra-poor 0 0 0 0 0 0 0
Poor 6841 0 9 2 3 14 51.85
Lower middle 6258 0 3 7 0 10 37.04
Middle 1193 0 3 0 0 3 11.11
Upper middle 120 0 0 0 0 0 0
Rich 67 0 0 0 0 0 0.00
Total 14483 0 15 9 3 27 100
Table 28: Year wise Total Caesarian and Total Maternal Death 1414-1424 (2008-2018)
Table 28 shows the year wise total deliveries of 11
years from 2008-2018. Of these total 146561 deli-
veries 205 mothers died and from 19367 caesarean
deliveries during the same period 48(23.4%) mother
died. There were significant year wise variations of
maternal deaths during the study period. The rate
fluctuated from the highest 16,59 percent in 2008-9 to
lowest 5.85 in 2011-12 in case of all deliveries and in
case of caesarean deliveries the variation ranges from
2.08 in 2009-10 to 16.67 percent in 2012-13.
Table 29 shows that during and or after caesarean
deliveries 48 mothers died. Among them, the highest
number of deaths occurred in age 20-24(41.67%), and
it gradually declined to age groups 25-29(25.00%),
30-34(22.92%), 35-39 (4.17%), 40 and above only
(2.08%) respectively.
Year No. of total
Deliveries
No. of Total
Maternal
Death
Percent of
Maternal
Death
No. of Total
Caesarian
Deliveries
Year wise
Maternal Death
by C/S
Percent of C/S
Death
1414 (2007-2008) 15874 34 16.59 670 2 4.17
1415 (2008-2009) 13583 17 8.29 604 2 4.17
1416 (2009-2010) 12606 13 6.34 685 1 2.08
1417 (2010-2011) 12956 16 7.80 842 2 4.17
1418 (2011-2012) 13196 12 5.85 801 6 12.50
1419 (2012-2013) 12735 18 8.78 1282 8 16.67
1420 (2013-2014) 12696 15 7.32 2072 3 6.25
1421 (2014-2015) 13059 21 10.24 2494 6 12.50
1422 (2015-2016) 12543 14 6.83 3008 5 10.42
1423 (2016-2017) 12756 20 9.76 3279 6 12.50
1424(2017-2018) 14557 25 12.20 3630 7 14.58
Total 146561 205 100 19367 48 100
Table 29: Caesarian Section of Maternal Death by Age group of Wife 1414-1424(2008-2018)
Age Group No of Death Percent
15-19 2 4.17
20-24 20 41.67
25-29 12 25.00
30-34 11 22.92
35-39 2 4.17
40+ 1 2.08
Total 48 100

Shaikh MAK / British Journal of Arts and Humanities, 3(2), 22-47, 2021
UniversePG l www.universepg.com 37
Table 30: No. of Total Births & Caesarian Section of Maternal Death by Age group of Mother 1414-1424-(2008-2018)
Age Group of Mother
No. of deliveries
(live birth+still birth) No. of Caesarian Death
No Percent No Percent
15-19 16465 11.03 2 4.17
20-24 62563 41.89 20 41.67
25-29 48692 32.61 12 25.00
30-34 15222 10.19 11 22.92
35-39 5431 3.64 2 4.17
40+ 964 0.65 1 2.08
Total 149337 100 48 100
Table 30 shows the number of deliveries by the age
of mothers. During the last eleven years from 2008
to 2018 there were 149337 deliveries occurred. Of
the deliveries highest 41.89 percent aged 20-24, the
second highest 32.61 percent aged 25-29 years and
the lowest 0.65 percent aged 40 years and above. A
similar result of caesarian deliveries are observed,
the highest 41.67 percent aged 20-24, the second
highest 32.61 percent aged 25-29 years and the
lowest 0.65 percent aged 40 years and above. There
was no caesarean information in the live birth forms
during 2007-2012. Since 2013, caesarean infor-
mation included in the birth form, so caesarean data
are being collected from 2013-2018. Among them,
only those who died during 2013-2018 are shown in
the (Table 31).
Table 32 Shows the educational qualification of
those mothers who had died during and after cae-
sarean delivery. Among the 48 mothers there were
6(12.50%) literate 13(27.08%), read up to 1-5 class,
24(50%), read up to 6-10 class and only 5 (10.42%),
got higher education, SSC and above.
Table 33 presents the Caesarian Section of Maternal
Death by Education of husband. There was no
caesarean information in the live birth forms during
2008-2012. Since 2013 caesarean information was
included in the form, so caesarean data are available
from 2013-2018 used in this table. Of the 14483
Caesarian mothers 27 died at the time of delivery.
Among the caesarians deaths, 8 (29.63 %) read up to
1-5 class, the highest no.13 (48.5%) read up to class
X and only 4(14.81%) SSC and above education. On
the contrary among the husbands of those women
were 2(7.41%) illiterate, 29.63% up to 5 class, 29.
63% high school 6-10 class and 33. 33% SSC and
above education.
Table 31: Total Caesarian Section and Caesarian Maternal Death by Age group of Mother 1420-1424-(2013-2018)
Age Group No. of Caesarian Percent No of Death Percent
15-19 1987 13.74 1 3.70
20-24 5653 39.09 9 33.33
25-29 4361 30.16 10 37.04
30-34 2081 14.39 5 18.52
35-39 350 2.42 1 3.70
40+ 51 0.35 1 3.70
Total 14483 100 27 100
Table 32: Caesarian Section of Maternal Death by Education of Mother 1414-1424(2008-2018)
Education Mother No of Death Percent
Illiterate 6 12.50
Primary (1-5 class) 13 27.08
High School 6-10 class 24 50.00
College & above (SSC. and above) 5 10.42
Quranic education 0 0.00
Total 48 100

Shaikh MAK / British Journal of Arts and Humanities, 3(2), 22-47, 2021
UniversePG l www.universepg.com 38
Table 33: Total Caesarian Section of Maternal Death by Education of husband 1420-1424 (2013-2018)
Table 34: Total no. of Caesarian Section and no. of Maternal Death by Education of Husband 1420-1424 (2013-2018)
Education of Husband Total No. of
Caesarian
Percent of
Total C/S
No. of C/S
Death
(Husband)
Percent of C/S
Illiterate 771 5.32 2 7.41
Primary, read upto1-5 class 3681 25.42 8 29.63
High school, read up to 6-10
class 5286 36.50 8 29.63
College & above, SSC and
above 4727 32.62 9 33.33
Quranic education 21 0.14 0 0.00
Total 14483 100 27 100
Table 35: Maternal Deaths by TT Dose of Mother 1414-1424 (2008-2018)
TT Dose of Mother No. of Death Percent
None 10 4.9
First dose 7 3.4
Second dose 24 11.7
Third dose 37 18.0
Fourth dose 32 15.6
Fifth dose 91 44.4
Booster dose-vaccination completed given in each pregnancy 4 2.0
Total 205 100
Table 36: Caesarian Section of Maternal Death by Edu-
cation of Husband 1414-1424 (2008-2018)
Education of Husband No. of Death Percent
Illiterate 6 12.50
Primary, 1-5 class 11 22.92
High school, 6-10 class 21 43.75
College & above, SSC and
above
10 20.83
Total 48 100
There was no caesarean information in the birth
forms during the period 2008-2012. Since 2013,
caesarean information included in the form, so
caesarean data are analized from 2013-2018. Within
this period 27 mothers had died. Among the hus-
bands of those women were 7.41% illiterate, 29.63%
primary (1-5) 29.63% high school (6-10) class and
33.33% SSC and above education (Table 34).
Table 35 Shows the doses of Tetanus Toxoid
Injection (TTI) given to those women who died due
to pregnancy related complication during this period
of time 2008-2018. Of the 205 maternal deaths, 95
mothers were given TT doses and among them
7(3.4%) mothers given only first dose, 24(11.7%)
mothers 2nd doses, 37(18.0%) mothers 3rd doses,
32(15.6%) mothers 4th doses, 91(44.4%) mothers 5th
doses and only 4(2.0 %) mothers completed booster
dose-vaccination.
Education of
Mother
No .of Total
Caesarian
mothers
Percent
Education of the
caesarian
maternal deaths
Percent of C/S
maternal
Deaths
Husbands’ education
caesarian maternal
deaths
Percent of C/S
maternal Deaths
Illiterate 559 3.86 2 7.41 2 7.41
Primary 1-5 class 4085 28.21 8 29.63 8 29.63
High School 6-10
class. 5570 38.46 13 48.15 8 29.63
College & above
SSC. and above 4260 29.41 4 14.81 9 33.33
Quranic education 9 0.06 0 0.00 0 0.00
Total 14483 100 27 100 27 100

Shaikh MAK / British Journal of Arts and Humanities, 3(2), 22-47, 2021
UniversePG l www.universepg.com 39
Table 37: Maternal Deaths by Antenatal Visit of Mother
1414-1424 (2008-2018)
Table 36 Shows the educational qualification of
husband of those women who had died during
Caesar or after caesarean delivery within 2008-
2018. The husbands’ educational qualification of
those 48 mothers died were 6(12.50%) illiterate, 11
( 22.92 %) read up to class 5, 21( 43.75% ) read up
to class X and 10(20.83%) SSC and above passed.
Table 37 Presents the maternal deaths by Antenatal
visit during 2008 to 2018. Of the 205 pregnant
mothers the number antenatal care were given 1-2
times to 32 (18.2%)mothers,3-4 times to 100
(56.8%), 5-6 times to 50(28.4%), 7+ times to 12
(6.8%) and only 11(6.3%) mothers were not given
any antenatal care.
Table 38: Maternal Deaths by Duration of Husband’s
Second Marriage 1414-1424 (2008-2018)
Husband Duration of Second
Marriage
No. of
Death Percent
Not Married Second time 36 17.6
<1 Month 8 3.9
1-2months 33 16.1
4 months 34 16.6
6 months 30 14.6
1 year 33 16.1
1+ 29 14.1
Soon after death 1st wife came back 1 0.5
First wife died but second wife alive 1 0.5
Total 205 100
Table 38 Shows the maternal deaths (wife) by
husband’s duration of second marriage. Of the
husbands of 205 maternal deaths, there were 8(34.
9%) got married after less than one month, 33
(16.1%) after 1-2 months, 34(16.6%) after 4
months, 33(16.1%) after 1 year, 29(14.1%) after
one year above and 38((18.6%) not married for the
second time after death of their wives.
Table 39 Presents those who were taken care of new
born babies after the death of their mother. Of the
205 maternal deaths there were 35(17.1%) mothers
died before delivery, 35(17.1%) delivered still birth
including 3 abortions and the remaining 124 mothers
delivered live births. Those who taken care of live
births were 48(38.7%) paternal grandmother, 18
(15.0%) paternal anti, 15(12.1%) maternal grand-
mother, 15(12.1%)adapted elsewhere, 11(9%) father
himself, 8(6.0%) father and step mother, 8(6.0%)
maternal anti and only 1 baby died after 2 and a half
year.
Table 39: After Maternal Death by Care Taker of New
Born Baby 1414-1424 (2008-2018)
Who has taken care of the new born
baby
No. of
Death Percent
Died before delivery (Baby not delivered) 35 17.1
Paternal Grand mother 48 23.4
Still birth 32 15.6
Paternal anti 18 8.8
Maternal Grandmother 15 7.3
Adapted 15 7.3
Father himself 11 5.4
Live birth but died after delivery 11 5.4
Father & Step mother 8 3.9
Maternal anti 8 3.9
Abortion (MR) 3 1.5
Died after 2 years 6 months 1 0.5
Total 205 100
Table 40: Total No. of Caesarian Section Mother by Age
1420-1424 (2013-2018)
Table 41: Total No. of Caesarian Section Mother by
Education 1420-1424 (2013-2018
Table 40 Shows the number of Caesarian mother by
age during 5 years from 2013 to 2018. Of the 14483
Caesarian mothers, there were 13.7 percent aged 15-
Antenatal Visit of Mother No. of Death Percent
None 11 6.3
1-2 32 18.2
3-4 100 56.8
5-6 50 28.4
7+ 12 6.8
Total 205 116
Age group of Wife No of Caesarian Percent
15-19 1987 13.7
20-24 5653 39.0
25-29 4361 30.1
30-34 2081 14.4
35-39 350 2.4
40-44 46 0.3
45-49 5 0.0
Total 14483 100
Education of Wife No of Caesarian Percent
No schooling 559 3.87
Primary 4085 28.25
High school 5575 38.55
S.S.C 2870 19.85
College & above 1383 9.56
Quranic education 11 0.08
Total 14483 100
Shaikh MAK / British Journal of Arts and Humanities, 3(2), 22-47, 2021
UniversePG l www.universepg.com 40
19, 39.0 percent in the age group 20-24, 30.1 percent
belong to 25-29 ages, 14.4 percent aged 30-34 and 2.5
percent of aged 35 and above.
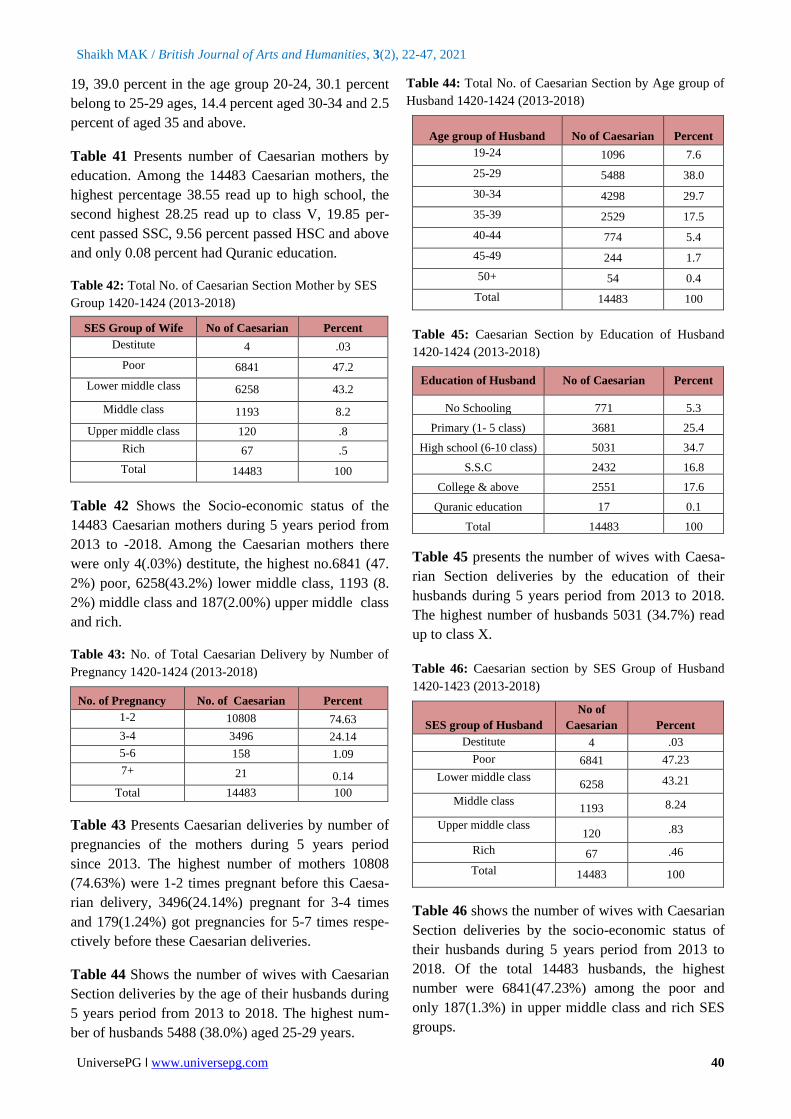
Table 41 Presents number of Caesarian mothers by
education. Among the 14483 Caesarian mothers, the
highest percentage 38.55 read up to high school, the
second highest 28.25 read up to class V, 19.85 per-
cent passed SSC, 9.56 percent passed HSC and above
and only 0.08 percent had Quranic education.
Table 42: Total No. of Caesarian Section Mother by SES
Group 1420-1424 (2013-2018)
SES Group of Wife No of Caesarian Percent
Destitute 4 .03
Poor 6841 47.2
Lower middle class 6258 43.2
Middle class 1193 8.2
Upper middle class 120 .8
Rich 67 .5
Total 14483 100
Table 42 Shows the Socio-economic status of the
14483 Caesarian mothers during 5 years period from
2013 to -2018. Among the Caesarian mothers there
were only 4(.03%) destitute, the highest no.6841 (47.
2%) poor, 6258(43.2%) lower middle class, 1193 (8.
2%) middle class and 187(2.00%) upper middle class
and rich.
Table 43: No. of Total Caesarian Delivery by Number of
Pregnancy 1420-1424 (2013-2018)
No. of Pregnancy No. of Caesarian Percent
1-2 10808 74.63
3-4 3496 24.14
5-6 158 1.09
7+ 21 0.14
Total 14483 100
Table 43 Presents Caesarian deliveries by number of
pregnancies of the mothers during 5 years period
since 2013. The highest number of mothers 10808
(74.63%) were 1-2 times pregnant before this Caesa-
rian delivery, 3496(24.14%) pregnant for 3-4 times
and 179(1.24%) got pregnancies for 5-7 times respe-
ctively before these Caesarian deliveries.
Table 44 Shows the number of wives with Caesarian
Section deliveries by the age of their husbands during
5 years period from 2013 to 2018. The highest num-
ber of husbands 5488 (38.0%) aged 25-29 years.
Table 44: Total No. of Caesarian Section by Age group of
Husband 1420-1424 (2013-2018)
Age group of Husband No of Caesarian Percent
19-24 1096 7.6
25-29 5488 38.0
30-34 4298 29.7
35-39 2529 17.5
40-44 774 5.4
45-49 244 1.7
50+ 54 0.4
Total 14483 100
Table 45: Caesarian Section by Education of Husband
1420-1424 (2013-2018)
Education of Husband No of Caesarian Percent
No Schooling 771 5.3
Primary (1- 5 class) 3681 25.4
High school (6-10 class) 5031 34.7
S.S.C 2432 16.8
College & above 2551 17.6
Quranic education 17 0.1
Total 14483 100
Table 45 presents the number of wives with Caesa-
rian Section deliveries by the education of their
husbands during 5 years period from 2013 to 2018.
The highest number of husbands 5031 (34.7%) read
up to class X.
Table 46: Caesarian section by SES Group of Husband
1420-1423 (2013-2018)
SES group of Husband
No of
Caesarian Percent
Destitute 4 .03
Poor 6841 47.23
Lower middle class 6258 43.21
Middle class 1193 8.24
Upper middle class 120 .83
Rich 67 .46
Total 14483 100
Table 46 shows the number of wives with Caesarian
Section deliveries by the socio-economic status of
their husbands during 5 years period from 2013 to
2018. Of the total 14483 husbands, the highest
number were 6841(47.23%) among the poor and
only 187(1.3%) in upper middle class and rich SES
groups.
Shaikh MAK / British Journal of Arts and Humanities, 3(2), 22-47, 2021
UniversePG l www.universepg.com 41
Table 47: Numerical and Percentage Distribution of Mothers Age, Pregnancy Order and Socio-economic Status of Maternal Deaths (N=205) 1414-1424 (2008-2018)
Pregnancy Mother
age group
Socio-economic status
Total Percent Destitute %
Ultra-
poor % Poor %
Lower Middle
Class %
Middle
Class %
Upper Middle
class % Rich %
1-2
15-19 0 0 0 0.0 9 5.8 1 2.2 1 33.3 0 0 0 0 11 5.37
20-24 0 0 1 33.3 42 27.3 11 24.4 1 33.3 0 0 0 0 55 26.83
25-29 0 0 0 0.0 22 14.3 7 15.6 0 0 0 0 0 0 29 14.15
30-34 0 0 0 0.0 5 3.3 5 11.1 0 0 0 0 0 0 10 4.88
35-39 0 0 0 0.0 4 2.6 1 2.2 0 0 0 0 0 0 5 2.44
3-4
20-24 0 0 0 0.0 3 1.9 0 0.00 0 0 0 0 0 0 3 1.46
25-29 1 50.0 0 33.3 27 17.5 7 15.6 0 0 0 0 0 0 35 17.07
30-34 0 0 0 0.0 7 4.5 8 17.8 0 0 0 0 0 0 15 7.32
35-39 0 0 0 0.0 8 5.2 1 2.2 0 0 0 0 0 0 9 4.39
40+ 1 50.0 0 33.3 2 1.3 1 2.2 1 33.3 0 0 0 0 5 2.44
5+
25-29 0 0 0 0.0 3 1.9 0 0.0 0 0 0 0 0 0 3 1.46
30-34 0 0 0 0.0 10 6.5 2 4.4 0 0 0 0 0 0 12 5.85
35-39 0 0 0 0.0 8 5.2 1 2.2 0 0 0 0 0 0 9 4.39
40+ 0 0 0 0.0 4 2.6 0 0.0 0 0 0 0 0 0 4 1.95
Total
15-19 0 0 0 0.0 9 5.8 1 2.2 1 33.3 0 0 0 0 11 5.37
20-24 0 0 1 33.3 45 29.2 11 24.4 1 33.3 0 0 0 0 58 28.29
25-29 1 0 0 33.3 52 33.8 14 31.1 0 0 0 0 0 0 67 32.68
30-34 0 0 0 0.0 22 14.3 15 33.3 0 0 0 0 0 0 37 18.05
35-39 0 0 0 0.0 20 13.0 3 6.7 0 0 0 0 0 0 23 11.22
40+ 1 50.0 0 33.3 6 3.1 1 2.2 1 33.3 0 0 0 0 9 4.39
Total 2 100 1 100 154 100 45 10 3 100 0 0 0 0 205 100
Percent 0.98 0.49 75.12 21.95 1.46 0 0 0.00 100
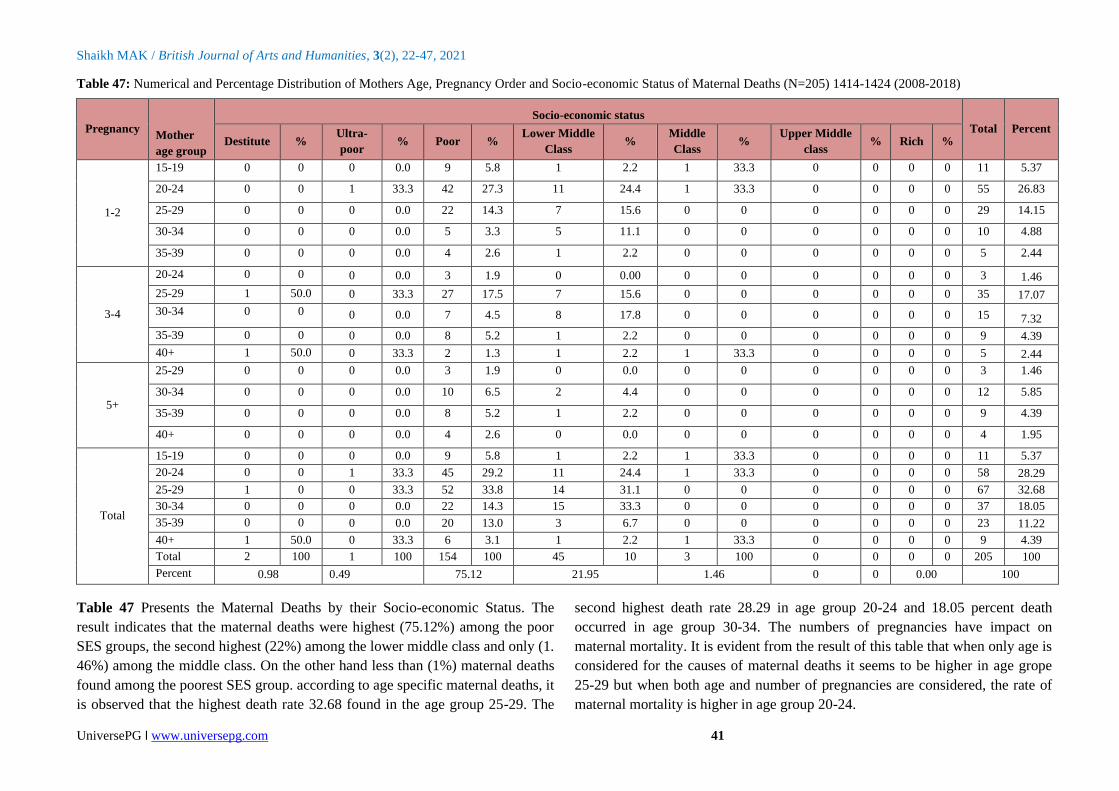
Table 47 Presents the Maternal Deaths by their Socio-economic Status. The
result indicates that the maternal deaths were highest (75.12%) among the poor
SES groups, the second highest (22%) among the lower middle class and only (1.
46%) among the middle class. On the other hand less than (1%) maternal deaths
found among the poorest SES group. according to age specific maternal deaths, it
is observed that the highest death rate 32.68 found in the age group 25-29. The
second highest death rate 28.29 in age group 20-24 and 18.05 percent death
occurred in age group 30-34. The numbers of pregnancies have impact on
maternal mortality. It is evident from the result of this table that when only age is
considered for the causes of maternal deaths it seems to be higher in age grope
25-29 but when both age and number of pregnancies are considered, the rate of
maternal mortality is higher in age group 20-24.

Shaikh MAK / British Journal of Arts and Humanities, 3(2), 22-47, 2021
UniversePG l www.universepg.com 42
Table 48: Maternal Death before Delivery, During Delivery and by Place and Causes of Death, 1414-424(2008-2018)
Table 48 Shows the maternal deaths occurred before
and during delivery by place and causes. There were
35 maternal deaths before delivery of which 9(25.7%)
due to ante partum Eclampsia, 7(20.0%) for the cause
of ante Partum Haemorrhage, 5(14.3%) by the cause
of Obstructed Labour, 4(11.4%) because of Hyperten-
tion, 2(5.7%) by each causes of Anaemia, Cardiac
Failure and Ruptured Uterus respectively, similarly
only 1(2.9%) from each causes of Respiratory Failure,
Typhoid fever, Blood reaction and Hung to Death. Out
of these 35 maternal deaths, there were 12(34.3%)
died on the way to hospital, 9(25.7%) in the Govt.
hospital, 8(22.9%) in husband’s house, 3(8.6%) in
Private hospital, 2(5.7%) in father’s house and only
1(2.9%) in GK hospital.
Table 49 explains the number of maternal deaths
delivered at home by their Socio-economic status
during 11 years period from 2008 to 2018. The result
shows that of the total 112830 home deliveries there
were 59(0.06%) destitute mothers having 3.71 per-
cent maternal death, 301(0.27 %) ultra-poor mothers
having no maternal death, 89959 (79.73%) poor
mothers having 85.19 percent maternal deaths,
20563(19.00%) lower middle class mothers having
11.12 percent maternal deaths, 1841(1.64%) middle-
class mothers having no maternal deaths, 62(0.06%)
upper middle class and 45(0.04%) rich mothers had
no maternal deaths. So over all 54(0.05%) maternal
deaths occurred among the mothers delivered 11230
live births.
Table 49: Total Home Delivery by Socio-economic Status of Maternal deaths1414-1424 (2008-2018)
Socio-economic status Home delivery (live birth) Percent Died Home Percent
Destitute 59 0.06 2 3.71
Ultra-poor 301 0.27 0 0.00
Poor 89959 79.73 46 85.19
Lower Middle Class 20563 19.00 6 11.1`2
Middle-class 1841 1.64 0 0.00
Upper Middle Class 62 0.06 0 0.00
Rich 45 0.04 0 0.00
Total 112830 100.00 54 100.00
DISCUSSION:
In this study the socio-economic status (SES) of a
household decided on the basis of qualitative and
quantitative socio-economic and demographic indi-
cators, such as occupation, education, food intake of
members of the household, ownership of land for
dwelling and for cultivation, owner of domestic ani-
mals, trees and household belongings. Number of
houses and the materials used in the construction of
wall, roof and floor of the house as well as type of
latrine used and sources of drinking water etc. All
these criteria are considered by village level GK
health worker and classified as (1) Ultra Poor; (2)
Poor; (3) Lower Middle Class; (4) Middle Class; (5)
Upper Middle Class; and (6) Rich. The status of the
Causes of Death
Place of Death
% Husband
Home
Father's
Home
GK.
Hospital
GOVT.
Hospital
Private
Hospital
Way to
Hospital Total
Ante partum Eclampsia 0 0 0 4 1 4 9 25.71
Ante Partum Haemorrhage 1 1 0 3 1 1 7 20.00
Obstructed Labour 2 0 0 1 0 2 5 14.29
Hypertention 1 0 0 0 0 3 4 11.43
Anaemia 1 0 0 0 0 1 2 5.71
Cardiac Failure 2 0 0 0 0 0 2 5.71
Ruptured Uterus 0 0 1 1 0 0 2 5.71
Respiratory Failure 1 0 0 0 0 0 1 2.86
Typhoid fever 0 0 0 0 1 0 1 2.86
Blood reaction 0 0 0 0 0 1 1 2.86
Hung to Death 0 1 0 0 0 0 1 2.86
Total 8 2 1 9 3 12 35 100
Percent 22.86 5.71 2.86 25.71 8.57 34.29 100

Shaikh MAK / British Journal of Arts and Humanities, 3(2), 22-47, 2021
UniversePG l www.universepg.com 43
household is likely to be positively associated with
maternal mortality as the mother of a well off house-
holds are suppose to be more aware of risk of pre-
gnancies than the poor mothers. Moreover, the former
is more likely to have utilized ANC and PNC services
than the latter because of their greater awareness and
afford-ability.
A pregnant mother is more vulnerable to a deadly
disease like tetanus, particularly in poor sanitary
condition in many developing countries like Bangla-
desh. The tetanus vaccinations are used for the safe
guard of mother. Moreover, in rural areas of Bangla-
desh there has been a common practice to cut the
umbilical cord using steel blade (not boiled) or blade
made of bamboo and paste cow dung on the cord.
This unhygienic method causes the risk of tetanus
infection. The data in Table 49 confirm the result that
the vaccinated women have considerably lower rate
of mortality than those women who have not
vaccinated. Educated pregnant women are more
conscious for taking and utilizing antenatal and post
natal care services than the women who have no
formal education. The other cause of maternal
mortality is severe anemia. It is observed and
estimated that a pregnant women’s blood volume
increases almost 50 percent, although the amount of
plasma is disproportionately greater than blood
volume. As a result the fall in the hemoglobin level
below the normal level may expose pregnant women
to a higher risk of death. To save the mother GK
workers treat with iron supplementation.
In Bangladesh there has been a decline of 40%
maternal mortality over a period of 9 years from 2001
to 2010. However the maternal mortality due to
indirect causes somewhat increased (BMMS, 2010).
In this respect the researchers opined that the indirect
causes of maternal mortality include diabetes, high
blood pressure, heart disease, cancer, tuberculosis,
anemia, hepatitis ‘B’, HIV Aids and Malaria. The age
of conception of women either too early or too late
also the causes of maternal deaths. One of the
members of the Bangladesh maternal mortality and
health care survey, 2010 suggests that during and
after conception of women if the following measures
are taken in the Govt. save motherhood campaign
programme to reduce the indirect causes of maternal
deaths such as: a) to identify the mother who has been
suffering from the diseases mentioned above; b)
Cancer vaccination has been given or not. Year Wise
Total Population by Socioeconomic Status, Total
Live Birth and Maternal Deaths of Gonoshasthaya
Kendra’s Health and Demographic Surveillance
Areas in Bangladesh 1414-1424 (2008-2018) are
shown in (Appendix A).
Gonoshasthaya Kendra provides reproductive and
child health care as well as family planning services
with other services to its catchments villages. Among
other things, these are:
1. Planning for a healthy pregnancy- GK health
workers regularly go to the villages, find out
eligible couple and provide consultation to them
about family planning and nutritional matters.
Especially, new couple who do not wish to take
baby immediately after marry. To identify all
eligible couple and inform them about the nece-
ssary to accept family planning. Besides, if any-
one needs to take any family planning method
with the help of government family planning
department, then maintain a liaison with them
and to provide instrument of family planning
methods. If any woman of eligible couple didn`t
take TT vaccine before, then give her TT vacc-
ine and ensured that she has accepted full course
of TT vaccine.
2. Care during pregnancy (Antenatal Care)-
Firstly, identify pregnant woman, enlisted and
make a follow-up card. The provided health
care’s are regularly recorded in the follow-up
card. Generally, four times antenatal follow-up
provides to a normal pregnant woman, but in
case of sick, risky and complicated pregnant,
antenatal follow-up may be more times. Exam-
ining their health condition such as edema, blood
pressure, jaundice, anemia etc. At the same time
health workers also observe eyes, nose, teeth and
stomach height of the pregnant mother. They
also observe the movement and heart beat of the
womb baby and test urine albumin of the
mother. If anyone needs to take nutrition then
provide Iron, calcium, vitamin-A and also pro-
vide consultation to eat proper nutritious (vege-
tables) food and minavit for filling up mal-
nutrition.
To register the pregnant mother and recorded
various ANC related services, such; (a) height
and weight, edema; (b) BP measurement, exami-
ning jaundice and anemia; (c) Urine test to iden-

Shaikh MAK / British Journal of Arts and Humanities, 3(2), 22-47, 2021
UniversePG l www.universepg.com 44
tify sugar and albumin; (d) Examine eyes, ear
and teeth; (e) Pregnant cervical height meas-
urement and observe heart beat and movement
of the womb baby. To teach the pregnant mother
to realize about fetus movement. Encourage the
pregnant mother to take Iron and Calcium tablet.
Provide TT vaccine to the pregnant mothers.
Measuring (Pregnant camp, yard meeting and
immunization center) blood grouping of all pre-
gnant mothers. It is also identified some relatives
of the pregnant of same blood group from
beginning, if blood is required during delivery.
If blood is needed, from the close relatives,
voluntary blood donor groups (Bondhon, Son-
dhani) and blood banks are collected the blood
and after cross-matching, the blood has to be
circulated. Sometimes in need have blood, to
announce locally using mosque mike to collect
blood. Ensure to identify high risk pregnant,
conduct regular follow-up, arrange medicine and
timely refer system to the certain place. After
identifying pregnant women, firstly attached her
with a nearest skilled TBA and provide her/
family members the mobile number of the pro-
ject manager/health in charge/supervisor so that
they can communicate with them at any time
finding any danger sign of the pregnant.
3. Care during Labour and Delivery: Delivery
time- Hearing the news of delivery pain of the
woman, at once the trained TBA goes to their
home. Most of the time the family member of
the pregnant informs GK health workers by
phone. 1). It is actual pregnant related pain or
not; 2). Due to actual labor, the duration of the
contraction will increase and reduce the con-
traction time from one contraction to the next. If
the contraction does not start, the mother is pro-
hibited from pressing, and it is said to make
walking, it is said to take long breathing and also
said to eat light hot liquids and soft foods. After
2 hours, it is said to urinate; 3). Examine vaginal
path, (a) Watch (Slippery fluid content is seen in
the vagina with a finger), (b) Whether the uterus
has opened and how many fingers it has, (c)
Whether the water has broken, the presence of
the baby in the womb is diagnosed, (d) Whether
there is water colour and smell, (e) Monitoring
delivery progress (child movements, checking
the heart beat of the child), mother's pulse
motion and blood pressure are tested through
partograph, (f) Perineal guard is used to protect
perineal tear, (g) The child is caught for not get-
ing hurt as the child falls.
4. The problems which can be performing due
to home delivery are as follows
• There are no facilities of Oxygen, Nebulizer or
suction if needed.
• If perineum tear and/or heavy bleeding occur
after delivery there is no way to provide emer-
gency treatment.
• During delivery pain many of the villagers call
quack. Before water leakage the unskilled
village doctors push injection for increasing
unnecessary pain. As a result still birth may
occur, Uterus may be tearing and heavy bleed-
ing occurs and placenta may not be come out
smoothly. For that reason many other pro-
blems can be seen and at once the patient need
to take in the hospital emergency. The condi-
tions of the pregnant mother then become very
risky.
• Generally the cultures in our country espec-
ially in the community, during the 1st delivery
of pregnant mother have to send to her
parent’s house. During delivery pain, gene-
rally unskilled relatives are called to attend
delivery who usually don`t properly under-
stand. At the time of delivery sometime it is
seen that the baby was in breech position. The
canal of the uterus was narrow and the un-
skilled TBA pulled the baby with force, as a
result tear the membrane and heavy bleeding
occurs. If they fail to stop bleeding then the
pregnant mother may be died.
Solution
• Delivery should be conducted by the trained
TBA and health workers.
• If the sign and Symptom identified compli-
cated from the beginning, then after starting
delivery pain at once the mother have to send
in hospital or any health center for safe
delivery.
• If any health worker of GK get news of
delivery pain from any guardian in village, at
once the health worker go to the spot along
with doctor and necessary instruments. If they
find complication, they bring her to the GK
hospital. Besides, they refer the patient to the
nearest Govt. hospital or other health centers.

Shaikh MAK / British Journal of Arts and Humanities, 3(2), 22-47, 2021
UniversePG l www.universepg.com 45
• If any skilled TBA finds complication of the
pregnant mother, then she sends her as early as
possible to nearest hospital. In this way such
problems can be solved.
5. For mother and child after birth- (1) Keep the
baby a little below at the parallel of the mother's
stomach, then the umbilical cord is cremated
several times till 2-3 minutes like milking a cow,
and is given her directly to mothers breast; (2)
After a few minutes, the umbilical cord is bound
by three hurdles, then keep the two binding with
the baby and cut the umbilical cord between two
to three number binding. The cord side of the
mother is tied with mother’s thyroid. The cord
side of the mother is tied with mother’s thyroid.
It is mentionable that there will not be any cloths
to make barrier among mother and baby`s skin.
It is to keep the baby on the mother’s breast for
suckling cholesterol. Mothers Placenta is thrown
out. It turns out that the placenta is completely
untouched. Generally the placenta come out
after 30 minutes of delivery, then examine the
mothers vaginal path (1) whether it is being tear,
(2) Whether excess bleeding is occurring, (3)the
uterus is contracted, (4) whether the uterus come
down, (5) whether another baby is in the womb.
After ensuring positive all, two mesoprostol
tablet may be give her through oral or vagina for
protecting excess bleeding.
After childbirth, the mother and child are kept in
constant monitoring for two hours so that the mother
and the baby can be identified immediately and take
proper step to solve the identifying problem. After
delivery, at least 3 Post Natal Care (PNC) needed.
First visit starts within first week of delivery, but it
would be better from first 12 to 24 hours.
Baby and mothers health condition is observed from
this visit. 2nd visit is starts after 2nd week of delivery.
Advice to give the baby vitamin -A capsule and again
examine mother and child health condition. 3rd visit is
to be complete within six week after delivery. In this
visit, generally encourage mother for immunization of
her baby and accept family planning. At the same
time encourage other members of the family to
provide balance diet to the mother.
When needs to refer
1) Being Eclampsia
2) Excess bleeding
3) Oedema
4) Blurred vision
5) If the baby is at land shape
6) If baby come out with uterus bag.
7) Whether the baby die in the womb of mother.
Pregnant pain is zero but water is broken.
8) If uterus come out after delivery.
9) If the child throat is trapped.
After delivery, if the baby don`t cry, the color of the
child becomes red-blue then at once have to refer to
the suitable health center.
The following matters are taught to the birth
attendants during training
Hand washing (practically), Nails cutting, Communi-
cation, Counseling, Pregnant care (Safe delivery,
normal sign of the womb, danger sign at pre, present
and post delivery, primary management and about
referring systems), Neonatal care, advantages of
cholesterol, Certain time of breast feeding, the way of
feeding baby, balance diet for mother and baby,
Family planning methods, Immunization etc. Espe-
cially, teaches them, how to refer in the emergency
situation. Some drugs were taught to them (Iron,
Calcium, Paracetamol, Antacid, Vitamin B-Complex,
ORS, Messoprostol and about minavit). Maternal
death meeting: Maternal death meeting is started at
1990. Super visors as well as health in charge with
paramedic have to present in such meeting. Besides,
union parishad members, government worker and
local well-known persons are requested to join the
meeting. At that meeting, the causes of death are
discussed with the family members and other
attendants. At the same time, it is to provide con-
sultation to the attendants and local community about
their duties in such a situation in future.
In this way, the paramedic acquired knowledge to
prevent the maternal death. In every monthly meet-
ing, paramedics illustrate their success and failure.
The function of various paramedics in the meeting
was judged in the best measure. In the next month,
again check up the matter of maternal and infant
death and try to find out the reasons of it. At the end
of the year, paramedic’s promotion and salary
increase depends on this evaluation. All paramedics
of Gonoshasthaya Kendra are dedicated to their
responsibility and are sincere in providing services.
As a result, their popularity and acceptance is in-

Shaikh MAK / British Journal of Arts and Humanities, 3(2), 22-47, 2021
UniversePG l www.universepg.com 46
creasing day by day in the villages and clinic level. A
matter is needed to mention here that, Gonoshas-
thaya Kendra never thought against village doctor and
dhai, otherwise always tried to train them.
CONCLUSION:
The result of this study suggests that the tetanus
vaccination reduce maternal mortality. Iron supple-
mentation will also reduce the high risk of maternal
deaths. Increased age at marriage of women will
increase the age of conception and maternal death
will be declined. If the following measures are taken
in the Govt. “Save the motherhood campaign pro-
grammers” will help to reduce the indirect causes of
maternal deaths. Of the direct causes of maternal
deaths, a) Home delivery with untrained dhai, b)
Early marriage and conception, c) Not taking proper
health care before, during and after delivery, d) Mal-
nutrition, e) Mental and physical torture of pregnant
mother. To reduce the indirect or direct causes of
maternal mortality, mothers’ and guardians awareness
must be build up through different Govt. non Govt.
Organizations either National or International and
also mass media can play vital role how to take
proper care of mother during pregnancy and after
delivery. Moreover, pregnant mother and her family
members should take care about the following four
topics to reduce the maternal deaths:
o Pregnant mother have to eat again and again a
little amount of nutritious food, not at the end of
all members, always try to eat firstly with other
children.
o Have to take rest (two hours after lunch and
eight hours after dinner)
o Cleanliness (takes care of personal cleanliness
and breast)
o Provide cholesterol and exclusive breast feeding
after delivery the baby.
Advice to take pre-preparation before delivery:
▪ To select neat and clean place where adequate
light and air are available (clean wealth cloth
and rexin sheet).
▪ Germfree yarn, blade and hand washing soap,
covered clean pot for boiling water.
▪ For taking the baby in lap and wrapping her,
need to collect clean dry cloths.
ACKNOWLEDGEMENT:
I am greatly indebted to the mother organization,
Gonostasthaya Kendra of Gono Bishwabidyalay for
providing me with the data and all financial support
for collecting and analyzing the data. I express my
profound gratitude to Dr. Zafrullah Chowdhury
Founder and Trustee of Gonoshasthaya Kendra for
his cooperation and support for this study. I am also
thankful to Rehana Sultana, Sr. Research Assistant
and Md. Sadequl Islam, Programmer for their assis-
tance in preparing the data files.
CONFLICTS OF INTEREST:
The author declares there is no conflict of interest to
publish it.
REFERENCES:
1) BMMS, (2010). Peter Kim Streatfield and
Shams EI Arifeen, ICDDR,B with contributions
from Ahmaed Al-sabir, MEASURE Evaluation
and Kanta Jamil, USAID, Bangladesh. Bangla-
desh Maternal Mortality and Health Care
Survey, 2010.
https://www.measureevaluation.org/resources/publ
ications/tr-12-87
2) NIPORT, (2010). Bangladesh Maternal Morta-
lity and Health Care Survey, 2010.
3) Rafiqul Huda Chaudhury. Zafrullah Chow-
dhury, (2007). Achieving the Millennium Deve-
lopment Goal on Maternal Mortality: Gono-
shasthaya Kendra’s Experience in Rural Bang-
ladesh, Gonoprokashani, Savar, Dhaka, 2007.
http://www.worldcat.org/oclc/243677353
4) UNFPA, (2002): In collaboration with the
Population and Family Study Center, Situation
and Voices. The older poor and excluded in
South Africa and India. Population and deve-
lopment strategies, No. 2, New York.
https://www.unfpa.org/sites/default/files/resource-
pdf/ageing_voices.pdf
5) World Bank, (2003). Health, Nutrition, and
Population and the Millennium Development
Goals (MDGs).
6) World Bank, (2007). To the MDGs and Beyond:
Accountability and Institutional Innovation in
Bangladesh. Bangladesh Development Series
Paper No.14, Dhaka, January 2007.
https://eprints.lse.ac.uk/27167/1/To_The_MDGs_a
nd_Beyond.pdf
7) www.thelancet.com/Series 1/Maternal Survival
1/Maternal Mortality: who, when, where, and
why/published online - 2006.
https://www.afro.who.int/sites/default/files/2017-
06/mps%2001%20Maternal%20Survival.pdf

Shaikh MAK / British Journal of Arts and Humanities, 3(2), 22-47, 2021
UniversePG l www.universepg.com 47
Appendix-A
Year Wise Total Population by Socio-economic Status, Total Live Birth and Maternal Deaths of Gonoshasthaya
Kendra's Health and Demographic Surveillance Areas in Bangladesh 1414-1424 (2008-2018).
Note: M death= Maternal Death, *Per 1000 lives birth, ** Per 100000 lives birth
Citation: Shaikh MAK, Ahmed MK, and Haque R. (2021). Consequences of maternal mortality in
Bangladesh rural families an experience of Gonoshasthaya Kendra (GK) 2008-2018, Br. J. Arts Humanit.,
3(2), 22-47. https://doi.org/10.34104/bjah.021022047