Embed Size (px)
Citation preview

Solvency I
Solvency II
Solvency I vs Solvency II
Pillar I
Minimum Capital
Requirements
Pillar II
Supervisory Review
Pillar III
Market Discipline
Timetable
Starting Points
Modelling
Consequences

Solvency I
The existing solvency margin requirements were established in 1973 under the First Non-Life Directive (73/239/EEC) and in 1979 under the First Life Directive (79/267/EEC). The third generation of life (92/96/EEC) and non-life (92/49/EEC) Insurance Directives established the single market for insurance in the mid-1990s. This gave the EU one of the most competitive insurance markets in the world. Insurance undertakings, on the basis of authorization in any one Member State, are entitled to sell throughout the EU without any price control or prior notification of terms and conditions (except for compulsory insurance). This system relies on mutual recognition of the supervision exercised by different national authorities according to rules harmonized to the extent necessary at the EU level. The requirement for insurance undertakings to establish an adequate solvency margin is one of the most important common prudential rules.
Solvency I vs. Solvency II
Whereas Solvency I phase aimed at revising and updating the current EU solvency regime, the Solvency II project has a much wider scope.
Solvency I has established more realistic minimum capital requirements, but still it does not reflect the true risk faced by insurance companies. Solvency II will bring the harmonization of asset and liabilities valuation techniques across EU. Even to mention different approaches to value assts – by historical or amortized cost and by market value.

Solvency I vs. Solvency II
The following graph presents how Solvency II differs from Solvency I.
Prudence margin
Solvency I Solvency II
Book Value of
assetsTechnical
Provisions
Free Surplus
Solvency I
Economic
Value of
liabilities
Solvency II
SCR
Free Surplus
Book Value of
assets
MV increase
Total Capital
requirement
Economic ViewAccounting View

Solvency I vs. Solvency II
Current Solvency I rules cannot cope with the variety of insurance company risks profiles and are therefore not aligned with the economics of the business & risks.
How the Solvency II requirements compare with Solvency I depend on a number of company specific factors including
• Current levels of prudence margin in provisions
• Current levels of unrealised capital gains allowed for in Solvency I
• Actual level of risk and diversification

SOLVENCY II PROJECT
Aims and purposes
Overall aims of Solvency II:
• Establish a match to insurer‟s individual risk-profile
• Bring assets and liabilities into fair value basis, if possible consistent with IASB
• Harmonise standards across EU
• Set higher capital requirements to permit timely intervention
SOLVENCY II PROJECT
What are the purposes of solvency II ?
The industry strongly supports a Solvency II framework which aims to achieve the following:
• “Gives an incentive to the supervised institutions to measure and properly manage their risks” (Framework for Consultation on Solvency II)
• Contribute to a “better managed and more competitive insurance industry that can better perform its key function of accepting and spreading risk” (Commissioner McCreevy)
• Encourages a single European market for financial services
• “Enables an institution to absorb significant unforeseen losses and gives reasonable assurance to policyholders” (Framework for Consultation on Solvency II)

SOLVENCY II PROJECT
Solvency II field study:
• Guidance for market consistent valuation necessary
• Embedded option valuation to be developed further
• Equity risk and interest risk are most important
• Risk measurement: stress and scenario tests or economic models?
• Risk management: integrated risk management framework in place
Solvency II is in line with Basel II which set the new capital adequacy framework for banking sector.

SOLVENCY II PROJECT
Industry Response
• Companies across the EU are evaluating impact of Solvency II on their activities.
• They were asked to run stress tests on balance sheets with assets at market value, including different types of risks as well as estimation of cost of insurance options and guarantees.
• Individual country initiatives: UK, Switzerland, Netherlands
• Others are evaluating impact of Solvency II
• Risk offices of major European (re)-insurers to promote best practice and set standards:
Aegon, Allianz, Aviva, Axa, Converium, Fortis, Generali, Munich Re, Prudential, Swiss Re, Winthertur, Zurich

SOLVENCY II PROJECT
Framework
A risk based solvency framework
The risk measurement process needs to cover all potential risks to which insurance company has exposure. A solvency framework is set to define the financial ability to fulfill the obligations when they become due.

SOLVENCY II PROJECT
Current
situation
Future
“True risk profile”
SCR - Internal Models
SCR - Standard Approach
Rating agency models
Current Solvency I
Range of solvency measures
Increasing accurate link
to true risk profile
A key aim for the industry is to move from a situation of multiple (and sometimes conflicting) solvency constraints to discussions around a single risk based economic framework, as presented in the figure below.
SOLVENCY II PROJECT
The current situation shows that many country supervisors have set additional local requirements on either solvency regulations or provision calculations. At the same time rating agencies have developed their own solvency models or rules of thumb and companies have developed internal models to analyse the risks more accurately. The increasing accurate link to true risk profile will lead to standard approach on Solvency Capital Requirements and encourage insurance companies to build the internal models that reflect their individual profiles.

PILLAR I - MINIMUM CAPITAL REQUIREMENT
• Safety nets/measures (MCR – Minimum Capital Requirement and SCR - Solvency Capital Requirement)
• Technical Provisions
• Forms of eligible solvency capital
• Internal model based approach

PILLAR I - MINIMUM CAPITAL REQUIREMENT
• The primary interest of Pillar I concerns the capital requirements - Minimum Capital Requirements MCR and Solvency Capital Requirements SCR.
• The figure below illustrates the relation between levels of capital requirements.
Technical Provisions
MCRCapital Minimum
Requirements
SCRSolvencyCapital
Requirements
Level 0: Ruin
Level 1: minimal capital
Level 2: target capital Surplus
Level of Supervisory intervension
Risk consideredas being unacceptable for the assured

PILLAR I - MINIMUM CAPITAL REQUIREMENT
• Solvency Capital Requirement (SCR) - The SCR reflects a level of capital that enables an institution to absorb significant unforeseen losses and that gives reasonable assurance to policyholders and beneficiaries.

PILLAR I - MINIMUM CAPITAL REQUIREMENT
• Minimum Capital Requirement (MCR) - The MCR is intended to be a safety net and reflects a level of capital below which ultimate supervisory action would be triggered.
PILLAR I - MINIMUM CAPITAL REQUIREMENT
• Technical Provisions – This represents the amounts set aside in order for an insurer to fulfil its obligations towards policyholders and other beneficiaries. It may include some element of prudence.
PILLAR I - MINIMUM CAPITAL REQUIREMENT
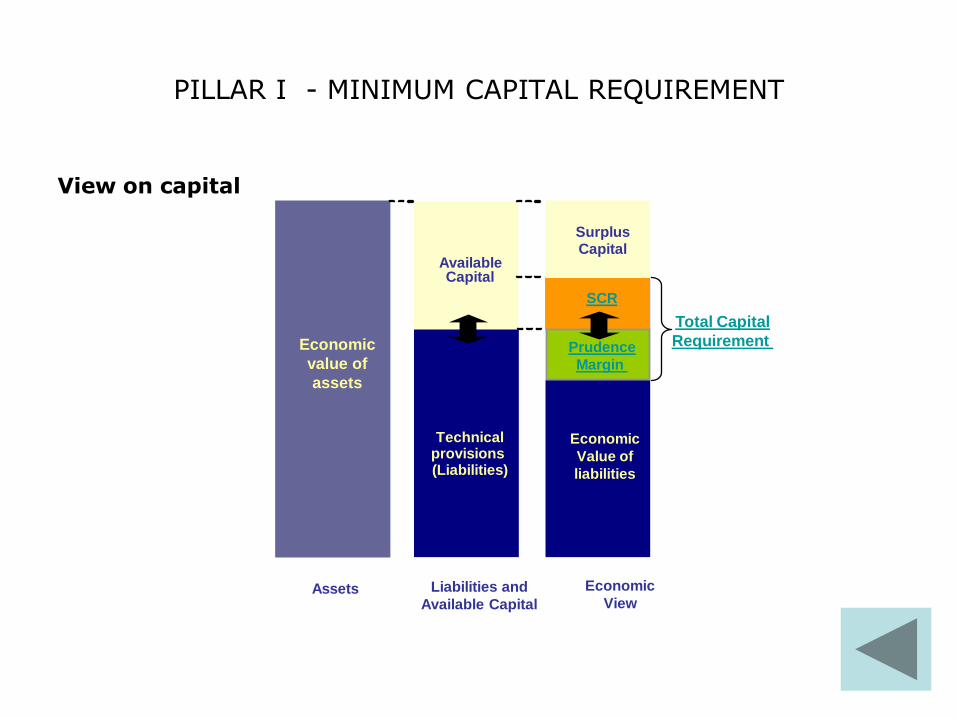
View on capital
Economic
value of
assets
SCR
Prudence
Margin
Technicalprovisions (Liabilities)
AvailableCapital
Economic
Value of
liabilities
Assets Liabilities and
Available Capital
Economic
View
SurplusCapital
Total Capital
Requirement

PILLAR I - MINIMUM CAPITAL REQUIREMENT
The SCR is the amount of capital required from shareholders and will depend on the level of Prudence.
The sizes of the prudence margin and the SCR are linked. In other words, if
the prudence margin is calibrated in such a way that it is relatively large
(offering a significant level of protection) the SCR should be calibrated to be
relatively low – and vice-versa.
PILLAR I - MINIMUM CAPITAL REQUIREMENT
Prudence Margin
As a starting point, the prudence margin on top of the best estimate of
liabilities should be calculated using a specific confidence interval
e.g. 75% (in line with the EC progress note from 22/2/2005).
The sizes of the prudence margin and the SCR are linked. In other words, if
the prudence margin is calibrated in such a way that it is relatively large
(offering a significant level of protection) the SCR should be calibrated to be
relatively low – and vice-versa.

PILLAR I - MINIMUM CAPITAL REQUIREMENT
Total Capital Requirement is the amount required above the economic value of liabilities. Total Capital Requirement should be based on the total balance sheet i.e.:
Volatility of liabilities, volatility of assets, taking into account how they interact.
Total Capital Requirement is therefore independent of the level of any Prudence Margin
PILLAR II – SUPERVISORY REVIEW
Pillar II is needed, in addition to the first pillar, since not all types of risk can be adequately assessed through solely quantitative measures. Even for those risks that can be assessed quantitatively, their determination for solvency purposes will require independent review by the supervisor or by a designated qualified party.
Such review will enable supervisory intervention if an insurer‟s capital does not sufficiently buffer the risk.

PILLAR II – SUPERVISORY REVIEW
• Internal control and risk management
• Supervisory review process – quantitative tools
• Transparency of supervisors
• Target level intervention
• Cooperation and communication of supervisors
• Investment management rules and asset-liability rules

PILLAR II – SUPERVISORY REVIEW
Risk identification:
Risk is inherent in each operation of an insurer and it includes many internal dependencies that require an integrated approach to risk or solvency assessment.
As a general principle, a Pillar I treatment may be applied to any risk
which is susceptible to quantification or limitation.

PILLAR II – SUPERVISORY REVIEW
MortalityMorbidity
UnderwritingCatastrophe
Policyholder actions
Insurance
EquitiesProperty
Interest rateInflation
Currencies
Market
ReinsuranceDerivative counter-parties
Corporate bonds
Credit
Cash flow matching
Liquidity
Systemscontrols
procedures
Operational
Increased exposure to losses due to concentration of investments
Concentration
PILLAR III

PILLAR II – SUPERVISORY REVIEW
Insurance risk
• The risks within the underwriting risk category are associated with both the perils covered by the specific line of insurance (fire, death, motor accident, windstorm, earthquake, etc.) and with the specific processes associated with the conduct of the insurance business.
• Sources of underwriting risk: process, premium calculation, product design, claims retention, policyholder behaviour and reserving risk.
PILLAR II – SUPERVISORY REVIEW
Market Risk
• Exposure to changes in level and volatility of financial securities
• Broken down into: interest rate, inflation, equity, real estate, commodity prices, exchange risk.
• Sources of market risk: interest rate volatility, price volatility, exchange volatility, asset/liability mismatch risk, reinvestment risk.
• Market risk relates also to the value of derivative instruments, such as options, futures and swaps.
PILLAR II – SUPERVISORY REVIEW
Credit risk:
• Risk of default or change in creditworthiness of debtors, counterparties (e.g. on reinsurance contracts, derivative contracts or deposits given) and intermediaries where institutions have claims.
• Sources of credit risk: commercial credit, invested asset, political and country risk
• In order to limit the possibility for arbitrage of credit risk from the banking to the insurance sector credit risk quantification follows as closely as possible the one used by the banking regulator.
• Therefore, a credit risk charge is calculated using an approach compatible to Basel II. This charge is then added to the target capital for insurance and market risks.
• The internal model for credit risk have to be calibrated to the same risk measure as used by Basel II, namely the Value at Risk on the 99% quantile.
PILLAR II – SUPERVISORY REVIEW
Liquidity risk
• Liquidity risk involves risk from limited availability of readily tradable investments to cover the expected cash flows arising from its liabilities
• Losses due to liquidity risk can occur when company has to borrow unexpectedly or sell assets for an unanticipated low price.
• The liquidity profile of a company is a function of both its assets and liabilities.
• Sources of liquidity risk: cash calls following major loss events, a credit rating downgrade, deterioration of economy

PILLAR II – SUPERVISORY REVIEW
Operational risk
• Operational risk, for capital purposes, is defined as “the risk of loss from inadequate or failed internal processes, people, systems or from external events.
• Operational risks are difficult to quantify so a qualitative assessment approach will initially be used. Capital requirements for these risks would be too arbitrary.
• Sufficient empirical data are not yet available. However, banks are now compiling such data to comply with Basel II. It is therefore conceivable that operational risk could be quantified in the future if insurance companies were to compile relevant data.

PILLAR II – SUPERVISORY REVIEW
Concentration risk:
• The risk of increased exposure to losses due to concentration of investments or risk exposure in a geographical area, economic sector or individual investments.
• Concentration risk may exist at either the legal entity level or the group level (after the holdings of all legal entities have been consolidated) or both.

PILLAR II – SUPERVISORY REVIEW
The Risk Management Revolution
• Companies can fail if they do not implement and ensure adherence to effective internal control in the field of risk management.
• Insurers face much the same problems concerning risk as banks. Managers must decide what risks to accept, and on what term to accept them; what new risks to take on.
They need to manage the risk.
PILLAR III

PILLAR II – SUPERVISORY REVIEW
Risk Measurement
Transformation of the practice of risk management consist of the following issues:
• Development of new theory and its rapid translation into practical applications (e.g. Black-Scholes option pricing model / Deflators)
• Development of risk management methodologies for measuring risk in practice (e.g. Value at Risk, Tail Value at Risk, Risk Based Capital).

PILLAR II – SUPERVISORY REVIEW
Risk Measurement

PILLAR II – SUPERVISORY REVIEW
Risk Measurement
PILLARII
PILLAR III
PILLAR II – SUPERVISORY REVIEW
Black Scholes – One of the most widely used closed form solutions for calculation of cost of guarantees. Black – Scholes formula can be used to value the option component of insurance contracts. The Black- Scholesmodel was developed as a tool to value stock options and requires the following information: strike price, stock price, duration, volatility, risk free rate of interest. Many insurance contracts with maturity guarantees can be thought of as an option on the underlying asset share. For example an endowment policy is in-the-money at maturity if the guaranteed benefits exceed the asset share.

PILLAR II – SUPERVISORY REVIEW
Deflators – The use of deflators is not limited to the valuation of financial instruments, but also includes the valuation of corporations and liability cash flows. The guaranteed benefits on variable annuity contracts can be thought of as policyholder options, which may be valued much like call options on assets. The average market value of the excess of the guaranteed benefit cash flows over the funded account values, calculated using deflators, represents the current cost of hedging all of the risk associated with the guaranteed benefits. It is that value that is required in order to adjust the embedded value…
PILLAR II – SUPERVISORY REVIEW
VaR - A 'risk measure' of the potential financial loss in the investment portfolio or on the whole balance sheet. Value at risk provides an estimate of the worst expected loss over a certain period of time at a given confidence level.
Example: a 12 month value at risk with a 95% confidence level of €1 million means that an insurer would only expect to lose more than€1 million 5% of the time or once in 20 years.

PILLAR II – SUPERVISORY REVIEW
TailVaR - The concept of 'coherence' has been introduced in actuarial literature to describe risk measures that possess a desirable set of consistency features. TailVaR is an example of a coherent risk measure. One desirable feature is 'subadditivity', which means the aggregation of risks does not lead to an increase in overall risk. VaR, by contrast, does not enjoy this property, except in the case of normally distributed risks. For these reasons, TailVaR is the risk measure that the IAA Insurer Solvency Assessment Working Party has suggested to use for the purpose of setting solvency requirements.
On a fundamental level, TailVaR would encourage supervisors, undertakings and policyholders to consider the consequences of a potential default, rather than focussing simply on the probability of insolvency. To some extent, a comparison could be drawn with the advanced approach to credit risk in the banking sector, whereundertakings consider both the Probability of Default (PD) and the Loss Given Default (LGD)
PILLAR II – SUPERVISORY REVIEW
RBC (Risk Based Capital) – Capital requirement is directly related to its risk profile & risk tolerance:
• Economic or risk based capital is the capital needed to attain the risk coverage, consistent with the firm‟s or desired credit rating
• The coverage level is applied consistently to all businesses and portfolios
• Example: 50 000 scenarios were run for several test initial surplus amounts, calculating the resulting gain or loss and accumulated surplus amount per €1 of earned premium. The gain or loss is the sum of the €1 premium plus expected interest on reserves and accumulated surplus less the randomly generated claim cost, expected expenses and taxes. Ruin occurs when the resulting accumulated surplus falls below zero in any year of the projection period. By interpolation and successive iterations of the process the beginning surplus is found that results in 5% probability of ruin. This is the RBC amount when expressed totally as percent of premium.

PILLAR II – SUPERVISORY REVIEW
Supervisory review process:
• The control will lead to qualitative control of risk management by the supervisory authority
• Increased requirements for capital adequacy will be possible
• The use of risk management models will be of relevance for competition, especially if linked with the level of own funds requirements.
• Processes of risk management will become increasingly important for supervision.
The regime aims to:
• Be transparent
• Allow earlier regulatory intervention
• Be risk sensitive
• To completely capture the risks arising from an individual company‟s business

PILLAR III – MARKET DISCIPLINE
The III Pillar brings in a “disciplinary effect” on corporate management and transparency in markets. It defines principles for the disclosure of information to policyholders, investors, rating agencies and other interested parties so they obtain a comprehensive picture of an insurer‟s risk.
• Disclosure regarding Capital structure - including „realistic free assets‟
• Risk management and control as well as risk measurement
• Risk profile
• Capital adequacy
• Market disciplining of institutions for risk management performance

SOLVENCY II – TIMETABLE

SOLVENCY II – TIMETABLE
Solvency II Timetable for 2005-2006
• Key decisions likely to be made during 2006
• Implementation date still uncertain
• Significant resources required for implementation
Directive Development (Commission)
CEIOPS work on Wave III Calls for
Advice
2006 2007 2008 2009 2010 2011
Directive Adoption ?(Council & Parliament)
Implementation ?(Member States)
2005
STARTING POINTS
What should be done to fulfil the requirements of Solvency II:
• Preparation of a coherent risk-based framework
• Setting the economic valuation of assets and liabilities
• Identification of risks and managing the risks
• Applying the two tier approach with an absolute minimum (MCR) a target (SCR) and a ladder of intervention between the two.
• The harmonisation should be achieved across all pillars and across all countries in Europe.

STARTING POINTS
Solvency II pre-cursors
• ICA (Individual Capital Assessment)
• Individual Country Solutions:
– SST
– FTK

STARTING POINTS
ICA (Individual Capital Assessment)
• ICA applies to both Life and Non-Life insurers
• ICA is mainly principles based
• Some guidance by Actuarial Profession
• Covers market, credit, insurance, liquidity, operational and group risks
• Significant freedom in choice of models
ICA lays much of the groundwork for Solvency II and has proven a useful risk
management platform. However, some areas of Solvency II may well impose
different standards.

STARTING POINTS
The ICA concept
Market Value of Assets
Realistic Liabilities
ICA
Other Liabilities
Issues with typical ICA approach:• Derivation of the stresses
Operational risk – bottom – upDerivation of correlationsNon-linearityManagement actionsTransferability of capitalGroup issues – reinsurance /
service co.s
Issues with liability valuation:• Value of NP business
Liquidity premiumManagement actionsTreatment of staff pension scheme

STARTING POINTS
The FTK
The aim of FTK was to improve insight into institution‟s financial position and
its possible development over the short and medium term.
• For insurers, FTK will have a supplementary role in early years, probably until Solvency II is embedded in legislation
• For pension funds, the capital requirements are in line with the Main Principles for Regulation of the Financial Supervision of Pension Funds in the Pensions Act memorandum
STARTING POINTS
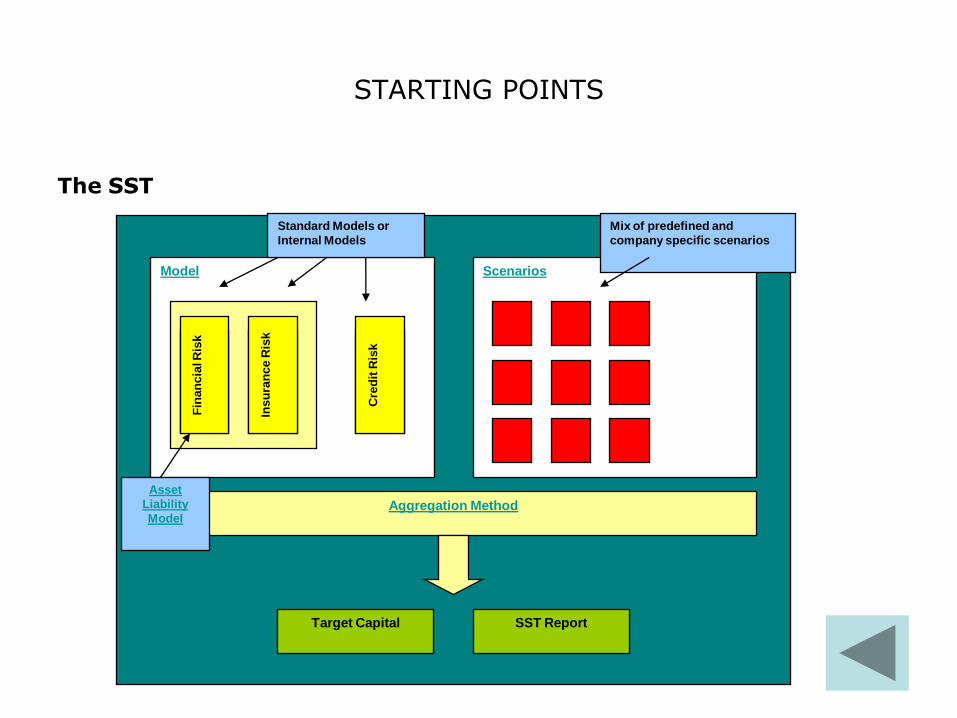
The SST
ScenariosModel
Aggregation Method
Target Capital SST Report
Cre
dit
Ris
k
Fin
an
cia
l R
isk
Insu
ran
ce R
isk
Mix of predefined and
company specific scenarios
Standard Models or
Internal Models
Asset
Liability
Model

STARTING POINTS
The SST Concept
• Assets and liabilities are valued market-consistently
• Relevant risks are market, credit and insurance risks
STARTING POINTS
The SST Concept
There are scenarios to take into account rare events or risks not covered by the standard models.

STARTING POINTS
The SST Concept
The results of the standard models and the evaluation of the scenarios are aggregated to determine the target capital.

STARTING POINTS
The SST Concept
Internal models can be used to for the calculation of target capital.
The assumptions and internal models used have to be documented in an SST report.

STARTING POINTS
The figure below presents starting steps that need to be taken in order to meet the Solvency II requirements
Equity calculation
Improveasset liabilitymanagement
Starting pointsnow
Improverisk
management
Information Technology
STARTING POINTS
Equity calculation
• Increased equity, especially in the case of life insurance companies
• Reallocate investments
STARTING POINTS
Improve Asset&Liability management will involve
• Identifying the changes to existing valuation methodologies.
• Applying stochastic techniques, understand interactions between assets and liabilities.

STARTING POINTS
Improve risk management
• Likely consequences of the introduction of Solvency II include well diversified insurance groups having good risk management processes. The risk based approach by insurance supervisors should lead to the recognition of internal risk models as a way to decrease the amount of capital required.
• Improving the risk orientated management will involve: Seek additional reinsurance cover Manage costs Divest or acquire of operations or lines of business Revise pricing strategy Solvency compatible business strategy

STARTING POINTS
Improving the information technology:
• Create Solvency II compatible processes, systems and controls to prevent breakdowns
• Infrastructure requirement that pertains to enterprise-wide management reporting
• Implementation of robust data management system

MODELLING
Internal Models
Initial estimat
e of SCR
Pillar I SCR+
Pillar II add-on
Pillar I SCR
Formulaic
recalibration
Discretionary
adjustment following
supervisory review
Capital RequirementInternal Model
Actuarial Model
Risk driver data
Exposure data Forecast P&L distributions
Risk management function
MODELLING
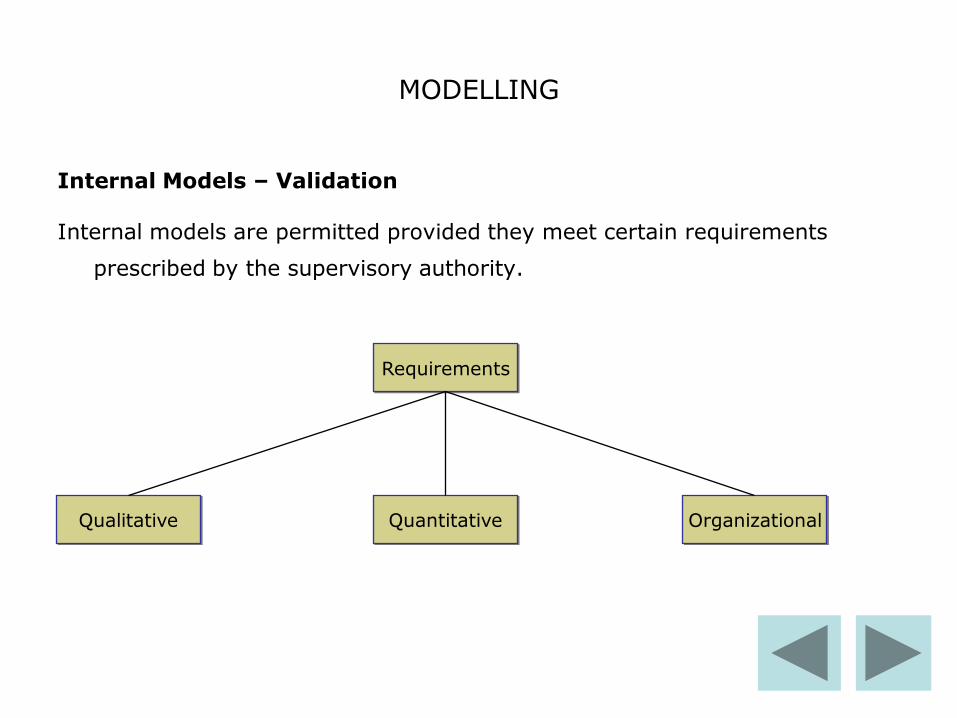
Internal Models – Validation
Internal models are permitted provided they meet certain requirements
prescribed by the supervisory authority.
Requirements
Qualitative Quantitative Organizational
MODELLING
Internal Models – Validation
Qualitative requirements
– All relevant risk factors must be factored into the internal models. The dependency structure of the risk factors must be taken into account.
– Data and parameters in internal models must be up-to-date and relevant for the insurance company.
– The appointed actuary has to asses the model risk and stability of the results by means of a sensitivity analysis, back-testing, or similar methods.
– The internal models must be reviewed regularly and adjusted if necessary.
MODELLING
Internal Models – Validation
Quantitative requirements
The market-consistent value must be used for all items an d the internal
models must be calibrated to the specified confidence level and risk
measure.
MODELLING
Internal Models – Validation
Organizational requirements:
Internal models need to be deeply embedded within an appropriate organizational framework. In particular, they need to be integrated into the company‟s daily risk-management processes, regularly updated and tasted.
MODELLING
About the DFA
DFA is an adapted library for Prophet, which provides code for a rapidcalculation engine for the stochastic modeling of Life and Non-Life insurance.It is designed for and achieves very rapid run-times, typically two orders of magnitude faster than other software. It is also designed for very rapidimplementation/calibration.
MODELLING
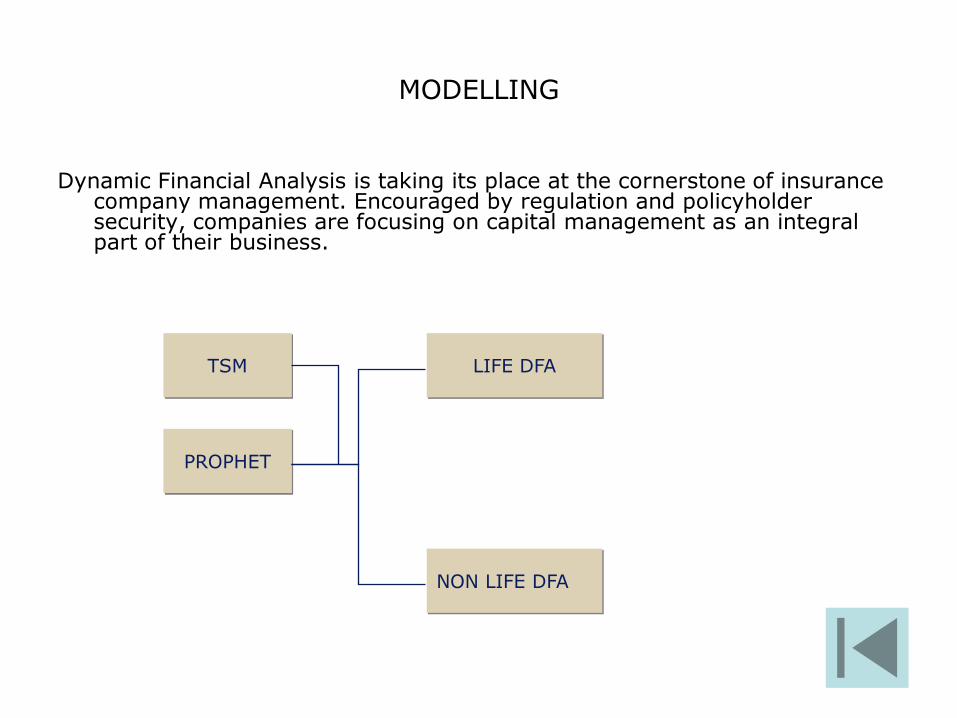
Dynamic Financial Analysis is taking its place at the cornerstone of insurance company management. Encouraged by regulation and policyholder security, companies are focusing on capital management as an integral part of their business.
LIFE DFA
NON LIFE DFA
PROPHET
TSM

MODELLING
THE SMITH MODEL
• The Smith Model (TSM) developed by Deloitte, represents the industry‟s most sophisticated suite of probability and risk modeling tools.
• With countries applications, from pricing complicated financial contracts and valuing guarantees, to assessing capital requirements or managing financial risk, TSM is able to meet the individual needs of insurance company.
Capital Modelling
Market Modelling Consistent Valuation
TSM Output

MODELLING
Capital Modelling
TSM is able to create the thousands of projections, for whatever index –for example, government and corporate bonds return, interest rates, equity markets or currency exchange rates. Since it is compatible with all leading projections systems, such as Prophet, TSM can provide the assumptions for insurers‟ model offices, whether they are for future investment returns, valuation bases and expenses, or the behavior of policyholders and management.

MODELLING
Economic Scenario Generator
In addition TSM can be used to investigate capital adequacy, since many regulators and insurance firms now think about their capital needs in terms of probability of ruin.
Today's
Balance
Sheet
projection
MODELLING
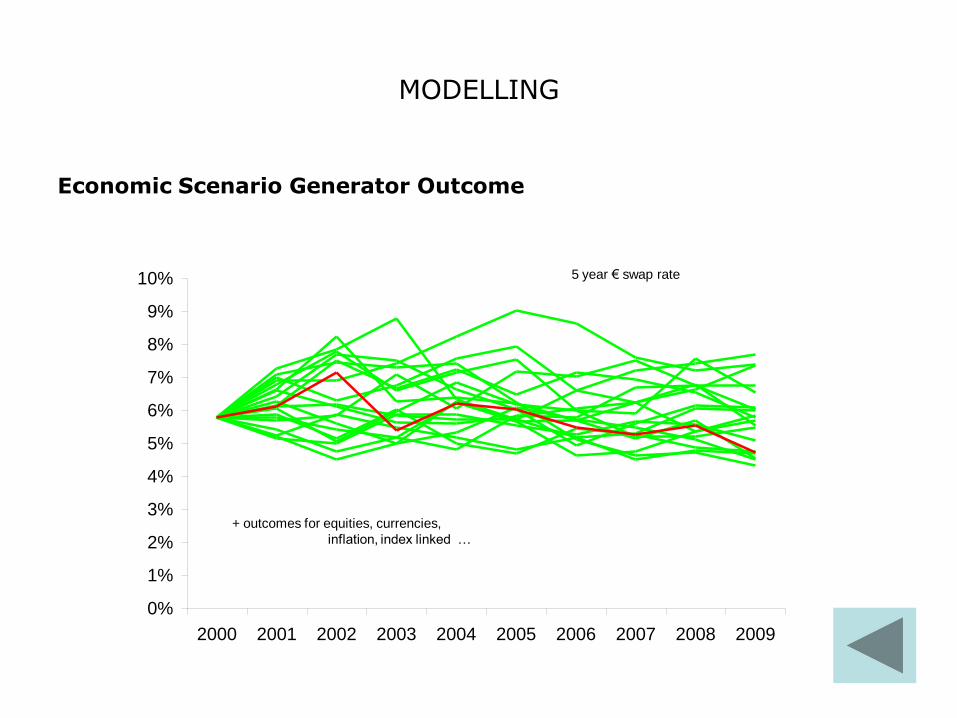
Economic Scenario Generator Outcome
0%
1%
2%
3%
4%
5%
6%
7%
8%
9%
10%
2000 2001 2002 2003 2004 2005 2006 2007 2008 2009
+ outcomes for equities, currencies,
inflation, index linked …
5 year € swap rate
MODELLING
Market Consistent Valuation
• Market consistency in valuation means performing sets of standard market-consistent simulations covering major world economies every quarter.
• TSM‟s flexibility makes it a highly effective tool for valuing liabilities, embedded guarantees or business (for mergers and acquisitions). To reflect the subtleties of market prices, flexible parameter choice is vital.

MODELLING
Using TSM to Value Cash Flows
Today's
Market
Prices
contingent claim
pricing theory
projection
MODELLING
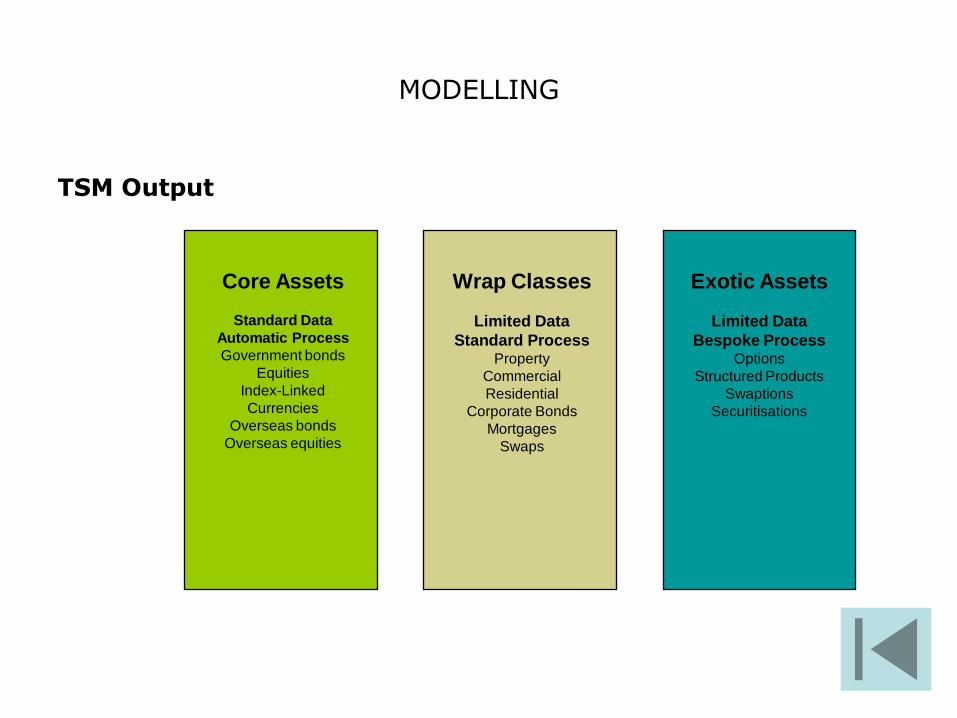
TSM Output
Core Assets
Standard Data
Automatic Process
Government bonds
Equities
Index-Linked
Currencies
Overseas bonds
Overseas equities
Wrap Classes
Limited Data
Standard ProcessProperty
Commercial
Residential
Corporate Bonds
Mortgages
Swaps
Exotic Assets
Limited Data
Bespoke ProcessOptions
Structured Products
Swaptions
Securitisations

MODELLING
PROPHET
• The Prophet workspace provides the „engine” for the DFA model. All DFA calcualtions are specified within the Prophet „library”. The library is open to inpection and may readily be adjusted by users.
• Prophet provides a framework for the development and running of one or more financial models to generate timely statutory and management information.
• Prophet has an extensive range of facilities for pricing, profit testing, valuation, ALM, and model office work.
MODELLING
Using Prophet you can perform comprehensive calculations such as:
• Asset/liability modelling and cash flow testing• Stochastic projections• Product pricing and design• Budgeting and planning• Statutory valuations• Embedded value calculations• Appraisal valuations• Financial reporting• US GAAP reserves and profits, including• Purchase GAAP• Experience analysis
The Modelling Process

MODELLING
The Modelling Process
TablesModel Point Data Product(s)
Run
Results
Review / Check
Report
Test
Policy Data Calculation Rules
Calculation Specifications
Analyse Requirements

MODELLING
LIFE DFA
LIFE INSURANCE COMPANY MODEL
Economic
Scenarios
Assets
Liabilities
Cashflow
and capital
valuesResults Analyser
Calculatio
n order

MODELLING
Asset Types• Bonds
• Fixed rate government bonds• Floating rate government bonds• Fixed rate corporate bonds• Floating rate corporate bonds• Index Linked bonds
• Equities• Options – Puts and Calls• Swaps – Fixed for Floating and Floating for Fixed• Swaptions• Caps and Floors• Property• Cash
Asset ModelAssets are modeled based on two groups:• Technical assets covering insurance liabilities for all insurance groups.• Shareholders assets for covering non-technical liabilities • For each modeled group a separate structure of assets is modeled
based on the pre-defined types of assets.

MODELLING
Liability Types:Continental liability types modelled include:
– Endowments – Pure Endowments– Term Assurances– Annuities (immediate and deferred)– Savings with profit sharing (or capitalisation)– Unit Linked – Group Pensions (Not covered in this module)
Various flavours:– Regular and single premiums– Risk premium (term) or yearly renewable– Increasing premiums
MODELLING
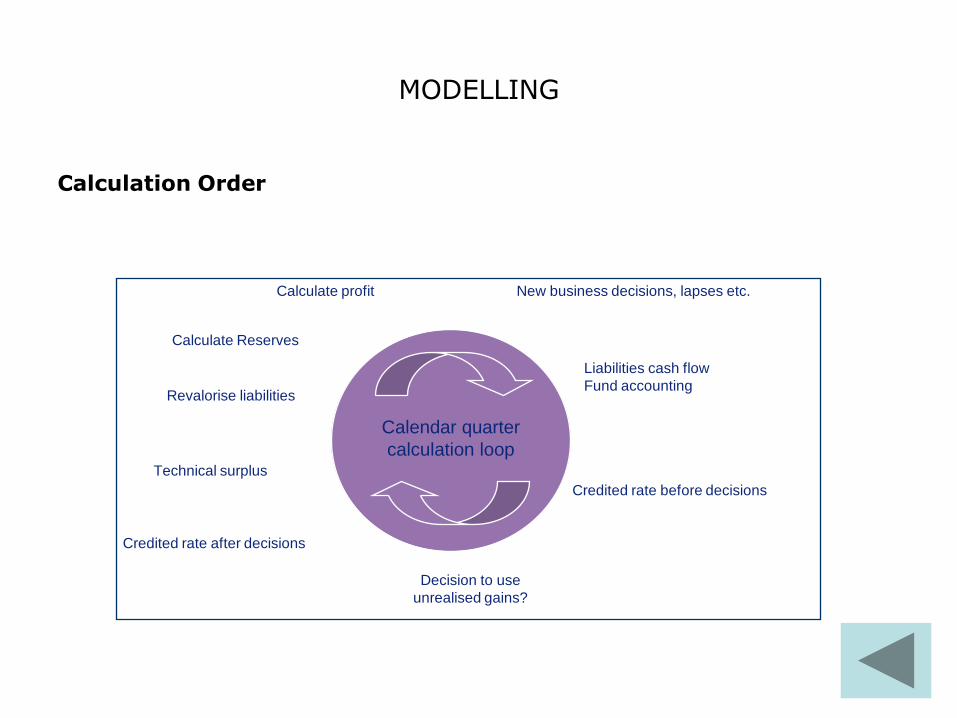
Calculation Order
Liabilities cash flow
Fund accounting
Credited rate before decisions
Decision to use
unrealised gains?
Credited rate after decisions
Revalorise liabilities
Calculate Reserves
New business decisions, lapses etc.
Technical surplus
Calendar quarter
calculation loop
Calculate profit

MODELLING
Uses Of The Model
– Market consistent cash flow valuation
– Risk based management, reporting and supervision
– Dynamic Stochastic Modelling
– Strategy work for:
• Asset liability modelling
• Investment decisions
• Profit sharing rules
• Capital requirements
• Pricing and design of new business
– Fair values and guarantee costs
– Other risks credit, mortality, lapse.

MODELLING
Dynamic Financial Analysis
Stage 1
Financial Budgeting = Deterministic projection with one set of market assumptions
Year
2001 2002 2003 2004 2005 2006
0
-
+
Esti
mate
d C
ap
ital
in e
xcess o
fR
eg
ula
tory m
inim
um
MODELLING
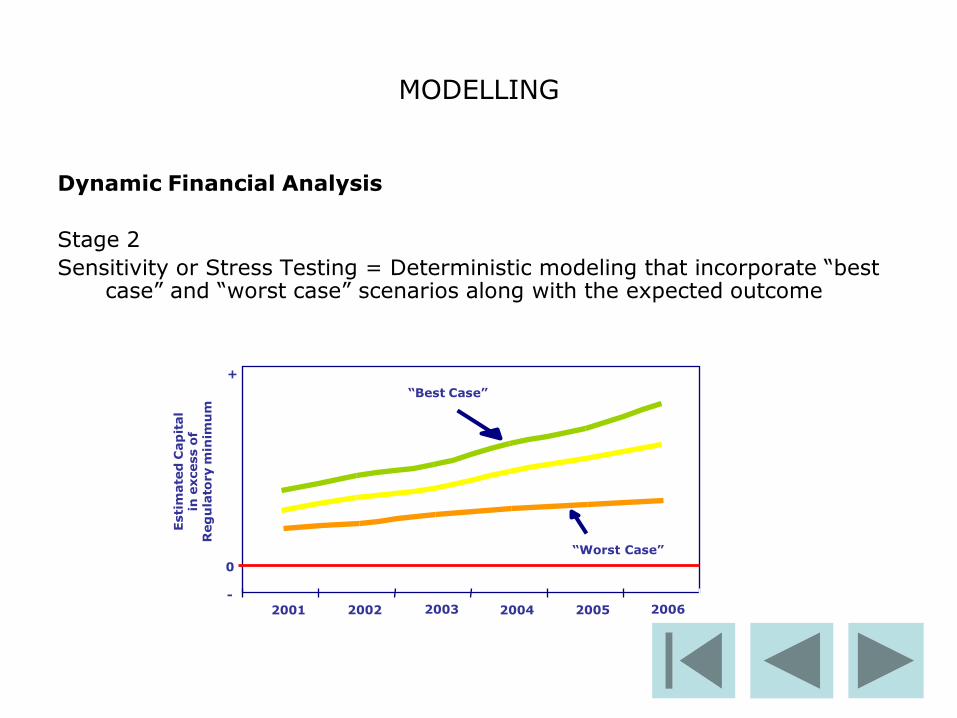
Dynamic Financial Analysis
Stage 2
Sensitivity or Stress Testing = Deterministic modeling that incorporate “best case” and “worst case” scenarios along with the expected outcome
2001 2002 2003 2004 2005 2006
0
-
“Best Case”
“Worst Case”
Esti
mate
d C
ap
ital
in e
xcess o
fR
eg
ula
tory m
inim
um
+
MODELLING
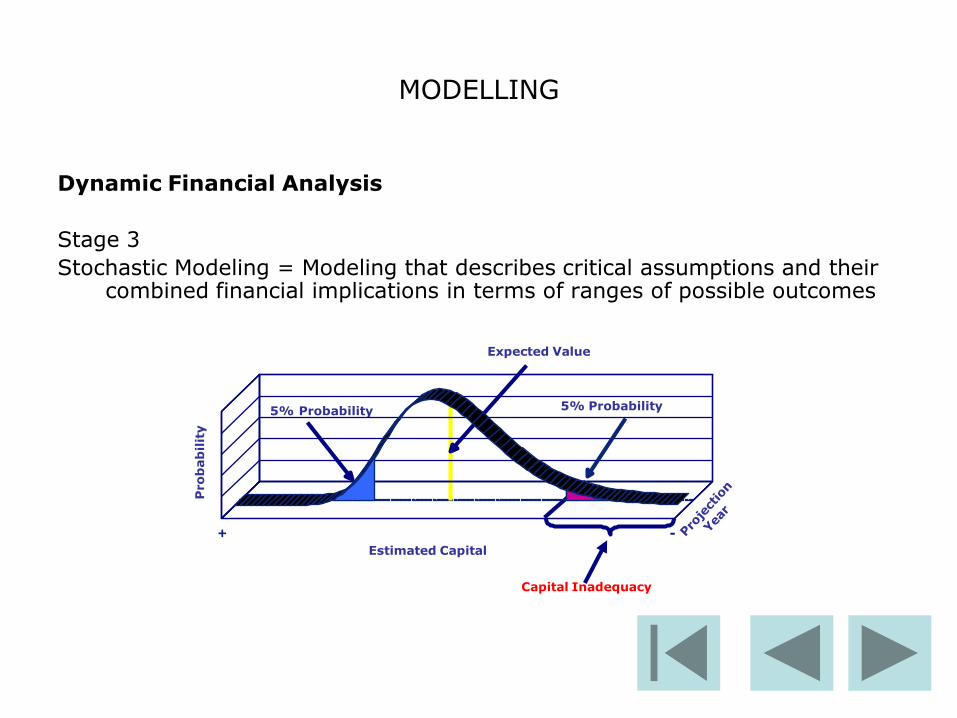
Dynamic Financial Analysis
Stage 3
Stochastic Modeling = Modeling that describes critical assumptions and their combined financial implications in terms of ranges of possible outcomes
Estimated Capital
+ -
5% Probability5% Probability
Expected Value
Capital Inadequacy
Pro
bab
ilit
y
MODELLING
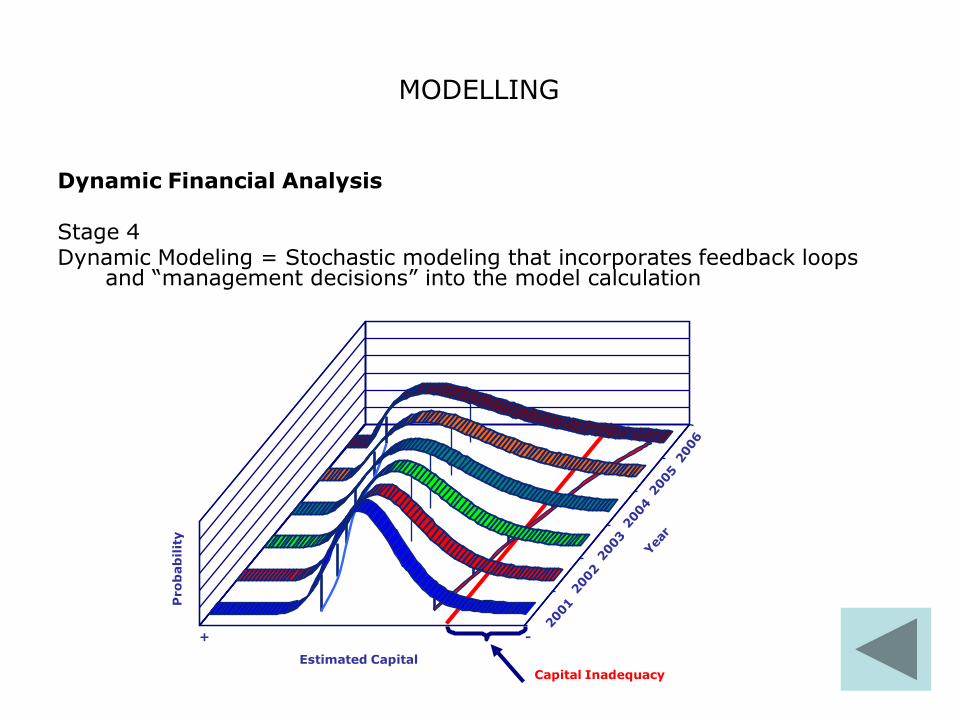
Dynamic Financial Analysis
Stage 4Dynamic Modeling = Stochastic modeling that incorporates feedback loops
and “management decisions” into the model calculation
Estimated Capital
+ -
Pro
bab
ilit
y
Capital Inadequacy
MODELLING
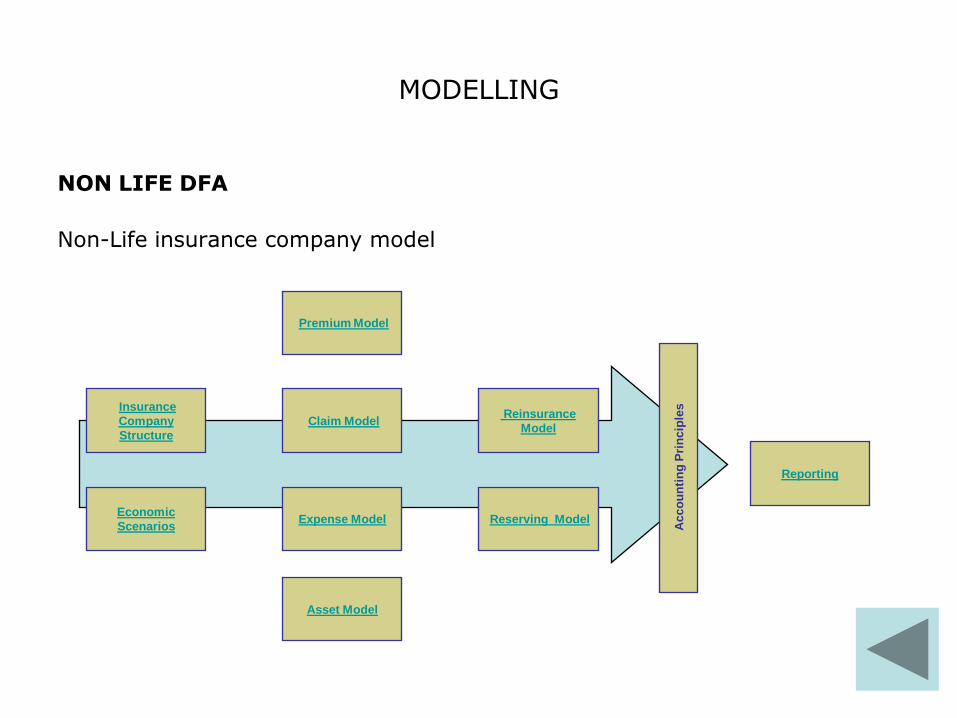
NON LIFE DFA
Non-Life insurance company model
Economic
Scenarios
Insurance
Company
Structure
Asset Model
Expense Model
Claim Model
Premium Model
Reinsurance
Model
Reserving Model
Acco
un
tin
g P
rin
cip
les
Reporting

CONSEQUENCES
Expected consequences for the insurance industry
Solvency II will bring some improvement on current overview of insurance activity. The emphasis is placed equally on running the insurance business effectively and formal compliance with the regulations.
Investment PolicyDetermination of equity
Asset Liability ManagementReinsurance PolicyUnderwriting PolicyClaims Management
Consequences for Life Insurance
Consequences for Non-Life Insurance

CONSEQUENCES
Consequences of Solvency II for Life Insurance:
• Increased orientation on capital costs in product development, pricing of guarantees and options.
• Trend in Profit Sharing System towards disclosure of gain shares of the customers on the end of the contract period.
• Strategies Capital Investments – Portfolio strategy, attention to the needs of liabilities

CONSEQUENCES
Consequences of Solvency II for Non Life Insurance:
• Possible trends to increasing possibilities for premium adjustment
• Trends to possible claims-experience premiums (bonus-malus systems)
• Enlargement of the exclusion clauses
• Special combination products (bundling of different risks)
• Strategies Capital Investment – increasing influence of asset – liability aspects also in non- life business

SOLVENCY II PROJECT
Stress tests:
• Stress tests are necessary tool for insurance management.
• Stress tests are fundamental element of an insurer‟s overall risk management framework and capital adequacy determination. They help the insurer in making decisions on what action is needed to ensure that there is no undue risk.
• One purpose of testing is to measure the level of consistency in the testing done by the insurers and thus to enhance the confidence in these tests.
• Various modelling techniques are used in stress testing. Common methods used are based on static or dynamic modelling and deterministic or stochastic approaches.

MODELLING
What can Prophet DFA do for you?
Prophet DFA can help evaluate the consequences of the many strategicdecisions facing insurers. Users of the model have addressed a wide range ofissues including:
• Allocation of capital to business units and classes of business• Setting risk – adjusted performance targets for business units• Monitoring actual performance against targets• Planning for future solvency and capital requirements. • Testing business strategies such as:
– Reinsurance purchasing– Asset allocation Overall capital requirements– Dividend strategy– Expanding/contracting lines of business– Acquisitions and disposals

MODELLING
Economic model
The Economic supporting Prophet DFA provides all economic variables (CPI, claims inflation, exchange rates and asset returns) over the projection period. This provides a self consistent economic environment for each model simulation.
We recommend that Deloitte‟s proprietary model „The Smith Model” (TSM) is used as this has a number of desirable features not present in other commercially available economic models.
TSM
LIFE
NON LIFE

MODELLING
Insurance Company Structure
Organisational Structure
• Organisational structures are dealt with by defining “Entities”. An Entity will usually represent a legal entity that may be part of a group structure and can be an Insurance company, Captive or Holding Company.
• Lines of Business
– Individual lines of business are separately defined with unique sets of
– assumptions describing premiums, loss distributions, expenses, commissions
– and other class specific issues.

MODELLING
Assets
Any asset included within the economic file can be allocated in any proportion
to individual lines of business or else at an entity level. Asset returns are split
by both growth and income.

MODELLING
Reinsurance
Most common types of reinsurance are in a flexible and general format,including:
• Surplus Lines
• Quota Share
• Excess of Loss (including Catastrophe covers)
• Aggregate Excess of Loss (including Catastrophe covers)
• Stop Loss

MODELLING
Reporting
Each line of business, entity and reinsurance treaty is associated with a “base
economy” and a “reporting economy”. The reporting economy determines the
exchange rates used when results are output. The base economy determines
the assets returns, CPI etc that should be read from the econometric
simulations.

MODELLING
Premium Model
• Premium written is modelled through the application of the estimated written premium in the first period of projection and the series of volumes multipliers in later periods.
• Earned premium is modelled through defining earned premium pattern, resulting from the analysis of historical data.
• The value of premiums receivable and premiums paid is modelled through defining the premium pattern, resulting from the analysis of historical data.

MODELLING
Claims Model
• Claims are modeled as a product of claim ratio (generated from a chosen probability distribution) and premium income estimated in the given period.
• Claims paid are modelled by an application of claims paid scheme received upon the analysis historical data.
• Process of paid claims can also be subject to random generating fluctuations.
MODELLING
Reserving Model
• The model includes four types of reserves:
– Unearned Premium Reserve,
– Outstanding claims reserves,
– Claims handling resrves,
– Equalisation reserve.
• Reserves are calculated separately for each insurance group based on selected parameters.
• Unearned premium reserve is calculated based on earned premium pattern.
• Claims handling reserves is calculated based on proportional loading on outstanding claims reserve.

MODELLING
Expense Model
• The modeled types of expenses are:
– Acquisition costs
– Administration expenses
– Claims handling expenses
– Reinsurance comissions
• Acquisition costs are defined as a percent of premium written or by per policy.
• Administration expenses are modeled as three types:
• Fixed (nominal)
• Variable per policy
• Variable as percent of premium earned / written)
• Claim handling expenses are modeled as a percent of claims paid.
• Reinsurance commissions are modeled as percent of ceded premium.

Solvency II vs. Basel II
Risk optimization
Market drivers:
•Product Innovation•Pricing Efficiency•Selling
•Distribution
Back Office
Identification, Measurement, Warehousing and Analysis
Decision making
Economic Capital
Main (80/82) Management Drivers
Data strategy
Insights
High Level Decision „Insights‟
Board
CEO
CFO
trategic Directives
Equity Cash Flow „shapes‟
Good and Bad investment Assessments
Shareholder Value Model(generic to all industries)
When ROE>COE:=positive spread=creates value=M/B > 1
When ROE<COE:=negative spread=destroys value=M/B < 1
BANKING
Basel II
INSURANCE
Solvency II
Industry Driver
Credit Book and Risk
Management
Liquidity
Cost structure
sset and Liability
Mix&Management
Re-insurance
Unit cost per policy sold
Capture & Confidence
Information System
Capture & Confidence
Information System
Application


![001112ˇ˛˚˙2˝˙˜0’˘’˚˙ 01*+,-13] Lipsey,R.G.(1970), The theory of Customs Unions: A General Equilibrium ... UK joining the EEC: ... 239-266. [26] Viner, J. ...Authors:](https://img.pdfslide.us/doc/110x75/5b1c5d447f8b9a23258fd276/00111220-01-13-lipseyrg1970-the-theory-of-customs.jpg)