Embed Size (px)
Citation preview
Presented at 34th TPRC, 2006
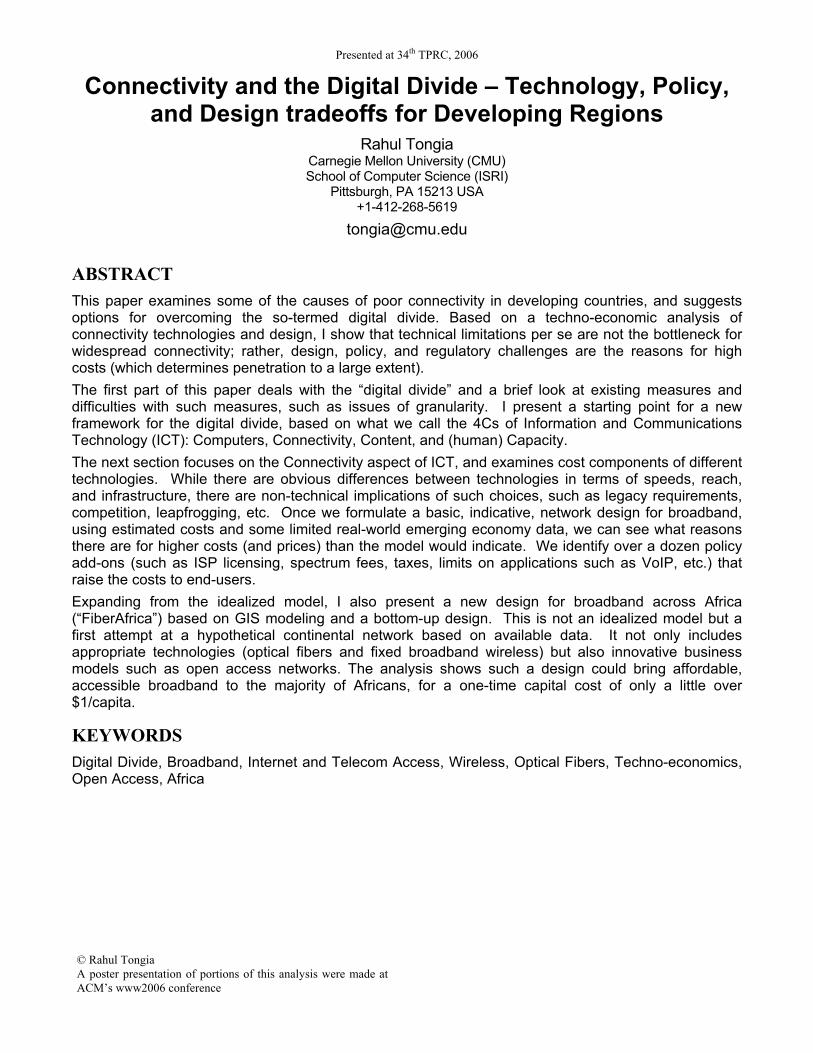
Connectivity and the Digital Divide – Technology, Policy, and Design tradeoffs for Developing Regions
Rahul Tongia Carnegie Mellon University (CMU) School of Computer Science (ISRI)
Pittsburgh, PA 15213 USA +1-412-268-5619
ABSTRACT
This paper examines some of the causes of poor connectivity in developing countries, and suggests options for overcoming the so-termed digital divide. Based on a techno-economic analysis of connectivity technologies and design, I show that technical limitations per se are not the bottleneck for widespread connectivity; rather, design, policy, and regulatory challenges are the reasons for high costs (which determines penetration to a large extent).
The first part of this paper deals with the “digital divide” and a brief look at existing measures and difficulties with such measures, such as issues of granularity. I present a starting point for a new framework for the digital divide, based on what we call the 4Cs of Information and Communications Technology (ICT): Computers, Connectivity, Content, and (human) Capacity.
The next section focuses on the Connectivity aspect of ICT, and examines cost components of different technologies. While there are obvious differences between technologies in terms of speeds, reach, and infrastructure, there are non-technical implications of such choices, such as legacy requirements, competition, leapfrogging, etc. Once we formulate a basic, indicative, network design for broadband, using estimated costs and some limited real-world emerging economy data, we can see what reasons there are for higher costs (and prices) than the model would indicate. We identify over a dozen policy add-ons (such as ISP licensing, spectrum fees, taxes, limits on applications such as VoIP, etc.) that raise the costs to end-users.
Expanding from the idealized model, I also present a new design for broadband across Africa (“FiberAfrica”) based on GIS modeling and a bottom-up design. This is not an idealized model but a first attempt at a hypothetical continental network based on available data. It not only includes appropriate technologies (optical fibers and fixed broadband wireless) but also innovative business models such as open access networks. The analysis shows such a design could bring affordable, accessible broadband to the majority of Africans, for a one-time capital cost of only a little over $1/capita.
KEYWORDS
Digital Divide, Broadband, Internet and Telecom Access, Wireless, Optical Fibers, Techno-economics, Open Access, Africa
© Rahul Tongia
A poster presentation of portions of this analysis were made at
ACM’s www2006 conference
Presented at 34th TPRC, 2006
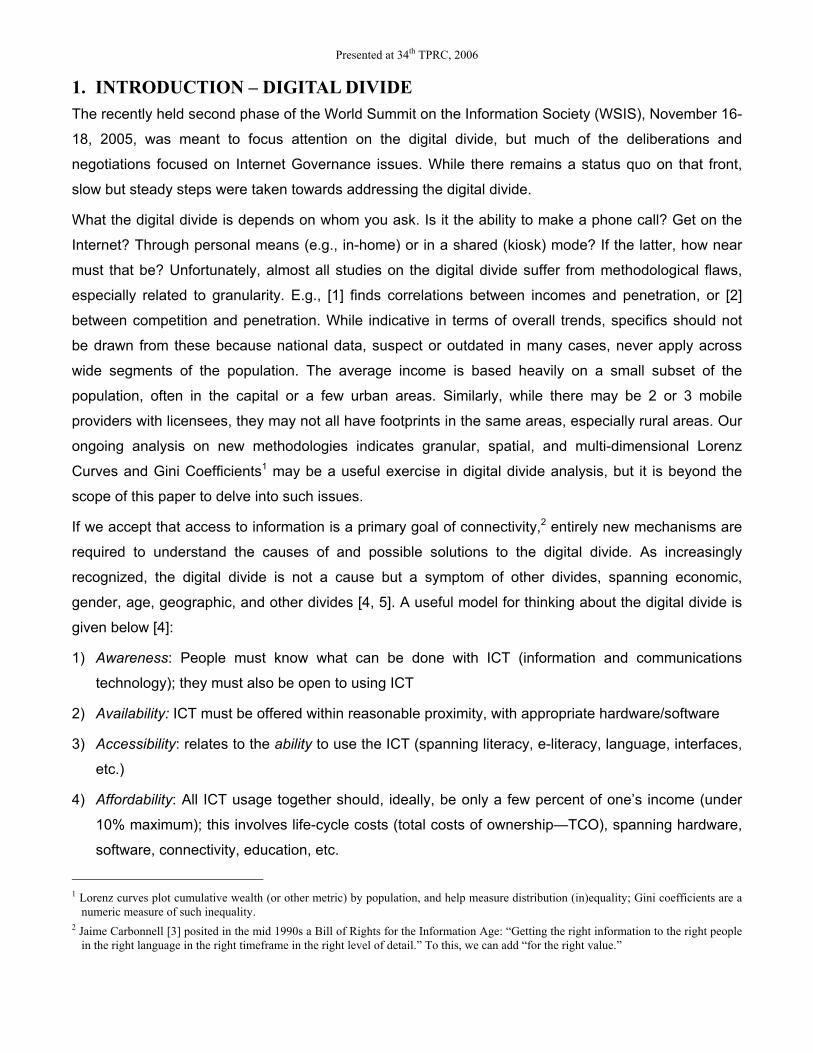
1. INTRODUCTION – DIGITAL DIVIDE
The recently held second phase of the World Summit on the Information Society (WSIS), November 16-
18, 2005, was meant to focus attention on the digital divide, but much of the deliberations and
negotiations focused on Internet Governance issues. While there remains a status quo on that front,
slow but steady steps were taken towards addressing the digital divide.
What the digital divide is depends on whom you ask. Is it the ability to make a phone call? Get on the
Internet? Through personal means (e.g., in-home) or in a shared (kiosk) mode? If the latter, how near
must that be? Unfortunately, almost all studies on the digital divide suffer from methodological flaws,
especially related to granularity. E.g., [1] finds correlations between incomes and penetration, or [2]
between competition and penetration. While indicative in terms of overall trends, specifics should not
be drawn from these because national data, suspect or outdated in many cases, never apply across
wide segments of the population. The average income is based heavily on a small subset of the
population, often in the capital or a few urban areas. Similarly, while there may be 2 or 3 mobile
providers with licensees, they may not all have footprints in the same areas, especially rural areas. Our
ongoing analysis on new methodologies indicates granular, spatial, and multi-dimensional Lorenz
Curves and Gini Coefficients1 may be a useful exercise in digital divide analysis, but it is beyond the
scope of this paper to delve into such issues.
If we accept that access to information is a primary goal of connectivity,2 entirely new mechanisms are
required to understand the causes of and possible solutions to the digital divide. As increasingly
recognized, the digital divide is not a cause but a symptom of other divides, spanning economic,
gender, age, geographic, and other divides [4, 5]. A useful model for thinking about the digital divide is
given below [4]:
1) Awareness: People must know what can be done with ICT (information and communications
technology); they must also be open to using ICT
2) Availability: ICT must be offered within reasonable proximity, with appropriate hardware/software
3) Accessibility: relates to the ability to use the ICT (spanning literacy, e-literacy, language, interfaces,
etc.)
4) Affordability: All ICT usage together should, ideally, be only a few percent of one’s income (under
10% maximum); this involves life-cycle costs (total costs of ownership—TCO), spanning hardware,
software, connectivity, education, etc.
1 Lorenz curves plot cumulative wealth (or other metric) by population, and help measure distribution (in)equality; Gini coefficients are a
numeric measure of such inequality.
2 Jaime Carbonnell [3] posited in the mid 1990s a Bill of Rights for the Information Age: “Getting the right information to the right people
in the right language in the right timeframe in the right level of detail.” To this, we can add “for the right value.”
Presented at 34th TPRC, 2006
Reducing the divide requires improvements across all the dimensions of ICT [dubbed the 4C
Framework]: Computing, Connectivity, Content, and (human) Capacity.
1) Computing: PCs are prohibitively expensive for most people, and shared access (e.g., community
centers or cybercafes) becomes inevitable. PCs today are very difficult to use, and even “experts”
spend a lot of time maintaining their machines, worrying about upgrades, security, compatibility of
hardware, etc. As a complementary technology, non-PC devices are an important option, e.g.,
mobile phones.
2) Connectivity: While mobile telephony is improving worldwide (witness in Africa it is now almost triple
the number of landlines), it remains expensive, limited in rural areas, and poor at providing data
connectivity.
3) Content: Meaningful content is lacking in many languages, and most content is not locally relevant.
Today’s systems tend to make people passive consumers of information, instead of enabling
generation of local information. In addition, rich content demands multimedia (useful to overcome
literacy issues), which, in turn, requires broadband connectivity.
4) (human) Capacity: Users need to be aware, literate, and innovative to hardness the power of ICT.
They also should be empowered to use ICT, societally and governmentally.
Of course, ICT usage does not occur within a vacuum, rather within social and cultural norms that also
shape the divide. In addition, ICT usage is based on policy and business models, especially regulation.
In the long run, ICT must provide value and be sustainable from both a user and a provider perspective.
If we consider the desired end-goals of empowerment and opportunities, access leads to information,
which can lead to knowledge, leading to empowerment and opportunities [6]. Of course, it is not linear,
and one requires complementary capabilities, especially to interpret information into usable knowledge.
Access → Information → Knowledge → Opportunities/Empowerment
Thus, access is a fundamental step in the Knowledge Economy.
2. ACCESS TECHNOLOGIES
2.1 Developing Region Issues
Digital divide statistics abound, such as by the ITU or the World Bank. As well known, the majority of
users, hosts, PCs, internet connections etc. are in developed countries. At a deeper level, developing
countries themselves show great variance, with China accounting for much of the growth in the last 15
years. Focusing on Africa,3 we find teledensity as low as 5.3 per 100 population in 2002 (fixed plus
3 Multilateral agencies often separate Northern Africa, focusing on Sub-Saharan Africa.
Presented at 34th TPRC, 2006
mobile), growing to over 11 by 2005-end, mainly from mobiles. Investments are large, estimated around
$30 billion between 1995-2002 [2].4 Indeed, telecoms, mainly mobile telephony, have been termed the
only bright spot in African industry, and the six largest (private) strategic investors in mobile had total
revenues in 2003 estimated at US$7 billion, with profits of US$800 million [2].
Studies have shown that the majority (~70%) of ICT differentials can be shown by income levels, with
additional variation explained by urbanization, regulatory regime, literacy, and age [2]. Thus, costs of
access matter. The ITU”s Digital Access Index is one composite metric that factors in affordability when
comparing ICT (in addition to quality, infrastructure, and knowledge). However, it only studies basic (20
hours) dial-up, and uses average numbers across nations.
2.2 Broadband, mobiles, and connectivity
Before we examine the feasibility and costs, we must first consider if the Internet is relevant to
developing countries, let alone broadband. ICT is widely recognized as a powerful enabler towards
development. The old argument of bread vs. computers has moved from competition towards
complementarity.5 While development requires large investments, ICT investments are relatively
modest, e.g., an order of magnitude lower than those required in electricity [4].
A fundamental question is whether a little connectivity is good enough, e.g., mobile phones or narrow-
band. Some have argued that developing countries don’t need broadband [8], given high costs vis-à-vis
other ICT. If this is the case, backbone requirements can be done via wireless quite easily, e.g.,
innovative designs for low-cost modified WiFi as developed by Brewer, et. al under the TIER
(Technology and Infrastructure for Emerging Regions) project at University of California, Berkeley, or
even commercial microwave backbones used by cellular providers in much of Africa. E-Commerce can
certainly be transacted over mobile phones. But much of the value-addition here is in terms of financial
transactions and credit systems, which are limited in much of the world.
Limited backbones inevitably become saturated, as users grow and applications drift upwards in
bandwidth. Quality of Service (QoS) mechanisms do not help significantly, and there are indications
these create more costs than benefits for many providers [9]. This is part of the moving target
phenomenon. Those who are online via dial-up then face a new divide between those who have
broadband, e.g., rural America.
If one is investing in infrastructure, it makes sense to deploy solutions that will last not a few years, but
a generation. Interim solutions may cost less up front, and, through cherry-picking profitable users, may
4 Only a fraction of investments went into new infrastructure; the remainder went into buying existing stakes through privatization, or
licensing/regulatory fees.
5 “The issue is whether we accept that the poor should, in addition to the existing deprivation of income, food and health service, etc., also
be further deprived of new opportunities to improve their livelihood.” [7].
Presented at 34th TPRC, 2006
even be highly profitable, but societal penetration, and hence, benefits, will be low. There is also
evidence that many complementary efforts (and costs) are relatively constant, regardless of the speed
of the linkages being considered, e.g., the permits and construction times for erecting a wireless tower
or digging a duct. This is further reason to optimize for higher speed connectivity, something only
looking at capital costs would not indicate.
Why build a network if you are not sure there will be users? If people don’t have or cannot afford PCs,
then this is a serious challenge. However, not only are there an increasing number of PCs for end-
users, but many schools, hospitals, government offices, institutions of higher learning, etc. have
computers, but find connectivity expensive.
2.2.1 Mobiles – Competitive or Complementary?
Mobile telephones operate as a proprietary, closed (but profitable) network. Add-on communications
(e.g., SMS, m-Commerce, etc.) require working with the operator, unlike open networks like the Internet
where the innovation can occur at the edge, independent of carrier.
Mobile telephony is now on the order of 10% penetration in Africa, and the footprint of providers in Sub-
Saharan Africa is estimated as high as 57% of the population [2]. Are mobiles the solution to the digital
divide, as claimed in the Economist March 10, 2005 cover story [5]?
Mobiles have been successful for many reasons beyond the need for people to communicate. Most
initial providers were private, who operated more efficiently (and with much less delay) then the
incumbents. Mobiles are also not an interim solution, in that the solutions deployed in developing
regions are similar (if not superior) to those deployed in developed countries. Why would we consider
interim solutions for data connectivity?
Mobiles fall short on several grounds when it comes to data needs.6 For starters, it is just too expensive
for much of the population; ITU data from 2003-04 [10] show average monthly costs more than double
those in India, though the ratio is improving. In addition, mobile devices are such that users find it
difficult to produce information, except in a one-to-one mode (voice or data, as SMS), making them
consumers of information at best. Claims of the third-generation (3G) cellular systems providing a
relevant data solution ignore the very high costs carriers hope to, rather, need to charge to recoup their
investments. The total bandwidth is also relatively limited, especially if we want real broadband for
many simultaneous users. The use of wireless backbones by many cellular networks across Africa
further limits their ability to offer broadband.
6 There is significant value to mobile phones for some applications, such as use of SMS messages for agricultural price discovery, or
mobile-commerce (m-Commerce), but these are subsets of the overall use of data connectivity.
Presented at 34th TPRC, 2006
Under scenarios of bandwidth scarcity, which would a provider rather supply: voice or data? As
Odlyzko [11] and others point out, voice bits are worth multiple times more on average than data bits,
so data again takes a back seat.
Questions about “enough” bandwidth may also be patronizing. Few people who have used (affordable)
broadband would ever want to go back to narrow-band. Duncombe and Heeks [12] say telephones are
what people in many developing regions need most to reduce costs – the network with whom people
communicate is often known or proximate. This is a useful first step, but there are indications it may not
be enough. Once gains have been culled from the voice telephony system (or, when it approaches
ubiquity and thus provides no relative competitive edge), improvements will only come from data
connectivity, in appropriate formats and form factors. There are undeniably higher learning curves and
barriers to adoption, but these should be addressed through improved designs and technology.
Consider the US or Europe (or even parts of China) – many people find more financial value (savings,
new opportunities, etc.) from the web than from the phone. This may be a chicken and egg problem,
however, that without the right consumer access to e-government or e-commerce, providers or
suppliers will not build out the content to spur connectivity demand.
2.3 Techno-economic framework
Tongia [13] presents a generalized model for analyzing broadband connectivity, which includes
stochastic or parametric elements for many of the variables. The four major components of the monthly
costs are, along with the components or factors that matter in [brackets]:
1) Capital expenditure (amortized into monthly payments) [turnover or churn rate, interest rate,
financing period (which is linked to churn and market competitiveness)]
2) Operating Expenses [customer relations, billing, maintenance]
3) Uplinking costs [transit or backbone fees, rated or advertised speeds, oversubscription ratio,
applications allowed (e.g., peer-to-peer, voice, etc.) and topology (where does contention and
sharing occur)?]
4) One-time costs [installation, activation, customer premises equipment (if bundled with service, else
is a capital or subscriber cost), marketing, rights of way charges or spectrum, as applicable].
Importantly, this model focuses only on costs, and not price. Retail prices often have very little to do
with costs, for various market, competitive, and social reasons.
Naturally, this generalized model requires adaptation for different scenarios. Not only are technologies
different and not always comparable, but different locations and regulatory environments lead to
different costing models and even technology choices. In a simplified model, there is an access (“last-
mile”) solution that operates over the first hop between end-user and edge of the provider’s network. At
Presented at 34th TPRC, 2006
the other end, the retail provider must connect to the overall Internet (“cloud connectivity”), paying
uplinking fees. In between, depending on the technology and business rollout, there may or may not be
an intermediate network segment or provider linking the two. Alternatively, one of these two (core or
retail) providers may do this function themselves. E.g., DSL uses voice-copper over the last-mile, all the
way to the central office (CO). From here, the voice and the data are separated, and data uplinks to the
cloud. Cable networks typically include a metro ring to interconnect the head-ends, end points for
where the hybrid fiber-coax network ends. In developed markets with competitive national backbones,
this metropolitan link is often a bottleneck; upgrading this local loop can be as time-consuming and
expensive as uplinking inter-city connectivity. For the middle link, collocation designs have some
advantages, but don’t obviate the physical need to go from a central office, headend, or base station to
the point where the core is available.
Under the generalized framework as above, how does one reduce the digital divide? The first step is
determining which services (and thus, technologies) apply. Availability of existing infrastructure is vital
to low costs. Cable modems and DSL utilize copper that was laid to carry other, revenue-bearing
services, something missing across much of Africa (wireline penetrations are a little over 3% only,
mainly in urban areas [10]).7 Mobile telephony, by its very success, limits migration paths for
broadband.
Let’s say the backbone is competitive. The US would qualify under that metric. Does that do enough?
Rural areas may still not be competitive, and the US often sees uplink charges 5 or more times higher
in rural areas. It is important to recognize that total charges for a high-speed link (e.g., a T-1) are the
sum of the transit fees (at the Point of Presence) plus the local loop, and the latter can dominate.
Limited backbone connectivity in developing regions (that too only at exorbitant prices) is a major issue,
esp. in Africa. Megabit speeds across Africa are rare, and largely available through satellite only
(except urban niches). Costs are at least $2/kbps/month for special (educational) cases—with uploads
much slower than downloads—and typical costs per mbps are closer to $4-5,000/month or higher, plus
high upfront costs.
Backbone (“transit”) prices are very different from retail connections. The latter are often advertised for
tens of $/month per mbps, sometimes lower. This is because retail connectivity is shared by multiple
users across an access segment, regardless of the technology. (It is inherently practical to do so, since
the bursty nature of packet transmissions means average utilizations are much lower than peak.) The
main differences are the levels of oversubscription, or statistical multiplexing. Business connections are
usually less shared in the uplink. If uplinking can be had for as low as $100/mbps/month (this is
available but cheap, strongly depending on geography, competition, etc.), then oversubscribing it by a
7 This means 3 phones per 100 population.
Presented at 34th TPRC, 2006
factor of 100—considered overly shared—implies per user costs of only $1/month. Personal
conversations with DSL analysts indicate US providers only pay ~$2-3/month per consumer for
uplinking. High oversubscription ratios lead to low performance for users, and these can be 200 or
worse in Africa [14]. In addition, increasing use of peer-to-peer and rich media applications is also
pressurizing uplinking speeds.
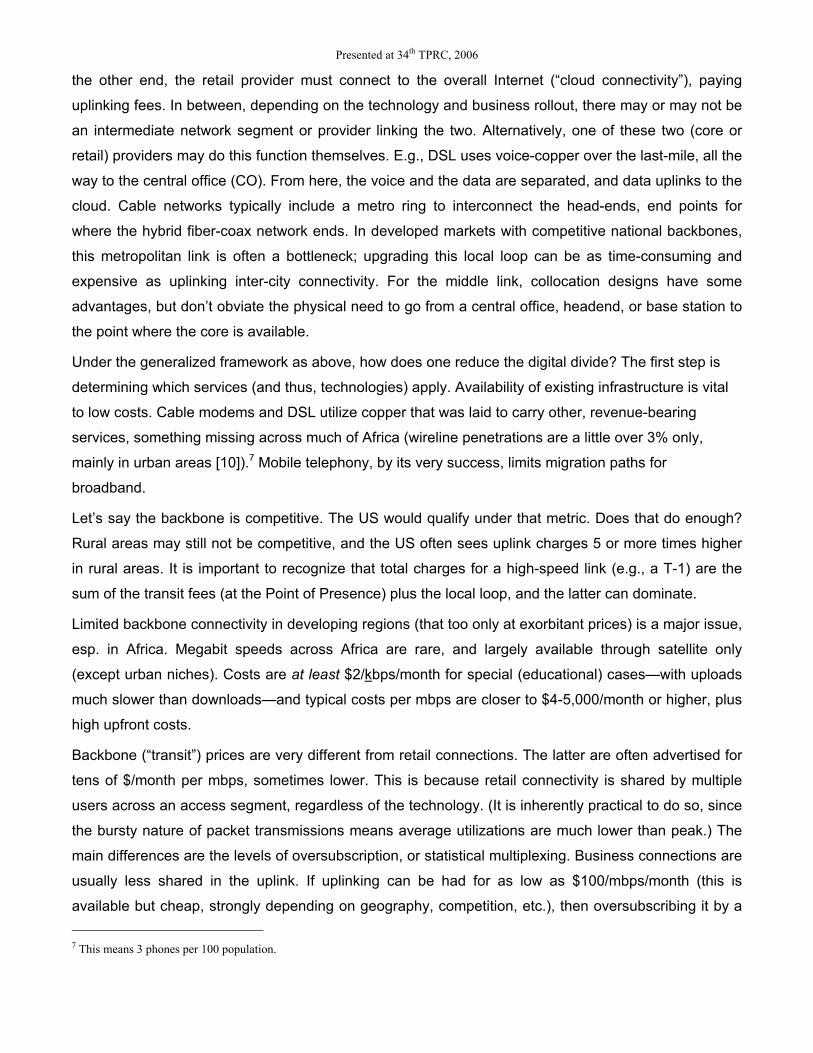
Given different design options and commercial choices providers can make, comparing technologies
and providers is difficult at best, and meaningless in many cases. Table 1 attempts this through
indicative numbers only. Dial-up is not shown in the table, though advertised speeds are upto 53 kbps.
In reality, many connections are 28.8 kbps or lower, and effective throughput is far worse because of
massive oversubscription.
Table 1: Broadband access technologies and costs for consumers (residential) (US$). The capital costs are estimates
based on public data, and are per subscriber (typical deployment), not per home passed. One difficulty is cost allocation, e.g.,
advanced cable systems can share infrastructure for Video-on-Demand functionality. For DSL, cable, and BPL, we assume
availability of existing copper. There are a few exceptions to these numbers, e.g., community, municipal, or even free WiFi
and other networks being considered in some cities.
Typical
speeds
(mbps)
[Down/up]
First hop
ends
Capital
expenditure
/subscriber
excluding
CPE
Customer
premises
equipment
(CPE)
Costs
Operating
costs per
subscriber/
month
Uplinking
costs
/subscriber
/month
One-time
costs
Typical
monthly
prices
seen in
developed
countries
Typical
monthly
prices in
developing
regions
Tech.
Maturity or
deployment
DSL 0.64-100 both
Central Office (CO)
40 10 Low (assuming existing copper)
15-50 5-100 (for lower speeds)
High
Cable .1-10/lower Head-end ~100 10 Medium 30-60 5-100 High
Broadband
over
Powerlines
(BPL)
1-4/lower Distribution Transformer
~300 20 High 30-40 NA Low
Fiber to the
Home
100/100 Access cabinet or CO
~1000 (western figure)
Highest 30-70 NA Low
Satellite 0.64-45/lower
Satellite ~500-1000 300-500 High 70-90 200+ High
3G cellular 0.384-2/lower
Base Station ~300+ ~200 High-medium
60+ 40+ (limited throughput)
Low
Fixed
wireless
WiFi
(mesh)
1-11 (raw, lower in practice)
Neighboring node
~100 10 Low 20+ ?? Medium
WiFi
(access
point)
1-11 Access point ~100 (no tower)
10 Low 20+ ?? High
WiMax
(802.16)
.5-10 Base station 100-200 250
Operating costs are assumed to be
comparable across
technologies, differentiated more by business model and location than technology. Costs range from 1-6 typically.
Uplinking costs are strongly a function of location and of rated consumer speed, instead of technology. Ranges from 2-10
typically, but higher in some locations.
Medium 30+ NA Low
Presented at 34th TPRC, 2006
Given the numbers above, we see that capital expenses are only a fraction of total monthly costs,
especially for reasonable costs of capital (10-15%). Tongia [13] goes through the above exercise in
detail for a particular technology (broadband over powerlines).
The 4C Framework for the digital divide on page 3 is more important than first glance when considering
costs of connectivity. Where does content sit that users want? Today, much of the global content is in
select locations, especially N. America, Europe, or East Asia.8 This implies heavy usage of international
connectivity, typically submarine fibers. In contrast, a domestic-centric network not only improves
performance, it also reduces costs significantly (if we assume, as seen worldwide, terrestrial links are
much less expensive than submarine). This is also a reason measuring the digital divide based on
international connectivity per capita, such as [15], is problematic. China, Korea, and Japan have low
values because of domestic content, and the US lags Europe given much of the content is within.
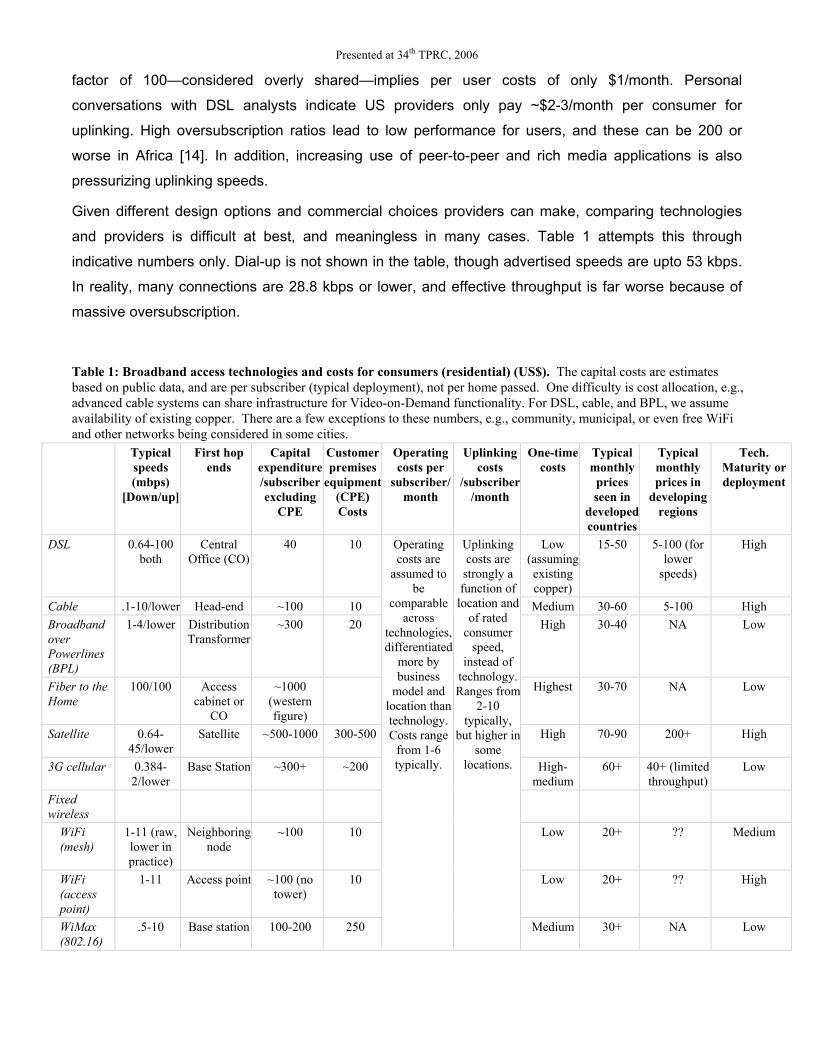
2.3.1 Policy and Add-on Distortions
Cost per user clearly depends on chosen technology, penetration level, user distribution, as well as
factors outside the broadband domain, including availability of complementary infrastructure. A further
distortion in access costs occurs when we consider how policies (especially governmental) lead to
artificial increases in the cost of connectivity (or other ICT). If one starts with the equipment (hardware,
software, and installation) for an ideal network (optimized for user conditions), there is an associated
cost to end-users. Any policy decisions on top, for whatever reason, create additional costs, distortions,
or rents. Below is a list of policies that make connectivity such as broadband more expensive for the
end-user (not in any particular order):
8 Caching and content delivery networks aim to mitigate this issue, but are ultimately limited.
Table 2: Policy and regulatory add-ons raising costs of technology. This is compared to an optimized techno-economic
framework, which is the bare minimum any deployment would cost based on technology, subscriber profile, applications,
etc.
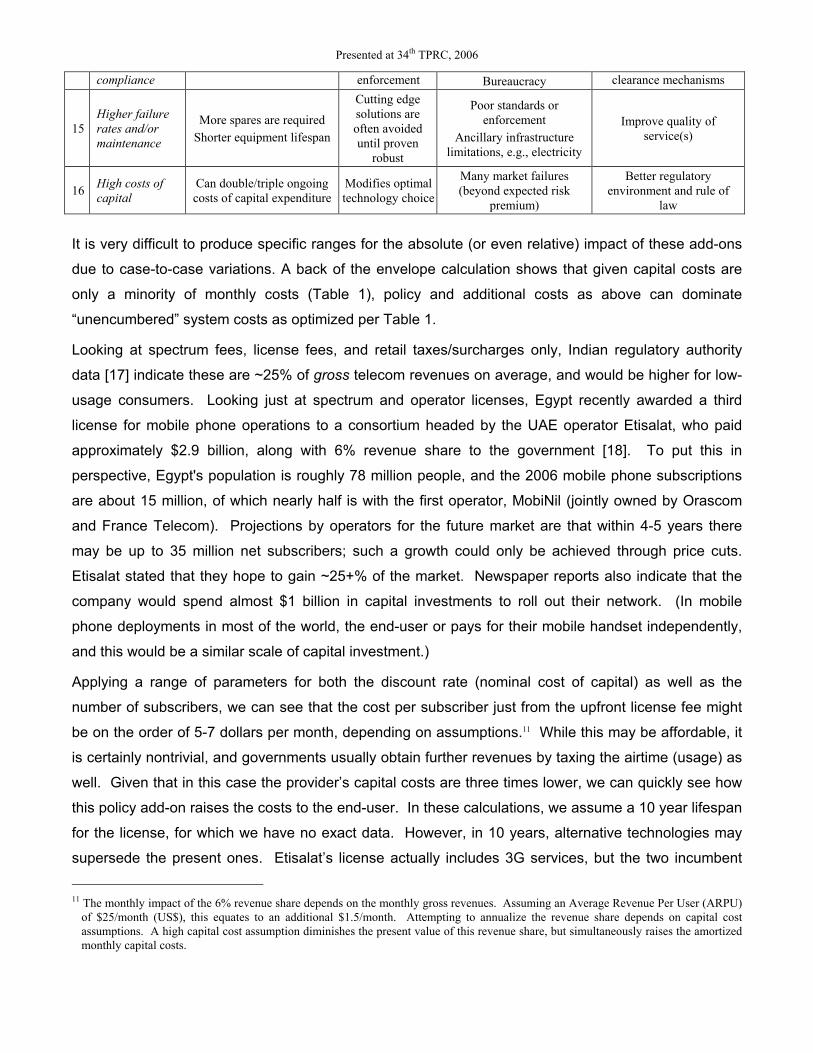
Distortion Financial Impact Other Impacts Underlying Issues Suggestions (beyond
eliminating the policy)
1 ISP licensing
fees
Upfront costs (often), which become higher for low user base, or revenue-sharing (sometimes 10-
15%)
Even non-financial
regulations pose compliance burdens
Government revenues;
Regulatory mindset
Move to revenue share, if at all;
Create new licensing norms including
penetration requirements instead
Presented at 34th TPRC, 2006
2 Spectrum
Cellular licenses in Africa have reportedly sold for as high as hundreds of millions of dollars
Limited unlicensed spectrum
9
Spectrum considered a scarce resource (which may no longer be true due to improved technology);
Key frequency bands poorly utilized [16], or unavailable for broadband
Open new bands for licensed and unlicensed broadband, especially
UHF bands;
Allow higher power levels, incl. through antennae gain
3 Rights of Way
charges
Can be as high as tens of thousands of dollars/mile
Limits barriers to entry
Major issues of public vs. private (both of land usage and of ICT services)
Open access solutions;
Transparency
4 Import Duties Can be 10s of percent on capital equipment
Impacts tech. choices
Government revenues;
Domestic market protection
Revenue share models (if net revenue neutrality is
desired)
5 User Taxes and
Surcharges
Fraction of revenues, order of 10% in many places
Cross-subsidy implications
Ostensibly for universal service, many surcharges are diverted to general accounts of the govt. (or
worse)
Transparency;
“Escrow” accounts outside general govt. budgets
6 Uplinking and
interconnection
restrictions
Artificially enhances market power of backbone
Incumbents are powerful, and often government entities; Security rationale is often
given
Non-discriminatory regulation
7 Limits on
applications
and services
Limits convergence and new revenue stream
Control over information flows;
Voice over IP (VoIP) is the most visible restriction, driven by profits (often monopoly rents) from voice services
Allow full competition across services,
applications, modes of delivery, etc.
8 Limits on
sharing
connectivity
Cannot share costs Poor acceptance of low marginal costs to allow new models of deployment
New deployment models for high levels of deployment, incl. community networks
10
Lack of clarity /
consistency on
“affiliate
transactions”10
Some charges are passed through to different classes
of users
Barriers to entry (helps
incumbents, often)
Regulatory immaturity;
Incumbency power
Create level playing field, inter- and intra-modally
11 Low density of
target users
Implications of lower penetration can be almost (but not quite) linear
Equity issues (exacerbating existing divides)
This is an issue of design, not natural consequence of
markets.
Develop new deployment models for high levels of deployment instead of
niche
12
Design without
scalability or
upgrading
possibilities
Limits economies of scale
Can favor traditional or established technologies
Conservatism;
Limited purview of market
Use optical fibers rather than copper, and IP-centric designs over circuit-
switched
13 Proprietary or
National-only
standards
Poorer price-performance (usually, but not always)
Less global competitiveness by local industry
Domestic market protection;
Leapfrogging (e.g., China or Korea)
Harmonize standards globally to reap economies
of scale
14 High costs of
regulatory
Raises start-up and ongoing costs
Potential for corruption or poor
Security bogey; Standardize;
Create single-window
9 Some countries allow for “fee-free licensing” which can be burdensome, or only allow for “in-campus” usage, (e.g., India), which
obviates Wireless ISPs.
10 These are the charges passed on to sister or partnering entities; e.g., a power utility offering broadband over powerlines, how are they to
pay for the copper, rights of way, poles, etc.?
Presented at 34th TPRC, 2006
compliance enforcement Bureaucracy clearance mechanisms
15 Higher failure
rates and/or
maintenance
More spares are required
Shorter equipment lifespan
Cutting edge solutions are often avoided until proven robust
Poor standards or enforcement
Ancillary infrastructure limitations, e.g., electricity
Improve quality of service(s)
16 High costs of
capital
Can double/triple ongoing costs of capital expenditure
Modifies optimal technology choice
Many market failures (beyond expected risk
premium)
Better regulatory environment and rule of
law
It is very difficult to produce specific ranges for the absolute (or even relative) impact of these add-ons
due to case-to-case variations. A back of the envelope calculation shows that given capital costs are
only a minority of monthly costs (Table 1), policy and additional costs as above can dominate
“unencumbered” system costs as optimized per Table 1.
Looking at spectrum fees, license fees, and retail taxes/surcharges only, Indian regulatory authority
data [17] indicate these are ~25% of gross telecom revenues on average, and would be higher for low-
usage consumers. Looking just at spectrum and operator licenses, Egypt recently awarded a third
license for mobile phone operations to a consortium headed by the UAE operator Etisalat, who paid
approximately $2.9 billion, along with 6% revenue share to the government [18]. To put this in
perspective, Egypt's population is roughly 78 million people, and the 2006 mobile phone subscriptions
are about 15 million, of which nearly half is with the first operator, MobiNil (jointly owned by Orascom
and France Telecom). Projections by operators for the future market are that within 4-5 years there
may be up to 35 million net subscribers; such a growth could only be achieved through price cuts.
Etisalat stated that they hope to gain ~25+% of the market. Newspaper reports also indicate that the
company would spend almost $1 billion in capital investments to roll out their network. (In mobile
phone deployments in most of the world, the end-user or pays for their mobile handset independently,
and this would be a similar scale of capital investment.)
Applying a range of parameters for both the discount rate (nominal cost of capital) as well as the
number of subscribers, we can see that the cost per subscriber just from the upfront license fee might
be on the order of 5-7 dollars per month, depending on assumptions.11 While this may be affordable, it
is certainly nontrivial, and governments usually obtain further revenues by taxing the airtime (usage) as
well. Given that in this case the provider’s capital costs are three times lower, we can quickly see how
this policy add-on raises the costs to the end-user. In these calculations, we assume a 10 year lifespan
for the license, for which we have no exact data. However, in 10 years, alternative technologies may
supersede the present ones. Etisalat’s license actually includes 3G services, but the two incumbent
11 The monthly impact of the 6% revenue share depends on the monthly gross revenues. Assuming an Average Revenue Per User (ARPU)
of $25/month (US$), this equates to an additional $1.5/month. Attempting to annualize the revenue share depends on capital cost
assumptions. A high capital cost assumption diminishes the present value of this revenue share, but simultaneously raises the amortized
monthly capital costs.
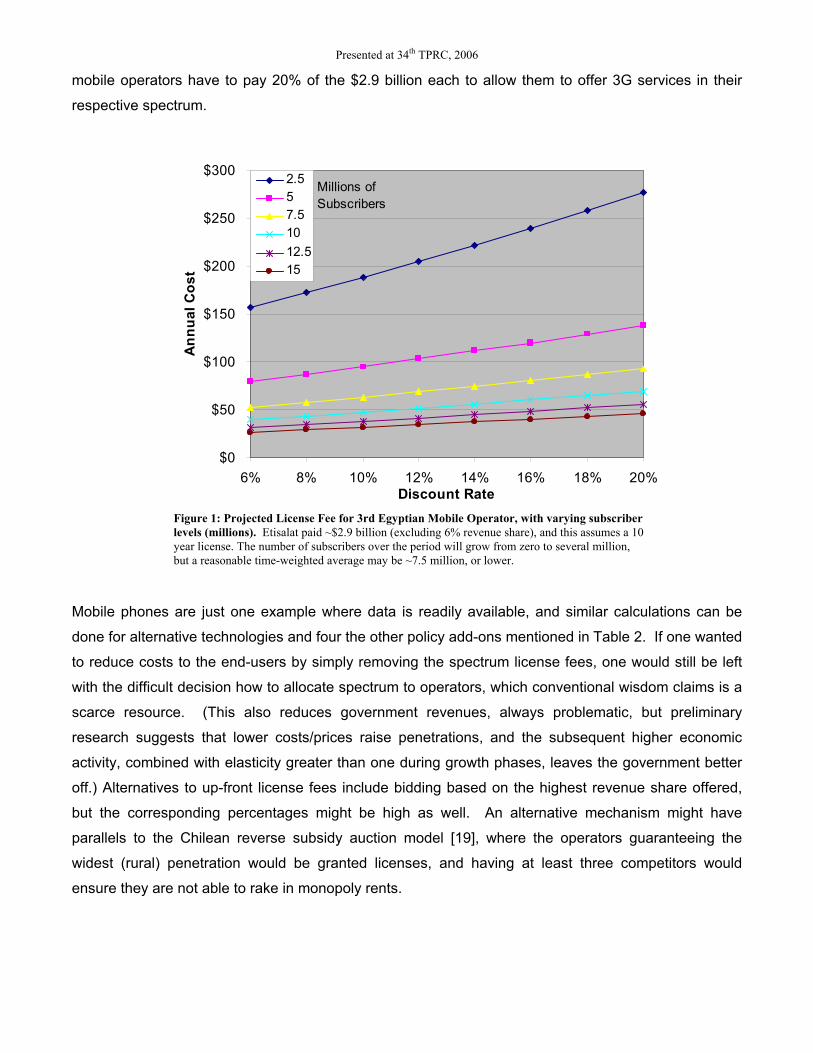
Presented at 34th TPRC, 2006
mobile operators have to pay 20% of the $2.9 billion each to allow them to offer 3G services in their
respective spectrum.
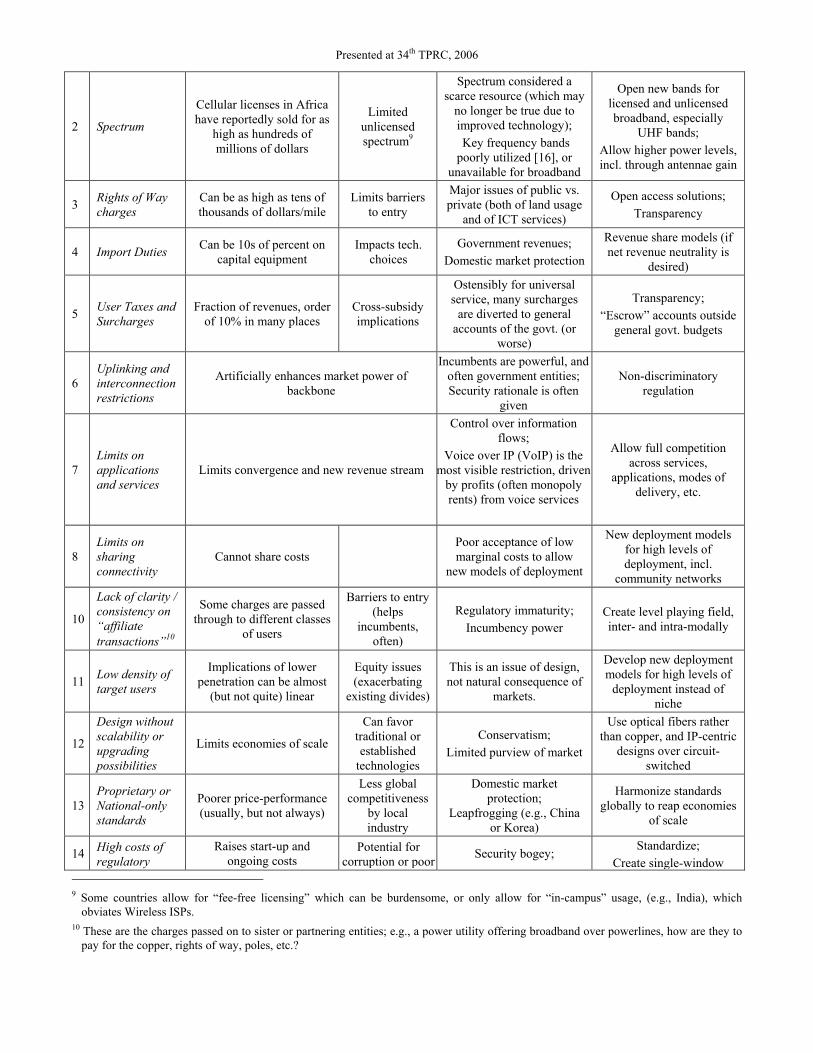
$0
$50
$100
$150
$200
$250
$300
6% 8% 10% 12% 14% 16% 18% 20%Discount Rate
Annual Cost
2.5
5
7.5
10
12.5
15
Millions of
Subscribers
Figure 1: Projected License Fee for 3rd Egyptian Mobile Operator, with varying subscriber
levels (millions). Etisalat paid ~$2.9 billion (excluding 6% revenue share), and this assumes a 10
year license. The number of subscribers over the period will grow from zero to several million,
but a reasonable time-weighted average may be ~7.5 million, or lower.
Mobile phones are just one example where data is readily available, and similar calculations can be
done for alternative technologies and four the other policy add-ons mentioned in Table 2. If one wanted
to reduce costs to the end-users by simply removing the spectrum license fees, one would still be left
with the difficult decision how to allocate spectrum to operators, which conventional wisdom claims is a
scarce resource. (This also reduces government revenues, always problematic, but preliminary
research suggests that lower costs/prices raise penetrations, and the subsequent higher economic
activity, combined with elasticity greater than one during growth phases, leaves the government better
off.) Alternatives to up-front license fees include bidding based on the highest revenue share offered,
but the corresponding percentages might be high as well. An alternative mechanism might have
parallels to the Chilean reverse subsidy auction model [19], where the operators guaranteeing the
widest (rural) penetration would be granted licenses, and having at least three competitors would
ensure they are not able to rake in monopoly rents.
Presented at 34th TPRC, 2006
3. LEAPFROG NETWORK DESIGNS (E.G., “FIBERAFRICA” PROPOSAL)
If we accept the limitations of trickle down, market-driven broadband deployment in Africa (especially
rural areas),
Table 2 presents a useful starting point for thinking of new designs for connectivity. I present details on a
leapfrog design network for broadband across Africa, dubbed “FiberAfrica”.12
3.1 FiberAfrica Design
The high-level design requirements include:
1) Core network of 10+ Gbps across all major population centers
2) Easy access to the core, without which (1) is meaningless
3) Affordable access costs (free or nearly free)
4) Public and private partnership, with competition
Gigabit speeds are only practical with optical fibers, and analysis indicated access was best achieved
through fixed (or perhaps portable) wireless. Reasons for the latter include (1) relatively low densities of
users, and wireless is a shared medium; (2) continuing innovation in price-performance; (3) scalability
with costs distributed with growth; (4) mobile wireless is complementary, competitive (with vested
interests) and sometimes burdened with regulations.13
3.1.1 Need for new designs
There is a philosophy held by many across various fields, amplified in the networking world:
incremental changes lead to incremental benefits. FiberAfrica (FA) is presented as a continental scale
network based on optical fiber and (fixed) broadband wireless that gives the majority of Africans
virtually free basic broadband connectivity within walking or cycling distance. The network is sustained
by small-scale payments and by commercial users who still benefit by dramatically lower costs for
connectivity than not only today but also alternative designs as proposed elsewhere.
The rationale for the FA model as proposed is based on several realizations:
1) Small “Internet Size” of most countries requires unique scaling and design. Most countries in Sub-
Saharan Africa are very small in terms of “Internet Size,”14 and even the obvious exceptions are
themselves modest in the scheme of the Internet overall. Today, most countries are attempting to
12 More details on FiberAfrica are available at http://tinyurl.com/dttga
13 Mobile wireless typically lacks enough spectrum for broadband (channels often being 1.25 MHz wide, compared to, say, 20 MHz for
WiFi). The spectral efficiency is also lower, even in 3G systems. In addition, mobility imposes unnecessary costs on system technology,
perhaps as high as 30-50% for the soft handoffs.
14 Internet size is our metric for capturing population, density, applications (and hence, bandwidth), etc. as well as secondary measures
such as literacy, age, language, etc.
Presented at 34th TPRC, 2006
“reinvent the wheel” with their individual international fiber connected gateways, data centers,
security centers, etc. Instead, they could save significant costs by sharing many of these features
(with appropriate security mechanisms and sovereign control, of course). A single large-scale core
router could handle all the traffic going in or out of Africa today with ease. But, we have countries
with a few million people, and less bandwidth than a small city in the US, building out their own
networks without optimizing them for the size or scale possible under a transnational network.
2) Domestic content and connectivity are required. Without meaningful penetration within the country,
building out international connectivity doesn’t achieve much. Meaningful penetration will only be
driven by content that meets domestic (local) needs, and such content is unlikely to be made
available from abroad, especially not in local languages. Using international connectivity as the
backbone for interconnections is poor and expensive design15 – domestic fibers will be much less
expensive and easier to scale. We already have significant global fiber capacity (potentially,
hundreds of Gbps) landing at multiple points in Africa (in multiple countries). However, has this
done much for bringing down connectivity/uplinking costs in those countries?16
3) Big bang approaches can sometimes be more acceptable than small interventions that keep the
underlying system (and divides) in place. A continental level playing field can mitigate neighboring
rivalries. In addition, the vision of FA ensures that a new divide between African countries is not
created – market-driven solutions would otherwise only connect a subset of countries in a
meaningful manner. This also makes it more likely for donors to consider investing in such
infrastructure. There are certainly interim solutions and technologies that may be less expensive
upfront, but they are less scalable and more expensive in the long run. Of course, FA will not be
built out at once, rather beginning in certain regions first.
4) There is no lower barrier to entry than free. In addition to innovations in technology, FiberAfrica has
a unique business model, whereby public users (schools, hospitals, libraries, etc.) can get free or
nearly free broadband access, and end-users can also get free basic connectivity in community
access points, distributed throughout Africa. Such access points would themselves receive either
free or virtually free connectivity, and could charge for value-added services or assistance with
transactions and fulfillment. Affordability is a key aspect of the digital divide. Mobile telephony could,
15 Even India had segments until the late 1990s where e-mail from one city to the other would go through the US!
16 SAT3 is the most visible example of such an expensive submarine cable landing in many countries in W. Africa. There is a proposal by
NEPAD to build a similar fiber-optic backbone for multiple countries in the Eastern portion of Africa based on submarine cables –
EASSY – Eastern Africa Submarine Cable System. This is a positive step in bringing countries together, but FA might be a better design
for the same stakeholders to consider. In addition to the much higher cost for EASSY—estimated ~10 times higher per km for the
submarine fiber (based on limited public data) than the low-cost terrestrial figure of $3,000/km inclusive of initial equipment—“bringing
the Internet to more countries,” even at high speeds, does very little for increasing access and penetration, especially in rural areas. Also,
this network has not been envisaged with innovations in business plans or true open access, rather, is currently set up as a “closed club”
like SAT3. A number of analysts have expressed concerns about such a model [20], and there are recent indications the World Bank and
others are insisting on Open Access rules to receive support.
Presented at 34th TPRC, 2006
in theory, be availed by almost 2/3 of Africans, even a non-trivial fraction of rural populations.
However, they choose not, based on the value proposition (or lack thereof).
5) The best model is one of public and private partnerships, on an Open Access model. Treating
connectivity as a utility but with a combination of shared core and competitive edges and/or retail
services appears to be the most cost-effective solution.
The suggested use of donors for one-time costs is only one option, and private funds could also be
used (leveraged through multilateral agencies, perhaps, who help reduce risks). It is worth emphasizing
that donors need only pay for the lowest level of open infrastructure; the actual retail services would be
provided by other public or private providers, whose total investment would be much larger in the long
run.
3.1.1.1 Open Access Networking
Optical fibers are a preferred technology for connectivity, but can we expect 3 or more independent
fiber networks being deployed across Africa in the near term (a minimum number of players as per
economics analysis)? If we treat optical fibers like a utility, built everywhere (or deeply enough) just
once, then different players could compete to provide services on top of this infrastructure.17 For rural
or underserved areas, free or nearly free connectivity could be given for community access points. In
urban areas, this could provide much cheaper uplinking bandwidth for service providers.
Open access networking is a concept that represents a fundamental shift in regulation and business.
This is more than “net neutrality,” whereby a service provider should allow all packets through the
network, and especially not favor (rather, disallow) some types of packets on commercial grounds.
Open access networking is based on a rethink of how different layers in telecommunications and
connectivity operate, especially in an integrated or converged world, and is an extension of structural
separation (between bulk and retail services). Instead of regulating integrated providers (“vertical silos”)
who provide applications over underlying infrastructure they own, the Internet offers a layered
approach, whereby different services can be provided over different technologies and layers, owned by
different providers [21]. Simplified, a bit is just a bit, and a provider is, say, either carrying it in the core,
or providing an end-user (retail) service. Voice can be carried as a packet (VoIP) or over mobile
phones, or traditional circuit-switched lines.
Open access networking has been recognized as especially important for developing countries, where
incumbents do not have near universal deployment and where capital is scarce. A recent report [22]
highlighted that open access can help overcome historical obstacles present in Africa. Additional
reasons for such a design include: (1) Economies of scale; (2) Competition, especially for broadband, is
17 This has parallels to the Utopia network model in the state of Utah, USA, and projects in Sweden.
Presented at 34th TPRC, 2006
hard to achieve in practice (merely allowing it is necessary but rarely sufficient); (3) Given the extra
costs that policies and regulations impose (
Table 2), any waivers from these should only be given for the greatest public good, instead of enriching
select providers; (4) Competition can be enhanced at the edge and in retail services, who all benefit
from very inexpensive uplinking; this also allows more content/application innovation instead of mere
connectivity; (5) Donors are likely to fund only public projects, and not help private companies reap
more profits.
Economies of scale are more than issues of larger market share. Optical fibers last for decades, while
the electronics upon these last much shorter, and must typically be amortized within just a few years
when considering access solutions. This fundamental disconnect today raises the costs to end-users if
amortized across the least common denominator (shorter timeframe) [23]. However, open access
networks can separate the two, reducing costs for providers (and thus, endusers).
A number of analysts have advocated treating bulk connectivity like a utility, and the Utopia network in
Utah is just one example of a community network.18 Critics have questioned many municipal or similar
open access networks on commercial grounds, and there are event attempts to restrict such
networks—in favor of private networks—especially in several states in the US. While there are certainly
some fiscal shortcomings in some deployments (along with successes), part of the challenge is when
incumbents lower their prices dramatically just in the regions where such competition is emerging [24].
This is either predatory pricing (easy to achieve given very low marginal costs of providing services), or
proof they were overcharging before! Competition, or the threat of competition is key to improving
connectivity (especially in Africa) [1]), and this so-termed “Walmart effect”19 undoubtedly helps
consumers.
Roads are a good example of an analogous system that allows open access on top of public
infrastructure – we don’t want ten highways in parallel under the aim of competition. But, there remains
significant competition and private participation, ranging from hardware (e.g., cars) to maintenance
(e.g., outsourcing or tendering for toll-booth operations or even building the roads) to services riding on
the infrastructure (e.g., courier and delivery companies). But roads can cost 2 orders of magnitude
higher per km than FA.
18 Community provision of utility services is common in much of the developed world, especially for rural power service in the US; over
25% of power utilities in the US are cooperatives, as per US Dept. of Energy data (though they supply smaller users than investor or
publicly owned utilities, and thus supply only ~10% of the power).
19 Walmart, as a dominant retailer, lowers prices on products significantly, and the competition must lower prices to match, or go out of
business [25].
Presented at 34th TPRC, 2006
3.1.2 FiberAfrica Technology
FA design has 3 components: core backbone, using Dense Wavelength Division Multiplexing (DWDM)
optical networking, core wireless from the backbone (“hubs”), and secondary access wireless to end-
users.
Core network: A GIS-based analysis showed that 70,000 km of fibers can link all 400+ cities over
250,000 in size, and 30,000 km spur fiber bundles to help extend the network into deeper regions as
well as connect to wireless hubs. Even if these cities are not all “lit” in the first phase of the network, it
becomes much easier to connect them over time as demand warrants. This design offers almost
limitless capacity, scalability and “future-proofness.”
Access solutions: A backbone network is of limited value without users accessing the network, and this
is where new wireless technologies are expected to play a major role, such as the emerging WiMax
(IEEE 802.16) standard. Not only is the core network routed along population centers, but the locations
for optical amplifiers along the core are ideal points for core wireless hubs (every 60-70 km). Regional
optical fiber spurs would extend the wireless footprint and satellite-based connectivity would be useful
for remote locations where extending optical fiber connectivity is not cost effective.
There are alternative designs based on WiFi and modified WiFi (including meshing) and such solutions
remain complementary. Our experience in building out real-world solutions shows that the radio
chipset costs are only a small fraction of the total installed costs in a mult-point scenario, where a large
tower can cost ~$10,000, and electricity, security, uplinking, etc. are major barriers. For a single point-
to-point pairing, instead of blanket deployment, WiFi remains a competitive solution. Calculations show
the proposed hybrid optical-wireless solution is optimal for greenfield developing region deployments.
End users: End-users would access the network through entrepreneurial or community-based
telecenters (kiosks), important given very low PC penetrations. Such providers would receive free
uplinking, in return for which they would have to offer free or nearly free basic connectivity for basic
(limited) usage.
3.1.3 Business Model
Using today’s numbers for costs of components and installation, which will decrease over time, we
found the total costs to be a little under $1 billion one-time capital costs. This includes laying optical
fibers, opto-electronics, routers, core wireless hubs and towers, and primary wireless (WiMax)
receivers.20 This represents a little over $1/capita only!
How are costs so low? The primary realization is that optical fibers in developing countries (for intercity
routes especially) are not nearly as inexpensive as conventional wisdom due to cheap labor. In India,
20 This excludes end-user radio modems, designed to be WiFi, handlehelds, or computers. These are non-zero costs per user, but scale
nicely with growing deployment.
Presented at 34th TPRC, 2006
the upcoming Andhra Pradesh state network, which will bring Fiber to every village, was realized for
only a few thousand dollars per km cost for the fiber including installation.21
Annualized, this figure comes to under $100 million/year. Operating costs, including uplinking (via
submarine cables), maintenance, R&D at multiple percent of revenues, power,22 insurance, rentals, etc.
comes to a similar amount. While $200m may appear large, it is a small fraction of the billions spent on
telecoms in Africa every year, most on mobiles.
How are costs to be recovered? The model envisages several thousand core wireless hubs, distributed
across Africa, each of which can be linked to multiple primary receivers (one per town or village
cluster). These would then provide last hop wireless links to user sites (such as the telecenters,
schools, etc.). Using such a hierarchy, we estimate that 10% of the population could ultimately access
the network. Based on effective usage costs of only a few dollars per user (not per capita) per year, the
network is sustainable. The costs towards connectivity are only a small fraction of the overall target
expenditure on ICT; given a crude average per capita GDP of $200 (conservative), 6% of this (close to
the global average ICT expenditure) is $12/year. Government support or cross-subsidy mechanisms
could ensure public users such as schools, hospitals, etc. could avail free megabit speed connectivity.
In addition, by designing the network to offer last hop services using standard WiFi, non-PC classes of
devices could access the network at low cost, including PDAs and upcoming Voice-over-Wireless LAN
(VOWLAN) phones, if allowed.23
The estimated <1.5$/capita capital costs may appear low, but it is actually expensive at some levels,
not merely based on normalization by average GDP. For starters, only 10% of the population are users
(per the business model), so capital costs are closer to $15/user, and this figure excludes CPE costs
(low on a per-user basis, however). Advanced (multi-megabit) DSL is being deployed in placed like
China for $50/household, including CPE, DSL Access Multiplexer, (DSLAM), port, etc. This comes to
$15/user (assuming three users per home), for much higher speeds, in the home.
3.2 Challenges
There are a number of issues and concerns beyond financing. One of the main sources of potential
failure would be fewer people connecting than planned, but even then the cost-benefit calculus should
remain positive. The optical fiber infrastructure, a large fraction of the capital costs, will be usable well
into the future (especially with ducted construction). In comparison, other grand schemes like Teledesic
21 In addition to governmental usage commitments (highlighted in [20] as important to create viable demand), competitive bidding, and
creation of e-Governance content, the scale and ubiquity of services are a key factor for the low costs, in essence, a design similar to
FiberAfrica.
22 This includes backup power at all optic fiber and wireless hubs.
23 Voice communications are not considered part of the cost-benefit analysis, though the potential is immense, because of regulatory
conflicts and resistance from traditional (mobile and land-line) providers.
Presented at 34th TPRC, 2006
were more capital intensive, had shorter timeframes for amortization, and had lower richness in terms
of value-addition.
The main challenge is one of mindset, one difficult to change for several reasons. If it were really that
simple, wouldn’t everyone be doing it? Vested interests and conventional wisdom are difficult
obstacles. Incumbents and those with enshrined or de-facto monopolies are loathe to accept
competition. In addition, there is a conventional wisdom, often projected by the West and the World
Bank, that competition is the answer (sometimes confused with privatization). Competition is certainly
helpful, especially for mobile telephony [2] but there is less evidence for broadband. Appropriate
regulatory frameworks for such public-private partnerships as proposed are few and far-between, and
there is the visible success of private competition for mobile telephony purporting to fill the void (or at
least draw investments).
Other issues include:
Cooperation: This vision requires cooperation between all the countries in Africa, potentially through the
New Partnership for Africa’s Development (NEPAD). While there are some regional cooperative
networks, such as COMESA and WAEMU, etc., FA, being Pan-African, reduces local and regional
rivalry issues.
Security: Physical and data security are paramount in this network, with extensive redundancy and
robustness in the design to counter issues such as inter- and intra-nation conflict. To ameliorate
vandalism and theft concerns through greater participation of local communities in the network, local
participation is important. For example, at every site that requires equipment housing (every 60 to 80
kilometers, say), a local entrepreneur would be given concessional connectivity for Value Added
Services. He or she would help secure and physically maintain some of the equipment. By providing
local connectivity, it is possible not only to spread access around the routing of the backbone, but also
reduce local opposition and mischief. Experience from India also suggests several techniques for
reducing theft of optical fiber and cables. While copper is often dug out from access networks due to its
resale value, optical fiber has very little resale value, something would-be-thieves quickly learned after
superfluous bundles were purposely left behind at construction sites.
National Policies: Countries need to commit to investments to help spread penetration, and develop the
applications for harnessing the power of the network, such as e-governance initiatives. Member
countries must also enact enabling legislation/regulations that allow FA to be built, e.g., allowing
appropriate spectrum availability and disruptive technologies such as Voice over IP. At the same time,
FA must work within the bounds of sovereign decision-making. Countries must also allow appropriate
cost reductions such as duty import waivers or free rights of way – without these the costs to the
consumers will increase. The network should be built such that access is non-discriminatory and largely
Presented at 34th TPRC, 2006
free. Otherwise, there remain concerns that incumbents and alternative players would object. Here,
experience from rural development initiatives in other countries have shown that urban utilities and
service providers often do not oppose networks that have a rural focus, as they consider such areas
unattractive commercially. ISPs and other providers today would also benefit from FA, especially if
regulators allow it to be used for complementary services (such as aggregated voice transport).
However, such calculations are not part of the focus of FA, nor included in the business model.
3.2.1 Experimentation and Next Steps
No single segment of the network as proposed is unique, and the technologies as designed are
available today (even though they’ll improve over time). In fact, there is significant hype over WiMax,
and how it will “level the playing field.” However, these are thought of as extensions of today’s designs,
lacking integrated design or changes to business models.24
What is required is to prove the concept, picking a country or region to demonstrate the technology and
price-performance.25 Enlightened and supportive government and regulators are a must, and additional
support could be had from development agencies, NGOs, academic institutions, etc. (In India, the
software industry is a major supporter of connectivity, and in other countries, exporters could play such
a role). Another option is to begin deployment of this network as a research and educational network,
which should minimize political and incumbent opposition.
A reasonable scale deployment (beyond a small pilot) might cost on the order of ~10 million dollars or
more, which typically means donor or grant support. However, this is still affordable, and low by
telecom investment standards. In addition, technology companies have significant incentives to provide
in-kind if not equipment donations as the long-term market depends on such experiments. While
standardization is part of the reason for the low costs, optimal designs will require iteration and testing,
and technology continues to improve.
Why should anyone build any such network in Africa, instead of such networks being built first in more
well-to-do nations? This represents a leapfrog opportunity, with less legacy needs, and less regulatory
hurdles (esp. compared to the US!) It might even be the one of the best methods for developing ICT in
the continent—a combination of innovations in technology and in regulation/business models. There
are also opportunities to test new technologies in scale, such as use of UHF bands for broadband.
In addition, the imperative for intervention in Africa is much higher given the stark differences in human
development versus the rest of the world. Critics might believe that Africa’s limited development is due
24 In discussions with a senior African government official, he mentioned they were going to auction 3.5 GHz spectrum for WiMax soon,
and based on earnings for cellular, hoped to earn on the order of $100m! When I pointed out that even with one million broadband
subscribers (difficult but possible in the large country), that implies a $100/user “capital cost,” he had no comment.
25 There is actually a fair amount of optical fiber already drawn in Africa, but un- or under-utilized, often in the hands of the power
company. Synergies are possible, but there is extreme regulatory confusion over access to and use of such fibers.
Presented at 34th TPRC, 2006
to poor governance and corruption. The truth is that Africa, only recently emerging from colonialization,
has been burdened with several debilitating challenges. The rains are seasonal and erratic, and the
overwhelming majority of agriculture is rain-based, instead of based on irrigation. The soil is also highly
depleted, reducing productivity dramatically. On top of this, Africa also bears the burden of a triad of
endemic diseases – HIV/AIDS, malaria, and tuberculosis. While ICT will not directly help with these, it
can play a powerful supportive role in improving the efficiency and transparency of all development
efforts.
4. CONCLUSION
New technologies continue to evolve, and this will help push deployment of Internet access across the
world. Not only will costs fall, but capabilities will continue to expand, especially in wireless
technologies where innovations in smart antennae (multi-input multi-output technology), mesh
networking, software defined radios, and cognitive radios can change the landscape within the next five
years. Even then, the generalized techno-economic model shows that equipment costs are only a
fraction of the total costs, and new designs must be considered that integrate innovations in policy and
business models. Without this, even with an impressive 15% annual growth of the Internet in Sub-
Saharan Africa,26 given increasing population, it would take roughly 25 years for basic Internet
penetration to cross 20%. Higher growth rates have been seen in mobile telephony, but broadband has
a much lower base than the roughly 1% of population online using mostly dial-up as of 2002 [1]. New
designs and business models must be explored, and the open access model with new technical and
business models (FiberAfrica) is one worthwhile experiment. Otherwise, the digital divide will not only
persist, but divides between and within developing countries will grow. Enlightened or determined
pockets of growth will emerge (e.g., China, Estonia, Chile, parts of India, etc.) but in a globalized
economy, communities that deploy advanced ICT will see increasing economic growth, further widening
the digital divide.
5. ACKNOWLEDGMENTS
This work was based on seminal ideas by Dr. Raj Reddy (CMU), and benefited from discussions with
Dr. V. S. Arunachalam (CMU/CSTEP) and Dr. G. Gongireddy (WorldBank). Many others have given
useful feedback on the FiberAfrica Model, including colleagues associated with the UN ICT Task Force
and UN Millennium Project, notably Dr. Jeffrey Sachs, Ambassador Astrid Dufborg, Anders Comstedt,
and Samuel Danofsky. Section 1 draws from previous work [4], supported by the US National Science
Foundation, UN, and World Bank.
26 Excluding South Africa.
Presented at 34th TPRC, 2006
6. REFERENCES
1. Oyelaran-Oyeyinka, B. and K. Lal, Internet diffusion in sub-Saharan Africa: A cross-country analysis.
Telecommunications Policy, 2005. 29(7): p. 507-527. 2. Kenney, C., Financing Information and Communication Infrastructure Needs in the Developing World:
Public and Private Roles (Draft). 2005, World Bank: Washington, DC. 3. Carbonell, J., Language Technologies Institute Presentation. 1997, Carnegie Mellon University. 4. Tongia, R., E. Subrahmanian, and V.S. Arunachalam, Information and Communications Technology for
Sustainable Development: Defining a Global Research Agenda. 2005, Bangalore: Allied Press. 5. Economist, The Real Digital Divide, in Economist. 2005. 6. United Nations, UN Global E-Government Readiness Report 2004: Towards Access for Opportunity.
2004, United Nations: New York. 7. Weigel, G. and D. Waldburger, eds. ICT4D - Connecting People for a Better World. Lessons, Innovations
and Perspectives of Information and Communication Technologies in Development. 2004, Swiss Agency for Development and Cooperation (SDC) and Global Knowledge Partnership (GKP): Berne.
8. Noam, E. Let them eat megabits in Financial Times. November 26, 2003. London. 9. Bradner, S., NGN: Replacement or Evolution? 2005: Harvard University. 10. ITU, African Telecommunication Indicators 2004. 2004, ITU: Geneva. 11. Odlyzko, A., The Evolution of Price Discrimination in Transportation and its Implications for the
Internet. Review of Network Economics, 2004. 3(3). 12. Duncombe, R. and R. Heeks, Information, ICTs and Small Enterprise: Findings from Botswana. 1999,
Institute for Development Policy and Management, Univ. of Manchester: Manchester. 13. Tongia, R., Can broadband over powerline carrier (PLC) compete? A techno-economic analysis.
Telecommunications Policy, 2004. 28(7-8): p. 559-578. 14. Obsidian, ADSL Systems. 2005. 15. ITU, World Telecommunication Development Report 2003 - Access Indicators for the Information
Society. 2003, ITU: Geneva. 16. Horne, W.D. Adaptive Spectrum Access: Using the Full Spectrum Space. in 31st TPRC. 2003. Arlington,
Virginia. 17. TRAI, Study Paper on 'Indicators for Telecom Growth'. 2005, Telecom Regulatory Authority of India:
New Delhi. 18. Wallis, W. Egyptian mobile telephone licence sells for Dollars 3bn in Financial Times. July 5, 2006.
London. 19. Wellenius, B., Closing the Gap in Access to Rural Telecommunications: Chile 1997-2002. 2002, World
Bank: Washington, DC. 20. Neto, I., C. Niang, and M. Ampah, Fostering Pro-Competitive Regional Connectivity in Sub-Saharan
Africa. 2005, World Bank: Washington, DC. 21. Witt, R.S., A Horizontal Leap Forward: Formulating A New Public Policy Framework Based On The
Network Layers Model. 2004, MCI White Paper. 22. Comstedt, A., E. Osiakwan, and R. Southwood, Options for Improving Backbone Access in Developing
Countries (with a Focus on Sub-Saharan Africa) (Final Draft). 2005, InfoDev: Washington, DC. 23. Frigo, N. Niche player or future broadband access network of choice?: What's in the cards for Fiber-to-
the-Home? in OFC 2004. 2004. Los Angeles. 24. Utopia MetroNet. 2005. 25. Goldman, A. and N. Cleeland. The Walmart Effect in Los Angeles Times. November 23, 2003. Los
Angeles.