Embed Size (px)
Citation preview
1
Five-year Prosperity StrategyMarch 2015
Prosperity Initiative
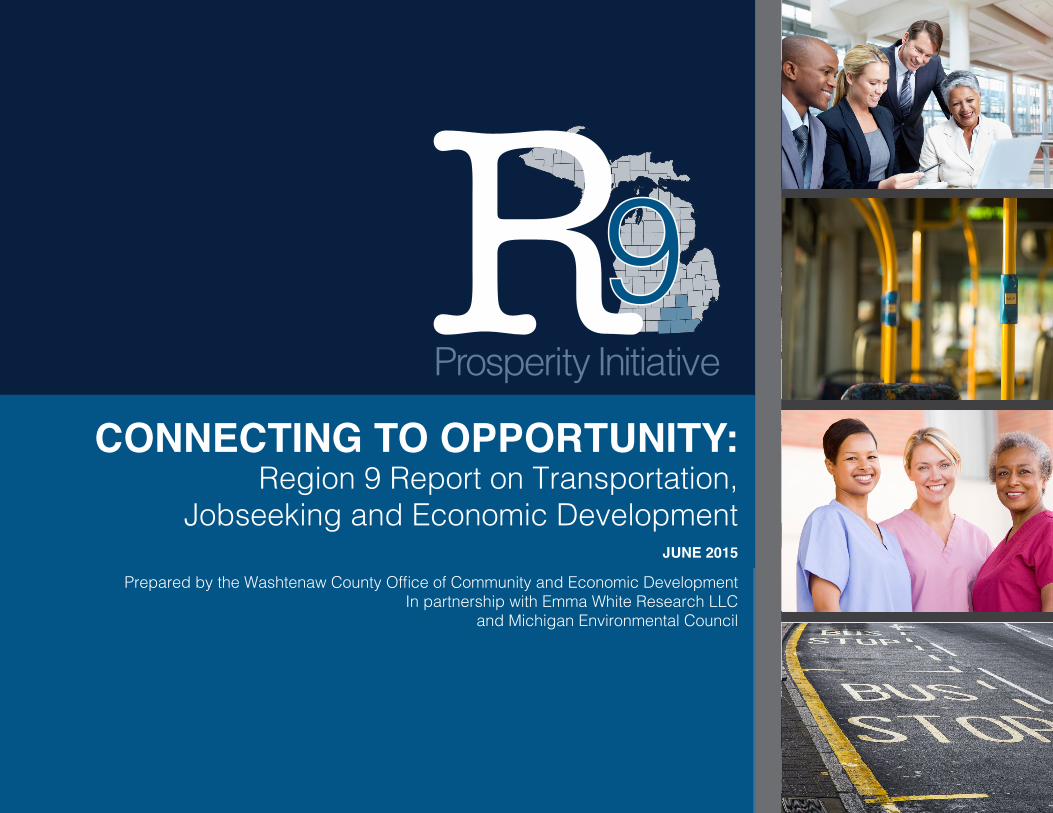
CONNECTING TO OPPORTUNITY:Region 9 Report on Transportation,
Jobseeking and Economic DevelopmentJUNE 2015
Prepared by the Washtenaw County Office of Community and Economic Development In partnership with Emma White Research LLC
and Michigan Environmental Council
2
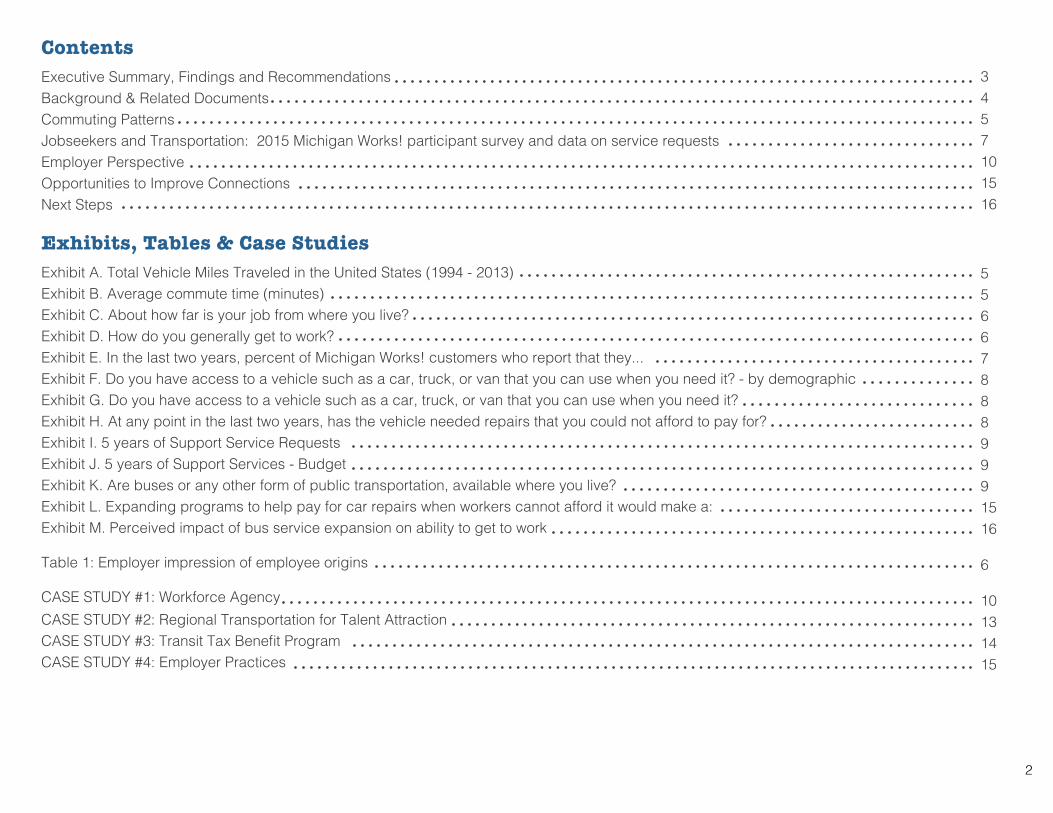
ContentsExecutive Summary, Findings and RecommendationsBackground & Related DocumentsCommuting PatternsJobseekers and Transportation: 2015 Michigan Works! participant survey and data on service requestsEmployer Perspective Opportunities to Improve ConnectionsNext Steps
Exhibits, Tables & Case StudiesExhibit A. Total Vehicle Miles Traveled in the United States (1994 - 2013)Exhibit B. Average commute time (minutes)Exhibit C. About how far is your job from where you live?Exhibit D. How do you generally get to work?Exhibit E. In the last two years, percent of Michigan Works! customers who report that they...Exhibit F. Do you have access to a vehicle such as a car, truck, or van that you can use when you need it? - by demographicExhibit G. Do you have access to a vehicle such as a car, truck, or van that you can use when you need it? Exhibit H. At any point in the last two years, has the vehicle needed repairs that you could not afford to pay for? Exhibit I. 5 years of Support Service RequestsExhibit J. 5 years of Support Services - BudgetExhibit K. Are buses or any other form of public transportation, available where you live? Exhibit L. Expanding programs to help pay for car repairs when workers cannot afford it would make a:Exhibit M. Perceived impact of bus service expansion on ability to get to work
Table 1: Employer impression of employee origins
CASE STUDY #1: Workforce AgencyCASE STUDY #2: Regional Transportation for Talent AttractionCASE STUDY #3: Transit Tax Benefit ProgramCASE STUDY #4: Employer Practices
3457101516
556678889991516
6
10131415
3
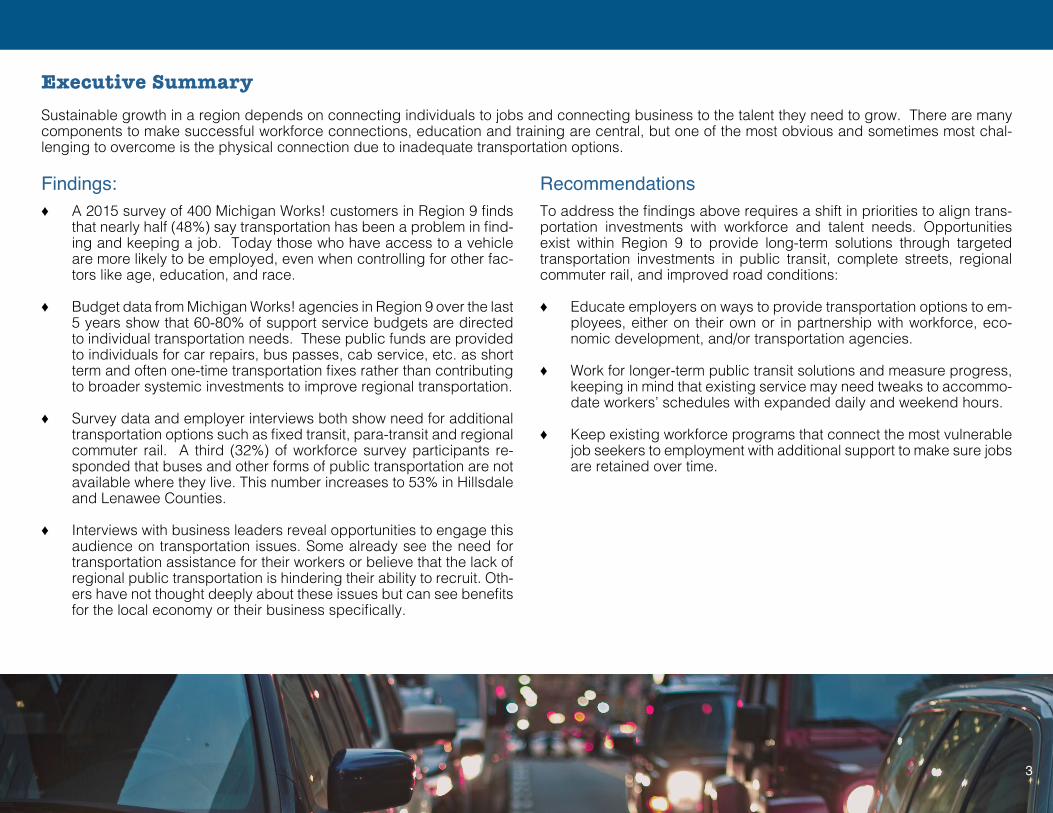
Executive SummarySustainable growth in a region depends on connecting individuals to jobs and connecting business to the talent they need to grow. There are many components to make successful workforce connections, education and training are central, but one of the most obvious and sometimes most chal-lenging to overcome is the physical connection due to inadequate transportation options.
Findings: ♦ A 2015 survey of 400 Michigan Works! customers in Region 9 finds
that nearly half (48%) say transportation has been a problem in find-ing and keeping a job. Today those who have access to a vehicle are more likely to be employed, even when controlling for other fac-tors like age, education, and race.
♦ Budget data from Michigan Works! agencies in Region 9 over the last 5 years show that 60-80% of support service budgets are directed to individual transportation needs. These public funds are provided to individuals for car repairs, bus passes, cab service, etc. as short term and often one-time transportation fixes rather than contributing to broader systemic investments to improve regional transportation.
♦ Survey data and employer interviews both show need for additional transportation options such as fixed transit, para-transit and regional commuter rail. A third (32%) of workforce survey participants re-sponded that buses and other forms of public transportation are not available where they live. This number increases to 53% in Hillsdale and Lenawee Counties.
♦ Interviews with business leaders reveal opportunities to engage this audience on transportation issues. Some already see the need for transportation assistance for their workers or believe that the lack of regional public transportation is hindering their ability to recruit. Oth-ers have not thought deeply about these issues but can see benefits for the local economy or their business specifically.
RecommendationsTo address the findings above requires a shift in priorities to align trans-portation investments with workforce and talent needs. Opportunities exist within Region 9 to provide long-term solutions through targeted transportation investments in public transit, complete streets, regional commuter rail, and improved road conditions:
♦ Educate employers on ways to provide transportation options to em-ployees, either on their own or in partnership with workforce, eco-nomic development, and/or transportation agencies.
♦ Work for longer-term public transit solutions and measure progress, keeping in mind that existing service may need tweaks to accommo-date workers’ schedules with expanded daily and weekend hours.
♦ Keep existing workforce programs that connect the most vulnerable job seekers to employment with additional support to make sure jobs are retained over time.
3
4
BackgroundIn March of 2015, the Region 2 Planning Commission contracted for a report investigating the role of transportation in successful job seeking as well as business location and growth on behalf of the Region 9 Transportation Functional Committee. Three agencies were engaged in the study, Emma White Research, LLC., Michigan Environmental Council, and the Washtenaw County Office of Community and Economic Development, to complete the following scope:
1. Perform a literature review focused on recent transportation and business trends, including examples of best practices for connecting residents to jobs and employers to talent.
2. Conduct twenty interviews with key business leaders in the key sectors of IT, healthcare, and manufacturing as targeted by Region 9. The interviews focused on the role transportation plays in job seek-ing, talent attraction, and related successes and challenges.
3. Administer 400 interviews with current and previous Michi-gan Works! jobseeker clients in Region 9 to statistically deter-mine the role transportation or lack thereof has on finding and keeping employment.
4. Develop dashboard to provide means to benchmark the region and allow for future measurement of regional decisions around transportation investments and policy as it relates to job access, employment, and business growth.
What follows is that review, study and synthesis as well as preliminary recommendations for next steps to improve opportunity through improved trans-portation connections. Note, this report synthesizes three separate reports as well as additional data. The original reports are available for review from the Region 9 Transportation Committee.
♦ Working to Learn Literature Review: Understanding Trans-portation and Workforce Trends
Liz Treutel, Michigan Environmental Council (5/27/15)
♦ Transportation and Talent in Michigan’s Prosperity Region 9: Findings of qualitative interviews with employers in manufactur-ing, health care, and information technology
May 2015 – Emma White Research, LLC
♦ Transportation and Talent in Michigan’s Prosperity Region 9: Findings of a survey on transportation access, barriers, and prior-ities
May 2015 – Emma White Research, LLC
1
The REGIONAL PROSPERITY INITIATIVE (RPI) was established by Gov. Rick Snyder and the state legislature in 2014 to encourage local partners to create vibrant regional economies. The RPI is a voluntary program, developed to recognize the fact that many Michigan regions and their myriad of planning and service delivery entities have overlapping responsibilities and lack a shared vision for economic prosperity. The program is intended to help regional partners come together to identify a common vision and identify ways to reduce redundancies and gaps in service delivery within their regions. A consortium of public, private, and nonprofit organizations in the six-county Prosperity Region 9 (Hillsdale, Jackson, Lenawee, Livingston, Monroe, and Washtenaw Counties) were awarded RPI grant funds to further build relationships and work together to enhance economic prosperity in the region.
There are challenges with drawing regional boundaries that naturally match labor sheds, economic activity, or physical and cultural characteristics of regional communities. In addition to its six counties, Region 9 is part of a larger southeast Michigan (and northern Ohio) economic region. While the labor and economic sheds of this region are bigger than the Region 9 boundaries and may
be imperfect in some ways, there are distinct talent, economic development, infrastructure, and cultural issues and opportunities within Region 9 that merit a cooperative approach to aligning and prioritizing resources and service delivery. In fact, there have been some significant collaborative efforts among organizations within the region in the years leading up to the RPI, including economic development organizations in the six counties collaboratively marketing the area as the Greater Ann Arbor Region for the purposes of business and talent attraction.
The Region 9 Prosperity Initiative manufacturers group is allowing for unprecedented collaboration between manufacturers and regional prosperity service partners. Common challenges that apply to manufacturers and partners throughout Region 9 are being explored and agreed upon. The group recognizes that filling future talent needs will require employers, service partners, educators, and community members to join forces. We are hopeful that the RPI platform will get all stakeholders working toward the same goals, with concrete results. Ideally, we can ensure the growth of our employers, our communities, our residents, and our state by collaborating in this fashion.
—Tim Kelly, Senior Manager of Human Resources, Chelsea Milling Company
The RPI effort has provided a tremendous opportunity to build on these existing efforts, and it has already been successful in strengthening relationships and catalyzing improved communication, collaboration, and discussions regarding the alignment of services and resources to best meet regional needs.
The Planning ProcessOver 70 different stakeholder organizations have been involved in the Region 9 Prosperity Initiative since it began. The implementation and coordination of the prosperity planning process has been overseen by a project management team made up of representatives from regional organizations representing education, economic development, transportation, and workforce development. The focus of Year 1 of the RPI collaborative has been on building relationships among leaders and practitioners in the region and identifying priority issues within two key areas that affect economic prosperity in the region: talent and transportation. This approach was used because these were areas identified as priorities by Gov. Snyder, and there was already some regional collaboration underway in these areas. It made sense to start with these areas, where there was momentum, and grow further regional collaboration from there.
To date, this effort has been achieved through the establishment and work of four functional teams made up of practitioners and leaders representing all six counties in the region. The teams are:
Talent Council (which includes information technology, health
SOURCE: Michigan Department of Management and Budget
5
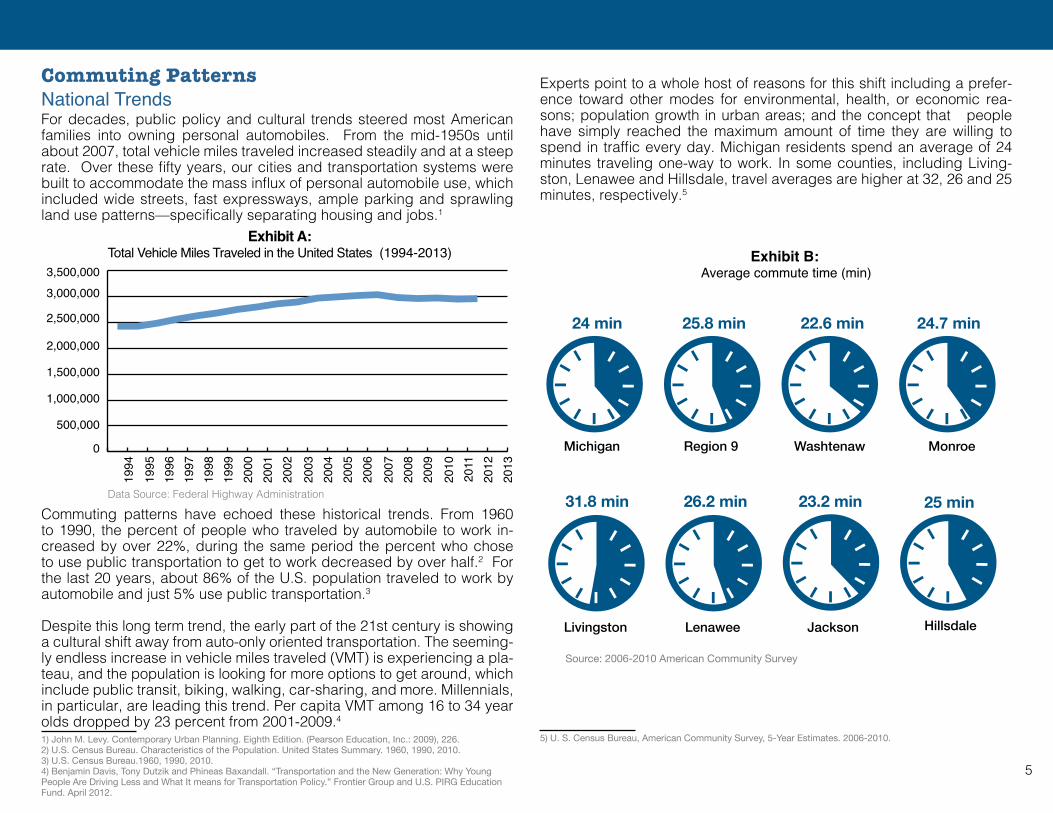
Experts point to a whole host of reasons for this shift including a prefer-ence toward other modes for environmental, health, or economic rea-sons; population growth in urban areas; and the concept that people have simply reached the maximum amount of time they are willing to spend in traffic every day. Michigan residents spend an average of 24 minutes traveling one-way to work. In some counties, including Living-ston, Lenawee and Hillsdale, travel averages are higher at 32, 26 and 25 minutes, respectively.5
5) U. S. Census Bureau, American Community Survey, 5-Year Estimates. 2006-2010.
Commuting PatternsNational TrendsFor decades, public policy and cultural trends steered most American families into owning personal automobiles. From the mid-1950s until about 2007, total vehicle miles traveled increased steadily and at a steep rate. Over these fifty years, our cities and transportation systems were built to accommodate the mass influx of personal automobile use, which included wide streets, fast expressways, ample parking and sprawling land use patterns—specifically separating housing and jobs.1
Commuting patterns have echoed these historical trends. From 1960 to 1990, the percent of people who traveled by automobile to work in-creased by over 22%, during the same period the percent who chose to use public transportation to get to work decreased by over half.2 For the last 20 years, about 86% of the U.S. population traveled to work by automobile and just 5% use public transportation.3
Despite this long term trend, the early part of the 21st century is showing a cultural shift away from auto-only oriented transportation. The seeming-ly endless increase in vehicle miles traveled (VMT) is experiencing a pla-teau, and the population is looking for more options to get around, which include public transit, biking, walking, car-sharing, and more. Millennials, in particular, are leading this trend. Per capita VMT among 16 to 34 year olds dropped by 23 percent from 2001-2009.4 1) John M. Levy. Contemporary Urban Planning. Eighth Edition. (Pearson Education, Inc.: 2009), 226.2) U.S. Census Bureau. Characteristics of the Population. United States Summary. 1960, 1990, 2010.3) U.S. Census Bureau.1960, 1990, 2010.4) Benjamin Davis, Tony Dutzik and Phineas Baxandall. “Transportation and the New Generation: Why Young People Are Driving Less and What It means for Transportation Policy.” Frontier Group and U.S. PIRG Education Fund. April 2012.
Exhibit A: Total Vehicle Miles Traveled in the United States (1994-2013)
Data Source: Federal Highway Administration
3,500,0003,000,000
2,500,000
2,000,000
1,500,000
1,000,000
500,000
0
1994
1995
1996
1997
1998
1999
2000
2001
2002
2003
2004
2005
2006
2007
2008
2009
2010
2011
2012
2013
Michigan Region 9 Washtenaw Monroe
Livingston Lenawee Jackson Hillsdale
Exhibit B: Average commute time (min)
24 min 25.8 min 22.6 min 24.7 min
31.8 min 26.2 min 23.2 min
Source: 2006-2010 American Community Survey
25 min
6
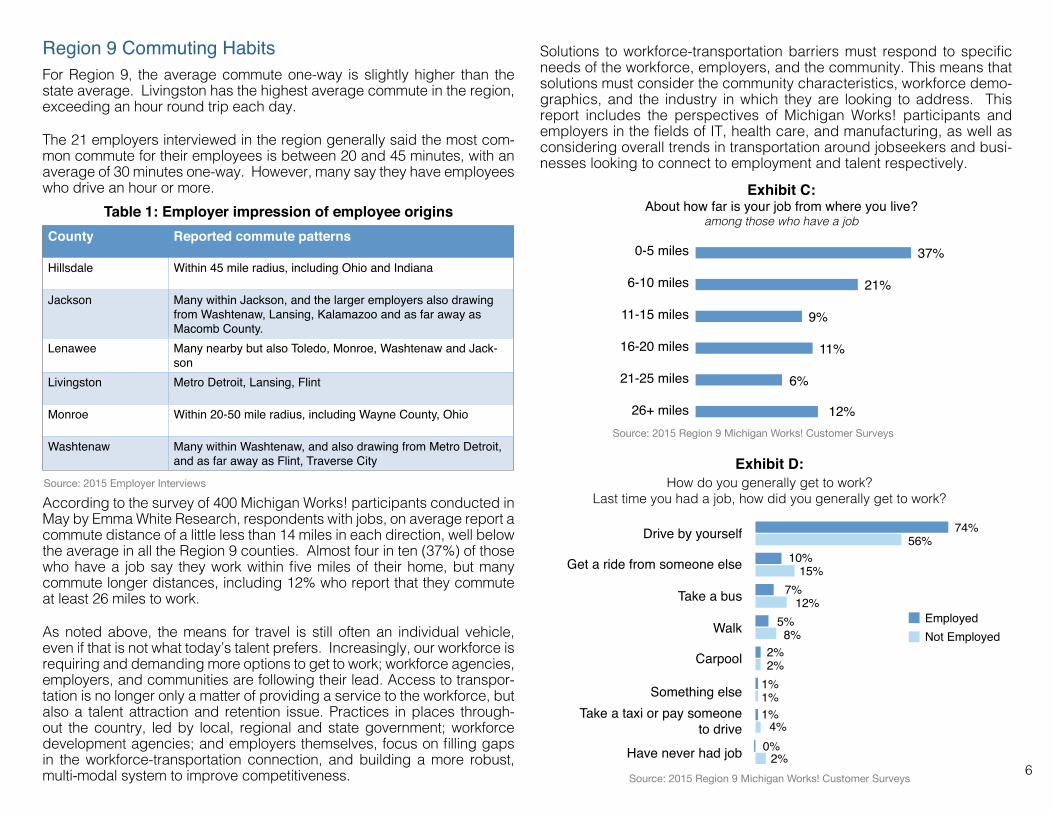
Region 9 Commuting HabitsFor Region 9, the average commute one-way is slightly higher than the state average. Livingston has the highest average commute in the region, exceeding an hour round trip each day.
The 21 employers interviewed in the region generally said the most com-mon commute for their employees is between 20 and 45 minutes, with an average of 30 minutes one-way. However, many say they have employees who drive an hour or more.
According to the survey of 400 Michigan Works! participants conducted in May by Emma White Research, respondents with jobs, on average report a commute distance of a little less than 14 miles in each direction, well below the average in all the Region 9 counties. Almost four in ten (37%) of those who have a job say they work within five miles of their home, but many commute longer distances, including 12% who report that they commute at least 26 miles to work.
As noted above, the means for travel is still often an individual vehicle, even if that is not what today’s talent prefers. Increasingly, our workforce is requiring and demanding more options to get to work; workforce agencies, employers, and communities are following their lead. Access to transpor-tation is no longer only a matter of providing a service to the workforce, but also a talent attraction and retention issue. Practices in places through-out the country, led by local, regional and state government; workforce development agencies; and employers themselves, focus on filling gaps in the workforce-transportation connection, and building a more robust, multi-modal system to improve competitiveness.
Solutions to workforce-transportation barriers must respond to specific needs of the workforce, employers, and the community. This means that solutions must consider the community characteristics, workforce demo-graphics, and the industry in which they are looking to address. This report includes the perspectives of Michigan Works! participants and employers in the fields of IT, health care, and manufacturing, as well as considering overall trends in transportation around jobseekers and busi-nesses looking to connect to employment and talent respectively.
0%4%
Drive by yourself
Get a ride from someone else
Take a bus
Walk
Carpool
Something elseTake a taxi or pay someone
to drive
Have never had job
1%
1%
2%
5%
7%
10%
74%
1%
2%
8%EmployedNot Employed
12%
15%
56%
2%
Exhibit D: How do you generally get to work?
Last time you had a job, how did you generally get to work?
Source: 2015 Region 9 Michigan Works! Customer Surveys
County Reported commute patterns
Hillsdale Within 45 mile radius, including Ohio and Indiana
Jackson Many within Jackson, and the larger employers also drawing from Washtenaw, Lansing, Kalamazoo and as far away as Macomb County.
Lenawee Many nearby but also Toledo, Monroe, Washtenaw and Jack-son
Livingston Metro Detroit, Lansing, Flint
Monroe Within 20-50 mile radius, including Wayne County, Ohio
Washtenaw Many within Washtenaw, and also drawing from Metro Detroit, and as far away as Flint, Traverse City
Source: 2015 Employer Interviews
Table 1: Employer impression of employee origins
0-5 miles
6-10 miles
11-15 miles
16-20 miles
21-25 miles
26+ miles
37%
21%
9%
11%
6%
12%
Exhibit C: About how far is your job from where you live?
among those who have a job
Source: 2015 Region 9 Michigan Works! Customer Surveys
7
Trends in Best Practices
A clear trend in responding to workforce-transportation needs is collaboration. When key stakeholders—workforce agencies, employers, transporta-tion providers, and planners—work together to understand problems, pool resources, and combine capacities, solutions are more easily accessible and more broadly impactful. In many of the “best practices,” highlighted throughout this report, employers take the lead to provide services which range from transit pass subsidies to providing high-end shuttle services for employees. However, many of the examples listed can be transferred for use by workforce development agencies, transportation providers, other government entities, or a combination of stakeholders. In fact, when these institutions take the lead to initiate a solution, the result is often a systematic approach that provides benefits for many more residents and employers.
Lost a job because transportation problems kept
them from getting to work
Did not apply for a job they were qualified for because
they could not arrange reliable transportation to the workplace
Missed work because of transportation problems
21%
33%
39%
35%
57%
48%
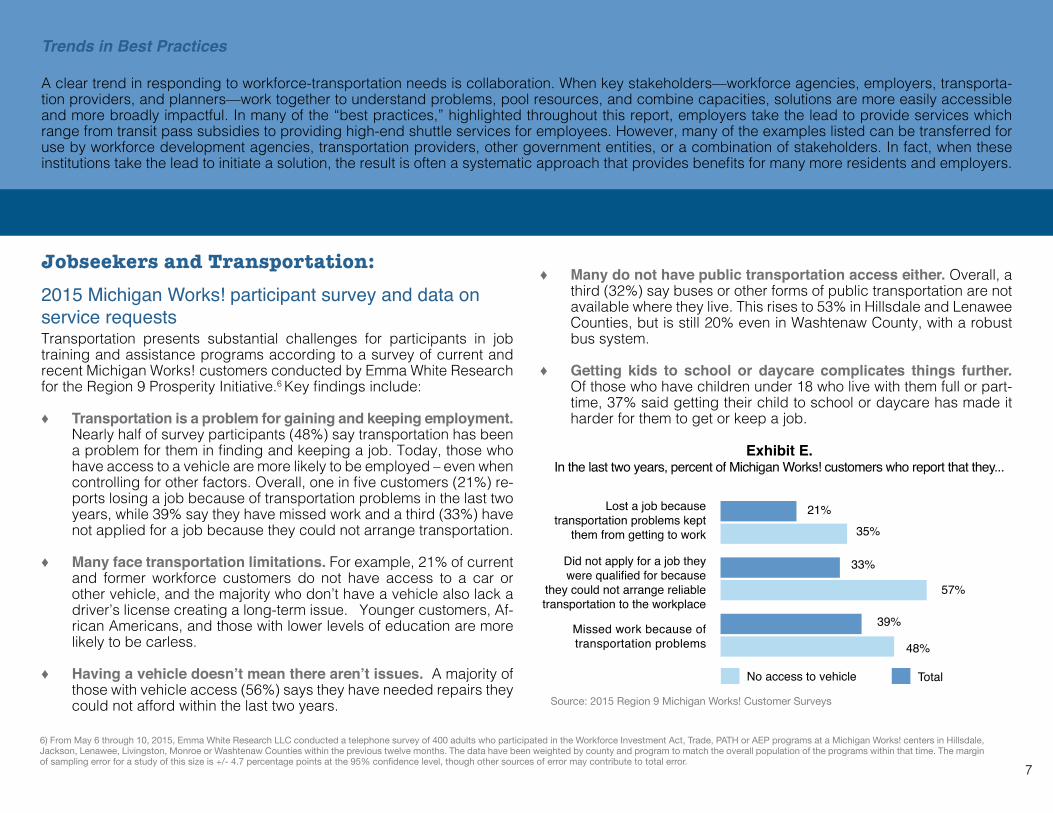
Exhibit E. In the last two years, percent of Michigan Works! customers who report that they...
Source: 2015 Region 9 Michigan Works! Customer Surveys
TotalNo access to vehicle
♦ Many do not have public transportation access either. Overall, a third (32%) say buses or other forms of public transportation are not available where they live. This rises to 53% in Hillsdale and Lenawee Counties, but is still 20% even in Washtenaw County, with a robust bus system.
♦ Getting kids to school or daycare complicates things further. Of those who have children under 18 who live with them full or part-time, 37% said getting their child to school or daycare has made it harder for them to get or keep a job.
Jobseekers and Transportation: 2015 Michigan Works! participant survey and data on service requestsTransportation presents substantial challenges for participants in job training and assistance programs according to a survey of current and recent Michigan Works! customers conducted by Emma White Research for the Region 9 Prosperity Initiative.6 Key findings include:
♦ Transportation is a problem for gaining and keeping employment. Nearly half of survey participants (48%) say transportation has been a problem for them in finding and keeping a job. Today, those who have access to a vehicle are more likely to be employed – even when controlling for other factors. Overall, one in five customers (21%) re-ports losing a job because of transportation problems in the last two years, while 39% say they have missed work and a third (33%) have not applied for a job because they could not arrange transportation.
♦ Many face transportation limitations. For example, 21% of current and former workforce customers do not have access to a car or other vehicle, and the majority who don’t have a vehicle also lack a driver’s license creating a long-term issue. Younger customers, Af-rican Americans, and those with lower levels of education are more likely to be carless.
♦ Having a vehicle doesn’t mean there aren’t issues. A majority of those with vehicle access (56%) says they have needed repairs they could not afford within the last two years.
6) From May 6 through 10, 2015, Emma White Research LLC conducted a telephone survey of 400 adults who participated in the Workforce Investment Act, Trade, PATH or AEP programs at a Michigan Works! centers in Hillsdale, Jackson, Lenawee, Livingston, Monroe or Washtenaw Counties within the previous twelve months. The data have been weighted by county and program to match the overall population of the programs within that time. The margin of sampling error for a study of this size is +/- 4.7 percentage points at the 95% confidence level, though other sources of error may contribute to total error.
8
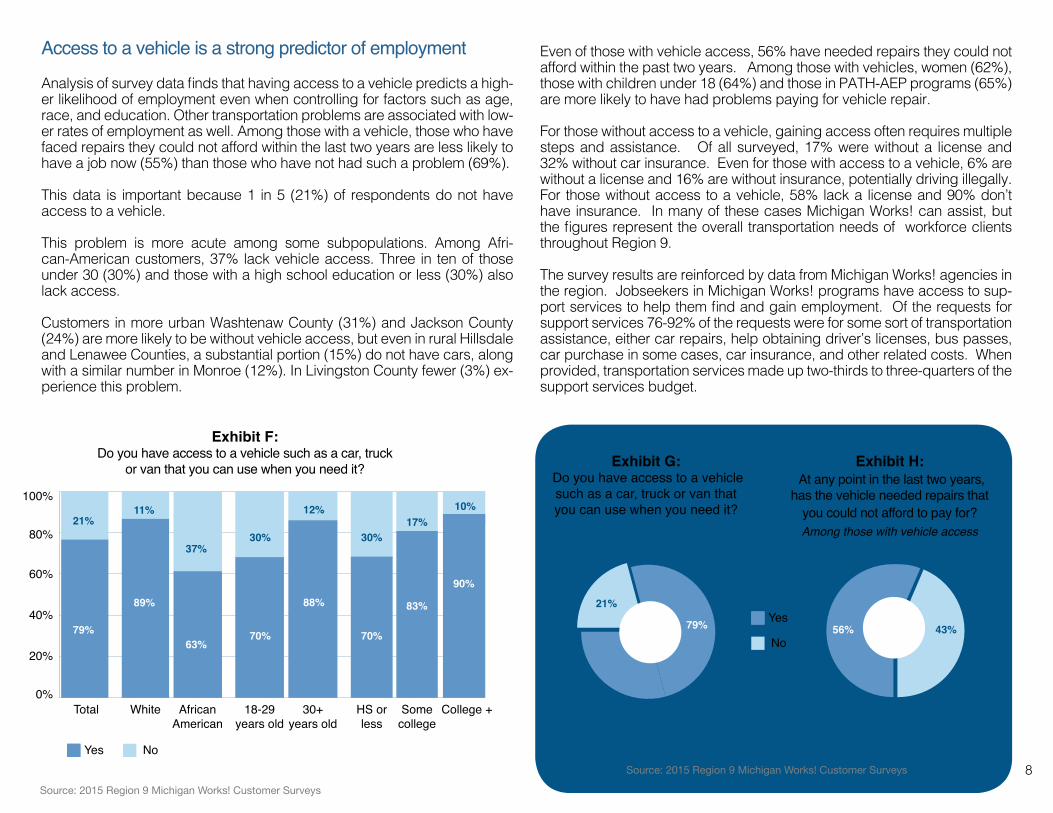
Access to a vehicle is a strong predictor of employment
Analysis of survey data finds that having access to a vehicle predicts a high-er likelihood of employment even when controlling for factors such as age, race, and education. Other transportation problems are associated with low-er rates of employment as well. Among those with a vehicle, those who have faced repairs they could not afford within the last two years are less likely to have a job now (55%) than those who have not had such a problem (69%).
This data is important because 1 in 5 (21%) of respondents do not have access to a vehicle.
This problem is more acute among some subpopulations. Among Afri-can-American customers, 37% lack vehicle access. Three in ten of those under 30 (30%) and those with a high school education or less (30%) also lack access.
Customers in more urban Washtenaw County (31%) and Jackson County (24%) are more likely to be without vehicle access, but even in rural Hillsdale and Lenawee Counties, a substantial portion (15%) do not have cars, along with a similar number in Monroe (12%). In Livingston County fewer (3%) ex-perience this problem.
Even of those with vehicle access, 56% have needed repairs they could not afford within the past two years. Among those with vehicles, women (62%), those with children under 18 (64%) and those in PATH-AEP programs (65%) are more likely to have had problems paying for vehicle repair.
For those without access to a vehicle, gaining access often requires multiple steps and assistance. Of all surveyed, 17% were without a license and 32% without car insurance. Even for those with access to a vehicle, 6% are without a license and 16% are without insurance, potentially driving illegally. For those without access to a vehicle, 58% lack a license and 90% don’t have insurance. In many of these cases Michigan Works! can assist, but the figures represent the overall transportation needs of workforce clients throughout Region 9.
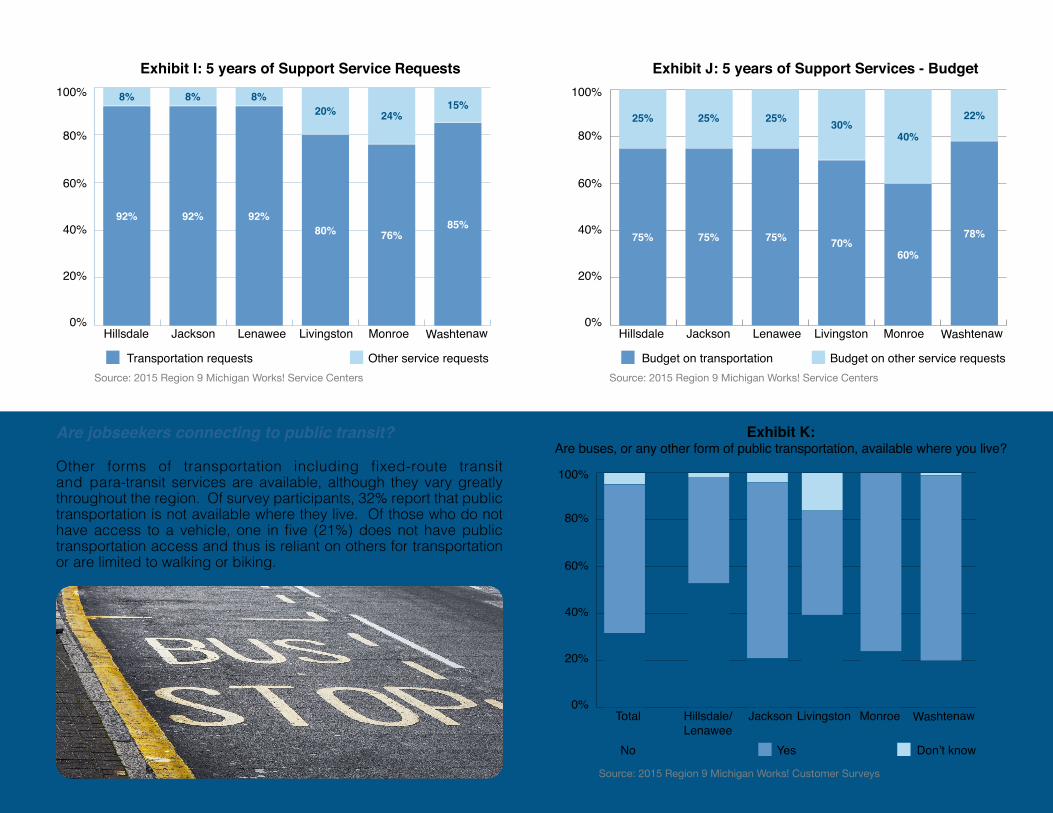
The survey results are reinforced by data from Michigan Works! agencies in the region. Jobseekers in Michigan Works! programs have access to sup-port services to help them find and gain employment. Of the requests for support services 76-92% of the requests were for some sort of transportation assistance, either car repairs, help obtaining driver’s licenses, bus passes, car purchase in some cases, car insurance, and other related costs. When provided, transportation services made up two-thirds to three-quarters of the support services budget.
Yes
No
Source: 2015 Region 9 Michigan Works! Customer Surveys
Exhibit H: At any point in the last two years,
has the vehicle needed repairs that you could not afford to pay for?Among those with vehicle access
56% 43%
Exhibit G: Do you have access to a vehicle such as a car, truck or van that you can use when you need it?
21%
79%
Exhibit F: Do you have access to a vehicle such as a car, truck
or van that you can use when you need it?
Total White 18-29 years old
HS or less
AfricanAmerican
30+ years old
Some college
College +
79%
21%
70%
30%
70%
30%
88%
12%
83%
17%
90%
10%
Yes No
Source: 2015 Region 9 Michigan Works! Customer Surveys
63%
37%
89%
11%100%
80%
60%
40%
20%
0%
9
Hillsdale LivingstonJackson MonroeLenawee Washtenaw
Exhibit I: 5 years of Support Service Requests
Source: 2015 Region 9 Michigan Works! Service Centers
100%
80%
60%
40%
20%
0%
Transportation requests Other service requests
Hillsdale LivingstonJackson MonroeLenawee Washtenaw
Exhibit J: 5 years of Support Services - Budget
Source: 2015 Region 9 Michigan Works! Service Centers
100%
80%
60%
40%
20%
0%
Budget on transportation Budget on other service requests
Total LivingstonHillsdale/Lenawee
MonroeJackson Washtenaw
Exhibit K: Are buses, or any other form of public transportation, available where you live?
Source: 2015 Region 9 Michigan Works! Customer Surveys
100%
80%
60%
40%
20%
0%
No Yes Don’t know
Are jobseekers connecting to public transit?
Other forms of transportation including fixed-route transit and para-transit services are available, although they vary greatly throughout the region. Of survey participants, 32% report that public transportation is not available where they live. Of those who do not have access to a vehicle, one in five (21%) does not have public transportation access and thus is reliant on others for transportation or are limited to walking or biking.
92%
75% 75% 75%
92% 92%80%
70%76%
60%
85%78%
8%
25% 25% 25%
8% 8%20%
30%24%
40%
15%22%
10
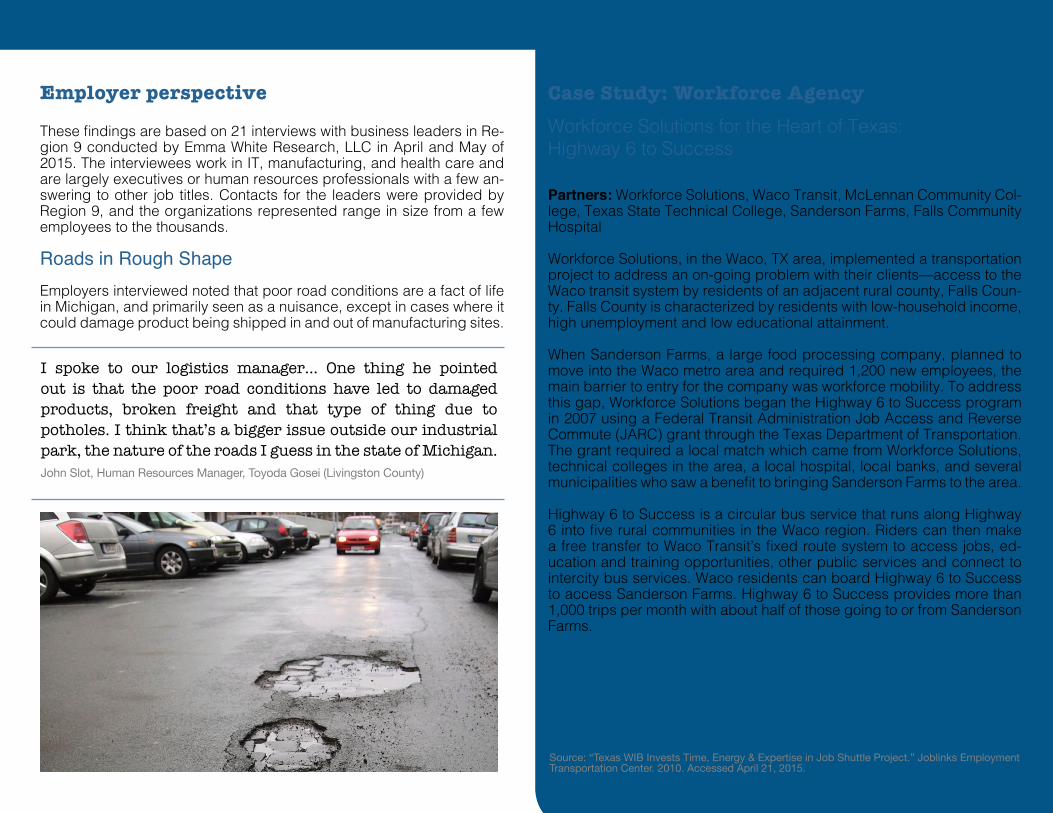
Case Study: Workforce AgencyWorkforce Solutions for the Heart of Texas: Highway 6 to Success
Partners: Workforce Solutions, Waco Transit, McLennan Community Col-lege, Texas State Technical College, Sanderson Farms, Falls Community Hospital
Workforce Solutions, in the Waco, TX area, implemented a transportation project to address an on-going problem with their clients—access to the Waco transit system by residents of an adjacent rural county, Falls Coun-ty. Falls County is characterized by residents with low-household income, high unemployment and low educational attainment.
When Sanderson Farms, a large food processing company, planned to move into the Waco metro area and required 1,200 new employees, the main barrier to entry for the company was workforce mobility. To address this gap, Workforce Solutions began the Highway 6 to Success program in 2007 using a Federal Transit Administration Job Access and Reverse Commute (JARC) grant through the Texas Department of Transportation. The grant required a local match which came from Workforce Solutions, technical colleges in the area, a local hospital, local banks, and several municipalities who saw a benefit to bringing Sanderson Farms to the area.
Highway 6 to Success is a circular bus service that runs along Highway 6 into five rural communities in the Waco region. Riders can then make a free transfer to Waco Transit’s fixed route system to access jobs, ed-ucation and training opportunities, other public services and connect to intercity bus services. Waco residents can board Highway 6 to Success to access Sanderson Farms. Highway 6 to Success provides more than 1,000 trips per month with about half of those going to or from Sanderson Farms.
Source: “Texas WIB Invests Time, Energy & Expertise in Job Shuttle Project.” Joblinks Employment Transportation Center. 2010. Accessed April 21, 2015.
Employer perspective
These findings are based on 21 interviews with business leaders in Re-gion 9 conducted by Emma White Research, LLC in April and May of 2015. The interviewees work in IT, manufacturing, and health care and are largely executives or human resources professionals with a few an-swering to other job titles. Contacts for the leaders were provided by Region 9, and the organizations represented range in size from a few employees to the thousands.
Roads in Rough ShapeEmployers interviewed noted that poor road conditions are a fact of life in Michigan, and primarily seen as a nuisance, except in cases where it could damage product being shipped in and out of manufacturing sites.
I spoke to our logistics manager… One thing he pointed out is that the poor road conditions have led to damaged products, broken freight and that type of thing due to potholes. I think that’s a bigger issue outside our industrial park, the nature of the roads I guess in the state of Michigan.John Slot, Human Resources Manager, Toyoda Gosei (Livingston County)
11
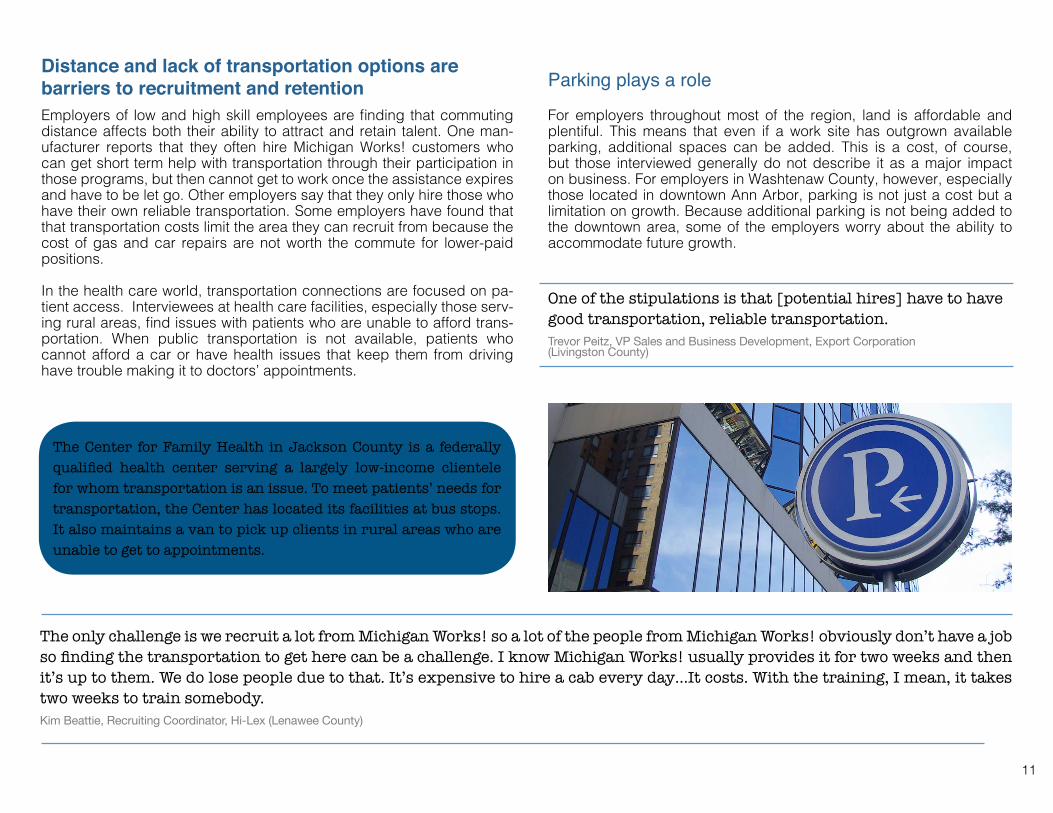
Parking plays a role
For employers throughout most of the region, land is affordable and plentiful. This means that even if a work site has outgrown available parking, additional spaces can be added. This is a cost, of course, but those interviewed generally do not describe it as a major impact on business. For employers in Washtenaw County, however, especially those located in downtown Ann Arbor, parking is not just a cost but a limitation on growth. Because additional parking is not being added to the downtown area, some of the employers worry about the ability to accommodate future growth.
Distance and lack of transportation options arebarriers to recruitment and retentionEmployers of low and high skill employees are finding that commuting distance affects both their ability to attract and retain talent. One man-ufacturer reports that they often hire Michigan Works! customers who can get short term help with transportation through their participation in those programs, but then cannot get to work once the assistance expires and have to be let go. Other employers say that they only hire those who have their own reliable transportation. Some employers have found that that transportation costs limit the area they can recruit from because the cost of gas and car repairs are not worth the commute for lower-paid positions.
In the health care world, transportation connections are focused on pa-tient access. Interviewees at health care facilities, especially those serv-ing rural areas, find issues with patients who are unable to afford trans-portation. When public transportation is not available, patients who cannot afford a car or have health issues that keep them from driving have trouble making it to doctors’ appointments.
The only challenge is we recruit a lot from Michigan Works! so a lot of the people from Michigan Works! obviously don’t have a job so finding the transportation to get here can be a challenge. I know Michigan Works! usually provides it for two weeks and then it’s up to them. We do lose people due to that. It’s expensive to hire a cab every day…It costs. With the training, I mean, it takes two weeks to train somebody. Kim Beattie, Recruiting Coordinator, Hi-Lex (Lenawee County)
The Center for Family Health in Jackson County is a federally qualified health center serving a largely low-income clientele for whom transportation is an issue. To meet patients’ needs for transportation, the Center has located its facilities at bus stops. It also maintains a van to pick up clients in rural areas who are unable to get to appointments.
One of the stipulations is that [potential hires] have to have good transportation, reliable transportation. Trevor Peitz, VP Sales and Business Development, Export Corporation (Livingston County)
12
Regional public transit would be beneficial for recruitingAnother example comes from some of the leaders interviewed from growing IT firms in Washtenaw County who say that they have a diffi-cult time recruiting, or that they hire and then lose people from Metro Detroit, even though it is close in terms of distance. Why? Because the auto commute is so unpleasant. They believe that if there were a rail connection it would make the commute easier and have positive impacts on recruiting.
Similarly, in Jackson County, an interviewee from Allegiance Health (the largest employer in the county) believes it would be easier to recruit tal-ent if there were a rail connection to Ann Arbor. And in Hillsdale County, a manufacturer says that it can be difficult to recruit for some positions because the cost of gas and car repairs make the commute expensive, and believes it would be easier to recruit from cities such as Jackson and Battle Creek if employees could commute by bus.
Finally, some say that the lack of public transportation limits recruiting from other areas of the country as well as from nearby parts of the re-gion. In particular, some of the IT employers say they recruit nationally, but that it can be difficult to attract young people to the region in part because the public transportation is poor and they believe Millennials do not want to be so car-reliant. These issues are most often brought up regarding hiring relatively high-skill employees. Yet, the data on jobseekers without a car shows a heavy reliance on public transit when available. Further, the trend analysis shows that Millenials are drawn to places that are dense, walkable, and urban where walking, biking, and transit connect them to employment, basic goods and, services, entertainment, and recreation.
Flex-time, remote workdays, flexible car sharing serviceEmployers interviewed do provide some options related to remote work-ing when appropriate, but don’t see much room to expand those op-tions in some cases due to team-culture, work duty limitations, or in the case of carpool, lack of interest on the part of employees due to limits on flexibility.
In some cases, employers did see potential in car sharing and semi-taxi services as these provide more flexibility than a traditional carpool. However, the concern over long-term costs is similar to those who have challenges of vehicle access and repair over time.
There’s a ton of talent in Metro Detroit that we just don’t have access to because it’s too far for them to consider the commute… and that’s why we’re opening a California office. We’ve sped up out there because really, the talent is easier for us to pull from given the BART, given the CalTrain, than it is here.
You know, having to split up the company and do more in other places, I wish we could grow more here…We’re just very strong supporters of regional transit. I think it would be very helpful if we had trains that went to Detroit, the airport at least, to Grand Rapids, down to Columbus…Our challenge is we just need more access to talent.
Dug Song, CEO, Duo Security (Washtenaw County)
Young people are seeking places that they can work where they don’t have to buy a car…So they will choose communities that have excellent public transportation infrastructure. Ann Arbor does pretty good. Southeast Michigan…this is a region that has let the car reign supreme. And so it’s a factor, it’s a factor in recruiting talent to this region.Richard Sheridan, CEO, Menlo Innovations (Washtenaw County)
13
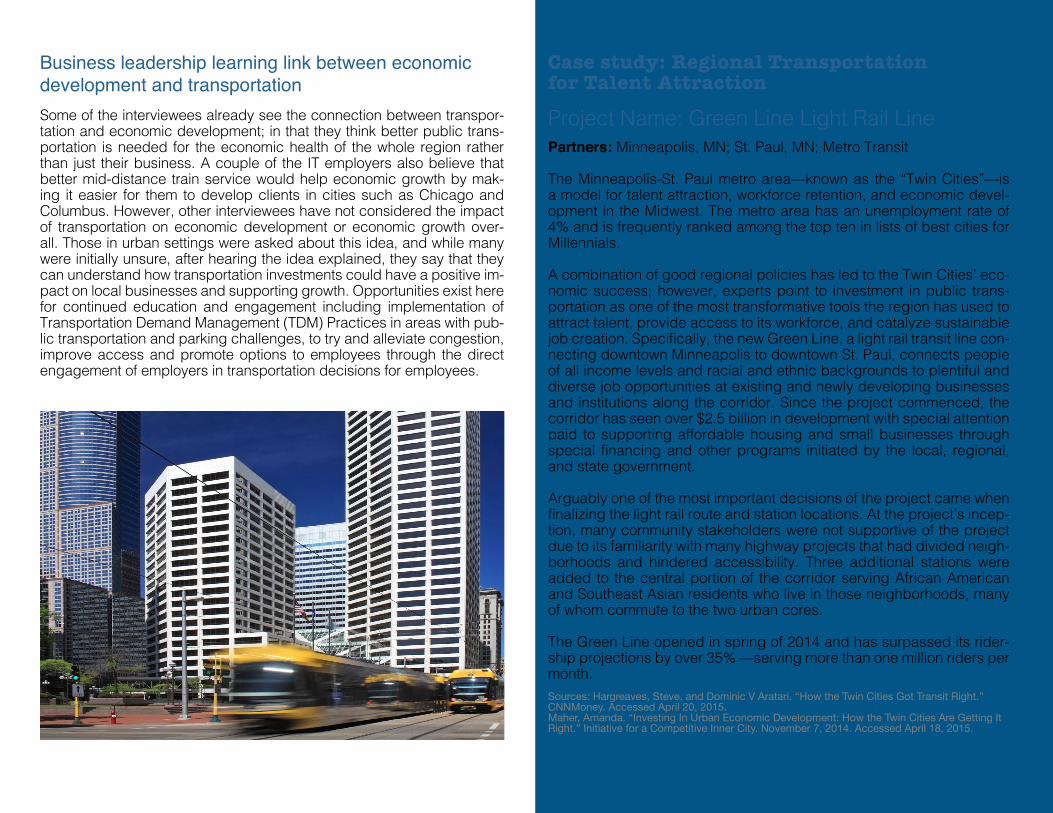
Case study: Regional Transportation for Talent Attraction
Project Name: Green Line Light Rail LinePartners: Minneapolis, MN; St. Paul, MN; Metro Transit
The Minneapolis-St. Paul metro area—known as the “Twin Cities”—is a model for talent attraction, workforce retention, and economic devel-opment in the Midwest. The metro area has an unemployment rate of 4% and is frequently ranked among the top ten in lists of best cities for Millennials.
A combination of good regional policies has led to the Twin Cities’ eco-nomic success; however, experts point to investment in public trans-portation as one of the most transformative tools the region has used to attract talent, provide access to its workforce, and catalyze sustainable job creation. Specifically, the new Green Line, a light rail transit line con-necting downtown Minneapolis to downtown St. Paul, connects people of all income levels and racial and ethnic backgrounds to plentiful and diverse job opportunities at existing and newly developing businesses and institutions along the corridor. Since the project commenced, the corridor has seen over $2.5 billion in development with special attention paid to supporting affordable housing and small businesses through special financing and other programs initiated by the local, regional, and state government.
Arguably one of the most important decisions of the project came when finalizing the light rail route and station locations. At the project’s incep-tion, many community stakeholders were not supportive of the project due to its familiarity with many highway projects that had divided neigh-borhoods and hindered accessibility. Three additional stations were added to the central portion of the corridor serving African American and Southeast Asian residents who live in those neighborhoods, many of whom commute to the two urban cores.
The Green Line opened in spring of 2014 and has surpassed its rider-ship projections by over 35% —serving more than one million riders per month.Sources: Hargreaves, Steve, and Dominic V Aratari. “How the Twin Cities Got Transit Right.” CNNMoney. Accessed April 20, 2015.Maher, Amanda. “Investing In Urban Economic Development: How the Twin Cities Are Getting It Right.” Initiative for a Competitive Inner City. November 7, 2014. Accessed April 18, 2015.
Business leadership learning link between economic development and transportationSome of the interviewees already see the connection between transpor-tation and economic development; in that they think better public trans-portation is needed for the economic health of the whole region rather than just their business. A couple of the IT employers also believe that better mid-distance train service would help economic growth by mak-ing it easier for them to develop clients in cities such as Chicago and Columbus. However, other interviewees have not considered the impact of transportation on economic development or economic growth over-all. Those in urban settings were asked about this idea, and while many were initially unsure, after hearing the idea explained, they say that they can understand how transportation investments could have a positive im-pact on local businesses and supporting growth. Opportunities exist here for continued education and engagement including implementation of Transportation Demand Management (TDM) Practices in areas with pub-lic transportation and parking challenges, to try and alleviate congestion, improve access and promote options to employees through the direct engagement of employers in transportation decisions for employees.
14
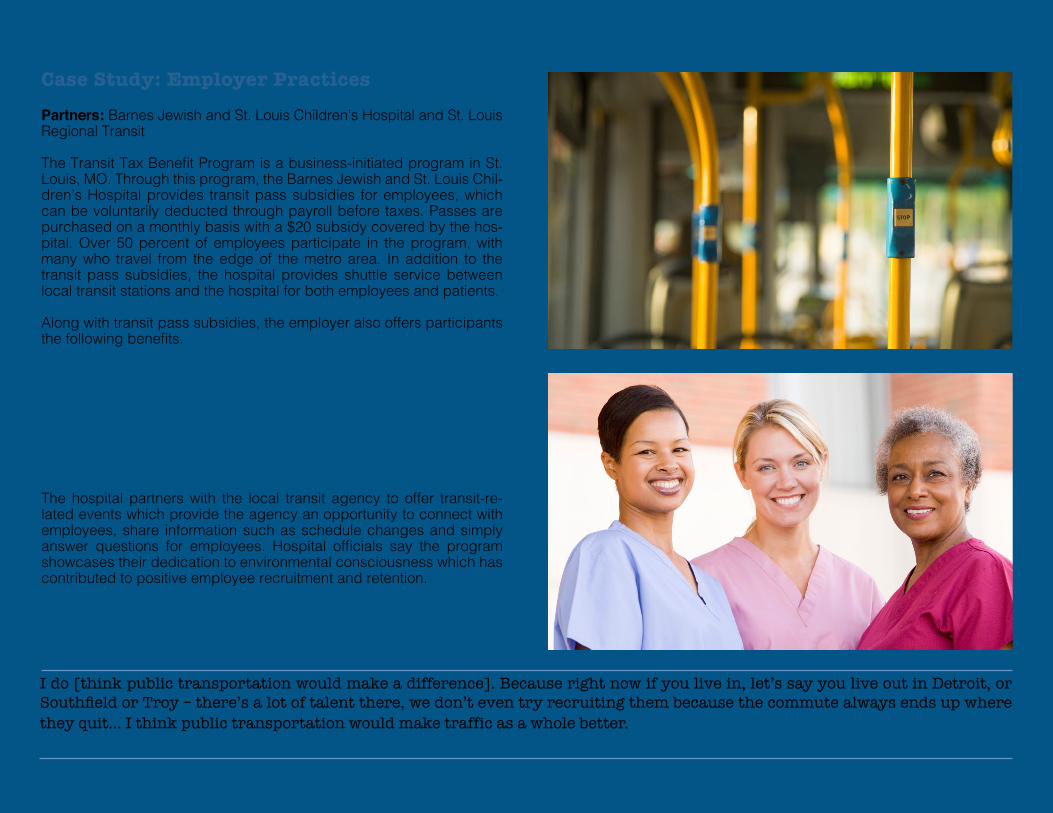
Case Study: Employer Practices
Partners: Barnes Jewish and St. Louis Children’s Hospital and St. Louis Regional Transit
The Transit Tax Benefit Program is a business-initiated program in St. Louis, MO. Through this program, the Barnes Jewish and St. Louis Chil-dren’s Hospital provides transit pass subsidies for employees, which can be voluntarily deducted through payroll before taxes. Passes are purchased on a monthly basis with a $20 subsidy covered by the hos-pital. Over 50 percent of employees participate in the program, with many who travel from the edge of the metro area. In addition to the transit pass subsidies, the hospital provides shuttle service between local transit stations and the hospital for both employees and patients.
Along with transit pass subsidies, the employer also offers participants the following benefits.
♦ A guaranteed ride home in the case of emergencies
♦ Free shuttle service
♦ Ridesharing coordination
♦ Secure bicycle parking and showers
The hospital partners with the local transit agency to offer transit-re-lated events which provide the agency an opportunity to connect with employees, share information such as schedule changes and simply answer questions for employees. Hospital officials say the program showcases their dedication to environmental consciousness which has contributed to positive employee recruitment and retention. Source: “Success Stories of Employer-Sponsored Transportation Programs.” Transportation to Work: A Toolkit For The Business Community. August 1, 2012. Accessed April 17, 2015.
I do [think public transportation would make a difference]. Because right now if you live in, let’s say you live out in Detroit, or Southfield or Troy – there’s a lot of talent there, we don’t even try recruiting them because the commute always ends up where they quit… I think public transportation would make traffic as a whole better. IT employer, Washtenaw County
15
Case Study: Transit Tax Benefit Program
Project Name: Duke Energy’s Transit Subsidy ProgramPartners: Duke Energy and Charlotte Area Transit System
Duke Energy, with locations in Charlotte, NC; Cincinnati, OH; and Houston, TX, participates in the Internal Revenue Service Qualified Transportation Fringe Benefit program, which allows the company to offer transportation subsidies for qualified employees. The program began in the company’s Charlotte location where employees had an average commute time of 40-60 minutes daily.
The program began over ten years ago when the company began offering monthly bus passes and 10-Ride bus passes for a small portion of its work-force that required transportation assistance. In August 2006, the compa-ny began offering a $50 monthly subsidy toward the purchase of transit or vanpool passes—covering the full cost of those services. In just two years, transit use by eligible employees increased from about 0.5% to 16%. When the Charlotte Area Transit System began new light rail service, which em-ployees could utilize using their transit passes, participation in the program increased to about 30 percent.
In fact, feedback from users of the program was so positive in Duke Ener-gy’s Charlotte location, the company expanded the program to its Cincinnati and Houston locations. Along with the Transit Subsidy Program, the compa-ny also offers several other transportation benefits listed below.
♦ Complimentary parking for carpools and vanpools that meet criteria outlined by the program
♦ Bike parking and access to shower facilities and lockers
♦ Online resources where employees can review the program guidelines, learn about updates, and coordinate rideshare opportunities
Due in large part to these transportation benefits, Duke Energy was named a “Best Workplace for Commuters” by the Environmental Protection Agency and the Department of Transportation attracting workers who increasingly look for employers championing clean air and sustainability practices. Source: “Success Stories of Employer-Sponsored Transportation Programs.” Transportation to Work: A Toolkit For The Business Community. August 1, 2012. Accessed April 17, 2015.
Opportunities to Improve Connections
Employers interviewed felt roads are the place to start. Workforce participants surveyed felt the most impact comes from making funds available for vehicle repairs when needed. However both strategies represent short term fixes that have to be reapplied continuously, and lack the ability to provide impactful change over the long term.
A number of the employers who pointed out affordability problems or talent attraction problems for their workforce see better public trans-portation including commuter rail as part of the solution, including those in rural areas where little public transportation is available now.
Those in urban areas were also asked directly about this issue, and even some who say they are not having problems related to transpor-tation believe their employees would appreciate it if convenient public transportation were available, either for cost reasons or because it would make for a more pleasant commute than driving. Complemen-tary walking and biking infrastructure would help support transporta-tion options such as public transit or regional commuter rail.
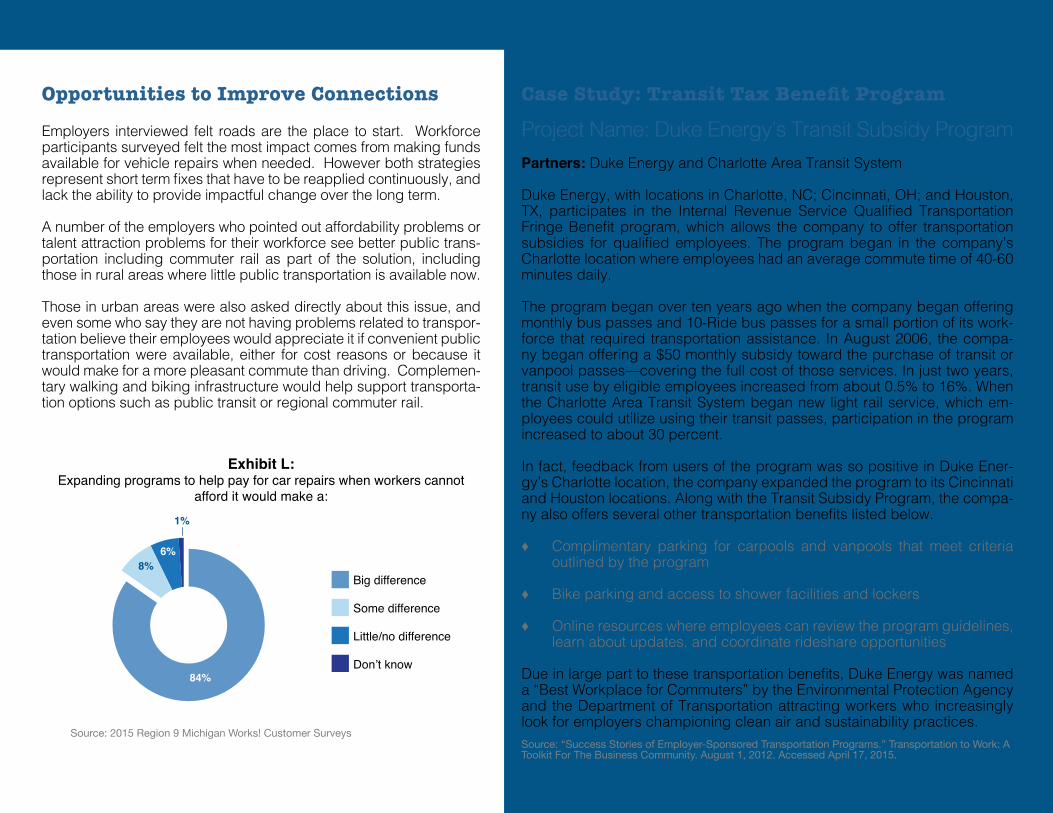
Exhibit L: Expanding programs to help pay for car repairs when workers cannot
afford it would make a:
Big difference
Little/no difference
Some difference
Don’t know
Source: 2015 Region 9 Michigan Works! Customer Surveys
84%
6%8%
1%
16
Next Steps
The surveys, interviews, and best practices all show areas where Region 9 can work to align transportation investments with workforce and talent needs. Opportunities exist within Region 9 to provide long-term solutions through targeted transportation investments in public transit, complete streets, regional commuter rail, and improved road conditions:
♦ Educate employers on ways to provide transportation options to em-ployees, either on their own or in partnership with workforce, eco-nomic development, and/or transportation agencies
♦ Work for longer-term public transit solutions and measure progress, keeping in mind that existing service may need tweaks to accommo-date workers’ schedules with expanded daily and weekend hours
♦ Keep existing workforce programs that connect the most vulnerable job seekers to employment with additional support to make sure jobs are retained over time
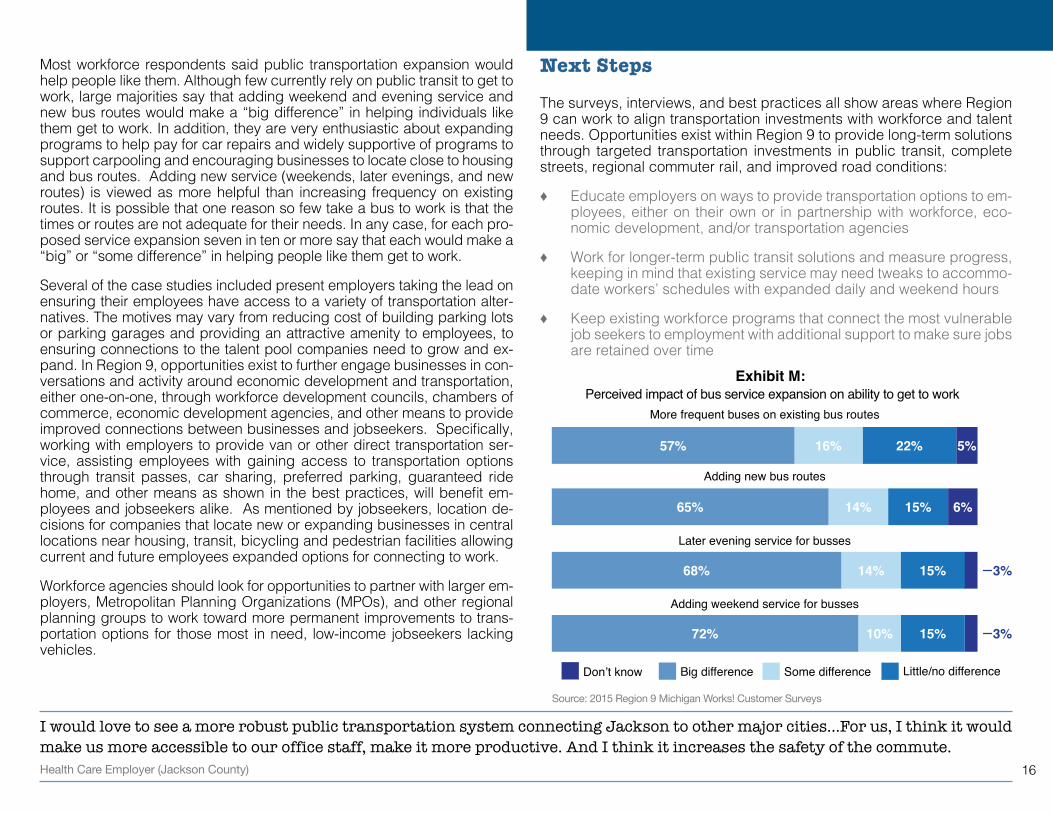
Most workforce respondents said public transportation expansion would help people like them. Although few currently rely on public transit to get to work, large majorities say that adding weekend and evening service and new bus routes would make a “big difference” in helping individuals like them get to work. In addition, they are very enthusiastic about expanding programs to help pay for car repairs and widely supportive of programs to support carpooling and encouraging businesses to locate close to housing and bus routes. Adding new service (weekends, later evenings, and new routes) is viewed as more helpful than increasing frequency on existing routes. It is possible that one reason so few take a bus to work is that the times or routes are not adequate for their needs. In any case, for each pro-posed service expansion seven in ten or more say that each would make a “big” or “some difference” in helping people like them get to work.
Several of the case studies included present employers taking the lead on ensuring their employees have access to a variety of transportation alter-natives. The motives may vary from reducing cost of building parking lots or parking garages and providing an attractive amenity to employees, to ensuring connections to the talent pool companies need to grow and ex-pand. In Region 9, opportunities exist to further engage businesses in con-versations and activity around economic development and transportation, either one-on-one, through workforce development councils, chambers of commerce, economic development agencies, and other means to provide improved connections between businesses and jobseekers. Specifically, working with employers to provide van or other direct transportation ser-vice, assisting employees with gaining access to transportation options through transit passes, car sharing, preferred parking, guaranteed ride home, and other means as shown in the best practices, will benefit em-ployees and jobseekers alike. As mentioned by jobseekers, location de-cisions for companies that locate new or expanding businesses in central locations near housing, transit, bicycling and pedestrian facilities allowing current and future employees expanded options for connecting to work.
Workforce agencies should look for opportunities to partner with larger em-ployers, Metropolitan Planning Organizations (MPOs), and other regional planning groups to work toward more permanent improvements to trans-portation options for those most in need, low-income jobseekers lacking vehicles.
I would love to see a more robust public transportation system connecting Jackson to other major cities...For us, I think it would make us more accessible to our office staff, make it more productive. And I think it increases the safety of the commute. Health Care Employer (Jackson County)
Big difference Little/no differenceSome differenceDon’t know
15% 6%14%65%
Adding new bus routes
5%22%16%57%
More frequent buses on existing bus routes
Adding weekend service for busses
15%10%72% 3%
Later evening service for busses
14% 15%68% 3%
Exhibit M: Perceived impact of bus service expansion on ability to get to work
Source: 2015 Region 9 Michigan Works! Customer Surveys
17
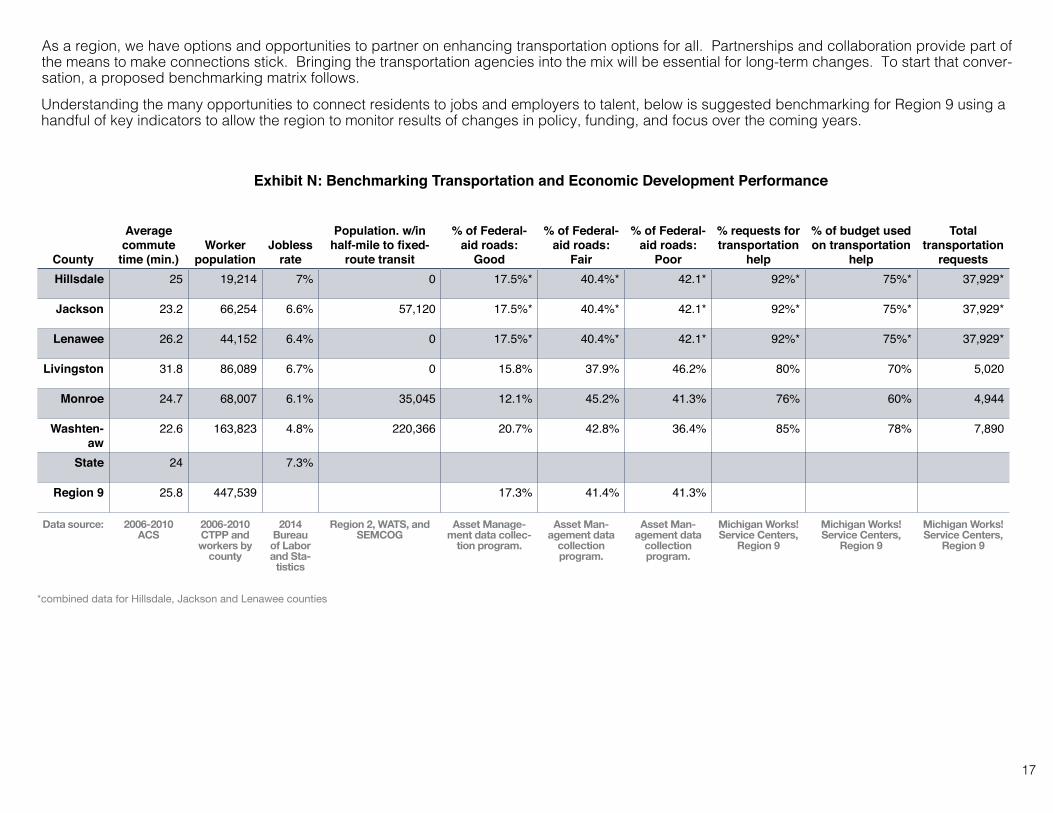
Understanding the many opportunities to connect residents to jobs and employers to talent, below is suggested benchmarking for Region 9 using a handful of key indicators to allow the region to monitor results of changes in policy, funding, and focus over the coming years.
County
Average commute
time (min.)Worker
populationJobless
rate
Population. w/in half-mile to fixed-
route transit
% of Federal-aid roads:
Good
% of Federal-aid roads:
Fair
% of Federal-aid roads:
Poor
% requests for transportation
help
% of budget used on transportation
help
Total transportation
requestsHillsdale 25 19,214 7% 0 17.5%* 40.4%* 42.1* 92%* 75%* 37,929*
Jackson 23.2 66,254 6.6% 57,120 17.5%* 40.4%* 42.1* 92%* 75%* 37,929*
Lenawee 26.2 44,152 6.4% 0 17.5%* 40.4%* 42.1* 92%* 75%* 37,929*
Livingston 31.8 86,089 6.7% 0 15.8% 37.9% 46.2% 80% 70% 5,020
Monroe 24.7 68,007 6.1% 35,045 12.1% 45.2% 41.3% 76% 60% 4,944
Washten-aw
22.6 163,823 4.8% 220,366 20.7% 42.8% 36.4% 85% 78% 7,890
State 24 7.3%
Region 9 25.8 447,539 17.3% 41.4% 41.3%
Data source: 2006-2010 ACS
2006-2010 CTPP and workers by
county
2014 Bureau of Labor and Sta-
tistics
Region 2, WATS, and SEMCOG
Asset Manage-ment data collec-
tion program.
Asset Man-agement data
collection program.
Asset Man-agement data
collection program.
Michigan Works! Service Centers,
Region 9
Michigan Works! Service Centers,
Region 9
Michigan Works! Service Centers,
Region 9
*combined data for Hillsdale, Jackson and Lenawee counties
Exhibit N: Benchmarking Transportation and Economic Development Performance
As a region, we have options and opportunities to partner on enhancing transportation options for all. Partnerships and collaboration provide part of the means to make connections stick. Bringing the transportation agencies into the mix will be essential for long-term changes. To start that conver-sation, a proposed benchmarking matrix follows.