Embed Size (px)
Citation preview

POLL Question:
What is your role in LNAPL Site Management? (Select all that apply)
A. State or Federal Regulator
B. Consultant
C. Policy maker
D. Site Owner
E. Technology Vendor
F. Community Stakeholder
G. Other
1

Connecting the Science to Managing LNAPL Sites – 3 Part SeriesThe newly updated LNAPLs (Light Non-Aqueous Phase Liquids) 3-part training course series is based on the ITRC guidance: LNAPL Site Management: LCSM Evolution, Decision Process, and Remedial Technologies (LNAPL-3, 2018) and focuses on connecting the science to managing LNAPL sites and helping you:- Build upon your Understanding of LNAPL Behavior in the Subsurface (Part 1)- Develop your LNAPL Conceptual Site Model and LNAPL Remedial Goals (Part 2)- Select/Implement LNAPL Technologies (Part 3)
After this training series, the expectation is that you will have the skills and understanding to use ITRC science-based resources to improve decision making at your LNAPL sites. For regulators and other government agency staff, this improved understanding can hopefully be incorporated into your own LNAPL programs.
It is recommended that participants have a general understanding of hydrogeology and some familiarity with petroleum contaminated sites. The courses will build on your existing LNAPL knowledge and outline the framework for making LNAPL remediation and management decisions. It is expected that participants will attend this 3-part training series in sequence.
LNAPL Training Part 1: Understanding LNAPL Behavior in the SubsurfacePart 1 teaches how LNAPLs behave in the subsurface and examines what controls their behavior. Part 1:- Explains what LNAPL data can tell you about the LNAPL and site conditionsp y- Covers how that information is applied to the development of an LNAPL conceptual site model (LCSM) (Part 2) and LNAPL technology selection (Part 3)
Relevant and practical examples are used to illustrate key concepts.
LNAPL Training Part 2: LNAPL Conceptual Site Models and the LNAPL Decision ProcessPart 2 teaches participants how to develop an LNAPL conceptual site model (LCSM) and the overall framework for making LNAPL remediation and management decisions. Part 2: - Discusses key LNAPL and site data- Explains when and why those data may be important- Covers how to effectively organize the data into an LCSM
Part 2 also discusses how to address LNAPL concerns by selecting appropriate goals and objectives, choosing applicable technologies, and assigning remedial performance metrics and endpoints.
LNAPL Training Part 3: Using LNAPL Science, the LCSM, and LNAPL Goals to Select an LNAPL Remedial TechnologyPart 3 of the training teaches the importance of informed remedial technology selection and appropriate technology application. Part 3:
Discusses remedial technology groups- Discusses remedial technology groups- Introduces specific and new remedial technologies- Reviews the technology selection process, how technologies can be combined to accelerate cleanup, and how the LCSM informs selection
A case study and examples demonstrate the use of these tools for remedial technology selection, implementation, and demonstration of successful remediation.Training participants are encouraged to view the associated ITRC guidance, LNAPL Site Management: LCSM Evolution, Decision Process, and Remedial Technologies (LNAPL-3, 2018), prior to attending the class.
ITRC (Interstate Technology and Regulatory Council) www.itrcweb.org
Training Co-Sponsored by: US EPA Technology Innovation and Field Services Division (TIFSD) (www.clu-in.org) ITRC Training Program: [email protected]; Phone: 402-201-2419
2

Notes:
We have started the seminar with all phone lines muted to prevent background noise PleaseWe have started the seminar with all phone lines muted to prevent background noise. Please keep your phone lines muted during the seminar to minimize disruption and background noise. During the question and answer break, press #6 to unmute your lines to ask a question (note: *6 to mute again). Also, please do NOT put this call on hold as this may bring unwanted background music over the lines and interrupt the seminar.
Use the “Q&A” box to ask questions, make comments, or report technical problems any time. For questions and comments provided out loud, please hold until the designated Q&A breaks.questions and comments provided out loud, please hold until the designated Q&A breaks.
Everyone – please complete the feedback form before you leave the training website. Link to feedback form is available on last slide.
3

The Interstate Technology and Regulatory Council (ITRC) is a state-led coalition of regulators, industry experts, citizen stakeholders, academia and federal partners that work to achieve regulatory acceptance of environmental technologies and innovative approaches ITRC consists of all 50and federal partners that work to achieve regulatory acceptance of environmental technologies and innovative approaches. ITRC consists of all 50 states (and Puerto Rico and the District of Columbia) that work to break down barriers and reduce compliance costs, making it easier to use new technologies and helping states maximize resources. ITRC brings together a diverse mix of environmental experts and stakeholders from both the public and private sectors to broaden and deepen technical knowledge and advance the regulatory acceptance of environmental technologies. Together, we’re building the environmental community’s ability to expedite quality decision making while protecting human health and the environment. With our network of organizations and individuals throughout the environmental community, ITRC is a unique catalyst for dialogue between regulators and the regulated community.
For a state to be a member of ITRC their environmental agency must designate a State Point of Contact. To find out who your State POC is check out the “contacts” section at www.itrcweb.org. Also, click on “membership” to learn how you can become a member of an ITRC Technical Team.
Disclaimer: This material was prepared as an account of work sponsored by an agency of the United States Government. Neither the United States Government nor any agency thereof, nor any of their employees, makes any warranty, express or implied, or assumes any legal liability or responsibility for the accuracy, completeness, or usefulness of any information, apparatus, product, or process disclosed, or represents that its use would not infringe privately owned rights. Reference herein to any specific commercial product, process, or service by trade name, trademark, manufacturer, or otherwise does not necessarily constitute or imply its endorsement, recommendation, or favoring by the United States Government or any agency thereof. The views and opinions of authors expressed herein do not necessarily state or reflect those of the United States Government or any agency thereof and no official endorsement should be inferred.
The information provided in documents, training curricula, and other print or electronic materials created by the Interstate Technology and Regulatory Council (“ITRC” and such materials are referred to as “ITRC Materials”) is intended as a general reference to help regulators and g y ( ) g p gothers develop a consistent approach to their evaluation, regulatory approval, and deployment of environmental technologies. The information in ITRC Materials was formulated to be reliable and accurate. However, the information is provided "as is" and use of this information is at the users’own risk.
ITRC Materials do not necessarily address all applicable health and safety risks and precautions with respect to particular materials, conditions, or procedures in specific applications of any technology. Consequently, ITRC recommends consulting applicable standards, laws, regulations, suppliers of materials, and material safety data sheets for information concerning safety and health risks and precautions and compliance with then-applicable laws and regulations. ITRC, ERIS and ECOS shall not be liable in the event of any conflict between information in ITRC Materials and such laws, regulations, and/or other ordinances. The content in ITRC Materials may be revised or withdrawn at any time without prior notice.
ITRC, ERIS, and ECOS make no representations or warranties, express or implied, with respect to information in ITRC Materials and specifically
4
disclaim all warranties to the fullest extent permitted by law (including, but not limited to, merchantability or fitness for a particular purpose). ITRC, ERIS, and ECOS will not accept liability for damages of any kind that result from acting upon or using this information.
ITRC, ERIS, and ECOS do not endorse or recommend the use of specific technology or technology provider through ITRC Materials. Reference to technologies, products, or services offered by other parties does not constitute a guarantee by ITRC, ERIS, and ECOS of the quality or value of those technologies, products, or services. Information in ITRC Materials is for general reference only; it should not be construed as definitive guidance for any specific site and is not a substitute for consultation with qualified professional advisors.

Randy Chapman is an Environmental Manager for the Petroleum Remediation Program at the Virginia Department of Environmental Quality (DEQ) Northern Regional Office in Woodbridge Virginia Randy has worked in the Tanks and Remediation Section since 1993Quality (DEQ) Northern Regional Office in Woodbridge, Virginia. Randy has worked in the Tanks and Remediation Section since 1993when he was hired as a Remediation Geologist. In 2015, Randy became manager of the Section. He currently oversees release investigations, environmental assessments, corrective actions, and closure of petroleum impacted sites as well as the Compliance and Enforcement activities associated with regulated petroleum UST and AST inspections. Randy has been actively involved in the development and implementation of numerous program guidance, including the issuance of the Virginia DEQ 2012 Case Closure Evaluation of Sites with Free Product guidance. Randy has presented at numerous technical conferences. Randy has been active in the ITRC since 2012 serving on the ITRC Petroleum Vapor Intrusion (PVI) team. Prior to the VA DEQ, Randy worked for South Carolina DHEC between 1990 and 1993. Randy earned a bachelor's degree in geology from Clemson University in Clemson South Carolina in 1988.
Sanjay Garg is a consultant within Shell Global Solutions in Houston, Texas, which provides technical expertise to Shell’s global operations. He has been employed with Shell Oil Company and its subsidiary companies since 1999. Sanjay provides technical support on underground fate-and-transport of hydrocarbons including LNAPL management to various Shell businesses. He routinely provides training inside and outside Shell on several topics including LNAPL. Prior to Shell he was a Postdoctoral fellow and a Faculty Fellow at Rice University during 1999. He has been active in the ITRC LNAPL team since 2007. Sanjay earned an undergraduate degree in Civil Engineering from Gulbarga University in India in 1988 and a Ph.D. in Environmental Engineering from the University of Houston, Houston, Texas in 1998.
Natasha Sihota is an Environmental Hydrogeologist with the Site Assessment and Remediation team of Chevron's Energy Technology Company in San Ramon, California. She provides technical guidance for domestic and international hydrocarbon remediation projects and supports internal technology research and development for site assessment and remediation tools. Natasha developed the surficial CO2 efflux approach for evaluating NAPL management through natural source zone depletion (NSZD). She has extensive experience with applying the NSZD concept to achieve different site management objectives. Natasha has been involved in developing guidance documents in the US for evaluating and applying the NSZD concept through the American Petroleum Association, ITRC, and other state groups. She has provided NSZD training to environmental regulators, industry colleagues, and university groups Natasha earned a bachelor's degree in hydrogeology ecology and environmental chemistry from the University ofuniversity groups. Natasha earned a bachelor s degree in hydrogeology, ecology and environmental chemistry from the University of British Columbia, Canada in 2009 and a Ph.D. in contaminant hydrogeology in 2014.
5

Light Non Aqueous Phase Liquids (LNAPL)
6

We have documented use of ITRC LNAPL guidance in nearly every state and at least 20 states are using ITRC LNAPL id f f f d l i th i idLNAPL guidance as a reference of as a resource for developing their own guidance.
Reference in guidance documents:
California Leaking Underground Fuel Tank Guidance Manual (September 2012)
Iowa Department of Natural Resources Underground Storage Tank Section, Tier 2 Site Cleanup Report Guidance: Site Assessment of Leaking Underground Storage Tanks Using Risk-Based Corrective Action (2015)
Kansas Bureau of Environmental Remediation Policy # BER-041, Total Petroleum Hydrocarbons (TPH) and Light Non-Aqueous Phase Liquid (LNAPL) Characterization, Remediation and Management (September 1, 2015)q q ( ) g ( p )
Massachusetts Department of Environmental Protection Light Nonaqueous Phase Liquids (LNAPL) and MCP: Guidance for Site Assessment and Closure (February 19, 2016)
Michigan Non-Aqueous Phase Liquid (NAPL) Characterization, Remediation, and Management for Petroleum Releases (June 2014)
Minnesota Pollution Control Agency’s LNAPL Management Strategy Guidance
Montana Department of Environmental Quality, Remediation Division’s Montana Light Non-Aqueous Phase Liquid (LNAPL) Recovery and Monitoring Guidance (July 15 2013)(LNAPL) Recovery and Monitoring Guidance (July 15, 2013)
New Jersey Department of Environmental Protection’s Monitored Natural Attenuation Technical Guidance (Version: 1.0, March 1, 2012)
New Jersey Department of Environmental Protection Site Remediation Program Light Non-aqueous Phase Liquid (LNAPL) Initial Recovery and Interim Remedial Measures Technical Guidance (June 29, 2012, Version 1.2)
Virginia Department of Environmental Quality, Storage Tank Program’s Case Closure Evaluation of Sites with Free Product (DEQ Guidance Document #LPR-SRR-03-2012, December 28, 2012)
W hi t G id f R di ti f P t l C t i t d Sit (P bli ti N 10 09 057 i d O t bWashington Guidance for Remediation of Petroleum Contaminated Sites (Publication No. 10-09-057, revised October 2011)
Multiple states in development.
ITRC LNAPL State Surveys from 2008 and 2017.
7

Here are a couple specific examples from VA and CO, as leaders of the current LNAPL effort we are d f th i t h d t t t ’ id i LNAPLvery proud of the improvements we have made to our own state’s guidance on managing LNAPL
sites using ITRC’s science-based approach.
VA guidance allows for case closure of sites with LNAPL regardless of thickness
8
Brief history
9
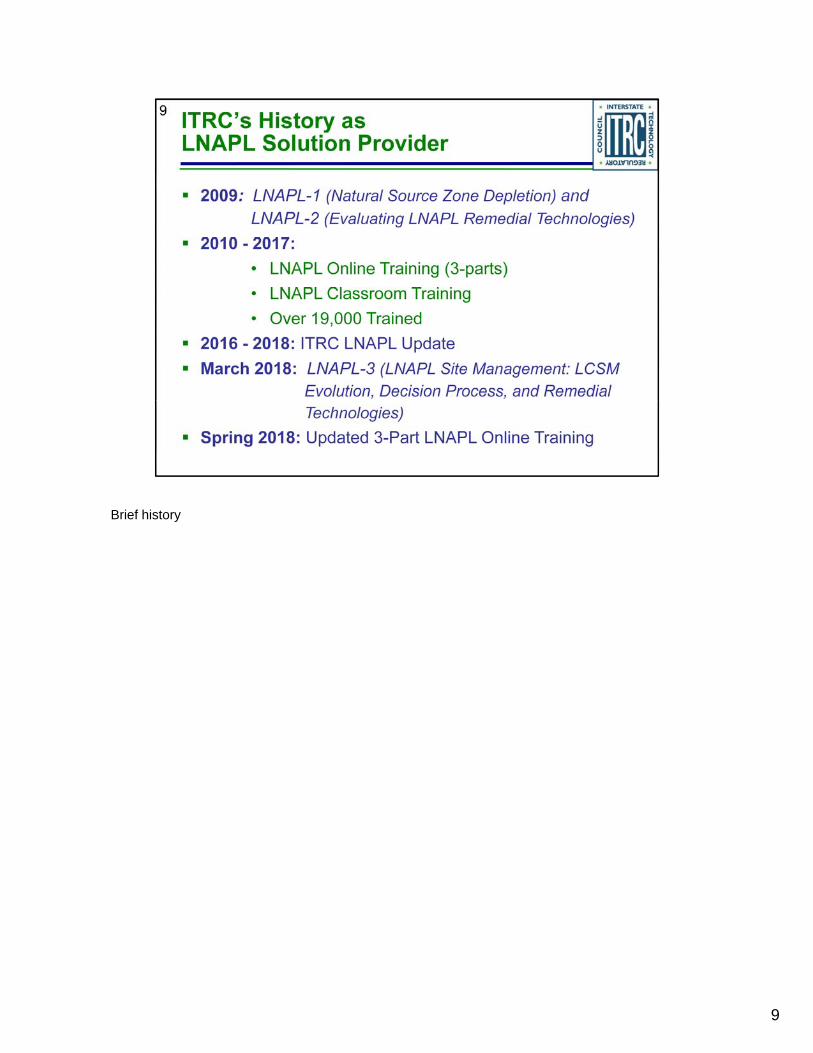
As with all ITRC documents we went through a consensus-based process; a collaborative effort i l i St t d F d l R l t C lt t I d t R t ti d i dinvolving State and Federal Regulators, Consultants, Industry Representatives, academia, and community stakeholders to develop our newest ITRC Online Resources
This guidance, LNAPL Site Management: LCSM Evolution, Decision Process, and Remedial Technologies (LNAPL-3), builds upon and supersedes both previous ITRC LNAPL guidance documents in an updated, web-based format. LNAPL-1 and LNAPL-2 are still available for review. LNAPL-3 is inclusive of those materials with new topics presented and previous topics elaborated upon and further clarifiedupon and further clarified.
Summarize the new information:
• Expansion of LNAPL Key Concepts
• Development of a LNAPL Conceptual Site Model (LCSM) Section
• Emphasis on identifying SMART (Specific, Measurable, Achievable, Realistic, Timely) goals
• Expansion of Transmissivity (Tn) and Natural Sources Zone Depletion (NSZD)• Expansion of Transmissivity (Tn) and Natural Sources Zone Depletion (NSZD)
10

11
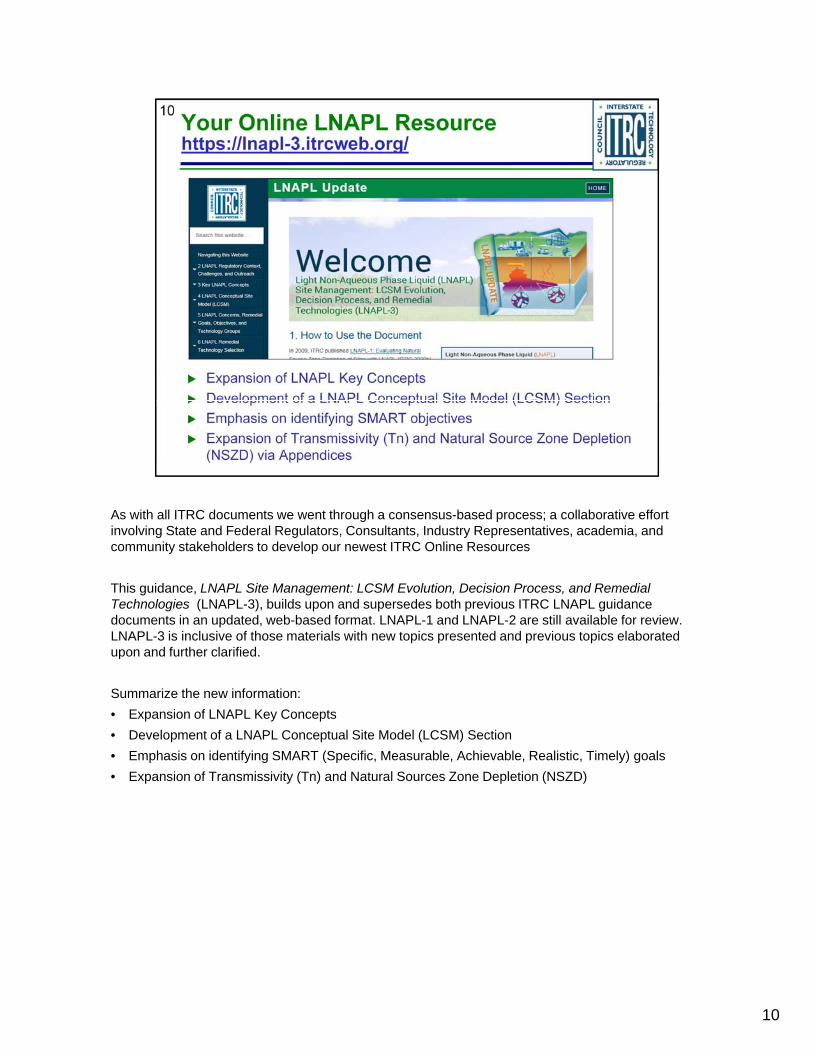
Don’t think that the LNAPL release has to be large or new. It does not. For most of us, the release i ll d ld N tt th i th d l i i i thsizes are small and old. No matter the size or age, the underlying science is the same.

Our 3-part training series provides you with the knowledge and skills so you can apply the newest ITRC LNAPL id t it ( d f th f l t t ti ll h l i t tITRC LNAPL guidance at your sites (and for the case of you regulators, potentially help you integrate LNAPL science into your own state guidance).
Here are our learning objectives for our 3-part series…….. We will provide a systematic framework to:
• Use LNAPL science to your advantage and apply at your sites
• Develop LNAPL Conceptual Site Model (LCSM) for LNAPL concern identification
• Establish appropriate LNAPL remedial goals and objectives
• Inform stakeholders of the applicability LNAPL remedial technologies
• Select remedial technologies to achieve goals
• Prepare for transition between LNAPL strategies or technologies as the site moves through investigation, cleanup, and beyond
• Evaluate remedial technology use to measure progress toward an identified technology specific endpoint
13

As mentioned, the 3-part training series focuses on helping you:
Connect Science to LNAPL Site Management
Build your LNAPL Conceptual Site Model
Select/Implement LNAPL Remedies
This training will be incomplete unless apply this information. After this training our expectation is that you will use ITRC science-based resources to improve decision making at your LNAPL sites (and for you regulators and other government agency staff consistent with your own guidance)you regulators and other government agency staff, consistent with your own guidance).
Today (CLICK) in Part 1 lets talk about the LNAPL science.
14

Today (Part 1) we are going to focus on LNAPL science, that will prepare us to effectively navigate th LNAPL R di ti P d E l ti f th LNAPL C t l Sit M d l (LCSM) (P tthe LNAPL Remediation Process and Evolution of the LNAPL Conceptual Site Model (LCSM) (Part 2). If you have already reviewed the new ITRC LNAPL guidance that serves as the basis for our 3-part training class, you have probably seen this flow chart, but to use this flow chart effectively and to make high quality decisions, you need to have an understanding of LNAPL science and how to apply it at your sites. Figure 1-1 identifies the stepwise evolution of the LCSM, the specific purpose of each LCSM phase, and the tools presented within this guidance to aid in the development of the LCSM. As depicted, the LCSM is the driving force for identifying actions to bring your LNAPL site to the appropriate regulatory closure.
15

There are several key concepts that we’d like to cover in this module. Here are some key “take-” th t b t t laways” that you are about to learn.
16

Let’s take a look at these points one-by-one…
17

What you see in a well is not what you’d see in the formation
18

Shows evolution of an LNAPL body over time, starting with the initial release.
Time 1: LNAPL migrates vertically downward through the USZ
Time 2: LNAPL begins to spread laterally and vertically above and below the water table
Time 3: Soil pore resistance and buoyancy begin to counteract LNAPL head (the driving force)
Time 4: LNAPL head is balanced by soil pore resistance and buoyancy, resulting in a distribution of LNAPL that varies with depth and quasi-stable over time.
<click> The LNAPL thickness that accumulates in a well is not the same as the LNAPL distribution in the formation Let’s look at some examplesthe formation. Let s look at some examples…
19

This sand tank experiment shows the release of an LNAPL dyed red. The second image shows that th LNAPL di t ib t b d b l th t t bl t dthe LNAPL distributes above and below the water table, as expected.
20

The key message here is that LNAPL doesn’t float like a pancake on top of the water table, it t t b l th t t bl i i bl t ti fil Thi i t ti ipenetrates below the water table in a variable saturation profile. This varying saturation arises
because the LNAPL and water occupy the same pore space.
21

Instead of a layer of continuous uniform LNAPL saturation, LNAPL and water both exist in the same il i i t L t’ l k t thi i d t ilsoil, in varying amounts. Let’s look at this in more detail…
22

Introduce next speaker
23

In these cases how do you know that LNAPL is present…we have a full section on this…
24

LNAPL exists in many conditions
25

This is a cross-sectional view of an LNAPL plume.
26

This is a plan view of an LNAPL plume.
27

partial vapor pressure of each component of an ideal mixture of liquids is equal to the vapour f th t lti li d b it l f ti i th i t I thpressure of the pure component multiplied by its mole fraction in the mixture. In other
words it is stated as the relative lowering of vapour pressure of a dilute solution containing nonvolatile solute is equal to the mole fraction of solute in the solution.
28

No associated notes.
29

No associated notes.
Csat is significantly lower than concentrations at which LNAPL may actually be observed
30

No associated notes.
31

This is a plan view of an LNAPL plume.Wh t i f di th d t ?What is feeding the groundwater?
32

This is a cross-sectional view of an LNAPL plume.
33

OVA – organic vapor analyzer
Existing soil data is typically readily available for most sites. However, most of this more historic data is typically in the for of total petroleum hydrocarbon (TPH) data. One way to estimate what the potential saturation of LNAPL within the subsurface is use of an equation developed by Parker, Waddill and Johnson in 1994, which was also presented in the Natural Attenuation text by Wiedemeier, Rifai, Newell and Wilson in 1999.
Typically, information exists from the logs as well but may not necessary be to the detail one would like for a LNAPL assessment.
•Parker, J.C., Waddill, D.W., and Johnson, J.A., 1994. UST Corrective Action Technologies: Engineering Design of Free Product Recovery Systems, prepared for Superfund Technology Demonstration Division, Risk Reduction Engineering Laboratory, Edison, NJ, Environmental Systems & Technologies, Inc., Blacksburg, VA, 77 pp.
•Wiedemeier, T.H., H.S. Rifai, C.J.Newell, and J.T.Wilson, 1999. Natural Attenuation of Fuels and Chlorinated Solvents in the Subsurface. John Wiley & Sons, Inc., New York, NY, 617 pages. Equation on Page 77, equation 2.23.
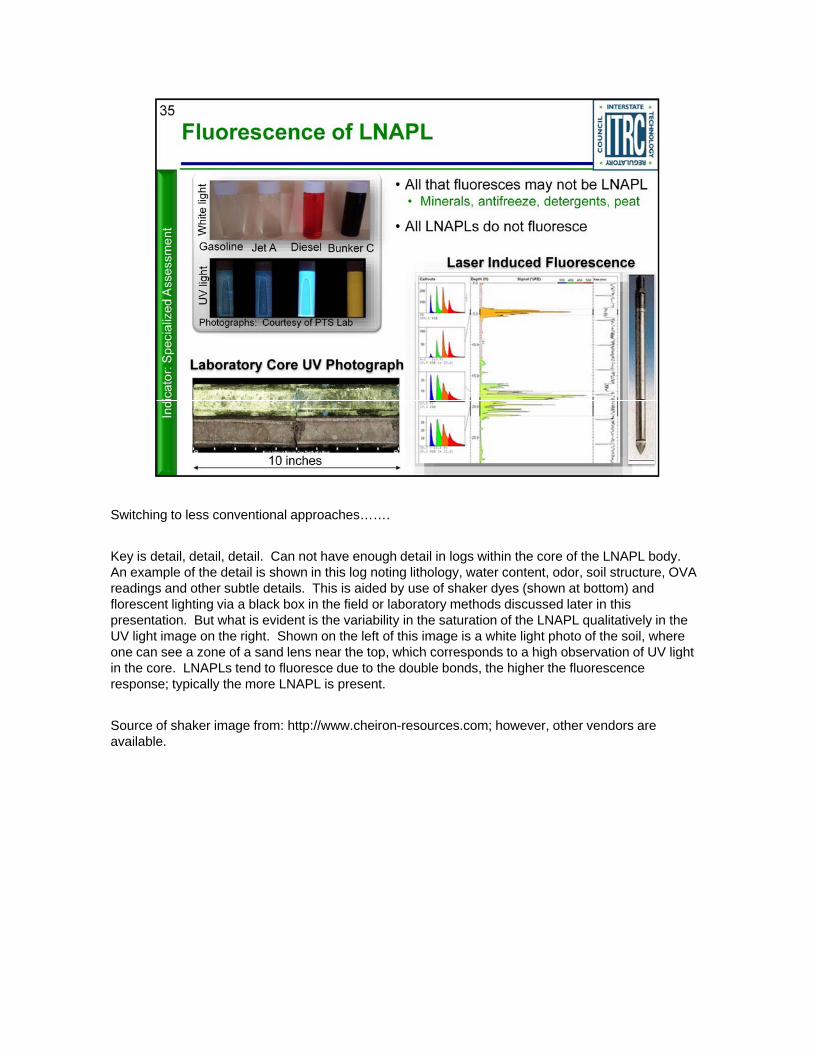
Switching to less conventional approaches…….
Key is detail, detail, detail. Can not have enough detail in logs within the core of the LNAPL body. An example of the detail is shown in this log noting lithology, water content, odor, soil structure, OVA readings and other subtle details. This is aided by use of shaker dyes (shown at bottom) and florescent lighting via a black box in the field or laboratory methods discussed later in this presentation. But what is evident is the variability in the saturation of the LNAPL qualitatively in the UV light image on the right. Shown on the left of this image is a white light photo of the soil, where one can see a zone of a sand lens near the top which corresponds to a high observation of UV lightone can see a zone of a sand lens near the top, which corresponds to a high observation of UV light in the core. LNAPLs tend to fluoresce due to the double bonds, the higher the fluorescence response; typically the more LNAPL is present.
Source of shaker image from: http://www.cheiron-resources.com; however, other vendors are available.

No associated notes.
36

Now that we’ve introduced the concepts of solubility and saturation, let’s look at LNAPL composition d t ti d h h i i t tand saturation, and why each is important
37

Imagine three LNAPLs: one pure Xylene, one pure Octane, and one that is a mixture of the two.
Each closed beaker has LNAPL in equilibrium with water.
Single-component LNAPL: solubility of the pure chemical
Mixture: solubility follows Raoult’s Law
38

This figure is from our guidance, page 17.It ill t t th ff t f ti l LNAPL l th LNAPL tit t t ti i•It illustrates the effect of partial LNAPL mass removal on the LNAPL constituent concentrations in a
monitoring well located down-gradient of the source zone and screened completely across the initial thickness of LNAPL impacts.•Case A is the base case where no active remediation is performed.•The contaminants of concern (COCs) dissolve into the groundwater until they are completely removed from the LNAPL.•The rest of the example cases are normalized to Case A.•In Case B, the LNAPL source has been partially excavated vertically, leaving the lower half of the LNAPL smear zone in placeLNAPL smear zone in place.•Since the well is screened across the entire thickness of the original impacts, the concentration in the monitoring well is reduced by half due to dilution.•However, since the source length is not changed, there is no effect of the longevity of groundwater impacts.•In Case C, the LNAPL source has been partially excavated in the direction of groundwater flow.•The upgradient half of the LNAPL source has been excavated and other half has been left under a building.•Here the groundwater concentrations in the monitoring wells are unchanged but the longevity is•Here the groundwater concentrations in the monitoring wells are unchanged, but the longevity is theoretically reduced by half (however, its not this simple - remember the previous slide).•Case D represents a scenario where 20% of the LNAPL body is removed to residual saturation using hydraulic removal, leaving 80% of the LNAPL body in place.•With a 20% reduction in LNAPL saturation, the concentrations are unchanged, but relative time is theoretically reduced by approximately 20%.•In Case E, 80% of the COCs are removed from the LNAPL body using air sparging/vapor extraction.•There is a proportional decrease in the concentrations of COCs in the groundwater emanating from the site.•One key takeaway is that removing LNAPL mass may have little to no effect on groundwater concentrations
39

The data in this graph come from over 4000 sites with 4 or more years of monitoring data.
X-axis shows max Benzene conc over a ten-year period.
Y-axis shows max Benzine conc in the last year of that same period.
Orange dots are sites with active LNAPL hydraulic recovery
Blue dots are sites with no LNAPL hydraulic recovery.
There is no systematic difference between these two groups of sites, in terms of concentration reduction over time.
40

If we wish to reduce groundwater concentrations, Raoult’s Law says we need to deplete the mole f ti f th t h i l i th LNAPLfraction of that chemical in the LNAPL.
How do we do this?
Here are four example ways, each has more effect on certain chemicals within the LNAPL mixture.
41

Remember that MNA focuses on the dissolved phase… it is not the same as NSZD, which we’ll talk b tabout soon.
42
No associated notes.
43

Slide 44Pore Entry Pressure – concept discussed in migration

Slide 45
Graph shows volume estimates for different soil types for a given LNAPL thickness in the well.
Volume of gasoline via pancake = LNAPL thickness in well x porosity
Volume of gasoline = area under the curve x porosity
Pancake over-predicts volume and the over-prediction gets more and more significant as grain size becomes smaller.
LNAPL thi k i f ll ill di t ib ti i b t iLNAPL thickness is same for all cases capillary pressure distribution is same, but pore sizes are different. Therefore, different sharkfins for different soils even though well thickness is the same.
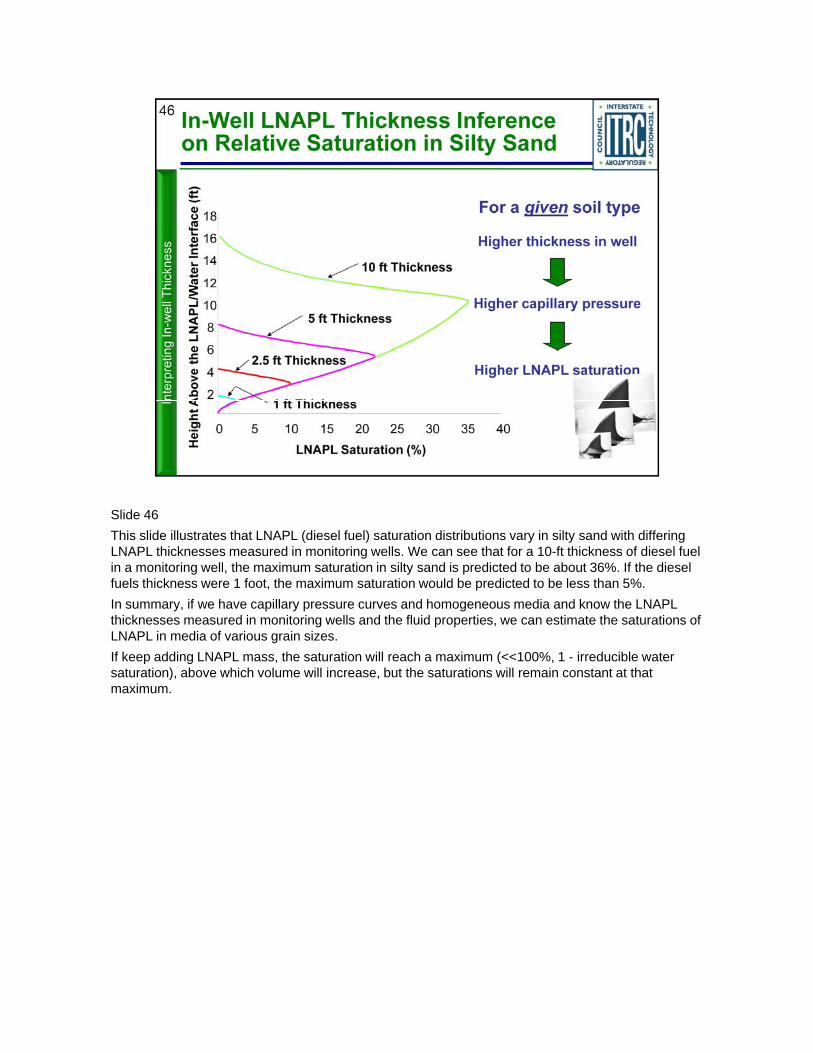
Slide 46
This slide illustrates that LNAPL (diesel fuel) saturation distributions vary in silty sand with differing LNAPL thicknesses measured in monitoring wells. We can see that for a 10-ft thickness of diesel fuel in a monitoring well, the maximum saturation in silty sand is predicted to be about 36%. If the diesel fuels thickness were 1 foot, the maximum saturation would be predicted to be less than 5%.
In summary, if we have capillary pressure curves and homogeneous media and know the LNAPL thicknesses measured in monitoring wells and the fluid properties, we can estimate the saturations of LNAPL in media of various grain sizes.
If k ddi LNAPL th t ti ill h i ( 100% 1 i d ibl tIf keep adding LNAPL mass, the saturation will reach a maximum (<<100%, 1 - irreducible water saturation), above which volume will increase, but the saturations will remain constant at that maximum.

Symbols are data. Lines are calculations.
Left panel has homogeneous soil. Right panel has 6 soil types.
Model predictions have a good match for the homogeneous soil. Reasonable match for the heterogeneous case.
Important to know geology and other factors like water table fluctuations if calculating profile.
Key point: LNAPL Saturation is never 1 and varies.

We’ve just looked at what a stable LNAPL saturation profile looks like when it’s on a stationary water t bl N l t’ h t h h thi htable. Now let’s see what happens when things change.
48

The attached movie illustrate a diesel plume in a gravelly sand aquifer that is characterized by l t t bl fl t ti Th t t d d t thi k d f 50seasonal water table fluctuations. The extent and product thickness were measured from over 50
wells across the site for five years. The apparent well product thickness measurements range from 0 to 4 feet. The groundwater level fluctuates approximately 8 feet seasonally. The blue gauge on the right side of each picture provides the average water level, and the color contours represent the LNAPL thickness in wells. The images illustrate the influence of water table fluctuations in trapping LNAPL as water rises into the oil profile, and in the subsequent drainage of LNAPL during periods of low water level. During this time period, recovery systems were operational, which resulted in the continual loss of product from the aquifer.
Full video in the API Interactive NAPL Guide

The attached movie stills illustrate a diesel plume in a gravelly sand aquifer that is characterized by l t t bl fl t ti Th t t d d t thi k d f 50seasonal water table fluctuations. The extent and product thickness were measured from over 50
wells across the site for five years. The apparent well product thickness measurements range from 0 to 4 feet. The groundwater level fluctuates approximately 8 feet seasonally. The blue gauge on the right side of each picture provides the average water level, and the color contours represent the LNAPL thickness in wells. The images illustrate the influence of water table fluctuations in trapping LNAPL as water rises into the oil profile, and in the subsequent drainage of LNAPL during periods of low water level. During this time period, recovery systems were operational, which resulted in the continual loss of product from the aquifer.
Full video in the API Interactive NAPL Guide

As the water table rises, water displaces LNAPL and air and traps LNAPL in pores.
As the water table drops, air displaces LNAPL and water in the upper part of the smear zone. Less LNAPL is trapped when air displaces LNAPL, so more LNAPL tends to accumulate in wells.
51

Let’s looks at how LNAPL accumulates in wells under in unconfined water table conditions.
Panel B shows GW elevation plotted against LNAPL thickness. As the water table rises, the LNAPL thickness is reduced.
Panel C shows this over time. Elevations of the top of LNAPL in red, LNAPL-Water interface in blue and the piezometric surface in purple. As the piezometric surface goes up the LNAPL thickness, which is the distance between the red and blue lines, goes down.
What is usually observed here in all hydrographs is that, when the water table elevation decreases, y y g pthe LNAPL thickness in the monitoring well increases, and vice versa. While changes in the measured LNAPL thickness often are attributed to a redistribution of LNAPL in the aquifer as the water-table elevation changes, this is only part of the story. Let’s look at the rest of the story…

What happens when the LNAPL is sitting on a low-permeability layer? This is often called a perched condition. In this instance, the LNAPL has enough head to continue to migrate downward, but it can’t, because it is blocked by the soil pore resistance of the fine-grained layer. The well becomes a pathway for drainage of the LNAPL, so it flows into the well. As the water level in the well drops, more LNAPL can flow in, even though the Air-LNAPL interface stays relatively stationary.

A confined condition is like a perched condition turned upside down. Let’s see how this works.
Left side: LNAPL in unconfined condition. The LNAPL in the well is adjacent to the bulk of the LNAPL in the formation. Water table fluctuations will have an inverse relationship to LNAPL thickness.
Right side: LNAPL/aquifer under confined condition. As the piezometric surface rises, the confining pressure on the LNAPL rises, resulting in an increased thickness in the well. That is, an increase in p gpiezometric surface results in increase in LNAPL thickness under confined conditions.

Sometimes LNAPL may be in confined conditions some of the time, and unconfined at other times. At thi ll th b f fi i l i t t 800 ftthis well, the base of a confining layer exists at 800 ft. Left Hand Side: Water table in gravel (unconfined condition), LNAPL moves up and down with water table fluctuations, with inverse LNAPL thickness change
Right Hand Side: With recharge, water table rise intercepts confining clay and confined conditions develop. Increase in potentiometric surface results in increase in LNAPL thickness. LNAPL forced into the well and floats to top of potentiometric surface.

No regular shark fin saturation profile in these situations:
Can act like perched or confined, depending on water level.
Perched: LNAPL drains into well as water table falls, Well acts like a conduit.
Confined: LNAPL is driven into well as water table rises.
Once equilibrium is reached, LNAPL thickness in well will mimic the continuous LNAPL column formed through connected fractures (macropores). Volume in formation is limited to the fractures.

Understanding the hydrogeologic conditions helps to explain the pattern of LNAPL occurrence.
Here are some examples.
57

Water table rises, LNAPL thickness increases.
58

No associated notes.
59

No associated notes.
60

Before considering how LNAPL moves, it is helpful to consider broader considerations for t f LNAPL d th l t t t f LNAPL bilitmanagement of LNAPL and the regulatory context for LNAPL mobility.
We begin with LNAPL emergency issues described in left panel, which include safety issues due to explosion and direct contact with LNAPL. In the middle panel, the vapour and groundwater pathways are highlighted. These are common risk pathways that are addressed by most state and federal regulations. The right panel addresses the additional considerations when LNAPL is present in wells, which is potential LNAPL mobility or other aspects that may be relevant due to presence of LNAPL in wells such as aesthetic considerations reputation or liability The focus of the subsequent slides iswells, such as aesthetic considerations, reputation or liability. The focus of the subsequent slides is the fourth point, which is LNAPL mobility. Although many regulatory frameworks have general provisions based on LNAPL presence in wells, such as recovery of LNAPL to the extent practicable, there are few regulations that address LNAPL mobility in detail. In part, our goal here today is to present the science to enable such regulations to be developed.
Notes on potential revisions:
Change title to “LNAPL Management Considerations”Change title to LNAPL Management Considerations
LNAPL emergency issues is typically addressed in regulations. My experience is that virtually all regulations have general prohibitions and cautions respecting factors given.
Replace “evaluated using std. regs) with “typically addressed by regulations”.
61
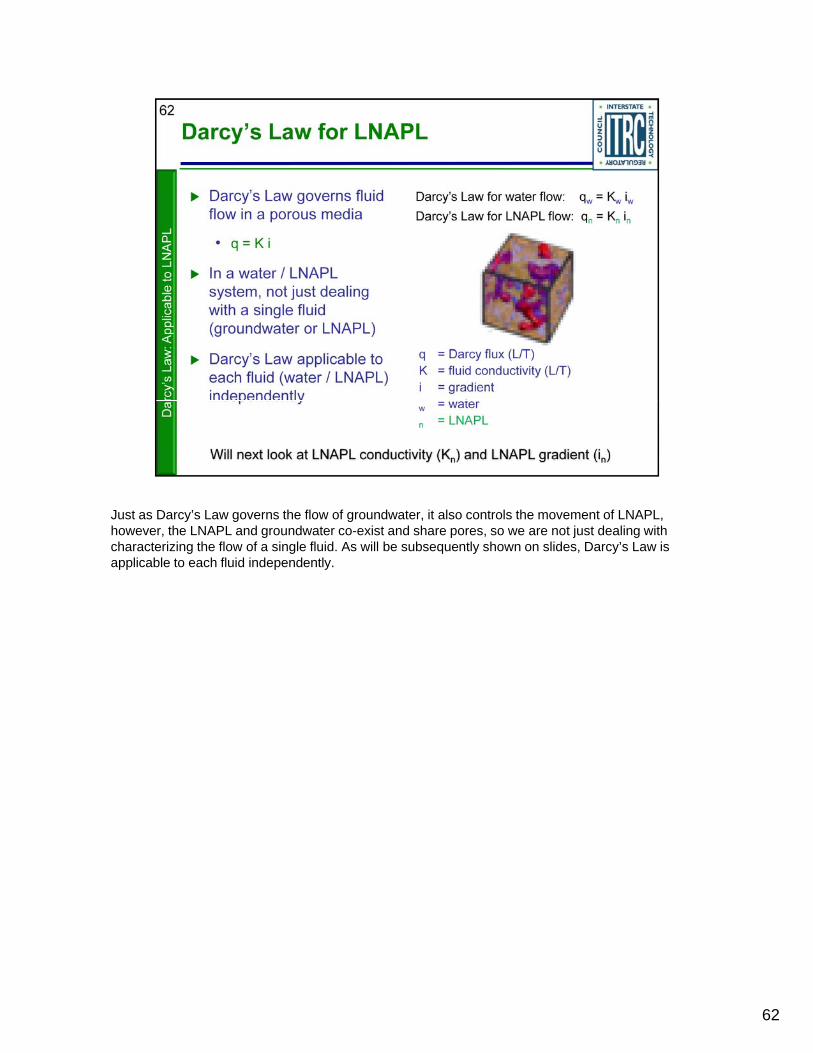
Just as Darcy’s Law governs the flow of groundwater, it also controls the movement of LNAPL, h th LNAPL d d t i t d h t j t d li ithhowever, the LNAPL and groundwater co-exist and share pores, so we are not just dealing with characterizing the flow of a single fluid. As will be subsequently shown on slides, Darcy’s Law is applicable to each fluid independently.
62
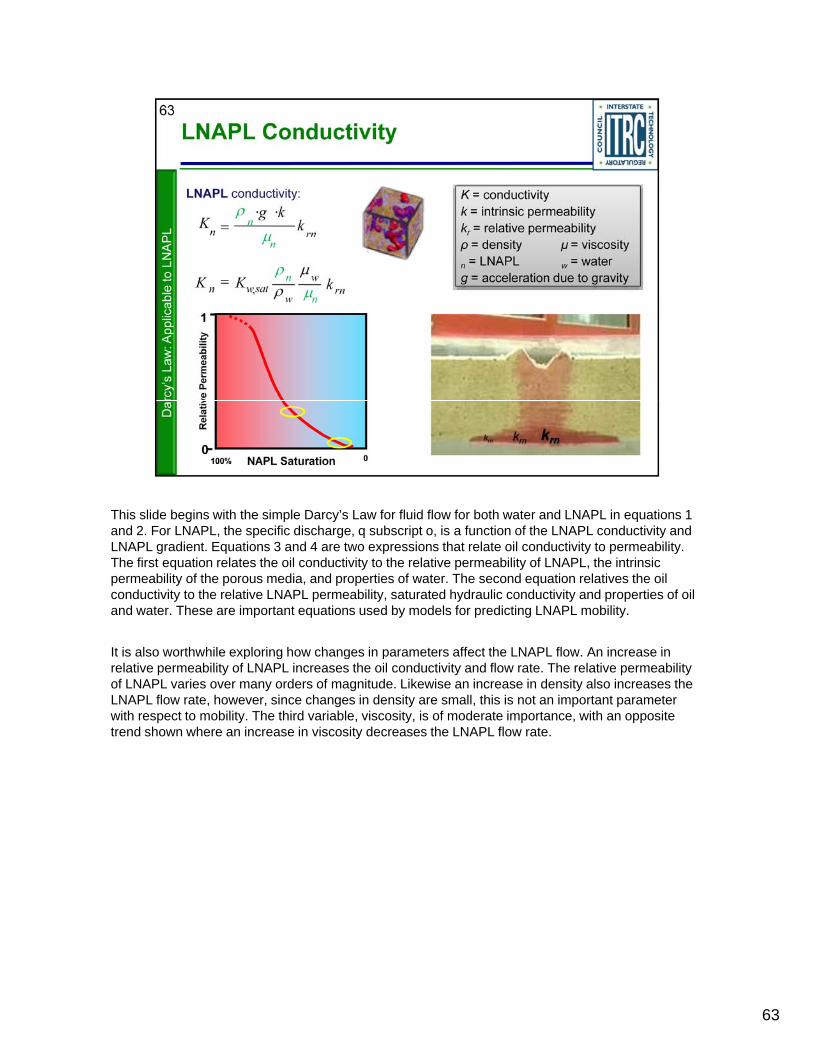
This slide begins with the simple Darcy’s Law for fluid flow for both water and LNAPL in equations 1 d 2 F LNAPL th ifi di h b i t i f ti f th LNAPL d ti it dand 2. For LNAPL, the specific discharge, q subscript o, is a function of the LNAPL conductivity and
LNAPL gradient. Equations 3 and 4 are two expressions that relate oil conductivity to permeability. The first equation relates the oil conductivity to the relative permeability of LNAPL, the intrinsic permeability of the porous media, and properties of water. The second equation relatives the oil conductivity to the relative LNAPL permeability, saturated hydraulic conductivity and properties of oil and water. These are important equations used by models for predicting LNAPL mobility.
It is also worthwhile exploring how changes in parameters affect the LNAPL flow An increase inIt is also worthwhile exploring how changes in parameters affect the LNAPL flow. An increase in relative permeability of LNAPL increases the oil conductivity and flow rate. The relative permeability of LNAPL varies over many orders of magnitude. Likewise an increase in density also increases the LNAPL flow rate, however, since changes in density are small, this is not an important parameter with respect to mobility. The third variable, viscosity, is of moderate importance, with an opposite trend shown where an increase in viscosity decreases the LNAPL flow rate.
63

This is a cross-sectional view of an LNAPL plume.
64

No associated notes.

This is a cross-sectional view of an LNAPL plume.
66

The emerging approach for evaluating LNAPL mobility is a multiple lines of evidence approach. The i t t h i t id i f thi h th t h i l l ti th t th ITRC LNAPLintent here is to provide an overview of this approach, the technical regulation that the ITRC LNAPL team is developing will provide additional details.
The first line of evidence and typically the primary and most important one are monitoring results. Assuming that there is an adequate monitoring network and sufficient temporal data, there are several factors that are evidence for a stable footprint, which are a stable or decreasing thickness of LNAPL in monitoring wells, sentinel wells outside of the LNAPL zone that remain free of LNAPL and a shrinking dissolved phase plumea shrinking dissolved phase plume
The second line of evidence involves calculating the potential LNAPL velocity using Darcy’s Law. The key parameter, which is the LNAPL conductivity, may be estimated from bail down tests, or from the measured LNAPL thickness, soil capillary parameters and model that assumes static equilibrium. The API Interactive LNAPL Guide is one tool that may be used to estimate the LNAPL velocity using this model. Some guidance documents have suggested that the calculated LNAPL velocity be compared to a de minimus LNAPL velocity below which one would generally not be concerned withcompared to a de minimus LNAPL velocity below which one would generally not be concerned with LNAPL mobility. It is important to recognize that use of Darcy’s Law would be precluded for some site conditions, such as a fractured bedrock site.
New emerging method for estimating LNAPL tracer dilution method
67

No associated notes.

The third line of evidence is to compare the measured LNAPL thickness to a calculated threshold LNAPL thi k i ll i d t i d t t b d th di l t tLNAPL thickness in wells required to invade water-wet pores based on the displacement entry pressure model. There is still some debate on the use of the this model as indicated earlier in this training.
The fourth line of evidence are recovery rates observed as LNAPL is removed from a well. Although not directly correlated to LNAPL mobility, declining recovery rates would generally indicate reduced potential for LNAPL mobility
The fifth line of evidence is the age of the release, when known. If a relatively long time has transpired since the release there is reduced potential for mobility due to smearing of LNAPL within soil and weathering of LNAPL through dissolution, biodegradation and volatilization
The sixth line of evidence are field and laboratory tests. While these a indirect indicators, if for example measured LNAPL saturations are less than residual saturation obtained from centrifuge test,
fthen there will likely be little potential for LNAPL mobility. However, these tests are approximate and for example centrifuge tests would tend to over predict mobility
69

The third line of evidence is to compare the measured LNAPL thickness to a calculated threshold LNAPL thi k i ll i d t i d t t b d th di l t tLNAPL thickness in wells required to invade water-wet pores based on the displacement entry pressure model. There is still some debate on the use of the this model as indicated earlier in this training.
The fourth line of evidence are recovery rates observed as LNAPL is removed from a well. Although not directly correlated to LNAPL mobility, declining recovery rates would generally indicate reduced potential for LNAPL mobility
The fifth line of evidence is the age of the release, when known. If a relatively long time has transpired since the release there is reduced potential for mobility due to smearing of LNAPL within soil and weathering of LNAPL through dissolution, biodegradation and volatilization
The sixth line of evidence are field and laboratory tests. While these a indirect indicators, if for example measured LNAPL saturations are less than residual saturation obtained from centrifuge test,
fthen there will likely be little potential for LNAPL mobility. However, these tests are approximate and for example centrifuge tests would tend to over predict mobility
70

The next three slides present case studies on LNAPL mobility. Before looking at specific cases, the l b ti th tgeneral observations are that:
LNAPL can initially spread at rates higher than groundwater flow
LNAPL can spread in the opposite direction to groundwater flow direction due to mounding of LNAPL and radial spreading, and finally,
LNAPL bodies tend to come to stable configurations in relatively short time periods
71

The second case example is measured data at a pipeline site crude oil release. The upper left figure i l h i th d i th LNAPL thi k ti Th t th dis a plan showing the spread in the LNAPL thickness over time. The grey area represents the spread between when the release occurred, in February 2000 and October 2001. The blue and yellow zone represents the additional spreading between October 2001 and December 2002. An important characteristic shown in this figure is that the LNAPL spreads radially from the release location and not only in the direction of groundwater flow.
The figure in the lower right shows the estimated rate of LNAPL spreading, which initially was on the order of a few feet per day and after about a year and half decreased to few feet per yearorder of a few feet per day, and after about a year and half, decreased to few feet per year.
After December 2002, no additional LNAPL was observed to migrate in sentinel wells surrounding the release area. The LNAPL plume is considered to be functionally stable, which refers to a state or condition where there is some vertical and lateral redistribution of LNAPL, but where additional movement is relatively minor and should not impact ongoing plume management objectives.
The dissolved concentrations in groundwater are also monitored routinely and indicate that the dissolved plume is also reaching a stabilized footprint around the LNAPL smear zone. The dissolved plume behavior can be used to infer LNAPL stability, if dissolved plume is stable or shrinking, the LNAPL is unlikely to be expanding.
72

The smaller thickness recorded by the LIF tool is consistent with notion that the oil previously met th iti l thi k b t th i h d d th thi kthe critical thickness, but weathering has reduced the thickness.
The oil is meets the critical thickness at location TG1126, but spreading from there to TG1102 is sufficient to meet the criteria. A UVOST LIF probe near TG1102 was non-detect on oil
UVOST can only detect aromatics like BTEX up to and including Naphthalene. TarGOST can only see the PAHs from Naphthalene to larger multiple-ring aromatics.
73
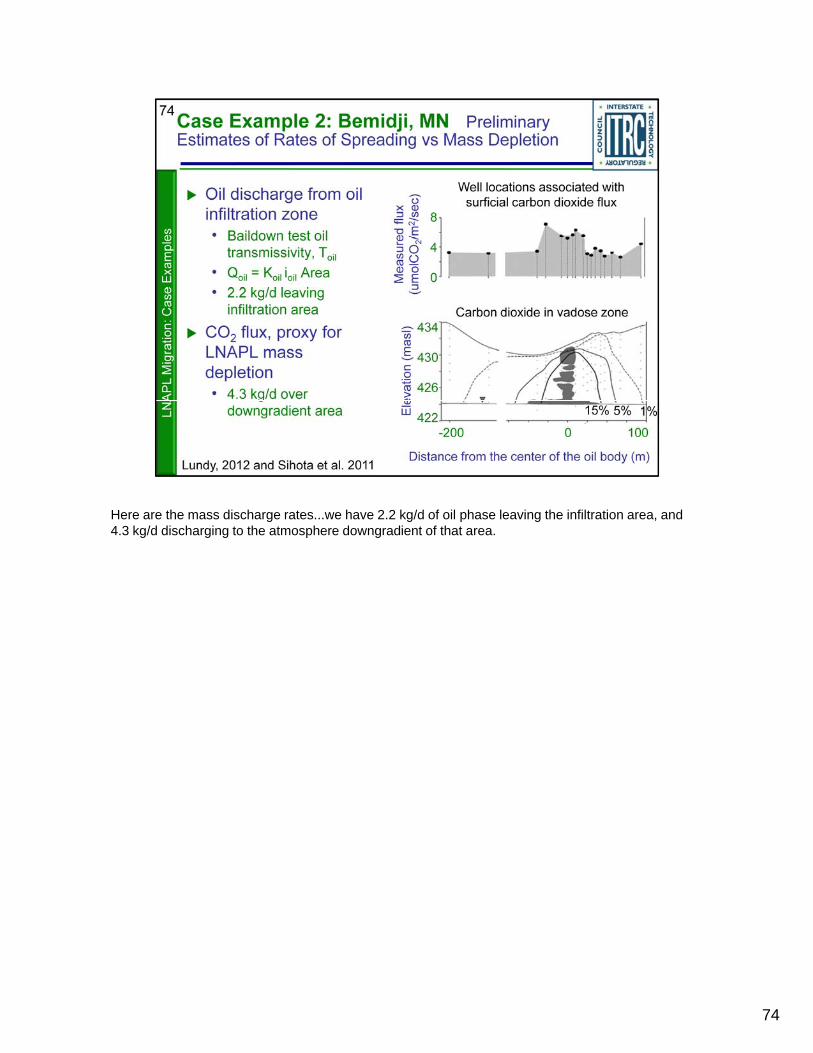
Here are the mass discharge rates...we have 2.2 kg/d of oil phase leaving the infiltration area, and 4 3 k /d di h i t th t h d di t f th t4.3 kg/d discharging to the atmosphere downgradient of that area.
74
No associated notes.
75

When is hydraulic recovery feasible? What is a practicable endpoint for recovery?
76

Thickness “seems” like a good indicator… but it’s not.
77

Borrowing a concept from groundwater hydrology.
T is the fluid discharge per unit width, per unit gradient, over the fluid-bearing interval.
78

Just like Darcy’s Law, applied to LNAPL instead of water.
qn = LNAPL flow per unit area perpendicular to flow/gradientqn p p p g
Qn = LNAPL discharge per unit width perpendicular to flow/gradient
in = LNAPL gradient
bn = LNAPL formation thickness
Transmissivity combines aquifer conditions, LNAPL saturation, and LNAPL properties into a single yardstick.
The graphic at the right shows both a soil core and a monitoring well under ultraviolet light.
The LNAPL conditions in the soil and well fluoresce.
The typical LNAPL saturation profile illustrates saturation over the vertical interval.
Highest LNAPL saturation has highest conductivity.
Low saturation = low conductivity
H d li i ti l t T d i t i di t d t l b LNAPL llHydraulic recovery is proportional to T, and is not indicated accurately by LNAPL well thickness

Choice of thickness depends on LNAPL condition.
It should be the thickness of the LNAPL-bearing interval.
Confined and perched.
80
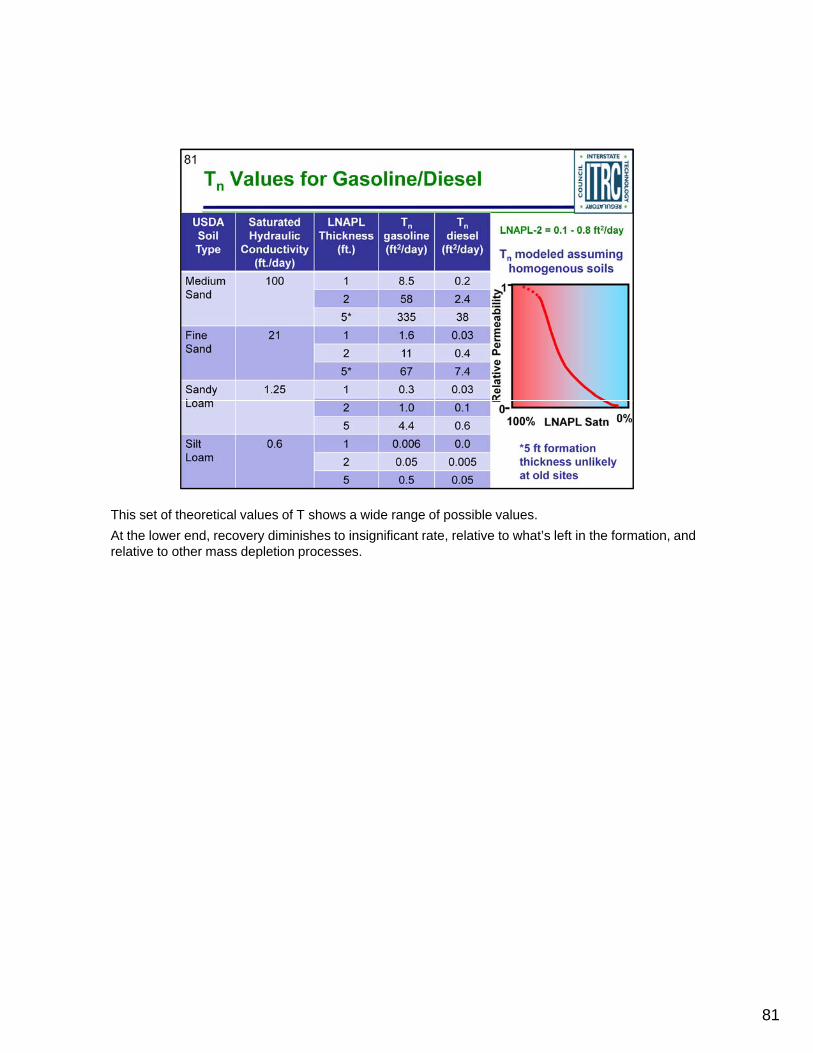
This set of theoretical values of T shows a wide range of possible values.
At the lower end, recovery diminishes to insignificant rate, relative to what’s left in the formation, and relative to other mass depletion processes.
81

As T goes to low values, more of the LNAPL source zone is in a residually-saturated state (f ti ll i bil )(functionally immobile).
Like a sponge that has drained but is still wet.
82

Water table rises, LNAPL thickness increases.
83

No associated notes.
84

No associated notes.
85

No associated notes.
86

No associated notes.
87

No associated notes.
88

No associated notes.
89

MNA was understood before NSZD.
Incorrectly assumed that most biodegradation happened in the saturated zone.
90

Measured rates, based on CO2 emissions, are much higher than expected based on dissolved h fl l Wh t i h i h ?phase fluxes alone. What is happening here?
91

Flux of vapors, and subsequent biodegradation of vapors and byproducts, is how most mass d l tidepletion occurs.
92

Methane is generated by anaerobic degradation. Methane migrates upward and is aerobically idi d Th th id ti b th t t bl hi h d di th toxidized. The methane oxidation zone can be near the water table, or higher, depending on the rate
of CH4 and VOC production, and also if there are shallow soil impacts.
93
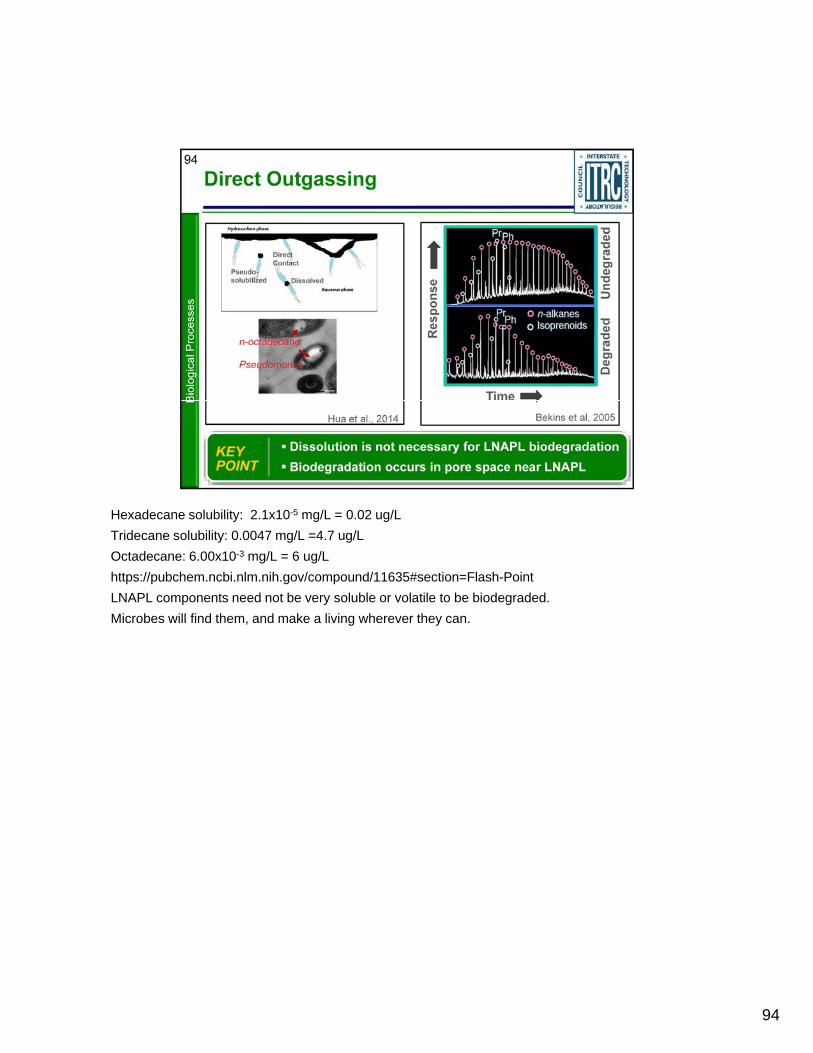
Hexadecane solubility: 2.1x10⁻⁵ mg/L = 0.02 ug/L
Tridecane solubility: 0.0047 mg/L =4.7 ug/L
Octadecane: 6.00x10⁻³ mg/L = 6 ug/L
https://pubchem.ncbi.nlm.nih.gov/compound/11635#section=Flash-Point
LNAPL components need not be very soluble or volatile to be biodegraded.
Microbes will find them, and make a living wherever they can.
94

LNAPL exists in many conditions
95

Our 3-part training series focuses on helping you:
- Connect Science to LNAPL Site Management
- Build your LNAPL Conceptual Site Model
- Select/Implement LNAPL Remedies
After this training the expectation is that you will have the skills and knowledge to use the ITRC science-based resources improve decision making at your LNAPL sites (and for you regulators and other government agency staff, look at ways you can incorporate ITRC states guidance into your own guidance).
P t 1 A I d U d t di f LNAPL B h i i th S b f C ti th S i t M i SitPart 1: An Improved Understanding of LNAPL Behavior in the Subsurface - Connecting the Science to Managing Sites
- Explains how LNAPL behaves in the subsurface
- Examines what controls their behavior
- Explains what LNAPL data can tell you about the LNAPL and site conditions
- Relevant and practical examples are used to illustrate key concepts
Part 1 explains how LNAPLs behave in the subsurface and examines what controls their behavior. Part 1 also explains what LNAPL data can tell you about the LNAPL and site conditions. Relevant and practical examples are used to illustrate key concepts.
Part 2: LNAPL Conceptual Site Models and Remedial Decision Framework - Do you know where the LNAPL is and how to address LNAPL concerns?
•Addresses LNAPL conceptual site model (LCSM) development and the overall framework for making LNAPL remediation and management decisions
•Discusses key LNAPL and site data•Discusses key LNAPL and site data
•When and why those data may be important
•How to effectively organize the data into an LCSM
•Discusses how to resolve LNAPL concerns by selecting appropriate goals and objectives, choosing applicable technologies, and assigning remedial performance metrics and endpoints
•Concludes with a special focus on LNAPL Transmissivity and how it may be used to improve LNAPL decision making
Part 2 addresses LNAPL conceptual site model (LCSM) development as well as the overall framework for making LNAPL remediation and management decisions. Part 2:
discusses key LNAPL and site data
when and why those data may be important, and
how to effectively organize the data into an LCSM.
Part 2 also discusses how to resolve LNAPL concerns by selecting appropriate goals and objectives, choosing applicable technologies, and assigning remedial performance metrics and endpoints. Part 2 concludes with a special focus on LNAPL Transmissivity and how it may be used to improve LNAPL decision making.
Part 3: Using LNAPL Science, the LCSM, and LNAPL Goals to Select an LNAPL Remedial Technology
•Fosters informed remedial technology selection and appropriate technology application. Part 3:
• Discusses remedial technology groups
• Introduces specific remedial technologies
• Provides a framework for technology selection
• Introduces a series of tools to screen the several remedial technologies addressed in the updated ITRC document
•A case study demonstrates the use of these tools for remedial technology selection, implementation, and demonstration of successful remediation
Part 3 of the training fosters informed remedial technology selection and appropriate technology application. Part 3:
• discusses remedial technology groups,
• introduces specific remedial technologies,
• provides a framework for technology selection, and
• introduces a series of tools to screen the several remedial technologies addressed in the updated ITRC document.
A case study demonstrates the use of these tools for remedial technology selection, implementation, and demonstration of successful remediation.
96

No associated notes.
97

Links to additional resources:
http://www.clu-in.org/conf/itrc/LNAPL-3/resource.cfm
Your feedback is important – please fill out the form at:
http://www.clu-in.org/conf/itrc/LNAPL-3/feedback.cfm
The benefits that ITRC offers to state regulators and technology developers, vendors, and consultants include:
Helping regulators build their knowledge base and raise their confidence about new environmental technologies
Helping regulators save time and money when evaluating environmental technologies
Guiding technology developers in the collection of performance data to satisfy the requirements of multiple states
Helping technology vendors avoid the time and expense of conducting duplicative and costly demonstrations
Providing a reliable network among members of the environmental community to focus on innovative environmental technologies
How you can get involved with ITRC:
Join an ITRC Team – with just 10% of your time you can have a positive impact on the regulatory process and acceptance of innovative technologies and approaches
Sponsor ITRC’s technical team and other activities
98
p
Use ITRC products and attend training courses
Submit proposals for new technical teams and projects