Embed Size (px)
Citation preview

Connecticut Office of Early Childhood Report on Changing the Kindergarten Entry Date
Legislative Charge
Current legislation requires all public schools be open to children who turn five on or before January 1st
of any school year (C.G.S. Sec.10-15c) and that public schools provide half-day kindergarten
programming for at least 180 days for 450 hours of actual schoolwork during each year. If a public
school chooses to offer full-day kindergarten, it must provide 900 hours of schoolwork for at least 180
days. (C.G.S. Sec. 10-15).
Public Act 14-39, Sec. 9 requires the Office of Early Childhood (OEC) to develop, in consultation with the
State Department of Education, a plan for changing the date by which children must reach five years of
age from January 1st to October 1st in order to be eligible to enroll in kindergarten for that school year.
In addition, the OEC must include a plan for the creation of spaces in school readiness programs and
public and private prekindergarten programs for children affected by the change in entry date.
A reason often cited for changing the entry date is that Connecticut currently has one of the latest entry
dates in the country. According to the Education Commission of the States (2013), Connecticut has the
latest cutoff date of any state with set kindergarten entry date. However, it should be noted that seven
states allow school districts to decide upon the kindergarten entry date locally (Massachusetts, New
Hampshire, New Jersey, New York, Ohio, Pennsylvania, Vermont). A change in entry date may make
comparisons of the data on national assessment measures more relevant.
Options for Implementing a Change in Kindergarten Entry Date
Immediate Change In Entry Date
Immediately changing the cut-off date for entry to kindergarten would result in approximately 6,500
children not being eligible for kindergarten (based upon 2014-2015 enrollment data).
Phase-in
Below is a chart summarizing the projected number of children who would be affected by phasing in a
kindergarten entry date of October 1. This plan to phase in the new entry age would be implemented by
gradually rolling back the kindergarten entry age date by one month each year over three years. The
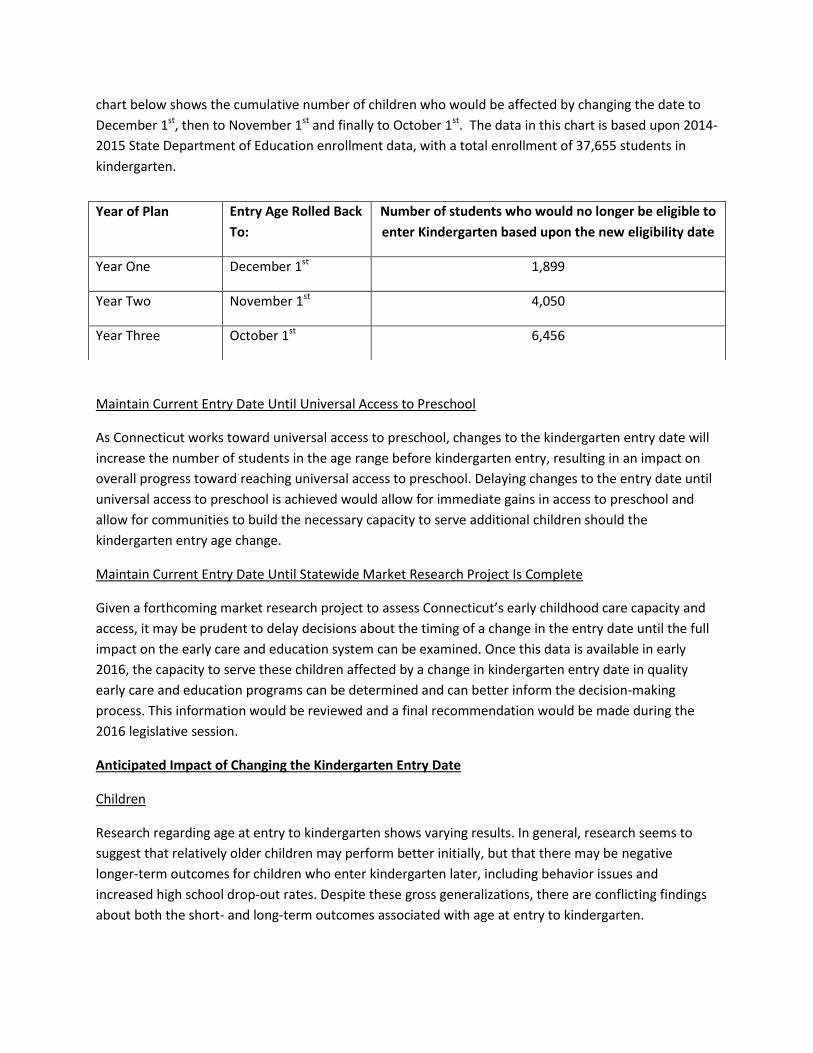
chart below shows the cumulative number of children who would be affected by changing the date to
December 1st, then to November 1st and finally to October 1st. The data in this chart is based upon 2014-
2015 State Department of Education enrollment data, with a total enrollment of 37,655 students in
kindergarten.
Maintain Current Entry Date Until Universal Access to Preschool
As Connecticut works toward universal access to preschool, changes to the kindergarten entry date will
increase the number of students in the age range before kindergarten entry, resulting in an impact on
overall progress toward reaching universal access to preschool. Delaying changes to the entry date until
universal access to preschool is achieved would allow for immediate gains in access to preschool and
allow for communities to build the necessary capacity to serve additional children should the
kindergarten entry age change.
Maintain Current Entry Date Until Statewide Market Research Project Is Complete
Given a forthcoming market research project to assess Connecticut’s early childhood care capacity and
access, it may be prudent to delay decisions about the timing of a change in the entry date until the full
impact on the early care and education system can be examined. Once this data is available in early
2016, the capacity to serve these children affected by a change in kindergarten entry date in quality
early care and education programs can be determined and can better inform the decision-making
process. This information would be reviewed and a final recommendation would be made during the
2016 legislative session.
Anticipated Impact of Changing the Kindergarten Entry Date
Children
Research regarding age at entry to kindergarten shows varying results. In general, research seems to
suggest that relatively older children may perform better initially, but that there may be negative
longer-term outcomes for children who enter kindergarten later, including behavior issues and
increased high school drop-out rates. Despite these gross generalizations, there are conflicting findings
about both the short- and long-term outcomes associated with age at entry to kindergarten.
Year of Plan Entry Age Rolled Back
To:
Number of students who would no longer be eligible to
enter Kindergarten based upon the new eligibility date
Year One December 1st 1,899
Year Two November 1st 4,050
Year Three October 1st 6,456

Many studies show short-term differences are minimal and often explained by other factors such as
preschool experience. In addition, some show that initial differences in skills based upon age at
kindergarten entry fade over time. A working paper regarding age at kindergarten entry by Cook and
Songman in the National Bureau of Economic Research (2013) found that children in North Carolina
born just after the cut-off date outperformed children born just before the cutoff date and were less
likely to engage in juvenile delinquency. However, children who just missed the cutoff date were more
likely to drop out of high school and commit a felony offense by 19 years of age.
Overall, there is not a consistent body of research evidence to inform decisions about a change in the
kindergarten entry date as a means of promoting positive outcomes for children. An annotated
bibliography of relevant research and literature reviews is included in Appendix A and can be referenced
for specific findings.
Three-Year-Olds
While policies could prioritize enrollment in state-funded programs for children who would have
previously been able to enter kindergarten, unless there is increased capacity for early care and
education in communities, space will not be available for children on the younger end of preschool
(eligible 3-year-olds) to begin their early education experience. The result may further inequities, with
children whose families cannot afford to pay for private early care and education losing access to state-
funded spaces when their child is 3 years of age. Research supports that children who have two years of
preschool have better outcomes. By changing the kindergarten entry age, many younger children may
not have access to state-funded early care and education, decreasing their time spent in preschool and
possibly affecting their future academic and lifelong success.
State and Municipalities
For 2015, there were an estimated 73,375 3- and 4-year-olds living in Connecticut. Of those 73,375, 43%
(31,502) received state- or federal-funded early care and education programming (School Readiness,
Child Day Care Centers and federal Head Start) or through the public school system. Based on this
information, it can be assumed that approximately 2,795 children (43% of the 6,500 children who would
not be eligible to attend kindergarten for an additional year) would require an additional year of publicly
funded early care and education funding. Based on the current utilization of publicly funded early care
and education programming, the total estimated cost to the state and municipalities is $23,863,033.
Families
The families of approximately 6,500 4-year-old children in Connecticut whose birthdays fall between
October 2 and December 31 will be affected by a change in the kindergarten entry date. As a result of a
change in the kindergarten entry age, these children will not be able to attend kindergarten for an
additional year, resulting in families needing to place their children in alternate child care for another
year.

Families who are able to enroll in state-funded School Readiness or Child Day Care Center programs
(approximately 1,274 children or 19.6% of the 6,500 children who would not be eligible to attend
kindergarten for an additional year) will receive some financial assistance, but will be responsible for an
additional year of family fees charged to parents associated with the program. Family fees are calculated
and based upon a family’s size and income and can range from $8 per week ($416 per year) to $200 per
week ($10,400 per year) based on the 2014-2015 Income Guidelines and per-Child Fee Schedule for
children attending full-time preschool services through state-funded School Readiness or Child Day Care
Center programs.
In addition, approximately 15% of families choose not to send their children to early childhood care
programs. This means approximately 975 five-year-olds (15% of 6,500 children who would not be
eligible to attend kindergarten for an additional year) would not enter a school setting for an additional
year, delaying their early learning and possibly impacting their academic and life-long trajectory.
A change in the kindergarten entry date will have a significant financial impact on families, specifically
working and middle-class families who are not eligible for state subsidies or have no access to other
publicly-funded free or low-cost child care options. Based on the information above, families of the
remaining 2,730 children would have to pay for another year of care for their children. A fee analysis
conducted by United Way of Connecticut in 2013 found the average weekly cost of full-day center-based
preschool is $210.65 with an annual cost of $10,953.80. The analysis also found the cost of full-day
center-based preschool ranged from $100 per week ($5,200 per year) to $456 per week ($23,712 per
year). Additionally, the average weekly cost of full-day family-based preschool is $179.94 with an annual
cost of $9,356.88. For full-day family-based preschool the cost ranged from $80 per week ($4,160 per
year) to $400 per week ($20,800 per year). In addition, private early care settings (early care programs
not receiving public funding) are of unknown quality, possibly delaying high-quality early education
experiences for 2,730 children, which could have an impact on their academic and life-long success.
Achievement Gap
Without a guarantee of a no-cost, state-funded or affordable preschool opportunity, this change will
have a financial impact on many families, most significantly for working and middle-class families. More
children in wealthier school districts are held out of kindergarten by their parents who can presumably
pay for an additional year of high-quality preschool. However, working and middle-class families who do
not qualify for state-funded programs would incur the cost of an additional year of early care and
education or would be unable to afford such a cost, further delaying their child’s entry to early
education by yet another year. The resulting inequity in years of preschool experience could cause an
increase in the disparity in school preparedness, further widening the achievement gap between
Connecticut’s wealthy and poor children, which is already the largest in the nation.
Availability of Early Care and Education
Given all of the considerations mentioned above, the availability of early care and education in
Connecticut is a critical consideration in deciding when a change in kindergarten entry date should be
implemented. As the state moves toward providing universal access to preschool, plans for an

integrated system of early care and education are in process. An integral part of this process is a market
research project to assess the capacity of early childhood care and education services in Connecticut and
access to these services for families. The information from this study, which will examine the capacity of
early care and education providers across communities, as well as assess the needs of families, is vital to
making a fully informed decision about a change in kindergarten entry date and the effect on children,
families, communities and schools. This study is projected to be completed in early 2016.
Some recent changes in the availability of high-quality preschool are noted below, however, without
further information about the needs of families and the capacity of school and community programs to
add spaces, the true effect of these new programs on the overall availability of early care and education
cannot be determined:
Recent efforts to expand preschool services in School Readiness communities have resulted in
approximately 2,000 additional spaces over the last three years.
The Preschool Development Grant awarded to Connecticut provides funds for 4-year-olds in 13
communities serving an additional 428 children and improving the quality of the early care and
education experience for 284 children. These spaces will be available for children in the 13
communities beginning Fall 2015.
The new Smart Start initiative provides additional preschool spaces for approximately 400
preschoolers in 14 school districts with potential funding to expand to more communities
statewide, possible serving an additional 1,600 students. These spaces will be available for
children in the 14 communities beginning Fall 2015.
School Districts
Changing the entry date would result in declining kindergarten enrollment in public schools as
fewer children would be eligible to enter kindergarten. Appendix B includes data by district.
Approximately 15% of 3- and 4-year-olds in Connecticut attend preschool provided through the
public school system. This means public schools would have to expand their preschool
programming by 975 seats statewide to accommodate the retention of 5-year-olds for an
additional year at an estimated cost of $8,700,900 based on the State Fiscal Year 2016 School
Readiness full-day full-year rate ($8,924 per year).
Critical Considerations
Compulsory Age and Opt-Out Provisions
While the compulsory age of school enrollment in Connecticut is 5 years of age, C.G.S. Sec. 10-184
allows parents of a child who is 5 years of age the option not to send their child to school until the child
is 6 or 7 years old. If families choose not to send their child when the child is age-eligible, they must go
to the school district and sign an option form. This practice is commonly known as “redshirting.” During
the 2014-2015 school year, 3,229 children enrolled in kindergarten in Connecticut were eligible to
attend kindergarten in a previous year (this data excludes children who were retained). This practice
occurs much more frequently in wealthier districts and is relatively uncommon in poorer urban districts

(see Appendix C). This may be due to the ability of families in wealthier districts to pay for an additional
year of early care and education and the inability of families in poorer urban districts to fund an
additional year of preschool.
Typically, a kindergarten classroom will have an age range of one year; however, as a result of red-
shirting, the age range in a kindergarten classroom is often much greater, resulting in possible
implications for curriculum and instructional supports (see section below). Research into redshirting has
been inconclusive regarding the impact on students (see Appendix A for an annotated bibliography),
although higher rates of redshirting for children who are white, male and higher in socio-economic
status are frequently cited.
Curriculum and Instructional Supports
Setting a specific cut-off date for enrollment in kindergarten would typically be expected to result in a
one-year age span in kindergarten classrooms. Having a consistent age span allows districts to establish
curricular and instructional practices that are age-appropriate for the majority of children in this age
span, and to differentiate based upon natural variation and special needs. However, if lower income
students who cannot afford to pay for an extra year of preschool enter kindergarten on time while
students whose families have the resources to attend another year of preschool are held out, the result
is a wide disparity in age and experience for children in kindergarten classrooms. This disparity may
impact the instructional and curriculum practices in kindergarten classrooms and may further contribute
to the preparation gap. In addition, the capacity of early care and education settings to provide
curriculum and instruction appropriate to those children who are currently age eligible for kindergarten,
as well as for preschool-age children, must be considered.
Recommendations
1. The OEC recommends that the effective date of a change in kindergarten entry date be determined
following the results of the market research project to assess Connecticut’s early childhood care
capacity and access.
2. The OEC recommends that when an appropriate time frame for changing the kindergarten entry date
is determined, the change be phased in one month increments over the course of three consecutive
years to allow time for families, schools and communities to adequately absorb and prepare for the
changes.
3. The OEC recommends that the provision that allows parents to wait to have their children attend
kindergarten until that child is age 6 or 7 be eliminated. While current law requires parents to go to the
school to exercise this option, this is not standard practice. A separate waiver provision, in current law,
allows for local or regional school boards to vote to waive the minimum age requirement will remain
intact and can be expanded to allow for boards to also vote to waive the maximum age requirement on
a case-by-case basis. This change would affect approximately 3,229 children, disproportionately in the
wealthier districts. Data on the prevalence of redshirting by district is available in Appendix C.

Appendix A: Annotated Bibliography
Age of Entry to Kindergarten
Aliprantis, Dionissi (2010). Redshirting, Compulsory Schooling Laws, and Educational Attainment.
Working paper of the Federal Reserve Bank of Cleveland.
Using data from the Early Childhood Longitudinal Study (ECLS-K), the author finds an inability to
determine the effects of educational attainment using date of birth.
Angrist, Joshua and Krueger, Alan. (1991). Does Compulsory School Attendance Affect School and
Earnings? Oxford University Press: The Quarterly Journal of Economics, Volume 106, Number 5.
This research concludes that students who are required to attend school longer earn higher wages.
Bedard, Kelly and Dhuey, Elizabeth. (2006). The Persistence of Early Childhood Maturity: International
Evidence of Long-Run Age Effect. The Quarterly Journal of Economics Volume 121, Number 4, pp.
1437-1472.
This study across Organisation for Economic Co-operation and Development (OECD) countries found
that older students scored higher on fourth grade tests and are more likely to enroll in higher education.
Researchers noted that in the United States 5% of children enter kindergarten a year late and many of
those entering late were from the top socioeconomic strata. As a result of this distribution an
unbalanced number of the youngest children in kindergarten in the US are from low socioeconomic
groups.
Black, Sandra; Devereux, Paul; and Salvanes, Kjell. (2011). Too Young to Leave the Nest? The Effects
of School Starting Age. The Review of Economics and Statistics, Volume 93, Number 2, 455–467.
Norwegian researchers found that the effects of an older school starting age include reduced earnings
until 30 years of age, limited impact on educational attainment, increased probability of teen pregnancy
and improved mental health for boys at 18. The researchers concluded that there was not much
evidence to support delayed entry to school.
Cannon, Jill S. & Lipscomb, S. (2008). Changing the Kindergarten Cutoff Date: Effects on California
Students and Schools. Public Policy Institute of California.
Researchers summarized 14 studies and found delayed entry to kindergarten has a positive effect on
elementary and middle school test scores. Findings included that more advantaged students derive the
greatest benefits and that this finding could lead to an increased achievement gap. It was also pointed
out that delayed entry can lead to less education completed for those that drop out. Additionally, that
moving the date is not likely to affect overall grade retention or special education enrollment rates.
Cook, Philip J. & Kang, Songman. (2013). Birthdays, Schooling, and Crime: New Evidence of the
Droput-Crime Nexus. National Bureau of Economic Research.
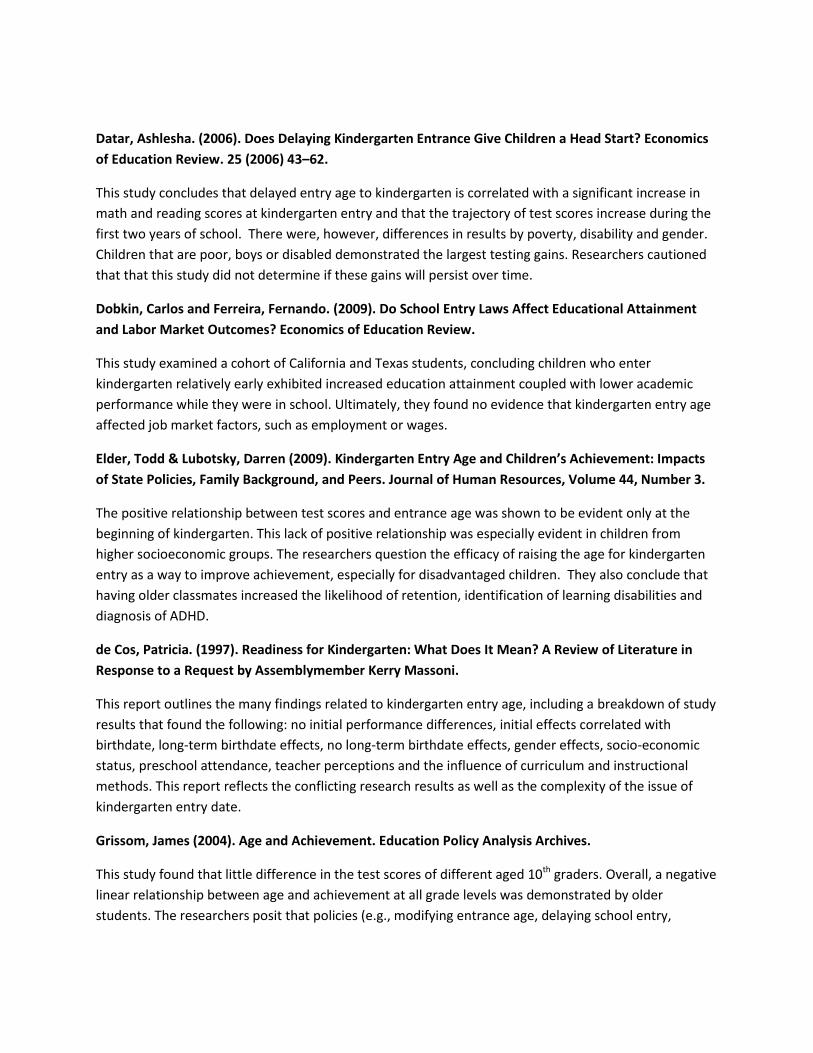
Datar, Ashlesha. (2006). Does Delaying Kindergarten Entrance Give Children a Head Start? Economics
of Education Review. 25 (2006) 43–62.
This study concludes that delayed entry age to kindergarten is correlated with a significant increase in
math and reading scores at kindergarten entry and that the trajectory of test scores increase during the
first two years of school. There were, however, differences in results by poverty, disability and gender.
Children that are poor, boys or disabled demonstrated the largest testing gains. Researchers cautioned
that that this study did not determine if these gains will persist over time.
Dobkin, Carlos and Ferreira, Fernando. (2009). Do School Entry Laws Affect Educational Attainment
and Labor Market Outcomes? Economics of Education Review.
This study examined a cohort of California and Texas students, concluding children who enter
kindergarten relatively early exhibited increased education attainment coupled with lower academic
performance while they were in school. Ultimately, they found no evidence that kindergarten entry age
affected job market factors, such as employment or wages.
Elder, Todd & Lubotsky, Darren (2009). Kindergarten Entry Age and Children’s Achievement: Impacts
of State Policies, Family Background, and Peers. Journal of Human Resources, Volume 44, Number 3.
The positive relationship between test scores and entrance age was shown to be evident only at the
beginning of kindergarten. This lack of positive relationship was especially evident in children from
higher socioeconomic groups. The researchers question the efficacy of raising the age for kindergarten
entry as a way to improve achievement, especially for disadvantaged children. They also conclude that
having older classmates increased the likelihood of retention, identification of learning disabilities and
diagnosis of ADHD.
de Cos, Patricia. (1997). Readiness for Kindergarten: What Does It Mean? A Review of Literature in
Response to a Request by Assemblymember Kerry Massoni.
This report outlines the many findings related to kindergarten entry age, including a breakdown of study
results that found the following: no initial performance differences, initial effects correlated with
birthdate, long-term birthdate effects, no long-term birthdate effects, gender effects, socio-economic
status, preschool attendance, teacher perceptions and the influence of curriculum and instructional
methods. This report reflects the conflicting research results as well as the complexity of the issue of
kindergarten entry date.
Grissom, James (2004). Age and Achievement. Education Policy Analysis Archives.
This study found that little difference in the test scores of different aged 10th graders. Overall, a negative
linear relationship between age and achievement at all grade levels was demonstrated by older
students. The researchers posit that policies (e.g., modifying entrance age, delaying school entry,

implementing transitional kindergarten or first grade programs, retaining students to improve
educational achievement) have adverse effects on educational achievement.
Lincove, Jane and Painter, Gary (2006). Does the Age that Children Start Kindergarten Matter?
Evidence of Long-term Educational and Social Outcomes. Educational Evaluation and Policy Analysis,
Volume 28, Number 2, pp. 153-179.
This study, using data from the National Education Longitudinal Survey, examined the long-term effects of school entry age on educational and social outcomes. The results of the study suggest that there is no long-term advantage to delayed entry to school. National Center for Education Statistics (2000). Children who Enter Kindergarten Late or Repeat
Kindergarten: Their Characteristics and Later School Performance.
Using 1993 and 1995 survey data, this study showed that when demographic, socioeconomic and
developmental factors were controlled for, there were no differences between students who had a
delayed entry to kindergarten and other first and second-grade students.
Narahara, May. (1998). Kindergarten Entrance Age and Academic Achievement. California State
University, Long Beach, CA. ERIC Digest 421 218.
This review of literature examines the following questions: (1) How does the entrance age of kindergarten children affect academic achievement?; (2) Do age-eligible older students perform better academically than younger students?; (3) Do year-older or "red-shirted" students have an academic advantage over younger students?; and (4) Do transitional programs such as pre-kindergarten and pre-first or junior first grade promote achievement for immature, high-risk students? Recommendations included reduction in kindergarten class size, improvements in developmentally
appropriate teaching in kindergarten, increased administrative knowledge of best practice and current
research to help guide families and teachers in their decision making, vertical alignment of preschool
and kindergarten.
NICHD Early Child Care Research Network (2007). Age of Entry to Kindergarten and Children’s
Academic Achievement and Socioemotional Development.
This study showed modest differences in academic achievement related to age of entry to kindergarten
and no relationship to social functioning, all of were measured across the first three years of school.
Stipek, Deborah & Byler, Patricia (2001). Academic Achievement and Social Behaviors Associated with
Age of Entry into Kindergarten. Applied Developmental Psychology. 22, 175-189.
This study demonstrated modest advantages in academic achievement for children who entered
kindergarten at older ages, but noted that this advantage disappeared by third grade. The only
advantage found in K and 3rd for older students were additional positive feelings about their teacher.

Zhang, Jiahui and Xin, Tao (2012). Boosting Early Development: The Mixed Effects of Kindergarten
Enrollment Age. US-China Education Review A3.
This study investigated the effects of kindergarten on cognition and problem solving. The researchers conclude that children not exposed to rich learning environments in the home had increased cognitive performance and behavior problems compared to children exposed to rich home learning environments.
Redshirting
Bassok, Daphna and Reardon, Sean F. (2013). “Academic Redshirting” in Kindergarten: Prevalence,
Patterns & Implications.
Using nationally-representative datasets, researchers found that between 4 and 5.5 percent of children
have a delayed entry to kindergarten. The children most likely to experience delayed entry are white,
male and high socioeconomic status. Low income families are less likely to delay entry due to cost. The
impact on learning of delayed entry students is mixed and additional research is necessary.
Dougan, Kelli and Pijanowski, John (2011). The Effects of Academic Redshirting and Relative Age on
Student Achievement. National Council of Professors of Educational Administration.
This article notes that redshirted children have advantages by virtue of their relative age when
compared to younger classmates. Redshirting is more likely to be practiced by those of higher
socioeconomic means; this could likely lead to increases in the achievement gap between poor and
more wealthy children. Redshirting does have advantages for individual children.
Range, Bret, Dugan, Kelli, and Pijanowski, John (2011). Rethinking Grade Retention and Academic
Redshirting: Helping School Administrators Make Sense of What Works. National Council of
Professors of Educational Administration.
This article compares the characteristics of redshirted and retained students and provides
recommendations to those who make decisions to redshirt or retain. The authors cite the importance of
using research and not intuition when making these decisions and the difficulty in doing so due to
inclusive research findings.

Appendix B: Projected Number of Children Affected by a Change in Kindergarten Entry Date by Month, Based Upon
CT State Department of Education Enrollment Data for 2014-2015
District Name
Total Number of
Children Affected by
an October 1 Cut-Off Date
Children Affected by
Rolling Back the Date to
October 1 Cut-Off Date
Children Affected by
Rolling Back the Date to
November 1 Cut-Off Date
Children Affected by
Rolling Back the Date to
December 1 Cut-Off Date
Amistad Academy District 20 9 7 4
Andover School District 3 1
2
Ansonia School District 36 16 13 7
Ashford School District 7 1 1 5
Avon School District 25 9 9 7
Barkhamsted School District 3 2 1 Berlin School District 28 8 13 7
Bethany School District 9 2 4 3
Bethel School District 29 13 7 9
Bloomfield School District 28 12 8 8
Bolton School District 6 3 2 1
Booker T Washington Academy District 10 4 5 1
Bozrah School District 1 1 Branford School District 25 15 8 2
Brass City Charter School District 8 4 2 2
Bridgeport Achievement First District 16 6 3 7
Bridgeport School District 406 150 127 129
Bristol School District 123 38 41 44
Brookfield School District 14 6 4 4
Brooklyn School District 7 2 5 Canaan School District 1 1
Canterbury School District 11 3 5 3
Canton School District 10 3 5 2
Chaplin School District 3 1
2
Cheshire School District 28 12 10 6
Chester School District 4 2 2
Clinton School District 14 8 1 5
Colchester School District 25 6 12 7

District Name
Total Number of
Children Affected by
an October 1 Cut-Off Date
Children Affected by
Rolling Back the Date to
October 1 Cut-Off Date
Children Affected by
Rolling Back the Date to
November 1 Cut-Off Date
Children Affected by
Rolling Back the Date to
December 1 Cut-Off Date
Colebrook School District 3 1 0 2
Columbia School District 4 1 3 0
Cornwall School District 1 0 1 0
Coventry School District 27 9 11 7
Cromwell School District 22 10 11 1
Danbury School District 192 69 66 57
Darien School District 24 10 6 8
Deep River School District 4 2 1 1
Derby School District 22 9 3 10
East Granby School District 10 3 6 1
East Haddam School District 13 7 1 5
East Hampton School District 19 8 5 6
East Hartford School District 107 43 32 32
East Haven School District 39 18 7 14
East Lyme School District 19 10 6 3
East Windsor School District 17 4 6 7
Eastford School District 3 1 1 1
Easton School District 8 3 3 2
Ellington School District 24 11 8 5
Elm City Montessori School District 4 1 1 2
Enfield School District 88 26 34 28
Essex School District 3 2 1 Fairfield School District 87 44 26 17
Farmington School District 29 12 8 9
Franklin School District 6 4 1 1
Glastonbury School District 38 17 9 12
Granby School District 19 6 8 5
Greenwich School District 103 29 37 37
Griswold School District 26 9 10 7
Groton School District 98 33 35 30
Guilford School District 22 11 5 6
Hamden School District 72 27 23 22
Hampton School District 1 0 1
Hartford School District 362 121 117 124

District Name
Total Number of
Children Affected by
an October 1 Cut-Off Date
Children Affected by
Rolling Back the Date to
October 1 Cut-Off Date
Children Affected by
Rolling Back the Date to
November 1 Cut-Off Date
Children Affected by
Rolling Back the Date to
December 1 Cut-Off Date
Hartland School District 2 1 1 0
Hebron School District 8 2 3 3
Kent School District 5 5 0 0
Killingly School District 33 10 13 10
Lebanon School District 6 2 2 2
Ledyard School District 21 10 6 5
Lisbon School District 5 2 1 2
Litchfield School District 14 8 4 2
Madison School District 9 4 2 3
Manchester School District 105 32 34 39
Mansfield School District 18 6 3 9
Marlborough School District 7 3 2 2
Meriden School District 155 40 64 51
Middletown School District 83 36 26 21
Milford School District 54 19 24 11
Monroe School District 23 8 8 7
Montville School District 26 13 7 6
Naugatuck School District 56 28 13 15
New Britain School District 182 79 56 47
New Canaan School District 15 6 4 5
New Fairfield School District 17 4 8 5
New Hartford School District 6 1 4 1
New Haven School District 314 98 118 98
New London School District 61 23 16 22
New Milford School District 28 13 11 4
Newington School District 56 21 23 12
Newtown School District 18 6 8 4
Norfolk School District 2 0 1 1
North Branford School District 23 14 5 4
North Canaan School District 2 1 0 1
North Haven School District 29 9 10 10
North Stonington School District 10 3 3 4
Norwalk School District 161 53 53 55
Norwich School District 80 28 20 32

District Name
Total Number of
Children Affected by
an October 1 Cut-Off Date
Children Affected by
Rolling Back the Date to
October 1 Cut-Off Date
Children Affected by
Rolling Back the Date to
November 1 Cut-Off Date
Children Affected by
Rolling Back the Date to
December 1 Cut-Off Date
Odyssey Community School District 9 3 5 1
Old Saybrook School District 10 0 9 1
Orange School District 17 7 9 1
Oxford School District 11 3 4 4
Plainfield School District 29 8 12 9
Plainville School District 24 11 6 7
Plymouth School District 15 7 3 5
Pomfret School District 5 1 1 3
Portland School District 13 5 4 4
Preston School District 10 6 4 Putnam School District 18 4 5 9
Redding School District 1 0 0 1
Regional School District 06 11 5 4 2
Regional School District 10 5 3 1 1
Regional School District 12 5 1
4
Regional School District 13 14 6 4 4
Regional School District 14 8 5 2 1
Regional School District 15 28 9 11 8
Regional School District 16 32 13 10 9
Regional School District 17 10 4 3 3
Regional School District 18 4 1 3
Ridgefield School District 34 17 12 5
Rocky Hill School District 43 13 16 14
Salem School District 4 2 1 1
Salisbury School District 6 2 2 2
Scotland School District 3 0 2 1
Seymour School District 25 15 3 7
Sharon School District 3 3 0 0
Shelton School District 56 20 20 16
Sherman School District 6 2 2 2
Simsbury School District 22 11 4 7
Somers School District 10 2 4 4
South Windsor School District 36 20 9 7
Southington School District 42 16 19 7

District Name
Total Number of
Children Affected by
an October 1 Cut-Off Date
Children Affected by
Rolling Back the Date to
October 1 Cut-Off Date
Children Affected by
Rolling Back the Date to
November 1 Cut-Off Date
Children Affected by
Rolling Back the Date to
December 1 Cut-Off Date
Sprague School District 2 2 0 0
Stafford School District 25 8 9 8
Stamford School District 293 109 97 87
Sterling School District 7 5 2 0
Stonington School District 15 6 6 3
Stratford School District 86 35 18 33
Suffield School District 18 13 2 3
Thomaston School District 10 3 4 3
Thompson School District 11 3 4 4
Tolland School District 21 8 8 5
Torrington School District 62 29 22 11
Trumbull School District 50 23 16 11
Union School District 1 1 0 0
Vernon School District 62 20 21 21
Voluntown School District 5 2 3 0
Wallingford School District 57 15 25 17
Waterbury School District 316 114 97 105
Waterford School District 18 6 5 7
Watertown School District 28 10 11 7
West Hartford School District 80 30 30 20
West Haven School District 101 40 33 28
Westbrook School District 5 0 0 5
Weston School District 23 9 6 8
Westport School District 31 15 8 8
Wethersfield School District 36 10 15 11
Willington School District 2 0 1 1
Wilton School District 20 6 10 4
Winchester School District 15 7 7 1
Windham School District 72 25 29 18
Windsor Locks School District 16 2 7 7
Windsor School District 36 11 12 13
Wolcott School District 21 6 8 7
Woodbridge School District 10 3 5 2
Woodstock School District 18 9 6 3

District Name
Total Number of
Children Affected by
an October 1 Cut-Off Date
Children Affected by
Rolling Back the Date to
October 1 Cut-Off Date
Children Affected by
Rolling Back the Date to
November 1 Cut-Off Date
Children Affected by
Rolling Back the Date to
December 1 Cut-Off Date
Achievement First Hartford Academy Inc. District 16 6 7 3
Area Cooperative Educational Services 12 4 4 4
Capitol Region Education Council 110 45 43 22
Cooperative Educational Services 10 4 3 3
Elm City College Preparatory School District 13 5 5 3
Highville Charter School District 3 3 0 0
Integrated Day Charter School District 9 4 4 1
Jumoke Academy District 19 6 8 5
Learn 51 23 13 15
New Beginnings Inc. Family Academy District 18 8 3 7
Side By Side Charter School District 3 1 2
Total 6456 2406 2151 1899

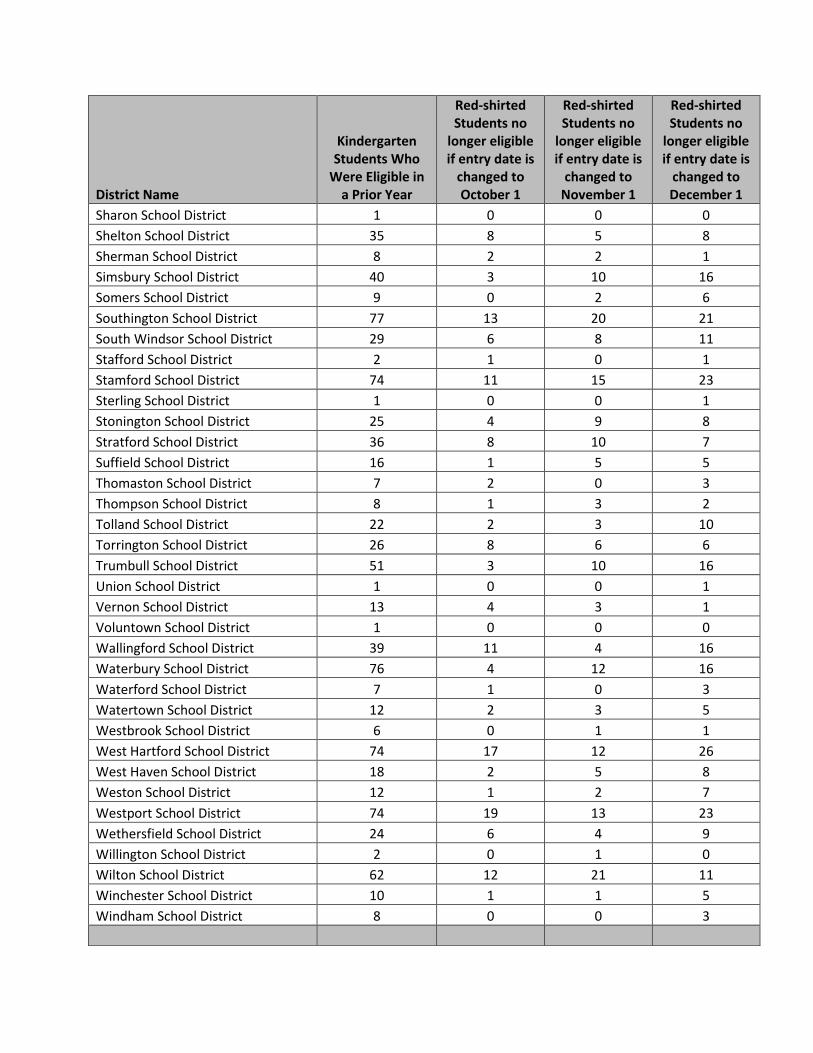
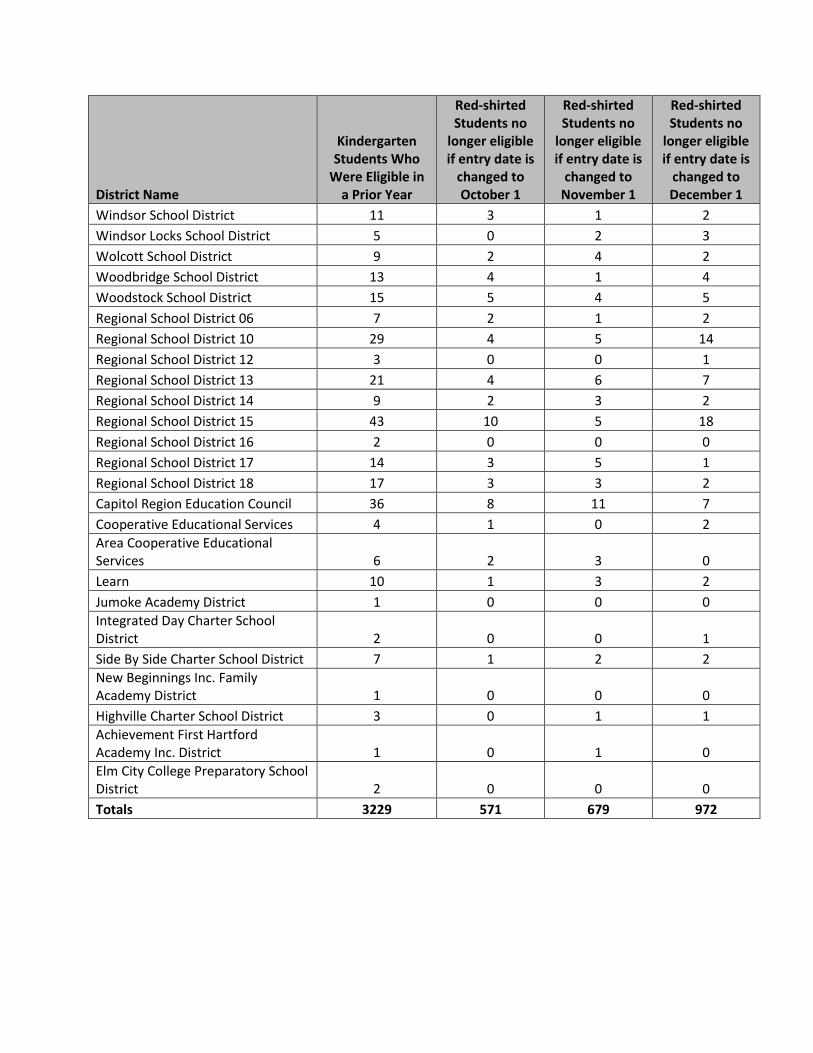
Appendix C: Kindergarten Enrollment of Students Who Were Eligible to Attend in a Prior Year (“Red Shirting) by District
(this data excludes students who were retained in Kindergarten)
District Name
Kindergarten Students Who
Were Eligible in a Prior Year
Red-shirted Students no longer eligible if entry date is changed to October 1
Red-shirted Students no longer eligible if entry date is changed to November 1
Red-shirted Students no longer eligible if entry date is changed to December 1
Ansonia School District 9 0 1 5
Ashford School District 2 0 0 2
Avon School District 37 6 9 8
Barkhamsted School District 1 0 0 1
Berlin School District 17 2 10 3
Bethany School District 4 0 1 3
Bethel School District 22 3 4 11
Bloomfield School District 6 2 0 2
Bolton School District 2 2 0 0
Branford School District 39 7 11 9
Bridgeport School District 72 11 8 12
Bristol School District 36 11 6 14
Brookfield School District 15 4 2 8
Brooklyn School District 9 1 2 3
Canaan School District 1 0 1 0
Canton School District 13 2 4 2
Chaplin School District 1 1 0 0
Cheshire School District 32 10 3 9
Chester School District 7 1 0 1
Clinton School District 17 2 5 5
Colchester School District 17 5 7 3
Colebrook School District 1 0 0 0
Columbia School District 2 1 0 0
Cornwall School District 1 0 0 0
Coventry School District 8 1 1 1
Cromwell School District 18 3 5 7
Danbury School District 43 4 9 15
Darien School District 93 18 15 28
Deep River School District 11 5 3 0
Derby School District 6 0 1 2

District Name
Kindergarten Students Who
Were Eligible in a Prior Year
Red-shirted Students no
longer eligible if entry date is
changed to October 1
Red-shirted Students no
longer eligible if entry date is
changed to November 1
Red-shirted Students no
longer eligible if entry date is
changed to December 1
East Granby School District 8 3 1 2
East Haddam School District 8 2 1 1
East Hampton School District 14 2 2 9
East Hartford School District 15 2 1 5
East Haven School District 25 0 5 16
East Lyme School District 17 4 1 7
Easton School District 14 2 3 6
East Windsor School District 3 0 0 1
Ellington School District 22 3 7 10
Enfield School District 23 0 8 9
Essex School District 8 2 1 3
Fairfield School District 114 28 29 23
Farmington School District 30 10 7 8
Glastonbury School District 55 12 12 15
Granby School District 25 4 7 11
Greenwich School District 93 18 20 26
Griswold School District 4 1 1 1
Groton School District 22 5 3 10
Guilford School District 33 8 8 9
Hamden School District 34 6 8 13
Hartford School District 79 9 12 15
Hebron School District 11 2 2 5
Kent School District 3 0 1 1
Killingly School District 13 2 3 2
Lebanon School District 3 0 0 3
Ledyard School District 10 4 0 2
Lisbon School District 2 1 0 0
Litchfield School District 6 0 2 1
Madison School District 39 9 10 7
Manchester School District 27 3 5 12
Mansfield School District 8 1 2 3
Marlborough School District 9 3 0 3
Meriden School District 28 7 3 9
Middletown School District 28 5 6 13
Milford School District 38 5 12 10

District Name
Kindergarten Students Who
Were Eligible in a Prior Year
Red-shirted Students no
longer eligible if entry date is
changed to October 1
Red-shirted Students no
longer eligible if entry date is
changed to November 1
Red-shirted Students no
longer eligible if entry date is
changed to December 1
Monroe School District 34 8 10 9
Montville School District 3 1 0 0
Naugatuck School District 15 4 2 4
New Britain School District 23 1 2 5
New Canaan School District 71 17 13 15
New Fairfield School District 14 3 4 2
New Hartford School District 5 2 1 0
New Haven School District 62 11 13 12
Newington School District 28 3 10 9
New London School District 11 0 2 7
New Milford School District 18 4 1 8
Newtown School District 38 6 7 17
North Branford School District 17 2 3 4
North Canaan School District 4 1 2 1
North Haven School District 24 4 4 10
North Stonington School District 6 1 1 2
Norwalk School District 47 4 11 14
Norwich School District 15 0 3 6
Old Saybrook School District 16 4 4 3
Orange School District 14 1 5 3
Oxford School District 10 0 4 2
Plainfield School District 5 0 1 2
Plainville School District 17 2 4 7
Plymouth School District 7 0 0 5
Pomfret School District 3 0 2 0
Portland School District 13 3 1 3
Preston School District 3 1 1 1
Putnam School District 5 0 2 2
Redding School District 15 3 2 5
Ridgefield School District 51 7 11 15
Rocky Hill School District 15 0 3 8
Salem School District 7 0 1 2
Salisbury School District 5 1 2 0
Scotland School District 1 0 1 0
Seymour School District 17 4 4 6
District Name
Kindergarten Students Who
Were Eligible in a Prior Year
Red-shirted Students no
longer eligible if entry date is
changed to October 1
Red-shirted Students no
longer eligible if entry date is
changed to November 1
Red-shirted Students no
longer eligible if entry date is
changed to December 1
Sharon School District 1 0 0 0
Shelton School District 35 8 5 8
Sherman School District 8 2 2 1
Simsbury School District 40 3 10 16
Somers School District 9 0 2 6
Southington School District 77 13 20 21
South Windsor School District 29 6 8 11
Stafford School District 2 1 0 1
Stamford School District 74 11 15 23
Sterling School District 1 0 0 1
Stonington School District 25 4 9 8
Stratford School District 36 8 10 7
Suffield School District 16 1 5 5
Thomaston School District 7 2 0 3
Thompson School District 8 1 3 2
Tolland School District 22 2 3 10
Torrington School District 26 8 6 6
Trumbull School District 51 3 10 16
Union School District 1 0 0 1
Vernon School District 13 4 3 1
Voluntown School District 1 0 0 0
Wallingford School District 39 11 4 16
Waterbury School District 76 4 12 16
Waterford School District 7 1 0 3
Watertown School District 12 2 3 5
Westbrook School District 6 0 1 1
West Hartford School District 74 17 12 26
West Haven School District 18 2 5 8
Weston School District 12 1 2 7
Westport School District 74 19 13 23
Wethersfield School District 24 6 4 9
Willington School District 2 0 1 0
Wilton School District 62 12 21 11
Winchester School District 10 1 1 5
Windham School District 8 0 0 3
District Name
Kindergarten Students Who
Were Eligible in a Prior Year
Red-shirted Students no
longer eligible if entry date is
changed to October 1
Red-shirted Students no
longer eligible if entry date is
changed to November 1
Red-shirted Students no
longer eligible if entry date is
changed to December 1
Windsor School District 11 3 1 2
Windsor Locks School District 5 0 2 3
Wolcott School District 9 2 4 2
Woodbridge School District 13 4 1 4
Woodstock School District 15 5 4 5
Regional School District 06 7 2 1 2
Regional School District 10 29 4 5 14
Regional School District 12 3 0 0 1
Regional School District 13 21 4 6 7
Regional School District 14 9 2 3 2
Regional School District 15 43 10 5 18
Regional School District 16 2 0 0 0
Regional School District 17 14 3 5 1
Regional School District 18 17 3 3 2
Capitol Region Education Council 36 8 11 7
Cooperative Educational Services 4 1 0 2
Area Cooperative Educational Services 6 2 3 0
Learn 10 1 3 2
Jumoke Academy District 1 0 0 0
Integrated Day Charter School District 2 0 0 1
Side By Side Charter School District 7 1 2 2
New Beginnings Inc. Family Academy District 1 0 0 0
Highville Charter School District 3 0 1 1
Achievement First Hartford Academy Inc. District 1 0 1 0
Elm City College Preparatory School District 2 0 0 0
Totals 3229 571 679 972