Embed Size (px)
Citation preview
CONNECTICUT DEPARTMENT OF PUBLIC HEALTH
Childhood Lead Poisoning in Connecticut
CY 2006 Surveillance Report

Childhood Lead Poisoning in Connecticut CY 2006 Surveillance Report
Commissioner J. Robert Galvin, MD, MPH, MBA Connecticut Department of Public Health
Prepared by: Tracy Hung, MHS, CLS (C)
Epidemiologist Connecticut Department of Public Health
Lead Poisoning Prevention and Control Program
For additional information about the Childhood Lead Poisoning in Connecticut CY 2006 Surveillance Report contact:
Connecticut Department of Public Health Lead Poisoning Prevention and Control Program
410 Capitol Avenue PO BOX 340308, MS#51LED Hartford, Connecticut 06134
Phone: (860) 509-7299
Funding provided by the Centers for Disease Control and Prevention, Grant Number US7/CCU122845-03
ACKNOWLEDGEMENTS
Connecticut Department of Public Health Commissioner – J. Robert Galvin, MD, MPH, MBA
Connecticut Department of Public Health Deputy Commissioner – Norma Gyle, RN, PhD
Regulatory Services Branch Chief – Ellen Blaschinski, MBA, RS
Environmental Health Section Chief – Suzanne Blancaflor, MS
Public Health Services Manager - Jeffery Curran, BS
Lead Poisoning Prevention and Control Program Supervisor – Alan Buzzetti, BA, RS
Childhood Lead Unit
Krista Veneziano, MPH, CHES, RS Linda Bailey, RN, MSN Brian Testut, MS, RS
Environmental Lead Unit Mark Aschenbach, BS, RS
Sharon Sharp, MBAH John, Lamb, BA
Data Management Unit
Tracy Hung, MHS, CLS(C) Michelle Wilson, BS
Education, Outreach, Media, and Special Projects Unit
Ana Chambers, MPH, CHES (Former Staff Member)
Rhonda Pales, BA Alessandra Litro, MPH
Administration Waynett Bobbs
Nakesha Scrivens (Currently assigned to Licensing)
Clarrisa Lopez
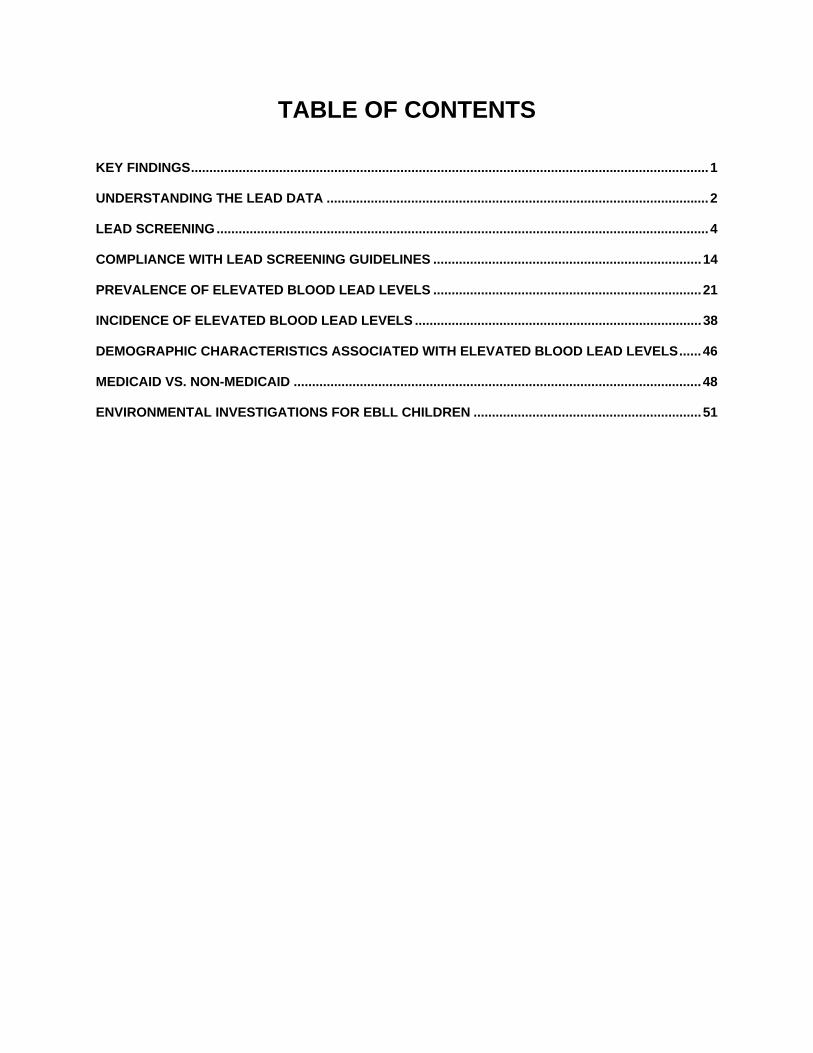
TABLE OF CONTENTS
KEY FINDINGS.............................................................................................................................................1
UNDERSTANDING THE LEAD DATA ........................................................................................................2
LEAD SCREENING......................................................................................................................................4
COMPLIANCE WITH LEAD SCREENING GUIDELINES .........................................................................14
PREVALENCE OF ELEVATED BLOOD LEAD LEVELS .........................................................................21
INCIDENCE OF ELEVATED BLOOD LEAD LEVELS ..............................................................................38
DEMOGRAPHIC CHARACTERISTICS ASSOCIATED WITH ELEVATED BLOOD LEAD LEVELS......46
MEDICAID VS. NON-MEDICAID ...............................................................................................................48
ENVIRONMENTAL INVESTIGATIONS FOR EBLL CHILDREN ..............................................................51
1 of 53
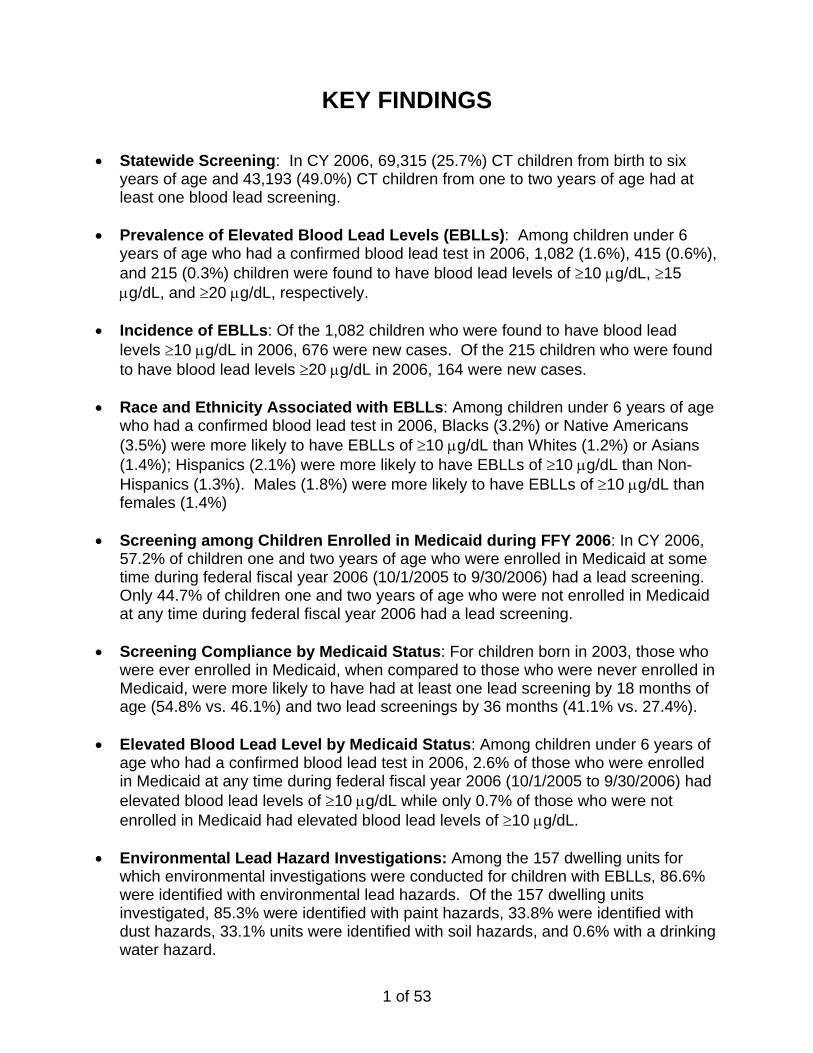
KEY FINDINGS
• Statewide Screening: In CY 2006, 69,315 (25.7%) CT children from birth to six years of age and 43,193 (49.0%) CT children from one to two years of age had at least one blood lead screening.
• Prevalence of Elevated Blood Lead Levels (EBLLs): Among children under 6
years of age who had a confirmed blood lead test in 2006, 1,082 (1.6%), 415 (0.6%), and 215 (0.3%) children were found to have blood lead levels of ≥10 µg/dL, ≥15 µg/dL, and ≥20 µg/dL, respectively.
• Incidence of EBLLs: Of the 1,082 children who were found to have blood lead
levels ≥10 µg/dL in 2006, 676 were new cases. Of the 215 children who were found to have blood lead levels ≥20 µg/dL in 2006, 164 were new cases.
• Race and Ethnicity Associated with EBLLs: Among children under 6 years of age
who had a confirmed blood lead test in 2006, Blacks (3.2%) or Native Americans (3.5%) were more likely to have EBLLs of ≥10 µg/dL than Whites (1.2%) or Asians (1.4%); Hispanics (2.1%) were more likely to have EBLLs of ≥10 µg/dL than Non-Hispanics (1.3%). Males (1.8%) were more likely to have EBLLs of ≥10 µg/dL than females (1.4%)
• Screening among Children Enrolled in Medicaid during FFY 2006: In CY 2006,
57.2% of children one and two years of age who were enrolled in Medicaid at some time during federal fiscal year 2006 (10/1/2005 to 9/30/2006) had a lead screening. Only 44.7% of children one and two years of age who were not enrolled in Medicaid at any time during federal fiscal year 2006 had a lead screening.
• Screening Compliance by Medicaid Status: For children born in 2003, those who
were ever enrolled in Medicaid, when compared to those who were never enrolled in Medicaid, were more likely to have had at least one lead screening by 18 months of age (54.8% vs. 46.1%) and two lead screenings by 36 months (41.1% vs. 27.4%).
• Elevated Blood Lead Level by Medicaid Status: Among children under 6 years of
age who had a confirmed blood lead test in 2006, 2.6% of those who were enrolled in Medicaid at any time during federal fiscal year 2006 (10/1/2005 to 9/30/2006) had elevated blood lead levels of ≥10 µg/dL while only 0.7% of those who were not enrolled in Medicaid had elevated blood lead levels of ≥10 µg/dL.
• Environmental Lead Hazard Investigations: Among the 157 dwelling units for
which environmental investigations were conducted for children with EBLLs, 86.6% were identified with environmental lead hazards. Of the 157 dwelling units investigated, 85.3% were identified with paint hazards, 33.8% were identified with dust hazards, 33.1% units were identified with soil hazards, and 0.6% with a drinking water hazard.
2 of 53
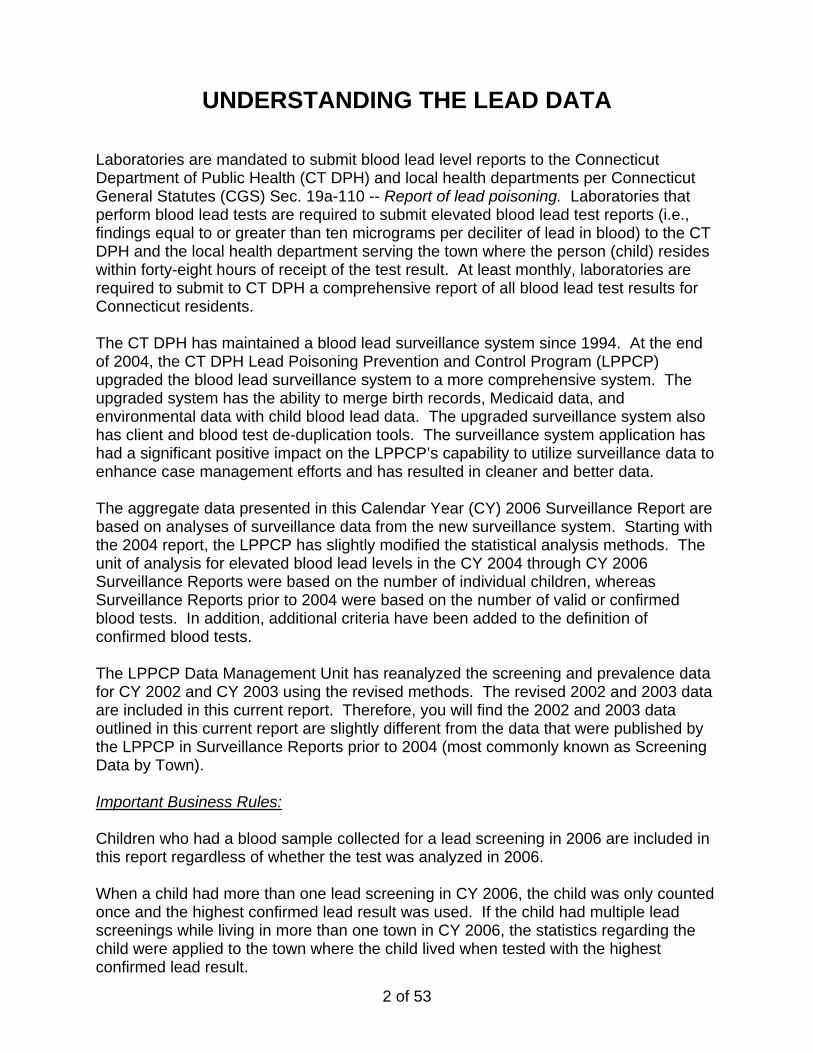
UNDERSTANDING THE LEAD DATA Laboratories are mandated to submit blood lead level reports to the Connecticut Department of Public Health (CT DPH) and local health departments per Connecticut General Statutes (CGS) Sec. 19a-110 -- Report of lead poisoning. Laboratories that perform blood lead tests are required to submit elevated blood lead test reports (i.e., findings equal to or greater than ten micrograms per deciliter of lead in blood) to the CT DPH and the local health department serving the town where the person (child) resides within forty-eight hours of receipt of the test result. At least monthly, laboratories are required to submit to CT DPH a comprehensive report of all blood lead test results for Connecticut residents. The CT DPH has maintained a blood lead surveillance system since 1994. At the end of 2004, the CT DPH Lead Poisoning Prevention and Control Program (LPPCP) upgraded the blood lead surveillance system to a more comprehensive system. The upgraded system has the ability to merge birth records, Medicaid data, and environmental data with child blood lead data. The upgraded surveillance system also has client and blood test de-duplication tools. The surveillance system application has had a significant positive impact on the LPPCP’s capability to utilize surveillance data to enhance case management efforts and has resulted in cleaner and better data. The aggregate data presented in this Calendar Year (CY) 2006 Surveillance Report are based on analyses of surveillance data from the new surveillance system. Starting with the 2004 report, the LPPCP has slightly modified the statistical analysis methods. The unit of analysis for elevated blood lead levels in the CY 2004 through CY 2006 Surveillance Reports were based on the number of individual children, whereas Surveillance Reports prior to 2004 were based on the number of valid or confirmed blood tests. In addition, additional criteria have been added to the definition of confirmed blood tests. The LPPCP Data Management Unit has reanalyzed the screening and prevalence data for CY 2002 and CY 2003 using the revised methods. The revised 2002 and 2003 data are included in this current report. Therefore, you will find the 2002 and 2003 data outlined in this current report are slightly different from the data that were published by the LPPCP in Surveillance Reports prior to 2004 (most commonly known as Screening Data by Town). Important Business Rules: Children who had a blood sample collected for a lead screening in 2006 are included in this report regardless of whether the test was analyzed in 2006. When a child had more than one lead screening in CY 2006, the child was only counted once and the highest confirmed lead result was used. If the child had multiple lead screenings while living in more than one town in CY 2006, the statistics regarding the child were applied to the town where the child lived when tested with the highest confirmed lead result.

3 of 53
Remark: Children who are 1 to 2 years old refer to those who are 12 through 35 months of age. Unless otherwise specified, “years” refer to calendar years within this report.
4 of 53
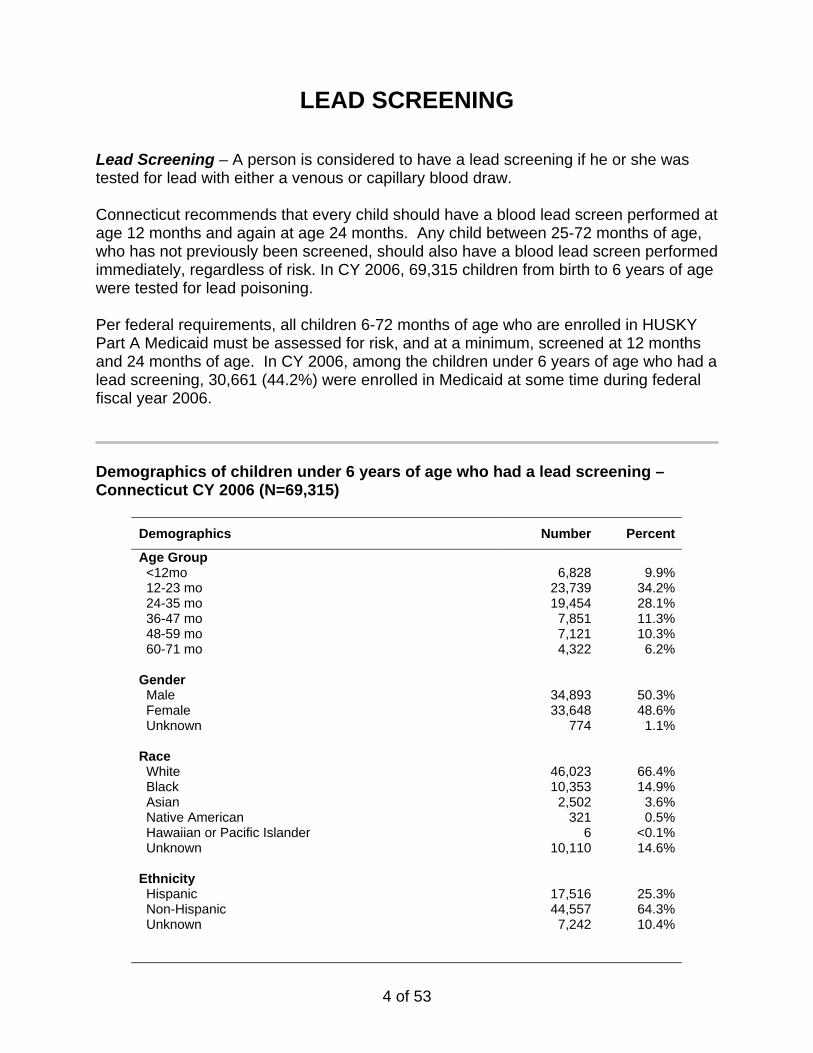
LEAD SCREENING Lead Screening – A person is considered to have a lead screening if he or she was tested for lead with either a venous or capillary blood draw. Connecticut recommends that every child should have a blood lead screen performed at age 12 months and again at age 24 months. Any child between 25-72 months of age, who has not previously been screened, should also have a blood lead screen performed immediately, regardless of risk. In CY 2006, 69,315 children from birth to 6 years of age were tested for lead poisoning. Per federal requirements, all children 6-72 months of age who are enrolled in HUSKY Part A Medicaid must be assessed for risk, and at a minimum, screened at 12 months and 24 months of age. In CY 2006, among the children under 6 years of age who had a lead screening, 30,661 (44.2%) were enrolled in Medicaid at some time during federal fiscal year 2006. Demographics of children under 6 years of age who had a lead screening – Connecticut CY 2006 (N=69,315)
Demographics Number Percent
Age Group <12mo 12-23 mo 24-35 mo 36-47 mo 48-59 mo 60-71 mo
6,828
23,739 19,454
7,851 7,121 4,322
9.9%34.2%28.1%11.3%10.3%
6.2%
Gender Male Female Unknown
34,893 33,648
774
50.3%48.6%
1.1%
Race White Black Asian Native American Hawaiian or Pacific Islander Unknown
46,023 10,353
2,502 321
6 10,110
66.4%14.9%
3.6%0.5%
<0.1%14.6%
Ethnicity Hispanic Non-Hispanic Unknown
17,516 44,557
7,242
25.3%64.3%10.4%
5 of 53
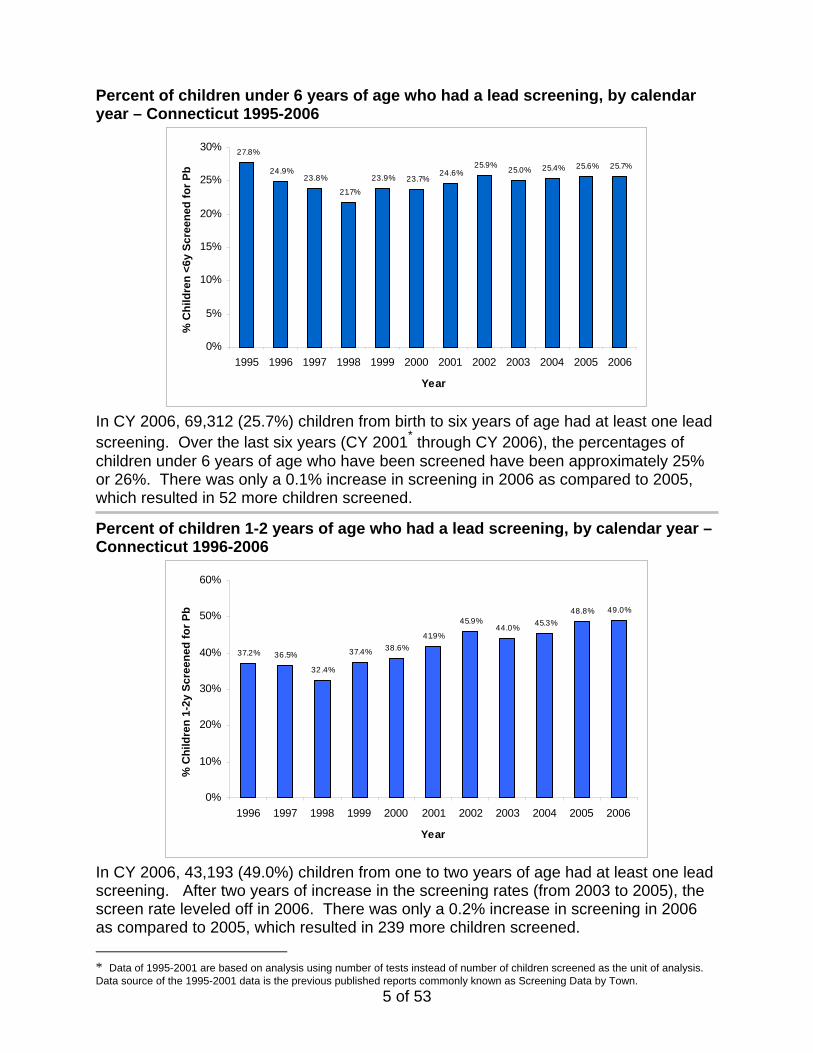
Percent of children under 6 years of age who had a lead screening, by calendar year – Connecticut 1995-2006
27.8%
24.9%23.8%
21.7%
23.9% 23.7%24.6%
25.9% 25.0% 25.4% 25.6% 25.7%
0%
5%
10%
15%
20%
25%
30%
1995 1996 1997 1998 1999 2000 2001 2002 2003 2004 2005 2006
Year
% C
hild
ren
<6y
Scre
ened
for P
b
In CY 2006, 69,312 (25.7%) children from birth to six years of age had at least one lead screening. Over the last six years (CY 2001* through CY 2006), the percentages of children under 6 years of age who have been screened have been approximately 25% or 26%. There was only a 0.1% increase in screening in 2006 as compared to 2005, which resulted in 52 more children screened. Percent of children 1-2 years of age who had a lead screening, by calendar year – Connecticut 1996-2006
37.2% 36.5%
32.4%
37.4% 38.6%41.9%
45.9%44.0% 45.3%
48.8% 49.0%
0%
10%
20%
30%
40%
50%
60%
1996 1997 1998 1999 2000 2001 2002 2003 2004 2005 2006
Year
% C
hild
ren
1-2y
Scr
eene
d fo
r Pb
In CY 2006, 43,193 (49.0%) children from one to two years of age had at least one lead screening. After two years of increase in the screening rates (from 2003 to 2005), the screen rate leveled off in 2006. There was only a 0.2% increase in screening in 2006 as compared to 2005, which resulted in 239 more children screened. * Data of 1995-2001 are based on analysis using number of tests instead of number of children screened as the unit of analysis. Data source of the 1995-2001 data is the previous published reports commonly known as Screening Data by Town.
6 of 53
7 of 53
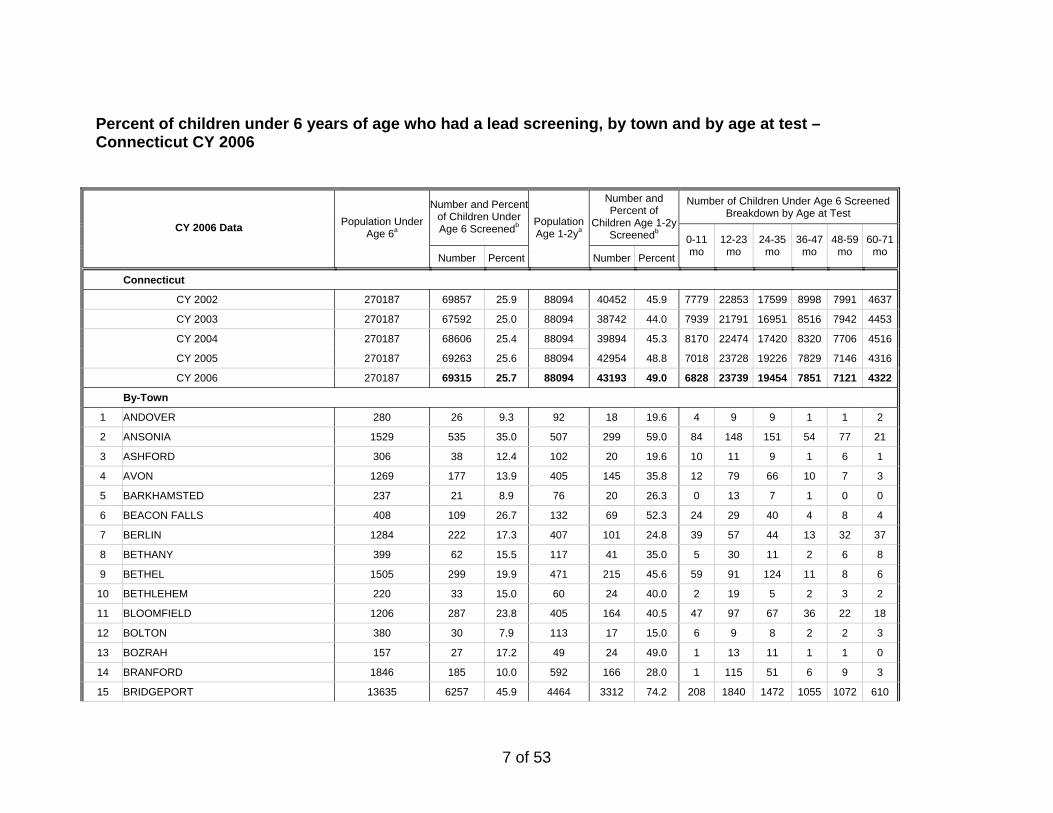
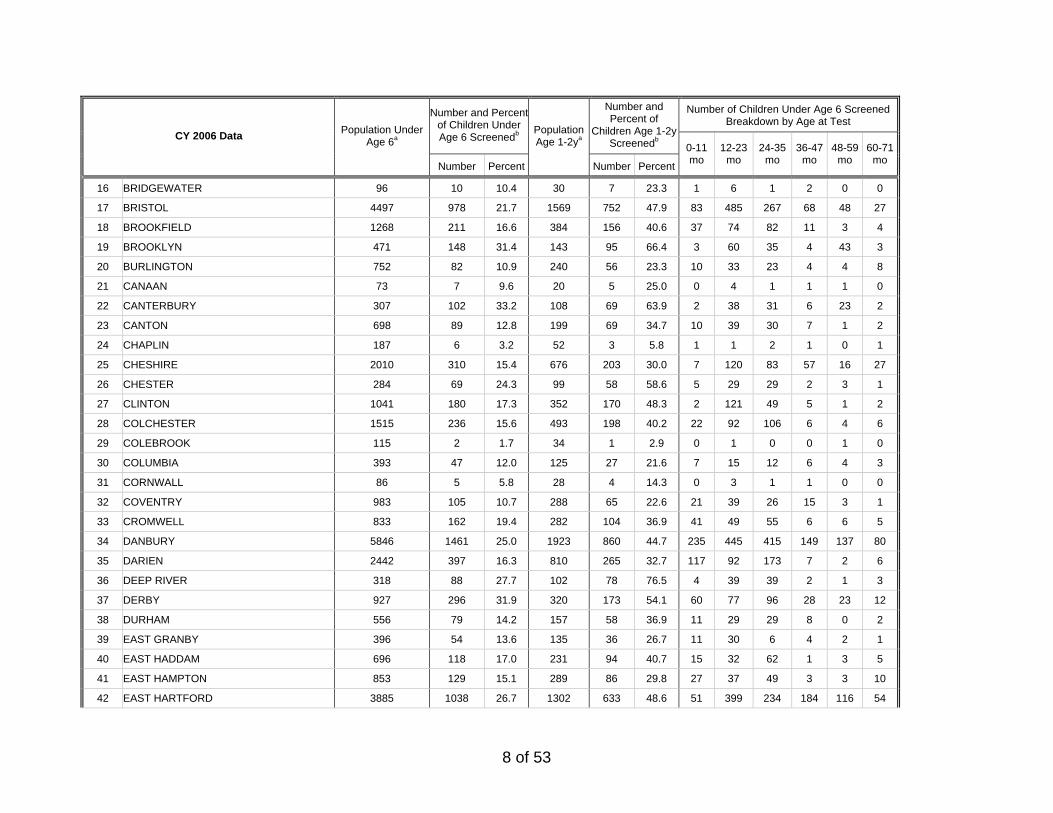
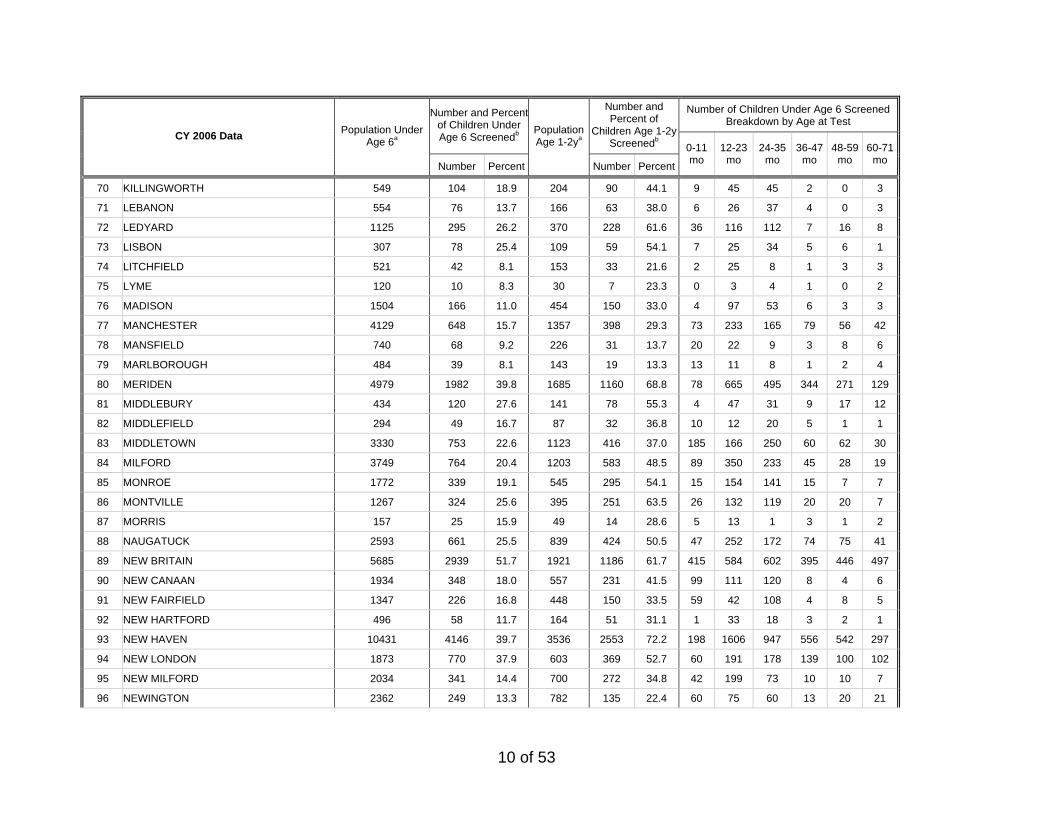
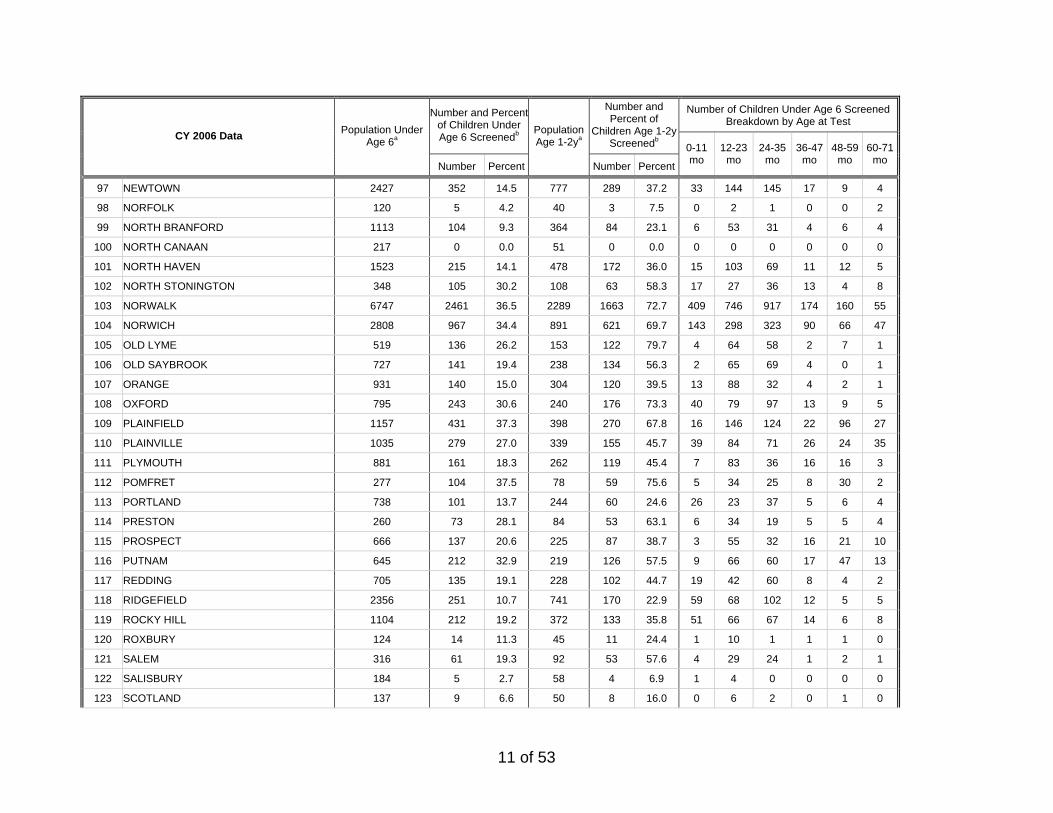
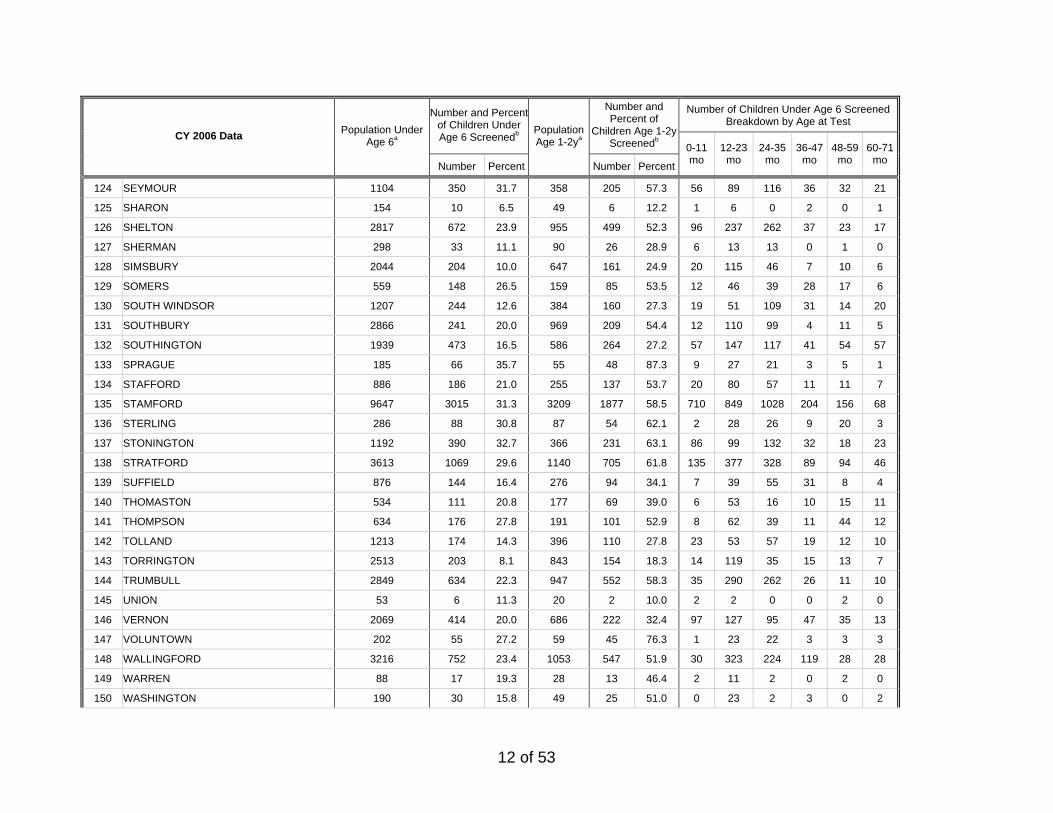
Percent of children under 6 years of age who had a lead screening, by town and by age at test – Connecticut CY 2006
Number of Children Under Age 6 ScreenedBreakdown by Age at Test
Number and Percent of Children Under Age 6 Screenedb
Number and Percent of
Children Age 1-2y Screenedb
CY 2006 Data Population Under Age 6a
Number Percent
Population Age 1-2ya
Number Percent
0-11mo
12-23mo
24-35mo
36-47mo
48-59mo
60-71mo
Connecticut
CY 2002 270187 69857 25.9 88094 40452 45.9 7779 22853 17599 8998 7991 4637
CY 2003 270187 67592 25.0 88094 38742 44.0 7939 21791 16951 8516 7942 4453
CY 2004 270187 68606 25.4 88094 39894 45.3 8170 22474 17420 8320 7706 4516
CY 2005 270187 69263 25.6 88094 42954 48.8 7018 23728 19226 7829 7146 4316
CY 2006 270187 69315 25.7 88094 43193 49.0 6828 23739 19454 7851 7121 4322
By-Town
1 ANDOVER 280 26 9.3 92 18 19.6 4 9 9 1 1 2
2 ANSONIA 1529 535 35.0 507 299 59.0 84 148 151 54 77 21
3 ASHFORD 306 38 12.4 102 20 19.6 10 11 9 1 6 1
4 AVON 1269 177 13.9 405 145 35.8 12 79 66 10 7 3
5 BARKHAMSTED 237 21 8.9 76 20 26.3 0 13 7 1 0 0
6 BEACON FALLS 408 109 26.7 132 69 52.3 24 29 40 4 8 4
7 BERLIN 1284 222 17.3 407 101 24.8 39 57 44 13 32 37
8 BETHANY 399 62 15.5 117 41 35.0 5 30 11 2 6 8
9 BETHEL 1505 299 19.9 471 215 45.6 59 91 124 11 8 6
10 BETHLEHEM 220 33 15.0 60 24 40.0 2 19 5 2 3 2
11 BLOOMFIELD 1206 287 23.8 405 164 40.5 47 97 67 36 22 18
12 BOLTON 380 30 7.9 113 17 15.0 6 9 8 2 2 3
13 BOZRAH 157 27 17.2 49 24 49.0 1 13 11 1 1 0
14 BRANFORD 1846 185 10.0 592 166 28.0 1 115 51 6 9 3
15 BRIDGEPORT 13635 6257 45.9 4464 3312 74.2 208 1840 1472 1055 1072 610
8 of 53
Number of Children Under Age 6 ScreenedBreakdown by Age at Test
Number and Percent of Children Under Age 6 Screenedb
Number and Percent of
Children Age 1-2y Screenedb
CY 2006 Data Population Under Age 6a
Number Percent
Population Age 1-2ya
Number Percent
0-11mo
12-23mo
24-35mo
36-47mo
48-59mo
60-71mo
16 BRIDGEWATER 96 10 10.4 30 7 23.3 1 6 1 2 0 0
17 BRISTOL 4497 978 21.7 1569 752 47.9 83 485 267 68 48 27
18 BROOKFIELD 1268 211 16.6 384 156 40.6 37 74 82 11 3 4
19 BROOKLYN 471 148 31.4 143 95 66.4 3 60 35 4 43 3
20 BURLINGTON 752 82 10.9 240 56 23.3 10 33 23 4 4 8
21 CANAAN 73 7 9.6 20 5 25.0 0 4 1 1 1 0
22 CANTERBURY 307 102 33.2 108 69 63.9 2 38 31 6 23 2
23 CANTON 698 89 12.8 199 69 34.7 10 39 30 7 1 2
24 CHAPLIN 187 6 3.2 52 3 5.8 1 1 2 1 0 1
25 CHESHIRE 2010 310 15.4 676 203 30.0 7 120 83 57 16 27
26 CHESTER 284 69 24.3 99 58 58.6 5 29 29 2 3 1
27 CLINTON 1041 180 17.3 352 170 48.3 2 121 49 5 1 2
28 COLCHESTER 1515 236 15.6 493 198 40.2 22 92 106 6 4 6
29 COLEBROOK 115 2 1.7 34 1 2.9 0 1 0 0 1 0
30 COLUMBIA 393 47 12.0 125 27 21.6 7 15 12 6 4 3
31 CORNWALL 86 5 5.8 28 4 14.3 0 3 1 1 0 0
32 COVENTRY 983 105 10.7 288 65 22.6 21 39 26 15 3 1
33 CROMWELL 833 162 19.4 282 104 36.9 41 49 55 6 6 5
34 DANBURY 5846 1461 25.0 1923 860 44.7 235 445 415 149 137 80
35 DARIEN 2442 397 16.3 810 265 32.7 117 92 173 7 2 6
36 DEEP RIVER 318 88 27.7 102 78 76.5 4 39 39 2 1 3
37 DERBY 927 296 31.9 320 173 54.1 60 77 96 28 23 12
38 DURHAM 556 79 14.2 157 58 36.9 11 29 29 8 0 2
39 EAST GRANBY 396 54 13.6 135 36 26.7 11 30 6 4 2 1
40 EAST HADDAM 696 118 17.0 231 94 40.7 15 32 62 1 3 5
41 EAST HAMPTON 853 129 15.1 289 86 29.8 27 37 49 3 3 10
42 EAST HARTFORD 3885 1038 26.7 1302 633 48.6 51 399 234 184 116 54

9 of 53
Number of Children Under Age 6 ScreenedBreakdown by Age at Test
Number and Percent of Children Under Age 6 Screenedb
Number and Percent of
Children Age 1-2y Screenedb
CY 2006 Data Population Under Age 6a
Number Percent
Population Age 1-2ya
Number Percent
0-11mo
12-23mo
24-35mo
36-47mo
48-59mo
60-71mo
43 EAST HAVEN 1930 318 16.5 647 249 38.5 7 178 71 25 26 11
44 EAST LYME 1086 247 22.7 346 168 48.6 9 88 80 17 29 24
45 EAST WINDSOR 645 117 18.1 230 73 31.7 13 33 40 13 9 9
46 EASTFORD 123 20 16.3 38 11 28.9 1 7 4 0 6 2
47 EASTON 694 130 18.7 219 104 47.5 14 64 40 9 2 1
48 ELLINGTON 1007 190 18.9 319 129 40.4 32 62 67 14 8 7
49 ENFIELD 3083 558 18.1 1008 345 34.2 35 205 140 112 52 14
50 ESSEX 511 115 22.5 154 110 71.4 2 48 62 2 1 0
51 FAIRFIELD 4910 1252 25.5 1698 1060 62.4 100 545 515 51 17 24
52 FARMINGTON 1667 211 12.7 502 161 32.1 27 92 69 7 2 14
53 FRANKLIN 130 23 17.7 34 19 55.9 2 8 11 2 0 0
54 GLASTONBURY 2766 186 6.7 876 100 11.4 20 47 53 9 21 36
55 GOSHEN 173 16 9.2 48 10 20.8 2 10 0 1 3 0
56 GRANBY 872 96 11.0 280 68 24.3 11 44 24 3 9 5
57 GREENWICH 5221 300 5.7 1679 184 11.0 55 83 101 23 19 19
58 GRISWOLD 782 236 30.2 232 175 75.4 25 83 92 12 19 5
59 GROTON 3836 739 19.3 1275 483 37.9 53 280 203 67 79 57
60 GUILFORD 1571 166 10.6 502 150 29.9 3 111 39 1 7 5
61 HADDAM 515 116 22.5 171 73 42.7 32 24 49 4 4 3
62 HAMDEN 3675 882 24.0 1235 697 56.4 49 456 241 69 39 28
63 HAMPTON 130 16 12.3 35 10 28.6 4 8 2 0 1 1
64 HARTFORD 12134 5486 45.2 4033 3021 74.9 282 1751 1270 1171 672 340
65 HARTLAND 134 11 8.2 41 10 24.4 0 7 3 0 0 1
66 HARWINTON 366 32 8.7 118 27 22.9 2 25 2 1 0 2
67 HEBRON 928 77 8.3 298 38 12.8 26 16 22 3 4 6
68 KENT 215 29 13.5 75 27 36.0 0 18 9 2 0 0
69 KILLINGLY 1231 537 43.6 402 314 78.1 19 183 131 35 147 22
10 of 53
Number of Children Under Age 6 ScreenedBreakdown by Age at Test
Number and Percent of Children Under Age 6 Screenedb
Number and Percent of
Children Age 1-2y Screenedb
CY 2006 Data Population Under Age 6a
Number Percent
Population Age 1-2ya
Number Percent
0-11mo
12-23mo
24-35mo
36-47mo
48-59mo
60-71mo
70 KILLINGWORTH 549 104 18.9 204 90 44.1 9 45 45 2 0 3
71 LEBANON 554 76 13.7 166 63 38.0 6 26 37 4 0 3
72 LEDYARD 1125 295 26.2 370 228 61.6 36 116 112 7 16 8
73 LISBON 307 78 25.4 109 59 54.1 7 25 34 5 6 1
74 LITCHFIELD 521 42 8.1 153 33 21.6 2 25 8 1 3 3
75 LYME 120 10 8.3 30 7 23.3 0 3 4 1 0 2
76 MADISON 1504 166 11.0 454 150 33.0 4 97 53 6 3 3
77 MANCHESTER 4129 648 15.7 1357 398 29.3 73 233 165 79 56 42
78 MANSFIELD 740 68 9.2 226 31 13.7 20 22 9 3 8 6
79 MARLBOROUGH 484 39 8.1 143 19 13.3 13 11 8 1 2 4
80 MERIDEN 4979 1982 39.8 1685 1160 68.8 78 665 495 344 271 129
81 MIDDLEBURY 434 120 27.6 141 78 55.3 4 47 31 9 17 12
82 MIDDLEFIELD 294 49 16.7 87 32 36.8 10 12 20 5 1 1
83 MIDDLETOWN 3330 753 22.6 1123 416 37.0 185 166 250 60 62 30
84 MILFORD 3749 764 20.4 1203 583 48.5 89 350 233 45 28 19
85 MONROE 1772 339 19.1 545 295 54.1 15 154 141 15 7 7
86 MONTVILLE 1267 324 25.6 395 251 63.5 26 132 119 20 20 7
87 MORRIS 157 25 15.9 49 14 28.6 5 13 1 3 1 2
88 NAUGATUCK 2593 661 25.5 839 424 50.5 47 252 172 74 75 41
89 NEW BRITAIN 5685 2939 51.7 1921 1186 61.7 415 584 602 395 446 497
90 NEW CANAAN 1934 348 18.0 557 231 41.5 99 111 120 8 4 6
91 NEW FAIRFIELD 1347 226 16.8 448 150 33.5 59 42 108 4 8 5
92 NEW HARTFORD 496 58 11.7 164 51 31.1 1 33 18 3 2 1
93 NEW HAVEN 10431 4146 39.7 3536 2553 72.2 198 1606 947 556 542 297
94 NEW LONDON 1873 770 37.9 603 369 52.7 60 191 178 139 100 102
95 NEW MILFORD 2034 341 14.4 700 272 34.8 42 199 73 10 10 7
96 NEWINGTON 2362 249 13.3 782 135 22.4 60 75 60 13 20 21
11 of 53
Number of Children Under Age 6 ScreenedBreakdown by Age at Test
Number and Percent of Children Under Age 6 Screenedb
Number and Percent of
Children Age 1-2y Screenedb
CY 2006 Data Population Under Age 6a
Number Percent
Population Age 1-2ya
Number Percent
0-11mo
12-23mo
24-35mo
36-47mo
48-59mo
60-71mo
97 NEWTOWN 2427 352 14.5 777 289 37.2 33 144 145 17 9 4
98 NORFOLK 120 5 4.2 40 3 7.5 0 2 1 0 0 2
99 NORTH BRANFORD 1113 104 9.3 364 84 23.1 6 53 31 4 6 4
100 NORTH CANAAN 217 0 0.0 51 0 0.0 0 0 0 0 0 0
101 NORTH HAVEN 1523 215 14.1 478 172 36.0 15 103 69 11 12 5
102 NORTH STONINGTON 348 105 30.2 108 63 58.3 17 27 36 13 4 8
103 NORWALK 6747 2461 36.5 2289 1663 72.7 409 746 917 174 160 55
104 NORWICH 2808 967 34.4 891 621 69.7 143 298 323 90 66 47
105 OLD LYME 519 136 26.2 153 122 79.7 4 64 58 2 7 1
106 OLD SAYBROOK 727 141 19.4 238 134 56.3 2 65 69 4 0 1
107 ORANGE 931 140 15.0 304 120 39.5 13 88 32 4 2 1
108 OXFORD 795 243 30.6 240 176 73.3 40 79 97 13 9 5
109 PLAINFIELD 1157 431 37.3 398 270 67.8 16 146 124 22 96 27
110 PLAINVILLE 1035 279 27.0 339 155 45.7 39 84 71 26 24 35
111 PLYMOUTH 881 161 18.3 262 119 45.4 7 83 36 16 16 3
112 POMFRET 277 104 37.5 78 59 75.6 5 34 25 8 30 2
113 PORTLAND 738 101 13.7 244 60 24.6 26 23 37 5 6 4
114 PRESTON 260 73 28.1 84 53 63.1 6 34 19 5 5 4
115 PROSPECT 666 137 20.6 225 87 38.7 3 55 32 16 21 10
116 PUTNAM 645 212 32.9 219 126 57.5 9 66 60 17 47 13
117 REDDING 705 135 19.1 228 102 44.7 19 42 60 8 4 2
118 RIDGEFIELD 2356 251 10.7 741 170 22.9 59 68 102 12 5 5
119 ROCKY HILL 1104 212 19.2 372 133 35.8 51 66 67 14 6 8
120 ROXBURY 124 14 11.3 45 11 24.4 1 10 1 1 1 0
121 SALEM 316 61 19.3 92 53 57.6 4 29 24 1 2 1
122 SALISBURY 184 5 2.7 58 4 6.9 1 4 0 0 0 0
123 SCOTLAND 137 9 6.6 50 8 16.0 0 6 2 0 1 0
12 of 53
Number of Children Under Age 6 ScreenedBreakdown by Age at Test
Number and Percent of Children Under Age 6 Screenedb
Number and Percent of
Children Age 1-2y Screenedb
CY 2006 Data Population Under Age 6a
Number Percent
Population Age 1-2ya
Number Percent
0-11mo
12-23mo
24-35mo
36-47mo
48-59mo
60-71mo
124 SEYMOUR 1104 350 31.7 358 205 57.3 56 89 116 36 32 21
125 SHARON 154 10 6.5 49 6 12.2 1 6 0 2 0 1
126 SHELTON 2817 672 23.9 955 499 52.3 96 237 262 37 23 17
127 SHERMAN 298 33 11.1 90 26 28.9 6 13 13 0 1 0
128 SIMSBURY 2044 204 10.0 647 161 24.9 20 115 46 7 10 6
129 SOMERS 559 148 26.5 159 85 53.5 12 46 39 28 17 6
130 SOUTH WINDSOR 1207 244 12.6 384 160 27.3 19 51 109 31 14 20
131 SOUTHBURY 2866 241 20.0 969 209 54.4 12 110 99 4 11 5
132 SOUTHINGTON 1939 473 16.5 586 264 27.2 57 147 117 41 54 57
133 SPRAGUE 185 66 35.7 55 48 87.3 9 27 21 3 5 1
134 STAFFORD 886 186 21.0 255 137 53.7 20 80 57 11 11 7
135 STAMFORD 9647 3015 31.3 3209 1877 58.5 710 849 1028 204 156 68
136 STERLING 286 88 30.8 87 54 62.1 2 28 26 9 20 3
137 STONINGTON 1192 390 32.7 366 231 63.1 86 99 132 32 18 23
138 STRATFORD 3613 1069 29.6 1140 705 61.8 135 377 328 89 94 46
139 SUFFIELD 876 144 16.4 276 94 34.1 7 39 55 31 8 4
140 THOMASTON 534 111 20.8 177 69 39.0 6 53 16 10 15 11
141 THOMPSON 634 176 27.8 191 101 52.9 8 62 39 11 44 12
142 TOLLAND 1213 174 14.3 396 110 27.8 23 53 57 19 12 10
143 TORRINGTON 2513 203 8.1 843 154 18.3 14 119 35 15 13 7
144 TRUMBULL 2849 634 22.3 947 552 58.3 35 290 262 26 11 10
145 UNION 53 6 11.3 20 2 10.0 2 2 0 0 2 0
146 VERNON 2069 414 20.0 686 222 32.4 97 127 95 47 35 13
147 VOLUNTOWN 202 55 27.2 59 45 76.3 1 23 22 3 3 3
148 WALLINGFORD 3216 752 23.4 1053 547 51.9 30 323 224 119 28 28
149 WARREN 88 17 19.3 28 13 46.4 2 11 2 0 2 0
150 WASHINGTON 190 30 15.8 49 25 51.0 0 23 2 3 0 2
13 of 53
Number of Children Under Age 6 ScreenedBreakdown by Age at Test
Number and Percent of Children Under Age 6 Screenedb
Number and Percent of
Children Age 1-2y Screenedb
CY 2006 Data Population Under Age 6a
Number Percent
Population Age 1-2ya
Number Percent
0-11mo
12-23mo
24-35mo
36-47mo
48-59mo
60-71mo
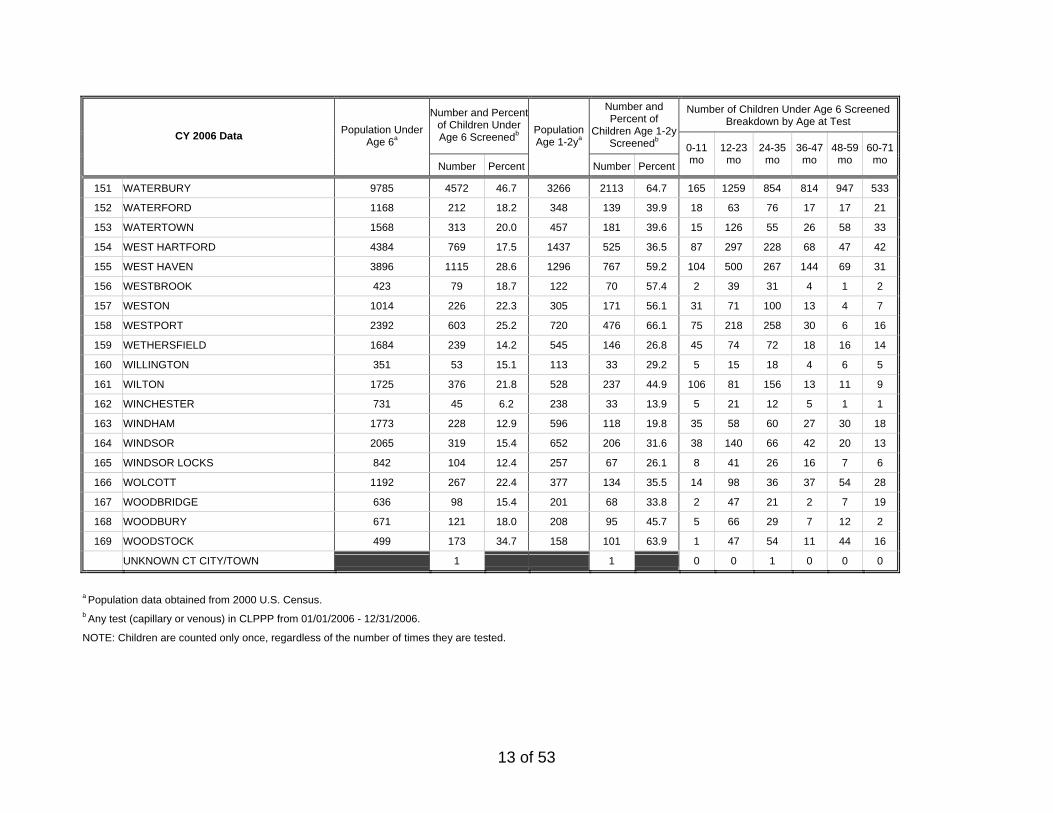
151 WATERBURY 9785 4572 46.7 3266 2113 64.7 165 1259 854 814 947 533
152 WATERFORD 1168 212 18.2 348 139 39.9 18 63 76 17 17 21
153 WATERTOWN 1568 313 20.0 457 181 39.6 15 126 55 26 58 33
154 WEST HARTFORD 4384 769 17.5 1437 525 36.5 87 297 228 68 47 42
155 WEST HAVEN 3896 1115 28.6 1296 767 59.2 104 500 267 144 69 31
156 WESTBROOK 423 79 18.7 122 70 57.4 2 39 31 4 1 2
157 WESTON 1014 226 22.3 305 171 56.1 31 71 100 13 4 7
158 WESTPORT 2392 603 25.2 720 476 66.1 75 218 258 30 6 16
159 WETHERSFIELD 1684 239 14.2 545 146 26.8 45 74 72 18 16 14
160 WILLINGTON 351 53 15.1 113 33 29.2 5 15 18 4 6 5
161 WILTON 1725 376 21.8 528 237 44.9 106 81 156 13 11 9
162 WINCHESTER 731 45 6.2 238 33 13.9 5 21 12 5 1 1
163 WINDHAM 1773 228 12.9 596 118 19.8 35 58 60 27 30 18
164 WINDSOR 2065 319 15.4 652 206 31.6 38 140 66 42 20 13
165 WINDSOR LOCKS 842 104 12.4 257 67 26.1 8 41 26 16 7 6
166 WOLCOTT 1192 267 22.4 377 134 35.5 14 98 36 37 54 28
167 WOODBRIDGE 636 98 15.4 201 68 33.8 2 47 21 2 7 19
168 WOODBURY 671 121 18.0 208 95 45.7 5 66 29 7 12 2
169 WOODSTOCK 499 173 34.7 158 101 63.9 1 47 54 11 44 16
UNKNOWN CT CITY/TOWN 1 1 0 0 1 0 0 0
a Population data obtained from 2000 U.S. Census. b Any test (capillary or venous) in CLPPP from 01/01/2006 - 12/31/2006.
NOTE: Children are counted only once, regardless of the number of times they are tested.
14 of 53
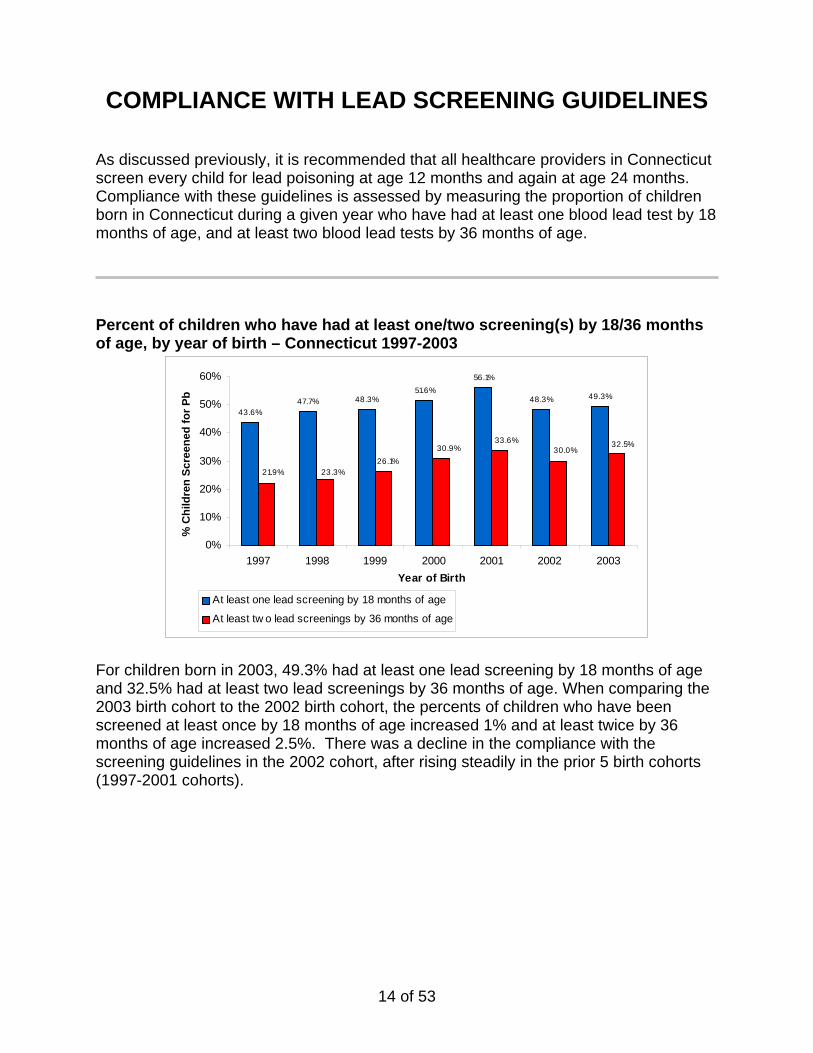
COMPLIANCE WITH LEAD SCREENING GUIDELINES As discussed previously, it is recommended that all healthcare providers in Connecticut screen every child for lead poisoning at age 12 months and again at age 24 months. Compliance with these guidelines is assessed by measuring the proportion of children born in Connecticut during a given year who have had at least one blood lead test by 18 months of age, and at least two blood lead tests by 36 months of age. Percent of children who have had at least one/two screening(s) by 18/36 months of age, by year of birth – Connecticut 1997-2003
43.6%47.7% 48.3%
51.6%56.1%
48.3% 49.3%
32.5%30.0%
33.6%30.9%
26.1%21.9% 23.3%
0%
10%
20%
30%
40%
50%
60%
1997 1998 1999 2000 2001 2002 2003Year of Birth
% C
hild
ren
Scre
ened
for P
b
At least one lead screening by 18 months of age
At least tw o lead screenings by 36 months of age
For children born in 2003, 49.3% had at least one lead screening by 18 months of age and 32.5% had at least two lead screenings by 36 months of age. When comparing the 2003 birth cohort to the 2002 birth cohort, the percents of children who have been screened at least once by 18 months of age increased 1% and at least twice by 36 months of age increased 2.5%. There was a decline in the compliance with the screening guidelines in the 2002 cohort, after rising steadily in the prior 5 birth cohorts (1997-2001 cohorts).
15 of 53
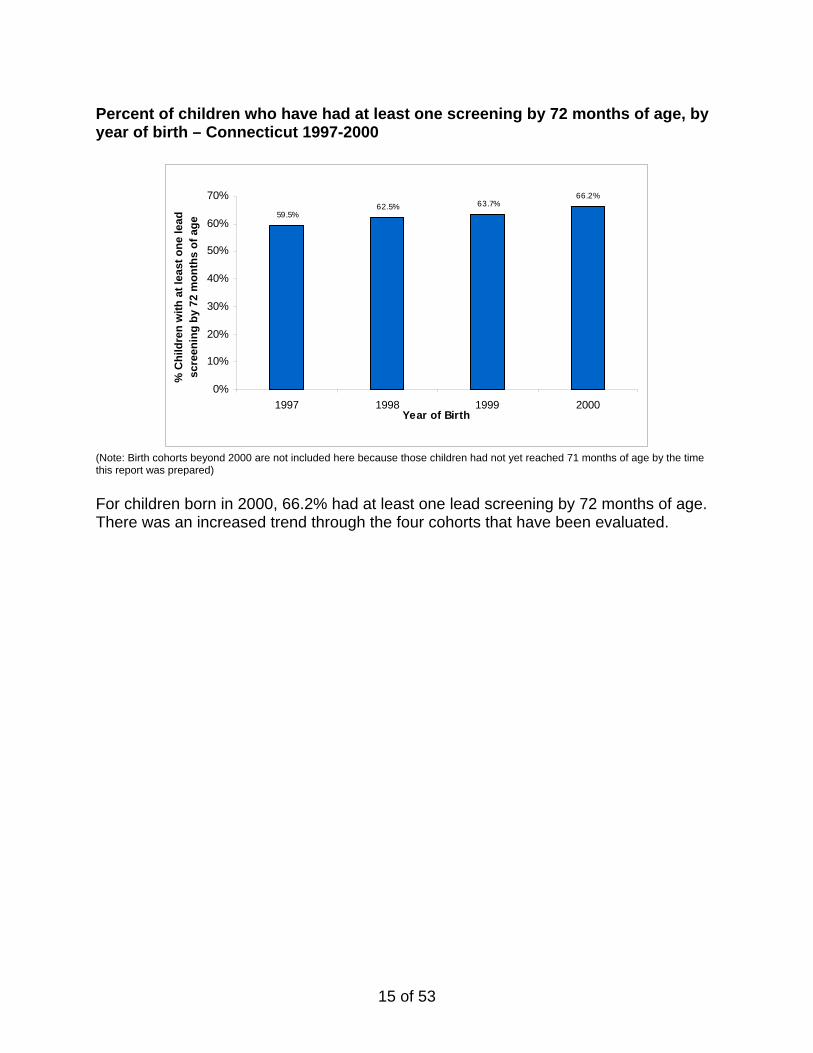
Percent of children who have had at least one screening by 72 months of age, by year of birth – Connecticut 1997-2000
59.5%62.5% 63.7%
66.2%
0%
10%
20%
30%
40%
50%
60%
70%
1997 1998 1999 2000Year of Birth
% C
hild
ren
with
at l
east
one
lead
sc
reen
ing
by 7
2 m
onth
s of
age
(Note: Birth cohorts beyond 2000 are not included here because those children had not yet reached 71 months of age by the time this report was prepared)
For children born in 2000, 66.2% had at least one lead screening by 72 months of age. There was an increased trend through the four cohorts that have been evaluated.
16 of 53
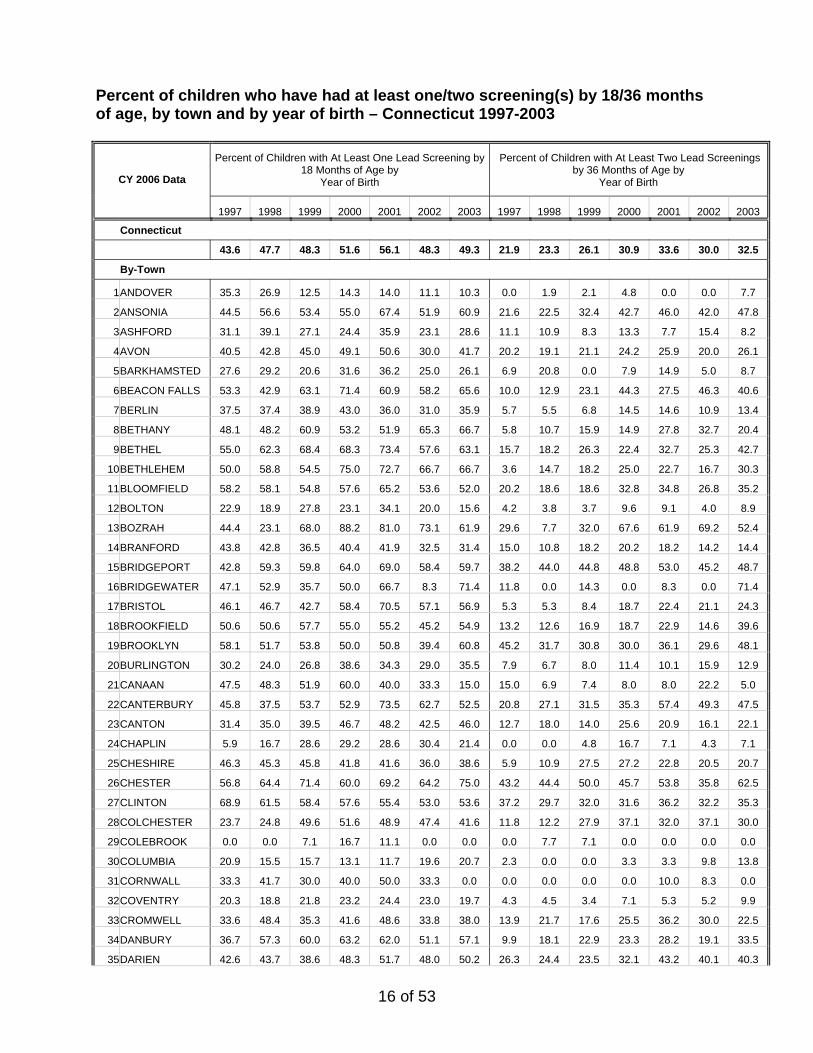
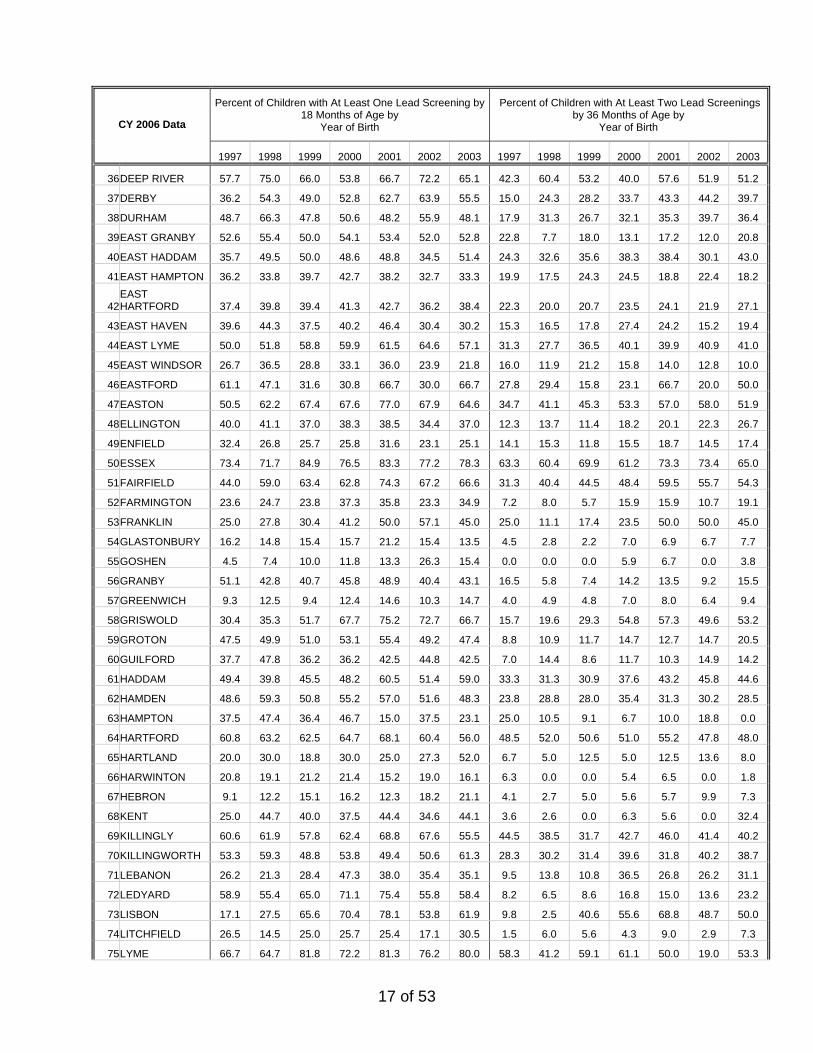
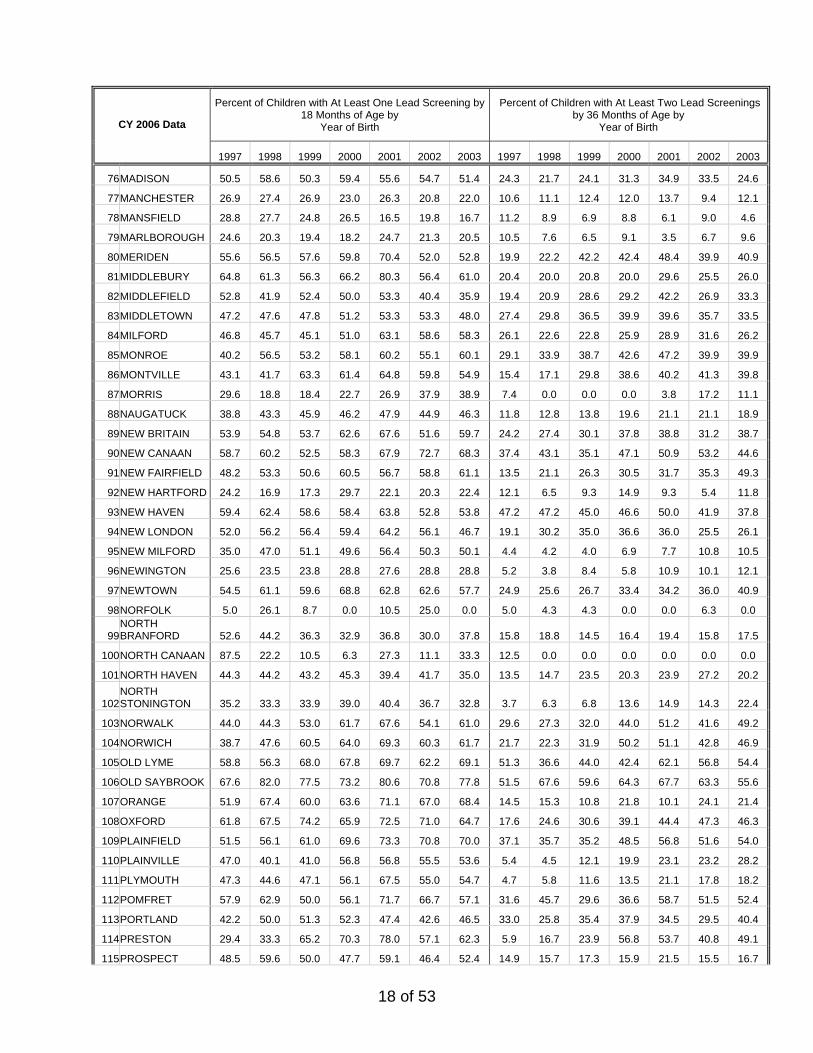
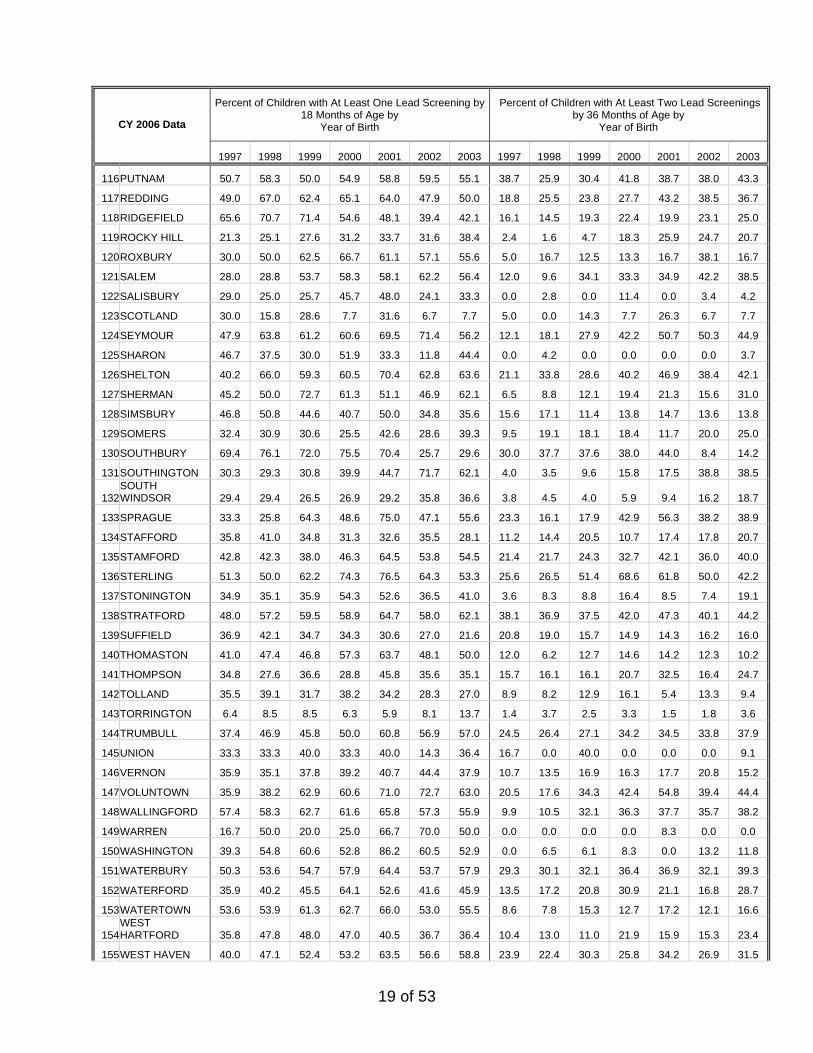
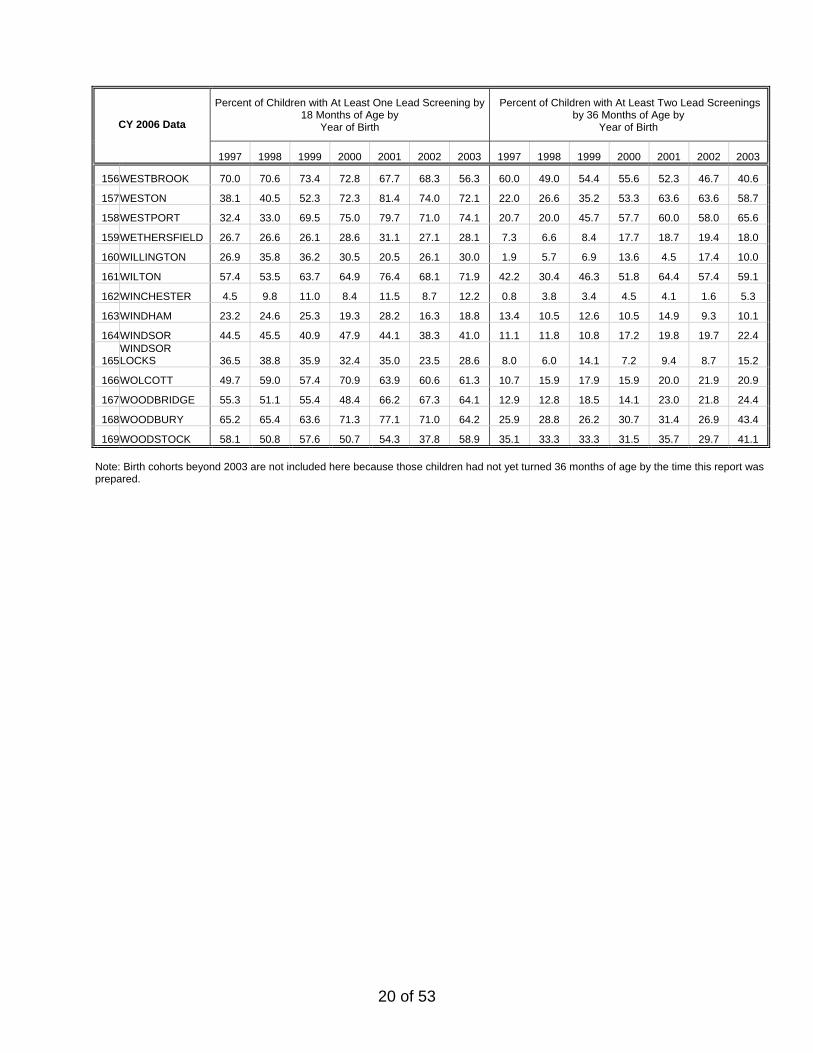
Percent of children who have had at least one/two screening(s) by 18/36 months of age, by town and by year of birth – Connecticut 1997-2003
Percent of Children with At Least One Lead Screening by 18 Months of Age by
Year of Birth
Percent of Children with At Least Two Lead Screenings by 36 Months of Age by
Year of Birth CY 2006 Data
1997 1998 1999 2000 2001 2002 2003 1997 1998 1999 2000 2001 2002 2003
Connecticut
43.6 47.7 48.3 51.6 56.1 48.3 49.3 21.9 23.3 26.1 30.9 33.6 30.0 32.5
By-Town
1ANDOVER 35.3 26.9 12.5 14.3 14.0 11.1 10.3 0.0 1.9 2.1 4.8 0.0 0.0 7.7
2ANSONIA 44.5 56.6 53.4 55.0 67.4 51.9 60.9 21.6 22.5 32.4 42.7 46.0 42.0 47.8
3ASHFORD 31.1 39.1 27.1 24.4 35.9 23.1 28.6 11.1 10.9 8.3 13.3 7.7 15.4 8.2
4AVON 40.5 42.8 45.0 49.1 50.6 30.0 41.7 20.2 19.1 21.1 24.2 25.9 20.0 26.1
5BARKHAMSTED 27.6 29.2 20.6 31.6 36.2 25.0 26.1 6.9 20.8 0.0 7.9 14.9 5.0 8.7
6BEACON FALLS 53.3 42.9 63.1 71.4 60.9 58.2 65.6 10.0 12.9 23.1 44.3 27.5 46.3 40.6
7BERLIN 37.5 37.4 38.9 43.0 36.0 31.0 35.9 5.7 5.5 6.8 14.5 14.6 10.9 13.4
8BETHANY 48.1 48.2 60.9 53.2 51.9 65.3 66.7 5.8 10.7 15.9 14.9 27.8 32.7 20.4
9BETHEL 55.0 62.3 68.4 68.3 73.4 57.6 63.1 15.7 18.2 26.3 22.4 32.7 25.3 42.7
10BETHLEHEM 50.0 58.8 54.5 75.0 72.7 66.7 66.7 3.6 14.7 18.2 25.0 22.7 16.7 30.3
11BLOOMFIELD 58.2 58.1 54.8 57.6 65.2 53.6 52.0 20.2 18.6 18.6 32.8 34.8 26.8 35.2
12BOLTON 22.9 18.9 27.8 23.1 34.1 20.0 15.6 4.2 3.8 3.7 9.6 9.1 4.0 8.9
13BOZRAH 44.4 23.1 68.0 88.2 81.0 73.1 61.9 29.6 7.7 32.0 67.6 61.9 69.2 52.4
14BRANFORD 43.8 42.8 36.5 40.4 41.9 32.5 31.4 15.0 10.8 18.2 20.2 18.2 14.2 14.4
15BRIDGEPORT 42.8 59.3 59.8 64.0 69.0 58.4 59.7 38.2 44.0 44.8 48.8 53.0 45.2 48.7
16BRIDGEWATER 47.1 52.9 35.7 50.0 66.7 8.3 71.4 11.8 0.0 14.3 0.0 8.3 0.0 71.4
17BRISTOL 46.1 46.7 42.7 58.4 70.5 57.1 56.9 5.3 5.3 8.4 18.7 22.4 21.1 24.3
18BROOKFIELD 50.6 50.6 57.7 55.0 55.2 45.2 54.9 13.2 12.6 16.9 18.7 22.9 14.6 39.6
19BROOKLYN 58.1 51.7 53.8 50.0 50.8 39.4 60.8 45.2 31.7 30.8 30.0 36.1 29.6 48.1
20BURLINGTON 30.2 24.0 26.8 38.6 34.3 29.0 35.5 7.9 6.7 8.0 11.4 10.1 15.9 12.9
21CANAAN 47.5 48.3 51.9 60.0 40.0 33.3 15.0 15.0 6.9 7.4 8.0 8.0 22.2 5.0
22CANTERBURY 45.8 37.5 53.7 52.9 73.5 62.7 52.5 20.8 27.1 31.5 35.3 57.4 49.3 47.5
23CANTON 31.4 35.0 39.5 46.7 48.2 42.5 46.0 12.7 18.0 14.0 25.6 20.9 16.1 22.1
24CHAPLIN 5.9 16.7 28.6 29.2 28.6 30.4 21.4 0.0 0.0 4.8 16.7 7.1 4.3 7.1
25CHESHIRE 46.3 45.3 45.8 41.8 41.6 36.0 38.6 5.9 10.9 27.5 27.2 22.8 20.5 20.7
26CHESTER 56.8 64.4 71.4 60.0 69.2 64.2 75.0 43.2 44.4 50.0 45.7 53.8 35.8 62.5
27CLINTON 68.9 61.5 58.4 57.6 55.4 53.0 53.6 37.2 29.7 32.0 31.6 36.2 32.2 35.3
28COLCHESTER 23.7 24.8 49.6 51.6 48.9 47.4 41.6 11.8 12.2 27.9 37.1 32.0 37.1 30.0
29COLEBROOK 0.0 0.0 7.1 16.7 11.1 0.0 0.0 0.0 7.7 7.1 0.0 0.0 0.0 0.0
30COLUMBIA 20.9 15.5 15.7 13.1 11.7 19.6 20.7 2.3 0.0 0.0 3.3 3.3 9.8 13.8
31CORNWALL 33.3 41.7 30.0 40.0 50.0 33.3 0.0 0.0 0.0 0.0 0.0 10.0 8.3 0.0
32COVENTRY 20.3 18.8 21.8 23.2 24.4 23.0 19.7 4.3 4.5 3.4 7.1 5.3 5.2 9.9
33CROMWELL 33.6 48.4 35.3 41.6 48.6 33.8 38.0 13.9 21.7 17.6 25.5 36.2 30.0 22.5
34DANBURY 36.7 57.3 60.0 63.2 62.0 51.1 57.1 9.9 18.1 22.9 23.3 28.2 19.1 33.5
35DARIEN 42.6 43.7 38.6 48.3 51.7 48.0 50.2 26.3 24.4 23.5 32.1 43.2 40.1 40.3
17 of 53
Percent of Children with At Least One Lead Screening by 18 Months of Age by
Year of Birth
Percent of Children with At Least Two Lead Screenings by 36 Months of Age by
Year of Birth CY 2006 Data
1997 1998 1999 2000 2001 2002 2003 1997 1998 1999 2000 2001 2002 2003
36DEEP RIVER 57.7 75.0 66.0 53.8 66.7 72.2 65.1 42.3 60.4 53.2 40.0 57.6 51.9 51.2
37DERBY 36.2 54.3 49.0 52.8 62.7 63.9 55.5 15.0 24.3 28.2 33.7 43.3 44.2 39.7
38DURHAM 48.7 66.3 47.8 50.6 48.2 55.9 48.1 17.9 31.3 26.7 32.1 35.3 39.7 36.4
39EAST GRANBY 52.6 55.4 50.0 54.1 53.4 52.0 52.8 22.8 7.7 18.0 13.1 17.2 12.0 20.8
40EAST HADDAM 35.7 49.5 50.0 48.6 48.8 34.5 51.4 24.3 32.6 35.6 38.3 38.4 30.1 43.0
41EAST HAMPTON 36.2 33.8 39.7 42.7 38.2 32.7 33.3 19.9 17.5 24.3 24.5 18.8 22.4 18.2
42EAST HARTFORD 37.4 39.8 39.4 41.3 42.7 36.2 38.4 22.3 20.0 20.7 23.5 24.1 21.9 27.1
43EAST HAVEN 39.6 44.3 37.5 40.2 46.4 30.4 30.2 15.3 16.5 17.8 27.4 24.2 15.2 19.4
44EAST LYME 50.0 51.8 58.8 59.9 61.5 64.6 57.1 31.3 27.7 36.5 40.1 39.9 40.9 41.0
45EAST WINDSOR 26.7 36.5 28.8 33.1 36.0 23.9 21.8 16.0 11.9 21.2 15.8 14.0 12.8 10.0
46EASTFORD 61.1 47.1 31.6 30.8 66.7 30.0 66.7 27.8 29.4 15.8 23.1 66.7 20.0 50.0
47EASTON 50.5 62.2 67.4 67.6 77.0 67.9 64.6 34.7 41.1 45.3 53.3 57.0 58.0 51.9
48ELLINGTON 40.0 41.1 37.0 38.3 38.5 34.4 37.0 12.3 13.7 11.4 18.2 20.1 22.3 26.7
49ENFIELD 32.4 26.8 25.7 25.8 31.6 23.1 25.1 14.1 15.3 11.8 15.5 18.7 14.5 17.4
50ESSEX 73.4 71.7 84.9 76.5 83.3 77.2 78.3 63.3 60.4 69.9 61.2 73.3 73.4 65.0
51FAIRFIELD 44.0 59.0 63.4 62.8 74.3 67.2 66.6 31.3 40.4 44.5 48.4 59.5 55.7 54.3
52FARMINGTON 23.6 24.7 23.8 37.3 35.8 23.3 34.9 7.2 8.0 5.7 15.9 15.9 10.7 19.1
53FRANKLIN 25.0 27.8 30.4 41.2 50.0 57.1 45.0 25.0 11.1 17.4 23.5 50.0 50.0 45.0
54GLASTONBURY 16.2 14.8 15.4 15.7 21.2 15.4 13.5 4.5 2.8 2.2 7.0 6.9 6.7 7.7
55GOSHEN 4.5 7.4 10.0 11.8 13.3 26.3 15.4 0.0 0.0 0.0 5.9 6.7 0.0 3.8
56GRANBY 51.1 42.8 40.7 45.8 48.9 40.4 43.1 16.5 5.8 7.4 14.2 13.5 9.2 15.5
57GREENWICH 9.3 12.5 9.4 12.4 14.6 10.3 14.7 4.0 4.9 4.8 7.0 8.0 6.4 9.4
58GRISWOLD 30.4 35.3 51.7 67.7 75.2 72.7 66.7 15.7 19.6 29.3 54.8 57.3 49.6 53.2
59GROTON 47.5 49.9 51.0 53.1 55.4 49.2 47.4 8.8 10.9 11.7 14.7 12.7 14.7 20.5
60GUILFORD 37.7 47.8 36.2 36.2 42.5 44.8 42.5 7.0 14.4 8.6 11.7 10.3 14.9 14.2
61HADDAM 49.4 39.8 45.5 48.2 60.5 51.4 59.0 33.3 31.3 30.9 37.6 43.2 45.8 44.6
62HAMDEN 48.6 59.3 50.8 55.2 57.0 51.6 48.3 23.8 28.8 28.0 35.4 31.3 30.2 28.5
63HAMPTON 37.5 47.4 36.4 46.7 15.0 37.5 23.1 25.0 10.5 9.1 6.7 10.0 18.8 0.0
64HARTFORD 60.8 63.2 62.5 64.7 68.1 60.4 56.0 48.5 52.0 50.6 51.0 55.2 47.8 48.0
65HARTLAND 20.0 30.0 18.8 30.0 25.0 27.3 52.0 6.7 5.0 12.5 5.0 12.5 13.6 8.0
66HARWINTON 20.8 19.1 21.2 21.4 15.2 19.0 16.1 6.3 0.0 0.0 5.4 6.5 0.0 1.8
67HEBRON 9.1 12.2 15.1 16.2 12.3 18.2 21.1 4.1 2.7 5.0 5.6 5.7 9.9 7.3
68KENT 25.0 44.7 40.0 37.5 44.4 34.6 44.1 3.6 2.6 0.0 6.3 5.6 0.0 32.4
69KILLINGLY 60.6 61.9 57.8 62.4 68.8 67.6 55.5 44.5 38.5 31.7 42.7 46.0 41.4 40.2
70KILLINGWORTH 53.3 59.3 48.8 53.8 49.4 50.6 61.3 28.3 30.2 31.4 39.6 31.8 40.2 38.7
71LEBANON 26.2 21.3 28.4 47.3 38.0 35.4 35.1 9.5 13.8 10.8 36.5 26.8 26.2 31.1
72LEDYARD 58.9 55.4 65.0 71.1 75.4 55.8 58.4 8.2 6.5 8.6 16.8 15.0 13.6 23.2
73LISBON 17.1 27.5 65.6 70.4 78.1 53.8 61.9 9.8 2.5 40.6 55.6 68.8 48.7 50.0
74LITCHFIELD 26.5 14.5 25.0 25.7 25.4 17.1 30.5 1.5 6.0 5.6 4.3 9.0 2.9 7.3
75LYME 66.7 64.7 81.8 72.2 81.3 76.2 80.0 58.3 41.2 59.1 61.1 50.0 19.0 53.3
18 of 53
Percent of Children with At Least One Lead Screening by 18 Months of Age by
Year of Birth
Percent of Children with At Least Two Lead Screenings by 36 Months of Age by
Year of Birth CY 2006 Data
1997 1998 1999 2000 2001 2002 2003 1997 1998 1999 2000 2001 2002 2003
76MADISON 50.5 58.6 50.3 59.4 55.6 54.7 51.4 24.3 21.7 24.1 31.3 34.9 33.5 24.6
77MANCHESTER 26.9 27.4 26.9 23.0 26.3 20.8 22.0 10.6 11.1 12.4 12.0 13.7 9.4 12.1
78MANSFIELD 28.8 27.7 24.8 26.5 16.5 19.8 16.7 11.2 8.9 6.9 8.8 6.1 9.0 4.6
79MARLBOROUGH 24.6 20.3 19.4 18.2 24.7 21.3 20.5 10.5 7.6 6.5 9.1 3.5 6.7 9.6
80MERIDEN 55.6 56.5 57.6 59.8 70.4 52.0 52.8 19.9 22.2 42.2 42.4 48.4 39.9 40.9
81MIDDLEBURY 64.8 61.3 56.3 66.2 80.3 56.4 61.0 20.4 20.0 20.8 20.0 29.6 25.5 26.0
82MIDDLEFIELD 52.8 41.9 52.4 50.0 53.3 40.4 35.9 19.4 20.9 28.6 29.2 42.2 26.9 33.3
83MIDDLETOWN 47.2 47.6 47.8 51.2 53.3 53.3 48.0 27.4 29.8 36.5 39.9 39.6 35.7 33.5
84MILFORD 46.8 45.7 45.1 51.0 63.1 58.6 58.3 26.1 22.6 22.8 25.9 28.9 31.6 26.2
85MONROE 40.2 56.5 53.2 58.1 60.2 55.1 60.1 29.1 33.9 38.7 42.6 47.2 39.9 39.9
86MONTVILLE 43.1 41.7 63.3 61.4 64.8 59.8 54.9 15.4 17.1 29.8 38.6 40.2 41.3 39.8
87MORRIS 29.6 18.8 18.4 22.7 26.9 37.9 38.9 7.4 0.0 0.0 0.0 3.8 17.2 11.1
88NAUGATUCK 38.8 43.3 45.9 46.2 47.9 44.9 46.3 11.8 12.8 13.8 19.6 21.1 21.1 18.9
89NEW BRITAIN 53.9 54.8 53.7 62.6 67.6 51.6 59.7 24.2 27.4 30.1 37.8 38.8 31.2 38.7
90NEW CANAAN 58.7 60.2 52.5 58.3 67.9 72.7 68.3 37.4 43.1 35.1 47.1 50.9 53.2 44.6
91NEW FAIRFIELD 48.2 53.3 50.6 60.5 56.7 58.8 61.1 13.5 21.1 26.3 30.5 31.7 35.3 49.3
92NEW HARTFORD 24.2 16.9 17.3 29.7 22.1 20.3 22.4 12.1 6.5 9.3 14.9 9.3 5.4 11.8
93NEW HAVEN 59.4 62.4 58.6 58.4 63.8 52.8 53.8 47.2 47.2 45.0 46.6 50.0 41.9 37.8
94NEW LONDON 52.0 56.2 56.4 59.4 64.2 56.1 46.7 19.1 30.2 35.0 36.6 36.0 25.5 26.1
95NEW MILFORD 35.0 47.0 51.1 49.6 56.4 50.3 50.1 4.4 4.2 4.0 6.9 7.7 10.8 10.5
96NEWINGTON 25.6 23.5 23.8 28.8 27.6 28.8 28.8 5.2 3.8 8.4 5.8 10.9 10.1 12.1
97NEWTOWN 54.5 61.1 59.6 68.8 62.8 62.6 57.7 24.9 25.6 26.7 33.4 34.2 36.0 40.9
98NORFOLK 5.0 26.1 8.7 0.0 10.5 25.0 0.0 5.0 4.3 4.3 0.0 0.0 6.3 0.0
99NORTH BRANFORD 52.6 44.2 36.3 32.9 36.8 30.0 37.8 15.8 18.8 14.5 16.4 19.4 15.8 17.5
100NORTH CANAAN 87.5 22.2 10.5 6.3 27.3 11.1 33.3 12.5 0.0 0.0 0.0 0.0 0.0 0.0
101NORTH HAVEN 44.3 44.2 43.2 45.3 39.4 41.7 35.0 13.5 14.7 23.5 20.3 23.9 27.2 20.2
102NORTH STONINGTON 35.2 33.3 33.9 39.0 40.4 36.7 32.8 3.7 6.3 6.8 13.6 14.9 14.3 22.4
103NORWALK 44.0 44.3 53.0 61.7 67.6 54.1 61.0 29.6 27.3 32.0 44.0 51.2 41.6 49.2
104NORWICH 38.7 47.6 60.5 64.0 69.3 60.3 61.7 21.7 22.3 31.9 50.2 51.1 42.8 46.9
105OLD LYME 58.8 56.3 68.0 67.8 69.7 62.2 69.1 51.3 36.6 44.0 42.4 62.1 56.8 54.4
106OLD SAYBROOK 67.6 82.0 77.5 73.2 80.6 70.8 77.8 51.5 67.6 59.6 64.3 67.7 63.3 55.6
107ORANGE 51.9 67.4 60.0 63.6 71.1 67.0 68.4 14.5 15.3 10.8 21.8 10.1 24.1 21.4
108OXFORD 61.8 67.5 74.2 65.9 72.5 71.0 64.7 17.6 24.6 30.6 39.1 44.4 47.3 46.3
109PLAINFIELD 51.5 56.1 61.0 69.6 73.3 70.8 70.0 37.1 35.7 35.2 48.5 56.8 51.6 54.0
110PLAINVILLE 47.0 40.1 41.0 56.8 56.8 55.5 53.6 5.4 4.5 12.1 19.9 23.1 23.2 28.2
111PLYMOUTH 47.3 44.6 47.1 56.1 67.5 55.0 54.7 4.7 5.8 11.6 13.5 21.1 17.8 18.2
112POMFRET 57.9 62.9 50.0 56.1 71.7 66.7 57.1 31.6 45.7 29.6 36.6 58.7 51.5 52.4
113PORTLAND 42.2 50.0 51.3 52.3 47.4 42.6 46.5 33.0 25.8 35.4 37.9 34.5 29.5 40.4
114PRESTON 29.4 33.3 65.2 70.3 78.0 57.1 62.3 5.9 16.7 23.9 56.8 53.7 40.8 49.1
115PROSPECT 48.5 59.6 50.0 47.7 59.1 46.4 52.4 14.9 15.7 17.3 15.9 21.5 15.5 16.7
19 of 53
Percent of Children with At Least One Lead Screening by 18 Months of Age by
Year of Birth
Percent of Children with At Least Two Lead Screenings by 36 Months of Age by
Year of Birth CY 2006 Data
1997 1998 1999 2000 2001 2002 2003 1997 1998 1999 2000 2001 2002 2003
116PUTNAM 50.7 58.3 50.0 54.9 58.8 59.5 55.1 38.7 25.9 30.4 41.8 38.7 38.0 43.3
117REDDING 49.0 67.0 62.4 65.1 64.0 47.9 50.0 18.8 25.5 23.8 27.7 43.2 38.5 36.7
118RIDGEFIELD 65.6 70.7 71.4 54.6 48.1 39.4 42.1 16.1 14.5 19.3 22.4 19.9 23.1 25.0
119ROCKY HILL 21.3 25.1 27.6 31.2 33.7 31.6 38.4 2.4 1.6 4.7 18.3 25.9 24.7 20.7
120ROXBURY 30.0 50.0 62.5 66.7 61.1 57.1 55.6 5.0 16.7 12.5 13.3 16.7 38.1 16.7
121SALEM 28.0 28.8 53.7 58.3 58.1 62.2 56.4 12.0 9.6 34.1 33.3 34.9 42.2 38.5
122SALISBURY 29.0 25.0 25.7 45.7 48.0 24.1 33.3 0.0 2.8 0.0 11.4 0.0 3.4 4.2
123SCOTLAND 30.0 15.8 28.6 7.7 31.6 6.7 7.7 5.0 0.0 14.3 7.7 26.3 6.7 7.7
124SEYMOUR 47.9 63.8 61.2 60.6 69.5 71.4 56.2 12.1 18.1 27.9 42.2 50.7 50.3 44.9
125SHARON 46.7 37.5 30.0 51.9 33.3 11.8 44.4 0.0 4.2 0.0 0.0 0.0 0.0 3.7
126SHELTON 40.2 66.0 59.3 60.5 70.4 62.8 63.6 21.1 33.8 28.6 40.2 46.9 38.4 42.1
127SHERMAN 45.2 50.0 72.7 61.3 51.1 46.9 62.1 6.5 8.8 12.1 19.4 21.3 15.6 31.0
128SIMSBURY 46.8 50.8 44.6 40.7 50.0 34.8 35.6 15.6 17.1 11.4 13.8 14.7 13.6 13.8
129SOMERS 32.4 30.9 30.6 25.5 42.6 28.6 39.3 9.5 19.1 18.1 18.4 11.7 20.0 25.0
130SOUTHBURY 69.4 76.1 72.0 75.5 70.4 25.7 29.6 30.0 37.7 37.6 38.0 44.0 8.4 14.2
131SOUTHINGTON 30.3 29.3 30.8 39.9 44.7 71.7 62.1 4.0 3.5 9.6 15.8 17.5 38.8 38.5
132SOUTH WINDSOR 29.4 29.4 26.5 26.9 29.2 35.8 36.6 3.8 4.5 4.0 5.9 9.4 16.2 18.7
133SPRAGUE 33.3 25.8 64.3 48.6 75.0 47.1 55.6 23.3 16.1 17.9 42.9 56.3 38.2 38.9
134STAFFORD 35.8 41.0 34.8 31.3 32.6 35.5 28.1 11.2 14.4 20.5 10.7 17.4 17.8 20.7
135STAMFORD 42.8 42.3 38.0 46.3 64.5 53.8 54.5 21.4 21.7 24.3 32.7 42.1 36.0 40.0
136STERLING 51.3 50.0 62.2 74.3 76.5 64.3 53.3 25.6 26.5 51.4 68.6 61.8 50.0 42.2
137STONINGTON 34.9 35.1 35.9 54.3 52.6 36.5 41.0 3.6 8.3 8.8 16.4 8.5 7.4 19.1
138STRATFORD 48.0 57.2 59.5 58.9 64.7 58.0 62.1 38.1 36.9 37.5 42.0 47.3 40.1 44.2
139SUFFIELD 36.9 42.1 34.7 34.3 30.6 27.0 21.6 20.8 19.0 15.7 14.9 14.3 16.2 16.0
140THOMASTON 41.0 47.4 46.8 57.3 63.7 48.1 50.0 12.0 6.2 12.7 14.6 14.2 12.3 10.2
141THOMPSON 34.8 27.6 36.6 28.8 45.8 35.6 35.1 15.7 16.1 16.1 20.7 32.5 16.4 24.7
142TOLLAND 35.5 39.1 31.7 38.2 34.2 28.3 27.0 8.9 8.2 12.9 16.1 5.4 13.3 9.4
143TORRINGTON 6.4 8.5 8.5 6.3 5.9 8.1 13.7 1.4 3.7 2.5 3.3 1.5 1.8 3.6
144TRUMBULL 37.4 46.9 45.8 50.0 60.8 56.9 57.0 24.5 26.4 27.1 34.2 34.5 33.8 37.9
145UNION 33.3 33.3 40.0 33.3 40.0 14.3 36.4 16.7 0.0 40.0 0.0 0.0 0.0 9.1
146VERNON 35.9 35.1 37.8 39.2 40.7 44.4 37.9 10.7 13.5 16.9 16.3 17.7 20.8 15.2
147VOLUNTOWN 35.9 38.2 62.9 60.6 71.0 72.7 63.0 20.5 17.6 34.3 42.4 54.8 39.4 44.4
148WALLINGFORD 57.4 58.3 62.7 61.6 65.8 57.3 55.9 9.9 10.5 32.1 36.3 37.7 35.7 38.2
149WARREN 16.7 50.0 20.0 25.0 66.7 70.0 50.0 0.0 0.0 0.0 0.0 8.3 0.0 0.0
150WASHINGTON 39.3 54.8 60.6 52.8 86.2 60.5 52.9 0.0 6.5 6.1 8.3 0.0 13.2 11.8
151WATERBURY 50.3 53.6 54.7 57.9 64.4 53.7 57.9 29.3 30.1 32.1 36.4 36.9 32.1 39.3
152WATERFORD 35.9 40.2 45.5 64.1 52.6 41.6 45.9 13.5 17.2 20.8 30.9 21.1 16.8 28.7
153WATERTOWN 53.6 53.9 61.3 62.7 66.0 53.0 55.5 8.6 7.8 15.3 12.7 17.2 12.1 16.6
154WEST HARTFORD 35.8 47.8 48.0 47.0 40.5 36.7 36.4 10.4 13.0 11.0 21.9 15.9 15.3 23.4
155WEST HAVEN 40.0 47.1 52.4 53.2 63.5 56.6 58.8 23.9 22.4 30.3 25.8 34.2 26.9 31.5
20 of 53
Percent of Children with At Least One Lead Screening by 18 Months of Age by
Year of Birth
Percent of Children with At Least Two Lead Screenings by 36 Months of Age by
Year of Birth CY 2006 Data
1997 1998 1999 2000 2001 2002 2003 1997 1998 1999 2000 2001 2002 2003
156WESTBROOK 70.0 70.6 73.4 72.8 67.7 68.3 56.3 60.0 49.0 54.4 55.6 52.3 46.7 40.6
157WESTON 38.1 40.5 52.3 72.3 81.4 74.0 72.1 22.0 26.6 35.2 53.3 63.6 63.6 58.7
158WESTPORT 32.4 33.0 69.5 75.0 79.7 71.0 74.1 20.7 20.0 45.7 57.7 60.0 58.0 65.6
159WETHERSFIELD 26.7 26.6 26.1 28.6 31.1 27.1 28.1 7.3 6.6 8.4 17.7 18.7 19.4 18.0
160WILLINGTON 26.9 35.8 36.2 30.5 20.5 26.1 30.0 1.9 5.7 6.9 13.6 4.5 17.4 10.0
161WILTON 57.4 53.5 63.7 64.9 76.4 68.1 71.9 42.2 30.4 46.3 51.8 64.4 57.4 59.1
162WINCHESTER 4.5 9.8 11.0 8.4 11.5 8.7 12.2 0.8 3.8 3.4 4.5 4.1 1.6 5.3
163WINDHAM 23.2 24.6 25.3 19.3 28.2 16.3 18.8 13.4 10.5 12.6 10.5 14.9 9.3 10.1
164WINDSOR 44.5 45.5 40.9 47.9 44.1 38.3 41.0 11.1 11.8 10.8 17.2 19.8 19.7 22.4
165WINDSOR LOCKS 36.5 38.8 35.9 32.4 35.0 23.5 28.6 8.0 6.0 14.1 7.2 9.4 8.7 15.2
166WOLCOTT 49.7 59.0 57.4 70.9 63.9 60.6 61.3 10.7 15.9 17.9 15.9 20.0 21.9 20.9
167WOODBRIDGE 55.3 51.1 55.4 48.4 66.2 67.3 64.1 12.9 12.8 18.5 14.1 23.0 21.8 24.4
168WOODBURY 65.2 65.4 63.6 71.3 77.1 71.0 64.2 25.9 28.8 26.2 30.7 31.4 26.9 43.4
169WOODSTOCK 58.1 50.8 57.6 50.7 54.3 37.8 58.9 35.1 33.3 33.3 31.5 35.7 29.7 41.1 Note: Birth cohorts beyond 2003 are not included here because those children had not yet turned 36 months of age by the time this report was prepared.
21 of 53
PREVALENCE OF ELEVATED BLOOD LEAD LEVELS Confirmation of Test Results – A lead test is considered ‘confirmed’ if it was:
1) A venous blood draw, 2) A capillary blood draw with a result of <10 µg/dL, 3) The second of two capillary blood draws, if both screenings results were ≥10
µg/dL and the blood tests were drawn within 12 weeks of one another, or 4) A capillary blood draw with a result of ≥10 µg/dL, if the previous lead test was
a confirmed elevated blood lead level of ≥10 µg/dL, regardless of the time lag between tests.
Prevalence of Elevated Blood Lead Levels – Prevalence of elevated blood lead levels is defined as the proportion of children under 6 years of age with a confirmed lead test in CY 2006 whose blood lead levels were ≥10 µg/dL. Prevalence of Significant Elevated Blood Lead Levels – Prevalence of significant elevated blood lead levels is defined as the proportion of children under 6 years of age with a confirmed lead test in CY 2006 whose blood lead levels were ≥20 µg/dL. Per Connecticut General Statutes, significant elevated blood lead levels require an epidemiological investigation including the inspection of residences for lead hazards by local health departments. In 2007, there was a legislative change in the action level that will be effective on Jan 1, 2009. Per Public Act 07-2, a second identified blood lead level of 15-19 µg/dL in children under 6 years of age will require an on-site inspection if the second test is more than 3 months apart from the initial 15-19 µg/dL test result. In this report, the prevalence of ≥15 µg/dL is added for the 2006 results.
22 of 53
Percent of children under 6 years of age with elevated blood lead, by calendar year and by blood lead levels – Connecticut 1995-2006*
2.5%2.2% 2.2%
1.8%1.6%
2.8%
3.5%3.1%
4.6%4.3%4.7%
6.1%
0.6%0.4%0.4%0.5%0.4%0.7%0.7%1.1%1.1%1.2%
1.6%
0.3% 0.3%
0%
1%
2%
3%
4%
5%
6%
7%
1995* 1996* 1997* 1998* 1999* 2000* 2001* 2002 2003 2004 2005 2006
Year
% C
hild
ren
with
Ele
vate
d B
lood
Lea
d>= 10 mcg/dL >= 15 mcg/dL >= 20 mcg/dL
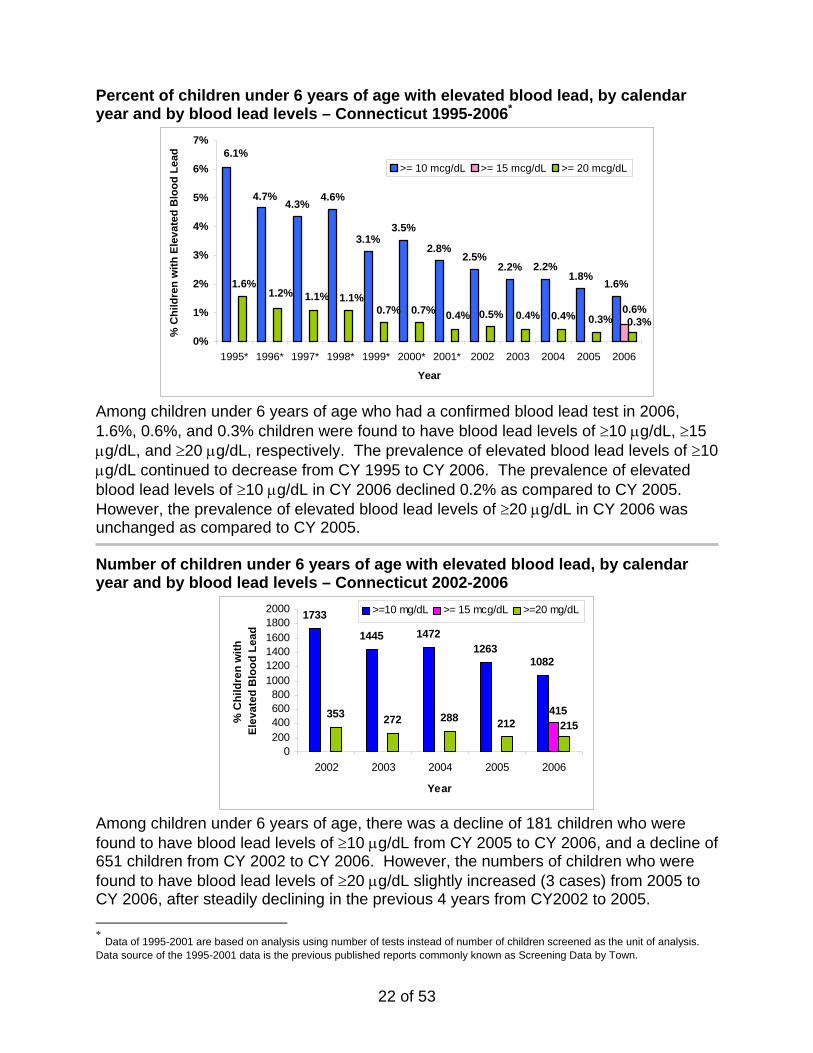
Among children under 6 years of age who had a confirmed blood lead test in 2006, 1.6%, 0.6%, and 0.3% children were found to have blood lead levels of ≥10 µg/dL, ≥15 µg/dL, and ≥20 µg/dL, respectively. The prevalence of elevated blood lead levels of ≥10 µg/dL continued to decrease from CY 1995 to CY 2006. The prevalence of elevated blood lead levels of ≥10 µg/dL in CY 2006 declined 0.2% as compared to CY 2005. However, the prevalence of elevated blood lead levels of ≥20 µg/dL in CY 2006 was unchanged as compared to CY 2005. Number of children under 6 years of age with elevated blood lead, by calendar year and by blood lead levels – Connecticut 2002-2006
1733
1445 14721263
1082
353 272 288 212415
215
0200400600800
100012001400160018002000
2002 2003 2004 2005 2006
Year
% C
hild
ren
with
El
evat
ed B
lood
Lea
d
>=10 mg/dL >= 15 mcg/dL >=20 mg/dL
Among children under 6 years of age, there was a decline of 181 children who were found to have blood lead levels of ≥10 µg/dL from CY 2005 to CY 2006, and a decline of 651 children from CY 2002 to CY 2006. However, the numbers of children who were found to have blood lead levels of ≥20 µg/dL slightly increased (3 cases) from 2005 to CY 2006, after steadily declining in the previous 4 years from CY2002 to 2005. * Data of 1995-2001 are based on analysis using number of tests instead of number of children screened as the unit of analysis. Data source of the 1995-2001 data is the previous published reports commonly known as Screening Data by Town.
23 of 53
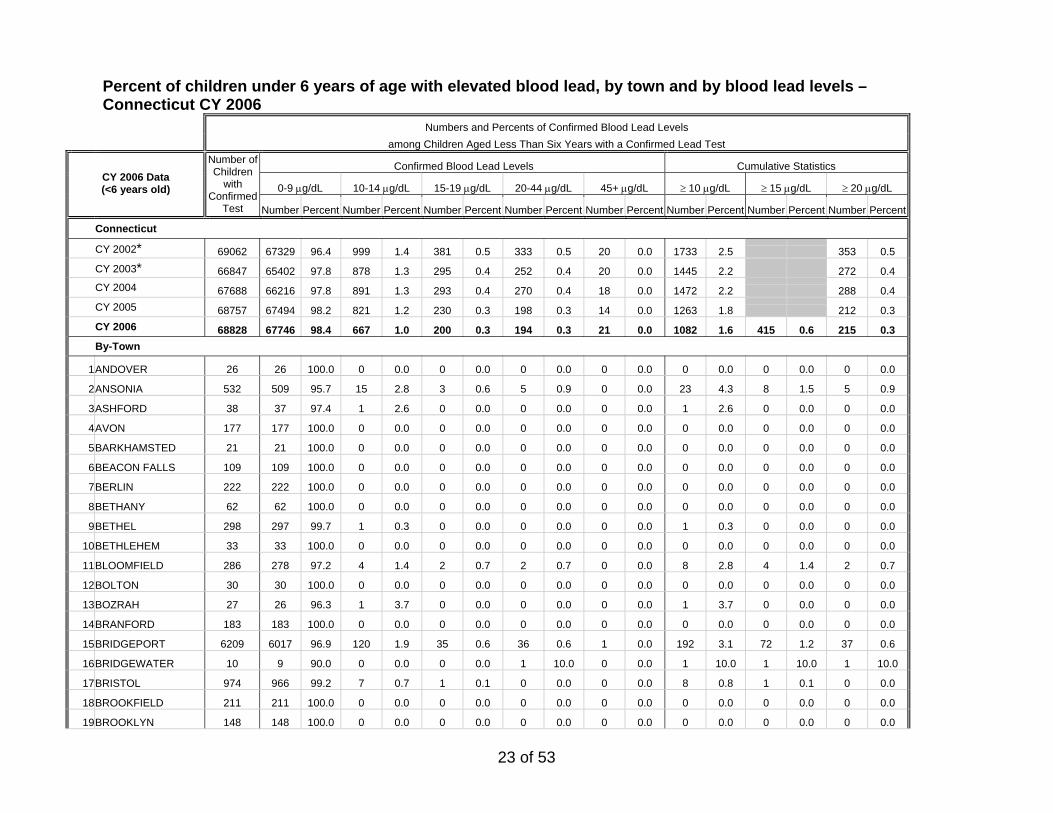
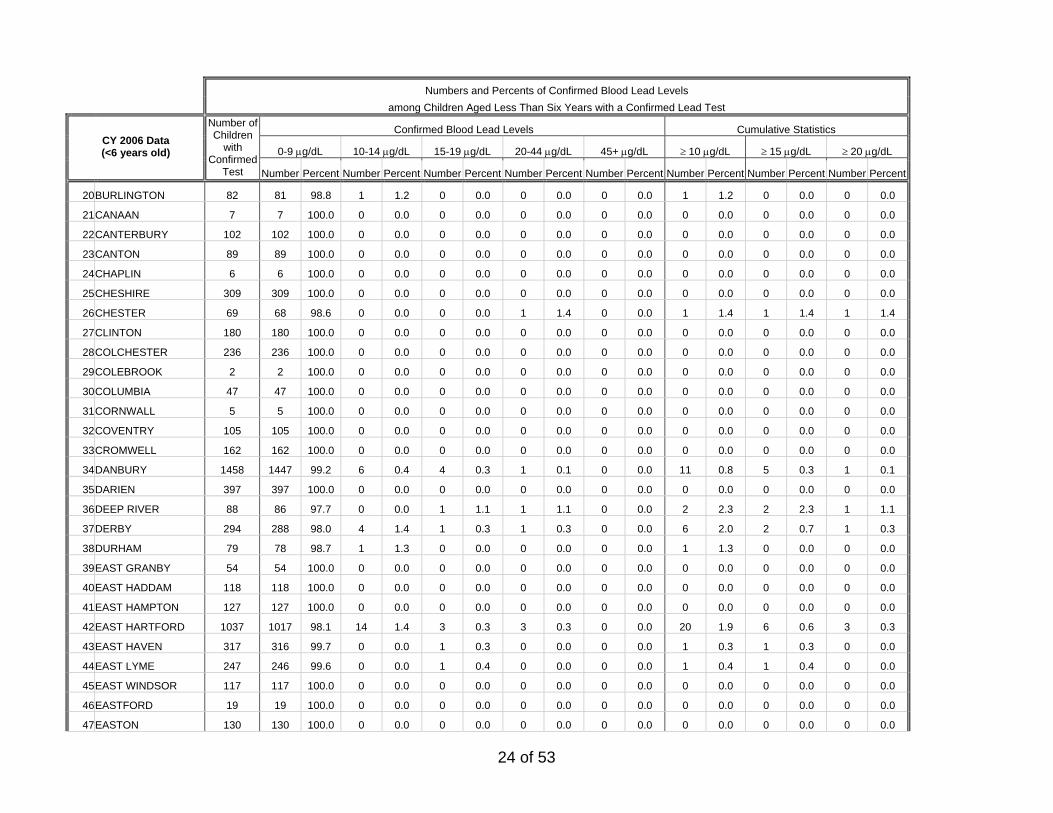
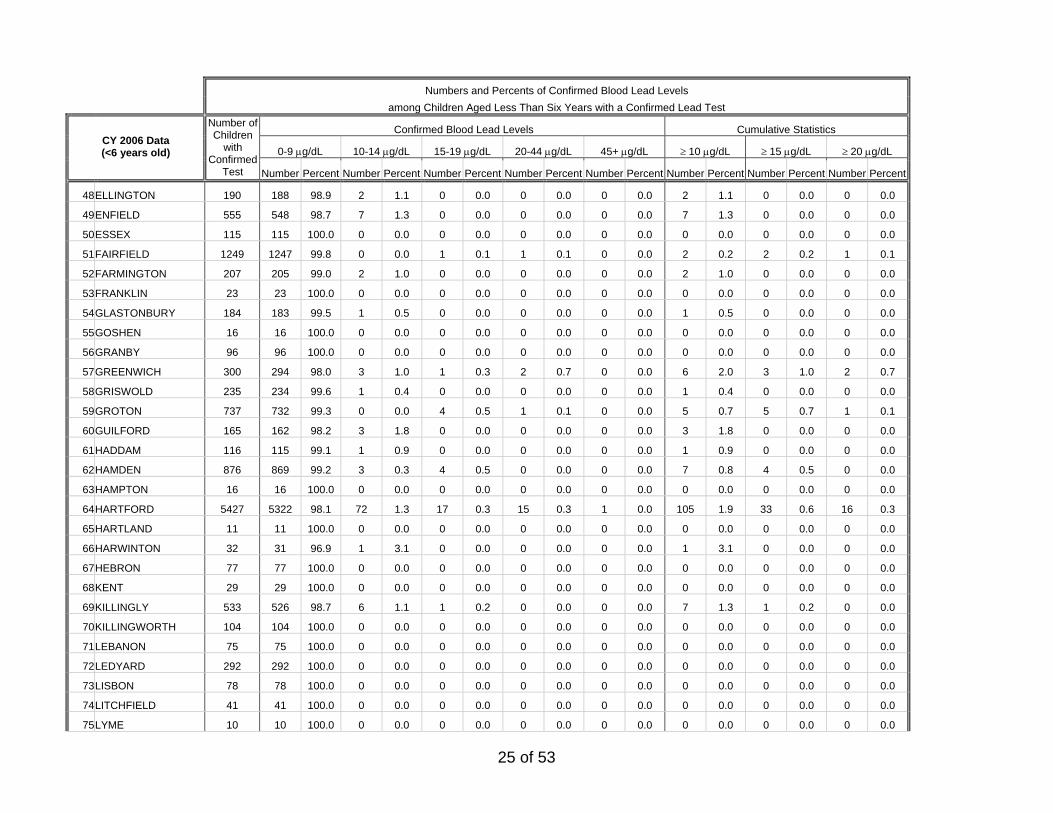
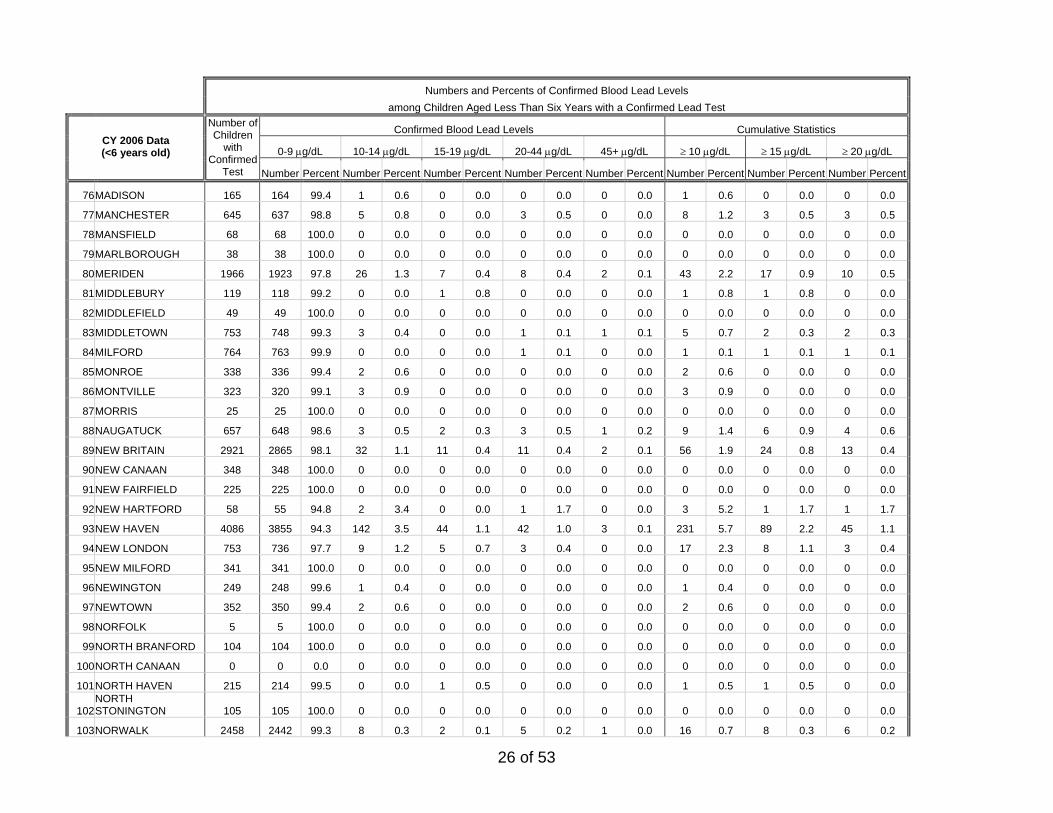
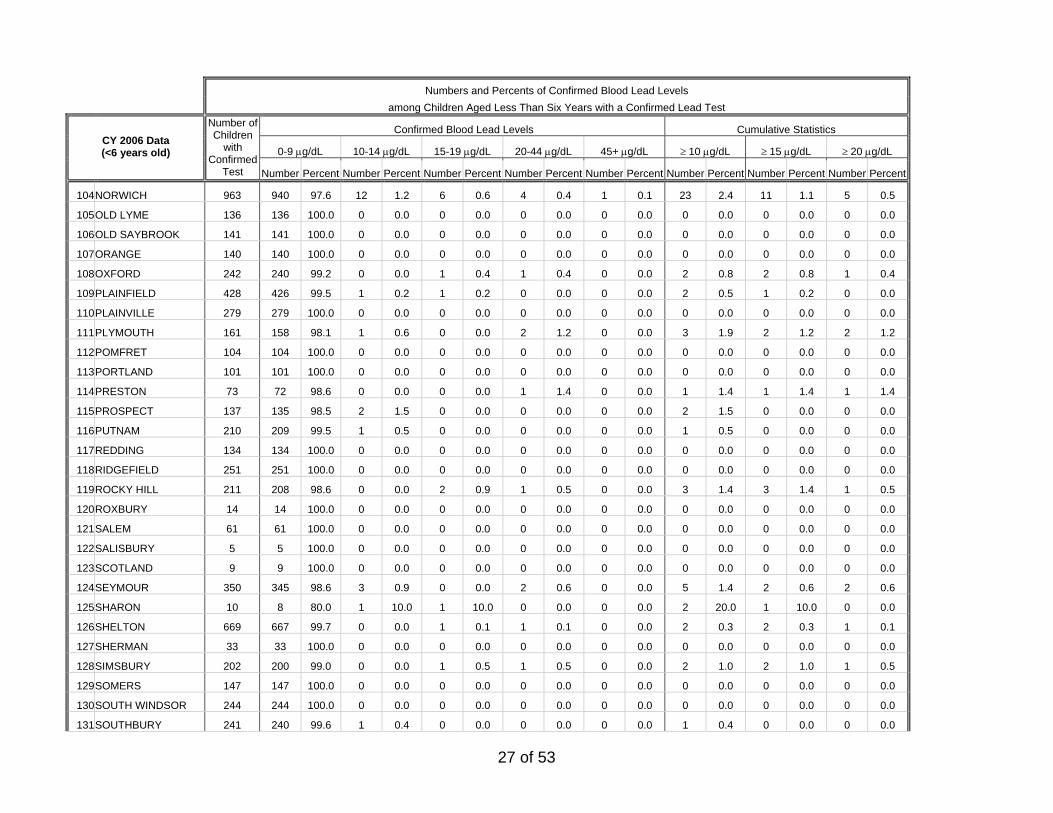
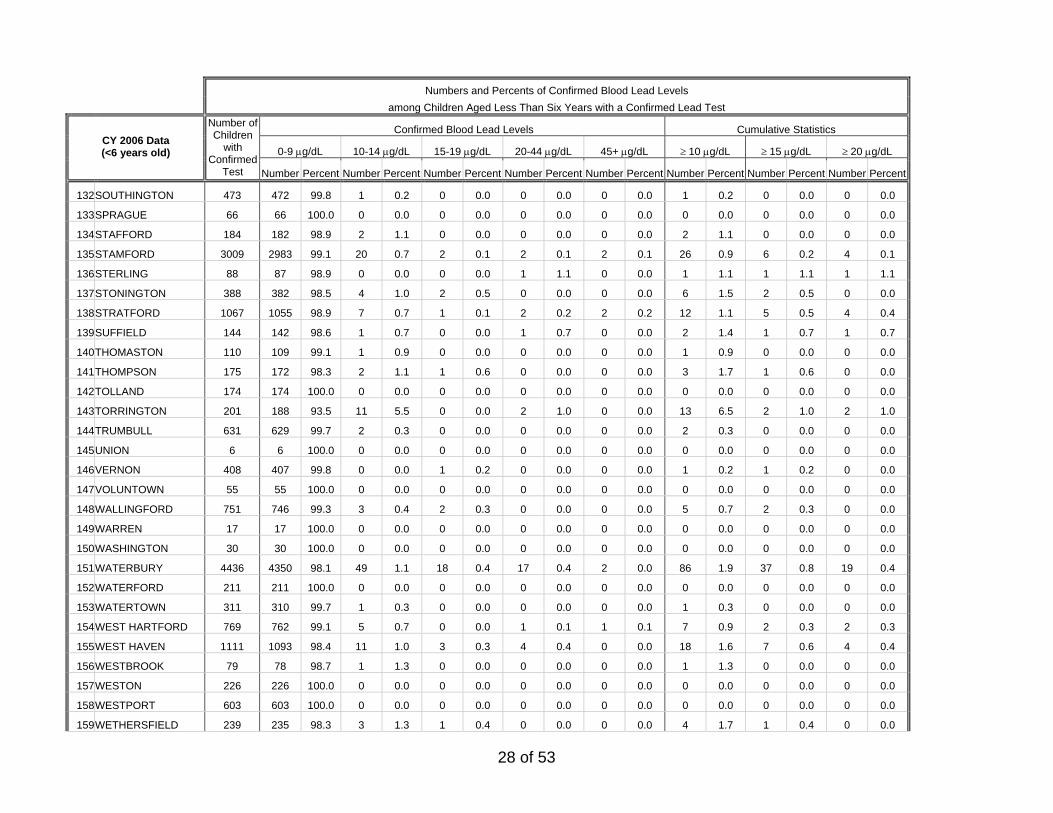
Percent of children under 6 years of age with elevated blood lead, by town and by blood lead levels – Connecticut CY 2006 Numbers and Percents of Confirmed Blood Lead Levels among Children Aged Less Than Six Years with a Confirmed Lead Test
Confirmed Blood Lead Levels Cumulative Statistics
0-9 µg/dL 10-14 µg/dL 15-19 µg/dL 20-44 µg/dL 45+ µg/dL ≥ 10 µg/dL ≥ 15 µg/dL ≥ 20 µg/dL CY 2006 Data (<6 years old)
Number of Children
with Confirmed
Test Number Percent Number Percent Number Percent Number Percent Number Percent Number Percent Number Percent Number Percent
Connecticut CY 2002* 69062 67329 96.4 999 1.4 381 0.5 333 0.5 20 0.0 1733 2.5 353 0.5 CY 2003* 66847 65402 97.8 878 1.3 295 0.4 252 0.4 20 0.0 1445 2.2 272 0.4 CY 2004 67688 66216 97.8 891 1.3 293 0.4 270 0.4 18 0.0 1472 2.2 288 0.4 CY 2005 68757 67494 98.2 821 1.2 230 0.3 198 0.3 14 0.0 1263 1.8 212 0.3 CY 2006 68828 67746 98.4 667 1.0 200 0.3 194 0.3 21 0.0 1082 1.6 415 0.6 215 0.3
By-Town
1 ANDOVER 26 26 100.0 0 0.0 0 0.0 0 0.0 0 0.0 0 0.0 0 0.0 0 0.0
2 ANSONIA 532 509 95.7 15 2.8 3 0.6 5 0.9 0 0.0 23 4.3 8 1.5 5 0.9
3 ASHFORD 38 37 97.4 1 2.6 0 0.0 0 0.0 0 0.0 1 2.6 0 0.0 0 0.0
4 AVON 177 177 100.0 0 0.0 0 0.0 0 0.0 0 0.0 0 0.0 0 0.0 0 0.0
5 BARKHAMSTED 21 21 100.0 0 0.0 0 0.0 0 0.0 0 0.0 0 0.0 0 0.0 0 0.0
6 BEACON FALLS 109 109 100.0 0 0.0 0 0.0 0 0.0 0 0.0 0 0.0 0 0.0 0 0.0
7 BERLIN 222 222 100.0 0 0.0 0 0.0 0 0.0 0 0.0 0 0.0 0 0.0 0 0.0
8 BETHANY 62 62 100.0 0 0.0 0 0.0 0 0.0 0 0.0 0 0.0 0 0.0 0 0.0
9 BETHEL 298 297 99.7 1 0.3 0 0.0 0 0.0 0 0.0 1 0.3 0 0.0 0 0.0
10 BETHLEHEM 33 33 100.0 0 0.0 0 0.0 0 0.0 0 0.0 0 0.0 0 0.0 0 0.0
11 BLOOMFIELD 286 278 97.2 4 1.4 2 0.7 2 0.7 0 0.0 8 2.8 4 1.4 2 0.7
12 BOLTON 30 30 100.0 0 0.0 0 0.0 0 0.0 0 0.0 0 0.0 0 0.0 0 0.0
13 BOZRAH 27 26 96.3 1 3.7 0 0.0 0 0.0 0 0.0 1 3.7 0 0.0 0 0.0
14 BRANFORD 183 183 100.0 0 0.0 0 0.0 0 0.0 0 0.0 0 0.0 0 0.0 0 0.0
15 BRIDGEPORT 6209 6017 96.9 120 1.9 35 0.6 36 0.6 1 0.0 192 3.1 72 1.2 37 0.6
16 BRIDGEWATER 10 9 90.0 0 0.0 0 0.0 1 10.0 0 0.0 1 10.0 1 10.0 1 10.0
17 BRISTOL 974 966 99.2 7 0.7 1 0.1 0 0.0 0 0.0 8 0.8 1 0.1 0 0.0
18 BROOKFIELD 211 211 100.0 0 0.0 0 0.0 0 0.0 0 0.0 0 0.0 0 0.0 0 0.0
19 BROOKLYN 148 148 100.0 0 0.0 0 0.0 0 0.0 0 0.0 0 0.0 0 0.0 0 0.0
24 of 53
Numbers and Percents of Confirmed Blood Lead Levels among Children Aged Less Than Six Years with a Confirmed Lead Test
Confirmed Blood Lead Levels Cumulative Statistics
0-9 µg/dL 10-14 µg/dL 15-19 µg/dL 20-44 µg/dL 45+ µg/dL ≥ 10 µg/dL ≥ 15 µg/dL ≥ 20 µg/dL CY 2006 Data (<6 years old)
Number of Children
with Confirmed
Test Number Percent Number Percent Number Percent Number Percent Number Percent Number Percent Number Percent Number Percent
20 BURLINGTON 82 81 98.8 1 1.2 0 0.0 0 0.0 0 0.0 1 1.2 0 0.0 0 0.0
21 CANAAN 7 7 100.0 0 0.0 0 0.0 0 0.0 0 0.0 0 0.0 0 0.0 0 0.0
22 CANTERBURY 102 102 100.0 0 0.0 0 0.0 0 0.0 0 0.0 0 0.0 0 0.0 0 0.0
23 CANTON 89 89 100.0 0 0.0 0 0.0 0 0.0 0 0.0 0 0.0 0 0.0 0 0.0
24 CHAPLIN 6 6 100.0 0 0.0 0 0.0 0 0.0 0 0.0 0 0.0 0 0.0 0 0.0
25 CHESHIRE 309 309 100.0 0 0.0 0 0.0 0 0.0 0 0.0 0 0.0 0 0.0 0 0.0
26 CHESTER 69 68 98.6 0 0.0 0 0.0 1 1.4 0 0.0 1 1.4 1 1.4 1 1.4
27 CLINTON 180 180 100.0 0 0.0 0 0.0 0 0.0 0 0.0 0 0.0 0 0.0 0 0.0
28 COLCHESTER 236 236 100.0 0 0.0 0 0.0 0 0.0 0 0.0 0 0.0 0 0.0 0 0.0
29 COLEBROOK 2 2 100.0 0 0.0 0 0.0 0 0.0 0 0.0 0 0.0 0 0.0 0 0.0
30 COLUMBIA 47 47 100.0 0 0.0 0 0.0 0 0.0 0 0.0 0 0.0 0 0.0 0 0.0
31 CORNWALL 5 5 100.0 0 0.0 0 0.0 0 0.0 0 0.0 0 0.0 0 0.0 0 0.0
32 COVENTRY 105 105 100.0 0 0.0 0 0.0 0 0.0 0 0.0 0 0.0 0 0.0 0 0.0
33 CROMWELL 162 162 100.0 0 0.0 0 0.0 0 0.0 0 0.0 0 0.0 0 0.0 0 0.0
34 DANBURY 1458 1447 99.2 6 0.4 4 0.3 1 0.1 0 0.0 11 0.8 5 0.3 1 0.1
35 DARIEN 397 397 100.0 0 0.0 0 0.0 0 0.0 0 0.0 0 0.0 0 0.0 0 0.0
36 DEEP RIVER 88 86 97.7 0 0.0 1 1.1 1 1.1 0 0.0 2 2.3 2 2.3 1 1.1
37 DERBY 294 288 98.0 4 1.4 1 0.3 1 0.3 0 0.0 6 2.0 2 0.7 1 0.3
38 DURHAM 79 78 98.7 1 1.3 0 0.0 0 0.0 0 0.0 1 1.3 0 0.0 0 0.0
39 EAST GRANBY 54 54 100.0 0 0.0 0 0.0 0 0.0 0 0.0 0 0.0 0 0.0 0 0.0
40 EAST HADDAM 118 118 100.0 0 0.0 0 0.0 0 0.0 0 0.0 0 0.0 0 0.0 0 0.0
41 EAST HAMPTON 127 127 100.0 0 0.0 0 0.0 0 0.0 0 0.0 0 0.0 0 0.0 0 0.0
42 EAST HARTFORD 1037 1017 98.1 14 1.4 3 0.3 3 0.3 0 0.0 20 1.9 6 0.6 3 0.3
43 EAST HAVEN 317 316 99.7 0 0.0 1 0.3 0 0.0 0 0.0 1 0.3 1 0.3 0 0.0
44 EAST LYME 247 246 99.6 0 0.0 1 0.4 0 0.0 0 0.0 1 0.4 1 0.4 0 0.0
45 EAST WINDSOR 117 117 100.0 0 0.0 0 0.0 0 0.0 0 0.0 0 0.0 0 0.0 0 0.0
46 EASTFORD 19 19 100.0 0 0.0 0 0.0 0 0.0 0 0.0 0 0.0 0 0.0 0 0.0
47 EASTON 130 130 100.0 0 0.0 0 0.0 0 0.0 0 0.0 0 0.0 0 0.0 0 0.0
25 of 53
Numbers and Percents of Confirmed Blood Lead Levels among Children Aged Less Than Six Years with a Confirmed Lead Test
Confirmed Blood Lead Levels Cumulative Statistics
0-9 µg/dL 10-14 µg/dL 15-19 µg/dL 20-44 µg/dL 45+ µg/dL ≥ 10 µg/dL ≥ 15 µg/dL ≥ 20 µg/dL CY 2006 Data (<6 years old)
Number of Children
with Confirmed
Test Number Percent Number Percent Number Percent Number Percent Number Percent Number Percent Number Percent Number Percent
48 ELLINGTON 190 188 98.9 2 1.1 0 0.0 0 0.0 0 0.0 2 1.1 0 0.0 0 0.0
49 ENFIELD 555 548 98.7 7 1.3 0 0.0 0 0.0 0 0.0 7 1.3 0 0.0 0 0.0
50 ESSEX 115 115 100.0 0 0.0 0 0.0 0 0.0 0 0.0 0 0.0 0 0.0 0 0.0
51 FAIRFIELD 1249 1247 99.8 0 0.0 1 0.1 1 0.1 0 0.0 2 0.2 2 0.2 1 0.1
52 FARMINGTON 207 205 99.0 2 1.0 0 0.0 0 0.0 0 0.0 2 1.0 0 0.0 0 0.0
53 FRANKLIN 23 23 100.0 0 0.0 0 0.0 0 0.0 0 0.0 0 0.0 0 0.0 0 0.0
54 GLASTONBURY 184 183 99.5 1 0.5 0 0.0 0 0.0 0 0.0 1 0.5 0 0.0 0 0.0
55 GOSHEN 16 16 100.0 0 0.0 0 0.0 0 0.0 0 0.0 0 0.0 0 0.0 0 0.0
56 GRANBY 96 96 100.0 0 0.0 0 0.0 0 0.0 0 0.0 0 0.0 0 0.0 0 0.0
57 GREENWICH 300 294 98.0 3 1.0 1 0.3 2 0.7 0 0.0 6 2.0 3 1.0 2 0.7
58 GRISWOLD 235 234 99.6 1 0.4 0 0.0 0 0.0 0 0.0 1 0.4 0 0.0 0 0.0
59 GROTON 737 732 99.3 0 0.0 4 0.5 1 0.1 0 0.0 5 0.7 5 0.7 1 0.1
60 GUILFORD 165 162 98.2 3 1.8 0 0.0 0 0.0 0 0.0 3 1.8 0 0.0 0 0.0
61 HADDAM 116 115 99.1 1 0.9 0 0.0 0 0.0 0 0.0 1 0.9 0 0.0 0 0.0
62 HAMDEN 876 869 99.2 3 0.3 4 0.5 0 0.0 0 0.0 7 0.8 4 0.5 0 0.0
63 HAMPTON 16 16 100.0 0 0.0 0 0.0 0 0.0 0 0.0 0 0.0 0 0.0 0 0.0
64 HARTFORD 5427 5322 98.1 72 1.3 17 0.3 15 0.3 1 0.0 105 1.9 33 0.6 16 0.3
65 HARTLAND 11 11 100.0 0 0.0 0 0.0 0 0.0 0 0.0 0 0.0 0 0.0 0 0.0
66 HARWINTON 32 31 96.9 1 3.1 0 0.0 0 0.0 0 0.0 1 3.1 0 0.0 0 0.0
67 HEBRON 77 77 100.0 0 0.0 0 0.0 0 0.0 0 0.0 0 0.0 0 0.0 0 0.0
68 KENT 29 29 100.0 0 0.0 0 0.0 0 0.0 0 0.0 0 0.0 0 0.0 0 0.0
69 KILLINGLY 533 526 98.7 6 1.1 1 0.2 0 0.0 0 0.0 7 1.3 1 0.2 0 0.0
70 KILLINGWORTH 104 104 100.0 0 0.0 0 0.0 0 0.0 0 0.0 0 0.0 0 0.0 0 0.0
71 LEBANON 75 75 100.0 0 0.0 0 0.0 0 0.0 0 0.0 0 0.0 0 0.0 0 0.0
72 LEDYARD 292 292 100.0 0 0.0 0 0.0 0 0.0 0 0.0 0 0.0 0 0.0 0 0.0
73 LISBON 78 78 100.0 0 0.0 0 0.0 0 0.0 0 0.0 0 0.0 0 0.0 0 0.0
74 LITCHFIELD 41 41 100.0 0 0.0 0 0.0 0 0.0 0 0.0 0 0.0 0 0.0 0 0.0
75 LYME 10 10 100.0 0 0.0 0 0.0 0 0.0 0 0.0 0 0.0 0 0.0 0 0.0
26 of 53
Numbers and Percents of Confirmed Blood Lead Levels among Children Aged Less Than Six Years with a Confirmed Lead Test
Confirmed Blood Lead Levels Cumulative Statistics
0-9 µg/dL 10-14 µg/dL 15-19 µg/dL 20-44 µg/dL 45+ µg/dL ≥ 10 µg/dL ≥ 15 µg/dL ≥ 20 µg/dL CY 2006 Data (<6 years old)
Number of Children
with Confirmed
Test Number Percent Number Percent Number Percent Number Percent Number Percent Number Percent Number Percent Number Percent
76 MADISON 165 164 99.4 1 0.6 0 0.0 0 0.0 0 0.0 1 0.6 0 0.0 0 0.0
77 MANCHESTER 645 637 98.8 5 0.8 0 0.0 3 0.5 0 0.0 8 1.2 3 0.5 3 0.5
78 MANSFIELD 68 68 100.0 0 0.0 0 0.0 0 0.0 0 0.0 0 0.0 0 0.0 0 0.0
79 MARLBOROUGH 38 38 100.0 0 0.0 0 0.0 0 0.0 0 0.0 0 0.0 0 0.0 0 0.0
80 MERIDEN 1966 1923 97.8 26 1.3 7 0.4 8 0.4 2 0.1 43 2.2 17 0.9 10 0.5
81 MIDDLEBURY 119 118 99.2 0 0.0 1 0.8 0 0.0 0 0.0 1 0.8 1 0.8 0 0.0
82 MIDDLEFIELD 49 49 100.0 0 0.0 0 0.0 0 0.0 0 0.0 0 0.0 0 0.0 0 0.0
83 MIDDLETOWN 753 748 99.3 3 0.4 0 0.0 1 0.1 1 0.1 5 0.7 2 0.3 2 0.3
84 MILFORD 764 763 99.9 0 0.0 0 0.0 1 0.1 0 0.0 1 0.1 1 0.1 1 0.1
85 MONROE 338 336 99.4 2 0.6 0 0.0 0 0.0 0 0.0 2 0.6 0 0.0 0 0.0
86 MONTVILLE 323 320 99.1 3 0.9 0 0.0 0 0.0 0 0.0 3 0.9 0 0.0 0 0.0
87 MORRIS 25 25 100.0 0 0.0 0 0.0 0 0.0 0 0.0 0 0.0 0 0.0 0 0.0
88 NAUGATUCK 657 648 98.6 3 0.5 2 0.3 3 0.5 1 0.2 9 1.4 6 0.9 4 0.6
89 NEW BRITAIN 2921 2865 98.1 32 1.1 11 0.4 11 0.4 2 0.1 56 1.9 24 0.8 13 0.4
90 NEW CANAAN 348 348 100.0 0 0.0 0 0.0 0 0.0 0 0.0 0 0.0 0 0.0 0 0.0
91 NEW FAIRFIELD 225 225 100.0 0 0.0 0 0.0 0 0.0 0 0.0 0 0.0 0 0.0 0 0.0
92 NEW HARTFORD 58 55 94.8 2 3.4 0 0.0 1 1.7 0 0.0 3 5.2 1 1.7 1 1.7
93 NEW HAVEN 4086 3855 94.3 142 3.5 44 1.1 42 1.0 3 0.1 231 5.7 89 2.2 45 1.1
94 NEW LONDON 753 736 97.7 9 1.2 5 0.7 3 0.4 0 0.0 17 2.3 8 1.1 3 0.4
95 NEW MILFORD 341 341 100.0 0 0.0 0 0.0 0 0.0 0 0.0 0 0.0 0 0.0 0 0.0
96 NEWINGTON 249 248 99.6 1 0.4 0 0.0 0 0.0 0 0.0 1 0.4 0 0.0 0 0.0
97 NEWTOWN 352 350 99.4 2 0.6 0 0.0 0 0.0 0 0.0 2 0.6 0 0.0 0 0.0
98 NORFOLK 5 5 100.0 0 0.0 0 0.0 0 0.0 0 0.0 0 0.0 0 0.0 0 0.0
99 NORTH BRANFORD 104 104 100.0 0 0.0 0 0.0 0 0.0 0 0.0 0 0.0 0 0.0 0 0.0
100 NORTH CANAAN 0 0 0.0 0 0.0 0 0.0 0 0.0 0 0.0 0 0.0 0 0.0 0 0.0
101 NORTH HAVEN 215 214 99.5 0 0.0 1 0.5 0 0.0 0 0.0 1 0.5 1 0.5 0 0.0
102 NORTH STONINGTON 105 105 100.0 0 0.0 0 0.0 0 0.0 0 0.0 0 0.0 0 0.0 0 0.0
103 NORWALK 2458 2442 99.3 8 0.3 2 0.1 5 0.2 1 0.0 16 0.7 8 0.3 6 0.2
27 of 53
Numbers and Percents of Confirmed Blood Lead Levels among Children Aged Less Than Six Years with a Confirmed Lead Test
Confirmed Blood Lead Levels Cumulative Statistics
0-9 µg/dL 10-14 µg/dL 15-19 µg/dL 20-44 µg/dL 45+ µg/dL ≥ 10 µg/dL ≥ 15 µg/dL ≥ 20 µg/dL CY 2006 Data (<6 years old)
Number of Children
with Confirmed
Test Number Percent Number Percent Number Percent Number Percent Number Percent Number Percent Number Percent Number Percent
104 NORWICH 963 940 97.6 12 1.2 6 0.6 4 0.4 1 0.1 23 2.4 11 1.1 5 0.5
105 OLD LYME 136 136 100.0 0 0.0 0 0.0 0 0.0 0 0.0 0 0.0 0 0.0 0 0.0
106 OLD SAYBROOK 141 141 100.0 0 0.0 0 0.0 0 0.0 0 0.0 0 0.0 0 0.0 0 0.0
107 ORANGE 140 140 100.0 0 0.0 0 0.0 0 0.0 0 0.0 0 0.0 0 0.0 0 0.0
108 OXFORD 242 240 99.2 0 0.0 1 0.4 1 0.4 0 0.0 2 0.8 2 0.8 1 0.4
109 PLAINFIELD 428 426 99.5 1 0.2 1 0.2 0 0.0 0 0.0 2 0.5 1 0.2 0 0.0
110 PLAINVILLE 279 279 100.0 0 0.0 0 0.0 0 0.0 0 0.0 0 0.0 0 0.0 0 0.0
111 PLYMOUTH 161 158 98.1 1 0.6 0 0.0 2 1.2 0 0.0 3 1.9 2 1.2 2 1.2
112 POMFRET 104 104 100.0 0 0.0 0 0.0 0 0.0 0 0.0 0 0.0 0 0.0 0 0.0
113 PORTLAND 101 101 100.0 0 0.0 0 0.0 0 0.0 0 0.0 0 0.0 0 0.0 0 0.0
114 PRESTON 73 72 98.6 0 0.0 0 0.0 1 1.4 0 0.0 1 1.4 1 1.4 1 1.4
115 PROSPECT 137 135 98.5 2 1.5 0 0.0 0 0.0 0 0.0 2 1.5 0 0.0 0 0.0
116 PUTNAM 210 209 99.5 1 0.5 0 0.0 0 0.0 0 0.0 1 0.5 0 0.0 0 0.0
117 REDDING 134 134 100.0 0 0.0 0 0.0 0 0.0 0 0.0 0 0.0 0 0.0 0 0.0
118 RIDGEFIELD 251 251 100.0 0 0.0 0 0.0 0 0.0 0 0.0 0 0.0 0 0.0 0 0.0
119 ROCKY HILL 211 208 98.6 0 0.0 2 0.9 1 0.5 0 0.0 3 1.4 3 1.4 1 0.5
120 ROXBURY 14 14 100.0 0 0.0 0 0.0 0 0.0 0 0.0 0 0.0 0 0.0 0 0.0
121 SALEM 61 61 100.0 0 0.0 0 0.0 0 0.0 0 0.0 0 0.0 0 0.0 0 0.0
122 SALISBURY 5 5 100.0 0 0.0 0 0.0 0 0.0 0 0.0 0 0.0 0 0.0 0 0.0
123 SCOTLAND 9 9 100.0 0 0.0 0 0.0 0 0.0 0 0.0 0 0.0 0 0.0 0 0.0
124 SEYMOUR 350 345 98.6 3 0.9 0 0.0 2 0.6 0 0.0 5 1.4 2 0.6 2 0.6
125 SHARON 10 8 80.0 1 10.0 1 10.0 0 0.0 0 0.0 2 20.0 1 10.0 0 0.0
126 SHELTON 669 667 99.7 0 0.0 1 0.1 1 0.1 0 0.0 2 0.3 2 0.3 1 0.1
127 SHERMAN 33 33 100.0 0 0.0 0 0.0 0 0.0 0 0.0 0 0.0 0 0.0 0 0.0
128 SIMSBURY 202 200 99.0 0 0.0 1 0.5 1 0.5 0 0.0 2 1.0 2 1.0 1 0.5
129 SOMERS 147 147 100.0 0 0.0 0 0.0 0 0.0 0 0.0 0 0.0 0 0.0 0 0.0
130 SOUTH WINDSOR 244 244 100.0 0 0.0 0 0.0 0 0.0 0 0.0 0 0.0 0 0.0 0 0.0
131 SOUTHBURY 241 240 99.6 1 0.4 0 0.0 0 0.0 0 0.0 1 0.4 0 0.0 0 0.0
28 of 53
Numbers and Percents of Confirmed Blood Lead Levels among Children Aged Less Than Six Years with a Confirmed Lead Test
Confirmed Blood Lead Levels Cumulative Statistics
0-9 µg/dL 10-14 µg/dL 15-19 µg/dL 20-44 µg/dL 45+ µg/dL ≥ 10 µg/dL ≥ 15 µg/dL ≥ 20 µg/dL CY 2006 Data (<6 years old)
Number of Children
with Confirmed
Test Number Percent Number Percent Number Percent Number Percent Number Percent Number Percent Number Percent Number Percent
132 SOUTHINGTON 473 472 99.8 1 0.2 0 0.0 0 0.0 0 0.0 1 0.2 0 0.0 0 0.0
133 SPRAGUE 66 66 100.0 0 0.0 0 0.0 0 0.0 0 0.0 0 0.0 0 0.0 0 0.0
134 STAFFORD 184 182 98.9 2 1.1 0 0.0 0 0.0 0 0.0 2 1.1 0 0.0 0 0.0
135 STAMFORD 3009 2983 99.1 20 0.7 2 0.1 2 0.1 2 0.1 26 0.9 6 0.2 4 0.1
136 STERLING 88 87 98.9 0 0.0 0 0.0 1 1.1 0 0.0 1 1.1 1 1.1 1 1.1
137 STONINGTON 388 382 98.5 4 1.0 2 0.5 0 0.0 0 0.0 6 1.5 2 0.5 0 0.0
138 STRATFORD 1067 1055 98.9 7 0.7 1 0.1 2 0.2 2 0.2 12 1.1 5 0.5 4 0.4
139 SUFFIELD 144 142 98.6 1 0.7 0 0.0 1 0.7 0 0.0 2 1.4 1 0.7 1 0.7
140 THOMASTON 110 109 99.1 1 0.9 0 0.0 0 0.0 0 0.0 1 0.9 0 0.0 0 0.0
141 THOMPSON 175 172 98.3 2 1.1 1 0.6 0 0.0 0 0.0 3 1.7 1 0.6 0 0.0
142 TOLLAND 174 174 100.0 0 0.0 0 0.0 0 0.0 0 0.0 0 0.0 0 0.0 0 0.0
143 TORRINGTON 201 188 93.5 11 5.5 0 0.0 2 1.0 0 0.0 13 6.5 2 1.0 2 1.0
144 TRUMBULL 631 629 99.7 2 0.3 0 0.0 0 0.0 0 0.0 2 0.3 0 0.0 0 0.0
145 UNION 6 6 100.0 0 0.0 0 0.0 0 0.0 0 0.0 0 0.0 0 0.0 0 0.0
146 VERNON 408 407 99.8 0 0.0 1 0.2 0 0.0 0 0.0 1 0.2 1 0.2 0 0.0
147 VOLUNTOWN 55 55 100.0 0 0.0 0 0.0 0 0.0 0 0.0 0 0.0 0 0.0 0 0.0
148 WALLINGFORD 751 746 99.3 3 0.4 2 0.3 0 0.0 0 0.0 5 0.7 2 0.3 0 0.0
149 WARREN 17 17 100.0 0 0.0 0 0.0 0 0.0 0 0.0 0 0.0 0 0.0 0 0.0
150 WASHINGTON 30 30 100.0 0 0.0 0 0.0 0 0.0 0 0.0 0 0.0 0 0.0 0 0.0
151 WATERBURY 4436 4350 98.1 49 1.1 18 0.4 17 0.4 2 0.0 86 1.9 37 0.8 19 0.4
152 WATERFORD 211 211 100.0 0 0.0 0 0.0 0 0.0 0 0.0 0 0.0 0 0.0 0 0.0
153 WATERTOWN 311 310 99.7 1 0.3 0 0.0 0 0.0 0 0.0 1 0.3 0 0.0 0 0.0
154 WEST HARTFORD 769 762 99.1 5 0.7 0 0.0 1 0.1 1 0.1 7 0.9 2 0.3 2 0.3
155 WEST HAVEN 1111 1093 98.4 11 1.0 3 0.3 4 0.4 0 0.0 18 1.6 7 0.6 4 0.4
156 WESTBROOK 79 78 98.7 1 1.3 0 0.0 0 0.0 0 0.0 1 1.3 0 0.0 0 0.0
157 WESTON 226 226 100.0 0 0.0 0 0.0 0 0.0 0 0.0 0 0.0 0 0.0 0 0.0
158 WESTPORT 603 603 100.0 0 0.0 0 0.0 0 0.0 0 0.0 0 0.0 0 0.0 0 0.0
159 WETHERSFIELD 239 235 98.3 3 1.3 1 0.4 0 0.0 0 0.0 4 1.7 1 0.4 0 0.0
29 of 53
Numbers and Percents of Confirmed Blood Lead Levels among Children Aged Less Than Six Years with a Confirmed Lead Test
Confirmed Blood Lead Levels Cumulative Statistics
0-9 µg/dL 10-14 µg/dL 15-19 µg/dL 20-44 µg/dL 45+ µg/dL ≥ 10 µg/dL ≥ 15 µg/dL ≥ 20 µg/dL CY 2006 Data (<6 years old)
Number of Children
with Confirmed
Test Number Percent Number Percent Number Percent Number Percent Number Percent Number Percent Number Percent Number Percent
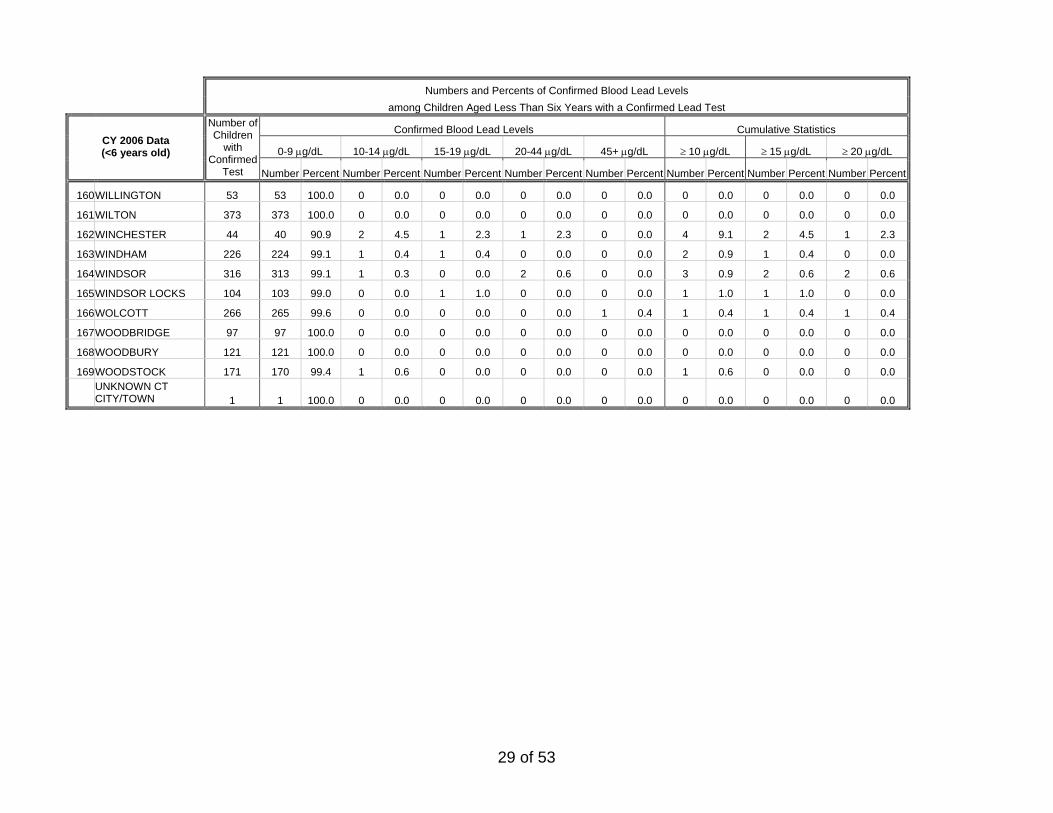
160 WILLINGTON 53 53 100.0 0 0.0 0 0.0 0 0.0 0 0.0 0 0.0 0 0.0 0 0.0
161 WILTON 373 373 100.0 0 0.0 0 0.0 0 0.0 0 0.0 0 0.0 0 0.0 0 0.0
162 WINCHESTER 44 40 90.9 2 4.5 1 2.3 1 2.3 0 0.0 4 9.1 2 4.5 1 2.3
163 WINDHAM 226 224 99.1 1 0.4 1 0.4 0 0.0 0 0.0 2 0.9 1 0.4 0 0.0
164 WINDSOR 316 313 99.1 1 0.3 0 0.0 2 0.6 0 0.0 3 0.9 2 0.6 2 0.6
165 WINDSOR LOCKS 104 103 99.0 0 0.0 1 1.0 0 0.0 0 0.0 1 1.0 1 1.0 0 0.0
166 WOLCOTT 266 265 99.6 0 0.0 0 0.0 0 0.0 1 0.4 1 0.4 1 0.4 1 0.4
167 WOODBRIDGE 97 97 100.0 0 0.0 0 0.0 0 0.0 0 0.0 0 0.0 0 0.0 0 0.0
168 WOODBURY 121 121 100.0 0 0.0 0 0.0 0 0.0 0 0.0 0 0.0 0 0.0 0 0.0
169 WOODSTOCK 171 170 99.4 1 0.6 0 0.0 0 0.0 0 0.0 1 0.6 0 0.0 0 0.0
UNKNOWN CT CITY/TOWN 1 1 100.0 0 0.0 0 0.0 0 0.0 0 0.0 0 0.0 0 0.0 0 0.0
30 of 53
31 of 53
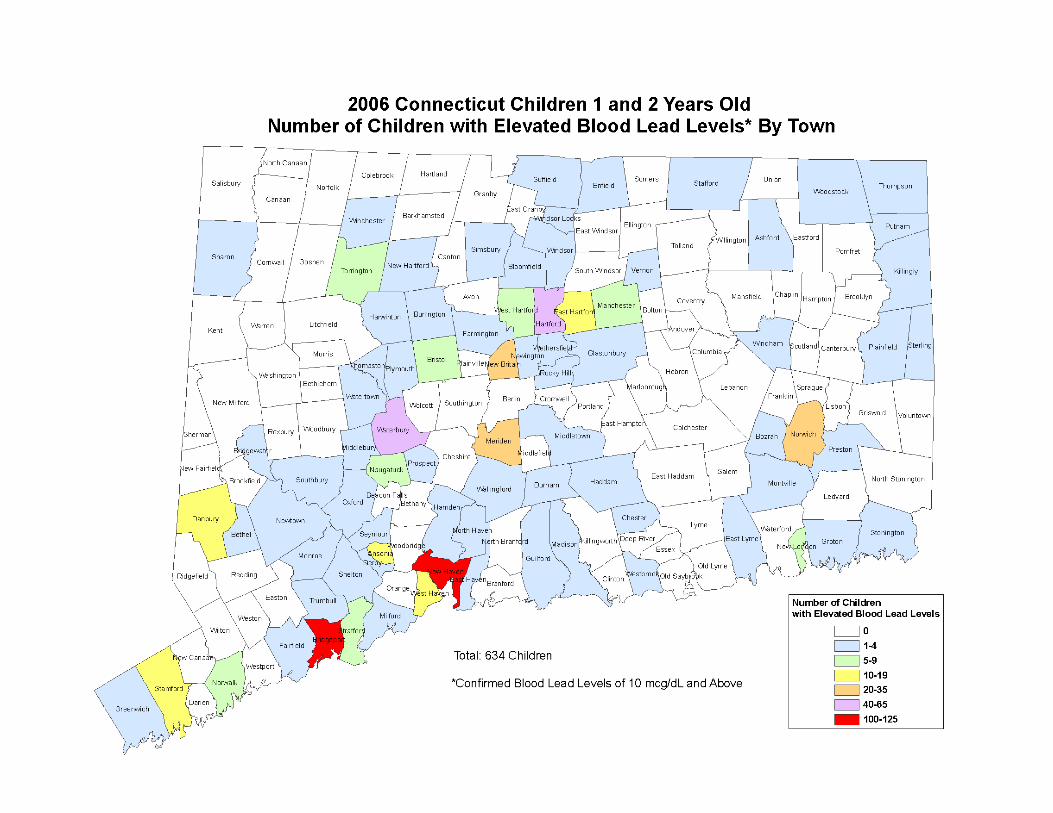
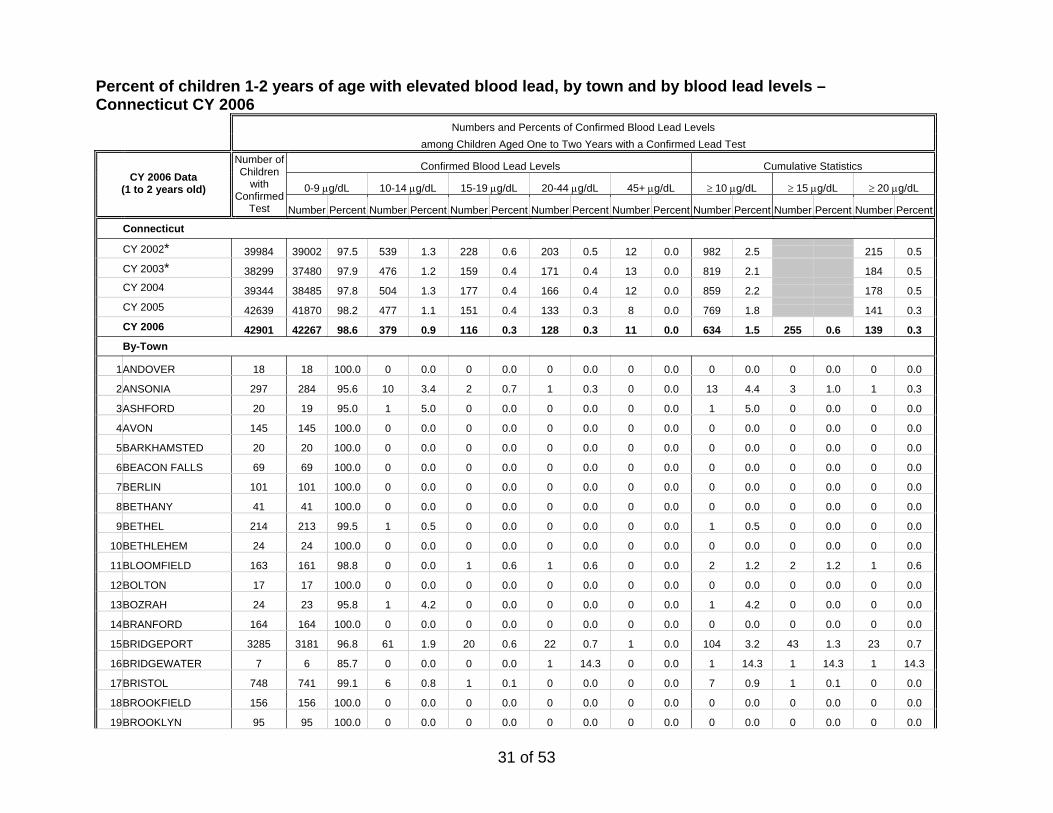
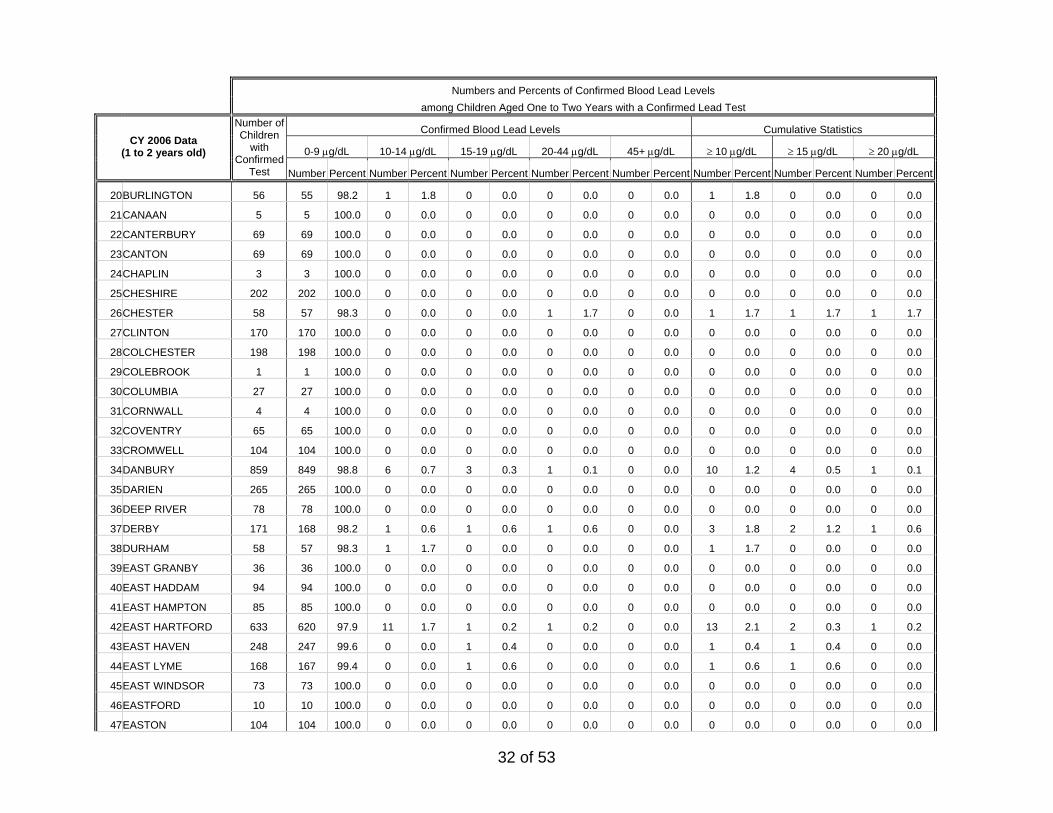
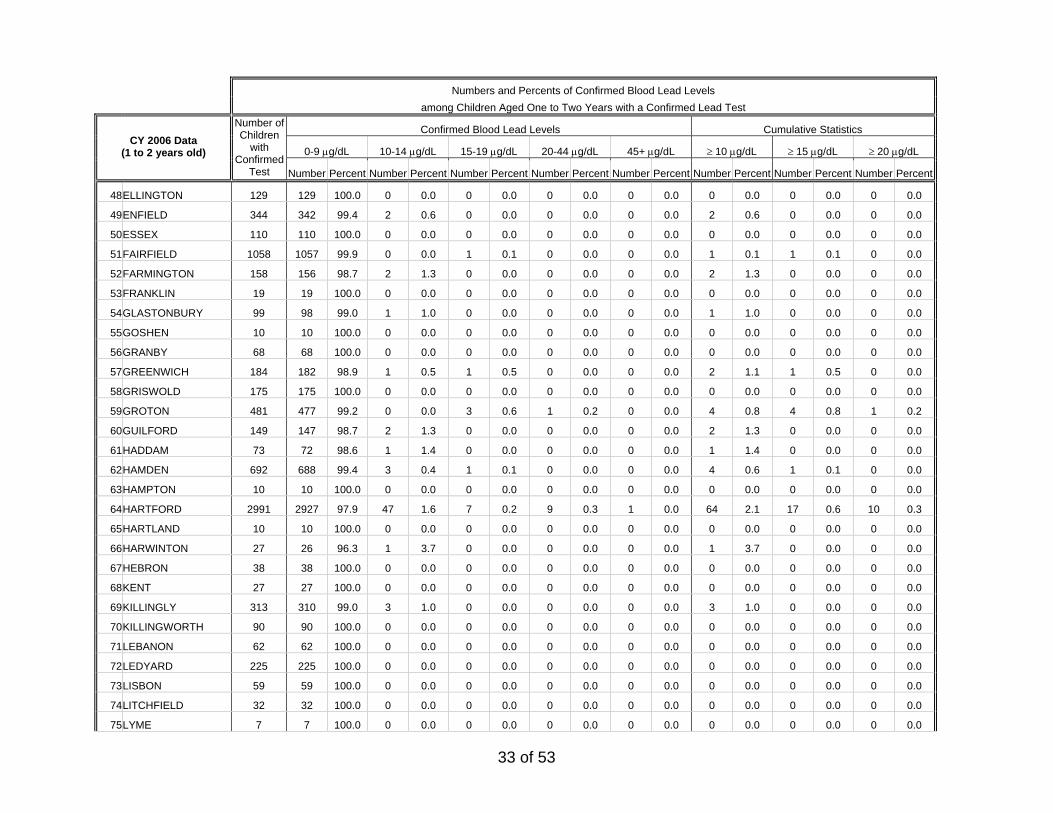
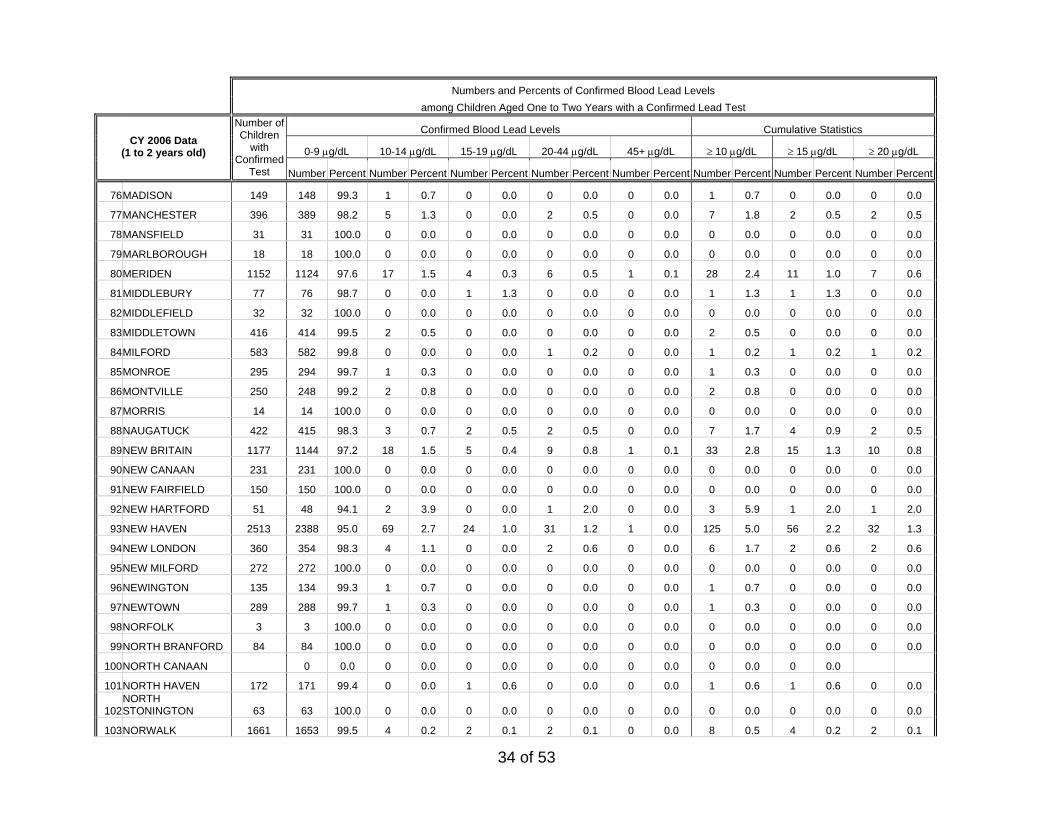
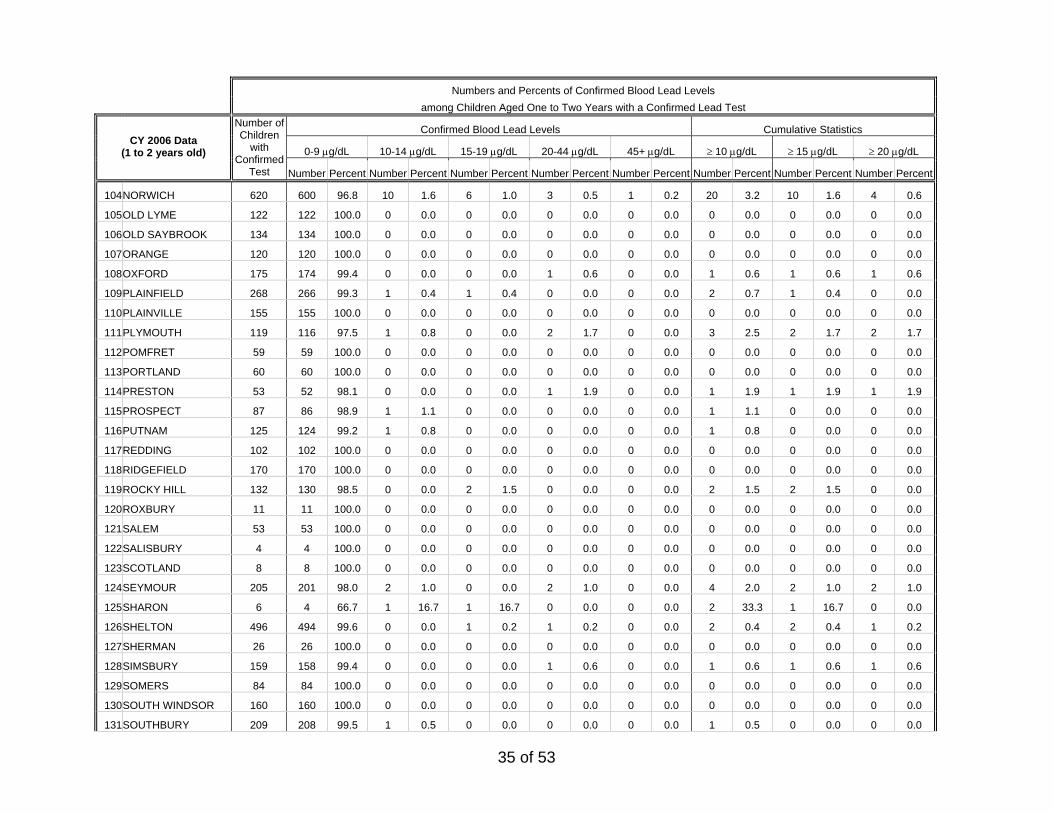
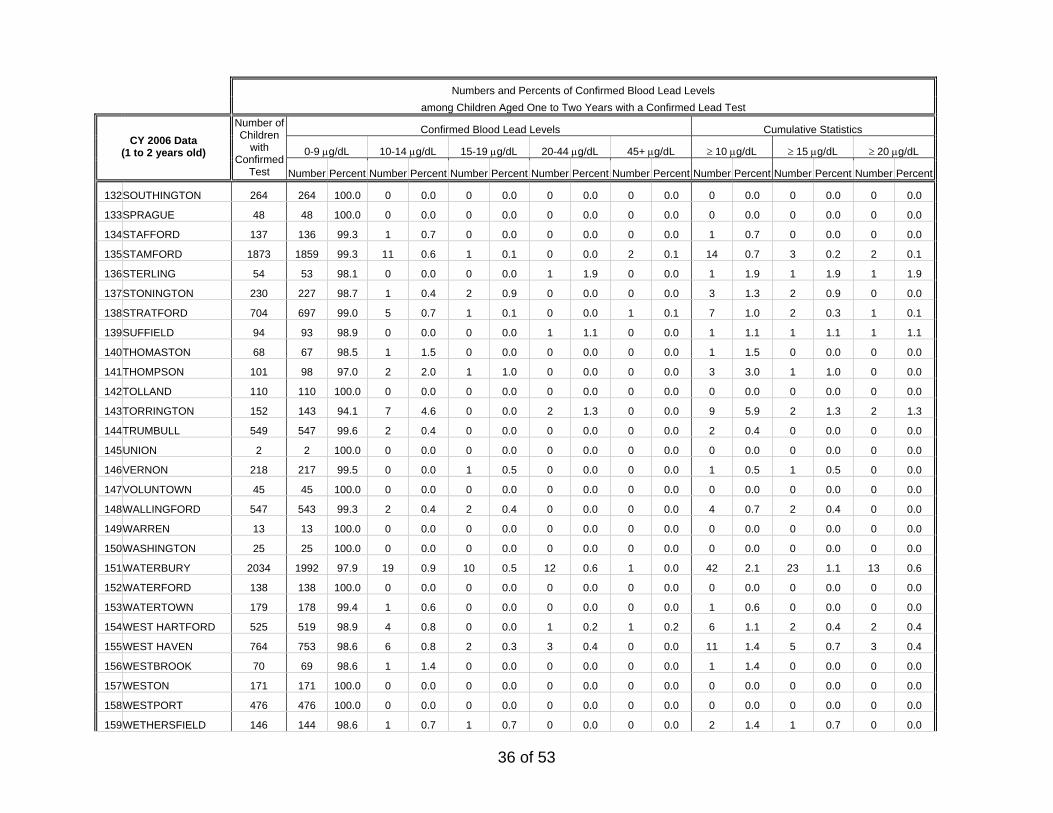
Percent of children 1-2 years of age with elevated blood lead, by town and by blood lead levels – Connecticut CY 2006 Numbers and Percents of Confirmed Blood Lead Levels among Children Aged One to Two Years with a Confirmed Lead Test
Confirmed Blood Lead Levels Cumulative Statistics
0-9 µg/dL 10-14 µg/dL 15-19 µg/dL 20-44 µg/dL 45+ µg/dL ≥ 10 µg/dL ≥ 15 µg/dL ≥ 20 µg/dL CY 2006 Data
(1 to 2 years old)
Number of Children
with Confirmed
Test Number Percent Number Percent Number Percent Number Percent Number Percent Number Percent Number Percent Number Percent
Connecticut CY 2002* 39984 39002 97.5 539 1.3 228 0.6 203 0.5 12 0.0 982 2.5 215 0.5 CY 2003* 38299 37480 97.9 476 1.2 159 0.4 171 0.4 13 0.0 819 2.1 184 0.5 CY 2004 39344 38485 97.8 504 1.3 177 0.4 166 0.4 12 0.0 859 2.2 178 0.5 CY 2005 42639 41870 98.2 477 1.1 151 0.4 133 0.3 8 0.0 769 1.8 141 0.3 CY 2006 42901 42267 98.6 379 0.9 116 0.3 128 0.3 11 0.0 634 1.5 255 0.6 139 0.3
By-Town
1ANDOVER 18 18 100.0 0 0.0 0 0.0 0 0.0 0 0.0 0 0.0 0 0.0 0 0.0
2ANSONIA 297 284 95.6 10 3.4 2 0.7 1 0.3 0 0.0 13 4.4 3 1.0 1 0.3
3ASHFORD 20 19 95.0 1 5.0 0 0.0 0 0.0 0 0.0 1 5.0 0 0.0 0 0.0
4AVON 145 145 100.0 0 0.0 0 0.0 0 0.0 0 0.0 0 0.0 0 0.0 0 0.0
5BARKHAMSTED 20 20 100.0 0 0.0 0 0.0 0 0.0 0 0.0 0 0.0 0 0.0 0 0.0
6BEACON FALLS 69 69 100.0 0 0.0 0 0.0 0 0.0 0 0.0 0 0.0 0 0.0 0 0.0
7BERLIN 101 101 100.0 0 0.0 0 0.0 0 0.0 0 0.0 0 0.0 0 0.0 0 0.0
8BETHANY 41 41 100.0 0 0.0 0 0.0 0 0.0 0 0.0 0 0.0 0 0.0 0 0.0
9BETHEL 214 213 99.5 1 0.5 0 0.0 0 0.0 0 0.0 1 0.5 0 0.0 0 0.0
10BETHLEHEM 24 24 100.0 0 0.0 0 0.0 0 0.0 0 0.0 0 0.0 0 0.0 0 0.0
11BLOOMFIELD 163 161 98.8 0 0.0 1 0.6 1 0.6 0 0.0 2 1.2 2 1.2 1 0.6
12BOLTON 17 17 100.0 0 0.0 0 0.0 0 0.0 0 0.0 0 0.0 0 0.0 0 0.0
13BOZRAH 24 23 95.8 1 4.2 0 0.0 0 0.0 0 0.0 1 4.2 0 0.0 0 0.0
14BRANFORD 164 164 100.0 0 0.0 0 0.0 0 0.0 0 0.0 0 0.0 0 0.0 0 0.0
15BRIDGEPORT 3285 3181 96.8 61 1.9 20 0.6 22 0.7 1 0.0 104 3.2 43 1.3 23 0.7
16BRIDGEWATER 7 6 85.7 0 0.0 0 0.0 1 14.3 0 0.0 1 14.3 1 14.3 1 14.3
17BRISTOL 748 741 99.1 6 0.8 1 0.1 0 0.0 0 0.0 7 0.9 1 0.1 0 0.0
18BROOKFIELD 156 156 100.0 0 0.0 0 0.0 0 0.0 0 0.0 0 0.0 0 0.0 0 0.0
19BROOKLYN 95 95 100.0 0 0.0 0 0.0 0 0.0 0 0.0 0 0.0 0 0.0 0 0.0
32 of 53
Numbers and Percents of Confirmed Blood Lead Levels among Children Aged One to Two Years with a Confirmed Lead Test
Confirmed Blood Lead Levels Cumulative Statistics
0-9 µg/dL 10-14 µg/dL 15-19 µg/dL 20-44 µg/dL 45+ µg/dL ≥ 10 µg/dL ≥ 15 µg/dL ≥ 20 µg/dL CY 2006 Data
(1 to 2 years old)
Number of Children
with Confirmed
Test Number Percent Number Percent Number Percent Number Percent Number Percent Number Percent Number Percent Number Percent
20BURLINGTON 56 55 98.2 1 1.8 0 0.0 0 0.0 0 0.0 1 1.8 0 0.0 0 0.0
21CANAAN 5 5 100.0 0 0.0 0 0.0 0 0.0 0 0.0 0 0.0 0 0.0 0 0.0
22CANTERBURY 69 69 100.0 0 0.0 0 0.0 0 0.0 0 0.0 0 0.0 0 0.0 0 0.0
23CANTON 69 69 100.0 0 0.0 0 0.0 0 0.0 0 0.0 0 0.0 0 0.0 0 0.0
24CHAPLIN 3 3 100.0 0 0.0 0 0.0 0 0.0 0 0.0 0 0.0 0 0.0 0 0.0
25CHESHIRE 202 202 100.0 0 0.0 0 0.0 0 0.0 0 0.0 0 0.0 0 0.0 0 0.0
26CHESTER 58 57 98.3 0 0.0 0 0.0 1 1.7 0 0.0 1 1.7 1 1.7 1 1.7
27CLINTON 170 170 100.0 0 0.0 0 0.0 0 0.0 0 0.0 0 0.0 0 0.0 0 0.0
28COLCHESTER 198 198 100.0 0 0.0 0 0.0 0 0.0 0 0.0 0 0.0 0 0.0 0 0.0
29COLEBROOK 1 1 100.0 0 0.0 0 0.0 0 0.0 0 0.0 0 0.0 0 0.0 0 0.0
30COLUMBIA 27 27 100.0 0 0.0 0 0.0 0 0.0 0 0.0 0 0.0 0 0.0 0 0.0
31CORNWALL 4 4 100.0 0 0.0 0 0.0 0 0.0 0 0.0 0 0.0 0 0.0 0 0.0
32COVENTRY 65 65 100.0 0 0.0 0 0.0 0 0.0 0 0.0 0 0.0 0 0.0 0 0.0
33CROMWELL 104 104 100.0 0 0.0 0 0.0 0 0.0 0 0.0 0 0.0 0 0.0 0 0.0
34DANBURY 859 849 98.8 6 0.7 3 0.3 1 0.1 0 0.0 10 1.2 4 0.5 1 0.1
35DARIEN 265 265 100.0 0 0.0 0 0.0 0 0.0 0 0.0 0 0.0 0 0.0 0 0.0
36DEEP RIVER 78 78 100.0 0 0.0 0 0.0 0 0.0 0 0.0 0 0.0 0 0.0 0 0.0
37DERBY 171 168 98.2 1 0.6 1 0.6 1 0.6 0 0.0 3 1.8 2 1.2 1 0.6
38DURHAM 58 57 98.3 1 1.7 0 0.0 0 0.0 0 0.0 1 1.7 0 0.0 0 0.0
39EAST GRANBY 36 36 100.0 0 0.0 0 0.0 0 0.0 0 0.0 0 0.0 0 0.0 0 0.0
40EAST HADDAM 94 94 100.0 0 0.0 0 0.0 0 0.0 0 0.0 0 0.0 0 0.0 0 0.0
41EAST HAMPTON 85 85 100.0 0 0.0 0 0.0 0 0.0 0 0.0 0 0.0 0 0.0 0 0.0
42EAST HARTFORD 633 620 97.9 11 1.7 1 0.2 1 0.2 0 0.0 13 2.1 2 0.3 1 0.2
43EAST HAVEN 248 247 99.6 0 0.0 1 0.4 0 0.0 0 0.0 1 0.4 1 0.4 0 0.0
44EAST LYME 168 167 99.4 0 0.0 1 0.6 0 0.0 0 0.0 1 0.6 1 0.6 0 0.0
45EAST WINDSOR 73 73 100.0 0 0.0 0 0.0 0 0.0 0 0.0 0 0.0 0 0.0 0 0.0
46EASTFORD 10 10 100.0 0 0.0 0 0.0 0 0.0 0 0.0 0 0.0 0 0.0 0 0.0
47EASTON 104 104 100.0 0 0.0 0 0.0 0 0.0 0 0.0 0 0.0 0 0.0 0 0.0
33 of 53
Numbers and Percents of Confirmed Blood Lead Levels among Children Aged One to Two Years with a Confirmed Lead Test
Confirmed Blood Lead Levels Cumulative Statistics
0-9 µg/dL 10-14 µg/dL 15-19 µg/dL 20-44 µg/dL 45+ µg/dL ≥ 10 µg/dL ≥ 15 µg/dL ≥ 20 µg/dL CY 2006 Data
(1 to 2 years old)
Number of Children
with Confirmed
Test Number Percent Number Percent Number Percent Number Percent Number Percent Number Percent Number Percent Number Percent
48ELLINGTON 129 129 100.0 0 0.0 0 0.0 0 0.0 0 0.0 0 0.0 0 0.0 0 0.0
49ENFIELD 344 342 99.4 2 0.6 0 0.0 0 0.0 0 0.0 2 0.6 0 0.0 0 0.0
50ESSEX 110 110 100.0 0 0.0 0 0.0 0 0.0 0 0.0 0 0.0 0 0.0 0 0.0
51FAIRFIELD 1058 1057 99.9 0 0.0 1 0.1 0 0.0 0 0.0 1 0.1 1 0.1 0 0.0
52FARMINGTON 158 156 98.7 2 1.3 0 0.0 0 0.0 0 0.0 2 1.3 0 0.0 0 0.0
53FRANKLIN 19 19 100.0 0 0.0 0 0.0 0 0.0 0 0.0 0 0.0 0 0.0 0 0.0
54GLASTONBURY 99 98 99.0 1 1.0 0 0.0 0 0.0 0 0.0 1 1.0 0 0.0 0 0.0
55GOSHEN 10 10 100.0 0 0.0 0 0.0 0 0.0 0 0.0 0 0.0 0 0.0 0 0.0
56GRANBY 68 68 100.0 0 0.0 0 0.0 0 0.0 0 0.0 0 0.0 0 0.0 0 0.0
57GREENWICH 184 182 98.9 1 0.5 1 0.5 0 0.0 0 0.0 2 1.1 1 0.5 0 0.0
58GRISWOLD 175 175 100.0 0 0.0 0 0.0 0 0.0 0 0.0 0 0.0 0 0.0 0 0.0
59GROTON 481 477 99.2 0 0.0 3 0.6 1 0.2 0 0.0 4 0.8 4 0.8 1 0.2
60GUILFORD 149 147 98.7 2 1.3 0 0.0 0 0.0 0 0.0 2 1.3 0 0.0 0 0.0
61HADDAM 73 72 98.6 1 1.4 0 0.0 0 0.0 0 0.0 1 1.4 0 0.0 0 0.0
62HAMDEN 692 688 99.4 3 0.4 1 0.1 0 0.0 0 0.0 4 0.6 1 0.1 0 0.0
63HAMPTON 10 10 100.0 0 0.0 0 0.0 0 0.0 0 0.0 0 0.0 0 0.0 0 0.0
64HARTFORD 2991 2927 97.9 47 1.6 7 0.2 9 0.3 1 0.0 64 2.1 17 0.6 10 0.3
65HARTLAND 10 10 100.0 0 0.0 0 0.0 0 0.0 0 0.0 0 0.0 0 0.0 0 0.0
66HARWINTON 27 26 96.3 1 3.7 0 0.0 0 0.0 0 0.0 1 3.7 0 0.0 0 0.0
67HEBRON 38 38 100.0 0 0.0 0 0.0 0 0.0 0 0.0 0 0.0 0 0.0 0 0.0
68KENT 27 27 100.0 0 0.0 0 0.0 0 0.0 0 0.0 0 0.0 0 0.0 0 0.0
69KILLINGLY 313 310 99.0 3 1.0 0 0.0 0 0.0 0 0.0 3 1.0 0 0.0 0 0.0
70KILLINGWORTH 90 90 100.0 0 0.0 0 0.0 0 0.0 0 0.0 0 0.0 0 0.0 0 0.0
71LEBANON 62 62 100.0 0 0.0 0 0.0 0 0.0 0 0.0 0 0.0 0 0.0 0 0.0
72LEDYARD 225 225 100.0 0 0.0 0 0.0 0 0.0 0 0.0 0 0.0 0 0.0 0 0.0
73LISBON 59 59 100.0 0 0.0 0 0.0 0 0.0 0 0.0 0 0.0 0 0.0 0 0.0
74LITCHFIELD 32 32 100.0 0 0.0 0 0.0 0 0.0 0 0.0 0 0.0 0 0.0 0 0.0
75LYME 7 7 100.0 0 0.0 0 0.0 0 0.0 0 0.0 0 0.0 0 0.0 0 0.0
34 of 53
Numbers and Percents of Confirmed Blood Lead Levels among Children Aged One to Two Years with a Confirmed Lead Test
Confirmed Blood Lead Levels Cumulative Statistics
0-9 µg/dL 10-14 µg/dL 15-19 µg/dL 20-44 µg/dL 45+ µg/dL ≥ 10 µg/dL ≥ 15 µg/dL ≥ 20 µg/dL CY 2006 Data
(1 to 2 years old)
Number of Children
with Confirmed
Test Number Percent Number Percent Number Percent Number Percent Number Percent Number Percent Number Percent Number Percent
76MADISON 149 148 99.3 1 0.7 0 0.0 0 0.0 0 0.0 1 0.7 0 0.0 0 0.0
77MANCHESTER 396 389 98.2 5 1.3 0 0.0 2 0.5 0 0.0 7 1.8 2 0.5 2 0.5
78MANSFIELD 31 31 100.0 0 0.0 0 0.0 0 0.0 0 0.0 0 0.0 0 0.0 0 0.0
79MARLBOROUGH 18 18 100.0 0 0.0 0 0.0 0 0.0 0 0.0 0 0.0 0 0.0 0 0.0
80MERIDEN 1152 1124 97.6 17 1.5 4 0.3 6 0.5 1 0.1 28 2.4 11 1.0 7 0.6
81MIDDLEBURY 77 76 98.7 0 0.0 1 1.3 0 0.0 0 0.0 1 1.3 1 1.3 0 0.0
82MIDDLEFIELD 32 32 100.0 0 0.0 0 0.0 0 0.0 0 0.0 0 0.0 0 0.0 0 0.0
83MIDDLETOWN 416 414 99.5 2 0.5 0 0.0 0 0.0 0 0.0 2 0.5 0 0.0 0 0.0
84MILFORD 583 582 99.8 0 0.0 0 0.0 1 0.2 0 0.0 1 0.2 1 0.2 1 0.2
85MONROE 295 294 99.7 1 0.3 0 0.0 0 0.0 0 0.0 1 0.3 0 0.0 0 0.0
86MONTVILLE 250 248 99.2 2 0.8 0 0.0 0 0.0 0 0.0 2 0.8 0 0.0 0 0.0
87MORRIS 14 14 100.0 0 0.0 0 0.0 0 0.0 0 0.0 0 0.0 0 0.0 0 0.0
88NAUGATUCK 422 415 98.3 3 0.7 2 0.5 2 0.5 0 0.0 7 1.7 4 0.9 2 0.5
89NEW BRITAIN 1177 1144 97.2 18 1.5 5 0.4 9 0.8 1 0.1 33 2.8 15 1.3 10 0.8
90NEW CANAAN 231 231 100.0 0 0.0 0 0.0 0 0.0 0 0.0 0 0.0 0 0.0 0 0.0
91NEW FAIRFIELD 150 150 100.0 0 0.0 0 0.0 0 0.0 0 0.0 0 0.0 0 0.0 0 0.0
92NEW HARTFORD 51 48 94.1 2 3.9 0 0.0 1 2.0 0 0.0 3 5.9 1 2.0 1 2.0
93NEW HAVEN 2513 2388 95.0 69 2.7 24 1.0 31 1.2 1 0.0 125 5.0 56 2.2 32 1.3
94NEW LONDON 360 354 98.3 4 1.1 0 0.0 2 0.6 0 0.0 6 1.7 2 0.6 2 0.6
95NEW MILFORD 272 272 100.0 0 0.0 0 0.0 0 0.0 0 0.0 0 0.0 0 0.0 0 0.0
96NEWINGTON 135 134 99.3 1 0.7 0 0.0 0 0.0 0 0.0 1 0.7 0 0.0 0 0.0
97NEWTOWN 289 288 99.7 1 0.3 0 0.0 0 0.0 0 0.0 1 0.3 0 0.0 0 0.0
98NORFOLK 3 3 100.0 0 0.0 0 0.0 0 0.0 0 0.0 0 0.0 0 0.0 0 0.0
99NORTH BRANFORD 84 84 100.0 0 0.0 0 0.0 0 0.0 0 0.0 0 0.0 0 0.0 0 0.0
100NORTH CANAAN 0 0.0 0 0.0 0 0.0 0 0.0 0 0.0 0 0.0 0 0.0
101NORTH HAVEN 172 171 99.4 0 0.0 1 0.6 0 0.0 0 0.0 1 0.6 1 0.6 0 0.0
102NORTH STONINGTON 63 63 100.0 0 0.0 0 0.0 0 0.0 0 0.0 0 0.0 0 0.0 0 0.0
103NORWALK 1661 1653 99.5 4 0.2 2 0.1 2 0.1 0 0.0 8 0.5 4 0.2 2 0.1
35 of 53
Numbers and Percents of Confirmed Blood Lead Levels among Children Aged One to Two Years with a Confirmed Lead Test
Confirmed Blood Lead Levels Cumulative Statistics
0-9 µg/dL 10-14 µg/dL 15-19 µg/dL 20-44 µg/dL 45+ µg/dL ≥ 10 µg/dL ≥ 15 µg/dL ≥ 20 µg/dL CY 2006 Data
(1 to 2 years old)
Number of Children
with Confirmed
Test Number Percent Number Percent Number Percent Number Percent Number Percent Number Percent Number Percent Number Percent
104NORWICH 620 600 96.8 10 1.6 6 1.0 3 0.5 1 0.2 20 3.2 10 1.6 4 0.6
105OLD LYME 122 122 100.0 0 0.0 0 0.0 0 0.0 0 0.0 0 0.0 0 0.0 0 0.0
106OLD SAYBROOK 134 134 100.0 0 0.0 0 0.0 0 0.0 0 0.0 0 0.0 0 0.0 0 0.0
107ORANGE 120 120 100.0 0 0.0 0 0.0 0 0.0 0 0.0 0 0.0 0 0.0 0 0.0
108OXFORD 175 174 99.4 0 0.0 0 0.0 1 0.6 0 0.0 1 0.6 1 0.6 1 0.6
109PLAINFIELD 268 266 99.3 1 0.4 1 0.4 0 0.0 0 0.0 2 0.7 1 0.4 0 0.0
110PLAINVILLE 155 155 100.0 0 0.0 0 0.0 0 0.0 0 0.0 0 0.0 0 0.0 0 0.0
111PLYMOUTH 119 116 97.5 1 0.8 0 0.0 2 1.7 0 0.0 3 2.5 2 1.7 2 1.7
112POMFRET 59 59 100.0 0 0.0 0 0.0 0 0.0 0 0.0 0 0.0 0 0.0 0 0.0
113PORTLAND 60 60 100.0 0 0.0 0 0.0 0 0.0 0 0.0 0 0.0 0 0.0 0 0.0
114PRESTON 53 52 98.1 0 0.0 0 0.0 1 1.9 0 0.0 1 1.9 1 1.9 1 1.9
115PROSPECT 87 86 98.9 1 1.1 0 0.0 0 0.0 0 0.0 1 1.1 0 0.0 0 0.0
116PUTNAM 125 124 99.2 1 0.8 0 0.0 0 0.0 0 0.0 1 0.8 0 0.0 0 0.0
117REDDING 102 102 100.0 0 0.0 0 0.0 0 0.0 0 0.0 0 0.0 0 0.0 0 0.0
118RIDGEFIELD 170 170 100.0 0 0.0 0 0.0 0 0.0 0 0.0 0 0.0 0 0.0 0 0.0
119ROCKY HILL 132 130 98.5 0 0.0 2 1.5 0 0.0 0 0.0 2 1.5 2 1.5 0 0.0
120ROXBURY 11 11 100.0 0 0.0 0 0.0 0 0.0 0 0.0 0 0.0 0 0.0 0 0.0
121SALEM 53 53 100.0 0 0.0 0 0.0 0 0.0 0 0.0 0 0.0 0 0.0 0 0.0
122SALISBURY 4 4 100.0 0 0.0 0 0.0 0 0.0 0 0.0 0 0.0 0 0.0 0 0.0
123SCOTLAND 8 8 100.0 0 0.0 0 0.0 0 0.0 0 0.0 0 0.0 0 0.0 0 0.0
124SEYMOUR 205 201 98.0 2 1.0 0 0.0 2 1.0 0 0.0 4 2.0 2 1.0 2 1.0
125SHARON 6 4 66.7 1 16.7 1 16.7 0 0.0 0 0.0 2 33.3 1 16.7 0 0.0
126SHELTON 496 494 99.6 0 0.0 1 0.2 1 0.2 0 0.0 2 0.4 2 0.4 1 0.2
127SHERMAN 26 26 100.0 0 0.0 0 0.0 0 0.0 0 0.0 0 0.0 0 0.0 0 0.0
128SIMSBURY 159 158 99.4 0 0.0 0 0.0 1 0.6 0 0.0 1 0.6 1 0.6 1 0.6
129SOMERS 84 84 100.0 0 0.0 0 0.0 0 0.0 0 0.0 0 0.0 0 0.0 0 0.0
130SOUTH WINDSOR 160 160 100.0 0 0.0 0 0.0 0 0.0 0 0.0 0 0.0 0 0.0 0 0.0
131SOUTHBURY 209 208 99.5 1 0.5 0 0.0 0 0.0 0 0.0 1 0.5 0 0.0 0 0.0
36 of 53
Numbers and Percents of Confirmed Blood Lead Levels among Children Aged One to Two Years with a Confirmed Lead Test
Confirmed Blood Lead Levels Cumulative Statistics
0-9 µg/dL 10-14 µg/dL 15-19 µg/dL 20-44 µg/dL 45+ µg/dL ≥ 10 µg/dL ≥ 15 µg/dL ≥ 20 µg/dL CY 2006 Data
(1 to 2 years old)
Number of Children
with Confirmed
Test Number Percent Number Percent Number Percent Number Percent Number Percent Number Percent Number Percent Number Percent
132SOUTHINGTON 264 264 100.0 0 0.0 0 0.0 0 0.0 0 0.0 0 0.0 0 0.0 0 0.0
133SPRAGUE 48 48 100.0 0 0.0 0 0.0 0 0.0 0 0.0 0 0.0 0 0.0 0 0.0
134STAFFORD 137 136 99.3 1 0.7 0 0.0 0 0.0 0 0.0 1 0.7 0 0.0 0 0.0
135STAMFORD 1873 1859 99.3 11 0.6 1 0.1 0 0.0 2 0.1 14 0.7 3 0.2 2 0.1
136STERLING 54 53 98.1 0 0.0 0 0.0 1 1.9 0 0.0 1 1.9 1 1.9 1 1.9
137STONINGTON 230 227 98.7 1 0.4 2 0.9 0 0.0 0 0.0 3 1.3 2 0.9 0 0.0
138STRATFORD 704 697 99.0 5 0.7 1 0.1 0 0.0 1 0.1 7 1.0 2 0.3 1 0.1
139SUFFIELD 94 93 98.9 0 0.0 0 0.0 1 1.1 0 0.0 1 1.1 1 1.1 1 1.1
140THOMASTON 68 67 98.5 1 1.5 0 0.0 0 0.0 0 0.0 1 1.5 0 0.0 0 0.0
141THOMPSON 101 98 97.0 2 2.0 1 1.0 0 0.0 0 0.0 3 3.0 1 1.0 0 0.0
142TOLLAND 110 110 100.0 0 0.0 0 0.0 0 0.0 0 0.0 0 0.0 0 0.0 0 0.0
143TORRINGTON 152 143 94.1 7 4.6 0 0.0 2 1.3 0 0.0 9 5.9 2 1.3 2 1.3
144TRUMBULL 549 547 99.6 2 0.4 0 0.0 0 0.0 0 0.0 2 0.4 0 0.0 0 0.0
145UNION 2 2 100.0 0 0.0 0 0.0 0 0.0 0 0.0 0 0.0 0 0.0 0 0.0
146VERNON 218 217 99.5 0 0.0 1 0.5 0 0.0 0 0.0 1 0.5 1 0.5 0 0.0
147VOLUNTOWN 45 45 100.0 0 0.0 0 0.0 0 0.0 0 0.0 0 0.0 0 0.0 0 0.0
148WALLINGFORD 547 543 99.3 2 0.4 2 0.4 0 0.0 0 0.0 4 0.7 2 0.4 0 0.0
149WARREN 13 13 100.0 0 0.0 0 0.0 0 0.0 0 0.0 0 0.0 0 0.0 0 0.0
150WASHINGTON 25 25 100.0 0 0.0 0 0.0 0 0.0 0 0.0 0 0.0 0 0.0 0 0.0
151WATERBURY 2034 1992 97.9 19 0.9 10 0.5 12 0.6 1 0.0 42 2.1 23 1.1 13 0.6
152WATERFORD 138 138 100.0 0 0.0 0 0.0 0 0.0 0 0.0 0 0.0 0 0.0 0 0.0
153WATERTOWN 179 178 99.4 1 0.6 0 0.0 0 0.0 0 0.0 1 0.6 0 0.0 0 0.0
154WEST HARTFORD 525 519 98.9 4 0.8 0 0.0 1 0.2 1 0.2 6 1.1 2 0.4 2 0.4
155WEST HAVEN 764 753 98.6 6 0.8 2 0.3 3 0.4 0 0.0 11 1.4 5 0.7 3 0.4
156WESTBROOK 70 69 98.6 1 1.4 0 0.0 0 0.0 0 0.0 1 1.4 0 0.0 0 0.0
157WESTON 171 171 100.0 0 0.0 0 0.0 0 0.0 0 0.0 0 0.0 0 0.0 0 0.0
158WESTPORT 476 476 100.0 0 0.0 0 0.0 0 0.0 0 0.0 0 0.0 0 0.0 0 0.0
159WETHERSFIELD 146 144 98.6 1 0.7 1 0.7 0 0.0 0 0.0 2 1.4 1 0.7 0 0.0
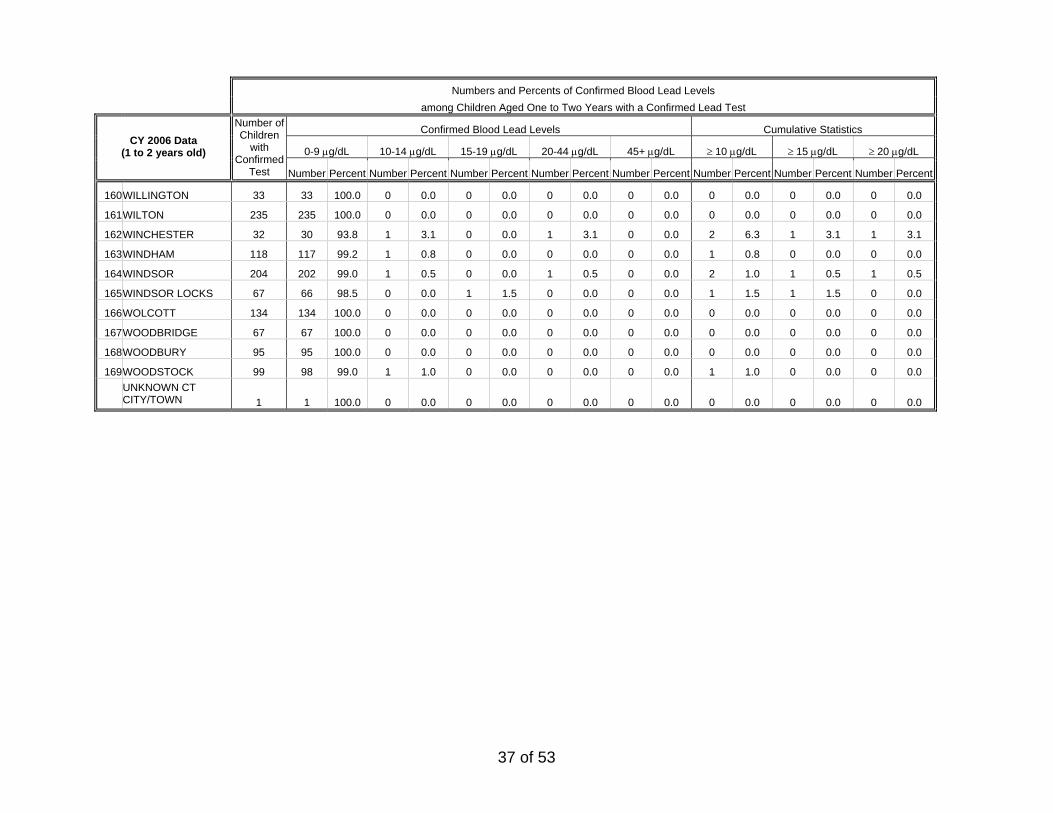
37 of 53
Numbers and Percents of Confirmed Blood Lead Levels among Children Aged One to Two Years with a Confirmed Lead Test
Confirmed Blood Lead Levels Cumulative Statistics
0-9 µg/dL 10-14 µg/dL 15-19 µg/dL 20-44 µg/dL 45+ µg/dL ≥ 10 µg/dL ≥ 15 µg/dL ≥ 20 µg/dL CY 2006 Data
(1 to 2 years old)
Number of Children
with Confirmed
Test Number Percent Number Percent Number Percent Number Percent Number Percent Number Percent Number Percent Number Percent
160WILLINGTON 33 33 100.0 0 0.0 0 0.0 0 0.0 0 0.0 0 0.0 0 0.0 0 0.0
161WILTON 235 235 100.0 0 0.0 0 0.0 0 0.0 0 0.0 0 0.0 0 0.0 0 0.0
162WINCHESTER 32 30 93.8 1 3.1 0 0.0 1 3.1 0 0.0 2 6.3 1 3.1 1 3.1
163WINDHAM 118 117 99.2 1 0.8 0 0.0 0 0.0 0 0.0 1 0.8 0 0.0 0 0.0
164WINDSOR 204 202 99.0 1 0.5 0 0.0 1 0.5 0 0.0 2 1.0 1 0.5 1 0.5
165WINDSOR LOCKS 67 66 98.5 0 0.0 1 1.5 0 0.0 0 0.0 1 1.5 1 1.5 0 0.0
166WOLCOTT 134 134 100.0 0 0.0 0 0.0 0 0.0 0 0.0 0 0.0 0 0.0 0 0.0
167WOODBRIDGE 67 67 100.0 0 0.0 0 0.0 0 0.0 0 0.0 0 0.0 0 0.0 0 0.0
168WOODBURY 95 95 100.0 0 0.0 0 0.0 0 0.0 0 0.0 0 0.0 0 0.0 0 0.0
169WOODSTOCK 99 98 99.0 1 1.0 0 0.0 0 0.0 0 0.0 1 1.0 0 0.0 0 0.0
UNKNOWN CT CITY/TOWN 1 1 100.0 0 0.0 0 0.0 0 0.0 0 0.0 0 0.0 0 0.0 0 0.0

38 of 53
INCIDENCE OF ELEVATED BLOOD LEAD LEVELS Incidence of Elevated Blood Lead Levels – Incidence of elevated blood lead levels (i.e., new cases of elevated blood lead) is defined as the proportion of children under 6 years of age who had a confirmed lead test of ≥10 µg/dL for the first time in 2006 compared to all children under 6 years of age who were screened for lead in 2006 and had not had a result of ≥10 µg/dL prior to 2006. Incidence of Significant Elevated Blood Lead Levels – Incidence of significant elevated blood lead levels (i.e., new cases of significant elevated blood lead) is defined as the proportion of children under 6 years of age who had a confirmed lead test of ≥20 µg/dL for the first time in 2006 compared to all children under 6 years of age who were screened for lead in 2006 and had not had a result of ≥20 µg/dL prior to 2006. As discussed previously, per Connecticut General Statutes, significant elevated blood lead levels require an epidemiological investigation including the inspection of residences for lead hazards by local health departments. Number of existing and new cases of elevated blood lead, by blood lead levels – Connecticut CY 2006
406
51
676
1640
200
400
600
800
1000
1200
>=10 mcg/dL >=20 mcg/dLBlood Lead Levels
Num
ber o
f Chi
ldre
n
Existing Cases New Cases
Of the 1,082 children who were found to have blood lead levels ≥10 µg/dL in 2006, 676 were new cases. Of the 215 children who were found to have blood lead levels ≥20 µg/dL in 2006, 164 were new cases of significant elevated blood lead.

39 of 53
Incidence of elevated blood lead among children under 6 years of age, by blood lead levels – Connecticut CY 2006
1.0%
0.2%
0.0%
0.2%
0.4%
0.6%
0.8%
1.0%
1.2%
>= 10 mcg/dL >= 20 mcg/dL
Blood Lead Levels
% C
hild
ren
with
New
Cas
es o
f Ele
vate
dB
lood
Lea
d
Among children who had a blood lead screening in 2006 and had not had a result of ≥10 µg/dL blood lead levels before 2006, 676 (1.0%) children had confirmed elevated blood lead levels of ≥10 µg/dL for the first time in 2006. Among children who had a blood lead screening in 2006 and had not had a result of ≥20 µg/dL blood lead levels before 2006, 164 (0.2%) children had confirmed significant elevated blood lead levels of ≥20 µg/dL for the first time in 2006.
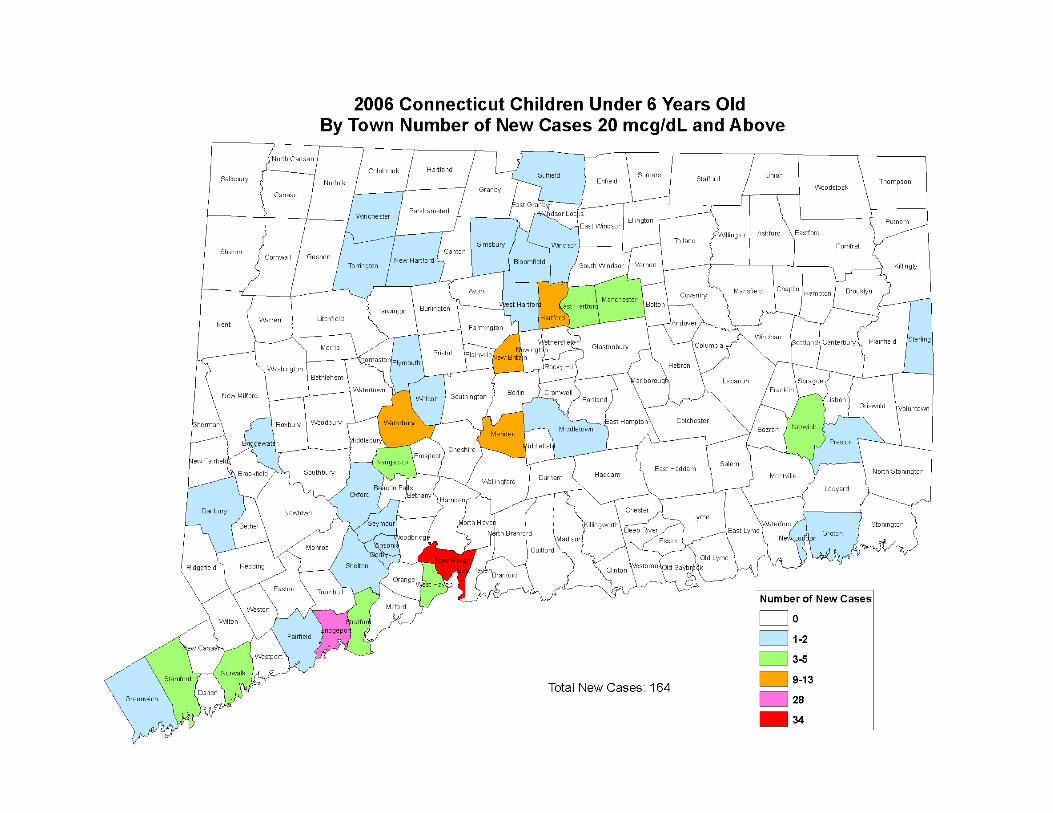
40 of 53
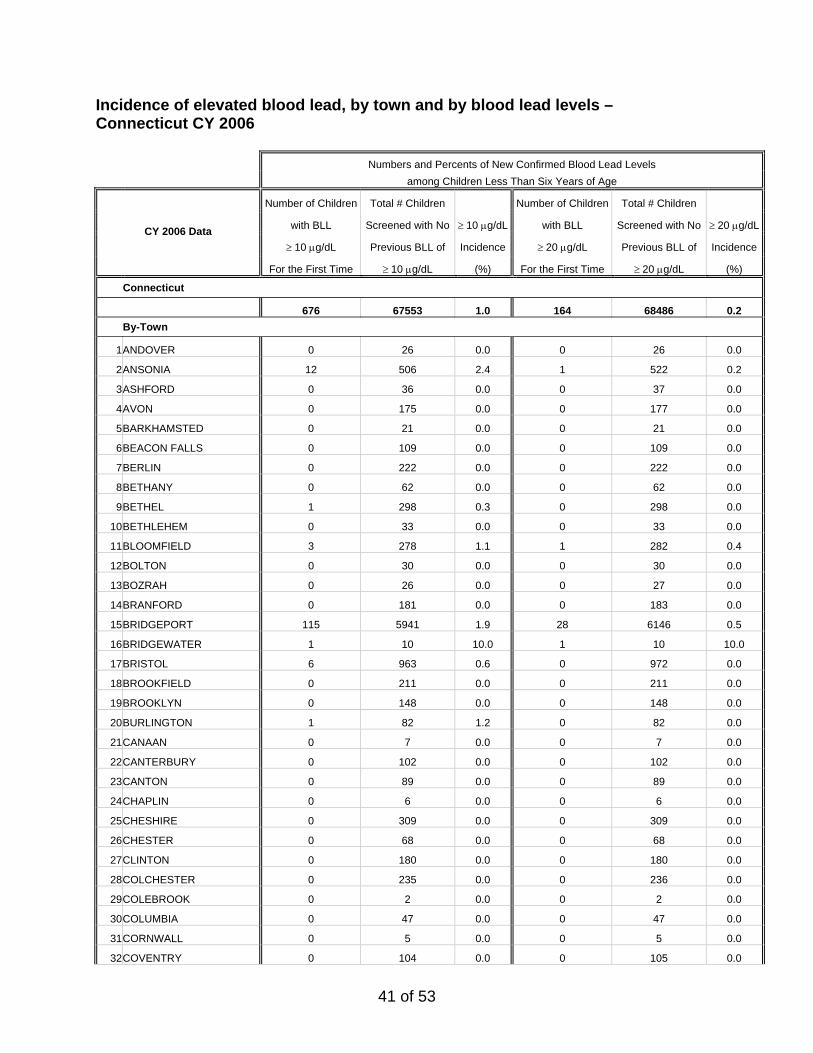
41 of 53
Incidence of elevated blood lead, by town and by blood lead levels – Connecticut CY 2006 Numbers and Percents of New Confirmed Blood Lead Levels among Children Less Than Six Years of Age
Number of Children Total # Children Number of Children Total # Children with BLL Screened with No ≥ 10 µg/dL with BLL Screened with No ≥ 20 µg/dL
≥ 10 µg/dL Previous BLL of Incidence ≥ 20 µg/dL Previous BLL of IncidenceCY 2006 Data
For the First Time ≥ 10 µg/dL (%) For the First Time ≥ 20 µg/dL (%)
Connecticut 676 67553 1.0 164 68486 0.2
By-Town
1ANDOVER 0 26 0.0 0 26 0.0
2ANSONIA 12 506 2.4 1 522 0.2
3ASHFORD 0 36 0.0 0 37 0.0
4AVON 0 175 0.0 0 177 0.0
5BARKHAMSTED 0 21 0.0 0 21 0.0
6BEACON FALLS 0 109 0.0 0 109 0.0
7BERLIN 0 222 0.0 0 222 0.0
8BETHANY 0 62 0.0 0 62 0.0
9BETHEL 1 298 0.3 0 298 0.0
10BETHLEHEM 0 33 0.0 0 33 0.0
11BLOOMFIELD 3 278 1.1 1 282 0.4
12BOLTON 0 30 0.0 0 30 0.0
13BOZRAH 0 26 0.0 0 27 0.0
14BRANFORD 0 181 0.0 0 183 0.0
15BRIDGEPORT 115 5941 1.9 28 6146 0.5
16BRIDGEWATER 1 10 10.0 1 10 10.0
17BRISTOL 6 963 0.6 0 972 0.0
18BROOKFIELD 0 211 0.0 0 211 0.0
19BROOKLYN 0 148 0.0 0 148 0.0
20BURLINGTON 1 82 1.2 0 82 0.0
21CANAAN 0 7 0.0 0 7 0.0
22CANTERBURY 0 102 0.0 0 102 0.0
23CANTON 0 89 0.0 0 89 0.0
24CHAPLIN 0 6 0.0 0 6 0.0
25CHESHIRE 0 309 0.0 0 309 0.0
26CHESTER 0 68 0.0 0 68 0.0
27CLINTON 0 180 0.0 0 180 0.0
28COLCHESTER 0 235 0.0 0 236 0.0
29COLEBROOK 0 2 0.0 0 2 0.0
30COLUMBIA 0 47 0.0 0 47 0.0
31CORNWALL 0 5 0.0 0 5 0.0
32COVENTRY 0 104 0.0 0 105 0.0

42 of 53
Numbers and Percents of New Confirmed Blood Lead Levels among Children Less Than Six Years of Age
Number of Children Total # Children Number of Children Total # Children with BLL Screened with No ≥ 10 µg/dL with BLL Screened with No ≥ 20 µg/dL
≥ 10 µg/dL Previous BLL of Incidence ≥ 20 µg/dL Previous BLL of IncidenceCY 2006 Data
For the First Time ≥ 10 µg/dL (%) For the First Time ≥ 20 µg/dL (%)
33CROMWELL 0 161 0.0 0 162 0.0
34DANBURY 10 1452 0.7 1 1458 0.1
35DARIEN 0 397 0.0 0 397 0.0
36DEEP RIVER 1 86 1.2 0 87 0.0
37DERBY 5 292 1.7 1 293 0.3
38DURHAM 1 79 1.3 0 79 0.0
39EAST GRANBY 0 54 0.0 0 54 0.0
40EAST HADDAM 0 118 0.0 0 118 0.0
41EAST HAMPTON 0 127 0.0 0 127 0.0
42EAST HARTFORD 11 1011 1.1 3 1030 0.3
43EAST HAVEN 1 315 0.3 0 317 0.0
44EAST LYME 1 247 0.4 0 247 0.0
45EAST WINDSOR 0 116 0.0 0 117 0.0
46EASTFORD 0 19 0.0 0 19 0.0
47EASTON 0 130 0.0 0 130 0.0
48ELLINGTON 2 190 1.1 0 190 0.0
49ENFIELD 5 549 0.9 0 553 0.0
50ESSEX 0 115 0.0 0 115 0.0
51FAIRFIELD 2 1242 0.2 1 1248 0.1
52FARMINGTON 1 206 0.5 0 206 0.0
53FRANKLIN 0 23 0.0 0 23 0.0
54GLASTONBURY 1 184 0.5 0 184 0.0
55GOSHEN 0 16 0.0 0 16 0.0
56GRANBY 0 96 0.0 0 96 0.0
57GREENWICH 6 299 2.0 2 300 0.7
58GRISWOLD 0 233 0.0 0 234 0.0
59GROTON 4 734 0.5 1 737 0.1
60GUILFORD 3 163 1.8 0 165 0.0
61HADDAM 0 115 0.0 0 116 0.0
62HAMDEN 5 865 0.6 0 873 0.0
63HAMPTON 0 16 0.0 0 16 0.0
64HARTFORD 68 5251 1.3 13 5388 0.2
65HARTLAND 0 10 0.0 0 11 0.0
66HARWINTON 1 32 3.1 0 32 0.0
67HEBRON 0 77 0.0 0 77 0.0
68KENT 0 29 0.0 0 29 0.0
69KILLINGLY 5 524 1.0 0 532 0.0
70KILLINGWORTH 0 104 0.0 0 104 0.0
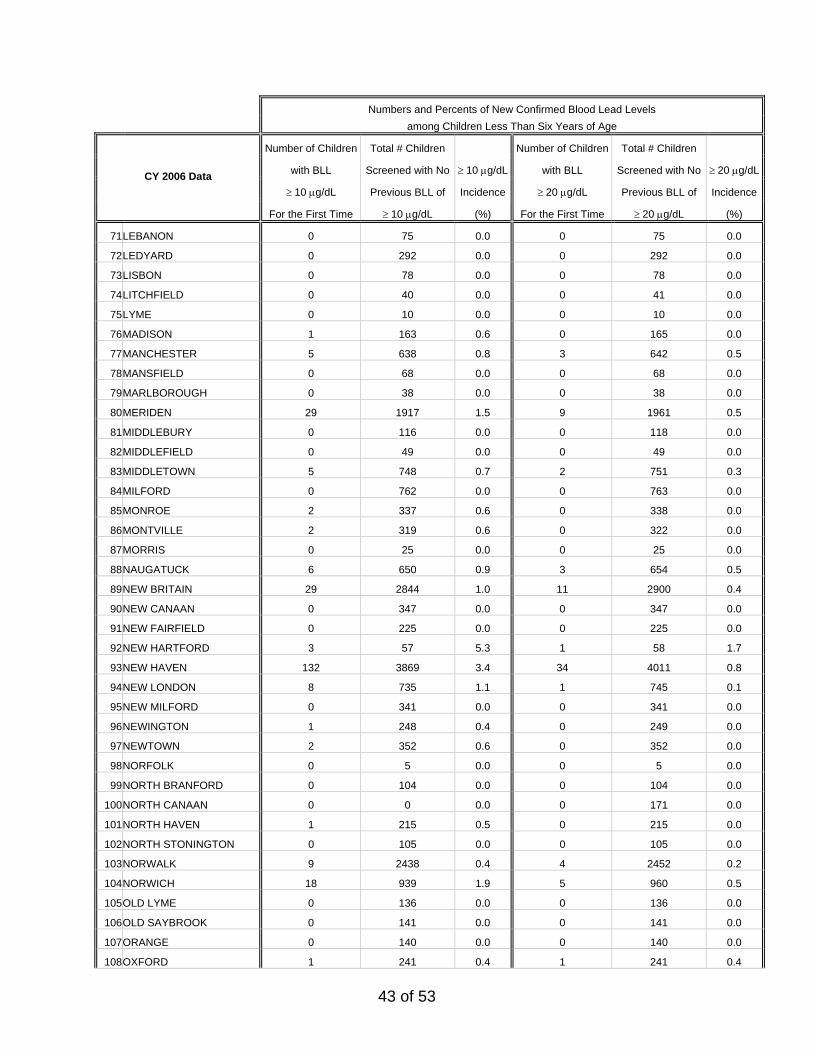
43 of 53
Numbers and Percents of New Confirmed Blood Lead Levels among Children Less Than Six Years of Age
Number of Children Total # Children Number of Children Total # Children with BLL Screened with No ≥ 10 µg/dL with BLL Screened with No ≥ 20 µg/dL
≥ 10 µg/dL Previous BLL of Incidence ≥ 20 µg/dL Previous BLL of IncidenceCY 2006 Data
For the First Time ≥ 10 µg/dL (%) For the First Time ≥ 20 µg/dL (%)
71LEBANON 0 75 0.0 0 75 0.0
72LEDYARD 0 292 0.0 0 292 0.0
73LISBON 0 78 0.0 0 78 0.0
74LITCHFIELD 0 40 0.0 0 41 0.0
75LYME 0 10 0.0 0 10 0.0
76MADISON 1 163 0.6 0 165 0.0
77MANCHESTER 5 638 0.8 3 642 0.5
78MANSFIELD 0 68 0.0 0 68 0.0
79MARLBOROUGH 0 38 0.0 0 38 0.0
80MERIDEN 29 1917 1.5 9 1961 0.5
81MIDDLEBURY 0 116 0.0 0 118 0.0
82MIDDLEFIELD 0 49 0.0 0 49 0.0
83MIDDLETOWN 5 748 0.7 2 751 0.3
84MILFORD 0 762 0.0 0 763 0.0
85MONROE 2 337 0.6 0 338 0.0
86MONTVILLE 2 319 0.6 0 322 0.0
87MORRIS 0 25 0.0 0 25 0.0
88NAUGATUCK 6 650 0.9 3 654 0.5
89NEW BRITAIN 29 2844 1.0 11 2900 0.4
90NEW CANAAN 0 347 0.0 0 347 0.0
91NEW FAIRFIELD 0 225 0.0 0 225 0.0
92NEW HARTFORD 3 57 5.3 1 58 1.7
93NEW HAVEN 132 3869 3.4 34 4011 0.8
94NEW LONDON 8 735 1.1 1 745 0.1
95NEW MILFORD 0 341 0.0 0 341 0.0
96NEWINGTON 1 248 0.4 0 249 0.0
97NEWTOWN 2 352 0.6 0 352 0.0
98NORFOLK 0 5 0.0 0 5 0.0
99NORTH BRANFORD 0 104 0.0 0 104 0.0
100NORTH CANAAN 0 0 0.0 0 171 0.0
101NORTH HAVEN 1 215 0.5 0 215 0.0
102NORTH STONINGTON 0 105 0.0 0 105 0.0
103NORWALK 9 2438 0.4 4 2452 0.2
104NORWICH 18 939 1.9 5 960 0.5
105OLD LYME 0 136 0.0 0 136 0.0
106OLD SAYBROOK 0 141 0.0 0 141 0.0
107ORANGE 0 140 0.0 0 140 0.0
108OXFORD 1 241 0.4 1 241 0.4
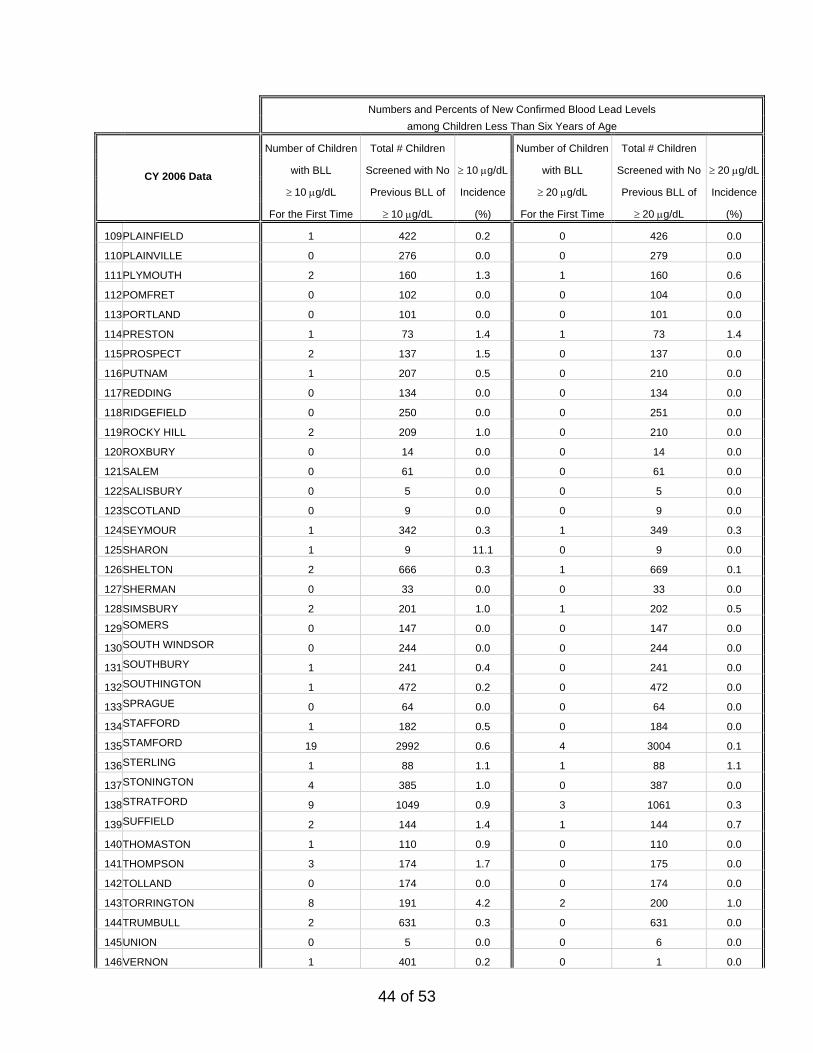
44 of 53
Numbers and Percents of New Confirmed Blood Lead Levels among Children Less Than Six Years of Age
Number of Children Total # Children Number of Children Total # Children with BLL Screened with No ≥ 10 µg/dL with BLL Screened with No ≥ 20 µg/dL
≥ 10 µg/dL Previous BLL of Incidence ≥ 20 µg/dL Previous BLL of IncidenceCY 2006 Data
For the First Time ≥ 10 µg/dL (%) For the First Time ≥ 20 µg/dL (%)
109PLAINFIELD 1 422 0.2 0 426 0.0
110PLAINVILLE 0 276 0.0 0 279 0.0
111PLYMOUTH 2 160 1.3 1 160 0.6
112POMFRET 0 102 0.0 0 104 0.0
113PORTLAND 0 101 0.0 0 101 0.0
114PRESTON 1 73 1.4 1 73 1.4
115PROSPECT 2 137 1.5 0 137 0.0
116PUTNAM 1 207 0.5 0 210 0.0
117REDDING 0 134 0.0 0 134 0.0
118RIDGEFIELD 0 250 0.0 0 251 0.0
119ROCKY HILL 2 209 1.0 0 210 0.0
120ROXBURY 0 14 0.0 0 14 0.0
121SALEM 0 61 0.0 0 61 0.0
122SALISBURY 0 5 0.0 0 5 0.0
123SCOTLAND 0 9 0.0 0 9 0.0
124SEYMOUR 1 342 0.3 1 349 0.3
125SHARON 1 9 11.1 0 9 0.0
126SHELTON 2 666 0.3 1 669 0.1
127SHERMAN 0 33 0.0 0 33 0.0
128SIMSBURY 2 201 1.0 1 202 0.5
129SOMERS 0 147 0.0 0 147 0.0
130SOUTH WINDSOR 0 244 0.0 0 244 0.0
131SOUTHBURY 1 241 0.4 0 241 0.0
132SOUTHINGTON 1 472 0.2 0 472 0.0
133SPRAGUE 0 64 0.0 0 64 0.0
134STAFFORD 1 182 0.5 0 184 0.0
135STAMFORD 19 2992 0.6 4 3004 0.1
136STERLING 1 88 1.1 1 88 1.1
137STONINGTON 4 385 1.0 0 387 0.0
138STRATFORD 9 1049 0.9 3 1061 0.3
139SUFFIELD 2 144 1.4 1 144 0.7
140THOMASTON 1 110 0.9 0 110 0.0
141THOMPSON 3 174 1.7 0 175 0.0
142TOLLAND 0 174 0.0 0 174 0.0
143TORRINGTON 8 191 4.2 2 200 1.0
144TRUMBULL 2 631 0.3 0 631 0.0
145UNION 0 5 0.0 0 6 0.0
146VERNON 1 401 0.2 0 1 0.0
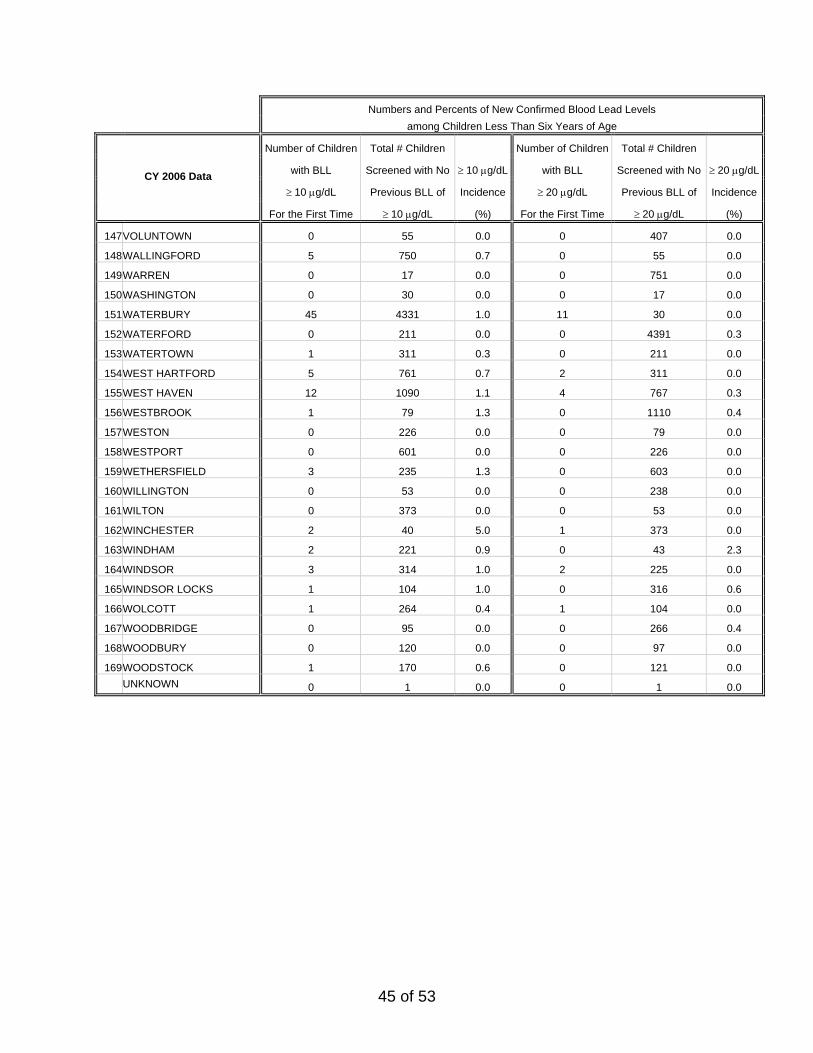
45 of 53
Numbers and Percents of New Confirmed Blood Lead Levels among Children Less Than Six Years of Age
Number of Children Total # Children Number of Children Total # Children with BLL Screened with No ≥ 10 µg/dL with BLL Screened with No ≥ 20 µg/dL
≥ 10 µg/dL Previous BLL of Incidence ≥ 20 µg/dL Previous BLL of IncidenceCY 2006 Data
For the First Time ≥ 10 µg/dL (%) For the First Time ≥ 20 µg/dL (%)
147VOLUNTOWN 0 55 0.0 0 407 0.0
148WALLINGFORD 5 750 0.7 0 55 0.0
149WARREN 0 17 0.0 0 751 0.0
150WASHINGTON 0 30 0.0 0 17 0.0
151WATERBURY 45 4331 1.0 11 30 0.0
152WATERFORD 0 211 0.0 0 4391 0.3
153WATERTOWN 1 311 0.3 0 211 0.0
154WEST HARTFORD 5 761 0.7 2 311 0.0
155WEST HAVEN 12 1090 1.1 4 767 0.3
156WESTBROOK 1 79 1.3 0 1110 0.4
157WESTON 0 226 0.0 0 79 0.0
158WESTPORT 0 601 0.0 0 226 0.0
159WETHERSFIELD 3 235 1.3 0 603 0.0
160WILLINGTON 0 53 0.0 0 238 0.0
161WILTON 0 373 0.0 0 53 0.0
162WINCHESTER 2 40 5.0 1 373 0.0
163WINDHAM 2 221 0.9 0 43 2.3
164WINDSOR 3 314 1.0 2 225 0.0
165WINDSOR LOCKS 1 104 1.0 0 316 0.6
166WOLCOTT 1 264 0.4 1 104 0.0
167WOODBRIDGE 0 95 0.0 0 266 0.4
168WOODBURY 0 120 0.0 0 97 0.0
169WOODSTOCK 1 170 0.6 0 121 0.0
UNKNOWN 0 1 0.0 0 1 0.0
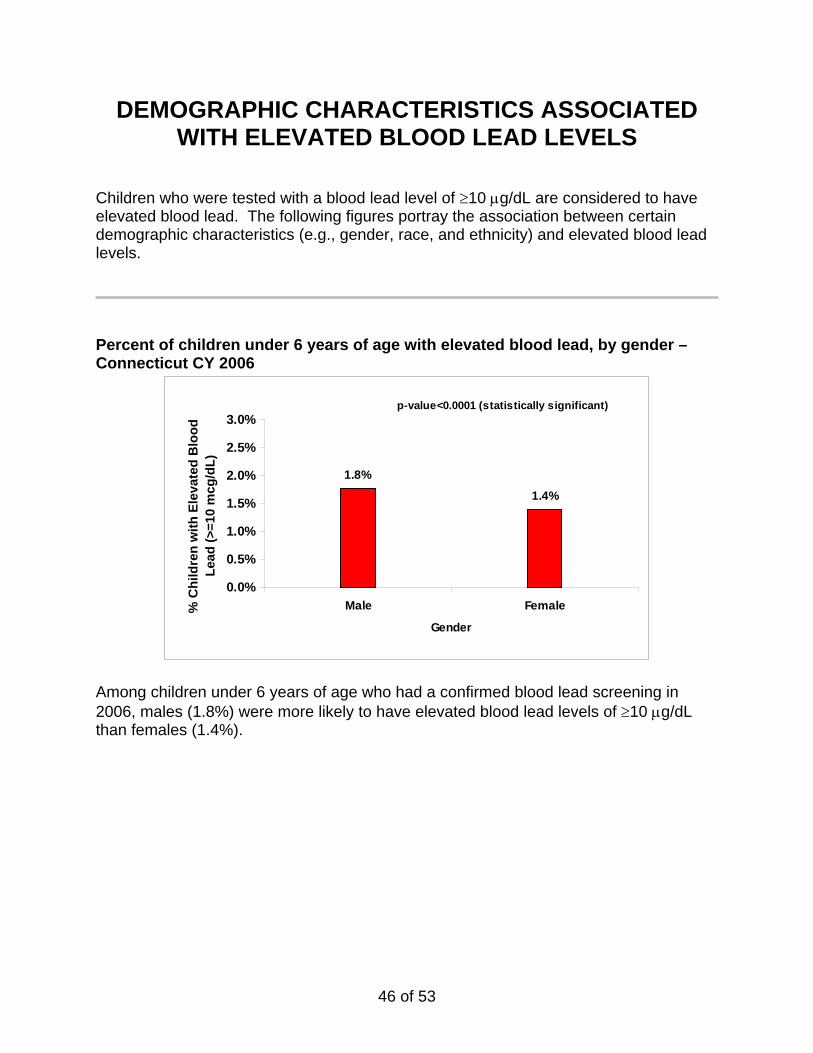
46 of 53
DEMOGRAPHIC CHARACTERISTICS ASSOCIATED WITH ELEVATED BLOOD LEAD LEVELS
Children who were tested with a blood lead level of ≥10 µg/dL are considered to have elevated blood lead. The following figures portray the association between certain demographic characteristics (e.g., gender, race, and ethnicity) and elevated blood lead levels. Percent of children under 6 years of age with elevated blood lead, by gender – Connecticut CY 2006
1.8%
1.4%
0.0%
0.5%
1.0%
1.5%
2.0%
2.5%
3.0%
Male Female
Gender
% C
hild
ren
with
Ele
vate
d B
lood
Le
ad (>
=10
mcg
/dL)
p-value<0.0001 (statistically significant)
Among children under 6 years of age who had a confirmed blood lead screening in 2006, males (1.8%) were more likely to have elevated blood lead levels of ≥10 µg/dL than females (1.4%).
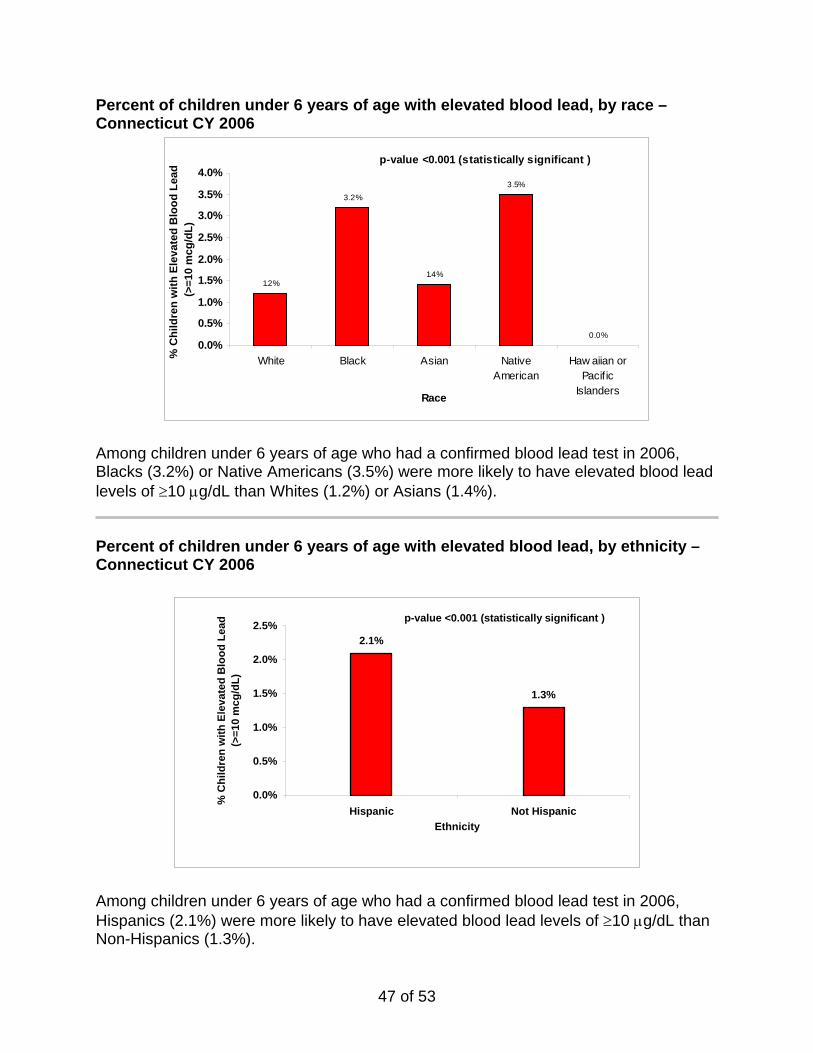
47 of 53
Percent of children under 6 years of age with elevated blood lead, by race – Connecticut CY 2006
1.2%
3.2%
1.4%
3.5%
0.0%0.0%
0.5%
1.0%
1.5%
2.0%
2.5%
3.0%
3.5%
4.0%
White Black Asian NativeAmerican
Haw aiian orPacif ic
IslandersRace
% C
hild
ren
with
Ele
vate
d B
lood
Lea
d (>
=10
mcg
/dL)
p-value <0.001 (statistically significant )
Among children under 6 years of age who had a confirmed blood lead test in 2006, Blacks (3.2%) or Native Americans (3.5%) were more likely to have elevated blood lead levels of ≥10 µg/dL than Whites (1.2%) or Asians (1.4%). Percent of children under 6 years of age with elevated blood lead, by ethnicity – Connecticut CY 2006
2.1%
1.3%
0.0%
0.5%
1.0%
1.5%
2.0%
2.5%
Hispanic Not HispanicEthnicity
% C
hild
ren
with
Ele
vate
d B
lood
Lea
d (>
=10
mcg
/dL)
p-value <0.001 (statistically significant )
Among children under 6 years of age who had a confirmed blood lead test in 2006, Hispanics (2.1%) were more likely to have elevated blood lead levels of ≥10 µg/dL than Non-Hispanics (1.3%).
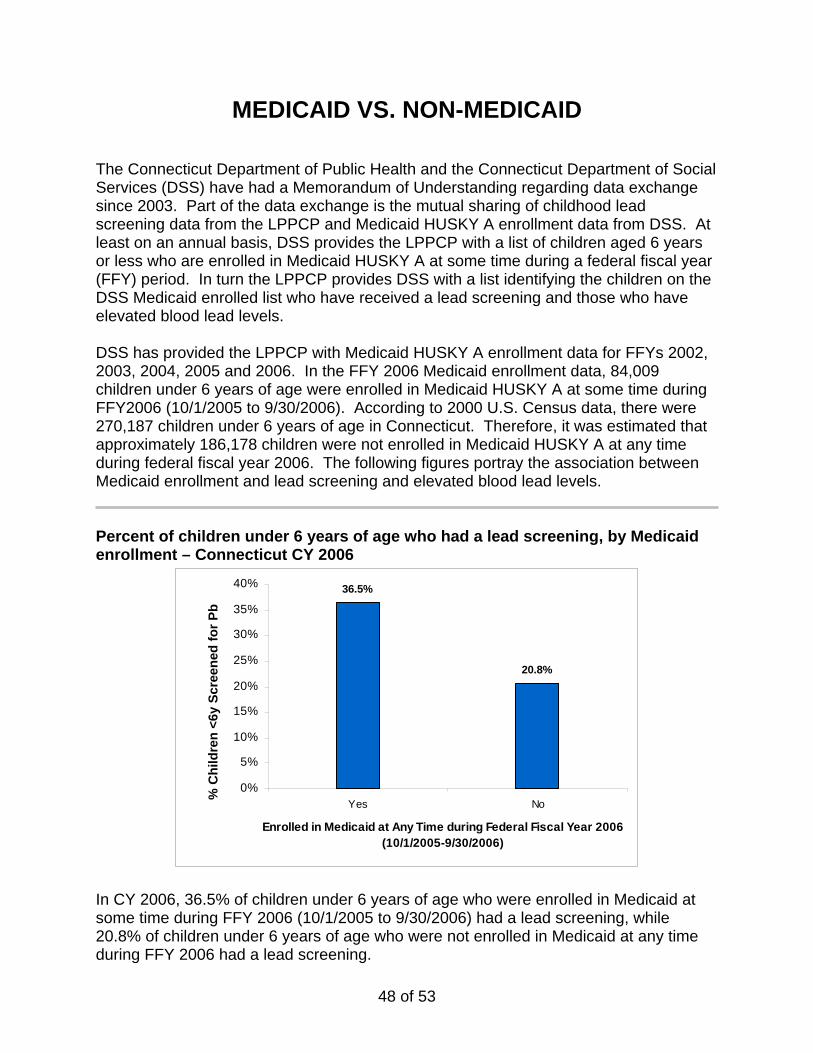
48 of 53
MEDICAID VS. NON-MEDICAID The Connecticut Department of Public Health and the Connecticut Department of Social Services (DSS) have had a Memorandum of Understanding regarding data exchange since 2003. Part of the data exchange is the mutual sharing of childhood lead screening data from the LPPCP and Medicaid HUSKY A enrollment data from DSS. At least on an annual basis, DSS provides the LPPCP with a list of children aged 6 years or less who are enrolled in Medicaid HUSKY A at some time during a federal fiscal year (FFY) period. In turn the LPPCP provides DSS with a list identifying the children on the DSS Medicaid enrolled list who have received a lead screening and those who have elevated blood lead levels. DSS has provided the LPPCP with Medicaid HUSKY A enrollment data for FFYs 2002, 2003, 2004, 2005 and 2006. In the FFY 2006 Medicaid enrollment data, 84,009 children under 6 years of age were enrolled in Medicaid HUSKY A at some time during FFY2006 (10/1/2005 to 9/30/2006). According to 2000 U.S. Census data, there were 270,187 children under 6 years of age in Connecticut. Therefore, it was estimated that approximately 186,178 children were not enrolled in Medicaid HUSKY A at any time during federal fiscal year 2006. The following figures portray the association between Medicaid enrollment and lead screening and elevated blood lead levels. Percent of children under 6 years of age who had a lead screening, by Medicaid enrollment – Connecticut CY 2006
36.5%
20.8%
0%
5%
10%
15%
20%
25%
30%
35%
40%
Yes No
Enrolled in Medicaid at Any Time during Federal Fiscal Year 2006 (10/1/2005-9/30/2006)
% C
hild
ren
<6y
Scre
ened
for P
b
In CY 2006, 36.5% of children under 6 years of age who were enrolled in Medicaid at some time during FFY 2006 (10/1/2005 to 9/30/2006) had a lead screening, while 20.8% of children under 6 years of age who were not enrolled in Medicaid at any time during FFY 2006 had a lead screening.
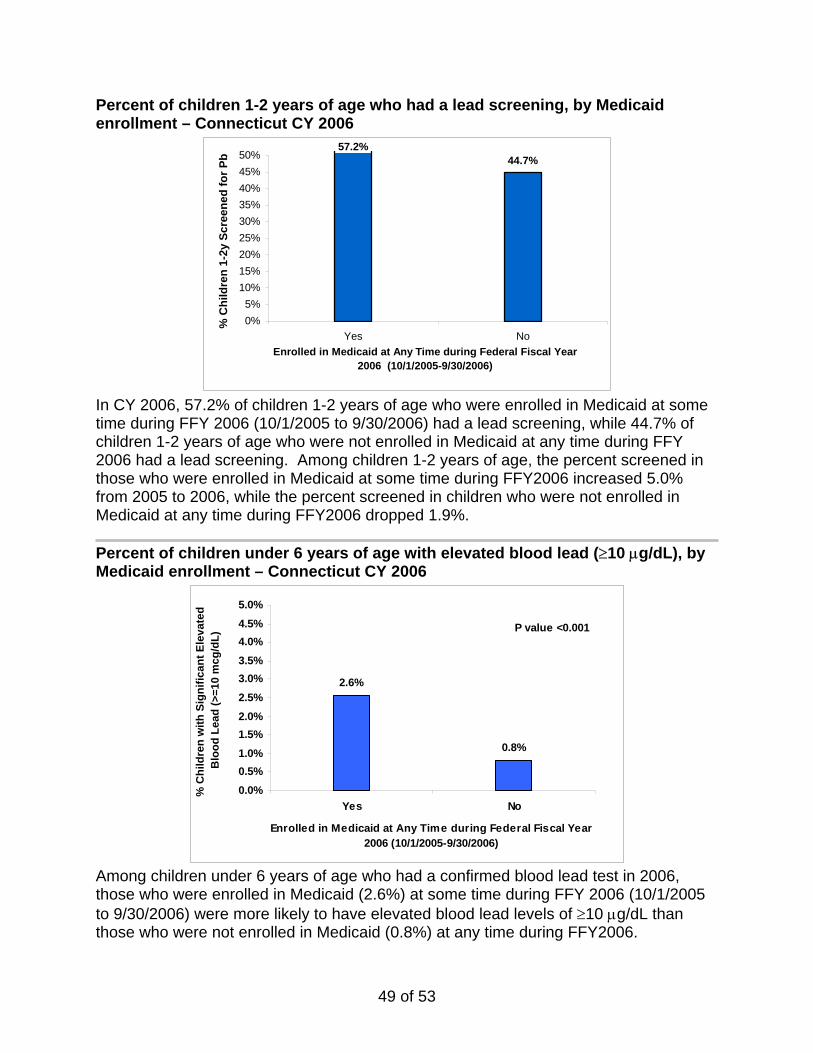
49 of 53
Percent of children 1-2 years of age who had a lead screening, by Medicaid enrollment – Connecticut CY 2006
57.2%44.7%
0%5%
10%15%20%25%30%35%40%45%50%
Yes NoEnrolled in Medicaid at Any Time during Federal Fiscal Year
2006 (10/1/2005-9/30/2006)
% C
hild
ren
1-2y
Scr
eene
d fo
r Pb
In CY 2006, 57.2% of children 1-2 years of age who were enrolled in Medicaid at some time during FFY 2006 (10/1/2005 to 9/30/2006) had a lead screening, while 44.7% of children 1-2 years of age who were not enrolled in Medicaid at any time during FFY 2006 had a lead screening. Among children 1-2 years of age, the percent screened in those who were enrolled in Medicaid at some time during FFY2006 increased 5.0% from 2005 to 2006, while the percent screened in children who were not enrolled in Medicaid at any time during FFY2006 dropped 1.9%. Percent of children under 6 years of age with elevated blood lead (≥10 µg/dL), by Medicaid enrollment – Connecticut CY 2006
2.6%
0.8%
0.0%0.5%1.0%1.5%2.0%2.5%3.0%3.5%4.0%4.5%5.0%
Yes No
Enrolled in Medicaid at Any Time during Federal Fiscal Year 2006 (10/1/2005-9/30/2006)
% C
hild
ren
with
Sig
nific
ant E
leva
ted
Blo
od L
ead
(>=1
0 m
cg/d
L)
P value <0.001
Among children under 6 years of age who had a confirmed blood lead test in 2006, those who were enrolled in Medicaid (2.6%) at some time during FFY 2006 (10/1/2005 to 9/30/2006) were more likely to have elevated blood lead levels of ≥10 µg/dL than those who were not enrolled in Medicaid (0.8%) at any time during FFY2006.
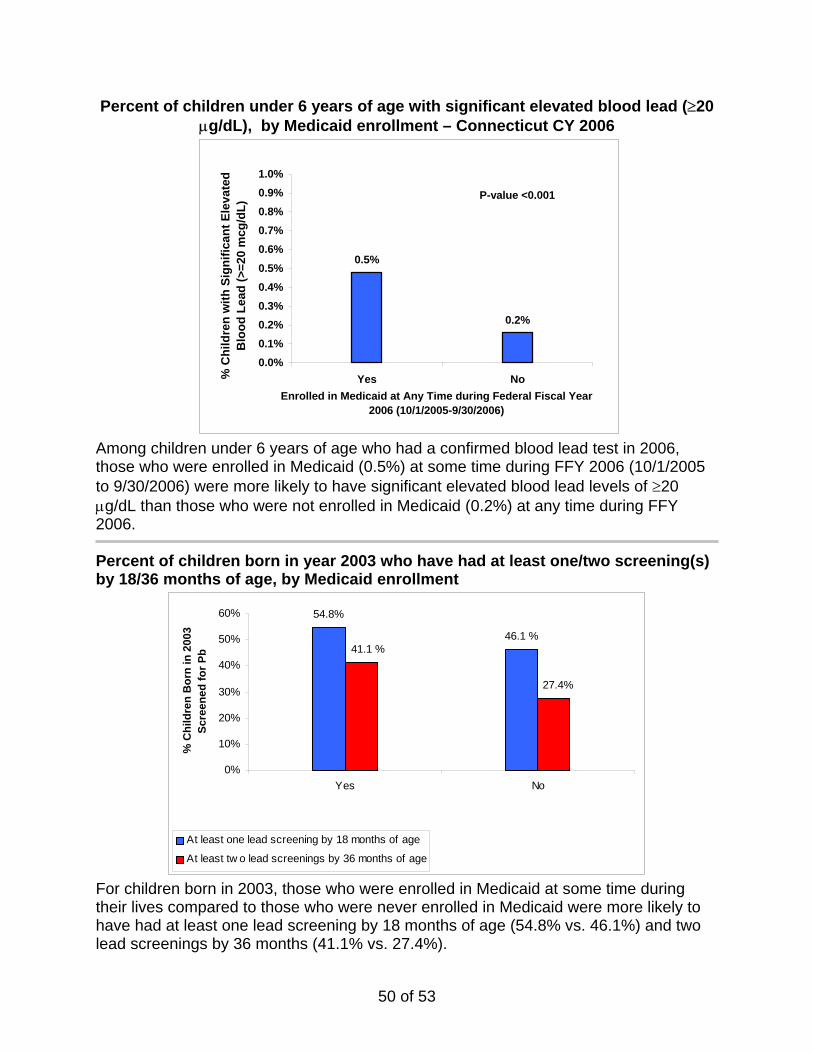
50 of 53
Percent of children under 6 years of age with significant elevated blood lead (≥20 µg/dL), by Medicaid enrollment – Connecticut CY 2006
0.5%
0.2%
0.0%0.1%0.2%0.3%0.4%0.5%0.6%0.7%0.8%0.9%1.0%
Yes NoEnrolled in Medicaid at Any Time during Federal Fiscal Year
2006 (10/1/2005-9/30/2006)
% C
hild
ren
with
Sig
nific
ant E
leva
ted
Blo
od L
ead
(>=2
0 m
cg/d
L)
P-value <0.001
Among children under 6 years of age who had a confirmed blood lead test in 2006, those who were enrolled in Medicaid (0.5%) at some time during FFY 2006 (10/1/2005 to 9/30/2006) were more likely to have significant elevated blood lead levels of ≥20 µg/dL than those who were not enrolled in Medicaid (0.2%) at any time during FFY 2006. Percent of children born in year 2003 who have had at least one/two screening(s) by 18/36 months of age, by Medicaid enrollment
54.8%
46.1 %
27.4%
41.1 %
0%
10%
20%
30%
40%
50%
60%
Yes No
% C
hild
ren
Bor
n in
200
3
Scre
ened
for P
b
At least one lead screening by 18 months of age
At least tw o lead screenings by 36 months of age
For children born in 2003, those who were enrolled in Medicaid at some time during their lives compared to those who were never enrolled in Medicaid were more likely to have had at least one lead screening by 18 months of age (54.8% vs. 46.1%) and two lead screenings by 36 months (41.1% vs. 27.4%).

51 of 53
ENVIRONMENTAL INVESTIGATIONS FOR EBLL CHILDREN
Per Connecticut General Statues, local health departments are required to conduct an epidemiological investigation and lead hazard inspection of the dwelling unit for a child newly identified with a blood lead level ≥20µg/dL. In addition, when an EBLL child moves to a new dwelling unit, the new dwelling unit is required to be inspected for lead hazards as well. If a child resides in more than one dwelling unit, multiple investigations are conducted for all the dwelling units where the EBLL child resides. In 2006, 206 environmental cases were opened for children who had a confirmed blood lead level 20 µg/dL and above. Among the 206 environmental cases opened in 2006, 184 (89.3%) housing dwellings were inspected for lead hazard. Of the184 housing dwelling units that were inspected, 157 complete inspection reports including XRF analysis results and paint chip, soil, dust, and drinking water sample results were received by the LPPCP. The analyses of the environmental findings below are based on the environmental investigation reports for these 157 dwelling units. Of the 157 dwelling units, 136 (86.6%) were identified with a lead hazard; 21 (13.4%) were identified without a lead hazard in the dwelling unit. Findings of the investigations are portrayed as follows-- Percent of environmental lead hazard identified by source- Connecticut CY 2006
85.3%
33.8% 33.1%
0.6%0%
10%20%30%40%50%60%70%80%90%
Paint Dust Soil Water
Type of Lead Hazard
Perc
ent i
dent
ified
with
haz
ard
amon
g in
spec
ted
Of the 157 dwelling units investigated and reported with complete inspection results, a total of 125 (85.3%) units were identified with a paint hazard, 53 (33.8%) units were identified with a dust lead hazard, 52 (33.1%) units were identified with a soil hazard, and 1 (0.6%) with a drinking water hazard.
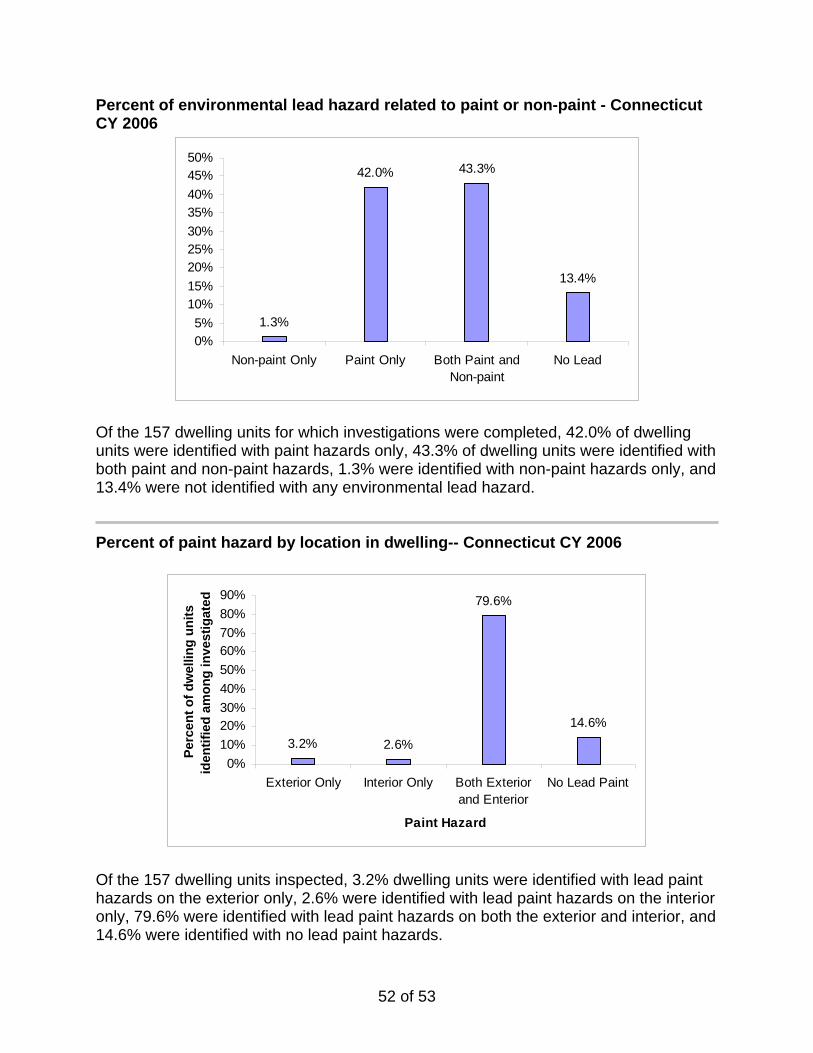
52 of 53
Percent of environmental lead hazard related to paint or non-paint - Connecticut CY 2006
1.3%
42.0% 43.3%
13.4%
0%5%
10%15%20%25%30%35%40%45%50%
Non-paint Only Paint Only Both Paint andNon-paint
No Lead
Of the 157 dwelling units for which investigations were completed, 42.0% of dwelling units were identified with paint hazards only, 43.3% of dwelling units were identified with both paint and non-paint hazards, 1.3% were identified with non-paint hazards only, and 13.4% were not identified with any environmental lead hazard. Percent of paint hazard by location in dwelling-- Connecticut CY 2006
3.2% 2.6%
79.6%
14.6%
0%10%20%30%40%50%60%70%80%90%
Exterior Only Interior Only Both Exteriorand Enterior
No Lead Paint
Paint Hazard
Perc
ent o
f dw
ellin
g un
its
iden
tifie
d am
ong
inve
stig
ated
Of the 157 dwelling units inspected, 3.2% dwelling units were identified with lead paint hazards on the exterior only, 2.6% were identified with lead paint hazards on the interior only, 79.6% were identified with lead paint hazards on both the exterior and interior, and 14.6% were identified with no lead paint hazards.
53 of 53
Reported Abatement and Management Activities Of the 157 dwelling units inspected and with complete inspection results submitted to LPPCP, 131 (83.4%) were identified as requiring abatement of lead hazards and 50 (31.8%) dwelling units as requiring a post abatement management plan. As of February 2008, among the dwelling units for which abatement of lead hazards was required, the abatement was completed for 35 (26.7%) dwelling units as of Feb 2008.

The children in the photos in this report are not lead poisoned. The goal of the Department of Public Health is for all children to be safe from lead poisoning.