Embed Size (px)
Citation preview

CONNECTED IN ISOLATION:
A CORRELATIONAL STUDY OF STUDENTS’ SENSE
OF CONNECTEDNESS IN AN ONLINE COURSE
AND THEIR LEARNING OUTCOMES
by
Ben Allen Morrell Jr.
Liberty University
2016
A Dissertation Presented in Partial Fulfillment
of the Requirements for the Degree
Doctor of Education

2
CONNECTED IN ISOLATION:
A CORRELATIONAL STUDY OF STUDENTS’ SENSE
OF CONNECTEDNESS IN AN ONLINE COURSE
AND THEIR LEARNING OUTCOMES
by
Ben Allen Morrell Jr.
A Dissertation Presented in Partial Fulfillment
of the Requirements for the Degree
Doctor of Education
Liberty University
2016
Approved By:
Alan Wimberley, Ed.D., Committee Chair
Dr. Sarah Pannone, Ed.D., Committee Member
Dr. Robin Wofford, Ed.D., Committee Member
Scott Watson, Ph.D., Associate Dean, Advanced Programs
3
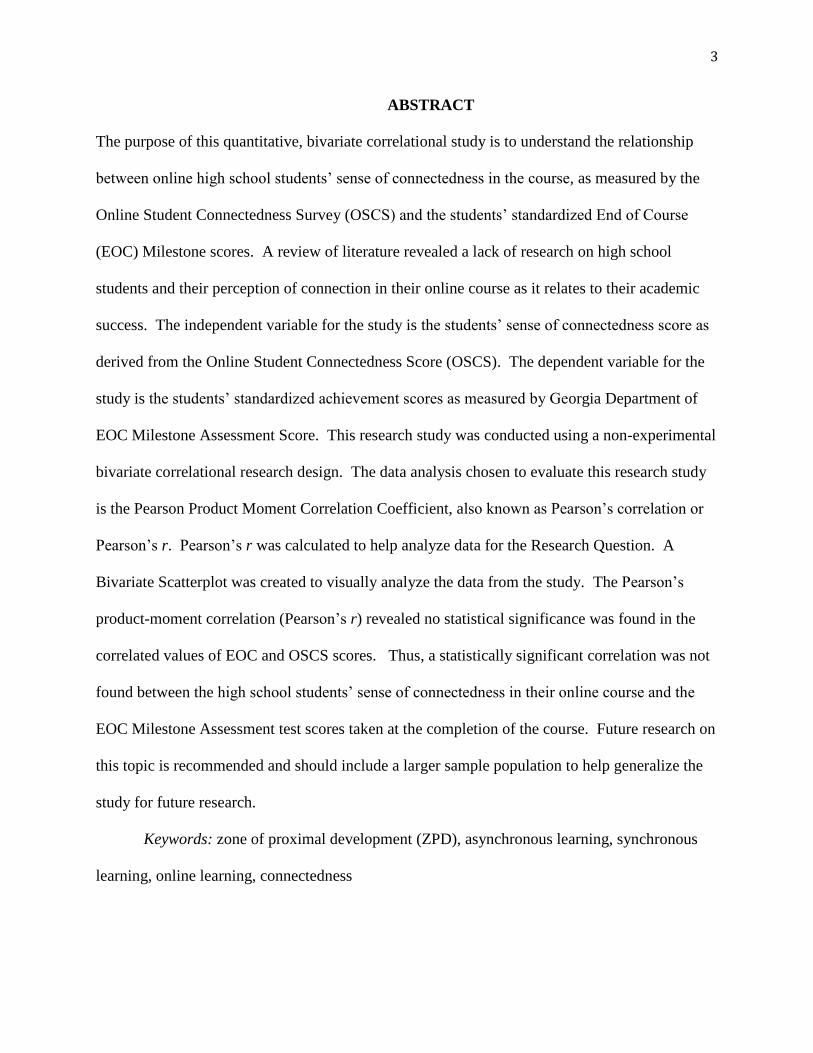
ABSTRACT
The purpose of this quantitative, bivariate correlational study is to understand the relationship
between online high school students’ sense of connectedness in the course, as measured by the
Online Student Connectedness Survey (OSCS) and the students’ standardized End of Course
(EOC) Milestone scores. A review of literature revealed a lack of research on high school
students and their perception of connection in their online course as it relates to their academic
success. The independent variable for the study is the students’ sense of connectedness score as
derived from the Online Student Connectedness Score (OSCS). The dependent variable for the
study is the students’ standardized achievement scores as measured by Georgia Department of
EOC Milestone Assessment Score. This research study was conducted using a non-experimental
bivariate correlational research design. The data analysis chosen to evaluate this research study
is the Pearson Product Moment Correlation Coefficient, also known as Pearson’s correlation or
Pearson’s r. Pearson’s r was calculated to help analyze data for the Research Question. A
Bivariate Scatterplot was created to visually analyze the data from the study. The Pearson’s
product-moment correlation (Pearson’s r) revealed no statistical significance was found in the
correlated values of EOC and OSCS scores. Thus, a statistically significant correlation was not
found between the high school students’ sense of connectedness in their online course and the
EOC Milestone Assessment test scores taken at the completion of the course. Future research on
this topic is recommended and should include a larger sample population to help generalize the
study for future research.
Keywords: zone of proximal development (ZPD), asynchronous learning, synchronous
learning, online learning, connectedness
4
Acknowledgments
I would like to thank God for allowing me to pursue this doctoral degree from Liberty
University. My favorite Bible verse is Philippians 4:11, which says “Not that I was ever in need,
for I have learned to get along happily whether I have much or little”. This is a degree that I
never thought I would acquire, so I am truly humbled to wrap this dissertation up and start to
realize that I am going to have Dr. in from of my name from now on.
I would also like to thank my wife Millie Ann, and kids, Jackson and Morgan. They have
been very supportive, as I have had missed way too much family time so I could complete this
degree. My family means everything to me. They have been troopers as I have worked on this
degree over the last three years.
I also have to give thanks to my dissertation committee, Dr. Sarah Pannone, Dr. Robin
Wofford, and especially Dr. Alan Wimberley, my dissertation chair and favorite instructor at
Liberty University. He helped me understand the impact a good teacher can have on a student in
an online course. The connection I felt with him in our course helped guide me to my
dissertation topic and ultimately my realization of the unlimited options that online learning
provides for today’s student.
Last but not least, I have to give thanks to my mom and dad. They provided me with
unconditional love growing up. They supported me and provided me with the guidance that has
helped me be a better husband and father. I would not be that man I am today without them.
It is great to get to the end of this program, but like the saying goes, “it’s not about the
destination, it’s about the journey and the experiences you have while working toward that
destination”. Looking forward now to new and exciting experiences in my educational journey.
5
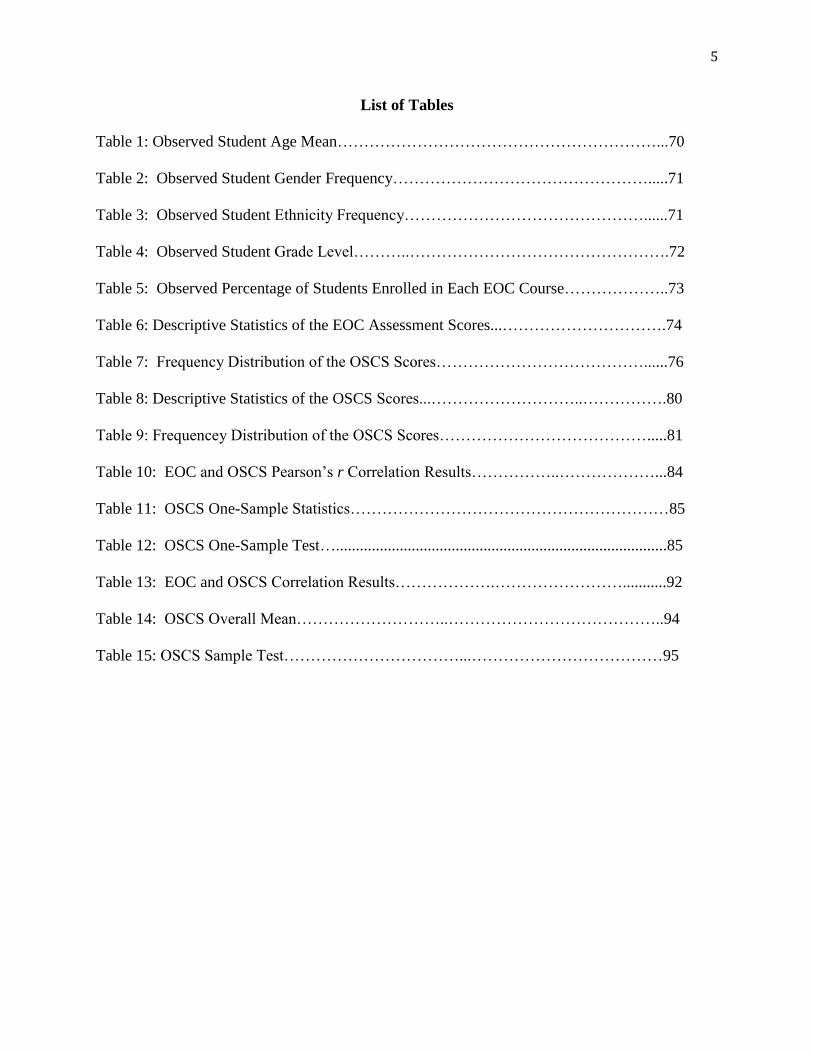
List of Tables
Table 1: Observed Student Age Mean……………………………………………………...70
Table 2: Observed Student Gender Frequency………………………………………….....71
Table 3: Observed Student Ethnicity Frequency………………………………………......71
Table 4: Observed Student Grade Level………..………………………………………….72
Table 5: Observed Percentage of Students Enrolled in Each EOC Course………………..73
Table 6: Descriptive Statistics of the EOC Assessment Scores...………………………….74
Table 7: Frequency Distribution of the OSCS Scores…………………………………......76
Table 8: Descriptive Statistics of the OSCS Scores...………………………..…………….80
Table 9: Frequencey Distribution of the OSCS Scores………………………………….....81
Table 10: EOC and OSCS Pearson’s r Correlation Results……………..………………...84
Table 11: OSCS One-Sample Statistics……………………………………………………85
Table 12: OSCS One-Sample Test…...................................................................................85
Table 13: EOC and OSCS Correlation Results……………….……………………...........92
Table 14: OSCS Overall Mean………………………..…………………………………..94
Table 15: OSCS Sample Test……………………………...………………………………95

6
List of Figures
Figure 1: Observed Number of Participants in Each Course …………………………….74
Figure 2: EOC Assessment Score Pass/Fail Rate…….…………………………………..77
Figure 3: Distribution of EOC Score Letter Grade Assignment…….……………………78
Figure 4: Distribution of EOC Assessment Scores…...……………………………..........79
Figure 5: Bivariate Linear Regression Scatterplot………………………………………..86
7
List of Abbreviations
County Virtual Academy (CVA)
End of Course Milestone Assessment (EOC)
Georgia Department of Education (GADOE)
Online Student Connectedness Survey (OSCS)
Zone of Proximal Development (ZPD)
8
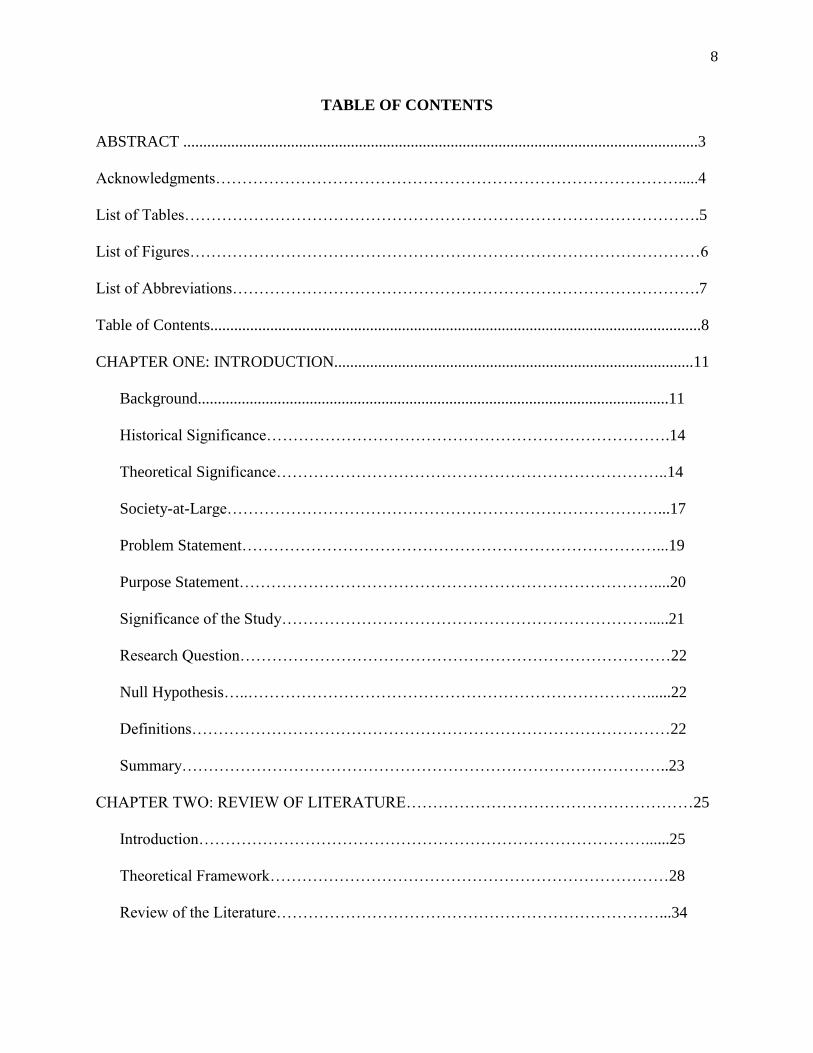
TABLE OF CONTENTS
ABSTRACT .................................................................................................................................3
Acknowledgments…………………………………………………………………………….....4
List of Tables…………………………………………………………………………………….5
List of Figures……………………………………………………………………………………6
List of Abbreviations…………………………………………………………………………….7
Table of Contents...........................................................................................................................8
CHAPTER ONE: INTRODUCTION..........................................................................................11
Background......................................................................................................................11
Historical Significance………………………………………………………………….14
Theoretical Significance………………………………………………………………..14
Society-at-Large………………………………………………………………………...17
Problem Statement……………………………………………………………………...19
Purpose Statement……………………………………………………………………....20
Significance of the Study…………………………………………………………….....21
Research Question………………………………………………………………………22
Null Hypothesis…..…………………………………………………………………......22
Definitions………………………………………………………………………………22
Summary………………………………………………………………………………..23
CHAPTER TWO: REVIEW OF LITERATURE………………………………………………25
Introduction…………………………………………………………………………......25
Theoretical Framework…………………………………………………………………28
Review of the Literature………………………………………………………………...34
9
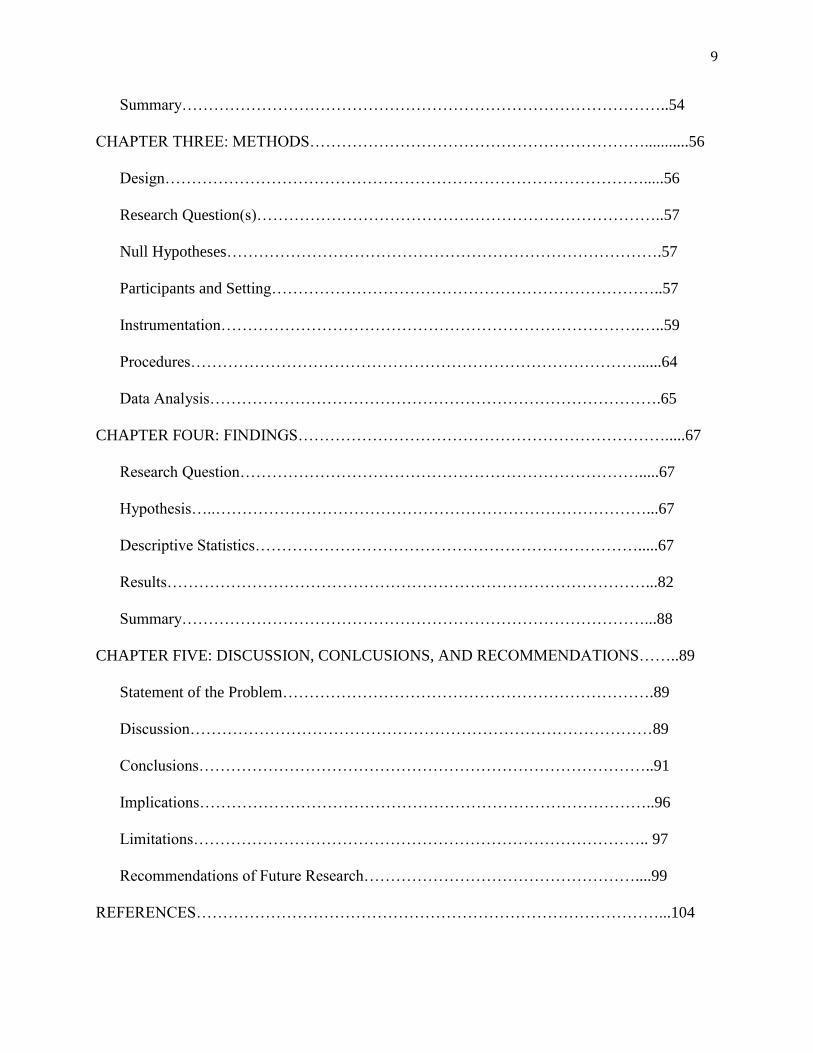
Summary………………………………………………………………………………..54
CHAPTER THREE: METHODS………………………………………………………...........56
Design……………………………………………………………………………….....56
Research Question(s)…………………………………………………………………..57
Null Hypotheses……………………………………………………………………….57
Participants and Setting………………………………………………………………..57
Instrumentation…………………………………………………………………….…..59
Procedures…………………………………………………………………………......64
Data Analysis………………………………………………………………………….65
CHAPTER FOUR: FINDINGS…………………………………………………………….....67
Research Question………………………………………………………………….....67
Hypothesis…..………………………………………………………………………...67
Descriptive Statistics……………………………………………………………….....67
Results………………………………………………………………………………...82
Summary……………………………………………………………………………...88
CHAPTER FIVE: DISCUSSION, CONLCUSIONS, AND RECOMMENDATIONS……..89
Statement of the Problem…………………………………………………………….89
Discussion……………………………………………………………………………89
Conclusions…………………………………………………………………………..91
Implications…………………………………………………………………………..96
Limitations………………………………………………………………………….. 97
Recommendations of Future Research……………………………………………....99
REFERENCES……………………………………………………………………………...104

10
APPENDIX A: OSCS……………………………………………………………………....114
APPENDIX B: Approval Email from OSCS Creator……………………………………....115
APPENDIX C: Survey Monkey Approval Letter…………………………………………..117
APPENDIX D: Parent Permission Letter…………………………………………………..118
APPENDIX E: Permission to Reproduce the OSCS……………………………………….119
11
CHAPTER ONE: INTRODUCTION
Background
In 1981, the United States government took a stand on the current status of the public
education experience for students. “A Nation at Risk” was a report created by the National
Commission on Excellence in Education. The report found that the curriculum at the secondary
school level in the country was not challenging to the level of not improving the education of our
high school students. The report shifted the educational focus in the United States to core
academic courses and standardized testing, where students could be compared to one another.
Christensen, Horn, and Johnson (2011) explain the report results with the analogy of “in effect,
we have a cafeteria-style curriculum in which the appetizers and desserts can easily be mistaken
for the main courses” (p. 59).
The standardization of education was accelerated by the report, “A Nation at Risk” (Horn
& Staker, 2015). The report began the push towards classroom experiences for students that
were less about the individual learner and more about getting through the standards of the course
and acquiring a test score. This report led to educational hysteria in the United States, along with
the perception that the current system was broken and must be changed if American students
were to keep up with their counterparts in other foreign countries (Christensen et al., 2011).
This educational hysteria, and the need to compare American students with each other
and with students in other countries, began the standardization of educational experience for
public school students in Kindergarten through 12th grade in the United States. The problem
with students being pushed through their educational journey in a factory style classroom
experience is obvious. Horn and Staker (2015) believe that all students have different aptitudes
and background knowledge. These different experiences affect the way and timeframe in which
12
students learn information. Students are all individuals who learn at different paces and in
different ways. When schools require all students to learn everything at the same time, and in
the same way, the system is doing students a disservice.
The accountability piece of education has grown so dramatically in recent years, to the
point where testing and data drive the curriculum. Assessment has become the driving factor in
the current realm of education, and schools are spending more time assessing skills through
standardized tests and less time preparing students for the current diverse and online workplace
they will soon enter (Lichtman, 2014). American students’ educational experiences have
become teacher and test focused. Students are expected to move through the curriculum at the
same time in order to pass a standardized test at the end of the course that may or may not be
relevant to what they need to know for success in the real world. Horn and Staker (2015) report
that today’s job market requires knowledge workers in over 60 percent new positions. These
knowledge workers will need skills, which are not memorized and used over and over again like
the factory workers of the past. Today’s student must be able to collaborate with peers, work
through real-world problems, and use technology to innovate and become problem solvers, not
become masters of multiple-choice exams.
The traditional, industrial age model of an education assembly line keeps students in
courses and grade levels in an assembly line concept. Schools feel the pressure to move students
through the curriculum at the same pace in order to expose them to as much curriculum as
possible prior to taking the standardized test at the end of the course. A teacher’s ability to
differentiate for individual student’s needs has taken a backseat to getting through the standards
of the course in a certain period of time. The past model of standardization and batching
students together based on age is changing to a culture of flexibility and self-pacing with the

13
online options available today for students. (Horn & Staker, 2015).
Technology and educational innovation is helping to change the concept of time in a
course and the teacher’s ability to differentiate for students and still progress through the
curriculum of the course in a timely manner. Lichtman (2014) believes “we can’t create more
minutes in a day or days, but we can absolutely twist time to better our learning goals” (p. 21).
The creation of student-centered, project based learning opportunities that incorporate
technology or are totally provided online is disrupting education in today’s classrooms
(Christensen et al., 2011).
It is imperative for our K-12 educational institutions to understand the impact online
learning is having across not only the United States, but also the entire world. Friedman and
Friedman (2011) suggest offering online courses to students as a cost effective way for schools
ranging from kindergarten through graduate school to offer more courses and opportunities for
students that was never possible in the past. Luehr (2011) believes that online learning cannot be
considered a trend in education and that it should be taken seriously as a main method to educate
students as we look for more options to differentiate for all student needs and learning
preferences.
The student-centered instructional model has been shown to increase student engagement
while allowing students to become more active participants in the learning process (Kurvitis &
Kurvitis, 2013). Virtual and online learning opportunities allow students to be active participants
in their instruction as teachers assume more of a facilitator role. Christensen et al. (2011) note
that new online options are arising to serve a student population that was not satisfied with the
traditional public school setting and educators have to make a choice as to how these new
mediums will affect their instructional beliefs. It is imperative for educators to realize the

14
potential online learning has for creating student-centered learning opportunities for students
where engagement, collaboration, and pace can all be addressed to improve student achievement.
Historical Significance
The Industrial Age of education is quickly coming to a close with the disruptive influence
of technology and the Internet in today’s classrooms. Educational research shows that students
all learn at different paces based on their ability levels, interest in a subject, and each student
having a particular learning style in which they learn best (Horn & Staker, 2015). Online courses
are an option for today’s K-12 student since the online version can provide them with a
differentiated and customized learning experience. This is critical as students try to learn new
concepts and master standards in online courses.
Horn and Staker (2015) believe that the traditional, public education model was designed
to do just the opposite of differentiation and customization. Today’s classrooms were created in
the “factory style” model of the Industrial Revolution. The one-room schoolhouses lost their
effectiveness when town populations exploded in the early 1900s. In 1900, only 50% of 5-19
year old students were enrolled in school in the United States (Horn & Staker, 2015). Local
government officials had to find a way to educate the masses through a universal system, and the
factory style model was used to accommodate this growing problem across the country
(Christensen et al., 2011). Standardizing the educational process helped to efficiently create an
economically sound system of public education, but it has affected the ability of a teacher to
customize and differentiate for individual students.
Theoretical Significance
A student’s ability to collaborate with their peers and their instructor in a classroom has
been shown to increase his or her understanding of new material. Vygotsky’s (1978) social

15
learning theory, and specifically his thoughts on a student’s zone of proximal development
(ZPD), states that students can increase their learning by watching and working with more
capable peers as they are introduced to new material. The ZPD theory conceives that a child has
an actual development level that is determined by their individual problem solving. The child
has the potential for a higher level of development through the guidance of an adult through
working with a more capable peer (Miller, 2011). Vygotsky believed the dynamic social
surroundings of a child helped to influence the whole child. He thought that every function in
the cultural development of a child appears socially and then psychologically.
The ZPD theory is grounded in the processes of cooperation and collaboration. Vygotsky
(1978) believed that learning leads to development. A child’s participation in guided activities
helps them uncover their true potential and helps to speed up their higher psychological functions
(Levykh, 2008). The actual size of the ZPD is not a fixed area of number, but Levykh (2008)
reports it is the ability for a child to use collaborative activities to realize their potential beyond
what they can do on their own in an independent setting on task that is age-appropriate.
Vygotsky viewed interaction with a teacher and peers, along with collaborative
opportunities, as critical to a child’s upbringing (Miller, 2011). Vygotsky believed that a child
could only do so much on his or her own with no interaction or collaboration with a peer or
teacher/parent. “Vygotsky argued that only by looking at moment-moment change over time can
we understand development; intelligence is not what you know but what you can learn with
help” (Miller, 2011, p. 219).
Based on Vygotsky’s (1978) social learning theory, a student’s connectedness with his or
her peers and instructor is instrumental in the learning process. Until recently, the ability to
connect with peers in the online setting was limited at best. As technology advances at its rapid
16
pace, more quality opportunities are now available for true collaboration and connection between
classmates and instructors in the virtual setting. These new online opportunities are allowing
students to connect with many more peers than previously possible (Haley, 2013). These virtual
opportunities are also allowing students access to their instructors at any time, not just during the
traditional school day. School systems are currently using online learning opportunities as a
new medium in which to learn and prepare students for the 21st century workplace (Bedard &
Knox-Pipes, 2006; Haley, 2013).
The online classroom movement is creating a shift from face-to-face opportunities for
students to more virtual interaction with their peers and instructor. Vygotsky’s (1978) social
learning theory and other similar ones stress the importance of the school experience and
interaction with peers as a catalyst for basic human development (Miller, 2011). A student’s
ZPD could be greatly affected by this online instructional movement and its ability to connect
peers from across the globe (Gredler, 2011). The ability to meaningfully connect with peers and
the instructor must be addressed in the online environment if educators believe in Vygotsky’s
theory of ZPD and its potential impact on a student’s intellectual growth.
It is imperative that educators understand the impact less face-to-face instruction may
have on a student’s academic success (Borup, Graham, & Davies, 2012; Luehr, 2011; Rankin,
2013). The online course model can help tailor the instructional experience for students, their
opportunities for collaboration, and the ability to receive more immediate feedback from their
instructor throughout the course. Vygotsky (1978) believed that learning helps jump-start
internal developmental processes that only can occur when a child interacts and cooperates with
others in their environment (Miller, 2011). High expectations and the teacher’s ability to create
collaborative opportunities for students to connect is a critical piece of Vygotsky’s ZPD theory.
17
The ability to feel connected with an instructor and more capable peers in the online
setting may help students grow their ZPD and increase their developmental potential. Thompson
(2012) feels the ZPD is “a shared zone within which pupil and teacher (or more capable other)
interact through symbolic or semiotic meditated activity using both psychological and physical
tools” (2012, p. 91). By conducting this study the researcher hopes to understand if a student’s
senses of connectedness has any relationship to a student’s success in the online course.
Society At-Large Significance
Christensen et al. (2011) suggest that the Internet and technology are providing a
disruptive innovation in educational practice. Bedard and Knox-Pipes (2006) say this is the first
generation of students who will spend more time using the Internet than watching television.
Haley (2013) reports that it is obvious that the Internet is the most preferred option for
entertainment, information, and communication for today’s student. The virtual setting has
become an integral part of a student’s world in the 21st century.
Technology has improved the ability for individuals to connect and collaborate with their
peers from across the world. Marx (2014) reports that Gary Rowe, a member of the Futures
Council 21, believes students will begin to work through the different K-12 grades at their own
pace in a more mastery level approach to moving from grade level to grade level. As teachers
take on the role of a facilitator, students can use technology to engage in real world, project-
based learning opportunities that lead to inquiry and collaboration with peers.
This generation of students is the first in history who do not require a teacher to provide them
with information (Elmore, 2010). Larry Rosen, a professor of psychology at California State
University expects technology to do whatever they want it to do: “Their WWW does not stand
for World Wide Web, it stands for Whatever, Whenever, and Wherever” (Marx, 2014, p. 42).

18
This access to information and connection with peers is unprecedented in the history of mankind
and many believe it is changing the way in which students and teachers will interact in the future.
Instead of measuring students on information that may already be obsolete, Lichtman
(2014) believes schools should be more focused on student-centered opportunities where
collaboration and problem solving are used to assess a student’s mastery of standards for a
course. Competency-based assessments can be used in lieu of standardized measures to assure
that each individual student, in real-world scenarios, can apply information. Information is
readily available, but the ability to collaborate with peers and apply it is increasingly needed in
today’s work place (Horn & Staker, 2015).
Today’s student has information available to him or her at the touch of a button on a cell
phone, Ipad, or personal home computer. Technology tools, Internet access, and human curiosity
are now allowing many students to come to school with the same and sometimes more
information than the teacher has (Marx, 2014). The role of the teacher is evolving into a
facilitator of that information as they help students learn to apply it in real-world scenarios.
Technology is allowing teaching and learning to become a partnership where students have more
time to collaborate with peers and their instructor, and less time sitting at a desk and memorizing
information (Bergmann & Sams, 2012).
Data show that 50 percent of high school courses will be delivered online by 2019
(Luehr, 2011). That possible shift in educational delivery requires the need for research and
studies into the online experience for students and what they need in order to be successful in
these courses. As school districts look for ways to provide students with more personalized
learning opportunities, they must also understand how to make these courses interactive, student-
centered options that engage students in relevant learning (Lichtman, 2014).

19
The shift from teacher-centered, traditional classrooms to student-centered, online
courses can revolutionize education in this country. A student’s ability to connect with their
instructor and peers from any location and at any time can provide them with opportunities never
before available in the history of education (Elmore, 2010). Lichtman (2014) suggests that the
“natural learning space for this and future generations is a connected knowledge space that is
open and available via technology anytime and anywhere, and students are increasingly
comfortable exploring and living in this space” (p. 146).
Problem Statement
Online opportunities for K-12 students are growing rapidly in school districts across the
United States (Marx, 2014). As students take more online classes, educators must understand
what type of online course design works best, while providing students with a quality course
experience. Smith (2009) believes the student perceptions of our K-12 distance education
students needs to be addressed and future research is needed. This research can help educators
understand the type of course development needed to help students succeed in this course format.
A student’s engagement in the online course and his or her feelings of connection with peers and
the instructor are areas of interest for researchers of K-12 high school online classes and
programs, and should be evaluated for its impact on student success (Rankin, 2013).
As more K-12 students take online courses, the classroom instructor is becoming less
involved in face-to-face interactions with students, and more as a facilitator of knowledge.
Teachers can use technology to enhance the experiences of their students by creating real-world
learning experiences that ask students to be active participants through guided inquiry,
collaboration with peers, and the creation of projects with their various technology options.
(Marx, 2014). It is imperative for school districts across the nation to understand how students
20
feel about their online experiences. This information can help lead to better designed courses
and more student engagement in the class and with their collaboration with peers.
Purpose Statement
The purpose of this study was to evaluate the relationship between students’ sense of
connectedness in an online high school course and their End of Course Milestone assessment
standardized scores upon completion of the course. Very little research has been done with high
school students’ sense of connectedness in online courses. Borup et al. (2012) believe that as
online options become more available to the K-12 student, it is imperative to increase the effort
by educators to improve the outcomes of students taking those courses.
The researcher hoped this study would reveal the relationship, if any, between students’
sense of connection with their peers and teacher in the online course and their EOC Milestone
assessment score. Understanding the relationship between a student’s sense of connection in the
online course and its impact on their achievement scores may help educators create better online
courses for students. This study used the Online Student Connectedness Survey (adapted for
high school students) and the students’ EOC Milestone assessment scores to analyze the
correlation between the two variables.
Scores were collected and analyzed from students taking the course in the online setting
through the County Virtual Academy (CVA). The research question analyzed the data to
determine if there was a significant relationship between the two sets of scores. The researcher
hoped to reveal if a lack of physical contact with the instructor and more capable peers on a daily
basis has an effect on a student’s score on the End of Course Milestone assessment. The study
results would be significant as the school district evaluates its online process and its impact on
student achievement on the Georgia state standardized assessment for high school students.

21
Significance of the Study
Kirby, Barbour, and Sharp (2012) identify a lack of available and useful research in the
online experience for K-12 students. A variety of studies exist for post-secondary students and
their experiences in the online environment. There is a need for more studies to be conducted on
the high school student’s experiences in the online medium, with a gap in the research seen in the
area of ZPD and its impact or lack of impact in a student’s success in an online course. The
research specifically does not address the new End of Couse Milestone assessment scores in
Georgia and the difference in those scores in the traditional instructional setting versus the online
setting for students.
Several research studies on post-secondary students’ online experiences have been
conducted (Harvey, Greer, Basham, & Hu, 2014; Rankin, 2013; Kirby et al., 2012), but the
researcher found no studies completed on high school students’ sense of connectedness in their
online class and its relationship to their standardized test score for the course. The answer to this
question may help educators understand what the sense of connection with peers and the
instructor has on a students achievement scores.
It is important to identify which online course allows for more student interaction and
collaboration to understand what the students’ sense of connection may have on the student
achievement in the course (Borup et al., 2012). This information may assist school systems in
understanding what type of online techniques work best with today’s student. There is very little
information in the research on the sense of connectedness for online students in the K-12
environment. This area has been noted by several researchers as a focus for future studies
(Haley, 2013; Luehr, 2011; Rankin, 2013).
Kim, Kim, and Karimi (2012) report that though substantial research has been conducted
22
in the areas of online school administration, management, and teacher development, but very
little has been conducted in the student learning experience and what they think about their
online interaction and collaboration opportunities. This gap in the literature reveals an area of
interest as schools try to understand what students need to be successful in the virtual classroom
and how best to engage them in their online experience.
Research Question
RQ1: Is there a correlation between online students’ sense of connectedness in the course and
their End of Course (EOC) Milestone score for students taking an EOC course through the
County Virtual Academy (CVA)?
Null Hypothesis
Ho1: There is no statistically significant correlation between students’ online
connectedness scores, as measured by the Online Student Connectedness Survey (OSCS) and
their End of Course Milestone scores for high school students taking a 16-week, online course
via the Virtual Academy (VA).
Definitions
1. Asynchronous Learning – A learning environment in which students are able to actively
participate at a time of their choosing in their own learning, giving them the opportunity
to interact with their peers, provide peer feedback, and reflect on the status of their
personal learning goals and outcomes (Haley, 2013).
2. County Virtual Academy (CVA) - The virtual academy offers high quality, online,
Internet-delivered high school courses that equip students to thrive in the complex life
and work environment of the 21st Century (CCSD, 2014).

23
3. Competency-Based Learning – A type of learning where students must demonstrate a
mastery of a given subject within a flexible timeframe- including application, or creation
of a knowledge, a skill, or a disposition- before moving on to the next one (Horn &
Staker, 2015).
4. Personalized Learning – Learning is tailored to an individual student’s particular needs
and customized to help each individual succeed (Horn & Staker, 2015).
5. Student-Centered Learning – The combination of personalized learning and competency-
based learning (Horn & Staker, 2015).
6. Synchronous Learning – When meaningful interactions in a face-to-face setting where
lectures, discussions, and lesson presentations occur at a specific point in time with the
expectation that all students will be available to participate (Haley, 2013).
7. Zone of Proximal Development – “The distance between the actual development levels as
determined by independent problem solving and the level of potential development as
determined through problem solving under adult guidance or in collaboration with more
capable peers” (Vygotsky, 1978, p. 86).
Summary
Today’s K-12 students have more options than ever before as they relate to the type
of instructional delivery they receive and in what manner they complete a course. The
online environment provides students with the ability to connect with their peers in their
community and across the globe. Students’ engagement in these courses and their ability
to feel connected to their classmates and instructor is crucial to their success in the
course. Teachers are becoming more of a “guide on the side” for students on their
instructional journey (Haley, 2013). It is important to understand how technology can be

24
used to increase student achievement as students are connecting to their peers like never
before in the history of education.

25
Chapter 2: Review of Literature
Introduction
Technology and the Internet are allowing learning to no longer be constrained to a classroom
or a school building. Access to information and the ability to connect with peers across the globe
is expanding exponentially each year (Elmore, 2010). Borup et al. (2012) say that historically,
distance education options have only been for adult and university students, but this option is
quickly expanding its reach to the K-12 educational community. Distance learning is providing
students across the country the opportunity to take courses that in previous years were not
available due to financial and practical issues (Smith, 2009).
The virtual, online educational option is beginning to take the place of the traditional,
physical brick and mortar school setting as educators realize that learning can take place anytime
and any place with all of the virtual opportunities available to today’s student. These online
learning opportunities and the online access students have to their classmates, teacher, and
course material is changing the landscape of the traditional educational model (Haley, 2013).
Advanced Placement (AP) courses, foreign language, and advanced mathematical courses that
could not be provided in the past are now available to all students at the touch of a button (Smith,
2009). The online learning option is allowing students from various socio-economic
backgrounds to take courses that were previously not available to them. Haley (2013) feels that
online learning is equalizing educational opportunities for students across the world.
Traditional education is transforming from teacher-centered, brick and mortar buildings
to student-centered, virtual learning opportunities. Horn and Staker (2015) believe that online
learning options and the use of technology to enhance students’ learning experiences are
disrupting the world of education. This disruption allows students the ability to connect with

26
their peers and instructor as they move through their educational journey.
Over the last thirty years, schools have begun to use technology to enhance student-
learning experiences: “In 1981, there was a computer for every 125 students in schools. In 1991
there was one for every eighteen, and by 2009, there was one for every five students” (Horn &
Staker, 2015, p. 6). The abundance of computers available to students, however, did not
necessarily create improved learning. The enhancement of student learning can only be
accomplished through the creation and development of online learning opportunities that help
customize a student’s learning experience and create intrinsic motivation to gain knowledge from
information.
Marx (2014) states, “like a violin in the hands of a master, various technologies can help
us personalize education, deliver instruction, monitor what students have learned and where they
need help, provide reinforcement, and serve as tools to conduct research” (p. 124).
Technological advancements and online instructional options now provide K-12 students with
learning opportunities that go beyond their traditional brick and mortar school building and the
factory style model of learning. Lamport and Metz (2009) say that students are now able to
connect with each other like never before in the history of education and those connections are
helping to change the way we educate students.
It is imperative for educators to understand the use of online instruction and its impact on
student success. The ability for K–12 online learning exploded over the past two decades, but
only a small amount of research is available in the online practice (Kirby et al., 2012). It is
imperative for educators to understand the significant impact technology will have on the success
of students in classrooms across the United States. Rankin (2013) found topic areas for future
study included “student academic performance, qualities of effective online courses and content

27
design, effective professional development for online teachers, and leaner characteristics and the
factors that contribute to success” (p. 10).
Harvey et al. (2014) report the lack of social interaction to be an area of concern for
students participating as it relates to peer to peer and student to teacher. Research of K-12
opportunities exists but Rankin (2013) reports that the literature shows a need for further
research into the actual student experiences and how they impact student achievement. Harvey
et al. (2014) found a positive relationship in the research with student satisfaction and success
with an online course among college students, but currently there is a gap in the research as it
relates to student interaction in online high school courses and the students overall success in the
course.
Christensen et al. (2011) propose that online learning will transform the traditional way in
which students learn. This will begin a competition between the student-centric, virtual learning
experience and the traditional teacher-centric classroom instructional model. Dillon and Tucker
(2011) believed that:
Instead of blackboards, schoolhouses, and a six-hour school day, interactive technology
will personalize learning to meet each student's needs, ensure all students have access to
quality teaching, extend learning opportunities to all hours of the day and all days of the
week, and innovate and improve over time. (p. 8)
These interactive, virtual learning opportunities are changing the traditional role of the teacher
and are putting more emphasis on the student as an active participant in the learning process.
Education in isolation versus online collaboration with peers may be the ultimate debate
if the virtual classroom can succeed as school districts implement a quality virtual learning
experience for students. Freeman (2010) believes that students need to be actively engaged in

28
the educational journey and that teachers are providing them with opportunities to learn practical
problem solving skills. As school districts decide how to incorporate online learning options for
K-12 students, budget constraints and technology improvements have helped school districts
become more open to the concept of online learning for their K-12 students in recent years.
Online learning has not yet taken over the traditional instructional model in the country,
but improvements in the process allow students the ability to collaborate with their peers in the
online arena (Christensen et al., 2011). These collaborative opportunities are beginning to
change the opinion of educators that online equals isolation. Kim et al. (2012) call for future
studies to understand and the detailed conditions that lead to student success in the online setting.
As each new generation of virtual learning is created, courses are becoming more and more
interactive for students and teachers. As technology improves, so too does the ability for school
districts to create courses where students may connect with peers from across the globe as they
work toward mastering standards and concepts in a course.
Theoretical Framework
Social Learning Theory and Zone of Proximal Development
As more online learning opportunities are provided for K-12 students in public education,
educators must rethink the traditional approach to teaching and learning. Schwirzke (2011)
believes that schools should be providing students with 21st century skills and opportunities in
the online setting to set them up for the global workforce they will enter after they complete their
education. As students begin to take more online courses, their physical interaction with their
peers will be limited in this new setting.
The use of technology is allowing students to become less involved with their peers as
they have begun to rely on technology to learn new concepts. Harvey et al. (2014) feels that an
29
area of concern with online learning is the lack of a student’s social interaction with his or her
peers. Levykh (2008) believes that Lev Vygotsky’s social development theory, and its emphasis
in the area of the zone of proximal development, may have a positive influence on students when
receiving computer-based instruction.
Collaboration with peers has been an instructional method since the formation of the
formal educational setting. Lev Vygotsky defined his theory, the Zone of Proximal
Development (ZPD) in his book “Mind in Society” (1978) as, “the distance between the actual
development level as determined by independent problem solving and the level of potential
development as determined through problem solving under adult guidance or in collaboration
with more capable peers” (Vygotsky, 1978, p. 86). Thompson (2012) describes ZPD as the
psychological development of the child is acquired first through the interaction with peers and then
internalized as knowledge and mastery of concepts.
Vygotsky (1978) believed that students could only acquire so much knowledge on skill
on their own, but with modeling and assistance from others, they could grow their ZPD and learn
to master concepts much more involved and intricate tasks. Vygotsky argued that, “the only good
kind of instruction is that which marches ahead of development and leads it; it must be aimed not
so much at the ripe as at the ripening functions” (Vygotsky, 1986, p. 188). Keeping a student’s
ZPD in mind will assist teachers as they create opportunities for increased cognitive
development. The online environment opens up connection opportunities that will assist
teachers in the creation of differentiated experiences to increase a student’s ZPD.
The use of technology allows students to become physically less involved with their
peers in a physical setting but more connected with them in the online setting. Technology
allows students to collaborate with assistance from technology as they access a vast amount of

30
information (Freeman, 2010). Technology provides students a way to learn that may not involve
physically interacting with their more capable peers. This new type of connection is opening up
new opportunities where students can participate in the virtual world with peers from across the
state, country, and globe (Elmore, 2010).
Technology and the online learning environment may provide opportunities for students
to collaborate with peers from anywhere in the world as they learn new concepts while
increasing their ZPD. These opportunities are creating a world where students can connect with
their peers on a level never before available (Horn & Staker, 2015). Online learning allows a
student to take risks and learn by trial and error. Students are not all working on the same thing
at the same time. They can progress through the online material at their own pace while asking
questions at any time, with no risk of ridicule or embarrassment (Haley, 2013).
School districts are beginning to rely on more online and computer-based instructional
methods to educate their students versus traditional course offerings, and technology is changing
the way we educate our students (Cobb County School District [CCSD], 2014). School districts
must understand the appropriate use of technology and the academic benefits of its use as they
create student-learning opportunities. Vrasidas, Zembylas, and Chamberlain (2003) believe that
more research needs to assess and evaluate the online learning experience for to improve course
offerings, pedagogical practices, and student assessment. Technology can provide differentiated
and student-centered activities that can engage students and provide them with meaningful
learning experiences (Christensen et al., 2011).
Kurvitis and Kurvitis (2013) feel the student-centered instructional model helps engage
students more than a teacher-centered model of instructional delivery. They believe a teacher-
centered delivery of instruction leads to passive students who are not engaged in the learning
31
process. Virtual courses and online instructional opportunities provide student-centered learning
opportunities where students can be active participants in their learning experiences while
moving through the course on their own (Christensen et al., 2011). Online instructors become
more coach than teacher. In the online classroom setting, peers may be students from the local
community or from across the entire state or country. The teacher’s role in a student-centered
classroom is to create the course framework and then provide support as students become more
personally active in the acquisition of mastering concepts and standards (Stix & Hrbek, 2006). A
student-centered course provides students with the support they need to learn on their own as
they collaborate with their peers through the process.
As online learning opportunities for students increase, the role of the instructor will begin
to evolve. Stix and Hrbek (2006) believe that teachers can assist more students when they
function as more of a coach. They should move away from the role of supplying direct
instruction and to a position of facilitator. This can create opportunities for real-world projects,
discussions, or debates that are more student-centric in nature (Stix & Hrbek, 2006). Providing
students with opportunities to work through problems on their own is crucial in today’s
workplace (Elmore 2010). Learning from their failures helps them master new concepts that
they can use in real-life situations. Students must learn to creatively react to real-life problems
as they mature and grow as learners.
Lev Vygotsky (1998) chose “non-independent problem solving as the method of
identifying maturing higher cognitive functions that establish a student’s zone of proximal
development (ZPD) at a particular time” (1998, p. 204). The four ways a teacher can examine
these emerging functions are: To assess if a child can imitate the steps after seeing a
demonstration, start the problem and observe the child to see if they can complete it; have the
32
child cooperate with a more capable peer; or explain the principles of solving the problem, ask
the child guiding questions, and then break down the task with the child to check for their
understanding of the task (Vygotsky, 1998).
The ZPD theory has given rise to some key concepts for student success in today’s
classroom environment. Gredler (2011) believes that Vygotsky's theory of ZPD and a child’s
cognitive development has repercussions on current educational practice on at least three
different areas. These areas include rethinking current instructional and pedagogical practices,
expressing concern about the curriculum currently in place in today’s traditional school setting,
and the implication of the revision and creation of new curriculum (Gredler, 2011). Assessments
focused on the ZPD of a student would challenge students to master concepts as they grow their
cognitive awareness level and grow their vertical relationships among concepts (Gredler, 2011).
The use of scaffolding, dynamic assessment, and collaborative learning are all crucial
elements to the ZPD theory (Shabani, Khatib, & Ebadi, 2010). Those concepts involve the
student, classroom peers, and the teacher in the enrichment of the learning environment.
Students who take online courses with no direct physical interaction with their more capable
peers or a teacher limit their opportunities for traditional social interaction. In the context of
learning, Vygotsky believed that a child’s development within a their ZPD revolved around the
three key areas of interaction with peers, dialogue with adults and peers, and facilitated
interaction between the child and their instructor (Wertsch, 2007).
The ZPD is future-oriented and is always interested in what the child can do after he or
she has had help understanding a concept or activity. Levykh (2008) believes an educator can
observe a child solving a problem and see the future mental development and capacity they have

33
for the development of more mature psychological functioning. Development occurs only when
children confront a difficult activity, and they cannot manage it on their own (Zaretskii, 2009).
The Social Learning Theory and the concept of ZPD is based on the belief that
individuals learn from watching or working with someone else, mastering the concept
individually, and finally moving on to a more difficult task. Vygotsky’s (1986) socio-cultural
theory of child development believes the interaction between the parent, teacher, or peer with an
individual student is crucial to the creation and development of that student’s cognitive skills.
The significant piece to the socio-cultural theory is the ZPD theory. Vygotsky believed the ZPD
was a moving target that could be increased through collaboration with more capable peers
(Birjandi and Sarem, 2012). More capable peers or adults have the ability to assist students as
they grow their ZPD and begin to master concepts on their own without the aid of others.
An online learning experience can be very different from a traditional classroom
experience for as student. Technology provides opportunities not available in the traditional
setting while allowing the instructor to be more of a guide for students as they make their way
through a course (Christensen et al., 2011). The online setting will look much like a
constructivist classroom as the teacher takes a less direct role in the delivery of instruction and
the learning is more student centered (Haley, 2013).
Greene and Ackerman (1995) say that for many educators, a constructivist classroom
setting can be unique. A constructivist classroom setting allows the student to be at the center of
the learning as the instructor participates as a facilitator of the knowledge, and acts as more of a
guide for the student (Greene & Ackerman, 1995). The online learning experience offers today’s
students the ability to take an active role in their own learning (Haley, 2013). They attempt to

34
understand concepts and master course standards while still being supported by the instructor
and their peers in the virtual classroom.
Review of the Literature
Emergence and Growth of Online Learning
The ability to work at a student’s own pace and the extra help that can be available in the
online setting are two factors that are leading to an increase in the online enrollment across the
country (Bedard & Knox-Pipes, 2006; Cavanaugh, 2006; Kim et al., 2012). Watson, Gemin,
Ryan, and Wicks (2009) believe that today’s student is choosing online courses for the options,
choices, convenience, and flexibility that it provides them compared to the traditional classroom.
Federal and State governments are looking to find unique ways in which to serve a variety of
student needs in today’s educational world.
The Internet opened the door for online opportunities for students that have not been
available in the past (Daniels, 2008). The introduction of online learning has broken down
traditional instructional offerings and instructional boundaries, while at the same time, creating
its own unique cultural phenomenon for the current generation of students (Liang, Thanq, and
Chen, 2012). The Internet has opened up the world to today’s student and is providing students
with the ability to connect with each other across the globe (Chandler, Tolbert, & Amber, 2012).
The beginning of online learning started out with a small number of participants, but over
the last two decades, participation in online courses has grown exponentially all over the world.
The first virtual schools serving the K-12 population got their start during the exponential
increase in Internet access across the United States in the late 1990’s (Rankin, 2013). Students
are now able to create, interact, and collaborate with their peers through the online platform.

35
Historically, students had only been able to work through a traditional course in a
synchronous manner, with all students learning the material at the same time, in a lecture style
method with little interaction between teacher and student (Scarborough & Ravaglia, 2014). The
online technology options have opened the door for a more asynchronous method of learning.
Scarborough and Ravaglia (2014) believe that live, interactive experiences for students in the
online setting works best for students taking courses with classmates from across the globe.
These opportunities to interact in real time enhance the course and help build connections
between students and their peers.
Picciano, Seamon, Shea, and Swan (2012) feel that the world is just seeing the beginning
of online learning in K-12 education, and that the future growth of the process will be significant
in the education of students. The most important piece of the online learning model is the
student having access to the technology needed to work in the online environment. Liang et al.
(2012) believe that the access to technology is a key factor in the implementation of online
opportunities for students. The accessibility to the technology and online environment is key to
its growth in the educational world.
During the 2007-2008 school year, online enrollment in one or more courses exceeded
one million students in the United States with around 70% of those students taking courses at the
high school level (Picciano et al., 2012). Luehr (2011) says the data suggests that 50 percent of
high school courses will be delivered online by 2019. With the demand for online opportunities for
students, it is imperative for K-12 educational institutions to understand the impact online learning
is having across not only the United States, but also the entire world. Friedman and Friedman
(2011) believe offering online courses to students is a cost-effective way for schools ranging from
kindergarten through graduate school to offer more courses and opportunities for students.

36
Generation iY
Elmore (2010) has coined the term Generation iY for students in today’s educational
world. This generation of students thinks, feels, and learns differently than past generations
(Hawkins, Graham, Sudweeks, Barbour, 2013). Students have more access to information than
any other generation before them, and the ability to connect to each other like never before. The
belief is that this generation of students is constantly connected and that technology is not seen as
an innovation, but a requirement for them to feel something is important. A disconnect between
how schools delivers instruction and how students want to receive the instruction has widened,
and students are not happy with what they are receiving (Elmore, 2010). Generation iY students
are bored with the traditional classroom setting where the teacher acts as the sage on a stage and
all students are required to move at the same pace (Elmore, 2010).
The traditional instructional model in education is all about teaching memorization and
fact recall. Research on the iY Generation has discovered these students desire a healthy,
trusting relationship with their teacher, an interactive learning community, and a creative
innovative approach that stimulates the right brain (Elmore, 2010). Standardized testing and
school accountability has made the way in which we teach students a mechanized approach that
is easy to evaluate and collect data for school report cards. Elmore (2010) believes students in
Generation iY are right brain thinkers who are being taught in left-brain schools. The left side of
one’s brain is about knowledge while the right side is about creativity. The left side of one’s
brain is definitive and the right side is innovative.
Elmore (2010) also believes that students in Generation iY learn through “uploading”
rather than “downloading”. Downloading is explained as a teacher lecture or dissemination of
material and information at a rapid pace where the student is given everything by the teacher and

37
told to memorize the information for a test, and then it is forgotten. Elmore (2010) explains
uploading is a student-centered activity where they can express themselves and move through an
activity at their own pace. Uploading allows students to be creative and show their
understanding of the material in the way in which they best learn. Elmore (2010) suggests that
the uploading experience allows students to grow through the participation with others and their
interaction with their peers through multiple platforms.
Benefits of the Online Experience
Kim et al. (2012) believe that students choose the online setting for many different
reasons that include, but are not limited to, course acceleration, freedom of choice, pace of the
course, and their difficulty with the traditional school setting. The traditional instructional
setting is very different than the virtual online experience. In the virtual setting students have
access to online lectures and discussions and can review these multiple times, providing them
with an advantage over a student in a traditional classroom who only can get the lecture one way
and at only one time (Bedard & Knox-Pipes, 2006).
In the traditional setting, the students have the ability to physically connect with their
peers and teacher on a daily basis. A traditional school is thought of as a building of mortar and
bricks, with bells announcing the class changes throughout the day. Mahrenholz (2010) believes
the online experience is more about clicks, than about bricks.
In a study conducted by Cavanagh (2006), students reported a preference to online
learning to traditional classes because of its flexibility and that it allowed them to work on their
schoolwork at any time during the day. Lim, Kim, Chen, and Ryder (2008) also conducted a
study and found similar results to Cavanaugh’s (2006) findings. Students reported that flexibility

38
and convenience were major factors in their satisfaction with the online experience. Based on
those experiences, they would recommend taking an online course to a peer.
Virtual course options are changing the delivery model in public education and making
educators reevaluate the traditional teaching and learning practices (Watson et al., 2009). The
use of technology has allowed students to become less involved with their peers as they have
begun to rely on technology to learn new concepts. Zunker (2008) believes that Lev Vygotsky’s
Social Development Theory and its emphasis in the area of the ZPD has a direct influence on
students when receiving computer-based instruction. Harvey et al. (2014) suggests that an area
of concern with online learning is the lack of a student’s social interaction with their peers.
Zunker (2008) believes the computer can act as the “more knowledgeable peer” in the
ZPD dynamic. The computer-based instruction can provide the needed support to a student who
may not be getting enough support in the traditional setting. The role of the teacher or facilitator
in guiding the online student through the process is found to be critical by Ng and Nicholas
(2010). They think the role of the teacher in the online experience is to provide a presence,
maintain continuity and guidance, be a motivator, and mentor students as they learn how to
understand and apply the information in the course (Ng & Nicholas, 2010).
Teachers in today’s classrooms facilitate student learning as they assist them in
navigating through the unlimited amount of information available to them. Technology is
providing students a way to learn that does not involve physically working with their more
capable peers. It does, however, provide them a way to connect with an unlimited number of
peers from across the globe in the virtual setting. These opportunities have never been available
to students in the past and are allowing students in today’s classrooms to make connections never
before possible in the history of education (Scarborough & Ravaglia, 2014).
39
In the past, direct instruction has been the norm for most typical classroom settings. The
teacher in front of the room, and the students seated in rows, listening and taking notes in with
little or no interaction with peers. Liang et al. (2012) believe the internet is allowing students to
have an online presence that could be more communicative and engaging than the actual physical
setting students are used to. In the past, collaboration was just seen as another instructional
strategy, and today it is viewed as an integral part of the development of a student (Liang et al.,
2012).
Students who take online courses with no direct physical interaction with their more
capable peers or a teacher have limited opportunities for traditional social interaction. The
online setting does, however, create a flexible, innovative way for students to interact without a
time constraint (Liang et al., 2012). The creation of online coursework that provides
opportunities for student interaction with their peers throughout the course is an integral part of a
successful online program (Lee & Figueroa, 2012). Langenhorst (2011) suggests that texting
options, online chat rooms, audio and video conferencing, and virtual classrooms have helped to
make the online environment more like the traditional face-to-face instructional model and have
helped to provide a sense of community for students who take online courses.
Success Factors in the Online Process
A student’s sense of community has been shown as a major factor in the success a student
has in an online course (Hawkins et al., 2013). Teacher support and interaction with peers are
both areas the researchers pointed out as being consistently visible in successful online students.
Particular learning style profiles have also been shown as a precursor for success in the virtual
world for a student (Rankin, 2013). Tomlinson and Imbeau (2010) say four distinct areas shape
a student’s learning profile. The four areas are: Learning style, intelligence reference, gender,
40
and culture. These four areas all help shape the students’ learning and approach to different
tasks. The online environment allows students with various learning styles to work through the
information at their own pace and in their personal way of understanding the material (Malcom,
2009). The traditional classroom setting does not allow this and all students move at the pace the
teacher sets for the class despite their various learning differences.
Roblyer and Marshall (2003) note that the online success of students occurs when the
constant ability to connect with others and their coursework eliminates the geographical
boundaries in place in the traditional setting. To be successful in the online learning
environment, students must be self-motivated and self-directed (Daniels, 2008). Research
collected in a study by Barbour, Siko, Sumara, and Simuel-Everage (2012) found the virtual
school environment provided students with the flexibility to work at his or her own pace, moving
ahead of everyone else if that was their desire. Daniels (2008) believes that the virtual classroom
provides students with the ability to receive individualized instruction while focusing on content
mastery as compared to the industrial style model of the traditional classroom.
Harvey et al. (2014) report that students who participated in an online course said they
most enjoyed the flexibility of the online experience and the ability to do their work from home.
To be successful in the online experience, students must maintain a good work ethic and keep in
contact with their peers and instructor. These two areas are critical to the success of students in
the online environment. Kerr (2011) believes a successful online course is a direct result of
teachers and students maximizing the tools afforded to them throughout the duration of the
course. Students must take an active role in their education in the online setting and use their
instructor as a mentor and their classmates as collaborative peers.

41
Research has established that online teachers assume several different roles. They may
act as a coach, facilitator of the content, a collaborative partner, and the organizer designer of the
material (Mahrenholz, 2010; Malcom, 2009; Picciano et al., 2012). In the online setting,
students must assume the responsibility for their own learning if they are to be successful in an
online course. Chandler et al. (2012) believe that as more and more traditional K-12 educators
begin to design and use online curriculum, it is important that they understand what has worked
in the past. Instructional techniques in the traditional, face-to-face instructional model do not
always work in the online setting. Haley (2013) believes some advanced students who are bored
in the traditional setting may be more successful in the online setting. They can progress through
the course at their own pace. They can take advantage of the ability to take courses for college
credit along with other courses they may not have had time to take in the traditional setting.
Advantages and Disadvantages of Online Learning
Based on the research, online learning has several possible advantages and disadvantages
for students who take online courses. Grubb (2011) says that the online learning experience’s
largest advantage is its flexibility of both location and time. Students have the ability to work on
their courses whenever they want to and from wherever they are. They are neither constrained to
a brick and mortar building, nor limited by their peers in the classroom and the teacher’s
instructional pace.
To be successful in online courses, students have to be highly motivated and work well
independently (Lowes, 2005). The instructional design of the content must include student-to-
student collaborative opportunities that allow students to reflect and respond to each other
throughout the course (Zucker, 2005). Lowes (2005) identified several indicators of success in
the online setting. Those included: Much closer supervision by teachers, constraints of
42
traditional education eliminated thus allowing more innovative instructional practices, and the
availability to offer many more options and courses for students. The online course setting can
provide these and many more much-needed pedagogical options for students and teachers that
may collaborate in a more effective and efficient manner.
The online experience can allow students to take courses that they may not have been
able to take due to several factors. The school may not have a certified teacher for a particular
course or the student may have a class load during the day that prohibits him or her from taking a
certain traditional course (Grubb, 2011). Also, due to greater school accountability across the
nation, schools have been forced to find ways to improve their graduation rates and overall
student performance. Picciano et al. (2012) explains the relatively new phenomenon of online
credit recovery courses and their impact in the online world of education. These offerings were
practically non-existent until recently but are now offered at almost all high schools across the
country. These courses allow students to re-take courses in the online setting. These online
credit-recovery courses help students get back on track for graduation after previously failing a
course.
The opportunity for students to be presented with differentiated activities during their
online experience is also an advantage of the process. Grubb (2011) believes online learning
offers opportunities for students to show their mastery of standards through a differentiated
process that allows them to use their preferred learning styles throughout a course. Not all
students learn in the same way or at the same pace, so the inclusion of several different
instructional mediums at the pace of the student may help them to better understand the material
for the course (Horn & Straker, 2015).

43
The theory of social development, as it relates to Lev Vygotsky’s ZPD (Miller, 2011), is
an important part of the online discussion and may be seen as a disadvantage to the online
experience. Individuals believe there are disadvantages to the online experience (Grubb, 2011),
but the ZPD theory has given rise to some key concepts for student success in today’s classroom
environment. The use of scaffolding, dynamic assessment, and collaborative learning are all
crucial elements of the ZPD theory (Shabani et al., 2010). The online experience takes students
out of the traditional setting and physically away from their peers and the course instructor, thus
limiting their physical collaboration with others. Miller (2011) says that Vygotsky believed what
students “can do with the assistance of others (zone of proximal development) is a better
reflection of their intellectual ability than what they can do alone” (p. 183).
Another disadvantage for the online experience is the perception of a lack of academic
integrity and the possibility for students to cheat their way through a course (Grubb, 2011).
Opportunities to cheat in the online setting are very real and must be monitored throughout the
course. Kerr (2011) explains a best practice in an online course is the creation of authentic
learning experiences for students. These assignments can help limit the ability to cheat on an
assignment due to their unique creation and possible grading.
Kim et al. (2012) believe that technology is blurring the line between brick and mortar
schools and the online classroom setting. Online options are helping to enhance instructional
pedagogy and helps students learn anytime, anyplace, and at any pace. Many educational
researchers believe education as we know it in the United State is changing at a rapid pace, and
the available online options are growing daily (Horn & Staker, 2015; Lichtman, 2014; Haley,
2013; & Scarborough & Ravaglia, 2014). Glader (2009) states, “Approximately 100,000 of the
12 million high-school-age students in the United States attend 438 online schools on a full-time

44
basis. This is an increase of 30,000 from 5 years ago" (para. 6). Some students are not even
taking one traditional high school course on campus. With several types of online learning
opportunities, there is tremendous potential for the growth and expansion of online opportunities
for all K-12 students in the United States as more students are provided the opportunity to
participate in online course offerings.
Types of Online Learning
There has been rapid growth in online programs across the country in recent years
(Schwirzke, 2011). The Department of Education estimates the number of online schools and
enrollment in online schools each year (Watson, Gemin, Ryan & Wicks, 2009). As of 2009, 45
states, including Florida, California, and Texas, had some form of statewide online initiative or
school for secondary students in their state (Watson et al., 2009). Online education opportunities
are rapidly growing in this country as various educational entities create new and differentiated
ways for K-12 students to complete their coursework (Dillon & Tucker, 2011).
There are several types of online learning opportunities for secondary students in the
United States. Dillon and Tucker (2011) report:
The types of online schools and programs range from state-run programs like Florida
Virtual School, where each year 100,000 students take one or two courses online as a
supplement to traditional schools, to "blended" models, which allow schools to combine
online and classroom-based instruction. (p. 1)
Overall, research on K-12 virtual education is limited at this time. Virtual opportunities at the
post-secondary level are much more prevalent. The limited amount of research-based
knowledge on high school students and their success with online learning is crucial to the
development and improvement of the process. Educators, parents, and students must understand
45
the different online learning options available and the strengths and weaknesses of each program
as they relate to the students’ successful learning opportunities.
Dillon & Tucker (2011) say the most controversial virtual schools are cyber charter
schools where students attend on a full-time basis, but the schools function independently from
local school districts by companies with no federal regulations. These programs are increasingly
hard to track and to evaluate based on their charter school status. These virtual schools are also
causing states to struggle on how funding should be handled for the programs. With little to no
physical expenses incurred for brick and mortar buildings, the virtual student seems to require
less funding than the traditional student. State decisions on funding can dramatically affect the
impact and availability of the virtual opportunities for their students in a particular region or
state.
County Virtual Academy
The County Virtual Academy (CVA) is a particular online learning option for secondary
students. The CVA “offers high quality, Internet-delivered high school courses that equip CVA
students to thrive in the complex life and work environment of the 21st Century” (CCSD, 2014,
p. 1). The CVA opened in 2001 and has served over 13,000 students since its inception. During
the 2013-2014 school year, the CVA served 3,000 students from the school district. Students
have the opportunity to take CVA courses during the year on a tuition basis for after school
options as well as for free if taken as part of their school day schedule.
State certified district faculty members teach all online CVA courses. Each CVA course
meets national, state, and school district curriculum standards. The school district (2014)
believes “the County Virtual Academy effective online educational programs – quality teachers,
quality curriculum, and constant teacher-student collaboration. The CVA suggests that students
46
are exposed to rigorous courses through the online, which allow students to be creative while
using higher order thinking skills, collaborate with their peers as they work in the digital age of
the 21st century (CCSD, 2014).
The Role of the Online Instructor
Technology allows the 21st century teacher the ability to instruct and assess students in
ways never before possible (Marx, 2014). The use of technology and its ability to allow
immediate feedback and constant contact between the teacher and student is helping to change
the traditional educational experience (Harvey et al., 2014). Interactions between peers and the
instructor help to foster student achievement in traditional and online classrooms (Dixson, 2010).
It also develops a more personalized learning opportunity for students. Mahrenholz (2010) says
that is a necessity for online instructors to understand their students’ needs and their particular
learning profile. This will assist them in providing the appropriate instructional material as they
deliver the lesson via the online setting.
Technology allows teachers to create student-centric instruction that allows teachers to
maximize class time and provide personalized learning opportunities. Christensen et al. (2011)
believe the goal of every educator should be to ensure that all students have the skills and
capabilities to break away from their current situation and help realize their dreams through a
student-centric learning model. Teachers can begin to use assessment for learning, not of
learning (Fullen, Hill, & Crevola, 2006).
Assessment of student success and its impact on perceived learning gains has changed
over recent history. Spaulding, Garcia, and Braun (2010) feel the role of the teacher is to help all
students achieve high-quality learning outcomes. Teachers in today’s classrooms are asked to
assess student progress at a much more frequent rate than in the past. Current research has begun

47
to study education in a more scientific manner and identify effective assessment strategies that
can improve student performance (Dixson, 2010). These strategies have been identified by
researchers as ones already used by effective instructors teaching meaningful, engaging lessons
in their classrooms.
Marzano, Pickering, and Pollack (2001) helped to define successful classroom
instructional practices for the nation and the effect they have on student achievement. These best
practices show the impact a teacher has on student achievement and the necessity of research-
based instructional practices for increasing student achievement. Reflecting on teaching
practices is necessary for teacher growth and student success. Research has shown the use of
reflective practices in the student-centric classroom model has a positive impact on student
achievement (Spaulding et al., 2010).
Reflective practice on common formative and summative assessments allows teachers to
create personalized learning opportunities and more meaningful lessons that are driven by the
data analysis of the assessments. Spaulding et al. (2010) believe that reflective practice is
necessary for teachers as it helps them constantly looking at ways to improve their craft and the
way they interact and instruct students. This reflective practice should include the analysis of
data to increase student-learning outcomes, as well as improve lesson development and teaching
delivery.
Teachers have traditionally been understood to be the expert in the course they teach.
Their instructional delivery has always been viewed as crucial to the development of their
student’s educational growth. The ability to work with their students, understand how they learn,
and get to know them on a personal level, has been shown as an important factor in raising
student achievement. New approaches to educational practices are helping teachers maximize
48
their students’ learning experiences while allowing them to engage their students with more
meaningful, relevant lessons and activities geared toward their learning style and preference.
These new approaches are not changing the role of the teacher, instead they are enhancing that
role. They are helping to improve instructional practices, and in turn, improving student
achievement.
New technological advances allow the classroom teachers to change the way in which
they foster creativity and concept acquisition among students. Technology cannot replace the
wisdom of a teacher and his or her personal experiences that are used to help students understand
concepts and their application in real-world situations. The use of blogs, email, video
conferencing, and other technological tools allows students to connect with their instructor and
peers at any point in the day, not just during the traditional school day. Students still require an
instructor to guide them through the vast amount of available information and to disseminate
what is important and what can be learned at a later date. Students need a teacher to develop
meaningful, engaging lessons for them as they grow as learners, and technology can be used to
enhance that practice.
Information is available to students today at the touch of a keystroke. Teachers need to
understand this as they help facilitate student learning and help guide students through the
educational process. They should assist students as they learn to take information and apply it in
real world situations through student-centric activities and lessons. Koenig (2010) says that true
learning comes from actual experiences learned from the interaction between student and teacher
as opposed to rote memorization of material for dissemination at a later date. Moving from rote
memorization to application is a huge step in a student’s ability to use higher order thinking
skills in real-life situations.

49
Technology can help teachers maximize their time with students. In the past, teacher-
student interaction could only occur in the classroom and was very limited. With modern
technology, teachers and students can be in constant contact, and lessons can be taught in virtual
settings as well as face-to-face. Zhao (2009) says research shows that there is no significant
difference between online and the traditional face-to-face instruction. In the online setting,
interaction and collaboration among students and the instructor can occur through texts,
discussion boards, email, and other online settings that can help build a sense of connectedness
for a student in any course.
The key to student success is the ability to provide immediate feedback and daily
formative assessments that can track a student’s progress (Miller, 2015). These areas are crucial
to the role of today’s teacher as an educational guide and facilitator of knowledge. Students’
academic success hinges on their ability to understand where they are making mistakes in the
application of knowledge and how to improve upon those mistakes.
Elmore (2010) believes today’s student is wired differently than prior generations of
students. Students do not need the teacher to stand in front of the room and lecture to them in a
direct instructional setting. That information is available to them at the touch of a keyboard.
This new generation of student requires a teacher who understands individual learning styles and
can provide learning opportunities for students by taking advantage of their particular style of
learning (Tomlinson & Imbeau, 2010). Teachers should incorporate technology into their
lessons to enhance student learning and to maximize their time with the students, while
providing immediate feedback and collaboration among peers (Malcom, 2009).
The “flipped” classroom concept is a concept that has become popular with incorporating
technology and communication with assessment and data analysis (Bergman & Sams, 2012).
50
Today’s teacher can use video lessons, online activities, and other digital opportunities to deliver
information to their students outside of the classroom setting and as they assess student progress
in the course. This allows teachers to maximize their instructional time at school with their
students. The “flipped” classroom model allows time for re-teaching and remediation for those
who need it as well as acceleration for those who are ready to move on with student-centric
learning opportunities (Bergman & Sams, 2012; Horn & Staker, 2015).
The teachers in the 21st century classroom must understand the unique differences each
student brings to their class. Students learn in different ways and at different times. The
constant assessment of student progress immediate feedback is crucial to the overall success for
all students (Malcom, 2009). Today’s classroom teacher must facilitate student-learning
opportunities and then provide them with support as they learn new information. They then must
help them learn how to apply it in a situation while providing constant, constructive feedback on
their progress in the course.
The role of today’s teachers is more of a partnership with their students in a collaborative
instructional model (Stix & Hrbek, 2006). In a student-centric classroom, teachers must be
active participants with their students, and act as a guide who gets to know their students on a
personal level, while assisting them on their educational journey. The teachers should use the
technology available to them to provide their students with immediate feedback when possible
while providing opportunities for students to connect with their peers in applying information
through performance-based tasks (Langenhorst, 2011). Teachers should facilitate their students’
understanding of new concepts and how to apply them in real life situations. In a study
conducted by Langenhorst (2011), the rapport between built between the instructor and the
student, along with constant monitoring of student progress, allowed the teacher to provide

51
proper feedback to students who needed it. The positive relationships and support efforts
allowed the instructors to create learning environment that was student-centered.
Like a sport’s coach, today’s teacher must motivate by teaching, guiding, and learning to
listen for what students need. When they struggle and lose motivation, teachers should provide
the student with necessary support to re-engage and continue on with the task at hand (Stix &
Hrbek, 2006). Teachers can no longer be the sage on a stage, delivering facts and figures while
students memorize the information for a test. They must be a data collector, data analyzer, and
data-driven user of information that assists them in creating student-centric learning
opportunities for their students while helping to guide their students through the process as they
grow as a learner.
Online Learning & Vygotsky
Zunker (2008) believes that Vygotsky’s social development theory, and its emphasis in
the area of the zone of proximal development (ZPD), has a direct impact on students receiving
online, computer-based instruction. Zunker’s (2008) study evaluated elementary age students
with disabilities and the impact computer-based learning had on their academic achievement in
mathematics. The study used a control group of students who received instruction in a
traditional setting and a study group that received computer-based instruction. The researcher
hoped to see if there was any added achievement or motivation when comparing the two types of
mathematical instruction for elementary age students with disabilities.
The study conducted by Zunker (2008) revealed a difference in student achievement and
motivation when using computer-based instruction for students who need help in mathematics.
The study’s review of literature also shows a strong bond between using computer-based
interventions and the social development theories of Jean Piaget and Lev Vygotsky. The data
52
and research indicate that students like the positive, immediate feedback that computer-based
programs can give them when learning new concepts. Zunker (2008) believes the computer can
act as the more knowledgeable peer in the ZPD dynamic and that computer-based instruction
gives the support to students that they may not be getting in the traditional setting.
Kaio (2011) conducted a research study to investigate the academic achievement rates of
students with disabilities in the traditional instructional setting versus the online instructional
setting as measured by the Texas Assessment of Knowledge and Skills (TAKS). The study
observed the variables of age, race and gender as they relate to student achievement outcomes.
The researcher evaluated if students with disabilities are making the same progress on their
TAKS when using computer-based, online learning when compared to their peers who received
their instruction in the traditional setting. The researcher’s review of literature found there is no
significant difference in the performance of students attending virtual schools and those
attending traditional schools. The research study hypotheses were found to be statistically
significant in at least one area each, but none of them in all areas. Kaio (2011) found there is
very little research to confirm or deny the success rates of students with disabilities and their
success rate in education. When comparing traditional versus online education, Kaio (2011)
believes more studies should be conducted to see if there is a correlation between the use of
online courses and higher student achievement.
Linkenhoker (2009) conducted a causal-comparative quantitative study to investigate the
effect online learning had on Advanced Placement Calculus AB course final grades for high
school students. The study used archived student achievement scores in an Advanced Placement
Calculus AB Course. Student scores were compared between students who received traditional
instruction in five different high schools in Massachusetts, and students who received their
53
instruction in the online setting, the Virtual High School (VHS). The data from the Linkenhoker
(2009) study revealed no significant difference for those individuals who received their
instruction in the traditional manner versus those who took the course online. Three different
research questions were posed for the study, but due to the limited availability of data, only one
of the research questions could be addressed. The researcher acknowledged the need for more
data to conduct a more thorough study
A mixed-methods study by Lewis, Whiteside, and Dikkers (2014) evaluated the benefits
and challenges of online learning for at-risk high school students in North Carolina. Students
from the North Carolina Virtual Public School (NCVPS) and the North Carolina Performance
Learning Center (NCPLC) were selected for the study. The mode of instruction for NCVPS
students is through the Moodle and Blackboard online learning management systems. Students
interacted with their peers and instructor exclusively in the online setting.
The NCPLC serves students who have not been successful in the traditional classroom
setting. There are five Performance Learning Centers (PLCs) in North Carolina and in 2012-
2013; the NCPLC model served 700 high school students. The NCPLC students complete their
coursework through a self-paced, online curriculum with both face-to-face instruction and an
online environment.
Lewis et al. (2014) found that the NCVPS students benefited from the access to their
courses twenty-four hours a day, seven days a week. This flexibility allowed students to work at
their own pace and whenever they wanted to work on their course. The NCVPS online
experience also allowed for mastery learning opportunities for its students. Students could show
mastery of a unit in a pre-test and then could skip that module and move to the next unit. This
54
individualization of instruction helps to differentiate learning opportunities for students as they
have various levels of background knowledge in all of the courses in which they participate.
Students from both the NCVPS and NCPLC reported self-motivation as a key factor in
their successful completion of their coursework. The study found that though students enjoyed
the totally online experience, they felt the need for support as they began the process. They
found there is a learning curve to the online instructional environment for both time management
and the learning management system and how it works.
Lewis et al. (2014) believe that trouble shooting technical problems and persevering
through online issues is critical with today’s virtual courses, but learning course content should
be the most important factor in the online experience. The study conducted by Lewis et al.
(2014) revealed that when the proper support is in place, the online learning experience can
benefit at-risk students who may thrive in an environment outside of the traditional classroom
instructional setting.
Summary
Online learning has been identified as a key factor in the future of education
(Christensen, Horn, Johnson, 2011; CCSD, 2014; Jacobs, 2010). Schwirzke, (2011) believes its
ability to help relieve overcrowded classrooms, outdated school schedules, a lack of quality
teachers and course offerings in rural and poor areas of the country, while providing a way to
differentiate instruction for students regardless of location or time constraints are just some of the
ways in which online learning can revolutionize education.
Online learning assists students to learn intrinsic motivational skills that will be essential
for them to have as they move into the 21st century workplace (Sheninger, 2014). Providing
students with the ability to connect with their peers in the online setting may help change the
55
way in which students are educated in this country. The implications from higher education
research suggest that basic constructivist principles can be used in virtual classroom design to
obtain an overall positive result (Townsend, 2009).
Kirby et al. (2012) identify a lack of available and useful research in the online
experience for K-12 students. A variety of studies exist for post-secondary students and their
experiences in the online environment. Smith (2009) says that there is a definite need for
research into K-12 distance learning and the impact interaction and collaboration has on student
success. Research shows a need for more studies to be conducted on the high school students’
experiences in the online medium, with a gap in the research seen specifically in the area of
student interaction along with a sense of community with their peers and instructor in the online
setting (Daniels, 2008; Hawkins et al., 2012; Malcom, 2009).
The intent of this study was to evaluate the correlation between online students’ EOC
Milestone assessment scores and the students’ online connectedness survey scores. Scores were
collected and analyzed from students taking the course in the online setting through the CVA.
The researcher determined if there is a statistically significant correlation between both sets of
scores. The researcher hoped to reveal if students’ sense of connectedness with their peers and
instructor in the online setting have any effect on their score on the EOC Milestone assessment.
56
Chapter 3: Methods
The purpose of this study was to understand the relationship between high school students’
sense of connectedness in their online course as it relates to their End of Course Milestone
assessment score. This chapter describes the research design, participants, setting,
instrumentation, procedures, and data analysis.
Design
This research study was conducted using an observational correlational research design to
evaluate the first research question. The bivariate correlational research design was appropriate
for this study due to its ability to determine the strength of relationship between two variables
(Gall, Gall, & Borg, 2007). The research study’s goal was to determine the relationship between
students’ sense of connectedness in an online course and the students’ EOC Milestone
assessment scores. The independent variable for the study was the students’ survey scores from
the Online Student Connectedness Survey. The dependent variable for this research study was
the students’ EOC Milestone assessment scores.
Gall et al. (2007) say that the use of bivariate correlational statistics for the research
question is appropriate “because each coefficient expresses the magnitude of a relationship
between two variables” (p. 345). The null hypothesis for this research study was that there is no
statistically significant correlation between students’ online connectedness and EOC Milestone
scores. The researcher tested the correlation through the use of the product-moment correlation
coefficient (r), better known as Pearson’s r. Gall et al. (2007) believe Pearson’s r should be
“computed when both variables that we wish to correlate are expressed as continuous scores” (p.
347).
57
When conducting a quantitative correlational study, “the product-moment correlation is
the most widely used bivariate correlational technique because most educational measures yield
continuous scores and because r has a small standard error” (Gall et al., 2007, p. 347). Howell
(2011) states that the correlation coefficient can be affected by three characteristics of the sample
that include: Restrictions of the range or variance, nonlinearity of the relationship, and the use of
heterogeneous subsamples (p. 203). No range restrictions for this study were used for the
independent or dependent variables. Howell (2011) believes the more usual effect of restricting
the ranges of the two variables leads to a reduced chance of correlation. The lack of a range
restriction helped the study eliminate a bias in the non-linearity of the relationship between the
independent and dependent variable in the study. The study did include a heterogeneous
subsample that includes 35.9% male and 64.1% female participants.
Research Question
RQ1: Is there a correlation between online students’ sense of connectedness in the course and
their End of Course (EOC) Milestone scores for students taking an EOC course through the
County Virtual Academy (CVA)?
Null Hypothesis
Ho1: There is no statistically significant correlation between students’ online
connectedness scores, as measured by the Online Student Connectedness Survey (OSCS) and
their End of Course Milestone scores for high school students taking a 16-week, online course
via the Virtual Academy (VA).
Participants and Setting
The participants for this research study were all students enrolled in the County Virtual
Academy (CVA) during the fall semester of 2015. All of these students were enrolled in a
58
course that includes an End of Courses (EOC) Milestone assessment upon completion of the
course. The state of Georgia assesses students with an EOC Milestone assessment in the
following courses: 9th grade Literature, 11th grade Literature, Algebra I, Geometry, United
States History, Economics, Physical Science and Biology. Approximately 207 students made up
the sample population, with their median age being 16.7 years of age. Participants for this
quantitative research study were chosen through the use of convenience sampling. Gall et al.
(2007) state that in a correlational study, a minimum of at least 30 participants are required when
conducting a quantitative study. The researcher believed that the return rate on the 207 student
surveys would be enough data for the study’s results to be generalized.
A total of 35.9% of the population was male and 64.1% female. The participants’ ethnic
background was 43.6% Caucasian, 51.3% African-American and 5.1% Multi-cultural. Gall et al.
(2007) believe it is best to plan this in the design stage so sample sizes can be evaluated and
found to have statistical power. The researcher found that with a total population of 207 students
eligible to participate in the survey, at least 36 total students would have to participate in order to
get a 15% margin of error with a 95% confidence level (Raosoft.com, 2016). All students who
were enrolled in an online CVA EOC Milestone course were asked to take a survey for the study.
The correlation between the two variables was evaluated for all online EOC classes: 9th grade
Literature, 11th grade Literature, Biology, Physical Science, Algebra I, Geometry, Economics,
and United States History.
The study took place in a school district located northwest of Atlanta, Georgia. The
school district is one of the largest school districts in the country and served over 111,000
students during the 2014-2015 school year. Participants for this study included all students
enrolled in an online county virtual academy course that is associated with an EOC Milestone

59
Assessment. The study took place during the fall semester of 2015. EOC Milestone assessment
score data and student connectedness scores using the OSCS survey were used for the study.
The population of the study included all CVA students who were enrolled in an online EOC
Milestone Course during the fall of 2015.
The school district (2014) reported that the CVA offers a web based high school course
delivery for students that will assist them in the internet based daily life and work environment in
which they live. The CVA opened in 2001 and has served over 13,000 students since its
inception. During the 2013-2014 school year, the CVA served 3,000 students from the school
district. Students had the opportunity to take CVA courses during the year on a tuition basis for
after-school options as well as for free if taken as part of their school day schedule (CCSD,
2014).
State certified school district teachers teach each CVA course through an online platform.
The teachers did not have any kind of physical interaction with the students, and all
communication is done virtually or by phone. Each CVA course met national, state, and county
curriculum standards. The school district believes “the Virtual Academy offers the hallmarks of
truly effective traditional education programs – quality teachers, quality curriculum, and frequent
student-teacher interaction” (CCSD, 2014).
Instrumentation
The purpose of the study was to determine if there is a statistically significant relationship
between a CVA students’ online sense of connectedness in their online course, as seen through
their connectedness score using the OSCS, and their EOC Milestone assessment score. The
ability to understand student perceptions of the online experience can lead to the creation and
implementation of more student friendly virtual courses for students. During this research study,

60
students were asked to take the OSCS to assess their perception of connection and community
with their peers and instructor in their online course. Bolliger and Inan (2012) created the OSCS
due to increased online course growth and the emerging concerns of student feelings of isolation
and disconnectedness with their peers and instructor.
The EOC Milestone assessment is a state mandated, standardized, criterion-referenced
assessment that is given to high school students in the state of Georgia at the completion of eight
different high school courses (Georgia Department of Education [GADOE], 2016). Students
receive a scaled score upon completion of the test. The EOC Milestone assessment’s first year
of implementation in Georgia was during the 2014-2015 school year. The EOC Milestone
assessments are taking the place of a similar test, referred to in the past as the End of Course Test
(EOCT; Georgia Department of Education [GADOE], 2014). The EOCT was a deemed a valid
tool as measured by its publisher and developer and was used to determine the academic
achievement level of students enrolled in an EOCT course (GADOE, 2014).
The EOC Milestone assessment tests were normed by the state of Georgia after the 2014-
2015 implementation and have been shown to be a valid and reliable test of course knowledge
(GADOE, 2016). There are several phases the state of Georgia goes through in the development
of validity on their standardized assessments. “By attending carefully to each phase of the test
development process, the GADOE can ensure that the Georgia Milestones Assessment System
consists of valid instruments” (GADOE, 2016, p.3), with the understanding that the validation of
a test is an ongoing process.
The EOC Milestone assessments were also reported to reliable by the Georgia State
Department of Education (GADOE, 2016). The GADOE (2016) reported that the reliability of a
test is the degree to which test scores are stable and consistent for a particular group over a

61
period of time. The reliability indices provided by the GADOE (2016) indicate the following
reliability numbers from the Spring 2015 administration of each EOC Milestones assessment
test; 9th grade Literature (.90), 11th grade Literature (.88), Algebra I (.90), Geometry (.90),
Biology (.91), Physical Science (.88), United States History (.90), and Economics (.89). “These
reliability indices indicate that the tests provide consistent results and that the various
generalizations of test results are justified” (GADOE, 2016, p. 12). The GADOE (2016) believes
that the reliability data also supports their claim of validity of the EOC Milestone assessments.
Bollinger and Inan (2012) created the OSCS to understand a student’s perception of
connectedness with their peers and instructor in the online classroom. Bollinger and Inan (2012)
established the validity of the OSCS by having it reviewed by a group of distance learning and
instructional technology experts at three different universities in the United States. The
researchers calculated the internal reliability coefficient for the instrument and its subscales after
several groups of online university students were administered the questionnaire. Bollinger and
Inan (2012) created four sub categories within their survey they believed were the four main
areas of interest for their research.
The OSCS survey was created to assess the overall connectedness felt by students in the
online setting and consists of four subcategories: comfort, community, facilitation, and
interaction and collaboration (Bolliger & Inan, 2012). The researchers conducted a factor
analysis that confirmed the OSCS’s four subscales of comfort, community, facilitation,
interaction and collaboration. These four areas were identified as critical to the online learning
student. Bolliger and Inan (2012) reported the reliability coefficients for the OSCS survey and
its subcategories were high and revealed a high internal consistency for the overall survey
instrument. This analysis provided information needed for the researchers to declare the OSCS
62
to be a valid and reliable measure of students’ perceived connectedness in the online
environment.
The OSCS consisted of a 25-question survey that uses a Likert-scale ranging from 1,
strongly disagree, to 5, strongly agree, to assess student perceptions of their online experience
(Bolliger & Inan, 2012). Gall et al. (2007) believe a survey should include at least 10 items to
obtain a reliable understanding of the participant’s attitude of the research topic.
Personal attitudes consist of three components: (1) affective, which relates to the individual’s
feelings; (2) cognitive, which includes the person’s beliefs or understanding of the subject; and
(3) behavioral, which is the way in which the person would act toward that action presented to
them (Gall et al., 2007). Bollinger and Inan (2012) report the 25-item OSCS “instrument’s
reliability to be very high (.97)” (p. 49). Gall et al. (2007) say that a test that yields a reliability
of .80 or higher is acceptable for use in most research studies.
The participants were initially asked to take the OSCS through the online survey portal of
Survey Monkey (basic version). The use of the online survey can reduce the possibility of
missing data within questions, and there will be less chance of data entry error on the part of the
researcher when collecting and analyzing the results (Gall et al., 2007). Since the participants
are taking an online course and are being asked to assess their perception of the connectedness
they feel in the course, the researcher feels it is only appropriate to use an online survey option
with a 5-point Likert-scale to collect the perception data.
The other instrument used in this quantitative multivariate correlational study was the
End of Course (EOC) Milestone assessment given to each student in an EOC course. In
educational settings, students are traditionally tested with standardized assessments, which are
categorized as either norm-referenced or criterion-referenced. In a norm-referenced assessment,
63
individuals acquire a score based on a comparison of their score with all other individual
participants (Gall et al., 2007). A small number of people will receive the highest scores or
lowest scores with the majority of individuals receiving scores in the middle. Gall et al. (2007)
reports that a criterion-referenced measurement’s major purpose is to get a precise estimation of
the student’s performance level and domain areas in which they struggle. EOC Milestone
assessments were developed for students in Georgia as criterion-referenced assessments to
measure student mastery of standards for selected 9-12th grade courses and to show domain
areas of strengths and weaknesses for individual students.
Federal regulations have required that states become much more accountable as it relates
to their educational progress across the country. Over the past two decades, a large number of
states have created end of course tests (EOCTs) as part of their formal assessment of students’
for graduation purposes (Domeleski, 2011). In 2002, only two states reported using EOCT
scores as an assessment of student achievement in their state. By 2011, that number had
increased to nineteen states considered in full implementation and another nine states developing
EOCT tests for their high school students (Domeleski, 2011). Some states use the EOCT scores
as a criterion for graduation eligibility, while others use it along with a student’s final grade in
the class to promote students and award course credit. Currently, thirteen states use these EOCT
scores to ensure that a high school diploma is a meaningful indicator of requisite student
achievement (Domeleski, 2011).
Gall et al. (2007) say the “reliability of a test refers to the degree to which measurement
error is absent from the scores yielded by the test” (p. 200). They go on to define validity as “the
degree to which evidence and theory support the interpretation of test scores entailed by
proposed use of tests” (Gall et al., 2007, p. 195). The GADOE has addressed validity in their

64
test creation, item development, and the development of their EOC administration procedures.
The GADOE (2016) provided adequate statistical data to establish the EOC Milestone’s
reliability and validity.
Procedures
The researcher secured IRB permission from Liberty University as well as permission to
conduct the study by the County School District (CSD). The researcher developed a permission
form and letter explaining the study for parents and students to review, and accept or decline
their participation in the study. The letter and consent forms were sent electronically to the
parents of 207 students who took an online, EOC CVA course during the fall semester of 2015.
The consent forms were delivered electronically through email correspondence with the students
and the CVA. Online instructors were not be a part of the process, as the researcher does not
want students to feel as if their answers would in any way influence their teacher’s perception of
them.
Completion of the consent forms and survey for students was optional. It was highly
recommended that they take it, but only with parental permission. Students who returned a
parental consent form were to be sent the OSCS via an email during the 14th week of their 16-
week course. The researcher created a copy of the OSCS in the online platform of Survey
Monkey. Students were to be given login information and an explanation of survey expectations
prior to completing the survey.
The researcher worked with the CSD Virtual Academy principal to acquire students’
EOC test data for all students who participate in the study upon completion of the course. EOC
scores were reported to the GADOE in January of 2016. Data from both the OSCS and EOC
Milestone assessments were used to conduct the correlational research study.

65
The researcher asked the EOC district coordinator to extract those EOC scores for any
students who took an EOC course through the CVA in the fall of 2015. The researcher used all
student OSCS scores along with their EOC scores to compute the product-moment correlational
coefficient (r) on the data to understand the relationship between the two variables included in
the research question for this study.
Data Analysis
The research question for this study is: is there a statistically significant correlation
between online students’ sense of connectedness in the course and their End of Course (EOC)
Milestone scores for students taking an EOC course through the County Virtual Academy
(CVA)? The researcher collected the data from OSCS scores from the fall of 2015 and using
SPSS 23.0 software, conducted a bivariate correlational study on the relationship among
students’ connectedness and their EOC Milestone assessment scores. Gall et al. (2007) say an
advantage of a correlational design is that it allows the researcher to show to what degree a
relationship exists or does not exist between more than two variables when several variables
exist among a large number of participants.
The researcher collected OSCS data after students complete the survey. Responses were
reported by course and then by individual student, based on the Likert-scale ranging from 1
(strongly disagree), to 5 (strongly agree). These scores show the students’ level of perceived
connectedness with their peers and instructor in their online course. EOC Milestone assessment
scores were collected and used as data in the bivariate correlational study.
After collecting the numerical data, the researcher computed Pearson’s r with SPSS 23.0
software using the data collected from the study. Gall et al. (2007) report that the “correlational
research designs are used for two major purposes: (1) to explore causal relationships between

66
variables and (2) to predict scores on one variable from research participants’ scores on other
variables” (p. 337). The researcher conducted a Bivariate, Zero Order Correlation and computed
Pearson’s r with SPSS to generate scatter grams to understand the linearity of the collected data
and the correlation between both sets of scores.
When r = 0, no relationship exists (Gall et al., 2007). Gall et al. (2007) reports that r = .1
to .29 as a small relationship, .30 to .49 as a medium relationship, and .50 to 1.0 as a large
relationship. Gall et al. (2007) state “if the scatter grams for research data indicate that the
relationship between two variables is markedly nonlinear, the research should compute the
correlation ratio (eta)” (p. 349). This computation can provide a more accurate index of the two
variables’ relationship as the researcher determines the extent of correlation between the two
variables. The researcher used both a Pearson’s r analysis and a bivariate scatterplot analysis to
understand the level of relationship the students’ OSCS score had with their EOC score. The p
value for statistical significance for the Pearson’s r analysis for research question one was set at
p ≤ .05.

67
Chapter Four: Findings
Research Question(s)
RQ1: Is there a correlation between online students’ sense of connectedness in the course and
their End of Course (EOC) Milestone score for students taking an EOC course through the
County Virtual Academy (CVA)?
Hypotheses
Ho1: There is a statistically significant correlation between students’ online
connectedness scores, as measured by the Online Student Connectedness Survey (OSCS) and
their End of Course (EOC) Milestone scores for high school students taking a 16-week, online
course via the County Virtual Academy (CVA).
Descriptive Statistics
The participants for this research study included students enrolled in the CVA during the
fall semester of 2015. The study took place in a school district located northwest of Atlanta,
Georgia. The school district is one of the largest school districts in the country and served over
111,000 students during the 2014-2015 school year. Participants for this study included 207
students who were enrolled in and completed an online virtual academy course that is associated
with an EOC Milestone Assessment. The state of Georgia assesses students with an EOC
Milestone assessment in the following courses: 9th grade Literature, 11th grade Literature,
Coordinate Algebra, Analytic Geometry, United States History, Economics, and Biology.
The study analyzed EOC Milestone data and student connectedness scores acquired
through the student’s participation in the OSCS survey. The sample population of the study
included all CVA students who were enrolled in an online course that required an EOC
Milestone assessment during the 2015 fall semester. Upon completion of the semester, per the

68
CVA counseling department, only 207 students actually completed the course with continuous
enrollment throughout the fall semester to earn a reported grade in the course.
The 207 students who made up the sample population for this quantitative research study
were chosen through the use of convenience sampling. Gall et al. (2007) state that in a
correlational study, a minimum of at least 30 participants are required when conducting a
quantitative study. The researcher determined that with a total population of 207 students
eligible to participate in the survey, at least 36 total students would have to participate in order to
get a 15% margin of error with a 95% confidence level (Raosoft.com, 2016).
A total of 39 parental consent forms and completed surveys were gathered during the data
collection. The researcher acknowledges that the margin of error calculation is higher than the
desired amount. The total number of returned and completed surveys for the study was low and
forced the researcher to use a high margin of error percentage to keep the confidence level at
95%. Based on the power analysis, the research data gathered and analyzed for this study is just
large enough to help generalize this study for future use. The correlation between the OSCS
score variable and the EOC Milestone assessment score variable was evaluated for all online
classes to determine if there was a statistically significant correlation between the two scores.
Prior to beginning this study, the CVA emailed a letter explaining the study and the parent
consent forms to the parents of enrolled CVA students in mid-November. This email was sent to
the parents’ personal email address they provided to the school district. The email, as seen in
Appendix D, gave explicit instructions on the purpose of the survey and how to reply to the
researcher. Parents were to read the letter and the consent form. If they agreed to have their
student participate in the study they were to print the consent form, sign it, and either send it
back to the researcher via email, or take a picture of it and text it back to the researcher. This

69
plan was not successful and the researcher only received feedback from two parents of the 207
students who received an email.
Next, the researcher sent paper copies of parental consent forms to each school. School
administrators were asked to hand deliver the consent forms to the students who were enrolled in
a CVA EOC course during the fall of 2015. Eligible students were asked to take home the
consent form, have their parent complete it, and then return it to the school. Paper copies of the
parental consent forms were sent home in December, at the end of the 2015 fall semester.
The paper copy of the letter explaining the research study and the parental consent forms
were exactly what was emailed to parents through the CVA in November 2015. Students were
asked to take the consent form home to their parents. Parents had the choice to allow their
student to participate in the study. If they chose to participate they were asked to return the
signed parental consent to the local school administrator. Upon return of the parental consent
form, each student was provided with an OSCS to complete and return.
Prior to beginning the study, the initial IRB research plan explained that students in the
research study would answer the OSCS through the online survey platform of Survey Monkey.
Due to a lack of participation by parents and the return rate on the parental consent forms
through the online consent form process, the researcher felt that the data collection process had
to be simplified. The researcher elected to have the OSCS paperwork hand delivered to students
and have them fill out the survey instead of trying to communicate with them via email.
Consent forms were sent to the local school and were given to eligible participants in the
study. The students were asked to take the consent form home, have it signed, and then return it
to their local school administrator. Once that form was returned, the students with permission,
were given the OSCS to complete and return. Students completed the OSCS and returned it to

70
their local school administrator. Students returned the OSCS to their local school administrator.
The surveys were collected by the researcher. A total of 39 parental consent forms and student
surveys were completed and returned.
The OSCS paperwork was collected throughout the month of January 2016. SPSS 23.0
was used to evaluate the OSCS data. The mean age of the 39 participants who returned both the
parent consent form and OSCS was 16.7 years old, as shown in Table 1. Students ages 16-18
comprised the majority of the study participants. The study includes four 15-year-old students,
thirteen 16-year-old students, fourteen17-year-old students, 6 18-year-old-students, one 19-year-
old student, and one 20-year-old student.
Table 1
Observed Student Age Mean
Age Frequency Percent
15 yrs. 4 10.3
16 yrs. 13 33.3
17 yrs. 14 35.9
18 yrs. 6 15.4
19 yrs. 1 2.6
20 yrs. 1 2.6
Total 39 100.0
The gender of the students as shown in Table 2 displays that 25 (64.1%) of the 39
participants were female and 14 (35.9%) of the 39 participants were male. As shown in Table 3,
17 students’ (43.6%) identified their race as White, 20 (51.3%) African American/Black, and 2
(5.1%) identified their race as Multiracial.

71
Table 2
Observed Student Gender Frequency
Gender Frequency Percent
Male 14 35.9
Female 25 64.1
Total 39 100.0
Table 3
Student Ethnicity
Of the 39 participants, 8 (20.5%) were in 9th grade, 11 (28.3%) were in 10th grade, 10
(25.6%) were in 11th grade, and 10 (25.6%) were in 12th grade as shown in Table 4. The
researcher believes the reported grade levels could be misleading. The school district assigns
students to specific grade levels based on their completion of certain courses, not years of
attendance at the school. A fourth year student could still actually be classified as a 9th grader
based on their completion of certain courses based on the district’s academic progress policy.
Race Frequency Percent
Black 20 51.3
White 17 43.6
Multiracial 2 5.1
Total 39 100
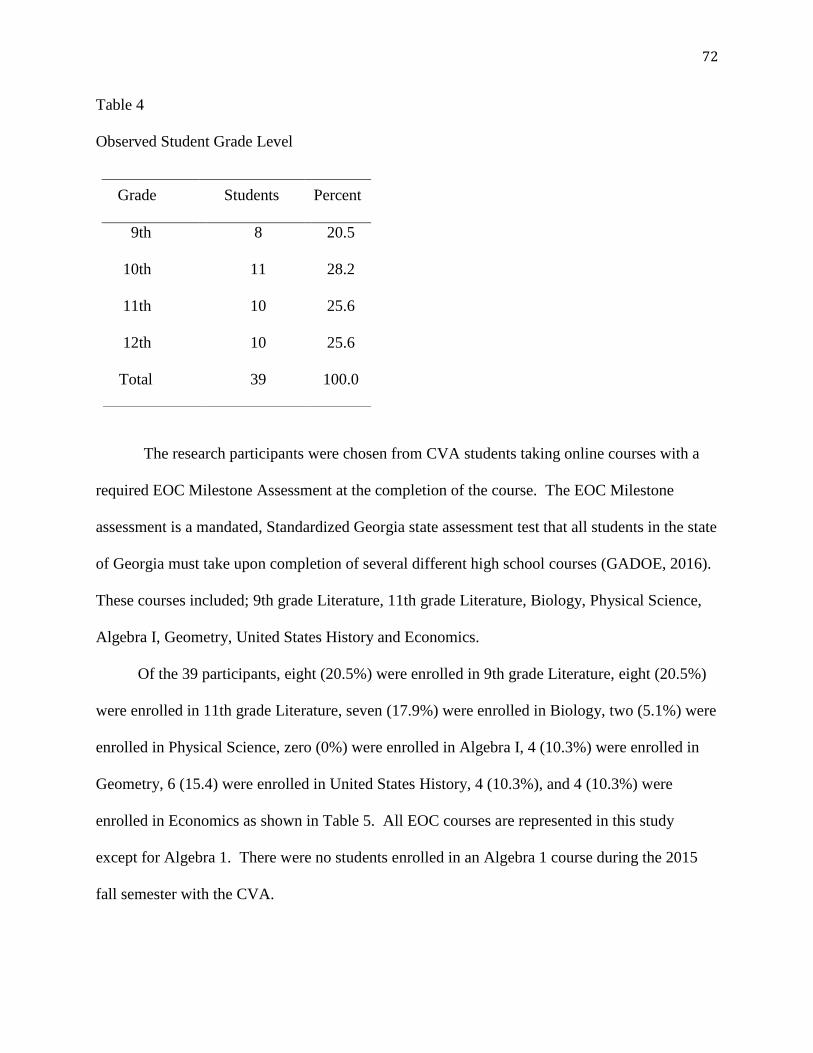
72
Table 4
Observed Student Grade Level
The research participants were chosen from CVA students taking online courses with a
required EOC Milestone Assessment at the completion of the course. The EOC Milestone
assessment is a mandated, Standardized Georgia state assessment test that all students in the state
of Georgia must take upon completion of several different high school courses (GADOE, 2016).
These courses included; 9th grade Literature, 11th grade Literature, Biology, Physical Science,
Algebra I, Geometry, United States History and Economics.
Of the 39 participants, eight (20.5%) were enrolled in 9th grade Literature, eight (20.5%)
were enrolled in 11th grade Literature, seven (17.9%) were enrolled in Biology, two (5.1%) were
enrolled in Physical Science, zero (0%) were enrolled in Algebra I, 4 (10.3%) were enrolled in
Geometry, 6 (15.4) were enrolled in United States History, 4 (10.3%), and 4 (10.3%) were
enrolled in Economics as shown in Table 5. All EOC courses are represented in this study
except for Algebra 1. There were no students enrolled in an Algebra 1 course during the 2015
fall semester with the CVA.
Grade Students Percent
9th 8 20.5
10th 11 28.2
11th 10 25.6
12th 10 25.6
Total 39 100.0

73
Table 5
Percentage of Students Enrolled in each EOC Course
Course
Frequency Percent
9th Lit 8 20.5
11th Lit 8 20.5
Biology 7 17.9
Economics 4 10.3
Geometry 4 10.3
Physical
Science
2 5.1
US History 6 15.4
Total 39 100.0
There was no opportunity to survey any students in the Algebra I course for this study. No
students were enrolled in the Algebra I course during the fall 2015 semester with the CVA. The
Algebra 1 course is a requirement for graduation in the state of Georgia. The researcher cannot
explain why no students took an online Algebra 1 course during the fall semester of 2015 and
acknowledges that the absence of data for this course could limit the findings for the study. The
other EOC Milestone assessment courses all had student participation among the CVA students
and there is no explanation as to why no student took the course in the online setting during the
fall of 2015.
The various EOC Milestone assessment courses were all represented among the 39
participants in the study with the exception of the Algebra 1 course. The Algebra I class had
zero students enrolled in a CVA course during the fall semester of the 2015 school year. The
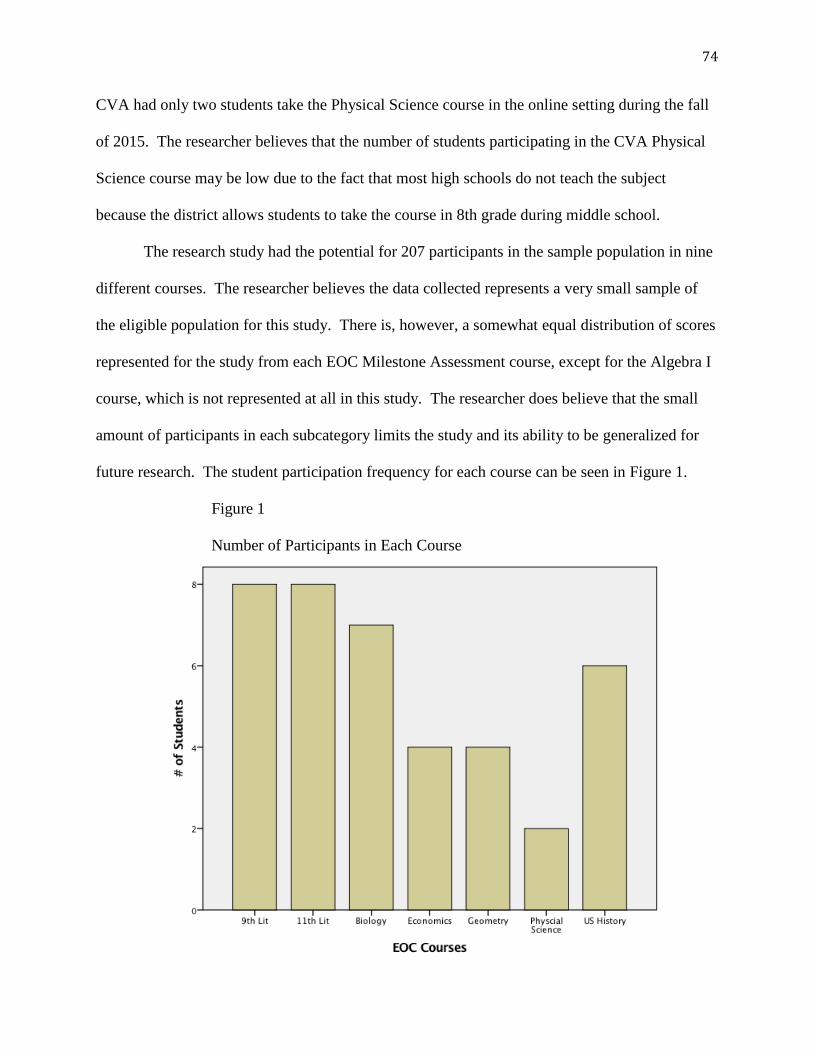
74
CVA had only two students take the Physical Science course in the online setting during the fall
of 2015. The researcher believes that the number of students participating in the CVA Physical
Science course may be low due to the fact that most high schools do not teach the subject
because the district allows students to take the course in 8th grade during middle school.
The research study had the potential for 207 participants in the sample population in nine
different courses. The researcher believes the data collected represents a very small sample of
the eligible population for this study. There is, however, a somewhat equal distribution of scores
represented for the study from each EOC Milestone Assessment course, except for the Algebra I
course, which is not represented at all in this study. The researcher does believe that the small
amount of participants in each subcategory limits the study and its ability to be generalized for
future research. The student participation frequency for each course can be seen in Figure 1.
Figure 1
Number of Participants in Each Course
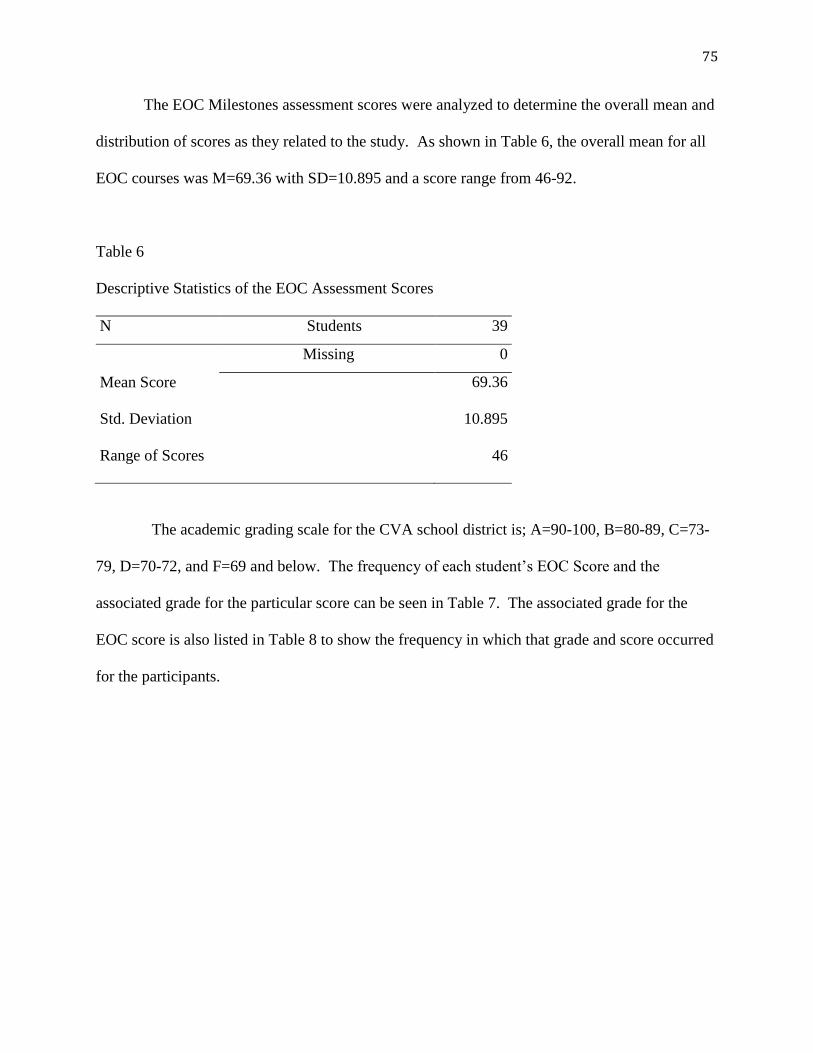
75
The EOC Milestones assessment scores were analyzed to determine the overall mean and
distribution of scores as they related to the study. As shown in Table 6, the overall mean for all
EOC courses was M=69.36 with SD=10.895 and a score range from 46-92.
Table 6
Descriptive Statistics of the EOC Assessment Scores
N Students 39
Missing 0
Mean Score 69.36
Std. Deviation 10.895
Range of Scores 46
The academic grading scale for the CVA school district is; A=90-100, B=80-89, C=73-
79, D=70-72, and F=69 and below. The frequency of each student’s EOC Score and the
associated grade for the particular score can be seen in Table 7. The associated grade for the
EOC score is also listed in Table 8 to show the frequency in which that grade and score occurred
for the participants.
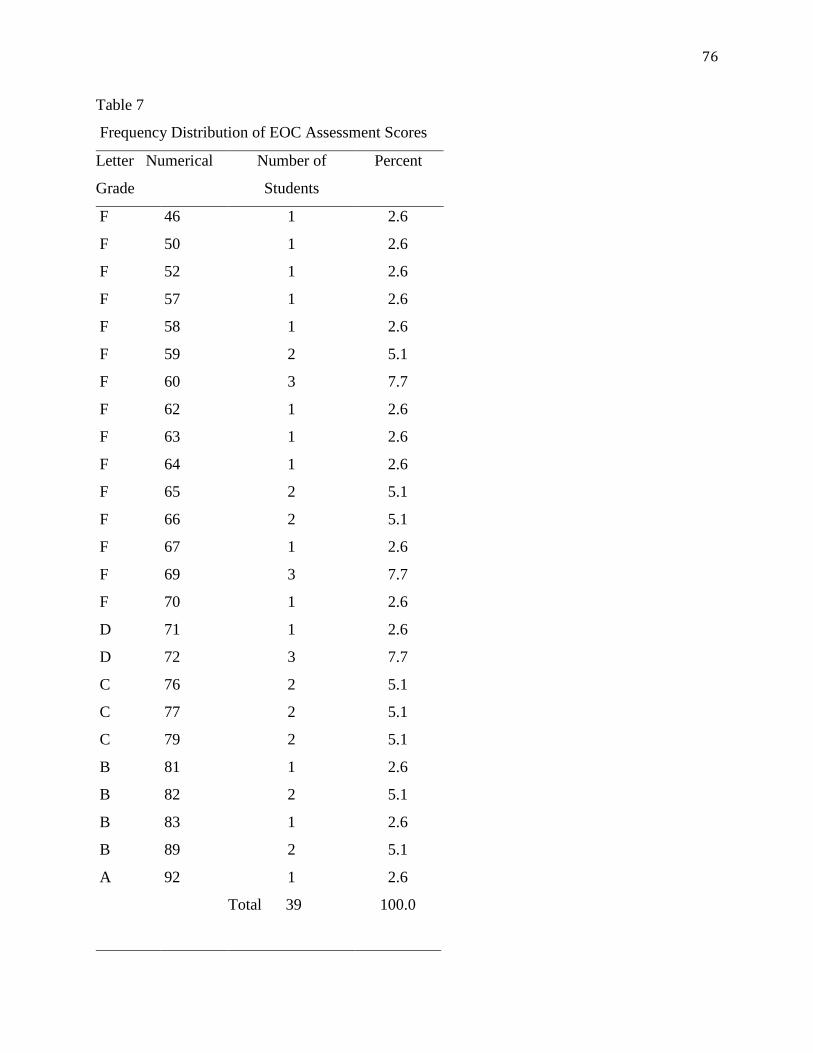
76
Table 7
Frequency Distribution of EOC Assessment Scores
Letter Numerical
Grade
Number of
Students
Percent
F
F
F
F
F
F
F
F
F
F
F
F
F
F
F
D
D
C
C
C
B
B
B
B
A
46 1 2.6
50 1 2.6
52 1 2.6
57 1 2.6
58 1 2.6
59 2 5.1
60 3 7.7
62 1 2.6
63 1 2.6
64 1 2.6
65 2 5.1
66 2 5.1
67 1 2.6
69 3 7.7
70 1 2.6
71 1 2.6
72 3 7.7
76 2 5.1
77 2 5.1
79 2 5.1
81 1 2.6
82 2 5.1
83 1 2.6
89 2 5.1
92 1 2.6
Total 39 100.0

77
The EOC assessment pass/fail distribution seen in Figure 2 reveals that 54.1% (Green) of
students failed their EOC assessment and 45.9% (Blue) passed the EOC assessment with a
passing grade of 70 or better.
Figure 2
EOC Milestone Assessment Score Pass/Fail Rate
As seen in Figure 3, data analysis shows that of the 45.9 % of students who passed their EOC
Milestone Assessment; 5 students (12.9%) fell in the range of D, 6 students (15.3%) earned a C,
6 students (15.4%) earned a B, and 1 student (2.6%) earned an A on their EOC Milestone
assessment. The scores were all assigned a letter grade based on the school district grading scale
to show the range of grades each score represents. The graph reveals the scores were evenly
distributed among the letter grades of B, C, and D, with a majority of students failing (69 or
below) their particular EOC Milestone assessment and only one receiving an A (90 or above).
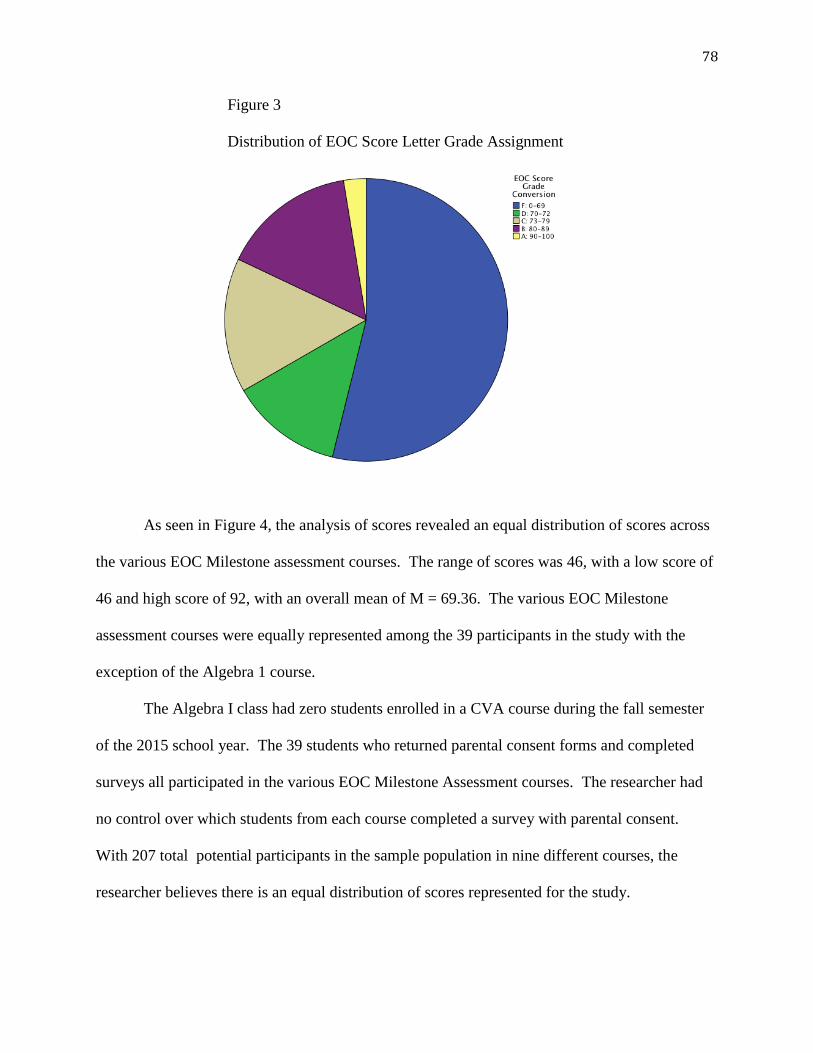
78
Figure 3
Distribution of EOC Score Letter Grade Assignment
As seen in Figure 4, the analysis of scores revealed an equal distribution of scores across
the various EOC Milestone assessment courses. The range of scores was 46, with a low score of
46 and high score of 92, with an overall mean of M = 69.36. The various EOC Milestone
assessment courses were equally represented among the 39 participants in the study with the
exception of the Algebra 1 course.
The Algebra I class had zero students enrolled in a CVA course during the fall semester
of the 2015 school year. The 39 students who returned parental consent forms and completed
surveys all participated in the various EOC Milestone Assessment courses. The researcher had
no control over which students from each course completed a survey with parental consent.
With 207 total potential participants in the sample population in nine different courses, the
researcher believes there is an equal distribution of scores represented for the study.
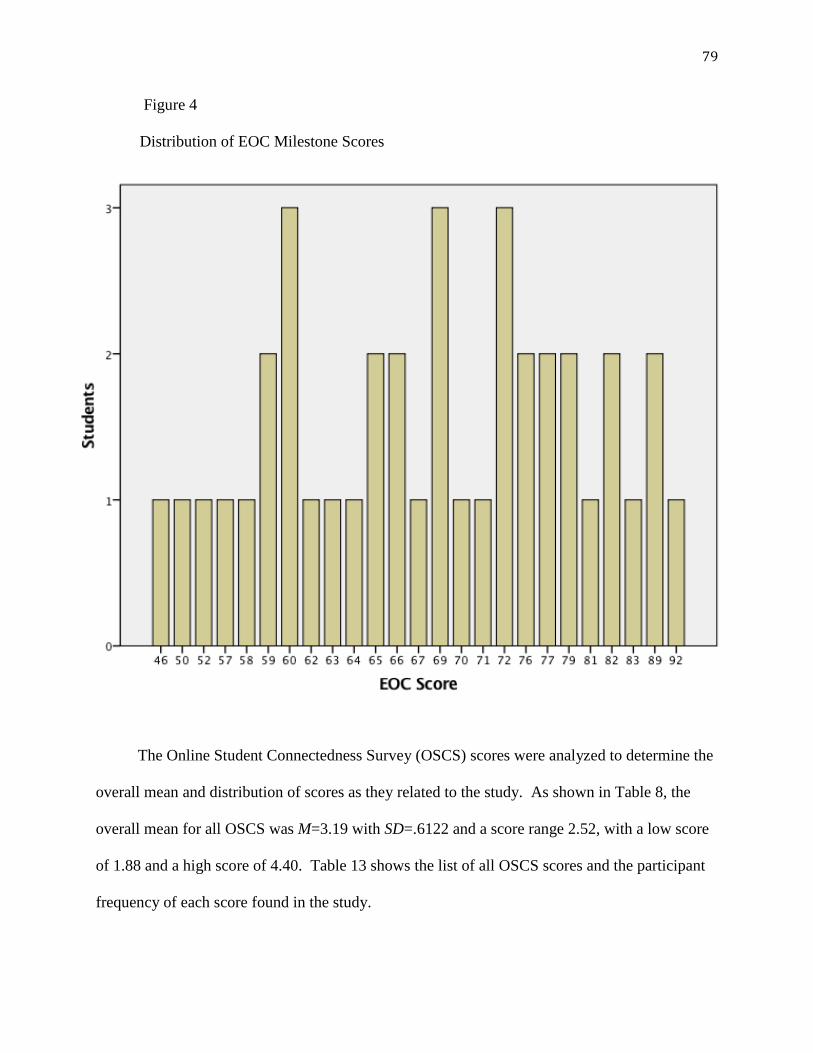
79
Figure 4
Distribution of EOC Milestone Scores
The Online Student Connectedness Survey (OSCS) scores were analyzed to determine the
overall mean and distribution of scores as they related to the study. As shown in Table 8, the
overall mean for all OSCS was M=3.19 with SD=.6122 and a score range 2.52, with a low score
of 1.88 and a high score of 4.40. Table 13 shows the list of all OSCS scores and the participant
frequency of each score found in the study.
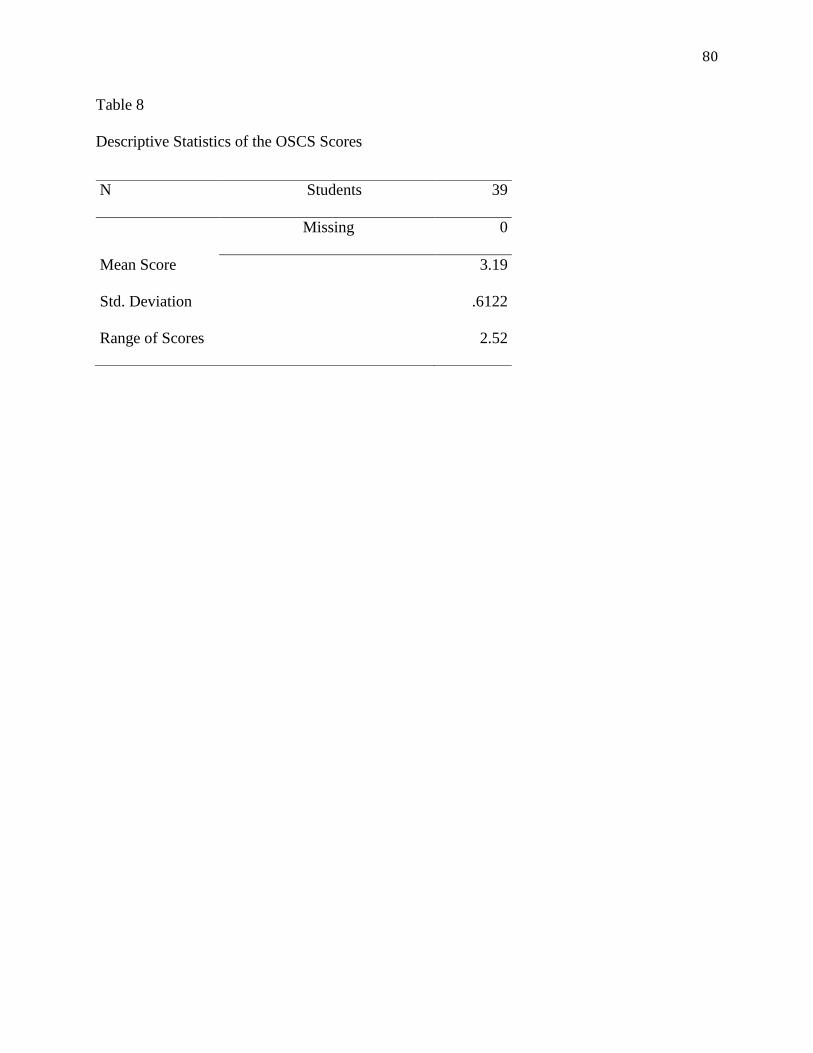
80
Table 8
Descriptive Statistics of the OSCS Scores
N Students 39
Missing 0
Mean Score 3.19
Std. Deviation .6122
Range of Scores 2.52

81
Table 9
Frequency Distribution of OSCS Scores
The data from Table 9 was analyzed along with the data from Table 7 using a bivariate
correlational analysis. Pearson’s r was calculated to evaluate the null hypothesis for this
research study: There is no statistically significant correlation between students’ online
connectedness scores, as measured by the Online Student Connectedness Survey (OSCS) and
OSCS
Score Frequency Percent
1.88 1 2.6
2.24 2 5.1
2.36 1 2.6
2.48 1 2.6
2.56 1 2.6
2.64 2 5.1
2.68 1 2.6
2.72 1 2.6
2.76 2 5.1
2.80 1 2.6
2.88 1 2.6
3.04 1 2.6
3.08 1 2.6
3.12 2 5.1
3.16 2 5.1
3.20 1 2.6
3.24 2 5.1
3.32 1 2.6
3.36 1 2.6
3.48 1 2.6
3.52 3 7.7
3.56 1 2.6
3.72 1 2.6
3.80 1 2.6
3.96 3 7.7
4.00 1 2.6
4.12 1 2.6
4.36 1 2.6
4.40 1 2.6
Total 39 100.0

82
their End of Course Milestone scores for high school students taking a 16-week, online course
via the Virtual Academy (CVA).
Results
Null Hypothesis
The null hypothesis in this research study was: There is no statistically significant
correlation between students’ online connectedness scores, as measured by the Online Student
Connectedness Survey (OSCS) and their End of Course Milestone scores for high school
students taking a 16-week, online course via the County Virtual Academy. The null hypothesis
was tested using a bivariate correlational analysis of Pearson’s product-moment correlation to
determine the correlation between the students’ EOC score and their OSCS overall score. Green
and Salkind (2011) state “the Pearson product-moment correlation (r) assess the degree that
quantitative variables are linearly related in a sample” (p. 257).
There are two assumptions the researcher makes in testing for a significant relationship
using the Pearson product-moment correlation, Pearson’s r. These assumptions include: “the
variables are bivariately normally distributed and the cases represent a random sample from the
population and the scores on variables for one case are independent of scores on these variables
for other cases” (Green & Saklind, 2011, p. 258). In SPSS software, the Pearson’s r is calculated
as an effect size. The range is from -1 to +1. The closer the calculation is to +1 or -1, the more
positively or negatively statistically significant the correlation is between the variables.
The researcher used SPSS 23.0 to compute Pearson’s r for the study. The significance
level for the test was set at a = .05. Green & Saklind (2011) report that for behavioral science
research, “correlation coefficients of .10, .30, and .50, irrespective of sign, are, by convention,
interpreted as small, medium, and large coefficients, respectively” (p. 259). If p ≤ .05, the
83
correlation between the students’ EOC scores and their OSCS overall score would be determined
as a statistically significant relationship between the two variable. If p ≥ .05, the correlation
between the two variables would be found to not be statistically significant.
Research Question
RQ: Is there a correlation between online students’ sense of connectedness in the course
and their End of Course (EOC) Milestone score for students taking an EOC course through the
County Virtual Academy (CVA)? The researcher conducted a bivariate correlational analysis to
determine if there was a statistically significant correlation between students’ EOC score and the
Online Student Connectedness Survey (OSCS) overall score. Pearson’s r was calculated and the
p value was set at p ≤ .05 to check for a statistical significant relationship between the two
variables.
The OSCS score is reported as an overall score and then broken down to the four
different categories found within the survey: Comfort, Community, Facilitation, and Interaction
and Collaboration. Each area is significant as the researcher understands the sense of connection
students have in their online course and then how that sense of connection relates to their End of
Course (EOC) score. The areas of comfort, sense of community, adequate facilitation, and
interaction with collaborative opportunities with peers were designated as subcategories within
the OSCS. Bollinger and Inan (2012) believed these four areas were the most important when
analyzing a student’s sense of connectedness in an online course. These areas are important to
consider as students become more connected in the online classroom setting. Bollinger and Inan
(2012) believe the Internet and online courses can be a medium to assist students with feelings of
social isolation and assist them in interacting on a more regular basis with their peers.
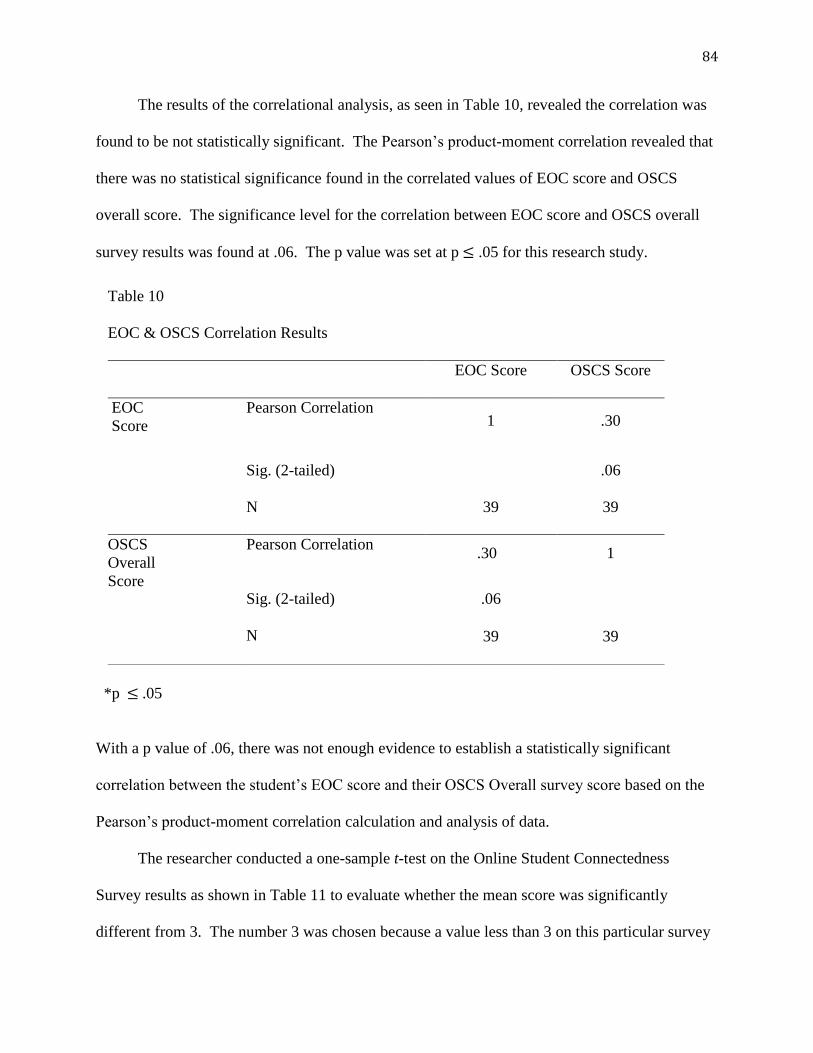
84
The results of the correlational analysis, as seen in Table 10, revealed the correlation was
found to be not statistically significant. The Pearson’s product-moment correlation revealed that
there was no statistical significance found in the correlated values of EOC score and OSCS
overall score. The significance level for the correlation between EOC score and OSCS overall
survey results was found at .06. The p value was set at p ≤ .05 for this research study.
*p ≤ .05
With a p value of .06, there was not enough evidence to establish a statistically significant
correlation between the student’s EOC score and their OSCS Overall survey score based on the
Pearson’s product-moment correlation calculation and analysis of data.
The researcher conducted a one-sample t-test on the Online Student Connectedness
Survey results as shown in Table 11 to evaluate whether the mean score was significantly
different from 3. The number 3 was chosen because a value less than 3 on this particular survey
Table 10
EOC & OSCS Correlation Results
EOC Score OSCS Score
EOC
Score
Pearson Correlation 1 .30
Sig. (2-tailed) .06
N 39 39
OSCS
Overall
Score
Pearson Correlation .30 1
Sig. (2-tailed) .06
N 39 39
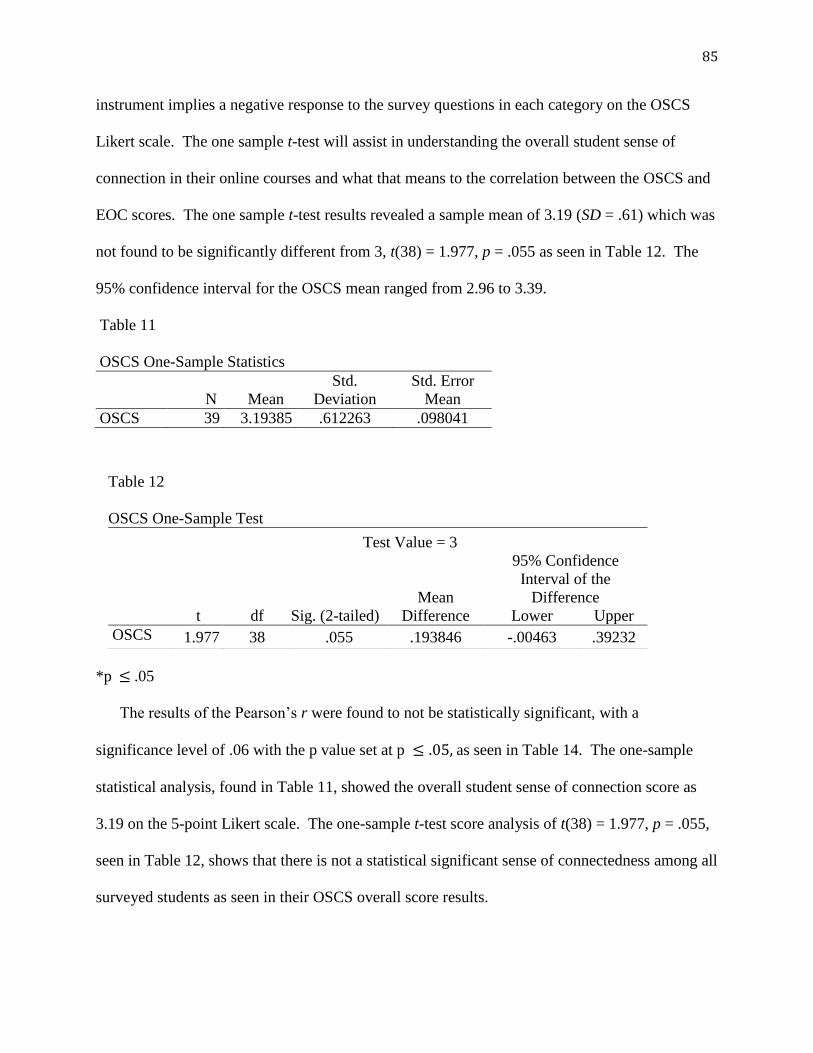
85
instrument implies a negative response to the survey questions in each category on the OSCS
Likert scale. The one sample t-test will assist in understanding the overall student sense of
connection in their online courses and what that means to the correlation between the OSCS and
EOC scores. The one sample t-test results revealed a sample mean of 3.19 (SD = .61) which was
not found to be significantly different from 3, t(38) = 1.977, p = .055 as seen in Table 12. The
95% confidence interval for the OSCS mean ranged from 2.96 to 3.39.
Table 11
OSCS One-Sample Statistics
N Mean
Std.
Deviation
Std. Error
Mean
OSCS 39 3.19385 .612263 .098041
*p ≤ .05
The results of the Pearson’s r were found to not be statistically significant, with a
significance level of .06 with the p value set at p ≤ .05, as seen in Table 14. The one-sample
statistical analysis, found in Table 11, showed the overall student sense of connection score as
3.19 on the 5-point Likert scale. The one-sample t-test score analysis of t(38) = 1.977, p = .055,
seen in Table 12, shows that there is not a statistical significant sense of connectedness among all
surveyed students as seen in their OSCS overall score results.
Table 12
OSCS One-Sample Test
Test Value = 3
t df Sig. (2-tailed)
Mean
Difference
95% Confidence
Interval of the
Difference
Lower Upper
OSCS 1.977 38 .055 .193846 -.00463 .39232

86
The researcher also conducted a linear regression analysis to visually display the data and
show the predictive value of the online student’s EOC Milestone assessment score and their
Online Connectedness Survey score. Green and Salkind (2012) report that a Bivariate Linear
Regression should be used to evaluate the independent (x) variable and its relationship to the
dependent (y) variable to display the relationship between two variables. In this study, the the
Online Student Connectedness Survey score was the independent (x) variable, and the online
student’s EOC Milestone assessment score was the dependent (y) variable.
The EOC scores and OSCS survey data were calculated in SPSS and a scatterplot of the
data was created as shown in Figure 5. A scatterplot is “a pictorial representation of the
correlation between two variables: The scores of individuals on one variable are plotted on the x-
axis of a graph and the scores of the same individuals on another variable are plotted on the y-
axis” (Gall, Gall, Borg, 2007, p. 332). The bivariate scatterplot shown in Table 16 reveals how
accurately the regression equation predicted the dependent variable scores.
Figure 5
Bivariate Linear Regression Scatterplot
87
The bivariate scatterplot in Figure 5 shows the homoscedasticity of variance to be unequal
around the line of fit, or the regression line, y = 0. The assumption of homoscedasticity expects
the variance around the regression line for all values of the predictor variable to be the same
(davidmlane.com, 2016). The violation of the assumption of homoscedasticity in the data
indicates a lack of statistical significance in the correlation between OSCS and EOC scores. The
fit line on bivariate scatterplot visually displays that the two variables indicate some correlational
predictability, but too many of the points are far off the fit line. A significant correlation cannot
be proven through the assumption of homoscedasticity.
The scatterplot, as seen in Figure 5 does, however, indicate the two variables have a
positive linear relationship. The analysis of survey results reveals that a student’s EOC
assessment score (dependent variable) does have a positive directional correlation with the
student’s OSCS (independent variable). The data analysis reveals a relationship between the two
variables, but the data does not show a statistically significant correlation between the EOC and
OSCS scores.
The data analysis did not allow the researcher to reject the null hypothesis. The data
anlyssis did not reveal a statistically significant correlation between students’ OSCS score and
their EOC Milestone score. Based on the lack of a statistically significant correlation between
the EOC Milestone assessment score and the OSCS score when calculating for Pearson’s r, the
data from the one-sample t-test, and the use of a bivariate scatterplot analysis, the researcher was
not able to reject the null hypothesis; there is no statistically significant correlation between
students’ online connectedness scores, as measured by the OSCS, and their EOC Milestone
assessment scores for high school students taking a 16-week, online course via the CVA.

88
Summary
Upon analyzing the data, the researcher was unable to reject the null hypothesis of
Research Question 1: There is no statistically significant correlation between students’ online
connectedness scores, as measured by the OSCS and EOC Milestone scores for high school
students taking a 16-week, online course via the County Virtual Academy (CVA). The
Pearson’s product-moment correlation (Pearson’s r) revealed no statistical significance found in
the correlated values of EOC score and OSCS overall. The level for the correlation between
EOC score and OSCS overall survey results was found at .06. The alpha level was set at p ≤ .05.
Based on Pearson’s r analysis, there is not enough evidence to show a statistically significant
correlation between the students’ EOC score and their OSCS Overall survey score.
A positive linear relationship was seen in the bivariate linear scatterplot between EOC
scores and the student’s OSCS score, with the regression equation predicting the dependent
variable scores. The bivariate scatterplot did, however, reveal a lack of homoscedasticity
between the two variables. The assumption of homoscedasticity expects the variance around the
regression line for all values of the predictor variable to be the same (davidmlane.com, 2016).
The fit line on the bivariate scatterplot reveals that there is an unequal variance between EOC
and OSCS scores, thus not allowing the researcher to reject the null hypothesis for the Research
Question.
89
CHAPTER FIVE: DISCUSSION, CONCLUSIONS, AND RECOMMENDATIONS
Discussion
The purpose of this quantitative, bivariate correlational study was to understand the
relationship between online high school students’ sense of connectedness in the course, as
measured by the OSCS and the students’ standardized EOC Milestone scores. The data analysis
for this study did not support the hypothesis for Research Question 1: There is a statistically
significant correlation between students’ OSCS and their EOC Milestone assessment score for
high school students taking a 16-week, online course via the CVA.
In this chapter, the statement of the problem, summary of the data analysis, discussion of
the overall findings, and future implications for educators are discussed. Limitations of this
research study are discussed in this chapter as well as recommendations for potential future
research on the subject of online learning. This chapter helps explain the gap in the research and
why more research needs to be conducted on the students’ experiences in the online learning
environment. It is important, as online educational opportunities are improved for students in the
K-12 setting, to try and understand the relationship between the students’ sense of connectedness
in the online setting and their success on standardized achievement scores for the online course.
Statement of the Problem
As the Internet makes online opportunities for students more accessible, educators must
find out how to use this medium to engage students in collaborative, authentic learning
experiences with each other. School leaders must realize that virtual options are allowing
learning to take place outside of the traditional school hours and that today’s student requires a
different type of instructional approach because they are wired differently from past generations
of students. (Sheninger, 2014). Today’s student is the first in history to not need the teacher to
90
be the provider of facts and figures (Elmore, 2010). Meeting the online needs of students means
understanding how to reach and improve our online practices and course offerings. Lichtman
(2014) believes that teachers cannot continue to teach as they have in past years and must
incorporate new and innovative approaches to student engagement as they help students pursue
their educational goals and passions.
In the past, research shows that distance education options have revealed higher dropout
and failure rates when compared to traditional course options (Hawkins et al., 2013; Roblyer &
Marshall, 2003). Meeting the needs of students in this new medium of educational opportunity
is paramount to helping students navigate and have success in the various forms of online
learning. Lichtman (2014) believes that getting rid of the assembly line, traditional model of
educating students and moving into a more collaborative, interactive model will help schools
prepare students for the future workplace.
The increase in online opportunities for K-12 students is raising the bar in the quality of
courses in which students participate (Roblyer, Davis, Mills, Marshall & Pape, 2008). The
ability students have to connect with each other to improve their own development and
achievement levels has never been greater. Roblyer et al. (2008) says that due to the fact that
distance education traditionally faces much higher dropout rates than the traditional model,
educators must understand what keeps students engaged in the online medium. Flipped
classrooms, virtual schools, and online course options are just some of the innovative ways in
which today’s student can take a course without physically collaborating with their teacher and
peers in the brick and mortar traditional school building (Harvey et al., 2014).
Local school districts must try and understand what type of online course design works
best for K-12 students and how to help them collaborate and connect with peers in the isolation
91
of the online experience. A research study conducted by Borup et al. (2013) explains that future
research into online options and its effect on student achievement should be conducted as
educators try to understand its impact in different courses and grade levels for K-12 students.
The researcher hopes the findings of this study may assist educators in understanding if a
students’ sense of connectedness in the online course has any relationship to their EOC
Milestone assessment score as well as their perception of connectedness in the CVA EOC
courses.
The Research Question asked, Is there a correlation between online students’ sense of
connectedness in the course and their End of Course (EOC) Milestone score? The hypothesis for
the study was: There is a statistically significant correlation between students’ online
connectedness scores, as measured by the Online Student Connectedness Survey (OSCS) and
their End of Course Milestone scores for high school students taking a 16-week, online course
via the County Virtual Academy (CVA). The null hypothesis was there is no statistically
significant correlation between students’ online connectedness scores, as measured by the Online
Student Connectedness Survey (OSCS) and their End of Course Milestone scores for high school
students taking a 16-week, online course via the County Virtual Academy (CVA).
Conclusion
Research Question
The Reseach Question asked, is there a statistically significant correlation between an
online students’ sense of connectedness in the course and their EOC Milestone assessment
score? The results of the Pearson product-moment correlation (Pearson’s r) did not establish a
statistically significant correlation between the two variables, as seen in Table 13.

92
*p ≤ .05
The Pearson’s r analysis of the correlation between the Online Students Connectedness
OSCS score and their EOC assessment results revealed a p value of .06 with p ≤ .05 set as the
significance level. A bivariate scatterplot was also created to evaluate the linear relationship
between OSCS score and EOC score. The fit line on the bivariate scatterplot, as seen in Figure
5, indicates some correlational predictability, but a violation of the assumption of
homoscedasticity in the data indicates a lack of statistical significance in the correlation between
OSCS and EOC scores. The bivariate scatterplot reveals that too many data points are off the
line of fit, thus violating the assumption of homoscedasticity. A violation of this assumption
allows the researcher to establish that a significant relationship could not be shown between the
OSCS and EOC score variables by the bivariate scatterplot and its data analysis.
Table 13
EOC and OSCS Correlation Results
EOC Score OSCS Score
EOC
Score
Pearson Correlation 1 .30
Sig. (2-tailed) .06
N 39 39
OSCS
Overall
Score
Pearson Correlation .30 1
Sig. (2-tailed) .06
N 39 39

93
The Pearson’s r data analysis and the bivariate scatterplot indicate a positive relationship,
but neither can confirm a significant correlation between the two variables. Based on this data
analysis, the null hypothesis could not be rejected. The data analysis did not reveal a statistically
significant correlation between the students’ sense of connectedness as measured by the OSCS
and their EOC Milestone assessment score. However, the researcher believes that future
research studies are needed in order to better understand the possible relationship between the
two variables as online learning is implemented in the K-12 setting. A definite area for future
study is the qualitative research of students’ thoughts and perceptions of the online course
experience. Future qualitative studies should take place to understand student perceptions of the
process and what they believe will improve their online experience.
Based on the research study hypothesis for Research Question 1, the researcher expected
to find a statistically significant correlation between the OSCS score and the EOC score.
Hawkins et al. (2013) found that a student’s sense of community and the quality and frequency
of interactions with their instructor and peers in an online course has been shown to be a major
factor in the actual success the student has in the online course. Their study examined the
interactions and perceptions of students in the online course setting and how that affected their
academic performance in the course (Hawkins et al., 2013). The students in the study perceived
positive interactions with their teacher for those who completed the course versus a negative
perception of their teacher interactions for those who did not complete the course.
Beldarrain’s (2008) online interaction study revealed that learner-learner interaction tends
to be associated with higher achievement than the analysis of learner-teacher interaction.
Zucker’s (2005) research revealed the learner–learner interaction is an important piece of online
student learning, but less than half of the study participants thought the interaction with their

94
peers assisted them in mastering the standards for the course. Borup et al. (2013) believe that
student collaboration by itself may not be responsible for the improvement in student success and
engagement in the course. They feel the instructor should continue to create and include more
collaborative opportunities for students to interact more often and help increase learning
opportunities (Borup et al., 2013).
Based on the data analysis for Research Question 1, a statistically significant relationship
was not found between the students’ sense of connectedness to their peers and instructor in the
online virtual classroom and the student’s mastery of course content as measured by the course
End of Course Milestone assessment. A statistically significant relationship was not found to
exist in the analysis of data for the Research Question, but the researcher believes research
studies and literature support the research hypothesis for this study and the continued research
into the area of connection in the online setting for students.
The overall OSCS overall mean score was M=3.19 on a Likert scale ranging from 1;
strongly disagree, to 5; strongly agree, as seen in Table 14.
Table 14
OSCS Overall Mean
N Students 39
Missing 0
Mean Score 3.19
Std. Deviation .6122
Range of Scores 2.52
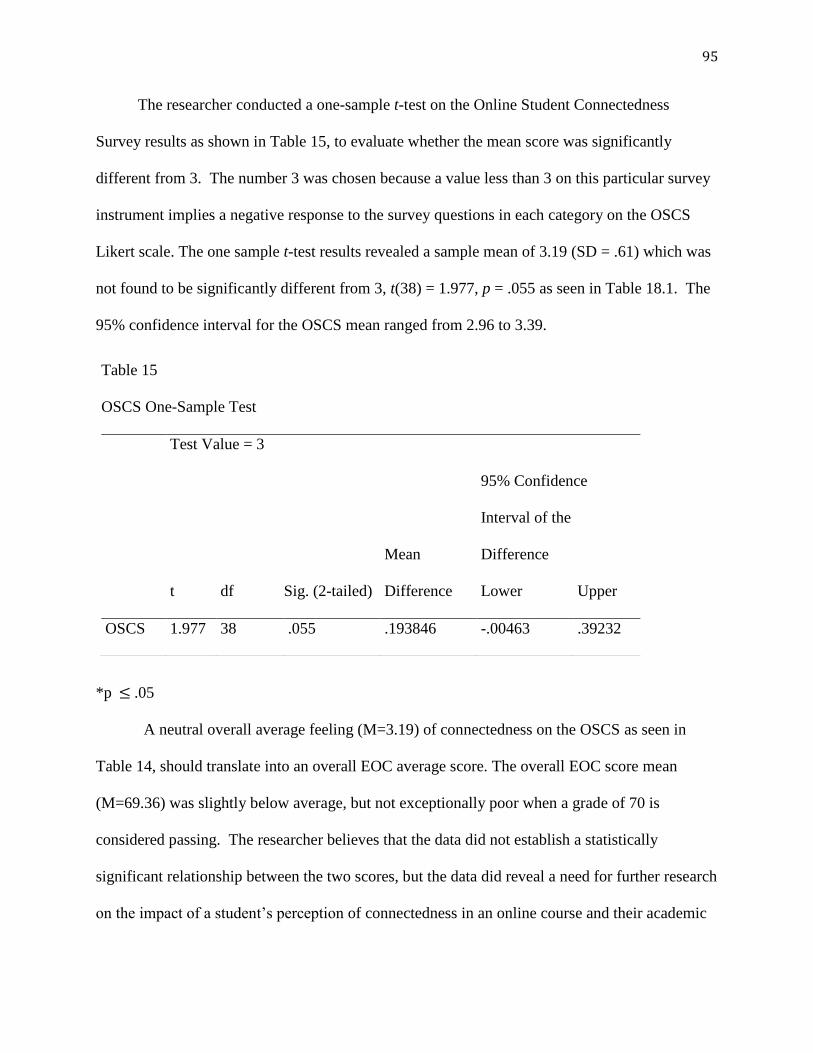
95
The researcher conducted a one-sample t-test on the Online Student Connectedness
Survey results as shown in Table 15, to evaluate whether the mean score was significantly
different from 3. The number 3 was chosen because a value less than 3 on this particular survey
instrument implies a negative response to the survey questions in each category on the OSCS
Likert scale. The one sample t-test results revealed a sample mean of 3.19 (SD = .61) which was
not found to be significantly different from 3, t(38) = 1.977, p = .055 as seen in Table 18.1. The
95% confidence interval for the OSCS mean ranged from 2.96 to 3.39.
*p ≤ .05
A neutral overall average feeling (M=3.19) of connectedness on the OSCS as seen in
Table 14, should translate into an overall EOC average score. The overall EOC score mean
(M=69.36) was slightly below average, but not exceptionally poor when a grade of 70 is
considered passing. The researcher believes that the data did not establish a statistically
significant relationship between the two scores, but the data did reveal a need for further research
on the impact of a student’s perception of connectedness in an online course and their academic
Table 15
OSCS One-Sample Test
Test Value = 3
t df Sig. (2-tailed)
Mean
Difference
95% Confidence
Interval of the
Difference
Lower Upper
OSCS 1.977 38 .055 .193846 -.00463 .39232

96
achievement in that medium.
The lack of a large sample size from the study’s population was a limitation for this
study. The researcher believed the small sample and sub-sample size for each course are both
contributing factors in discovering a statistically significant correlation between the OSCS and
EOC score. The small sample size led to a power analysis with a large margin of error of 15%
that will limit the generalization of the study for future use. The comparison of OSCS and EOC
scores did reveal some support for the original hypothesis for Research Question 1, but the data
analysis does not allow the researcher to reject the null hypothesis.
Implications
The research hypothesis stated that there would be a statistically significant correlation
between the students’ sense of connectedness and their EOC Milestone assessment score. Data
analysis from the study provided insufficient evidence to reject the null hypothesis for the study.
The implementation of K-12 online learning has increased exponentially in recent years but very
little research is available in the area of secondary education (Kirby et al., 2012). Borup et al.
(2013) feel that as online options become increasingly more available for K-12 students, it is
imperative to understand what today’s student needs to be successful in the online classroom
setting.
Kim et al. (2012) mention:
A substantial number of research studies have focused on issues related to online school
administration, management, or teacher competency development, but little has been
done in investigating the early stage (i.e., which is perhaps the most critical period of
student learning online and especially what they might think about online interaction or
discussion experiences). (p. 523)

97
The OSCS instrument was initially developed for college students and adapted for this
study to be used with high school students. As online learning for K-12 students becomes more
popular and available, educators need to understand the students’ perception of the experience
and what can be implemented to help them be successful in this online environment. The lack of
a true evaluative instrument dedicated to the high school population could account for the lack of
a statistically significant correlation between the EOC and OSCS scores and is something that
should be further investigated and researched. As the school district moves forward with
improving their online course offerings, more information needs to be gathered from the students
on what they believe needs to be done to improve their perception of these subcategories of the
OSCS.
Limitations
As with any research, there weree several limitations related to the study. The limitations
found within this study included the total number of participants in the study. With a small
sample size (N=39) the researcher was forced to use a 15% margin of error in the power analysis
of the study. The 15% margin of error allowed the researcher to keep the confidence level at
95% while maintaining the minimum number of participants at 15%, which was 36. This large
margin of error was a contributing factor in ability to generalize the study for future use.
The total number of participants was directly related to the fact that the study dealt with
minors who must have parental permission to participate in the research study. The ability to
acquire parental consent, especially for students who are participating in online courses was
extremely challenging. The acquisition of the survey data was two-fold. Parental consent had to
be obtained, and then the survey also had to be completed and returned. When working with
minors, data collection and reporting practices are magnified (Gall et al., 2007).
98
After the initial consent email was delivered to parents with almost no response back, a
second option had to be utilized to try and obtain consent prior to the data collection. A study
focusing on the online environment should try and use online tools to communicate and
participate in the data collection. After several attempts to collect the consent and data virtually,
the decision was made to use a traditional pencil and paper approach. This option was much
more successful and provided enough participants to complete the research study. The
anonymous nature of the survey data was also a limitation. The students could not be sent any
follow-up questions after the fact to help the researcher better understand the survey data.
Anonymity also limited the ability to improve the return rate after receiving the initial responses.
Participation bias was also a limitation for the study. Gall et al. (2007) define a bias as “a
set to perceive events in such a way that certain types of facts are habitually overlooked,
distorted, or falsified” (p. 543). With the email consent form, all parents had the ability to
participate in the study, but the researcher could not account for who actually returned a survey.
Only one parent responded to the email sent out by the CVA, and that parent did not complete a
consent form; they only asked questions about the study.
Consent forms were then sent out to each of the high schools in the district. Local school
administrators were asked to deliver consent forms to the students who took EOC courses
through the CVA during the fall semester of 2015. Once the forms were sent to the local
schools, there was no way to account for who received one, who took it home, and who returned
a completed copy. This method of collecting survey data could not ensure a balanced return
among all schools based on their percentage of students who took an EOC online course in the
fall of 2015 and may have led to participation bias for the analyzed data.

99
One further limitation for this study was that no students took Algebra I during the fall
semester of 2015 with the CVA. The Algebra I course is a major course in any school district
across the county, but not one CVA student was registered for this EOC Milestone assessment
course during the fall of 2015. This lack of student participation in this online course cannot be
accounted for, but its exclusion is a limitation to the study as Algebra I is a major academic
course required for graduation in the state of Georgia.
The researcher had a sample population for this study that consisted of a small population
of online students taking particular courses during one semester of the school year from one
school district. The number of participants can limit the researcher’s ability to generalize the
findings of the study for future research and comparison to other similar populations (Gall et al.,
2007). The researcher believes that despite the addressed limitations, this research study
revealed significant findings in the area of student connectedness in the online environment for
high school students. The limitations for this study have been addressed, and the data from the
study reveal a need for much more research in the area of student interaction, collaboration, and
overall connectedness in online courses at the high school level.
Recommendations for Future Research
This study’s intent was to determine if a correlation existed between a high school
students’ sense of connectedness with their peers and instructor in their online class and their
EOC Milestone assessment score. The study used the OSCS to assess the students’ sense of
connectedness in their EOC course. The overall survey and EOC scores were used to determine
if a correlation existed between the two scores. Each area of the OSCS was also evaluated to
realize the students’ perceptions of their online experience in each course. The findings found
within the study clearly show a need for further studies to be conducted to help educators

100
understand the relationship between students’ sense of connection with their online instructor
and their peers as it relates to their overall success in the online course.
Various options for high school students and the Internet’s capability to connect with
others at any time of the day are changing the world of K-12 education (Scarborough &
Ravaglia, 2014). Online opportunities for high school students are shifting the instructional
focus to the application of knowledge and skills that help students have a deeper understanding
of material due to the lack of a traditional brick and mortar school setting (Elmore, 2010; Horn
and Staker, 2015; and Sheninger, 2014). There is a new movement of believers in the online
educational environment and, at its core, the local school should be the facilitator of information
as students understand how to apply that information and to collaborate with their peers using the
technology available to them (Scarborough & Ravaglia, 2014).
The online setting at the college level has been researched and the students’ sense of
connectedness has been shown to be a key piece to their overall success (Dixson, 2010;
LaBarbera, 2013, & Milman, 2013). As students are given more options with online courses,
educators must understand what students need if they are to be successful in the online
environment (Lee & Figueroa, 2012). The support, course design, and project-based learning
opportunities are critical pieces to helping students achieve success in an online course (Horn &
Staker, 2015). It is imperative for educators to understand student needs in the online course
setting as more options become available for students at the high school level. LaBarbera (2013)
feels that assessing student needs and desires for their online experience will assist school
districts in moving forward with finding innovative ways for students to access online courses
that have never before been available.
101
The educational development theories of Lev Vygotsky are just as relevant, and maybe
more important today than they were in the 1930’s. “Both the growing racial and cultural
diversity of children within the United States and the globalization of contemporary life make it
imperative that we understand cultural contributions to development” (Miller, 2011, p. 170). As
technology increases the ability for students’ to connect (Christensen et al., 2011; Elmore, 2010;
& Sheninger, 2014), understanding Vygotsky’s ZPD theory and the impact it may have on
student achievement in the online setting is critical.
Future studies related to this research should evaluate the student perceptions of their
online experience and what students believe can be included in the experience to help them
better collaborate with their peers and interact with their instructor. The primary findings of this
study established through Pearson’s r (p = .06, with p ≤ .05), there was not enough evidence to
show a statistically significant relationship between students’ sense of connectedness and their
EOC Milestone assessment score. Recommendations for future research would include more
studies which observe the students’ sense of connection with their peers and instructor with a
much larger population of students to help generalize the findings and lower the margin of error
for the study.
Additionally, the researcher believes that qualitative studies focused on the student
experience would be beneficial in future research studies (Haley, 2013; Luehr, 2011; Rankin,
2013). This information could help educators understand the thought process of the student as
they work through the course, and what it is that they want from their online experience. This
type of qualitative study could be information rich and assist the researcher to better understand
exactly what the student feels and what they need to help them navigate through an online
course.
102
The data analysis revealed that the students’ overall sense of collaboration and interaction
with peers was much lower than expected in the online environment. Understanding what can be
done to improve student perception of these two areas is definitely an area of focus for future
research. Future studies could also address the time students spend logged on and actively
participating in their online course. Time was not accounted for in this study and could be a
large factor in the success of a student in the online setting. The more educators can understand
about student needs in the online setting, the better they can prepare an online experience where
students can be successful.
Today’s student is not restricted to physical collaboration with classmates or school
friends as they learn (Daniels, 2008). Collaboration with peers from across the state, nation, and
even the globe, can help learners grow in the online setting. Connection is a key piece of
Vygotsky’s (1978) ZPD theory and its impact on a student’s growth potential. The use of online
learning in the K-12 setting opens up a new world of connection where no bells end to the school
day. “We can’t create more minutes in a day or days in a year, but we can absolutely twist time
to better meet our learning goals” (Lichtman, 2014, p. 21).
A successful implementation of online learning opportunities for students is important as
more K-12 students take courses in the virtual setting (Barbour et al., 2012). Today’s students
have the ability to virtually connect with each other, apply information to real world scenarios
and learn to creatively collaborate with their peers. These online opportunities open a whole new
world of educational possibilities for all students.
Students now have almost unlimited access to their peers and instructor in the online
setting. Understanding how to help students connect and the level of comfort they feel as they
learn from their more capable peers is imperative to the success of the online experience
103
(Chandler et al., 2012). It should be a priority for all educators to understand the best possible
way to implement online options to help students apply information in authentic, real-world
settings in collaboration with their peers as they grow as learners and learn to connect in today’s
digital society.
104
References
Barbour, M., Siko, J., Sumara, J., & Simuel-Everage, K. (2012). Narratives from the online-
frontier: A K-12 student’s experience in an online learning environment. The Qualitative
Report, 17(20), 1-19. Retrieved from: http://www.nova.edu/ssss/QR/QR17/barbour.pdf
Bedard, S., & Knox-Pipes, B. (2006). Online distance learning: The K-12 student’s perspective.
Distance Learning, 3(4), 13-19.
Bergman, J. & Sams, A. (2012). Flip your classroom: Reach every student in every class every
day. Alexandria, VA: ASCD.
Beldarrain, Y. (2008). Engaging the 21st century learner: An exploratory study of the
relationship between interaction and achievement in the virtual high school. Retrieved
from ProQuest Dissertation and Theses Database. (UMI No. 3311390)
Bolliger, D. & Inan, F. (2012). Development and validation of the Online Student Connectedness
Survey (OSCS). International Review of Research in Open and Distance Learning, 13(3),
41-65. Retrieved from: http://www.irrodl.org/index.php/irrodl/article/view/1171/2206
Birjandi, P., Sarem, S. (2012). Dynamic Assessment (DA): An evolution of the current trends in
language testing and assessment. Theory and Practice in Language Studies, 2(4), 747-
753. Doi: 10.4304/tpls.2.4.747-753
Borup, J., Graham, C. R., & Davies, R. S. (2012). The nature of adolescent learner interaction in
a virtual high school setting. Journal of Computer Assisted Learning, 29(2), 153–167.
doi:10.1111/j.1365-2729.2012.00479.x
Cavanagh, S. (2006). To tailor schedules, students log in to online classes. EducationWeek,
26(9), 1-24.

105
Chandler, C., Tolbert, D., & Amber, V. (2012). Online learning is not flat: An analysis of online
learning that promotes interactivity. Distance Learning, 9(4), 55-64. Retrieved from:
http://www.infoagepub.com/dl-issue.html?i=p54c10d7edd314
Christensen, C., Horn, M., & Johnson, C. (2011). Disrupting class: How disruptive innovation
will change the way the world learns. New York, NY: McGraw-Hill.
Cobb County School District (CCSD). (2014a). About the Cobb County School District.
Retrieved from: http://www.cobbk12.org/aboutccsd.
Cobb County School District (CCSD). (2014b). Cobb Virtual Academy. Retrieved from:
http://www.cobbk 12.org/schools/cobbvirtualacademy/about/about.html
Daniels, B. (2008). Motivation, Academic Success, and Learning Environments: Comparing high
school face-to-face and online courses. Retrieved from ProQuest Dissertation and Theses
Database. (UMI 3340542)
Davidmlane.com (2016). Hyperstat Online Content: Homoscedasticity. Retrieved from
http://www.davidmlane.com
Dillon, E. & Tucker, B. (2011). Lessons for online learning. Education Next, 11(2), 1-9.
Retrieved from: http://www.liberty.edu:2048/login?url=http:search.proquest .com/
docview/1237824016?accountid=12085
Dixson, M. (2010). Creating effective student engagement in online courses: What do students
find engaging?. Journal of the Scholarship of Teaching and Learning, 10(2), 1-13
Domeleski, C. (2011). State end-of-course testing programs: A policy brief. Council of Chief
State School Officers, 1-27, Washington, DC: CCSSO.
Elmore, T. (2010). Generation iY: Our last chance to save their future. Atlanta, Ga: Poet
Gardener Publishing.

106
Freeman, M. (2010). Vygotsky and the virtual classroom: Sociocultural Theory comes to the
communications classroom. Christian Perspectives in Education, 4(1), 1-16. Retrieved
from: http://digitalcommons.liberty.edu/cpe/vol4/iss1/5
Friedman, H. H. & Friedman, L. W. (2011). Crisis in education: Online learning as a solution.
Creative Education, 2(3), 156-163. Doi: 10.4236/ce.2011.23022
Fullen, M., Hill, P., & Crevola, C. (2006). Breakthrough. Thousand Oaks, CA: Corwin Press.
Gall, M., Gall, J., & Borg, W. (2007). Educational Research: An Introduction (8th ed.). Boston,
MA: Pearson.
Georgia Department of Education (GADOE). (2014). Georgia Milestones Assessment System.
Retrieved from: http://www.gadoe.org
Georgia Department of Education (GADOE). (2016). An assessment and accountability brief:
Validity and Reliability of the 2014-2015 Georgia Milestones Assessment System, 1-13.
Retrieved from: http://www.gadoe.org
Glader, P. (2009). Online high schools test students' social skills: As digital learning programs
grow, educators hope to prevent teens from feeling isolated; student government via the
web. Retrieved from http://online.wsj.com/article/ SB125374569191035579.html
Gredler, M., E. (2011). Understanding Vygotsky for the classroom: Is it too late? Educational
Psychology Review, 24, 113-131. Doi: 10.1007/s10648-011-9183-6
Green, S. & Salkind, N. (2011). Using SPSS for Windows and Macintosh: Analyzing and
understanding data (6th ed.). Upper Saddle River, NJ: Prentice Hall.
Greene, S. & Ackerman, J. (1995). Expanding the constructivist metaphor: A rhetorical
perspective on literacy research and practice. Review of Educational Research, 65(4),
383-420. doi:10.3102/00346543065004383

107
Grubb, M. (2011). Predictors of high school student success in online courses. Retrieved from
ProQuest Dissertation and Theses Database. (UMI No. 3462834)
Haley, R. (2013). Evaluating the Effectiveness of Online Learning at the High School Level.
Retrieved from ProQuest Dissertation and Theses Database. (UMI No. 3591828)
Harvey, D., Greer, D., Basham, J., & Hu, B. (2014). From the student perspective: Experiences
of middle and high school students in online learning. American Journal of Distance
Education, 28(1), 14-26. Doi: 10.1080/08923647.2014.8687 39
Hawkins, A., Graham, C., Sudweeks, R. & Barbour, M. (2013). Academic performance, course
completion rates, and student perceptions of the quality and frequency of interaction in a
virtual high school. Distance Education, 34(1), 64-83). Doi: 10.1080/01 587919.2013.
770430
Horn, M. & Staker, H. (2015). Blended: Using disruptive innovation to improve schools. San
Francisco, CA: Jossey-Bass.
Howell, D. (2011). Fundamental Statistics for the Behavioral Sciences (7th ed.). Belmont, CA:
Wadsworth.
Kaio, C. J. (2011). A study of academic achievement rates of students with disabilities educated
in traditional schools versus virtual schools. Retrieved from: ProQuest Dissertations and
Theses database. (UMI No. 3536909)
Kerr, S. (2011). Tips tools and techniques for teaching in the online high school classroom. Tech
Trends, 55(1), 28-30. Doi: 10.1007/s11528-011-0466-z
Kim, P., Kim, F., & Karimi, A. (2012). Public online charter school students: Choices,
perceptions, and traits. American Educational Research Journal, 49(3), 521-554. Doi:
10.3102/0002831212443078
108
Kirby, D., Barbour, M., & Sharpe, D. (2012). Student perceptions and preferences for tertiary
online courses: Does prior high school distance learning make a difference? American
Journal of Distance Education, 26(1), 34-49. Doi: 10.1080/08923647.2012.646089
Koenig, R. (2010). Learning for keeps: Teaching the strategies essential for creating
independent learners. Alexandria, VA: ASCD.
Kurvitis, J. & Kurvitis, M. (2013). High school student’s acquisition of knowledge and skills
through web-based collaboration. International Journal for Technology in Mathematics
Education, 20(3), 97-102.
LaBarbera, R. (2013). The relationship between students’ perceived sense of connectedness to
the instructor and satisfaction in online courses. The Quarterly Review of Distance
Education, 14(4), 209-220.
Lamport, M. & Metz, K. (2009). The emergent use of online in secondary education: A
preliminary review of the literature. Christian Perspectives in Education, 3(1), 1-21.
Retrieved from http://digitalcommons.liberty.edu/cpe/vol3/iss1/3
Langenhorst, D. G. (2011). Effectiveness of online instruction: Differences in measured student
outcomes online versus face-to-face instruction at the high school level. Retrieved
from ProQuest Dissertations and Theses database. (UMI No. 3494482)
Lee, M. & Figueroa, R. (2012). Internal and external indicators of online learning success: A
guide to success in K-12 virtual learning. Distance Learning, 9(1), 21-28.
Levykh, M. (2008). The affective establishment and maintenance of Vygotsky’s zone of
proximal development. Educational Theory, 58(1), 83-101. Doi: 10.1111/j.1741-
5446.2007.00277.x

109
Lewis, S., Whiteside, A., Dikkers, G. (2014). Autonomy and responsibility: Online learning as a
solution to at risk high school students. Journal of Distance Education, 29(2), 1-11.
Retrieved from http://ijede.ca/index.php/jde/article/view/883/1543_1
Liang, R., Thanq, D., & Chen, V. (2012). Online learning: Trends, potential, and challenges.
Creative Education, 3(8), 1332-1335. Doi:10.4236/ce.2012.38195
Lichtman, G. (2014). #Edjourney: A road map to the future of education. San Francisco, CA:
Jossey-Bass.
Lim, J., Kim, M., Chen, S., & Ryder, C. (2008). An empirical investigation of student
achievement and satisfaction in different learning environments. Journal of Instructional
Psychology, 35(2), 113-119. Doi:10.1142/9781848160149_0020
Linkenhoker, A. H. (2009). The effect of online learning on academic achievement in A.P.
calculus courses: A casual-comparative study. Retrieved from ProQuest Dissertation and
Theses Database. (UMI 3370940)
Lowes, S. (2005). Online teaching and classroom change: The impact of virtual high school on
its teachers and their schools. Unpublished manuscript, Teachers College, Columbia
University, New York, NY.
Luehr, D. D. (2011). Organizational perspectives on online programming implementation in
three traditional high schools. Retrieved from ProQuest Dissertations and Theses
database. (UMI 3457103)
Mahrenholz, F. (2010). The emergence, growth and challenges of online learning. Retrieved
from ProQuest Dissertations and Theses database. (UMI 1493035)
Malcom. M. (2009). The Relationship between learning styles and success in online learning.
Retrieved from ProQuest Dissertations and Theses database. (UMI 3356569)

110
Marx, G. (2014). 21 trends for the 21st century: Out of the trenches and into the future.
Bethesda, MD: Education Week Press.
Marzano, R., Pickering, D., & Pollock, J. (2001). Classroom instruction that works: Research-
based strategies for increasing student achievement. Alexandria, VA: ASCD.
Miller, P. (2011). Theories of developmental psychology (5th ed.). New York, NY: Worth
Publishers.
Milman, N. (2013). Increasing student success in online courses examining existing research-
And the need for even more. Distance Learning, 10(3), 63-65.
Ng, W. & Nicholas, H. (2010). A progressive pedagogy for online learning with high ability
secondary school students: A case study. Gifted Child Quarterly, 54(3), 239-251. Doi:
10.1177/0016986209355973
Picciano, A., Seamon, J., Shea, P., & Swan, K. (2012). Examining the extent and nature of online
learning in American K-12 education: The research initiatives of the Alfred P. Sloan
Foundation. Internet and Higher Education, 15(3), 127-135.
Rankin, D. (2013). Predictors of success for high school students enrolled in online courses in a
single district program. Retrieved from ProQuest Dissertations and Theses database.
(UMI 3561551)
Raosoft (2016). Raosoft®: Sample size calculator. Retrieved from www.raosoft.com
Roblyer, M. & Marshall, J. (2003). Predicting success of virtual high school students:
Preliminary results from an educational success prediction instrument. Journal of
Research on Technology in Education, 35(2), 241-255. Retrieved from
http://ezproxy.liberty.edu:2048/login?url=http://search.proquest.com/docview/274705665
?accountid=12085
111
Roblyer, M., Davis, D., Mills, S., Marshall, C., & Pape, L. (2008). Toward practical procedures
for predicting and promoting success in virtual school students. American Journal of
Distance Education, 222, 90-109. Doi: 1 0.1080/08923640802039040
Scarborough, J. & Ravaglia, R. (2014). Bricks and mortar: The making of a real education at the
Stanford Online High School. Stanford, CA: CSLI Publications.
Schwirzke, K. (2011). Online learning in California K-12 schools: Status and perceptions of
administrators. Retrieved from ProQuest Dissertations and Theses database. (UMI
3515001)
Shabani, K., Khatib, M., & Ebadi, S. (2010). Vygotsky’s zone of proximal development:
Instructional implications and teachers’ professional development. English Language
Teaching, 3(4), 237-248. Retrieved from http://proquest.com/docview
/839108952?accountid=12085
Sheninger, E. (2014). Digital leadership: Changing paradigms for the changing times. Thousand
Oaks, CA: Corwin.
Smith, S. (2009). High school student’s perceptions of distance learning. Retrieved from
Proquest Dissertations and Theses database. (UMI 3396358).
Spaulding, E., Garcia, J., & Braun, J. A. (2010). An introduction to standards-based reflective
practice for middle & high school teaching. New York, NY: Teachers College Press.
Stix, A. & Hrbek, F. (2006). Teachers as classroom coaches. Alexandria, VA: ASCD.
Thompson, I. (2012). Stimulating reluctant writers: A Vygotskian approach to teaching writing
in secondary schools. English in Education, 46(1), 85-100. Doi: 10:1111/j.1754-
8845.2011.01117.x

112
Tomlinson, C. & Imbeau, M. (2010). Leading and managing: A differentiated classroom.
Alexandria, VA: ASCD.
Townsend, L. (2009). Online teaching and learning: Student-student and teacher-student
discourse for student learning in asynchronous discussions of high school courses.
Retrieved from ProQuest Dissertations and Theses database. (UMI DP19207)
Vrasidas, C., Zembylas, M., & Chamberlain, R. (2003). Complexities in the evaluation of
distance education and virtual school. Educational Media International 40(3/4), 201-218.
Retrieved from the EBSCO database.
Vygotsky, L. (1978). Mind in Society. Cambridge, MA: Harvard University Press.
Vygotsky, L. (1986). Thought and Language. Cambridge, MA: The MIT Press.
Vygotsky, L. (1998). The problem of age. In R. W. Rieber (Ed.), Collected works of L. S.
Vygotsky: Vol. 5. Child Psychology, (5) (187-205).
Watson, J., Gemin, B., Ryan, J., & Wicks, M. (2009, November). Keeping pace with K-12 online
learning: An annual review of state-level policy and practice. Evergreen Consulting
Associates. Retrieved from http://www.kpk12.com
Wertsch, J. (2007). ‘Mediation’, in H. Daniels, M. Cole and J. Wertsch (Eds). The
Cambridge Companion to Vygotsky. New York, NY: Cambridge University Press.
Zaretskii, V. K. (2009). The zone of proximal development: What Vygotsky did not have time to
write. Journal of Russian and East European Psychology, 47(6), 70-93. Doi: 10.2753/
RPO1061-0405470604
Zhao, Y. (2009). Catching up or leading the way: An American education in the age of
globalization. Alexandria, VA: ASCD.
113
Zucker, A. (2005). A study of student interaction and collaboration in the virtual high school.
Unpublished manuscript, the Concord Consortium, Emeryville, CA.
Zunker, L. J. (2008). Computer-based instruction and mathematics skills of elementary school
students with disabilities. Retrieved from ProQuest Dissertation and Theses Database.
(UMI No. 3332683)

114
Appendix A
Online Student Connectedness Survey (OSCS)
(Bolliger and Inan, 2012)
Please answer each question with a 1,2,3,4, or 5.
1=Strongly Disagree, 2=Disagree, 3=Neutral, 4=Agree, 5=Strongly Agree
Comfort
1. _____ I feel comfortable in the online learning environment provided by my District.
2. _____ I feel my instructors have created a safe online environment in which I can freely express myself.
3. _____ I feel comfortable asking other students in my online course for help.
4. _____ I feel comfortable expressing my opinions and feelings in my online course.
5. _____ I feel comfortable introducing myself in my online course.
6. _____ If I need to, I will ask for help from my classmates.
7. _____ I have no difficulties with expressing my thoughts in my online course.
8. _____ I can effectively communicate in my online course.
Community
1. _____ I have gotten to know some of the faculty members and classmates well.
2. _____ I feel emotionally attached to other students in my online course.
3. _____ I can easily make acquaintances in my online course.
4. _____ I spend a lot of time online with my online course peers.
5. _____ My peers have gotten to know me quite well in my online course.
6. _____ I feel that students in my online course depend on me.
Facilitation
1. _____ Instructors promote collaboration between students in my online course.
2. _____ Instructors integrate collaboration tools (e.g., chat rooms, wikis, etc.) into online course activities.
3. _____ My online instructors are responsive to my questions.
4. _____ I receive frequent feedback from my online instructors.
5. _____ My instructors participate in online discussions.
6. _____ In my online course, instructors promote interaction between learners.
Interaction and Collaboration
1. _____ I work with others in my online course.
2. _____ I relate my work to others’ work in my online course.
3. _____ I share information with other students in my online course.
4. _____ I discuss my ideas with other students in my online course.
5. _____ I collaborate with other students in my online course.
Bolliger & Inan (2012). Online Student Connectedness Survey (OSCS). © Used and adapted
with permission from Dr. Doris U. Bolliger, Ed.D.
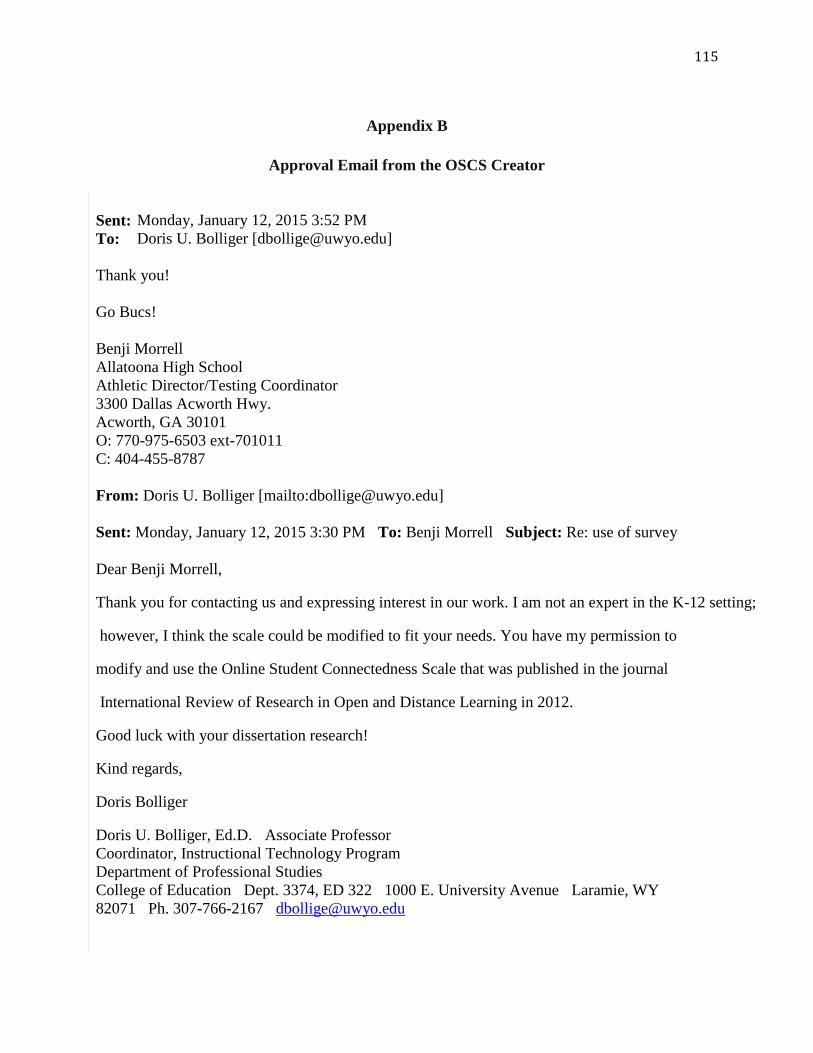
115
Appendix B
Approval Email from the OSCS Creator
Sent: Monday, January 12, 2015 3:52 PM
To: Doris U. Bolliger [[email protected]]
Thank you!
Go Bucs!
Benji Morrell
Allatoona High School
Athletic Director/Testing Coordinator
3300 Dallas Acworth Hwy.
Acworth, GA 30101
O: 770-975-6503 ext-701011
C: 404-455-8787
From: Doris U. Bolliger [mailto:[email protected]]
Sent: Monday, January 12, 2015 3:30 PM To: Benji Morrell Subject: Re: use of survey
Dear Benji Morrell,
Thank you for contacting us and expressing interest in our work. I am not an expert in the K-12 setting;
however, I think the scale could be modified to fit your needs. You have my permission to
modify and use the Online Student Connectedness Scale that was published in the journal
International Review of Research in Open and Distance Learning in 2012.
Good luck with your dissertation research!
Kind regards,
Doris Bolliger
Doris U. Bolliger, Ed.D. Associate Professor
Coordinator, Instructional Technology Program
Department of Professional Studies
College of Education Dept. 3374, ED 322 1000 E. University Avenue Laramie, WY
82071 Ph. 307-766-2167 [email protected]

116
From: Benji Morrell <[email protected]>
Sent: Tuesday, December 30, 2014 3:57 PM To: Doris U. Bolliger Subject: use of survey
Dr. Bolliger,
I am putting together my dissertation proposal for Liberty University and wanted to ask
your permission to possibly use your online connectedness survey in my research.
Is it also applicable for use with high school students taking online courses?
Any help you can give me would be appreciated.
Regards,
Benji Morrell
Assistant Principal
Allatoona High School
3300 Dallas Acworth Hwy
Acworth, Ga 3010
Note: “This message is intended only for the use of the individual or entity to which it is addressed
and may contain information that is privileged, confidential and exempt from disclosure under
applicable law. If the reader of this message is not the intended recipient, you are hereby notified
that any dissemination, distribution, or copying of this communication is strictly prohibited. If
you have received this communication in error, please notify us immediately by telephone
and/or e-mail."
117
APPENDIX C: Survey Monkey Permission Letter
SurveyMonkey Inc.
www.surveymonkey.com
For questions, visit our Help Center
help.surveymonkey.com
Re: Permission to Conduct Research Using SurveyMonkey
To whom it may concern:
This letter is being produced in response to a request by a student at your institution who wishes to conduct a survey using SurveyMonkey in order to support their research. The student has indicated that they require a letter from SurveyMonkey granting them permission to do this. Please accept this letter as evidence of such permission. Students are permitted to conduct research via the SurveyMonkey platform provided that they abide by our Terms of Use, a copy of which is available on our website.
SurveyMonkey is a self-serve survey platform on which our users can, by themselves, create, deploy and analyze surveys through an online interface. We have users in many different industries who use surveys for many different purposes. One of our most common use cases is students and other types of researchers using our online tools to conduct academic research.
If you have any questions about this letter, please contact us through our Help Center at help.surveymonkey.com.
Sincerely,
SurveyMonkey Inc.
118
APPENDIX D: Parent Permission Letter
Dear Parent/Guardian:
Your student is invited to participate in a research study conducted by Benji Morrell, a doctoral
student from Liberty University’s College of Education. This study is being conducted to
understand the relationship between how connected your student feels in their online course and
their final End of Course Milestone Assessment score. Your student was selected as a possible
participant in this study because they are enrolled in and online course through the Cobb County
Virtual Academy during the fall semester of 2015.
If you decide to allow your student to participate, they will be sent an online survey consisting of
25 questions through the Survey Monkey platform. Their survey results will be collected and
compared to their End of Course Assessment scores at the end of the semester.
It is the researcher’s desire to use the results of this study to better develop future online courses
in Cobb County. However, I cannot guarantee that your student personally will receive any
benefits from this research.
Any identifying information about your student will remain confidential and will be disclosed
only with your permission or as required by law. Student identities will be kept confidential by
using Cobb County School District student identification numbers and the researcher will be the
only person that will have access to the survey data.
Your student’s participation in this study is voluntary. Your decision of whether or not to allow
them to participate will not affect your or your student’s relationship with the Cobb County
School District. If you decide to allow your student to participate, you and/or your student are
free to withdraw your consent and discontinue participation at any time without penalty.
If you have any questions about the study, please feel free to contact Benji Morrell at
[email protected] or by phone at 404-455-8787. You may also contact his faculty
advisor, Dr. Alan Wimberley at [email protected]. If you have questions regarding your
rights as a research subject, please contact the IRB ([email protected]). You will be offered a copy of
this form to keep.
Your response to this email with a reply of, “Yes, I agree to my student’s participation in this
study”, indicates that you have read and understand the information provided above, that you
willingly agree to allow your student to participate, that you and/or your student may withdraw
your consent at any time and discontinue participation without penalty, that you have received a
copy of this form, and that you are not waiving any legal claim.
119
APPENDIX E: Permission to Reproduce the OSCS
Doris U. Bolliger [email protected] Re: Permission to reproduce the OSCS in my dissertation
Hi Benji,
Just a quick note about my last name. It does not have an "N" in it. It is simply Bolliger. Just FYI for publishing purposes.
Cheers!
Doris
From: Benji Morrell <[email protected]> Sent: Tuesday, October 25, 2016 8:44:01 AM To: Doris U. Bolliger Subject: Permission to reproduce the OSCS in my dissertation Dr. Bollinger,
Thank you for allowing me to use your OSCS in my research for my dissertation,
I am contacting you now because I would like to ask permission to reproduce your Online Student
Connectedness Survey in my Dissertation. After defending my Dissertation, my program requires me to
submit it for publication in the Liberty
University open-access institutional repository, the Digital Commons, and in the Proquest thesis and
dissertation subscription research database. If you allow this, I will provide a citation of your work as
follows:
The OSCS is reproduced here, in its entirety, with permission from Dr. Doris U. Bollinger. Dr.
Bollinger’s permission to reproduce the survey is not an endorsement of the products, services, or other
uses in which the survey appears or is applied.
Can you please respond back to this email so I may add the information as an appendix to my
dissertation?
Thank you for your consideration in this matter!
Dr. Benji Morrell


![Correlational Research - Article[1]](https://img.pdfslide.us/doc/110x75/577d2ba41a28ab4e1eaaf991/correlational-research-article1.jpg)