Embed Size (px)
DESCRIPTION
Correlational analysis. Scatterplot. Correlational tests. Correlation coefficient + effect size. Beispiel: MLU & Age. Beispiel: MLU & Age. - PowerPoint PPT Presentation
Citation preview

Correlational analysis
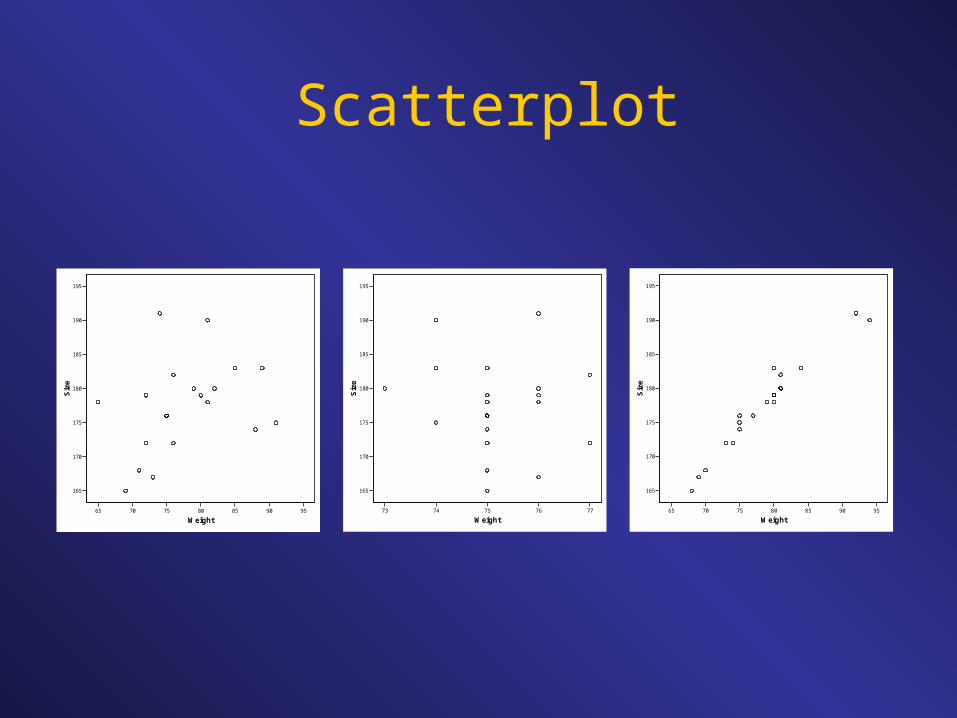
65 70 75 80 85 90 95
Weight
165
170
175
180
185
190
195
Size
73 74 75 76 77
Weight
165
170
175
180
185
190
195
Size
65 70 75 80 85 90 95
Weight
165
170
175
180
185
190
195
Size
Scatterplot
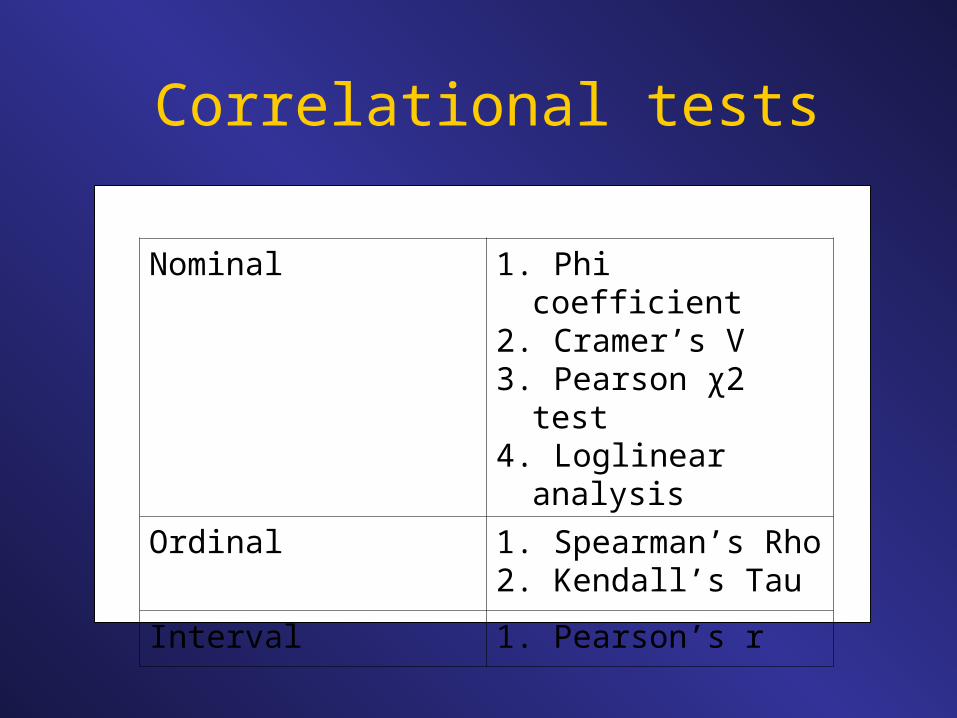
Nominal 1. Phi coefficient2. Cramer’s V3. Pearson χ2 test4. Loglinear analysis
Ordinal 1. Spearman’s Rho2. Kendall’s Tau
Interval 1. Pearson’s r
Correlational tests
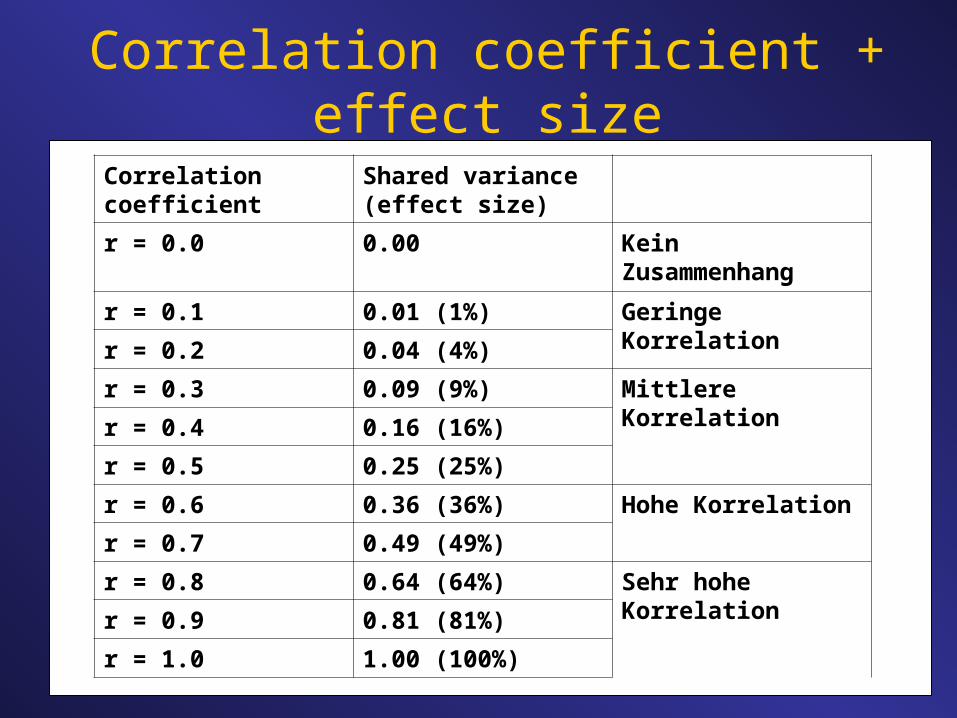
Correlation coefficient + effect size
Correlation coefficient Shared variance (effect size)
r = 0.0 0.00 Kein Zusammenhang
r = 0.1 0.01 (1%) Geringe Korrelation
r = 0.2 0.04 (4%)
r = 0.3 0.09 (9%) Mittlere Korrelation
r = 0.4 0.16 (16%)
r = 0.5 0.25 (25%)
r = 0.6 0.36 (36%) Hohe Korrelation
r = 0.7 0.49 (49%)
r = 0.8 0.64 (64%) Sehr hohe Korrelation
r = 0.9 0.81 (81%)
r = 1.0 1.00 (100%)
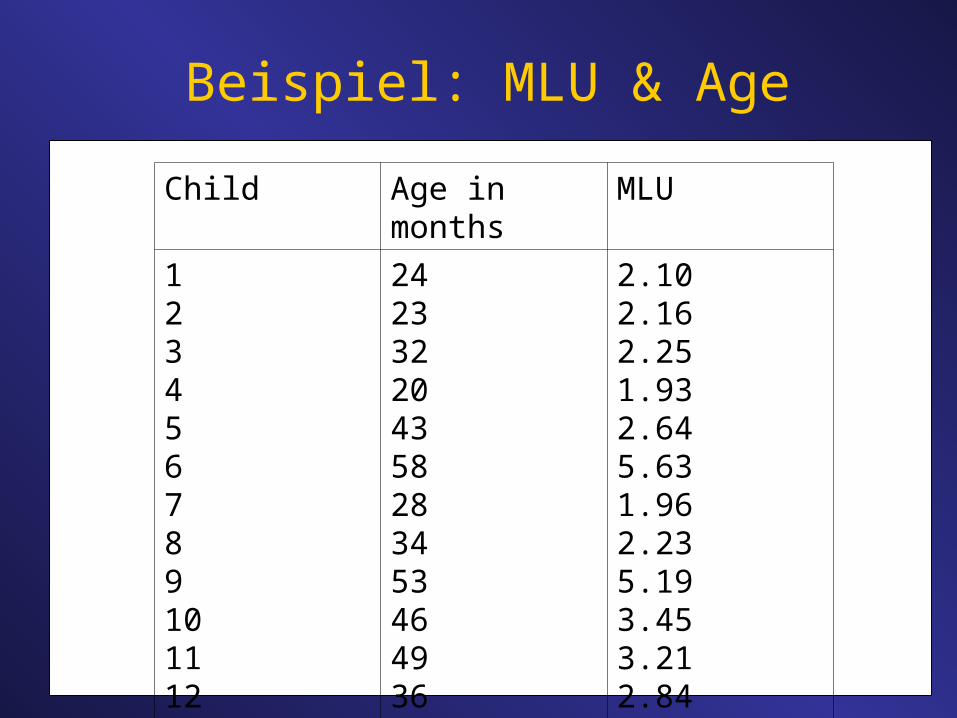
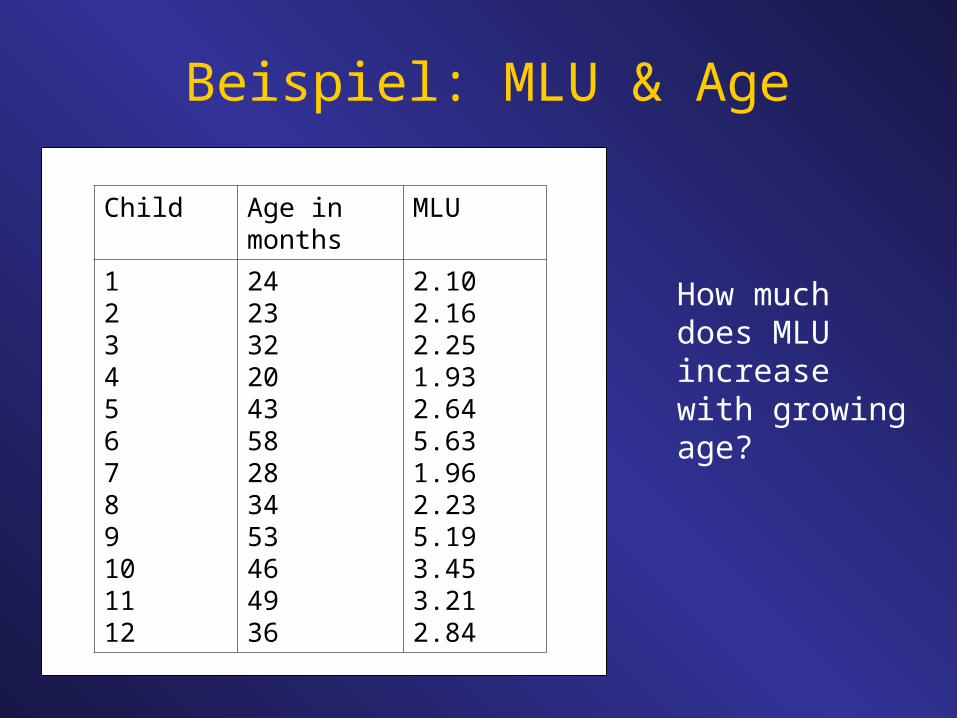
Beispiel: MLU & Age
Child Age in months MLU
123456789101112
242332204358283453464936
2.102.162.251.932.645.631.962.235.193.453.212.84
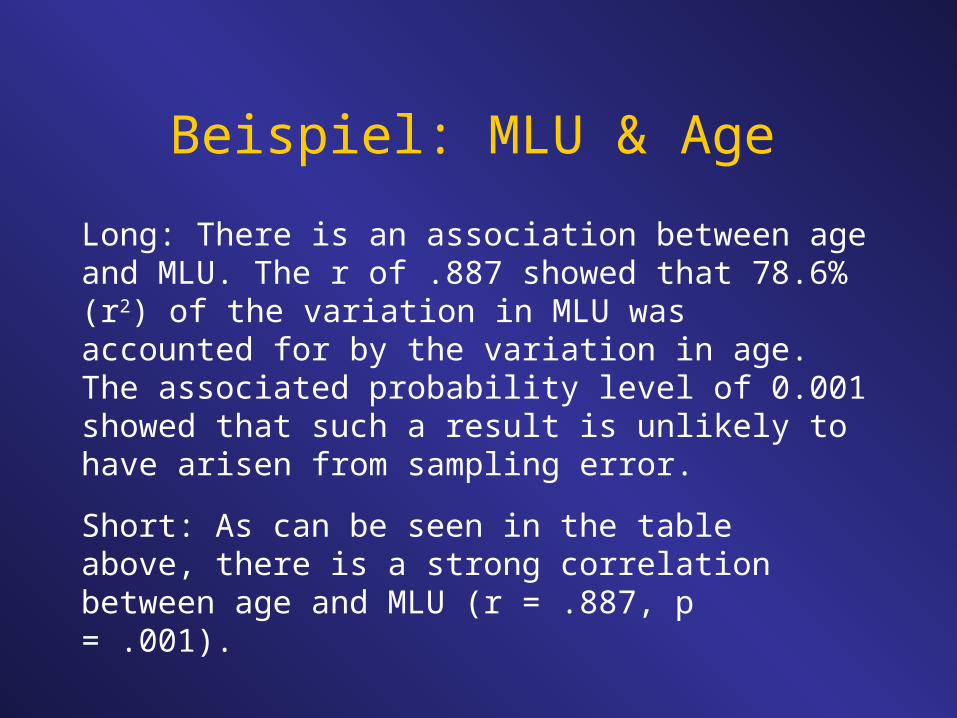
Long: There is an association between age and MLU. The r of .887 showed that 78.6% (r2) of the variation in MLU was accounted for by the variation in age. The associated probability level of 0.001 showed that such a result is unlikely to have arisen from sampling error.
Short: As can be seen in the table above, there is a strong correlation between age and MLU (r = .887, p = .001).
Beispiel: MLU & Age

Beispiel: Typicality & Frequency
Words Typicality rank Frequency rank
cartrucksports carmotor biketrainbicycleshipboatscat boardspace shuttle
12345678910
12653487910
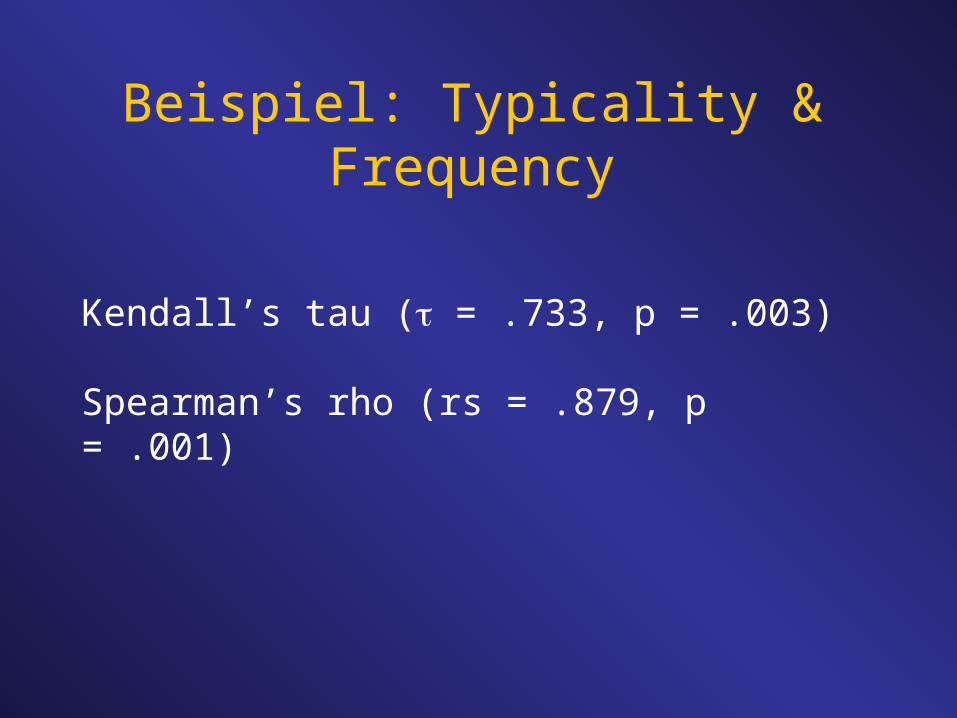
Kendall’s tau ( = .733, p = .003)
Spearman’s rho (rs = .879, p = .001)
Beispiel: Typicality & Frequency

Phoneme & Silben r = .898, p = .001Phoneme & Häufigkeit r = .795, p = .006Silben & Häufigkeit r = .677, p = .031
Partial correlation
Phoneme & Häufigkeit r = .578, p = .103(Silben Konstant)

Es gibt eine signifikante Korrelation zwischen Geschlecht (Boys vs. Girls) und der Präferenz für ein bestimmtes Spielzeug (mechanisch vs. nicht-mechanisch) (χ2 = 49,09, df = 2, p = .001).
Nominal Daten
Phi-Koeffizient = .70, p < .001Cramer’s V = .70, p < .001

Regression
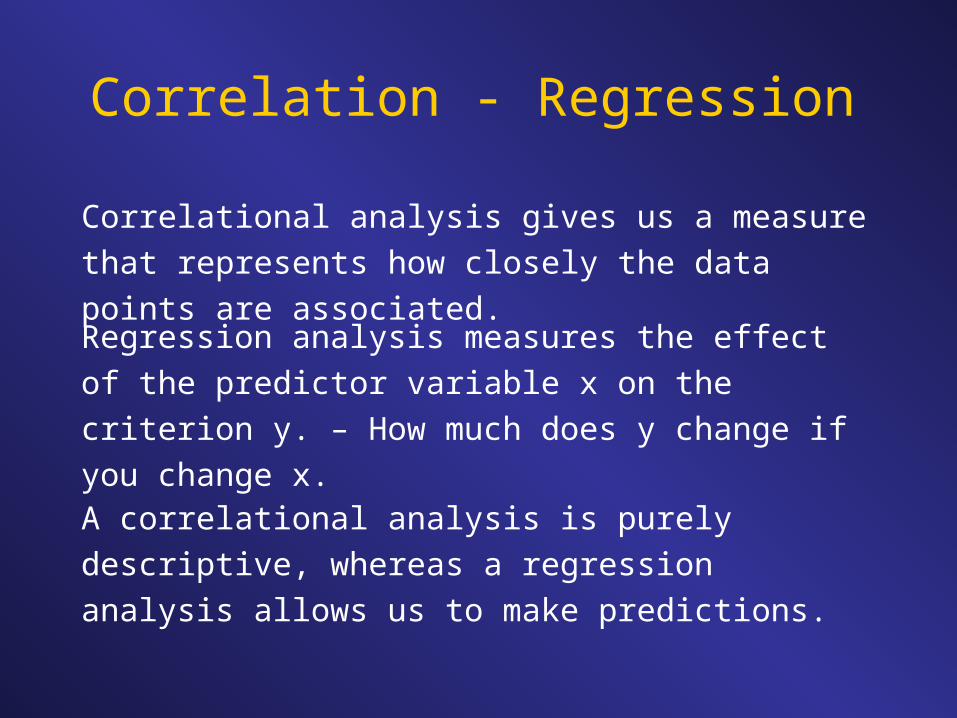
Correlational analysis gives us a measure that
represents how closely the data points are associated.
Correlation - Regression
Regression analysis measures the effect of the predictor
variable x on the criterion y. – How much does y change
if you change x.
A correlational analysis is purely descriptive, whereas
a regression analysis allows us to make predictions.
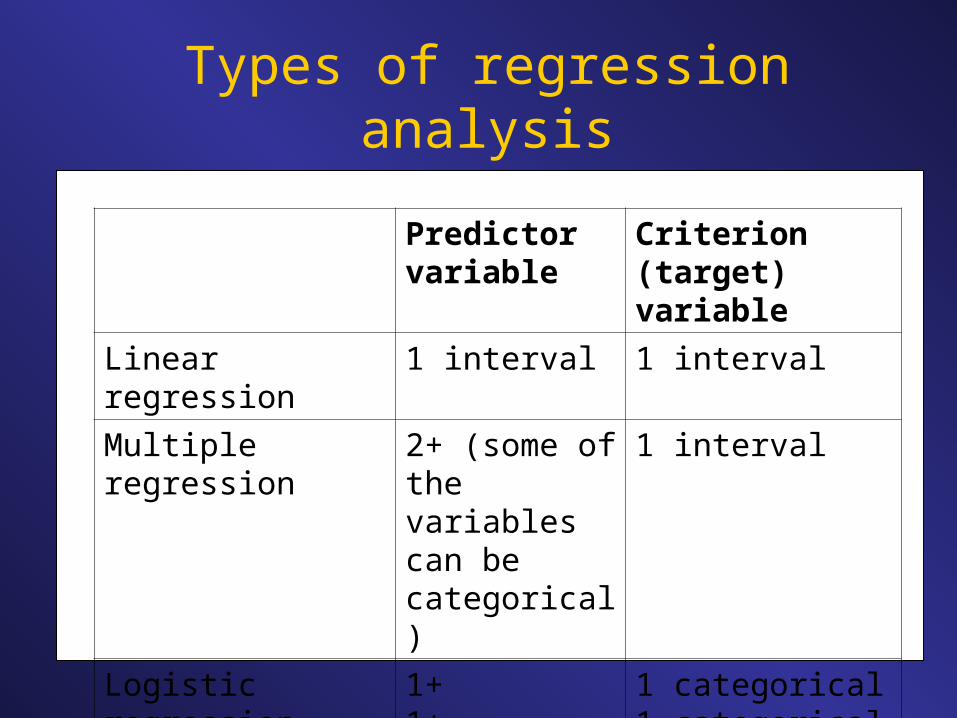
Types of regression analysis
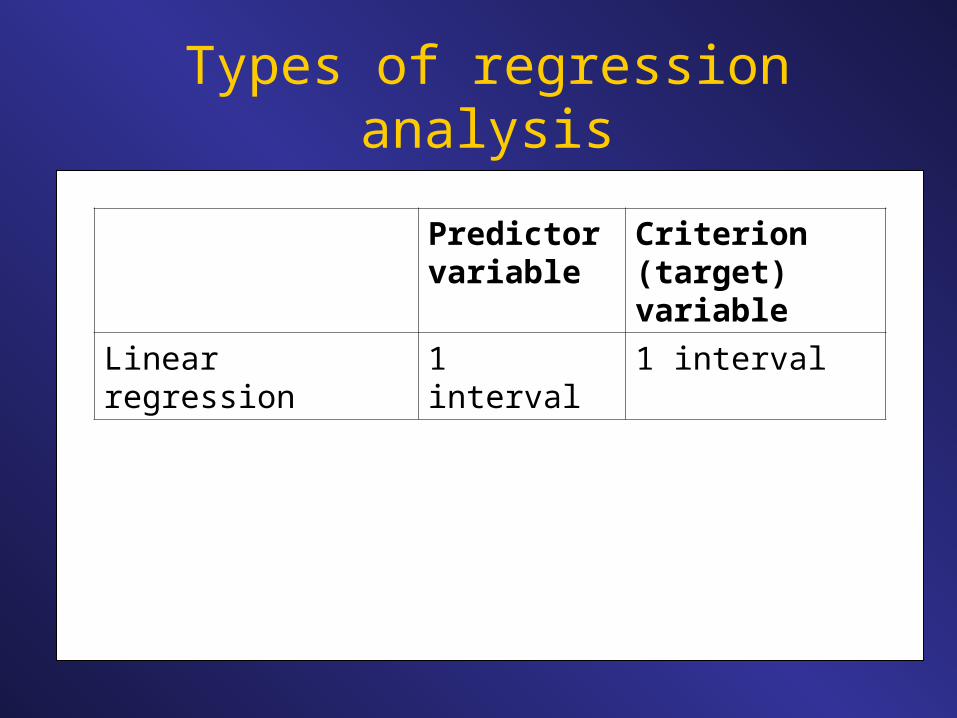
Predictor variable
Criterion (target) variable
Linear regression 1 interval 1 interval

Types of regression analysis
Predictor variable
Criterion (target) variable
Linear regression 1 interval 1 interval
Multiple regression 2+ (some of the variables can be categorical)
1 interval
Types of regression analysis
Predictor variable
Criterion (target) variable
Linear regression 1 interval 1 interval
Multiple regression 2+ (some of the variables can be categorical)
1 interval
Logistic regressionDiscriminant analysis
1+1+
1 categorical1 categorical

Line-of-best-fit
20,00 30,00 40,00 50,00 60,00
Age
2,00
3,00
4,00
5,00
6,00
MLU
R-Quadrat linear = 0,786

y = bx + a
Linear Regression
y = variable to be predictedx = given value on the variable xb = value of the slope of the line a = the intercept (or constant), which is the
place where the line-of-best-fit intercepts the y-axis.

Given a score of 20 on the x-axis, a slope of b = 2,
and an interception point of a = 5, what is the
predicted score?
Linear Regression
y = (2 20) + 5 = 45
Beispiel: MLU & Age
Child Age in months
MLU
123456789101112
242332204358283453464936
2.102.162.251.932.645.631.962.235.193.453.212.84
How much does MLU increase with growing age?

There is s strong association between age and MLU (R =
0.887). Specifically, it was found that the children’s MLU
increases by an average of .088 words each months (t =
6,069, p < 0.001), which amounts to about a word a year.
Since the F-value (36,838, df = 1) is highly significant (p <
001), these results are unlikely to have arisen from
sample error.
Linear Regression

Several predictor variables influence the criterion.
Multiple Regression
Plane-pf-best-fit
1. Simultaneous multiple regression
2. Stepwise multiple regression

Eine Universität möchte wissen, welche Faktoren am
besten dazu geeignet sind, den Lernerfolg ihrer
Studenten vorherzusagen. Als Indikator für den
Wissensstand der Studenten gilt die Punktzahl in einer
zentralen Abschlussklausur. Als mögliche Faktoren
werden in Betracht gezogen: (1) Punktzahl beim
Eingangstest, (2) Alter, (3) IQ Test, (4) Punktzahl bei
einem wissenschaftlichen Projekt.
Simultaneous Multiple Regression

Predictor
entrance exam
age
IQ
Scientific project
Simultaneous Multiple Regression
Criterion
final exam

There is s strong association between the predictor
variables and the result of the final exam (Multiple R =
0.875; F = 22,783, df = 4, p = .001 ). Together they account
for 73% of the variation in the exam succes. If we look at
the four predictor variables individually we find that the
result of the entrance exam (B = .576, t = 5.431, p = .001)
and the IQ score (B = .447, t = 4.606, p = .001) make the
strongest contributions (i.e. they are the best predictors).
The predictive value of age (B = .099, t = 5.431, p = .327
and the score on the scientific project is not significant (B =
0.141, t = 1,417, p = 0.168.).
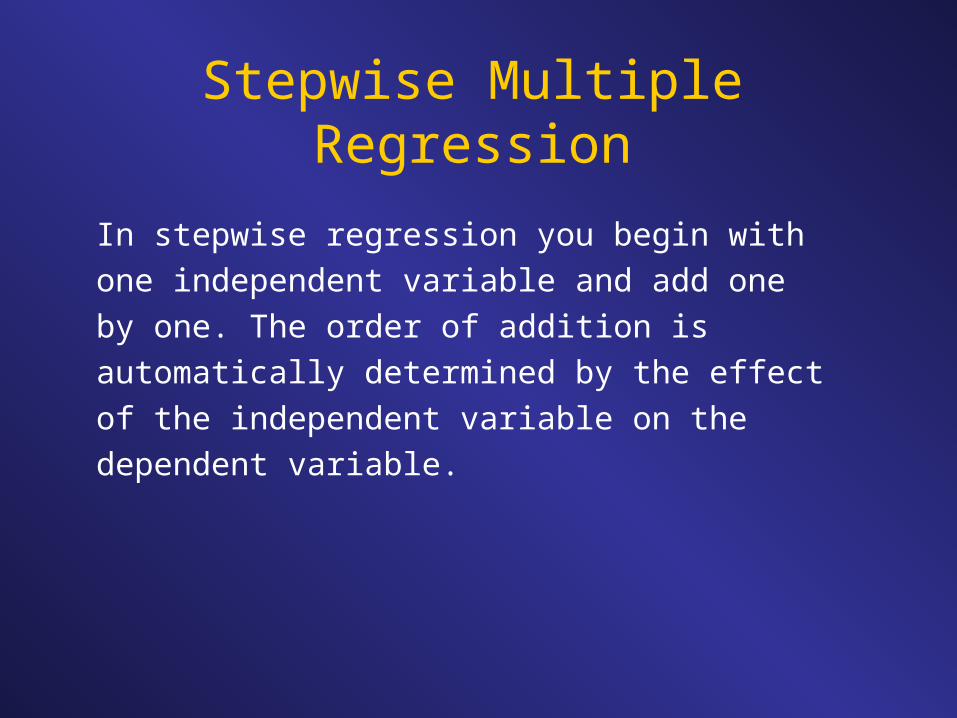
In stepwise regression you begin with one
independent variable and add one by one. The
order of addition is automatically determined by the
effect of the independent variable on the
dependent variable.
Stepwise Multiple Regression
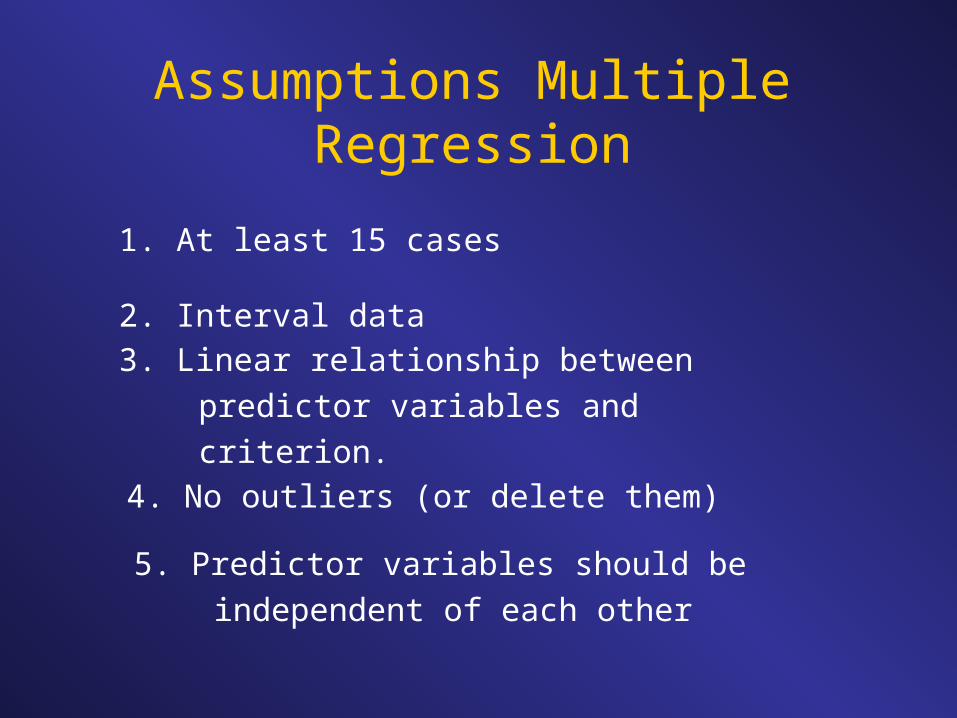
Assumptions Multiple Regression
1. At least 15 cases
2. Interval data
3. Linear relationship between predictor variables
and criterion.
4. No outliers (or delete them)
5. Predictor variables should be independent of
each other
In Linguistics, you often use logistic regression: Multiple
factors determine the choice of linguistic alternates:
1. look up the number - look the number up
2. that-complement clauses - zero-complement clause
3. intial adverbial clause - final adverbial clause
4. aspirate /t/ - unaspirated /t/ - glottal stop - flap
Logistic Regression