Embed Size (px)
Citation preview
2015–2016
Congenital anomalies in Victoria

To receive this publication in an accessible format phone (03) 9096 0380, using the National Relay Service 13 36 77 if required, or email [email protected].
Authorised and published by the Victorian Government, 1 Treasury Place, Melbourne.
© State of Victoria, Safer Care Victoria, June 2018. (1805021)
Where the term ‘Aboriginal’ is used it refers to both Aboriginal and Torres Strait Islander people.
ISSN 2207-2764 (pdf/online)
Available at bettersafercare.vic.gov.au
Recommended citation: Victorian Congenital Anomalies Register 2018, Congenital anomalies in Victoria 2015–2016, Consultative Council on Obstetric and Paediatric Mortality and Morbidity (CCOPMM), Melbourne.
Congenital anomalies in Victoria 2015–2016 CCOPMM i
The release of this report covering major congenital anomalies detected in children born in Victoria marks the return of timely reporting and analyses of these conditions which commenced in 1982.
Collection of the data that underlies this report comes from the Victorian Perinatal Data Collection, from clinicians including the maternal and child health nurses and cytogenetic laboratories and we express our appreciation for their cooperation and facilitation of this collection.
With the expansion in genetic analysis, the understanding of the causation of many anomalies has undergone major developments as the ability to detect changes in the child’s DNA is rapidly improving. With this knowledge will come initiatives to prevent and correct at least some of these anomalies that can have such a major impact on the child and their parents and family.
This report is the result of a substantial effort by the staff of the Consultative Councils Unit of Safer Care Victoria that supports the work of the Consultative Council on Obstetric and Paediatric Mortality and Morbidity that has the legislative responsibility for the surveillance and reporting on congenital anomalies of children born in Victoria.
Jeremy J N OatsChairConsultative Council on Obstetric and Paediatric Mortality and Morbidity
Message from the chair
ii CCOPMM Congenital anomalies in Victoria 2015–2016
This report would not have been possible without the particular assistance of:
l midwives in Victoria who provided notification of congenital anomalies via their hospital’s electronic system or the online e-form to the Victorian Perinatal Data Collection (VPDC)
l maternal and child health nurses who completed the Birth Anomalies Notification form – either via hard copy or online
l health information managers at all hospitals with maternity services and, in particular, those at hospitals with paediatric services
l cytogenetic services in Victoria.
We thank them for their contributions.
This report was developed by the Consultative Council on Obstetric and Paediatric Mortality and Morbidity (CCOPMM) with support from the following team members from Safer Care Victoria’s Consultative Councils Unit:
Dr Shirin Anil Acting Manager
Ms Joanna Gaston Senior Project Officer
Ms Taliesin Ryan-Atwood Research Officer
Dr Sophie Treleaven Paediatric Epidemiologist
Dr Mary-Ann Davey Perinatal Epidemiologist; Acting Team Leader, Research and Reporting
Ms Sarah Kenny Team Leader, Council Program Support
Ms Diana Stubbs Liaison Midwife
Ms Adelinda Botham Project Officer
Ms Marina Forte Administration Officer
We would like to acknowledge the following people for their contributions to the report:
Dr Catherine Rose from Victorian Clinical Genetics Service (VCGS) and POSSUMweb, Murdoch Children’s Research Institute and Ms Fiona Norris, from VCGS.
We would like to extend our sincere gratitude and thanks to Professor Jeremy Oats, chairperson of CCOPMM since 2007, for his expertise and passion for improving obstetric and paediatric outcomes for Victorian mothers and babies. His guidance of CCOPMM over the past 11 years has ensured that the Minister for Health and the Department of Health and Human Services have been informed and supported on obstetric and paediatric issues in Victoria. We wish Professor Oats all the best in his retirement, and his many contributions to improving the health and wellbeing of Victorians are greatly appreciated.
Acknowledgements
Congenital anomalies in Victoria 2015–2016 CCOPMM iii
Executive summary 1
Findings at a glance 2
Reporting of congenital anomalies in Victoria 3
Victorian Congenital Anomalies Register 3
Congenital anomalies: major and minor 3
Sources of notification 4
Data items 5
Data quality 5
Data analysis 5
Trends in prenatal testing 6
Prevalence of congenital anomalies in Victoria 7
Congenital anomaly trends in Victoria 7
Congenital anomalies by body system 8
Congenital anomalies by diagnostic category 9
Congenital anomalies by the child’s characteristics 10
Gender 10
Gestational age 11
Birthweight 11
Birth plurality 12
Perinatal outcomes 13
Congenital anomalies by maternal characteristics 14
Mother’s age at birth 14
Aboriginal women 14
Parity 14
Mother’s country of birth 15
Smoking 16
Obesity 16
Pre-gestational diabetes 18
Socioeconomic status 20
Contents
iv CCOPMM Congenital anomalies in Victoria 2015–2016
Selected congenital anomalies 21
Cleft palate (Q35) 21
Cleft lip (Q36) 22
Cleft lip and palate (Q37) 23
Malformations of oesophagus (Q39) 24
Absence, atresia and stenosis of small intestine (Q41) 25
Absence, atresia and stenosis of large intestine (Q42) 26
Diaphragmatic hernia (Q790) 27
Gastroschisis (Q793) 28
Exomphalos (Q792) 29
Trisomy 21 (Q90) 30
Trisomy 13 (Q914, Q915, Q916, Q917) 31
Trisomy 18 (Q910, Q911, Q912, Q913) 32
Appendix 1: Selected major congenital anomalies by body system 33
Appendix 2: Excluded minor congenital anomalies 41
Appendix 3: Routine data items contained in the Victorian Congenital Anomalies Register 42
Appendix 4: Major congenital anomalies by year, 1983–2016 43
Appendix 5: Perinatal outcomes of key congenital anomalies, 2015–2016 44
Glossary 46
Acronyms 46
References 47
Congenital anomalies in Victoria 2015–2016 CCOPMM v
Table 1: Sources of notifications for congenital anomaly cases in Victoria, 2015–2016 4
Table 2: Order of prevalence of key congenital anomalies, 2015–2016 9
Table 3: Congenital anomalies by gestational age, 2015–2016 11
Table 4: Congenital anomalies by birthweight, 2015–2016 11
Table 5: Congenital anomalies by birthweight and reporting years 11
Table 6: Congenital anomalies by birth plurality, 2015–2016 12
Table 7: Congenital anomalies by mother’s age at birth, 2015–2016 14
Table 8: Congenital anomalies by Aboriginality, 2015–2016 14
Table 9: Congenital anomalies by parity, 2015–2016 15
Table 10: Congenital anomalies by mother’s country of birth, 2015–2016 15
Table 11: Congenital anomalies by smoking status 16
Table 12: Selected key congenital anomalies in obese women, 2015–2016 17
Table 13: Selected key congenital anomalies in women with pre-gestational diabetes, 2015–2016 19
Table 14: Congenital anomalies by mother’s socioeconomic status, 2015–2016 20
Table 15: Cleft palate by selected maternal and child characteristics, 2015–2016 21
Table 16: Cleft lip by selected maternal and child characteristics, 2015–2016 22
Table 17: Cleft lip and palate by selected maternal and child characteristics, 2015–2016 23
Table 18: Malformations of the oesophagus by selected maternal and child characteristics,
2015–2016 24
Table 19: Absence, atresia and stenosis of small intestine by selected maternal and child
characteristics, 2015–2016 25
Table 20: Absence, atresia and stenosis of the large intestine by selected maternal and child
characteristics, 2015–2016 26
Table 21: Diaphragmatic hernia by selected maternal and child characteristics, 2015–2016 27
Table 22: Gastroschisis by selected maternal and child characteristics, 2015–2016 28
Table 23: Exomphalos by selected maternal and child characteristics, 2015–2016 29
Table 24: Trisomy 21 by selected maternal and child characteristics, 2015–2016 30
Table 25: Trisomy 13 by selected maternal and child characteristics, 2015–2016 31
Table 26: Trisomy 18 by selected maternal and child characteristics, 2015–2016 32
Tables
vi CCOPMM Congenital anomalies in Victoria 2015–2016
Figures
Figure 1: Congenital anomaly cases in Victoria, 2015–2016 4
Figure 2: Prevalence of congenital anomalies, 1983–2016 7
Figure 3: Congenital anomalies in Victoria by body systems, 2015–2016 8
Figure 4: Congenital anomalies by gender 10
Figure 5: Congenital anomalies excluding terminations by gender 10
Figure 6: Congenital anomalies by birth plurality, 2015–2016 12
Figure 7: Cleft palate per 1,000 pregnancies, 1998–2016 21
Figure 8: Cleft lip per 1,000 pregnancies, 1998–2016 22
Figure 9: Cleft lip and palate per 1,000 pregnancies, 1998–2016 23
Figure 10: Malformations of the oesophagus per 1,000 pregnancies, 1995–2016 24
Figure 11: Absence, atresia and stenosis of small intestine per 1,000 pregnancies, 1998–2016 25
Figure 12: Absence, atresia and stenosis of the large intestine per 1,000 pregnancies, 1998–2016 26
Figure 13: Diaphragmatic hernia per 1,000 pregnancies, 1998–2016 27
Figure 14: Gastroschisis per 1,000 pregnancies, 1998–2016 28
Figure 15: Exomphalos per 1,000 pregnancies, 1998–2016 29
Figure 16: Trisomy 21 per 1,000 pregnancies, 1998–2016 30
Figure 17: Trisomy 13 per 1,000 pregnancies, 1998–2016 31
Figure 18: Trisomy 18 per 1,000 pregnancies, 1998–2016 32
Congenital anomalies in Victoria 2015–2016 CCOPMM 1
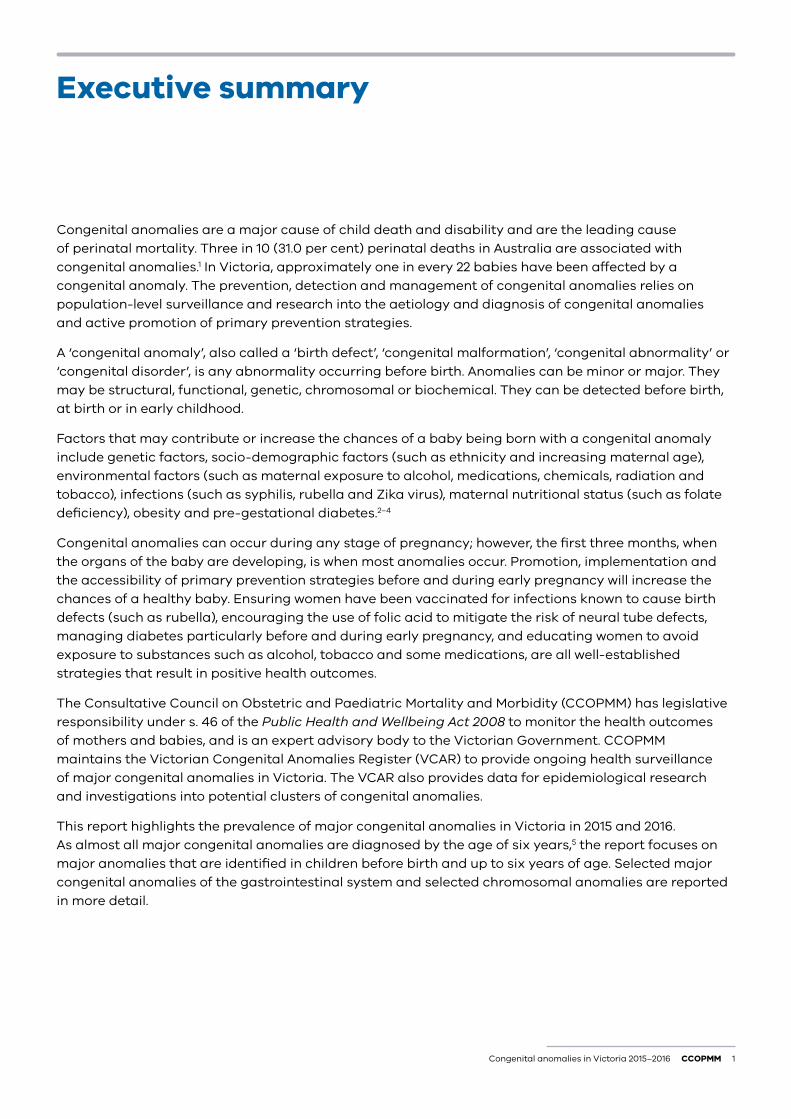
Congenital anomalies are a major cause of child death and disability and are the leading cause of perinatal mortality. Three in 10 (31.0 per cent) perinatal deaths in Australia are associated with congenital anomalies.1 In Victoria, approximately one in every 22 babies have been affected by a congenital anomaly. The prevention, detection and management of congenital anomalies relies on population-level surveillance and research into the aetiology and diagnosis of congenital anomalies and active promotion of primary prevention strategies.
A ‘congenital anomaly’, also called a ‘birth defect’, ‘congenital malformation’, ‘congenital abnormality’ or ‘congenital disorder’, is any abnormality occurring before birth. Anomalies can be minor or major. They may be structural, functional, genetic, chromosomal or biochemical. They can be detected before birth, at birth or in early childhood.
Factors that may contribute or increase the chances of a baby being born with a congenital anomaly include genetic factors, socio-demographic factors (such as ethnicity and increasing maternal age), environmental factors (such as maternal exposure to alcohol, medications, chemicals, radiation and tobacco), infections (such as syphilis, rubella and Zika virus), maternal nutritional status (such as folate deficiency), obesity and pre-gestational diabetes.2–4
Congenital anomalies can occur during any stage of pregnancy; however, the first three months, when the organs of the baby are developing, is when most anomalies occur. Promotion, implementation and the accessibility of primary prevention strategies before and during early pregnancy will increase the chances of a healthy baby. Ensuring women have been vaccinated for infections known to cause birth defects (such as rubella), encouraging the use of folic acid to mitigate the risk of neural tube defects, managing diabetes particularly before and during early pregnancy, and educating women to avoid exposure to substances such as alcohol, tobacco and some medications, are all well-established strategies that result in positive health outcomes.
The Consultative Council on Obstetric and Paediatric Mortality and Morbidity (CCOPMM) has legislative responsibility under s. 46 of the Public Health and Wellbeing Act 2008 to monitor the health outcomes of mothers and babies, and is an expert advisory body to the Victorian Government. CCOPMM maintains the Victorian Congenital Anomalies Register (VCAR) to provide ongoing health surveillance of major congenital anomalies in Victoria. The VCAR also provides data for epidemiological research and investigations into potential clusters of congenital anomalies.
This report highlights the prevalence of major congenital anomalies in Victoria in 2015 and 2016. As almost all major congenital anomalies are diagnosed by the age of six years,5 the report focuses on major anomalies that are identified in children before birth and up to six years of age. Selected major congenital anomalies of the gastrointestinal system and selected chromosomal anomalies are reported in more detail.
Executive summary
2 CCOPMM Congenital anomalies in Victoria 2015–2016
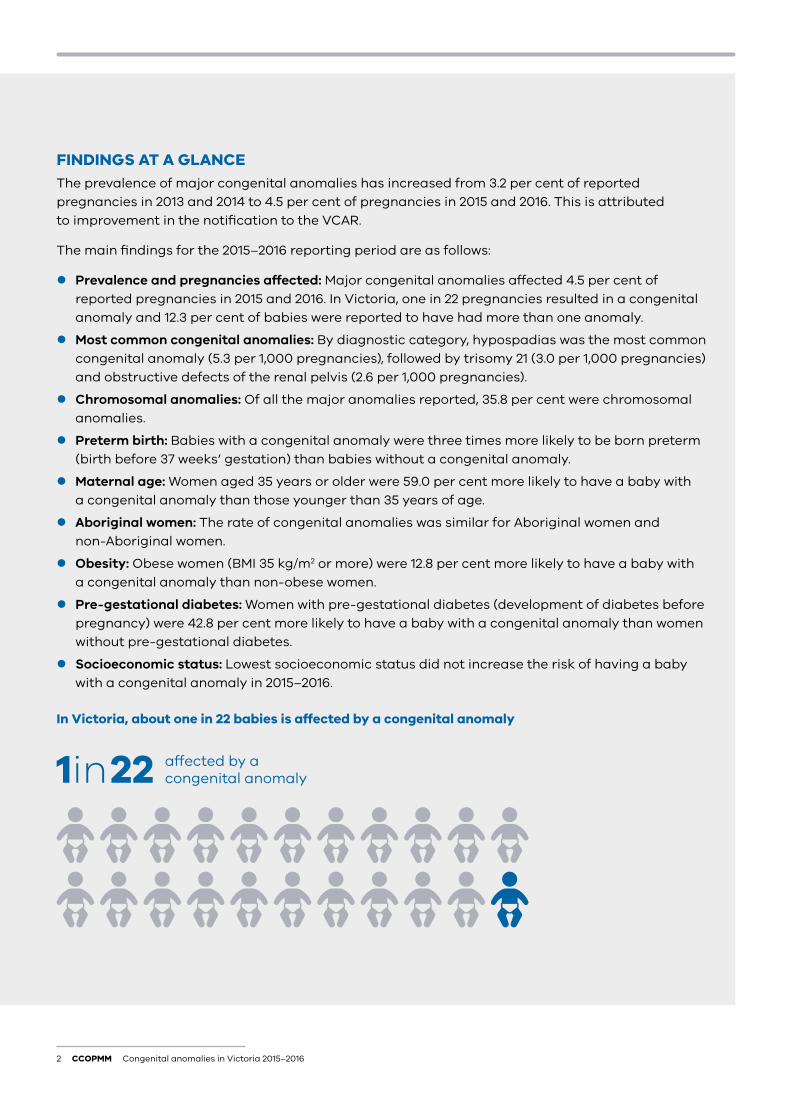
FINDINGS AT A GLANCEThe prevalence of major congenital anomalies has increased from 3.2 per cent of reported pregnancies in 2013 and 2014 to 4.5 per cent of pregnancies in 2015 and 2016. This is attributed to improvement in the notification to the VCAR.
The main findings for the 2015–2016 reporting period are as follows:
l Prevalence and pregnancies affected: Major congenital anomalies affected 4.5 per cent of reported pregnancies in 2015 and 2016. In Victoria, one in 22 pregnancies resulted in a congenital anomaly and 12.3 per cent of babies were reported to have had more than one anomaly.
l Most common congenital anomalies: By diagnostic category, hypospadias was the most common congenital anomaly (5.3 per 1,000 pregnancies), followed by trisomy 21 (3.0 per 1,000 pregnancies) and obstructive defects of the renal pelvis (2.6 per 1,000 pregnancies).
l Chromosomal anomalies: Of all the major anomalies reported, 35.8 per cent were chromosomal anomalies.
l Preterm birth: Babies with a congenital anomaly were three times more likely to be born preterm (birth before 37 weeks’ gestation) than babies without a congenital anomaly.
l Maternal age: Women aged 35 years or older were 59.0 per cent more likely to have a baby with a congenital anomaly than those younger than 35 years of age.
l Aboriginal women: The rate of congenital anomalies was similar for Aboriginal women and non-Aboriginal women.
l Obesity: Obese women (BMI 35 kg/m2 or more) were 12.8 per cent more likely to have a baby with a congenital anomaly than non-obese women.
l Pre-gestational diabetes: Women with pre-gestational diabetes (development of diabetes before pregnancy) were 42.8 per cent more likely to have a baby with a congenital anomaly than women without pre-gestational diabetes.
l Socioeconomic status: Lowest socioeconomic status did not increase the risk of having a baby with a congenital anomaly in 2015–2016.
In Victoria, about one in 22 babies is affected by a congenital anomaly
1in22 affected by a congenital anomaly
Congenital anomalies in Victoria 2015–2016 CCOPMM 3
Reporting of congenital anomalies in Victoria
VICTORIAN CONGENITAL ANOMALIES REGISTERThe VCAR, first established in 1982 under the Health Act 1981, is a population-based surveillance system that collects information on all congenital anomalies for live births, still births and terminations of pregnancy. More than half the notifications to the VCAR are made directly to the VPDC, with the remaining from sources such as hospitals, maternal and child health nurses, cytogenetic laboratories, death certificates, autopsy reports and private paediatricians. The VCAR includes both suspected and confirmed congenital anomalies.
The VPDC collects and analyses information on the health of mothers and babies in Victoria to contribute to improved maternal and perinatal health outcomes. The VCAR and VPDC are the legislative responsibility of CCOPMM. The principal function of CCOPMM is to identify and report on issues relating to perinatal, maternal and paediatric mortality and morbidity and to provide advice on strategies to improve the safety and quality of paediatric and maternity services in Victoria. Specifically, the Public Health and Wellbeing Act states that CCOPMM is required to identify and monitor trends in perinatal health including birth defects and disabilities and to establish and maintain a register of these.
Data from the VCAR can assist with:
l planning for and providing healthcare to people with congenital anomalies
l information for families concerned about having a baby with a congenital anomaly
l epidemiological research in the aetiology and preventability of congenital anomalies
l assessing the effectiveness of primary prevention and screening programs
l informing the need for additional primary prevention strategies or screening programs
l responding to concerns about potential clusters or trends in congenital anomalies.
The VCAR collects notifications of congenital anomalies in children from before birth to six years of age. This is because approximately 99 per cent of all major congenital anomalies are diagnosed during this period.5
Congenital anomalies can be notified to VCAR by completing an online notification form available at bettersafercare.vic.gov.au/ccopmm.
CONGENITAL ANOMALIES: MAJOR AND MINORThis report focuses on major congenital anomalies, which are generally defined as structural changes that have significant medical, social or cosmetic consequences, typically require medical intervention and are known to significantly contribute to perinatal and childhood morbidity, mortality and disability. These are listed in Appendix 1.
4 CCOPMM Congenital anomalies in Victoria 2015–2016
Minor congenital anomalies are structural changes that pose no significant health problem in the neonatal period and have limited social or cosmetic consequences. Minor congenital anomalies have been excluded from this report. Classification of these anomalies have primarily been based on the ‘External minor congenital anomalies’ table provided by the World Health Organization (WHO), United States Centers for Disease Control and Prevention (CDC) and the International Clearinghouse for Birth Defects Surveillance and Research (ICBDSR) (Appendix 2).6
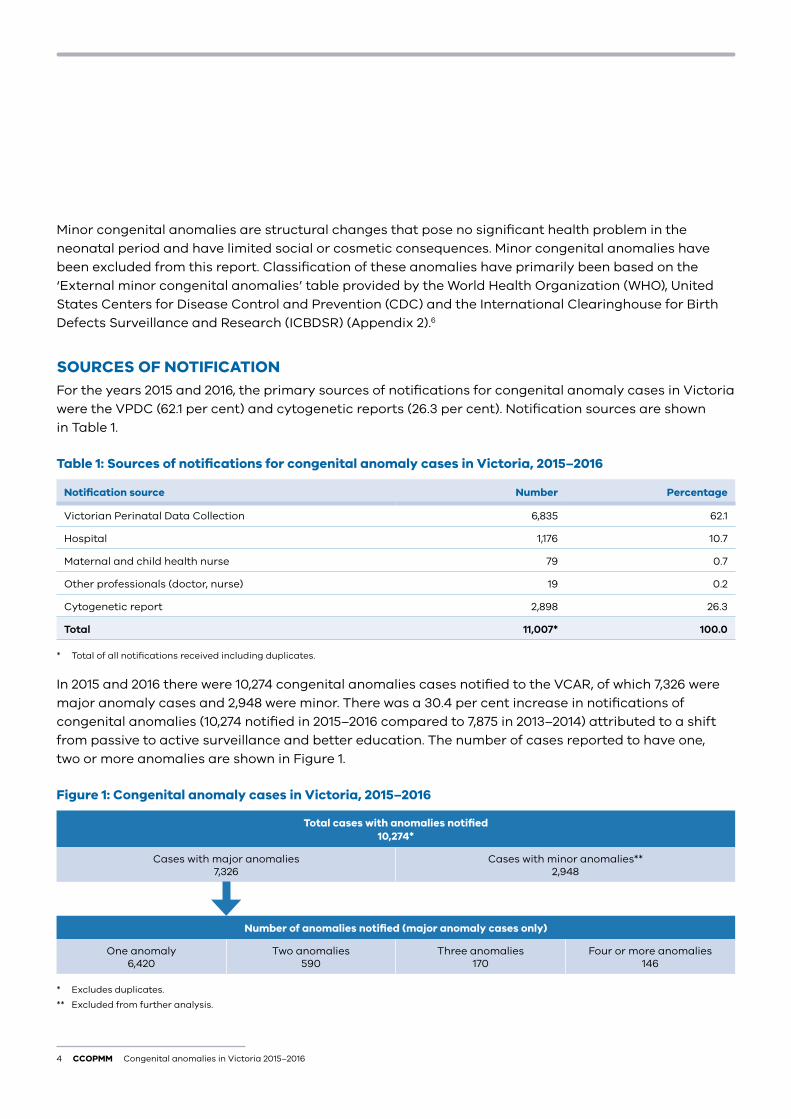
SOURCES OF NOTIFICATIONFor the years 2015 and 2016, the primary sources of notifications for congenital anomaly cases in Victoria were the VPDC (62.1 per cent) and cytogenetic reports (26.3 per cent). Notification sources are shown in Table 1.
Table 1: Sources of notifications for congenital anomaly cases in Victoria, 2015–2016
Notification source Number Percentage
Victorian Perinatal Data Collection 6,835 62.1
Hospital 1,176 10.7
Maternal and child health nurse 79 0.7
Other professionals (doctor, nurse) 19 0.2
Cytogenetic report 2,898 26.3
Total 11,007* 100.0
* Total of all notifications received including duplicates.
In 2015 and 2016 there were 10,274 congenital anomalies cases notified to the VCAR, of which 7,326 were major anomaly cases and 2,948 were minor. There was a 30.4 per cent increase in notifications of congenital anomalies (10,274 notified in 2015–2016 compared to 7,875 in 2013–2014) attributed to a shift from passive to active surveillance and better education. The number of cases reported to have one, two or more anomalies are shown in Figure 1.
Figure 1: Congenital anomaly cases in Victoria, 2015–2016
Total cases with anomalies notified 10,274*
Cases with major anomalies 7,326
Cases with minor anomalies** 2,948
Number of anomalies notified (major anomaly cases only)
One anomaly 6,420
Two anomalies 590
Three anomalies 170
Four or more anomalies 146
* Excludes duplicates.
** Excluded from further analysis.
Congenital anomalies in Victoria 2015–2016 CCOPMM 5
DATA ITEMSAll notifications of congenital anomalies reported to the VCAR (excluding terminations of pregnancy before 20 weeks’ gestation and interstate births) are linked to the VPDC to access the obstetric history for each case. Health services and maternity care providers must provide data to the VPDC for every birth in Victoria occurring after 20 weeks of gestation, or if the gestation is unknown, births of babies weighing more than 400 grams. Appendix 3 provides data items routinely collected in the VCAR and additional data items available for each case (more than 20 weeks’ gestation) as reported in the VPDC.7
DATA QUALITYData submitted to the VPDC and the VCAR are checked for completeness and validity. Further data cleaning is carried out when all data for the calendar year have been submitted.
Projects to determine the accuracy and completeness of data submitted to the VPDC and the VCAR are undertaken periodically.8–12 Ascertainment of congenital anomalies from terminations of pregnancy less than 20 weeks is incomplete because reporting of these is not mandated by legislation.
DATA ANALYSISThe 2015–2016 Victorian congenital anomaly rates are reported per 1,000 pregnancies for:
l all major congenital anomalies
l major congenital anomalies by maternal and child characteristics
l major congenital anomalies by diagnostic categories.
Major congenital anomalies, anomalies of the gastrointestinal system and chromosomal anomalies are reported by prevalence, trends and selected maternal and child characteristics. Relative risk (RR) and its 95 per cent confidence intervals (CI) have been calculated to assess the association of maternal and child characteristics with all congenital anomalies and selected anomalies. A p-value of less than 0.05 is considered statistically significant.
During the period 2010–2012 congenital anomaly data was collected but not analysed or reported due to resource limitations. As a result notifications decreased in subsequent years. This was reflected in the reduction in congenital anomalies reported in 2013–2014 and gave rise to possible differences in trends as noted in the 2013–2014 report. Notifications have now returned to higher levels due to improved surveillance.
6 CCOPMM Congenital anomalies in Victoria 2015–2016
TRENDS IN PRENATAL TESTING13
Advances in prenatal testing, such as the introduction of a non-invasive prenatal test (NIPT) and chromosome microarray (CMA), have resulted in significant changes in prenatal screening and testing in Victoria. The NIPT test, used to screen for common chromosome anomalies such as trisomies 13, 18 and 21, and combined first trimester screening (CFTS) have increased the ability to identify pregnancies at risk of a chromosomal anomaly. While this has led to a decrease in invasive procedures in pregnancies that are low risk for a chromosomal anomaly, pregnancies identified as high risk are confirmed by an invasive procedure such as chorionic villus sampling (CVS) and amniocentesis testing. This has led to an increase in detecting these anomalies through CVS and amniocentesis testing.
NIPT may include screening for a broader range of chromosomal conditions such as trisomies of all chromosomes as well as genetic changes such as deletions and duplications of chromosomes or parts thereof.
The introduction of CMA in 2011 has further improved detection and diagnosis of chromosomal anomalies. CMA, however, has the potential for uncertain or unknown genetic information of unknown significance. We all carry genetic changes, but in most cases these do not affect our health and wellbeing. It can be difficult to interpret results of uncertain or unknown significance.
The increase of chromosomal anomalies notified to VCAR for 2015–2016 may in part be attributed to improved screening and testing for chromosomal anomalies.
Congenital anomalies in Victoria 2015–2016 CCOPMM 7
Prevalence of congenital anomalies in Victoria
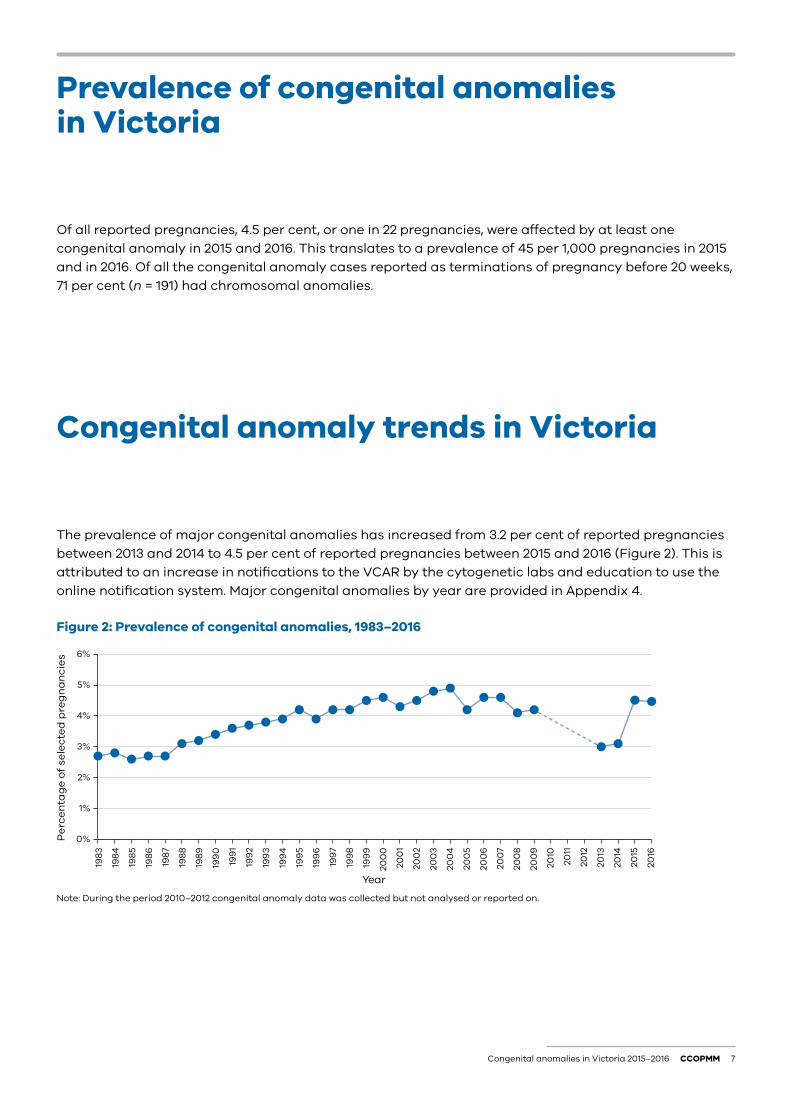
Of all reported pregnancies, 4.5 per cent, or one in 22 pregnancies, were affected by at least one congenital anomaly in 2015 and 2016. This translates to a prevalence of 45 per 1,000 pregnancies in 2015 and in 2016. Of all the congenital anomaly cases reported as terminations of pregnancy before 20 weeks, 71 per cent (n = 191) had chromosomal anomalies.
Congenital anomaly trends in Victoria
The prevalence of major congenital anomalies has increased from 3.2 per cent of reported pregnancies between 2013 and 2014 to 4.5 per cent of reported pregnancies between 2015 and 2016 (Figure 2). This is attributed to an increase in notifications to the VCAR by the cytogenetic labs and education to use the online notification system. Major congenital anomalies by year are provided in Appendix 4.
Figure 2: Prevalence of congenital anomalies, 1983–2016
0%
1%
2%
3%
4%
5%
6%20
16
2015
2014
2013
2012
2011
2010
200
9
200
8
200
7
200
6
200
5
200
4
200
3
200
2
200
1
200
0
199
9
199
8
199
7
199
6
199
5
199
4
199
3
199
2
199
1
199
0
198
9
198
8
198
7
198
6
198
5
198
4
198
3
Pe
rce
nta
ge
of
sele
cte
d p
reg
na
nci
es
Year Note: During the period 2010–2012 congenital anomaly data was collected but not analysed or reported on.
8 CCOPMM Congenital anomalies in Victoria 2015–2016
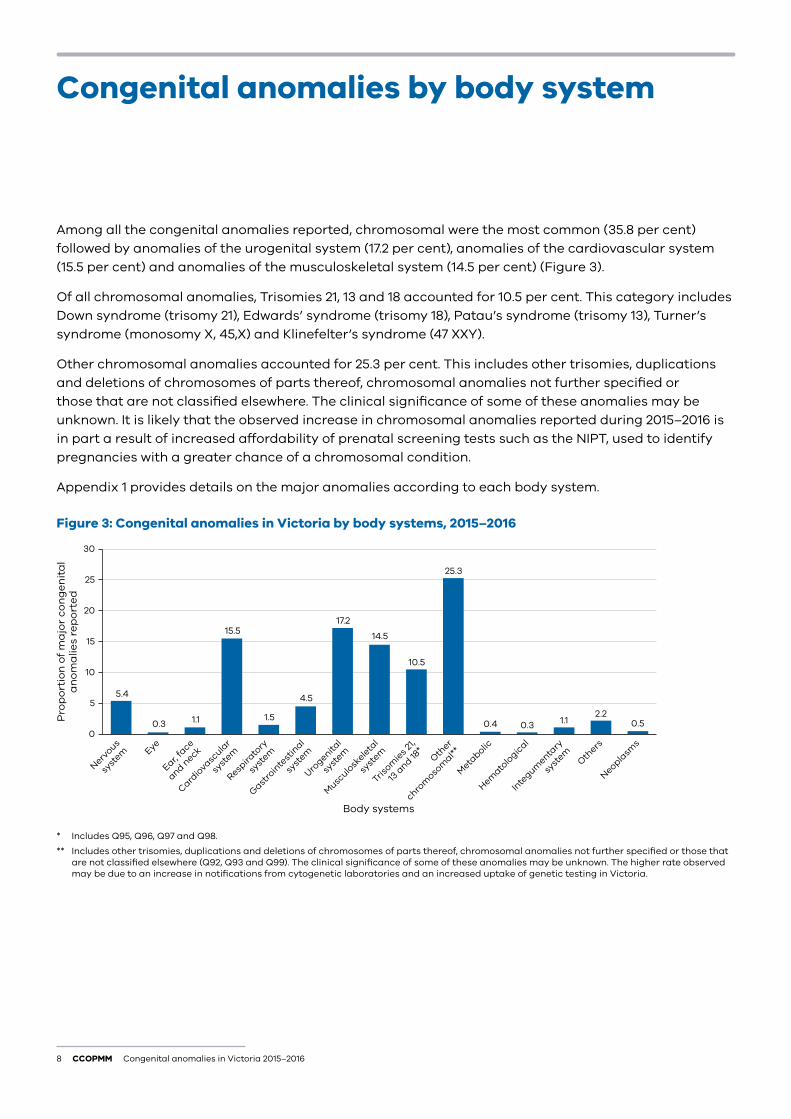
Among all the congenital anomalies reported, chromosomal were the most common (35.8 per cent) followed by anomalies of the urogenital system (17.2 per cent), anomalies of the cardiovascular system (15.5 per cent) and anomalies of the musculoskeletal system (14.5 per cent) (Figure 3).
Of all chromosomal anomalies, Trisomies 21, 13 and 18 accounted for 10.5 per cent. This category includes Down syndrome (trisomy 21), Edwards’ syndrome (trisomy 18), Patau’s syndrome (trisomy 13), Turner’s syndrome (monosomy X, 45,X) and Klinefelter’s syndrome (47 XXY).
Other chromosomal anomalies accounted for 25.3 per cent. This includes other trisomies, duplications and deletions of chromosomes of parts thereof, chromosomal anomalies not further specified or those that are not classified elsewhere. The clinical significance of some of these anomalies may be unknown. It is likely that the observed increase in chromosomal anomalies reported during 2015–2016 is in part a result of increased affordability of prenatal screening tests such as the NIPT, used to identify pregnancies with a greater chance of a chromosomal condition.
Appendix 1 provides details on the major anomalies according to each body system.
Figure 3: Congenital anomalies in Victoria by body systems, 2015–2016
0
5
10
15
20
25
30
Neoplasm
s
Others
Inte
gumenta
ry
syst
em
Hemato
logic
al
Meta
bolic
Other
chrom
osom
al**
Trisom
ies 2
1,
13 a
nd 18*
Musc
ulosk
eleta
l
syst
em
Urogenita
l
syst
em
Gastro
inte
stin
al
syst
em
Respira
tory
syst
em
Cardio
vascula
r
syst
em
Ear, fa
ce
and neckEye
Nervous
syst
em
Pro
po
rtio
n o
f m
ajo
r co
ng
en
ita
la
no
ma
lies
rep
ort
ed
Body systems
5.4
0.3 1.1
15.5
1.5
4.5
17.2
14.5
10.5
25.3
0.4 0.3 1.1 0.52.2
* Includes Q95, Q96, Q97 and Q98.
** Includes other trisomies, duplications and deletions of chromosomes of parts thereof, chromosomal anomalies not further specified or those that are not classified elsewhere (Q92, Q93 and Q99). The clinical significance of some of these anomalies may be unknown. The higher rate observed may be due to an increase in notifications from cytogenetic laboratories and an increased uptake of genetic testing in Victoria.
Congenital anomalies by body system
Congenital anomalies in Victoria 2015–2016 CCOPMM 9
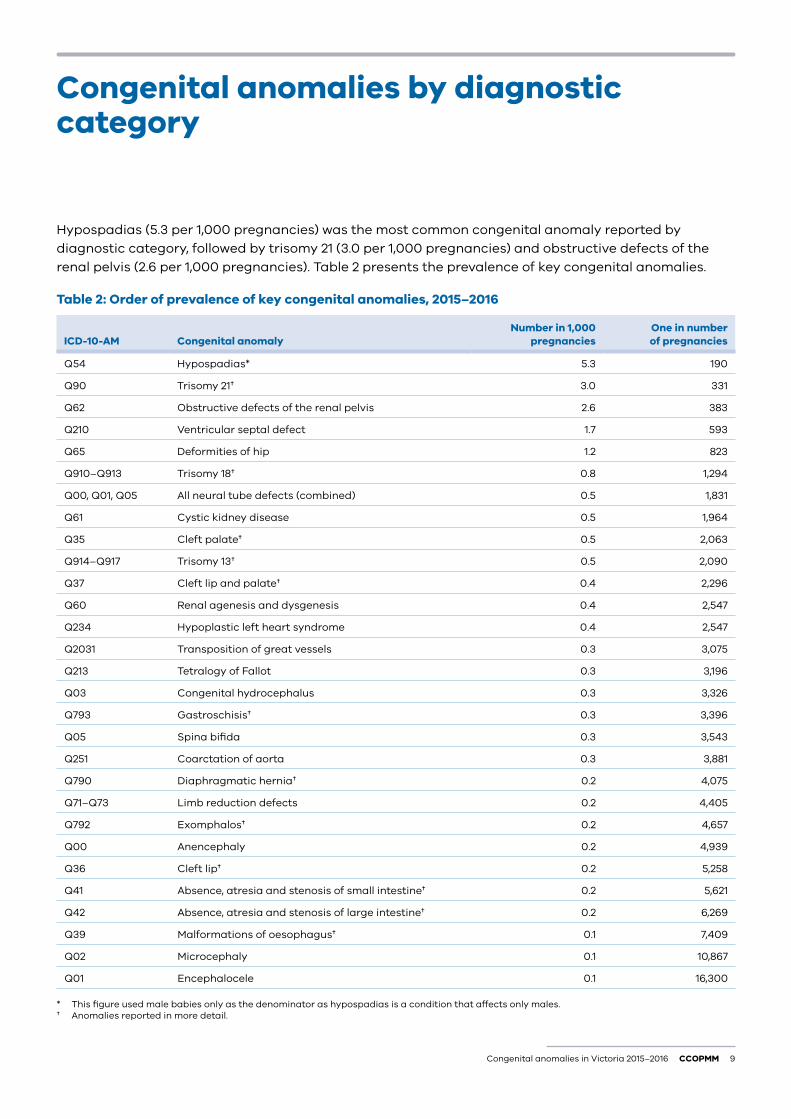
Hypospadias (5.3 per 1,000 pregnancies) was the most common congenital anomaly reported by diagnostic category, followed by trisomy 21 (3.0 per 1,000 pregnancies) and obstructive defects of the renal pelvis (2.6 per 1,000 pregnancies). Table 2 presents the prevalence of key congenital anomalies.
Table 2: Order of prevalence of key congenital anomalies, 2015–2016
ICD-10-AM Congenital anomalyNumber in 1,000
pregnanciesOne in number of pregnancies
Q54 Hypospadias* 5.3 190
Q90 Trisomy 21† 3.0 331
Q62 Obstructive defects of the renal pelvis 2.6 383
Q210 Ventricular septal defect 1.7 593
Q65 Deformities of hip 1.2 823
Q910–Q913 Trisomy 18† 0.8 1,294
Q00, Q01, Q05 All neural tube defects (combined) 0.5 1,831
Q61 Cystic kidney disease 0.5 1,964
Q35 Cleft palate† 0.5 2,063
Q914–Q917 Trisomy 13† 0.5 2,090
Q37 Cleft lip and palate† 0.4 2,296
Q60 Renal agenesis and dysgenesis 0.4 2,547
Q234 Hypoplastic left heart syndrome 0.4 2,547
Q2031 Transposition of great vessels 0.3 3,075
Q213 Tetralogy of Fallot 0.3 3,196
Q03 Congenital hydrocephalus 0.3 3,326
Q793 Gastroschisis† 0.3 3,396
Q05 Spina bifida 0.3 3,543
Q251 Coarctation of aorta 0.3 3,881
Q790 Diaphragmatic hernia† 0.2 4,075
Q71–Q73 Limb reduction defects 0.2 4,405
Q792 Exomphalos† 0.2 4,657
Q00 Anencephaly 0.2 4,939
Q36 Cleft lip† 0.2 5,258
Q41 Absence, atresia and stenosis of small intestine† 0.2 5,621
Q42 Absence, atresia and stenosis of large intestine† 0.2 6,269
Q39 Malformations of oesophagus† 0.1 7,409
Q02 Microcephaly 0.1 10,867
Q01 Encephalocele 0.1 16,300
* This figure used male babies only as the denominator as hypospadias is a condition that affects only males. † Anomalies reported in more detail.
Congenital anomalies by diagnostic category
10 CCOPMM Congenital anomalies in Victoria 2015–2016
Congenital anomalies by the child’s characteristics
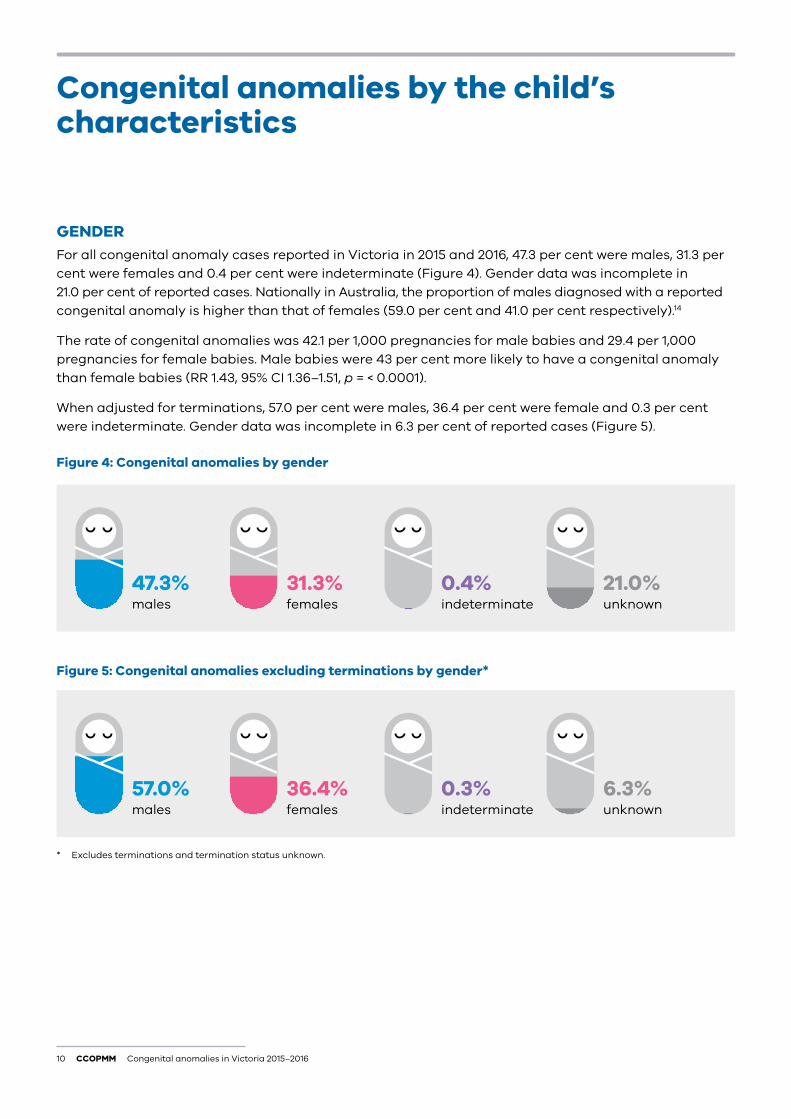
GENDER For all congenital anomaly cases reported in Victoria in 2015 and 2016, 47.3 per cent were males, 31.3 per cent were females and 0.4 per cent were indeterminate (Figure 4). Gender data was incomplete in 21.0 per cent of reported cases. Nationally in Australia, the proportion of males diagnosed with a reported congenital anomaly is higher than that of females (59.0 per cent and 41.0 per cent respectively).14
The rate of congenital anomalies was 42.1 per 1,000 pregnancies for male babies and 29.4 per 1,000 pregnancies for female babies. Male babies were 43 per cent more likely to have a congenital anomaly than female babies (RR 1.43, 95% CI 1.36–1.51, p = < 0.0001).
When adjusted for terminations, 57.0 per cent were males, 36.4 per cent were female and 0.3 per cent were indeterminate. Gender data was incomplete in 6.3 per cent of reported cases (Figure 5).
Figure 4: Congenital anomalies by gender
47.3% males
57.0% males
31.3% females
36.4% females
0.4% indeterminate
0.3% indeterminate
21.0% unknown
6.3% unknown
Figure 5: Congenital anomalies excluding terminations by gender*
* Excludes terminations and termination status unknown.
Congenital anomalies in Victoria 2015–2016 CCOPMM 11
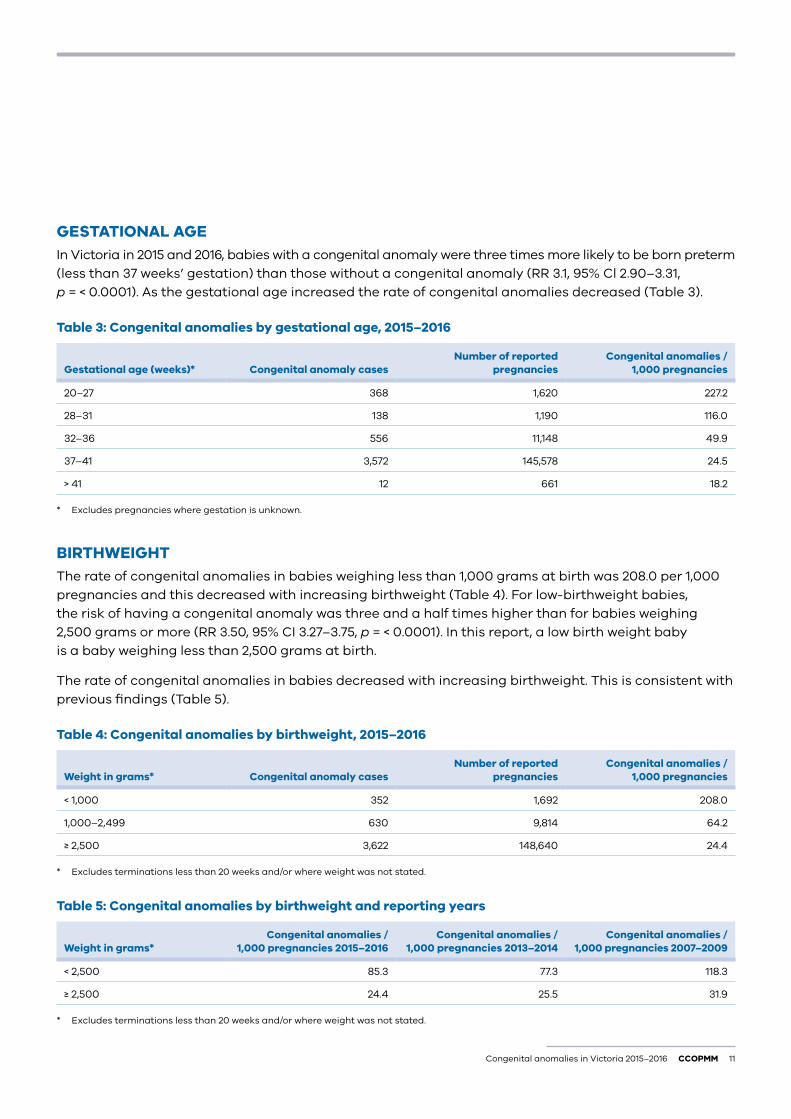
GESTATIONAL AGEIn Victoria in 2015 and 2016, babies with a congenital anomaly were three times more likely to be born preterm (less than 37 weeks’ gestation) than those without a congenital anomaly (RR 3.1, 95% Cl 2.90–3.31, p = < 0.0001). As the gestational age increased the rate of congenital anomalies decreased (Table 3).
Table 3: Congenital anomalies by gestational age, 2015–2016
Gestational age (weeks)* Congenital anomaly casesNumber of reported
pregnanciesCongenital anomalies /
1,000 pregnancies
20–27 368 1,620 227.2
28–31 138 1,190 116.0
32–36 556 11,148 49.9
37–41 3,572 145,578 24.5
> 41 12 661 18.2
* Excludes pregnancies where gestation is unknown.
BIRTHWEIGHTThe rate of congenital anomalies in babies weighing less than 1,000 grams at birth was 208.0 per 1,000 pregnancies and this decreased with increasing birthweight (Table 4). For low-birthweight babies, the risk of having a congenital anomaly was three and a half times higher than for babies weighing 2,500 grams or more (RR 3.50, 95% CI 3.27–3.75, p = < 0.0001). In this report, a low birth weight baby is a baby weighing less than 2,500 grams at birth.
The rate of congenital anomalies in babies decreased with increasing birthweight. This is consistent with previous findings (Table 5).
Table 4: Congenital anomalies by birthweight, 2015–2016
Weight in grams* Congenital anomaly casesNumber of reported
pregnanciesCongenital anomalies /
1,000 pregnancies
< 1,000 352 1,692 208.0
1,000–2,499 630 9,814 64.2
≥ 2,500 3,622 148,640 24.4
* Excludes terminations less than 20 weeks and/or where weight was not stated.
Table 5: Congenital anomalies by birthweight and reporting years
Weight in grams*Congenital anomalies /
1,000 pregnancies 2015–2016Congenital anomalies /
1,000 pregnancies 2013–2014Congenital anomalies /
1,000 pregnancies 2007–2009
< 2,500 85.3 77.3 118.3
≥ 2,500 24.4 25.5 31.9
* Excludes terminations less than 20 weeks and/or where weight was not stated.
12 CCOPMM Congenital anomalies in Victoria 2015–2016
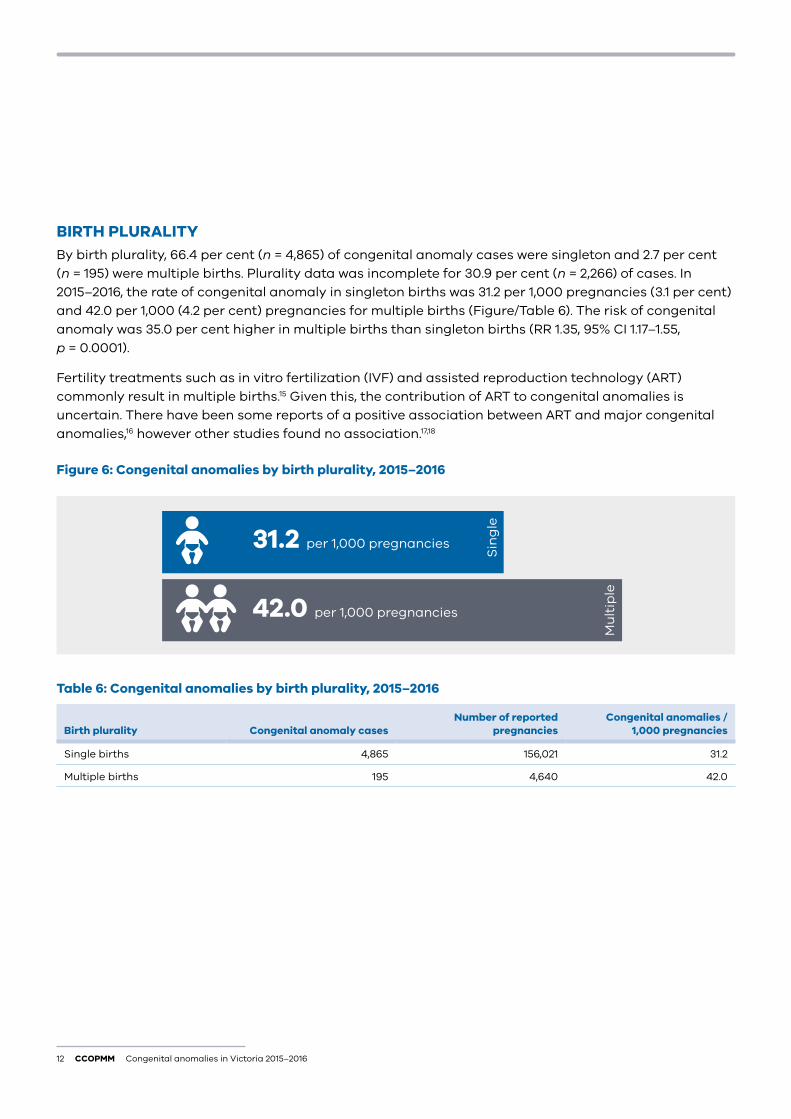
BIRTH PLURALITYBy birth plurality, 66.4 per cent (n = 4,865) of congenital anomaly cases were singleton and 2.7 per cent (n = 195) were multiple births. Plurality data was incomplete for 30.9 per cent (n = 2,266) of cases. In 2015–2016, the rate of congenital anomaly in singleton births was 31.2 per 1,000 pregnancies (3.1 per cent) and 42.0 per 1,000 (4.2 per cent) pregnancies for multiple births (Figure/Table 6). The risk of congenital anomaly was 35.0 per cent higher in multiple births than singleton births (RR 1.35, 95% CI 1.17–1.55, p = 0.0001).
Fertility treatments such as in vitro fertilization (IVF) and assisted reproduction technology (ART) commonly result in multiple births.15 Given this, the contribution of ART to congenital anomalies is uncertain. There have been some reports of a positive association between ART and major congenital anomalies,16 however other studies found no association.17,18
Figure 6: Congenital anomalies by birth plurality, 2015–2016
31.2 per 1,000 pregnancies
42.0 per 1,000 pregnancies
Sin
gle
Mu
ltip
le
Table 6: Congenital anomalies by birth plurality, 2015–2016
Birth plurality Congenital anomaly casesNumber of reported
pregnanciesCongenital anomalies /
1,000 pregnancies
Single births 4,865 156,021 31.2
Multiple births 195 4,640 42.0
Congenital anomalies in Victoria 2015–2016 CCOPMM 13
PERINATAL OUTCOMESIn 2015–16, the perinatal mortality rate (excluding terminations) in babies with one or more congenital anomalies was 22.0 per 1,000 pregnancies compared with 6.3 per 1,000 pregnancies for babies not having a congenital anomaly.
Pregnancies with congenital anomalies were four times more likely to result in perinatal death (excluding terminations) compared with pregnancies with babies not having a congenital anomaly (RR 4.07, 95% CI 3.45–4.80) p = < 0.0001.
Of all reported pregnancies with congenital anomalies, 17.7 per cent (n = 1,300) resulted in termination – 3.7 per cent (n = 269) before 20 weeks’ gestation, 3.9 per cent (n = 284) after 20 weeks and the gestation period was unknown in 10.5 per cent (n = 747) of cases. More than two-thirds (67.1 per cent, n = 4,913) of reported pregnancies with congenital anomalies resulted in a live birth. Of these, 1.3 per cent died before 28 days of age (neonatal death, n = 64). Still birth occurred in 1.3 per cent (n = 97) of reported pregnancies with congenital anomalies. Perinatal outcome data was incomplete for 13.9 per cent of births (n = 1,016). Appendix 5 shows perinatal outcomes for selected major anomalies.
14 CCOPMM Congenital anomalies in Victoria 2015–2016
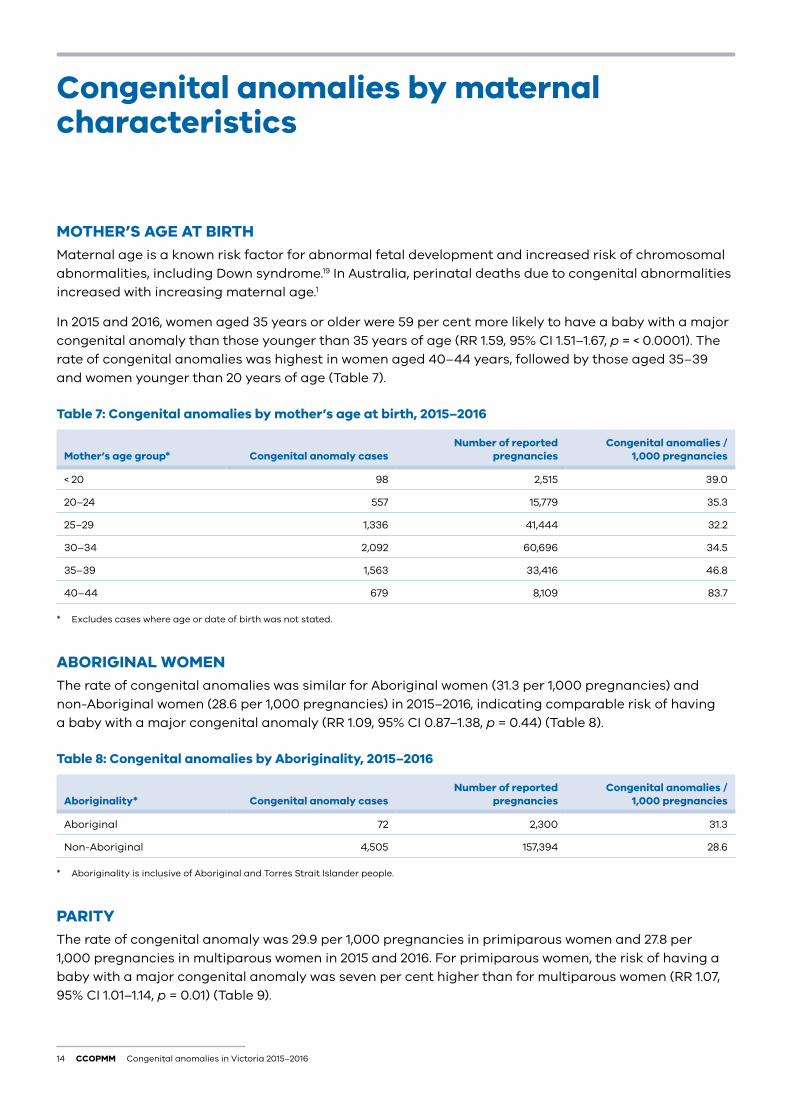
MOTHER’S AGE AT BIRTHMaternal age is a known risk factor for abnormal fetal development and increased risk of chromosomal abnormalities, including Down syndrome.19 In Australia, perinatal deaths due to congenital abnormalities increased with increasing maternal age.1
In 2015 and 2016, women aged 35 years or older were 59 per cent more likely to have a baby with a major congenital anomaly than those younger than 35 years of age (RR 1.59, 95% CI 1.51–1.67, p = < 0.0001). The rate of congenital anomalies was highest in women aged 40–44 years, followed by those aged 35–39 and women younger than 20 years of age (Table 7).
Table 7: Congenital anomalies by mother’s age at birth, 2015–2016
Mother’s age group* Congenital anomaly casesNumber of reported
pregnanciesCongenital anomalies /
1,000 pregnancies
< 20 98 2,515 39.0
20–24 557 15,779 35.3
25–29 1,336 41,444 32.2
30–34 2,092 60,696 34.5
35–39 1,563 33,416 46.8
40–44 679 8,109 83.7
* Excludes cases where age or date of birth was not stated.
ABORIGINAL WOMENThe rate of congenital anomalies was similar for Aboriginal women (31.3 per 1,000 pregnancies) and non-Aboriginal women (28.6 per 1,000 pregnancies) in 2015–2016, indicating comparable risk of having a baby with a major congenital anomaly (RR 1.09, 95% CI 0.87–1.38, p = 0.44) (Table 8).
Table 8: Congenital anomalies by Aboriginality, 2015–2016
Aboriginality* Congenital anomaly casesNumber of reported
pregnanciesCongenital anomalies /
1,000 pregnancies
Aboriginal 72 2,300 31.3
Non-Aboriginal 4,505 157,394 28.6
* Aboriginality is inclusive of Aboriginal and Torres Strait Islander people.
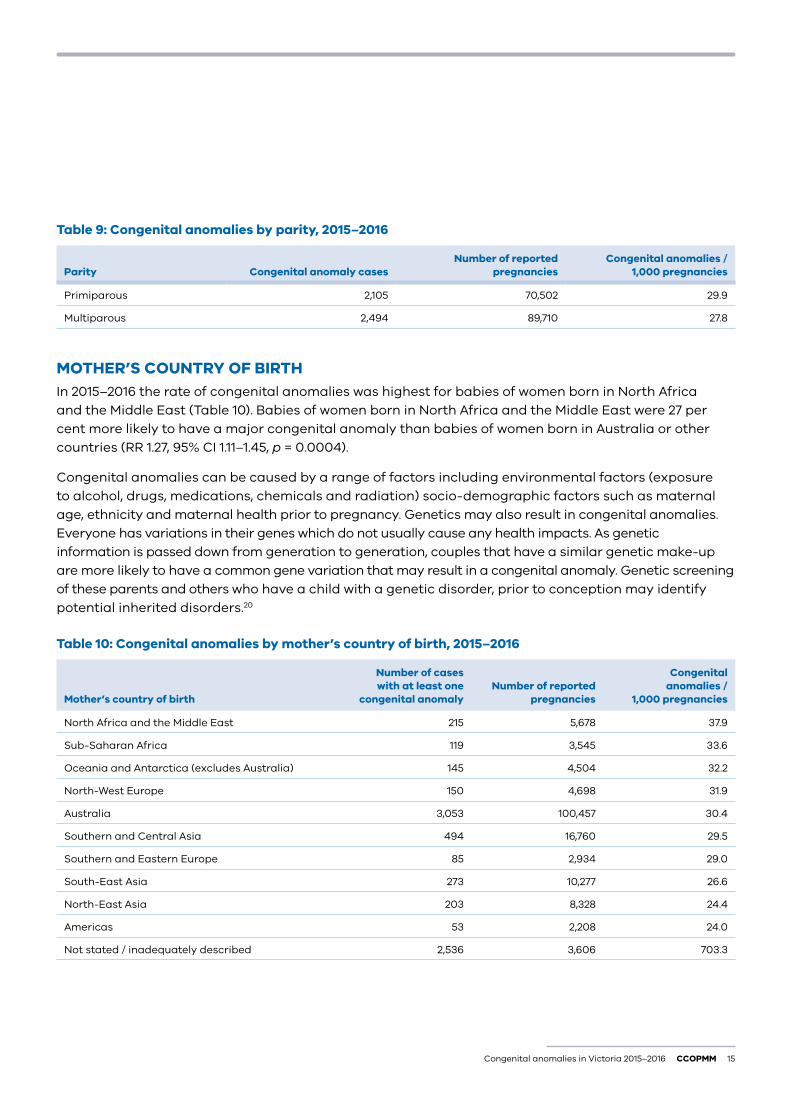
PARITYThe rate of congenital anomaly was 29.9 per 1,000 pregnancies in primiparous women and 27.8 per 1,000 pregnancies in multiparous women in 2015 and 2016. For primiparous women, the risk of having a baby with a major congenital anomaly was seven per cent higher than for multiparous women (RR 1.07, 95% CI 1.01–1.14, p = 0.01) (Table 9).
Congenital anomalies by maternal characteristics
Congenital anomalies in Victoria 2015–2016 CCOPMM 15
Table 9: Congenital anomalies by parity, 2015–2016
Parity Congenital anomaly casesNumber of reported
pregnanciesCongenital anomalies /
1,000 pregnancies
Primiparous 2,105 70,502 29.9
Multiparous 2,494 89,710 27.8
MOTHER’S COUNTRY OF BIRTHIn 2015–2016 the rate of congenital anomalies was highest for babies of women born in North Africa and the Middle East (Table 10). Babies of women born in North Africa and the Middle East were 27 per cent more likely to have a major congenital anomaly than babies of women born in Australia or other countries (RR 1.27, 95% CI 1.11–1.45, p = 0.0004).
Congenital anomalies can be caused by a range of factors including environmental factors (exposure to alcohol, drugs, medications, chemicals and radiation) socio-demographic factors such as maternal age, ethnicity and maternal health prior to pregnancy. Genetics may also result in congenital anomalies. Everyone has variations in their genes which do not usually cause any health impacts. As genetic information is passed down from generation to generation, couples that have a similar genetic make-up are more likely to have a common gene variation that may result in a congenital anomaly. Genetic screening of these parents and others who have a child with a genetic disorder, prior to conception may identify potential inherited disorders.20
Table 10: Congenital anomalies by mother’s country of birth, 2015–2016
Mother’s country of birth
Number of cases with at least one
congenital anomalyNumber of reported
pregnancies
Congenital anomalies /
1,000 pregnancies
North Africa and the Middle East 215 5,678 37.9
Sub-Saharan Africa 119 3,545 33.6
Oceania and Antarctica (excludes Australia) 145 4,504 32.2
North-West Europe 150 4,698 31.9
Australia 3,053 100,457 30.4
Southern and Central Asia 494 16,760 29.5
Southern and Eastern Europe 85 2,934 29.0
South-East Asia 273 10,277 26.6
North-East Asia 203 8,328 24.4
Americas 53 2,208 24.0
Not stated / inadequately described 2,536 3,606 703.3
16 CCOPMM Congenital anomalies in Victoria 2015–2016
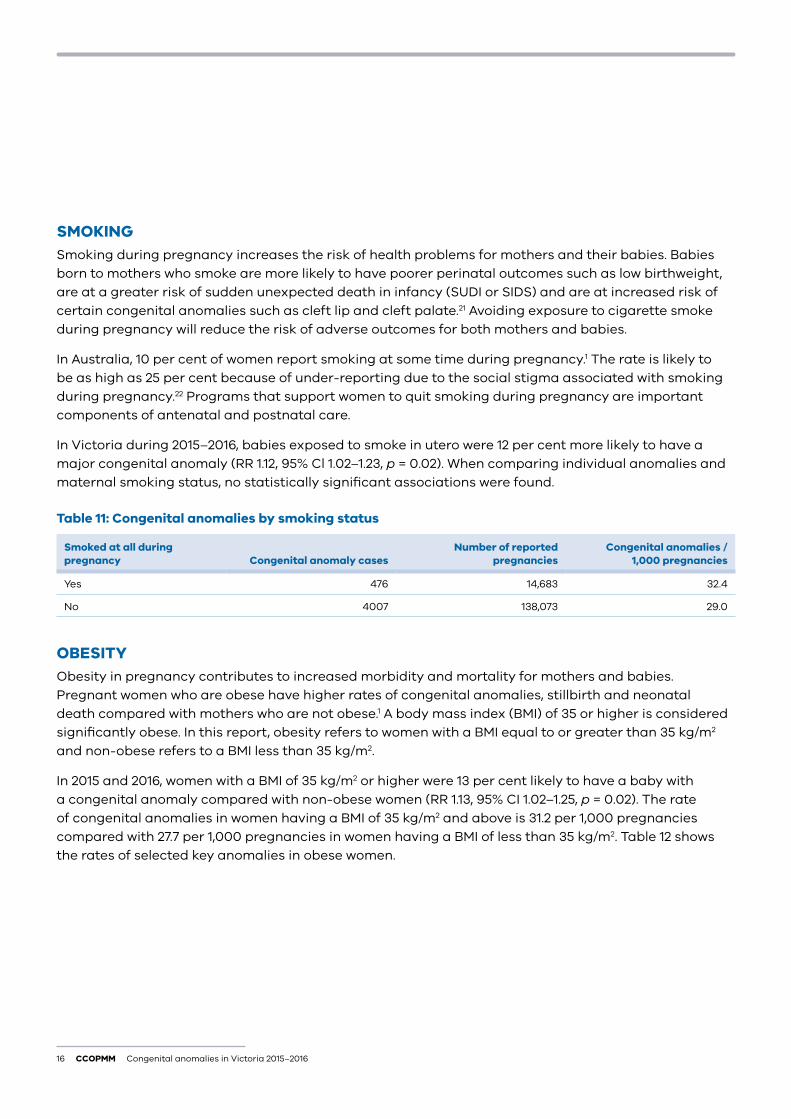
SMOKINGSmoking during pregnancy increases the risk of health problems for mothers and their babies. Babies born to mothers who smoke are more likely to have poorer perinatal outcomes such as low birthweight, are at a greater risk of sudden unexpected death in infancy (SUDI or SIDS) and are at increased risk of certain congenital anomalies such as cleft lip and cleft palate.21 Avoiding exposure to cigarette smoke during pregnancy will reduce the risk of adverse outcomes for both mothers and babies.
In Australia, 10 per cent of women report smoking at some time during pregnancy.1 The rate is likely to be as high as 25 per cent because of under-reporting due to the social stigma associated with smoking during pregnancy.22 Programs that support women to quit smoking during pregnancy are important components of antenatal and postnatal care.
In Victoria during 2015–2016, babies exposed to smoke in utero were 12 per cent more likely to have a major congenital anomaly (RR 1.12, 95% Cl 1.02–1.23, p = 0.02). When comparing individual anomalies and maternal smoking status, no statistically significant associations were found.
Table 11: Congenital anomalies by smoking status
Smoked at all during pregnancy Congenital anomaly cases
Number of reported pregnancies
Congenital anomalies / 1,000 pregnancies
Yes 476 14,683 32.4
No 4007 138,073 29.0
OBESITYObesity in pregnancy contributes to increased morbidity and mortality for mothers and babies. Pregnant women who are obese have higher rates of congenital anomalies, stillbirth and neonatal death compared with mothers who are not obese.1 A body mass index (BMI) of 35 or higher is considered significantly obese. In this report, obesity refers to women with a BMI equal to or greater than 35 kg/m2 and non-obese refers to a BMI less than 35 kg/m2.
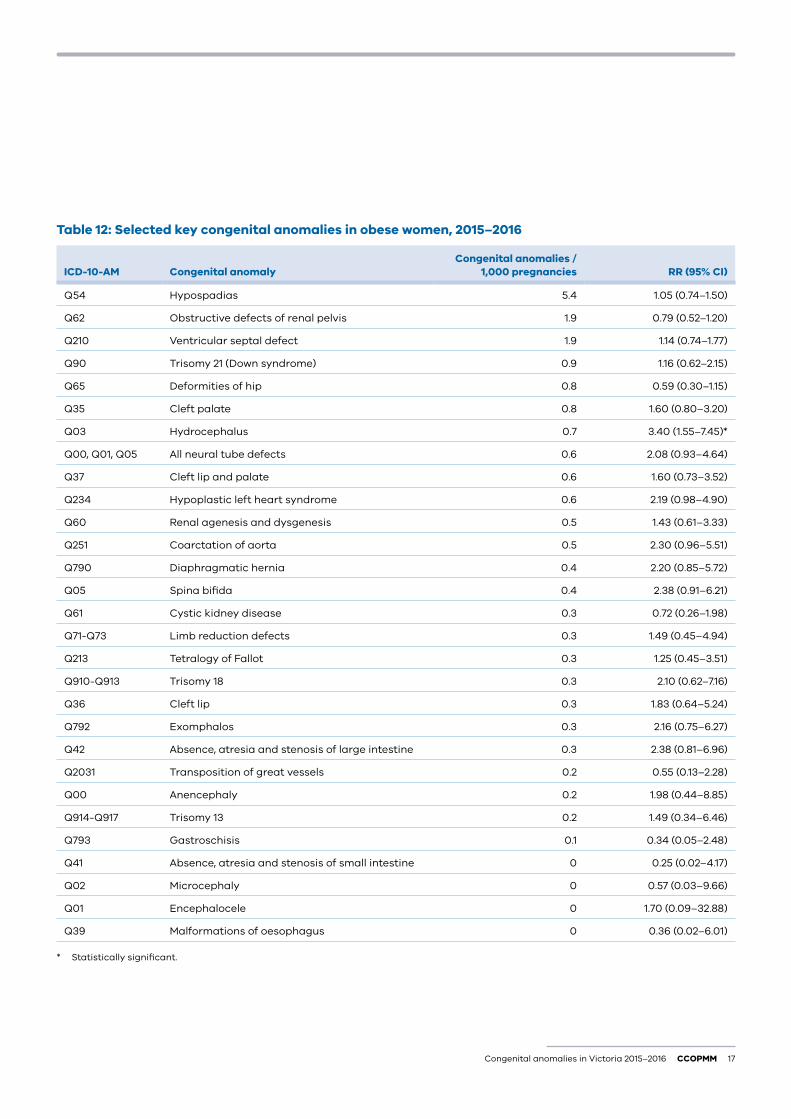
In 2015 and 2016, women with a BMI of 35 kg/m2 or higher were 13 per cent likely to have a baby with a congenital anomaly compared with non-obese women (RR 1.13, 95% CI 1.02–1.25, p = 0.02). The rate of congenital anomalies in women having a BMI of 35 kg/m2 and above is 31.2 per 1,000 pregnancies compared with 27.7 per 1,000 pregnancies in women having a BMI of less than 35 kg/m2. Table 12 shows the rates of selected key anomalies in obese women.
Congenital anomalies in Victoria 2015–2016 CCOPMM 17
Table 12: Selected key congenital anomalies in obese women, 2015–2016
ICD-10-AM Congenital anomalyCongenital anomalies /
1,000 pregnancies RR (95% CI)
Q54 Hypospadias 5.4 1.05 (0.74–1.50)
Q62 Obstructive defects of renal pelvis 1.9 0.79 (0.52–1.20)
Q210 Ventricular septal defect 1.9 1.14 (0.74–1.77)
Q90 Trisomy 21 (Down syndrome) 0.9 1.16 (0.62–2.15)
Q65 Deformities of hip 0.8 0.59 (0.30–1.15)
Q35 Cleft palate 0.8 1.60 (0.80–3.20)
Q03 Hydrocephalus 0.7 3.40 (1.55–7.45)*
Q00, Q01, Q05 All neural tube defects 0.6 2.08 (0.93–4.64)
Q37 Cleft lip and palate 0.6 1.60 (0.73–3.52)
Q234 Hypoplastic left heart syndrome 0.6 2.19 (0.98–4.90)
Q60 Renal agenesis and dysgenesis 0.5 1.43 (0.61–3.33)
Q251 Coarctation of aorta 0.5 2.30 (0.96–5.51)
Q790 Diaphragmatic hernia 0.4 2.20 (0.85–5.72)
Q05 Spina bifida 0.4 2.38 (0.91–6.21)
Q61 Cystic kidney disease 0.3 0.72 (0.26–1.98)
Q71-Q73 Limb reduction defects 0.3 1.49 (0.45–4.94)
Q213 Tetralogy of Fallot 0.3 1.25 (0.45–3.51)
Q910-Q913 Trisomy 18 0.3 2.10 (0.62–7.16)
Q36 Cleft lip 0.3 1.83 (0.64–5.24)
Q792 Exomphalos 0.3 2.16 (0.75–6.27)
Q42 Absence, atresia and stenosis of large intestine 0.3 2.38 (0.81–6.96)
Q2031 Transposition of great vessels 0.2 0.55 (0.13–2.28)
Q00 Anencephaly 0.2 1.98 (0.44–8.85)
Q914-Q917 Trisomy 13 0.2 1.49 (0.34–6.46)
Q793 Gastroschisis 0.1 0.34 (0.05–2.48)
Q41 Absence, atresia and stenosis of small intestine 0 0.25 (0.02–4.17)
Q02 Microcephaly 0 0.57 (0.03–9.66)
Q01 Encephalocele 0 1.70 (0.09–32.88)
Q39 Malformations of oesophagus 0 0.36 (0.02–6.01)
* Statistically significant.
18 CCOPMM Congenital anomalies in Victoria 2015–2016
PRE-GESTATIONAL DIABETESWomen who have pre-gestational diabetes are at increased risk of adverse perinatal outcomes.23 Controlling maternal glycaemia before and particularly in early pregnancy (during fetal organ development) through counselling, weight management, diet and appropriate hypoglycaemic therapy may decrease the frequency of certain congenital anomalies.24 As these mothers have been found to be at increased risk of neural tube anomalies, prophylactic folate therapy of 1–5mg daily is essential.24 Aboriginal mothers are also more likely to be obese or to have pre-existing diabetes.1
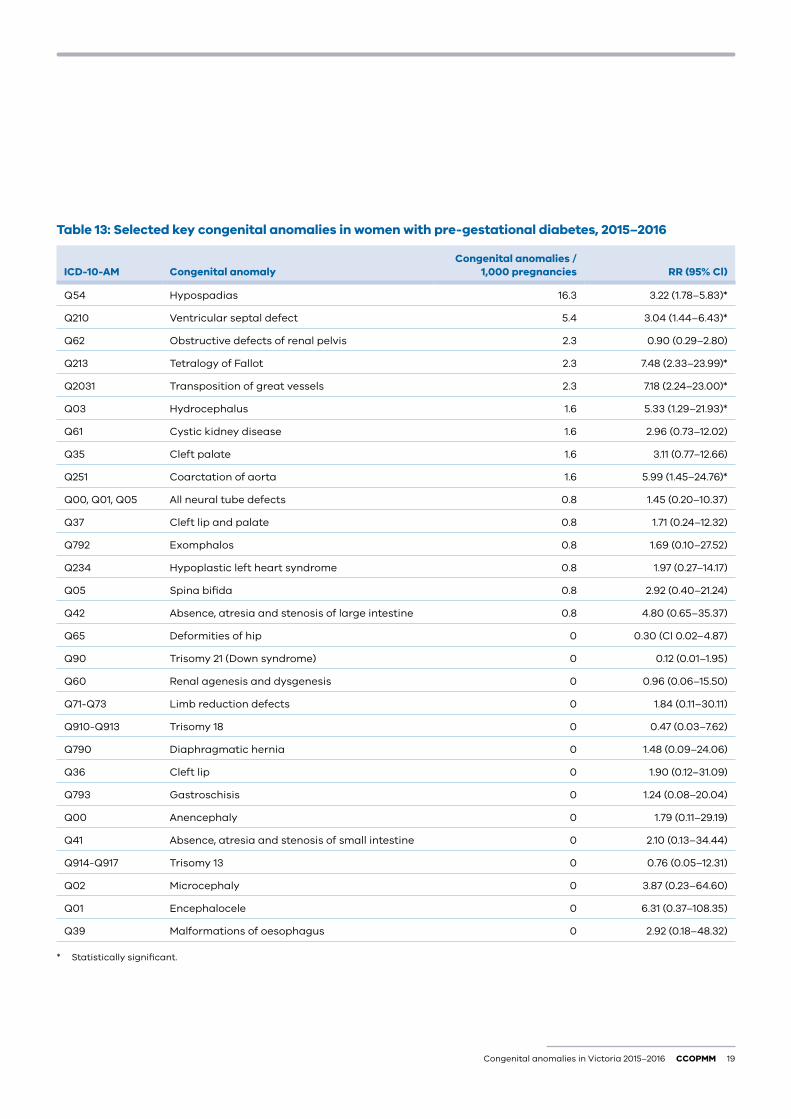
In 2015 and 2016, women having pre-gestational diabetes were 43 per cent more likely to have a baby with a congenital anomaly compared with women not having pre-gestational diabetes (RR 1.43, 95% CI 1.17–1.75, p = 0.0006). The rate of congenital anomalies in babies born to women having pre-gestational diabetes was 64.7 per 1,000 pregnancies compared with 44.8 per 1,000 pregnancies in women not having pre-gestational diabetes. Table 13 shows the rates of selected key anomalies in mothers with pre-gestational diabetes.
Women with pre-gestational diabetes were 43 per cent more likely to have a baby with a congenital anomaly compared to women not having pre-gestational diabetes.
Congenital anomalies in Victoria 2015–2016 CCOPMM 19
Table 13: Selected key congenital anomalies in women with pre-gestational diabetes, 2015–2016
ICD-10-AM Congenital anomalyCongenital anomalies /
1,000 pregnancies RR (95% Cl)
Q54 Hypospadias 16.3 3.22 (1.78–5.83)*
Q210 Ventricular septal defect 5.4 3.04 (1.44–6.43)*
Q62 Obstructive defects of renal pelvis 2.3 0.90 (0.29–2.80)
Q213 Tetralogy of Fallot 2.3 7.48 (2.33–23.99)*
Q2031 Transposition of great vessels 2.3 7.18 (2.24–23.00)*
Q03 Hydrocephalus 1.6 5.33 (1.29–21.93)*
Q61 Cystic kidney disease 1.6 2.96 (0.73–12.02)
Q35 Cleft palate 1.6 3.11 (0.77–12.66)
Q251 Coarctation of aorta 1.6 5.99 (1.45–24.76)*
Q00, Q01, Q05 All neural tube defects 0.8 1.45 (0.20–10.37)
Q37 Cleft lip and palate 0.8 1.71 (0.24–12.32)
Q792 Exomphalos 0.8 1.69 (0.10–27.52)
Q234 Hypoplastic left heart syndrome 0.8 1.97 (0.27–14.17)
Q05 Spina bifida 0.8 2.92 (0.40–21.24)
Q42 Absence, atresia and stenosis of large intestine 0.8 4.80 (0.65–35.37)
Q65 Deformities of hip 0 0.30 (Cl 0.02–4.87)
Q90 Trisomy 21 (Down syndrome) 0 0.12 (0.01–1.95)
Q60 Renal agenesis and dysgenesis 0 0.96 (0.06–15.50)
Q71-Q73 Limb reduction defects 0 1.84 (0.11–30.11)
Q910-Q913 Trisomy 18 0 0.47 (0.03–7.62)
Q790 Diaphragmatic hernia 0 1.48 (0.09–24.06)
Q36 Cleft lip 0 1.90 (0.12–31.09)
Q793 Gastroschisis 0 1.24 (0.08–20.04)
Q00 Anencephaly 0 1.79 (0.11–29.19)
Q41 Absence, atresia and stenosis of small intestine 0 2.10 (0.13–34.44)
Q914-Q917 Trisomy 13 0 0.76 (0.05–12.31)
Q02 Microcephaly 0 3.87 (0.23–64.60)
Q01 Encephalocele 0 6.31 (0.37–108.35)
Q39 Malformations of oesophagus 0 2.92 (0.18–48.32)
* Statistically significant.
20 CCOPMM Congenital anomalies in Victoria 2015–2016
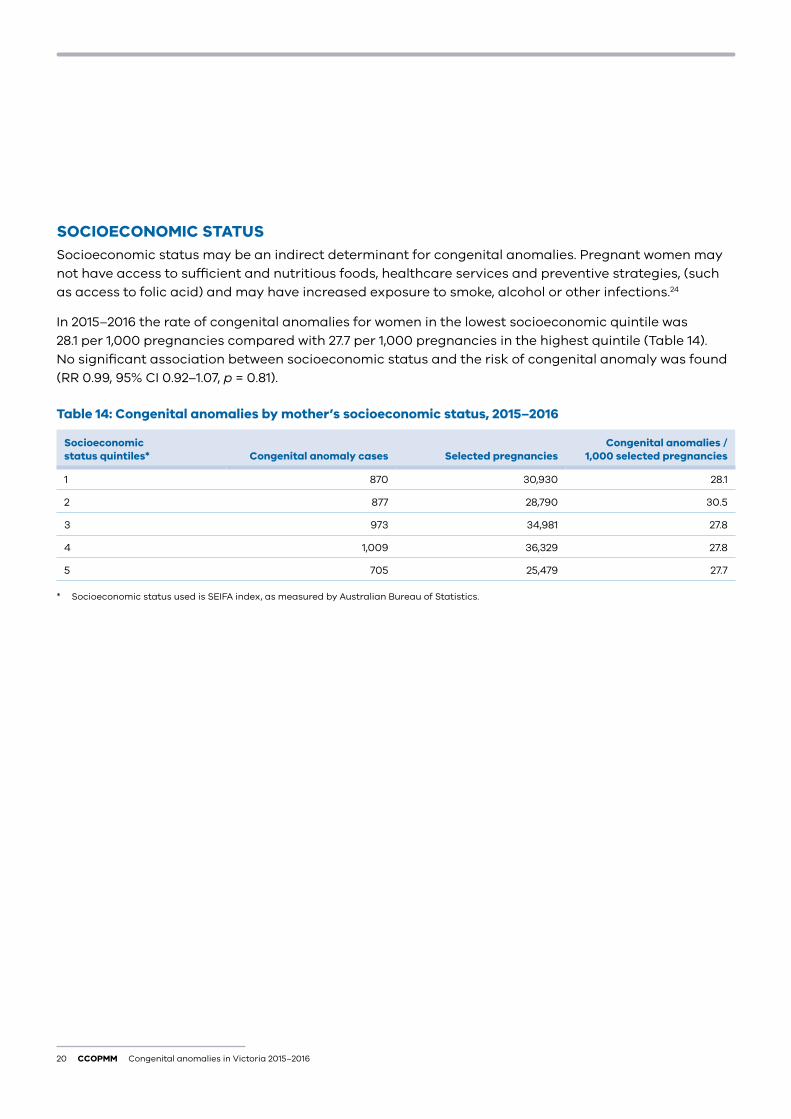
SOCIOECONOMIC STATUSSocioeconomic status may be an indirect determinant for congenital anomalies. Pregnant women may not have access to sufficient and nutritious foods, healthcare services and preventive strategies, (such as access to folic acid) and may have increased exposure to smoke, alcohol or other infections.24
In 2015–2016 the rate of congenital anomalies for women in the lowest socioeconomic quintile was 28.1 per 1,000 pregnancies compared with 27.7 per 1,000 pregnancies in the highest quintile (Table 14). No significant association between socioeconomic status and the risk of congenital anomaly was found (RR 0.99, 95% CI 0.92–1.07, p = 0.81).
Table 14: Congenital anomalies by mother’s socioeconomic status, 2015–2016
Socioeconomic status quintiles* Congenital anomaly cases Selected pregnancies
Congenital anomalies / 1,000 selected pregnancies
1 870 30,930 28.1
2 877 28,790 30.5
3 973 34,981 27.8
4 1,009 36,329 27.8
5 705 25,479 27.7
* Socioeconomic status used is SEIFA index, as measured by Australian Bureau of Statistics.
Congenital anomalies in Victoria 2015–2016 CCOPMM 21
Selected congenital anomalies
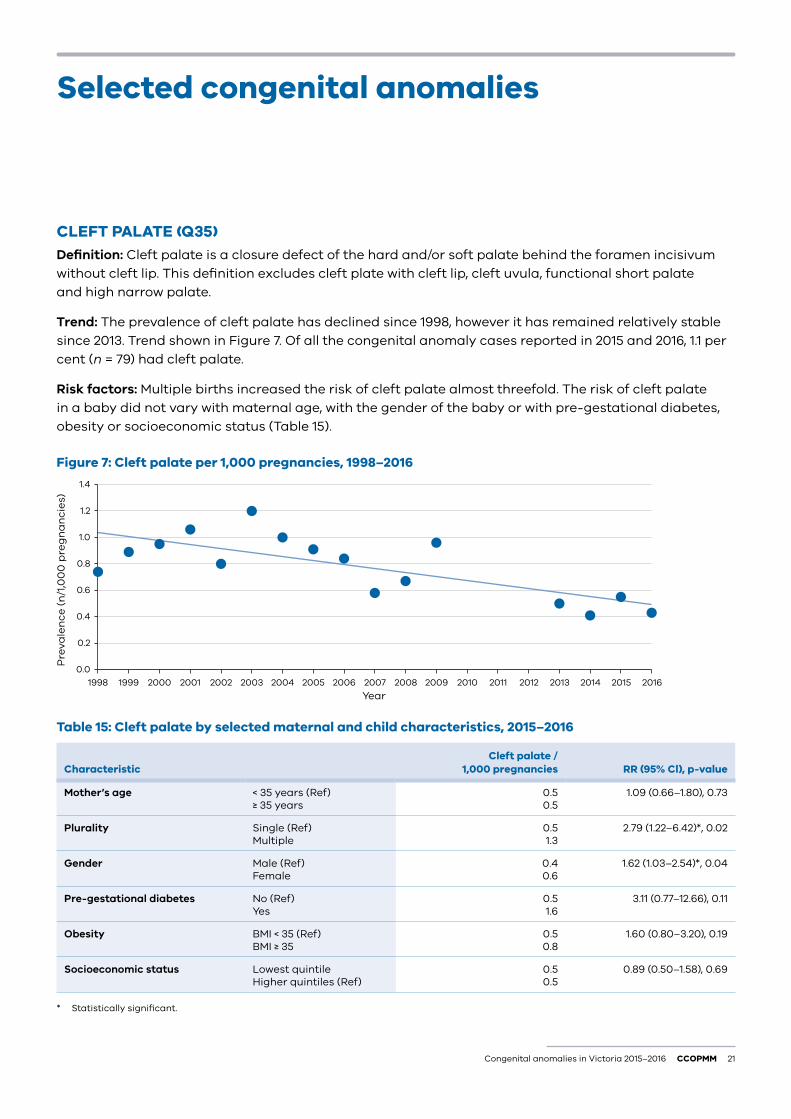
CLEFT PALATE (Q35)Definition: Cleft palate is a closure defect of the hard and/or soft palate behind the foramen incisivum without cleft lip. This definition excludes cleft plate with cleft lip, cleft uvula, functional short palate and high narrow palate.
Trend: The prevalence of cleft palate has declined since 1998, however it has remained relatively stable since 2013. Trend shown in Figure 7. Of all the congenital anomaly cases reported in 2015 and 2016, 1.1 per cent (n = 79) had cleft palate.
Risk factors: Multiple births increased the risk of cleft palate almost threefold. The risk of cleft palate in a baby did not vary with maternal age, with the gender of the baby or with pre-gestational diabetes, obesity or socioeconomic status (Table 15).
Figure 7: Cleft palate per 1,000 pregnancies, 1998–2016
0.0
0.2
0.4
0.6
0.8
1.0
1.2
1.4
2016201520142013201220112010200920082007200620052004200320022001200019991998
Pre
vale
nce
(n
/1,0
00
pre
gn
an
cie
s)
Year
Table 15: Cleft palate by selected maternal and child characteristics, 2015–2016
CharacteristicCleft palate /
1,000 pregnancies RR (95% Cl), p-value
Mother’s age < 35 years (Ref) ≥ 35 years
0.50.5
1.09 (0.66–1.80), 0.73
Plurality Single (Ref) Multiple
0.51.3
2.79 (1.22–6.42)*, 0.02
Gender Male (Ref) Female
0.40.6
1.62 (1.03–2.54)*, 0.04
Pre-gestational diabetes No (Ref) Yes
0.51.6
3.11 (0.77–12.66), 0.11
Obesity BMI < 35 (Ref) BMI ≥ 35
0.50.8
1.60 (0.80–3.20), 0.19
Socioeconomic status Lowest quintileHigher quintiles (Ref)
0.50.5
0.89 (0.50–1.58), 0.69
* Statistically significant.
22 CCOPMM Congenital anomalies in Victoria 2015–2016
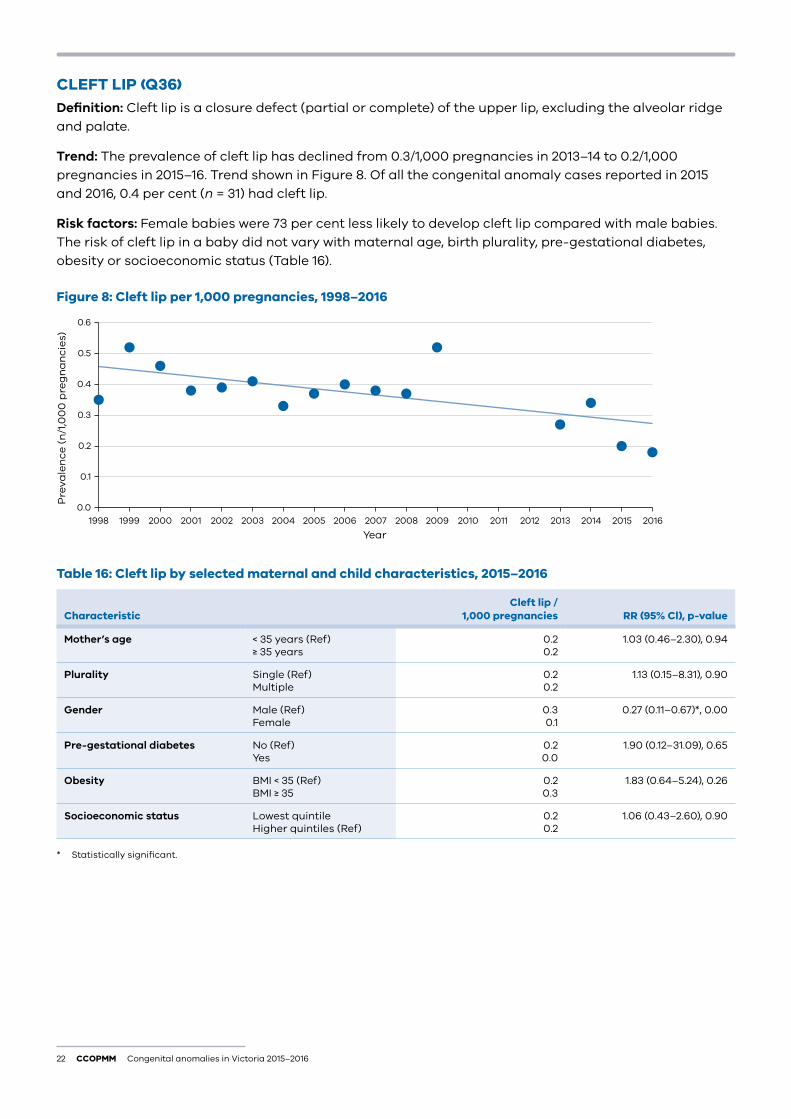
CLEFT LIP (Q36)Definition: Cleft lip is a closure defect (partial or complete) of the upper lip, excluding the alveolar ridge and palate.
Trend: The prevalence of cleft lip has declined from 0.3/1,000 pregnancies in 2013–14 to 0.2/1,000 pregnancies in 2015–16. Trend shown in Figure 8. Of all the congenital anomaly cases reported in 2015 and 2016, 0.4 per cent (n = 31) had cleft lip.
Risk factors: Female babies were 73 per cent less likely to develop cleft lip compared with male babies. The risk of cleft lip in a baby did not vary with maternal age, birth plurality, pre-gestational diabetes, obesity or socioeconomic status (Table 16).
Figure 8: Cleft lip per 1,000 pregnancies, 1998–2016
0.0
0.1
0.2
0.3
0.4
0.5
0.6
Pre
vale
nce
(n
/1,0
00
pre
gn
an
cie
s)
Year2016201520142013201220112010200920082007200620052004200320022001200019991998
Table 16: Cleft lip by selected maternal and child characteristics, 2015–2016
CharacteristicCleft lip /
1,000 pregnancies RR (95% Cl), p-value
Mother’s age < 35 years (Ref) ≥ 35 years
0.20.2
1.03 (0.46–2.30), 0.94
Plurality Single (Ref) Multiple
0.20.2
1.13 (0.15–8.31), 0.90
Gender Male (Ref) Female
0.30.1
0.27 (0.11–0.67)*, 0.00
Pre-gestational diabetes No (Ref) Yes
0.20.0
1.90 (0.12–31.09), 0.65
Obesity BMI < 35 (Ref) BMI ≥ 35
0.20.3
1.83 (0.64–5.24), 0.26
Socioeconomic status Lowest quintileHigher quintiles (Ref)
0.20.2
1.06 (0.43–2.60), 0.90
* Statistically significant.
Congenital anomalies in Victoria 2015–2016 CCOPMM 23
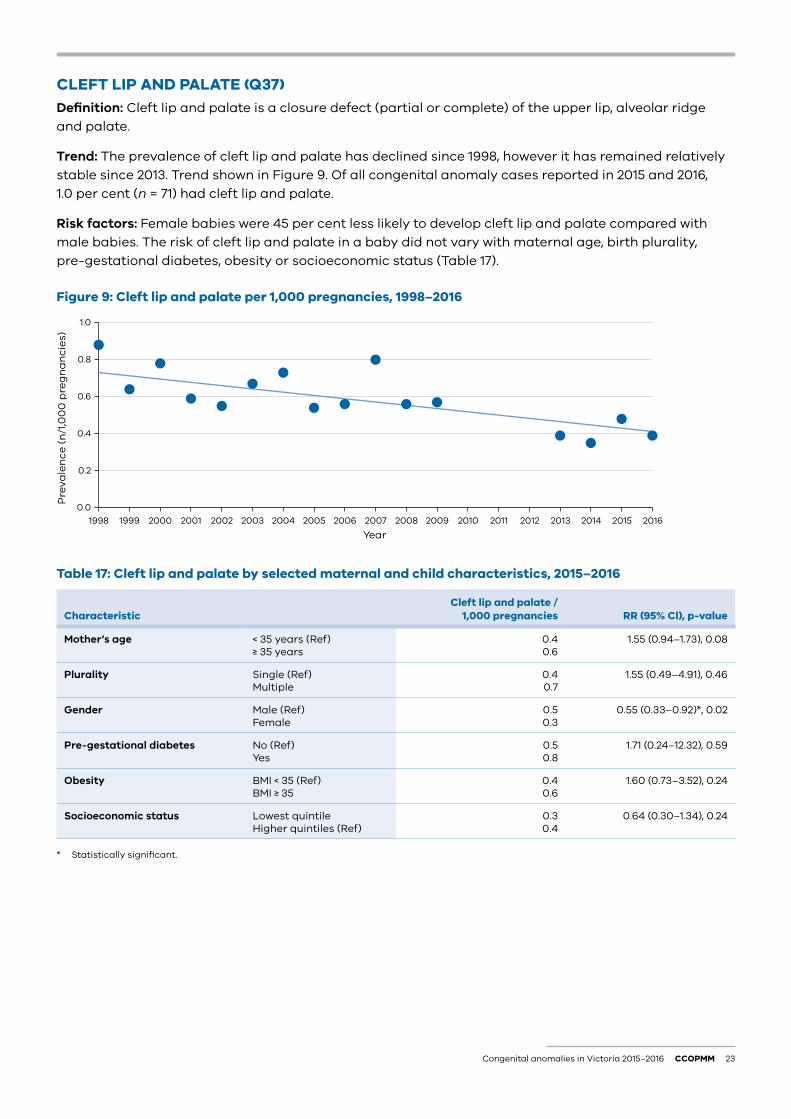
CLEFT LIP AND PALATE (Q37)Definition: Cleft lip and palate is a closure defect (partial or complete) of the upper lip, alveolar ridge and palate.
Trend: The prevalence of cleft lip and palate has declined since 1998, however it has remained relatively stable since 2013. Trend shown in Figure 9. Of all congenital anomaly cases reported in 2015 and 2016, 1.0 per cent (n = 71) had cleft lip and palate.
Risk factors: Female babies were 45 per cent less likely to develop cleft lip and palate compared with male babies. The risk of cleft lip and palate in a baby did not vary with maternal age, birth plurality, pre-gestational diabetes, obesity or socioeconomic status (Table 17).
Figure 9: Cleft lip and palate per 1,000 pregnancies, 1998–2016
0.0
0.2
0.4
0.6
0.8
1.0
Pre
vale
nce
(n
/1,0
00
pre
gn
an
cie
s)
Year2016201520142013201220112010200920082007200620052004200320022001200019991998
Table 17: Cleft lip and palate by selected maternal and child characteristics, 2015–2016
CharacteristicCleft lip and palate /
1,000 pregnancies RR (95% Cl), p-value
Mother’s age < 35 years (Ref) ≥ 35 years
0.40.6
1.55 (0.94–1.73), 0.08
Plurality Single (Ref) Multiple
0.40.7
1.55 (0.49–4.91), 0.46
Gender Male (Ref) Female
0.50.3
0.55 (0.33–0.92)*, 0.02
Pre-gestational diabetes No (Ref) Yes
0.50.8
1.71 (0.24–12.32), 0.59
Obesity BMI < 35 (Ref) BMI ≥ 35
0.40.6
1.60 (0.73–3.52), 0.24
Socioeconomic status Lowest quintileHigher quintiles (Ref)
0.30.4
0.64 (0.30–1.34), 0.24
* Statistically significant.
24 CCOPMM Congenital anomalies in Victoria 2015–2016
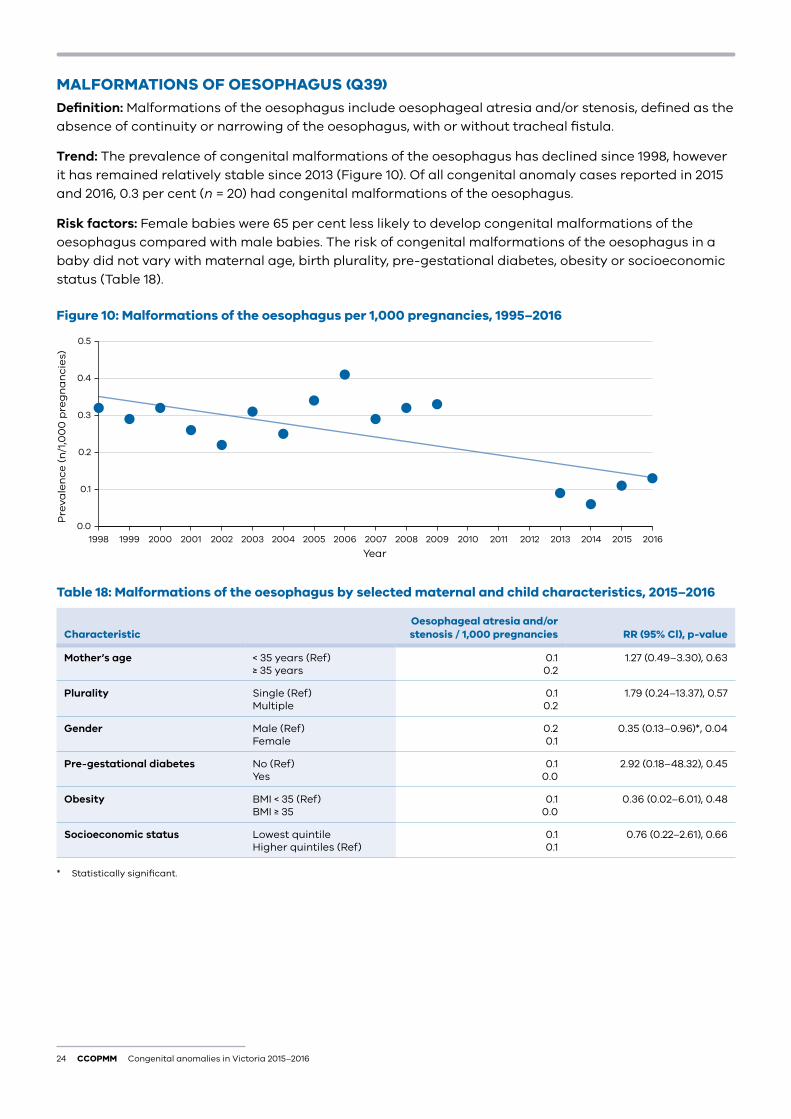
MALFORMATIONS OF OESOPHAGUS (Q39)Definition: Malformations of the oesophagus include oesophageal atresia and/or stenosis, defined as the absence of continuity or narrowing of the oesophagus, with or without tracheal fistula.
Trend: The prevalence of congenital malformations of the oesophagus has declined since 1998, however it has remained relatively stable since 2013 (Figure 10). Of all congenital anomaly cases reported in 2015 and 2016, 0.3 per cent (n = 20) had congenital malformations of the oesophagus.
Risk factors: Female babies were 65 per cent less likely to develop congenital malformations of the oesophagus compared with male babies. The risk of congenital malformations of the oesophagus in a baby did not vary with maternal age, birth plurality, pre-gestational diabetes, obesity or socioeconomic status (Table 18).
Figure 10: Malformations of the oesophagus per 1,000 pregnancies, 1995–2016
0.0
0.1
0.2
0.3
0.4
0.5
Pre
vale
nce
(n
/1,0
00
pre
gn
an
cie
s)
Year2016201520142013201220112010200920082007200620052004200320022001200019991998
Table 18: Malformations of the oesophagus by selected maternal and child characteristics, 2015–2016
CharacteristicOesophageal atresia and/or stenosis / 1,000 pregnancies RR (95% Cl), p-value
Mother’s age < 35 years (Ref) ≥ 35 years
0.10.2
1.27 (0.49–3.30), 0.63
Plurality Single (Ref) Multiple
0.10.2
1.79 (0.24–13.37), 0.57
Gender Male (Ref) Female
0.20.1
0.35 (0.13–0.96)*, 0.04
Pre-gestational diabetes No (Ref) Yes
0.10.0
2.92 (0.18–48.32), 0.45
Obesity BMI < 35 (Ref) BMI ≥ 35
0.10.0
0.36 (0.02–6.01), 0.48
Socioeconomic status Lowest quintileHigher quintiles (Ref)
0.10.1
0.76 (0.22–2.61), 0.66
* Statistically significant.
Congenital anomalies in Victoria 2015–2016 CCOPMM 25
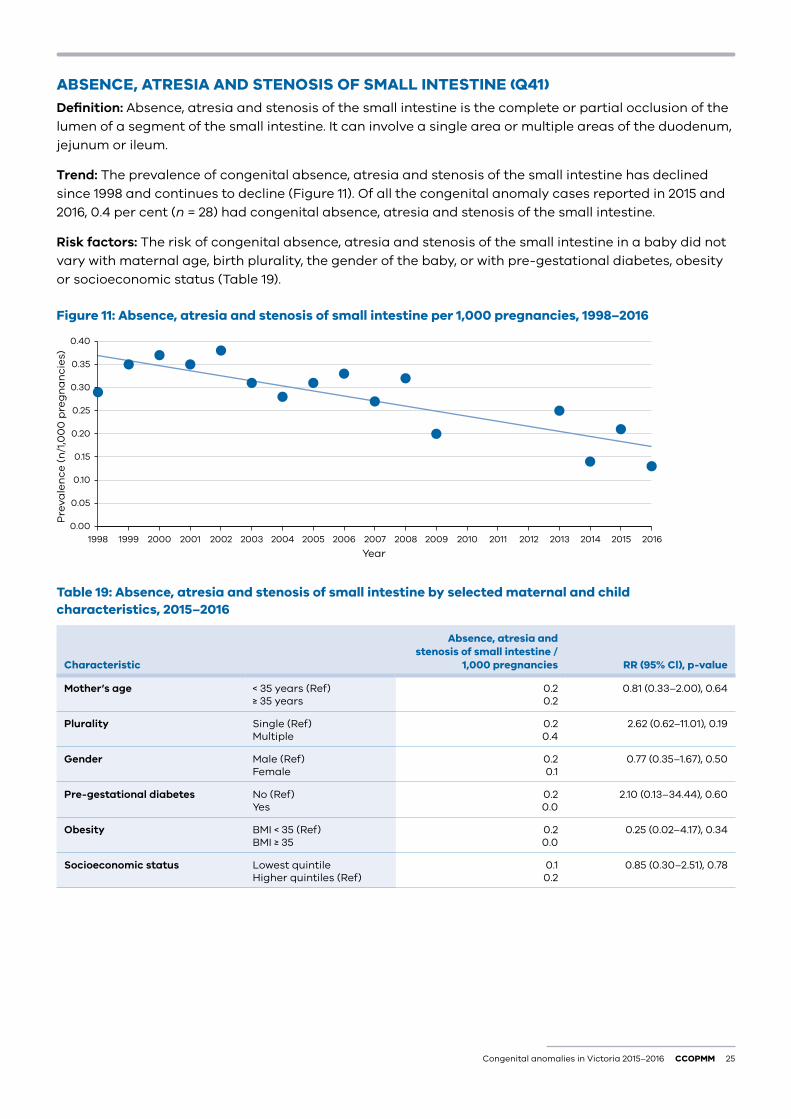
ABSENCE, ATRESIA AND STENOSIS OF SMALL INTESTINE (Q41)Definition: Absence, atresia and stenosis of the small intestine is the complete or partial occlusion of the lumen of a segment of the small intestine. It can involve a single area or multiple areas of the duodenum, jejunum or ileum.
Trend: The prevalence of congenital absence, atresia and stenosis of the small intestine has declined since 1998 and continues to decline (Figure 11). Of all the congenital anomaly cases reported in 2015 and 2016, 0.4 per cent (n = 28) had congenital absence, atresia and stenosis of the small intestine.
Risk factors: The risk of congenital absence, atresia and stenosis of the small intestine in a baby did not vary with maternal age, birth plurality, the gender of the baby, or with pre-gestational diabetes, obesity or socioeconomic status (Table 19).
Figure 11: Absence, atresia and stenosis of small intestine per 1,000 pregnancies, 1998–2016
0.00
0.05
0.10
0.15
0.20
0.25
0.30
0.35
0.40
Pre
vale
nce
(n
/1,0
00
pre
gn
an
cie
s)
Year2016201520142013201220112010200920082007200620052004200320022001200019991998
Table 19: Absence, atresia and stenosis of small intestine by selected maternal and child characteristics, 2015–2016
Characteristic
Absence, atresia and stenosis of small intestine /
1,000 pregnancies RR (95% Cl), p-value
Mother’s age < 35 years (Ref) ≥ 35 years
0.20.2
0.81 (0.33–2.00), 0.64
Plurality Single (Ref) Multiple
0.20.4
2.62 (0.62–11.01), 0.19
Gender Male (Ref) Female
0.20.1
0.77 (0.35–1.67), 0.50
Pre-gestational diabetes No (Ref) Yes
0.20.0
2.10 (0.13–34.44), 0.60
Obesity BMI < 35 (Ref) BMI ≥ 35
0.20.0
0.25 (0.02–4.17), 0.34
Socioeconomic status Lowest quintileHigher quintiles (Ref)
0.10.2
0.85 (0.30–2.51), 0.78
26 CCOPMM Congenital anomalies in Victoria 2015–2016
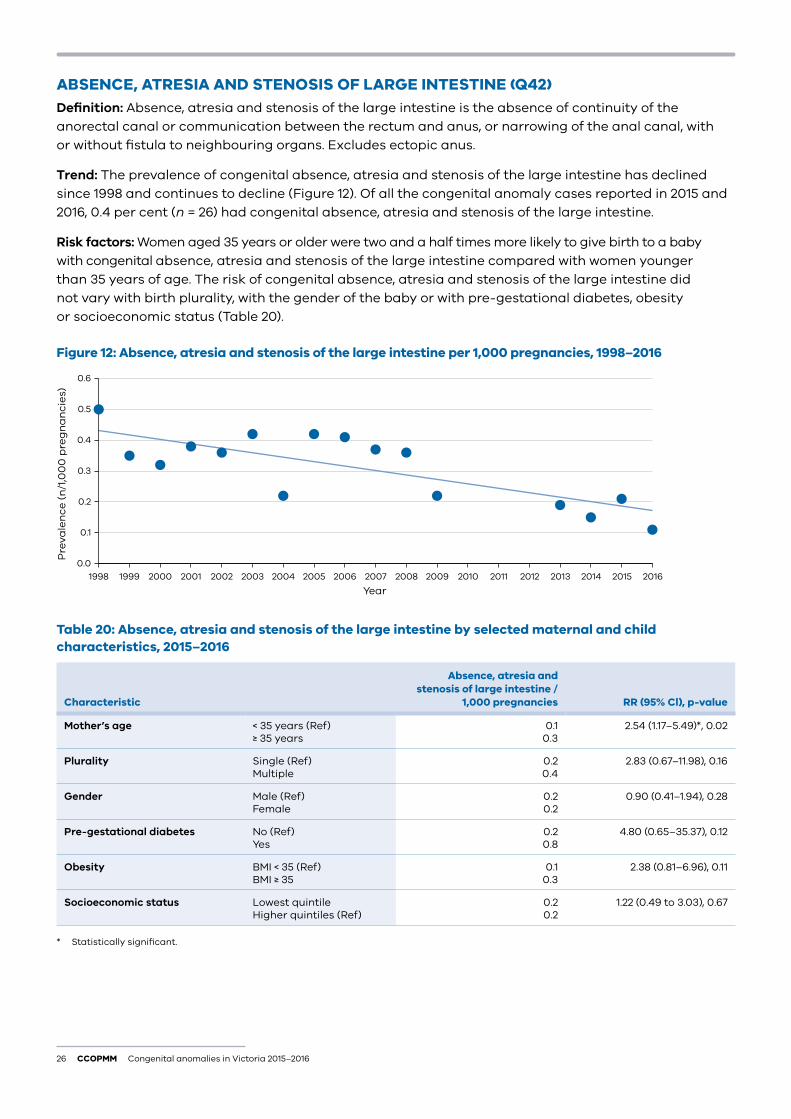
ABSENCE, ATRESIA AND STENOSIS OF LARGE INTESTINE (Q42)Definition: Absence, atresia and stenosis of the large intestine is the absence of continuity of the anorectal canal or communication between the rectum and anus, or narrowing of the anal canal, with or without fistula to neighbouring organs. Excludes ectopic anus.
Trend: The prevalence of congenital absence, atresia and stenosis of the large intestine has declined since 1998 and continues to decline (Figure 12). Of all the congenital anomaly cases reported in 2015 and 2016, 0.4 per cent (n = 26) had congenital absence, atresia and stenosis of the large intestine.
Risk factors: Women aged 35 years or older were two and a half times more likely to give birth to a baby with congenital absence, atresia and stenosis of the large intestine compared with women younger than 35 years of age. The risk of congenital absence, atresia and stenosis of the large intestine did not vary with birth plurality, with the gender of the baby or with pre-gestational diabetes, obesity or socioeconomic status (Table 20).
Figure 12: Absence, atresia and stenosis of the large intestine per 1,000 pregnancies, 1998–2016
0.0
0.1
0.2
0.3
0.4
0.5
0.6
Pre
vale
nce
(n
/1,0
00
pre
gn
an
cie
s)
Year2016201520142013201220112010200920082007200620052004200320022001200019991998
Table 20: Absence, atresia and stenosis of the large intestine by selected maternal and child characteristics, 2015–2016
Characteristic
Absence, atresia and stenosis of large intestine /
1,000 pregnancies RR (95% Cl), p-value
Mother’s age < 35 years (Ref) ≥ 35 years
0.10.3
2.54 (1.17–5.49)*, 0.02
Plurality Single (Ref) Multiple
0.20.4
2.83 (0.67–11.98), 0.16
Gender Male (Ref) Female
0.20.2
0.90 (0.41–1.94), 0.28
Pre-gestational diabetes No (Ref) Yes
0.20.8
4.80 (0.65–35.37), 0.12
Obesity BMI < 35 (Ref) BMI ≥ 35
0.10.3
2.38 (0.81–6.96), 0.11
Socioeconomic status Lowest quintileHigher quintiles (Ref)
0.20.2
1.22 (0.49 to 3.03), 0.67
* Statistically significant.
Congenital anomalies in Victoria 2015–2016 CCOPMM 27
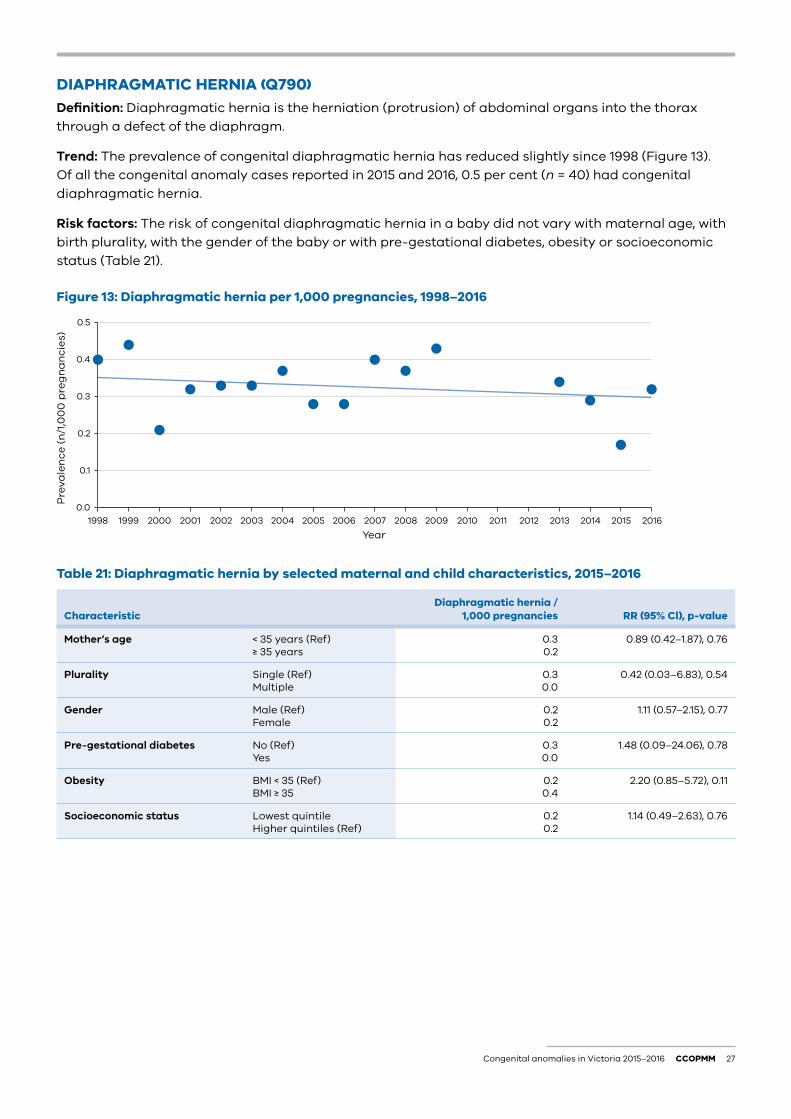
DIAPHRAGMATIC HERNIA (Q790)Definition: Diaphragmatic hernia is the herniation (protrusion) of abdominal organs into the thorax through a defect of the diaphragm.
Trend: The prevalence of congenital diaphragmatic hernia has reduced slightly since 1998 (Figure 13). Of all the congenital anomaly cases reported in 2015 and 2016, 0.5 per cent (n = 40) had congenital diaphragmatic hernia.
Risk factors: The risk of congenital diaphragmatic hernia in a baby did not vary with maternal age, with birth plurality, with the gender of the baby or with pre-gestational diabetes, obesity or socioeconomic status (Table 21).
Figure 13: Diaphragmatic hernia per 1,000 pregnancies, 1998–2016
0.0
0.1
0.2
0.3
0.4
0.5
Pre
vale
nce
(n
/1,0
00
pre
gn
an
cie
s)
Year2016201520142013201220112010200920082007200620052004200320022001200019991998
Table 21: Diaphragmatic hernia by selected maternal and child characteristics, 2015–2016
CharacteristicDiaphragmatic hernia /
1,000 pregnancies RR (95% Cl), p-value
Mother’s age < 35 years (Ref) ≥ 35 years
0.30.2
0.89 (0.42–1.87), 0.76
Plurality Single (Ref) Multiple
0.30.0
0.42 (0.03–6.83), 0.54
Gender Male (Ref) Female
0.20.2
1.11 (0.57–2.15), 0.77
Pre-gestational diabetes No (Ref) Yes
0.30.0
1.48 (0.09–24.06), 0.78
Obesity BMI < 35 (Ref) BMI ≥ 35
0.20.4
2.20 (0.85–5.72), 0.11
Socioeconomic status Lowest quintileHigher quintiles (Ref)
0.20.2
1.14 (0.49–2.63), 0.76
28 CCOPMM Congenital anomalies in Victoria 2015–2016
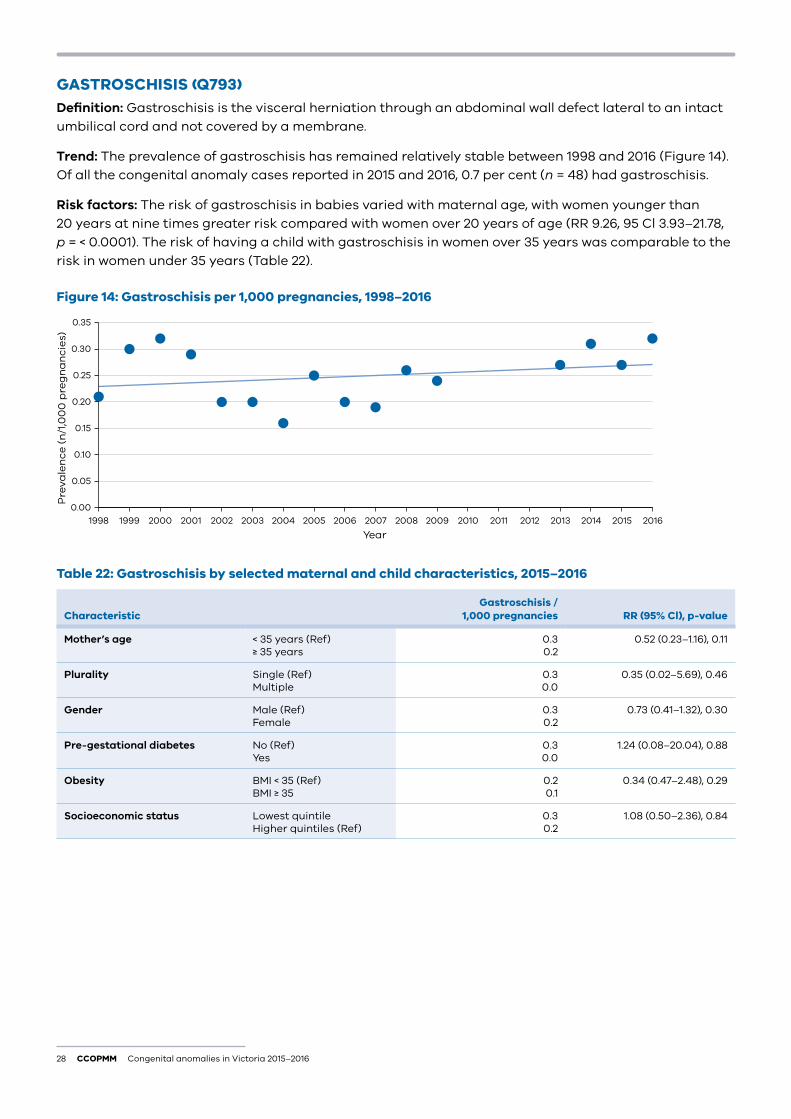
GASTROSCHISIS (Q793)Definition: Gastroschisis is the visceral herniation through an abdominal wall defect lateral to an intact umbilical cord and not covered by a membrane.
Trend: The prevalence of gastroschisis has remained relatively stable between 1998 and 2016 (Figure 14). Of all the congenital anomaly cases reported in 2015 and 2016, 0.7 per cent (n = 48) had gastroschisis.
Risk factors: The risk of gastroschisis in babies varied with maternal age, with women younger than 20 years at nine times greater risk compared with women over 20 years of age (RR 9.26, 95 Cl 3.93–21.78, p = < 0.0001). The risk of having a child with gastroschisis in women over 35 years was comparable to the risk in women under 35 years (Table 22).
Figure 14: Gastroschisis per 1,000 pregnancies, 1998–2016
0.00
0.05
0.10
0.15
0.20
0.25
0.30
0.35
Pre
vale
nce
(n
/1,0
00
pre
gn
an
cie
s)
Year2016201520142013201220112010200920082007200620052004200320022001200019991998
Table 22: Gastroschisis by selected maternal and child characteristics, 2015–2016
CharacteristicGastroschisis /
1,000 pregnancies RR (95% Cl), p-value
Mother’s age < 35 years (Ref) ≥ 35 years
0.30.2
0.52 (0.23–1.16), 0.11
Plurality Single (Ref) Multiple
0.30.0
0.35 (0.02–5.69), 0.46
Gender Male (Ref) Female
0.30.2
0.73 (0.41–1.32), 0.30
Pre-gestational diabetes No (Ref) Yes
0.30.0
1.24 (0.08–20.04), 0.88
Obesity BMI < 35 (Ref) BMI ≥ 35
0.20.1
0.34 (0.47–2.48), 0.29
Socioeconomic status Lowest quintileHigher quintiles (Ref)
0.30.2
1.08 (0.50–2.36), 0.84
Congenital anomalies in Victoria 2015–2016 CCOPMM 29
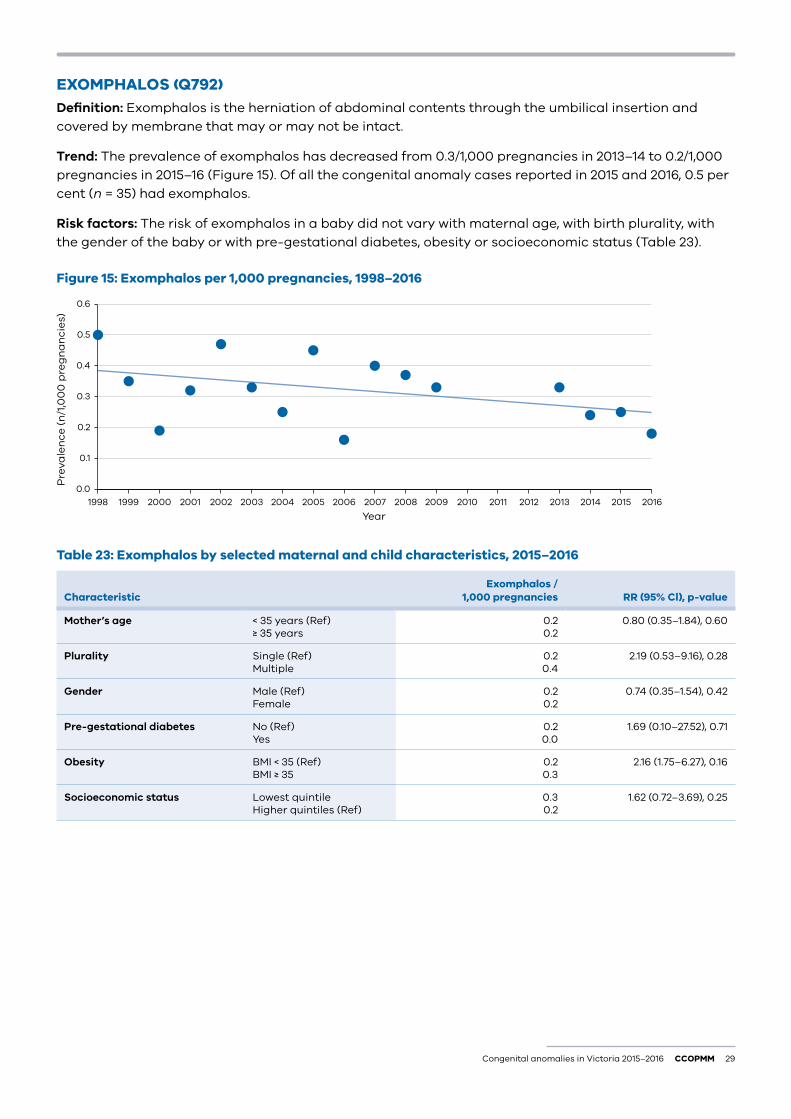
EXOMPHALOS (Q792)Definition: Exomphalos is the herniation of abdominal contents through the umbilical insertion and covered by membrane that may or may not be intact.
Trend: The prevalence of exomphalos has decreased from 0.3/1,000 pregnancies in 2013–14 to 0.2/1,000 pregnancies in 2015–16 (Figure 15). Of all the congenital anomaly cases reported in 2015 and 2016, 0.5 per cent (n = 35) had exomphalos.
Risk factors: The risk of exomphalos in a baby did not vary with maternal age, with birth plurality, with the gender of the baby or with pre-gestational diabetes, obesity or socioeconomic status (Table 23).
Figure 15: Exomphalos per 1,000 pregnancies, 1998–2016
0.0
0.1
0.2
0.3
0.4
0.5
0.6
Pre
vale
nce
(n
/1,0
00
pre
gn
an
cie
s)
Year2016201520142013201220112010200920082007200620052004200320022001200019991998
Table 23: Exomphalos by selected maternal and child characteristics, 2015–2016
CharacteristicExomphalos /
1,000 pregnancies RR (95% Cl), p-value
Mother’s age < 35 years (Ref) ≥ 35 years
0.20.2
0.80 (0.35–1.84), 0.60
Plurality Single (Ref) Multiple
0.20.4
2.19 (0.53–9.16), 0.28
Gender Male (Ref) Female
0.20.2
0.74 (0.35–1.54), 0.42
Pre-gestational diabetes No (Ref) Yes
0.20.0
1.69 (0.10–27.52), 0.71
Obesity BMI < 35 (Ref) BMI ≥ 35
0.20.3
2.16 (1.75–6.27), 0.16
Socioeconomic status Lowest quintileHigher quintiles (Ref)
0.30.2
1.62 (0.72–3.69), 0.25
30 CCOPMM Congenital anomalies in Victoria 2015–2016
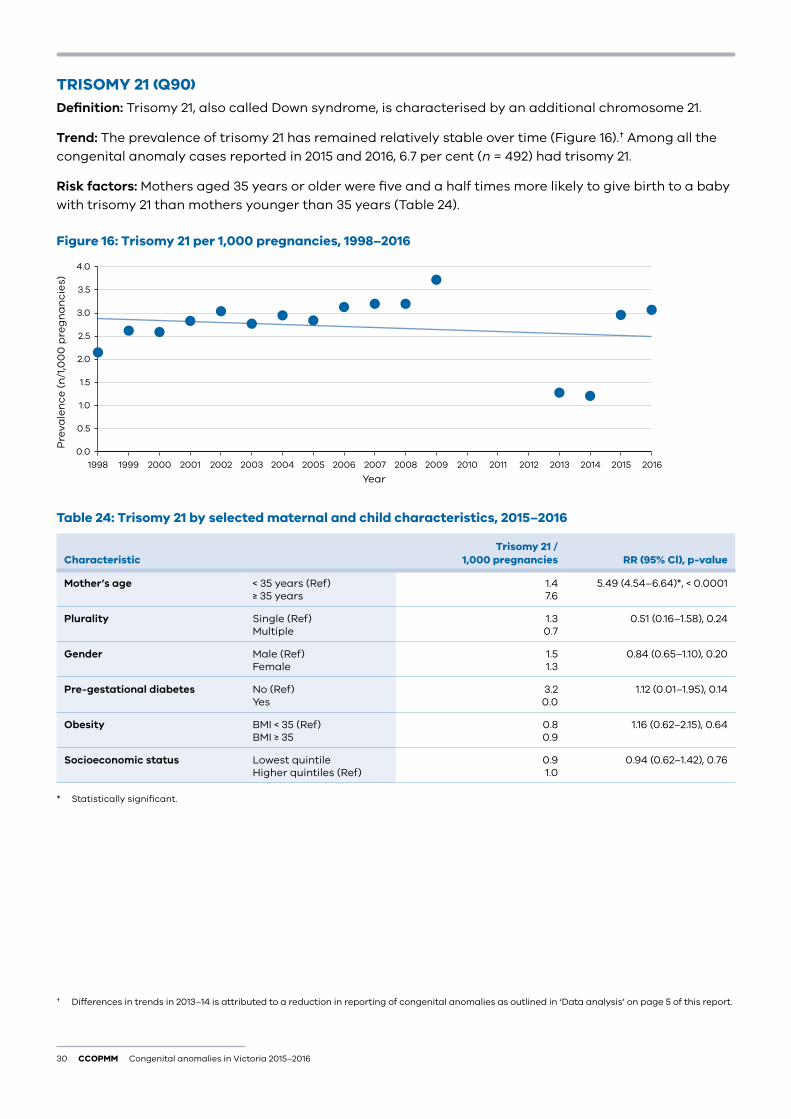
TRISOMY 21 (Q90)Definition: Trisomy 21, also called Down syndrome, is characterised by an additional chromosome 21.
Trend: The prevalence of trisomy 21 has remained relatively stable over time (Figure 16).† Among all the congenital anomaly cases reported in 2015 and 2016, 6.7 per cent (n = 492) had trisomy 21.
Risk factors: Mothers aged 35 years or older were five and a half times more likely to give birth to a baby with trisomy 21 than mothers younger than 35 years (Table 24).
Figure 16: Trisomy 21 per 1,000 pregnancies, 1998–2016
0.0
0.5
1.0
1.5
2.0
2.5
3.0
3.5
4.0
Pre
vale
nce
(n
/1,0
00
pre
gn
an
cie
s)
Year2016201520142013201220112010200920082007200620052004200320022001200019991998
Table 24: Trisomy 21 by selected maternal and child characteristics, 2015–2016
CharacteristicTrisomy 21 /
1,000 pregnancies RR (95% Cl), p-value
Mother’s age < 35 years (Ref) ≥ 35 years
1.47.6
5.49 (4.54–6.64)*, < 0.0001
Plurality Single (Ref) Multiple
1.30.7
0.51 (0.16–1.58), 0.24
Gender Male (Ref) Female
1.51.3
0.84 (0.65–1.10), 0.20
Pre-gestational diabetes No (Ref) Yes
3.20.0
1.12 (0.01–1.95), 0.14
Obesity BMI < 35 (Ref) BMI ≥ 35
0.80.9
1.16 (0.62–2.15), 0.64
Socioeconomic status Lowest quintileHigher quintiles (Ref)
0.91.0
0.94 (0.62–1.42), 0.76
* Statistically significant.
† Differences in trends in 2013–14 is attributed to a reduction in reporting of congenital anomalies as outlined in ‘Data analysis’ on page 5 of this report.
Congenital anomalies in Victoria 2015–2016 CCOPMM 31
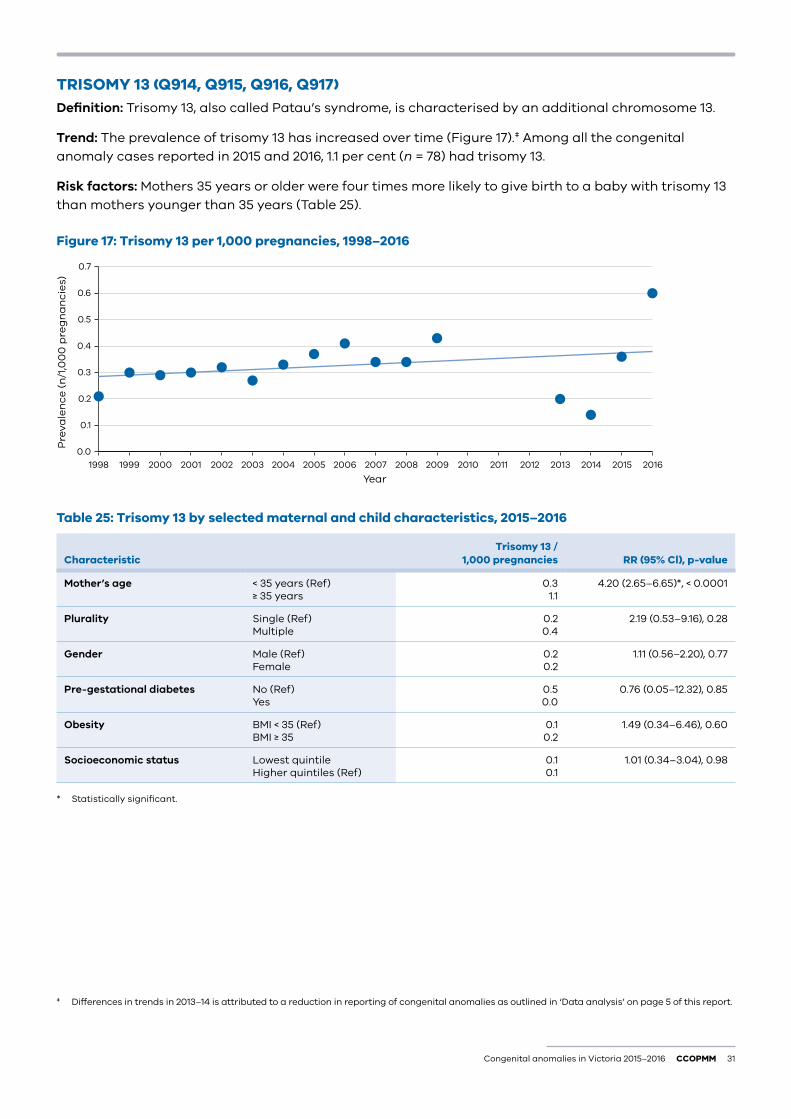
TRISOMY 13 (Q914, Q915, Q916, Q917)Definition: Trisomy 13, also called Patau’s syndrome, is characterised by an additional chromosome 13.
Trend: The prevalence of trisomy 13 has increased over time (Figure 17).‡ Among all the congenital anomaly cases reported in 2015 and 2016, 1.1 per cent (n = 78) had trisomy 13.
Risk factors: Mothers 35 years or older were four times more likely to give birth to a baby with trisomy 13 than mothers younger than 35 years (Table 25).
Figure 17: Trisomy 13 per 1,000 pregnancies, 1998–2016
0.0
0.1
0.2
0.3
0.4
0.5
0.6
0.7
Pre
vale
nce
(n
/1,0
00
pre
gn
an
cie
s)
Year2016201520142013201220112010200920082007200620052004200320022001200019991998
Table 25: Trisomy 13 by selected maternal and child characteristics, 2015–2016
CharacteristicTrisomy 13 /
1,000 pregnancies RR (95% Cl), p-value
Mother’s age < 35 years (Ref) ≥ 35 years
0.31.1
4.20 (2.65–6.65)*, < 0.0001
Plurality Single (Ref) Multiple
0.20.4
2.19 (0.53–9.16), 0.28
Gender Male (Ref) Female
0.20.2
1.11 (0.56–2.20), 0.77
Pre-gestational diabetes No (Ref) Yes
0.50.0
0.76 (0.05–12.32), 0.85
Obesity BMI < 35 (Ref) BMI ≥ 35
0.10.2
1.49 (0.34–6.46), 0.60
Socioeconomic status Lowest quintileHigher quintiles (Ref)
0.10.1
1.01 (0.34–3.04), 0.98
* Statistically significant.
‡ Differences in trends in 2013–14 is attributed to a reduction in reporting of congenital anomalies as outlined in ‘Data analysis’ on page 5 of this report.
32 CCOPMM Congenital anomalies in Victoria 2015–2016
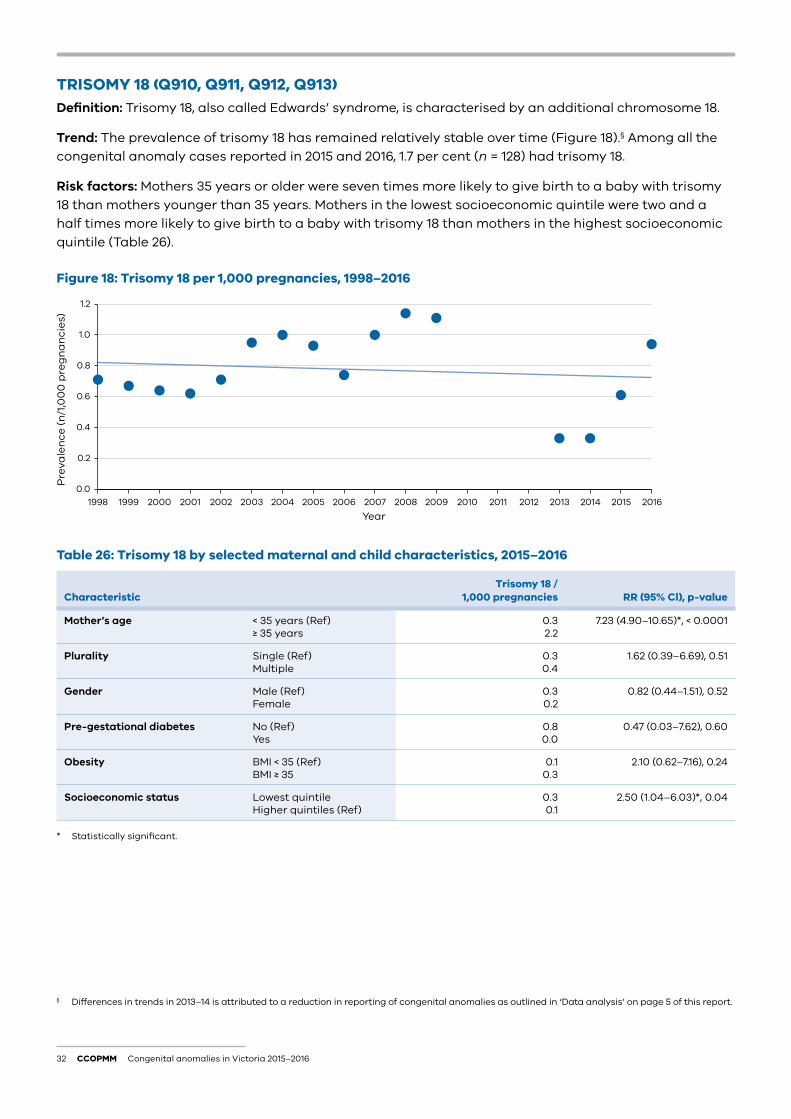
TRISOMY 18 (Q910, Q911, Q912, Q913)Definition: Trisomy 18, also called Edwards’ syndrome, is characterised by an additional chromosome 18.
Trend: The prevalence of trisomy 18 has remained relatively stable over time (Figure 18).§ Among all the congenital anomaly cases reported in 2015 and 2016, 1.7 per cent (n = 128) had trisomy 18.
Risk factors: Mothers 35 years or older were seven times more likely to give birth to a baby with trisomy 18 than mothers younger than 35 years. Mothers in the lowest socioeconomic quintile were two and a half times more likely to give birth to a baby with trisomy 18 than mothers in the highest socioeconomic quintile (Table 26).
Figure 18: Trisomy 18 per 1,000 pregnancies, 1998–2016
0.0
0.2
0.4
0.6
0.8
1.0
1.2
Pre
vale
nce
(n
/1,0
00
pre
gn
an
cie
s)
Year2016201520142013201220112010200920082007200620052004200320022001200019991998
Table 26: Trisomy 18 by selected maternal and child characteristics, 2015–2016
CharacteristicTrisomy 18 /
1,000 pregnancies RR (95% Cl), p-value
Mother’s age < 35 years (Ref) ≥ 35 years
0.32.2
7.23 (4.90–10.65)*, < 0.0001
Plurality Single (Ref) Multiple
0.30.4
1.62 (0.39–6.69), 0.51
Gender Male (Ref) Female
0.30.2
0.82 (0.44–1.51), 0.52
Pre-gestational diabetes No (Ref) Yes
0.80.0
0.47 (0.03–7.62), 0.60
Obesity BMI < 35 (Ref) BMI ≥ 35
0.10.3
2.10 (0.62–7.16), 0.24
Socioeconomic status Lowest quintileHigher quintiles (Ref)
0.30.1
2.50 (1.04–6.03)*, 0.04
* Statistically significant.
§ Differences in trends in 2013–14 is attributed to a reduction in reporting of congenital anomalies as outlined in ‘Data analysis’ on page 5 of this report.
Congenital anomalies in Victoria 2015–2016 CCOPMM 33
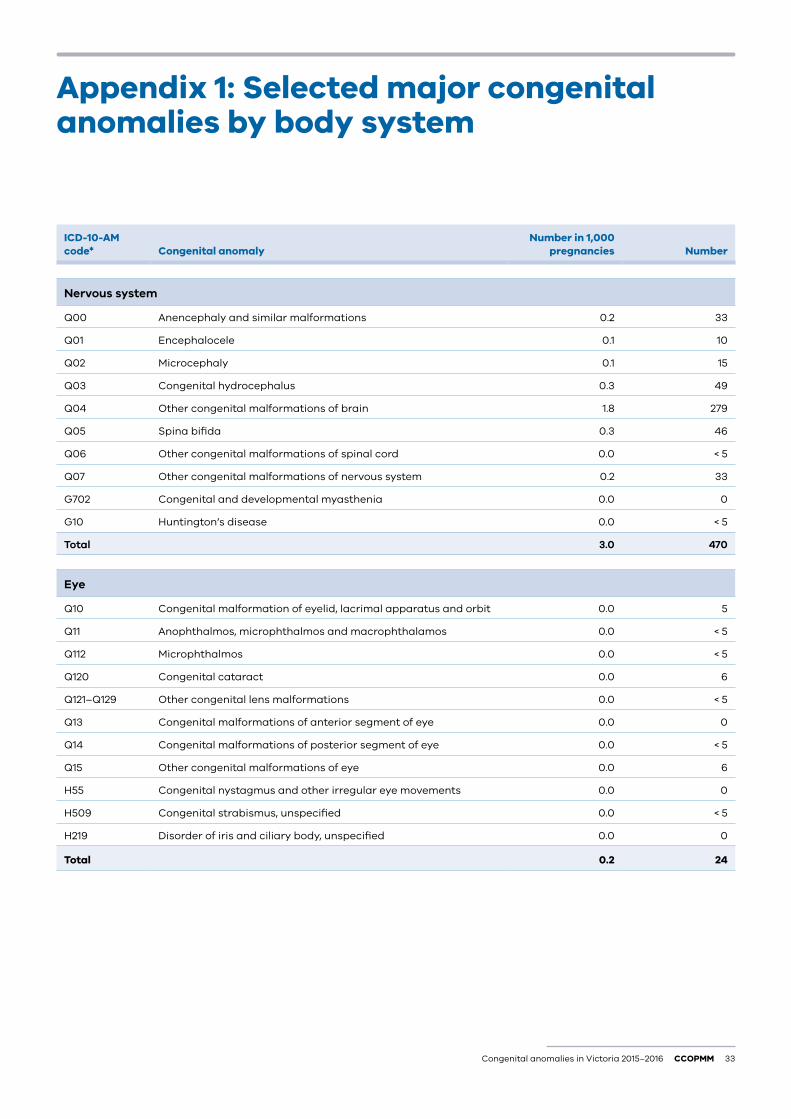
Appendix 1: Selected major congenital anomalies by body system
ICD-10-AM code* Congenital anomaly
Number in 1,000 pregnancies Number
Nervous system
Q00 Anencephaly and similar malformations 0.2 33
Q01 Encephalocele 0.1 10
Q02 Microcephaly 0.1 15
Q03 Congenital hydrocephalus 0.3 49
Q04 Other congenital malformations of brain 1.8 279
Q05 Spina bifida 0.3 46
Q06 Other congenital malformations of spinal cord 0.0 < 5
Q07 Other congenital malformations of nervous system 0.2 33
G702 Congenital and developmental myasthenia 0.0 0
G10 Huntington’s disease 0.0 < 5
Total 3.0 470
Eye
Q10 Congenital malformation of eyelid, lacrimal apparatus and orbit 0.0 5
Q11 Anophthalmos, microphthalmos and macrophthalamos 0.0 < 5
Q112 Microphthalmos 0.0 < 5
Q120 Congenital cataract 0.0 6
Q121–Q129 Other congenital lens malformations 0.0 < 5
Q13 Congenital malformations of anterior segment of eye 0.0 0
Q14 Congenital malformations of posterior segment of eye 0.0 < 5
Q15 Other congenital malformations of eye 0.0 6
H55 Congenital nystagmus and other irregular eye movements 0.0 0
H509 Congenital strabismus, unspecified 0.0 < 5
H219 Disorder of iris and ciliary body, unspecified 0.0 0
Total 0.2 24
34 CCOPMM Congenital anomalies in Victoria 2015–2016
ICD-10-AM code* Congenital anomaly
Number in 1,000 pregnancies Number
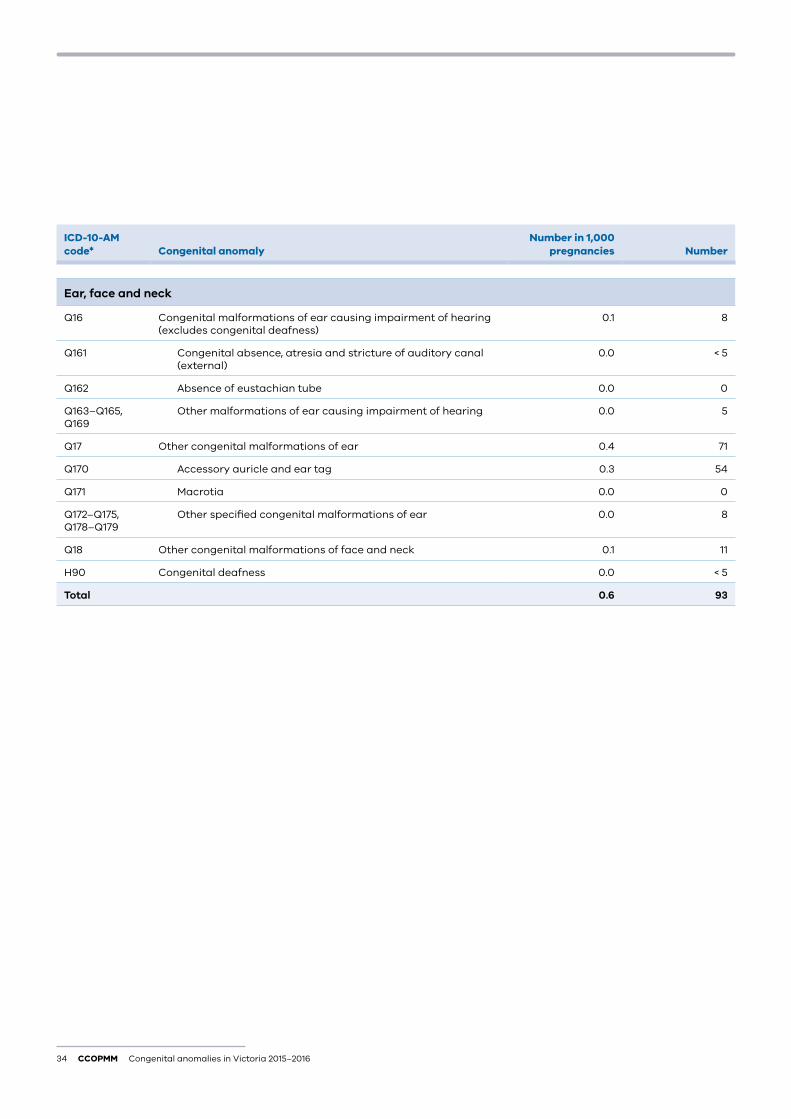
Ear, face and neck
Q16 Congenital malformations of ear causing impairment of hearing (excludes congenital deafness)
0.1 8
Q161 Congenital absence, atresia and stricture of auditory canal (external)
0.0 < 5
Q162 Absence of eustachian tube 0.0 0
Q163–Q165, Q169
Other malformations of ear causing impairment of hearing 0.0 5
Q17 Other congenital malformations of ear 0.4 71
Q170 Accessory auricle and ear tag 0.3 54
Q171 Macrotia 0.0 0
Q172–Q175, Q178–Q179
Other specified congenital malformations of ear 0.0 8
Q18 Other congenital malformations of face and neck 0.1 11
H90 Congenital deafness 0.0 < 5
Total 0.6 93
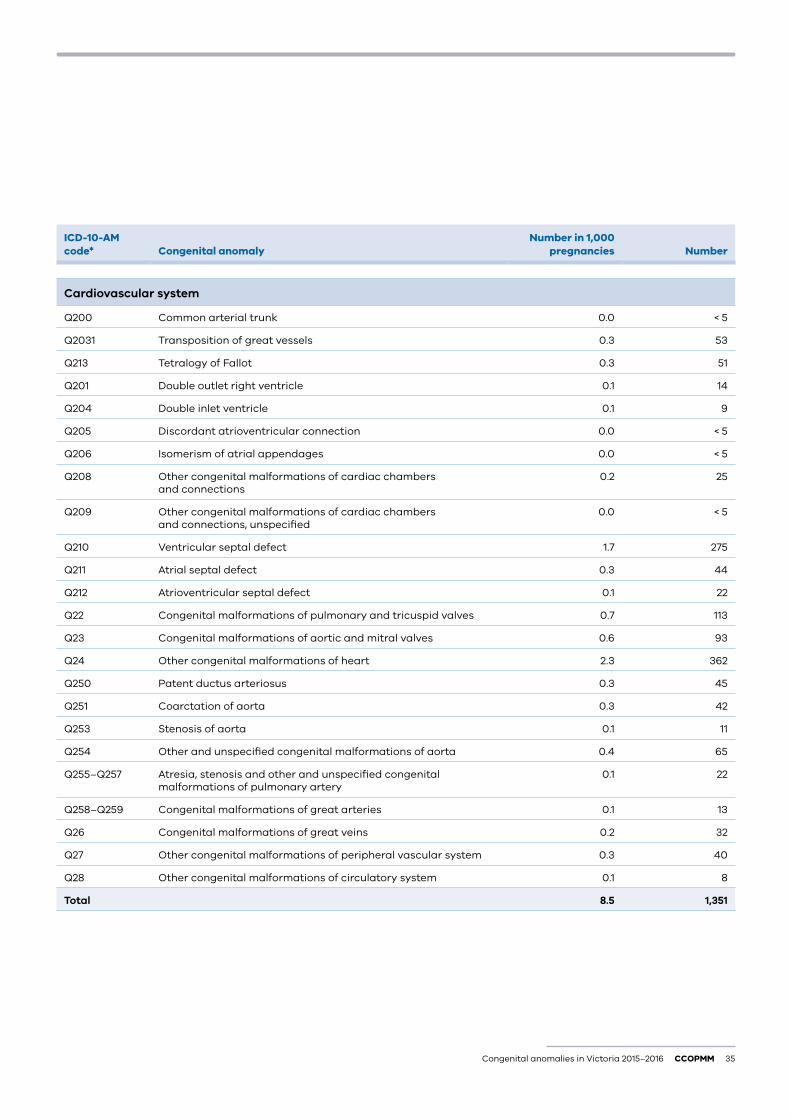
Congenital anomalies in Victoria 2015–2016 CCOPMM 35
ICD-10-AM code* Congenital anomaly
Number in 1,000 pregnancies Number
Cardiovascular system
Q200 Common arterial trunk 0.0 < 5
Q2031 Transposition of great vessels 0.3 53
Q213 Tetralogy of Fallot 0.3 51
Q201 Double outlet right ventricle 0.1 14
Q204 Double inlet ventricle 0.1 9
Q205 Discordant atrioventricular connection 0.0 < 5
Q206 Isomerism of atrial appendages 0.0 < 5
Q208 Other congenital malformations of cardiac chambers and connections
0.2 25
Q209 Other congenital malformations of cardiac chambers and connections, unspecified
0.0 < 5
Q210 Ventricular septal defect 1.7 275
Q211 Atrial septal defect 0.3 44
Q212 Atrioventricular septal defect 0.1 22
Q22 Congenital malformations of pulmonary and tricuspid valves 0.7 113
Q23 Congenital malformations of aortic and mitral valves 0.6 93
Q24 Other congenital malformations of heart 2.3 362
Q250 Patent ductus arteriosus 0.3 45
Q251 Coarctation of aorta 0.3 42
Q253 Stenosis of aorta 0.1 11
Q254 Other and unspecified congenital malformations of aorta 0.4 65
Q255–Q257 Atresia, stenosis and other and unspecified congenital malformations of pulmonary artery
0.1 22
Q258–Q259 Congenital malformations of great arteries 0.1 13
Q26 Congenital malformations of great veins 0.2 32
Q27 Other congenital malformations of peripheral vascular system 0.3 40
Q28 Other congenital malformations of circulatory system 0.1 8
Total 8.5 1,351
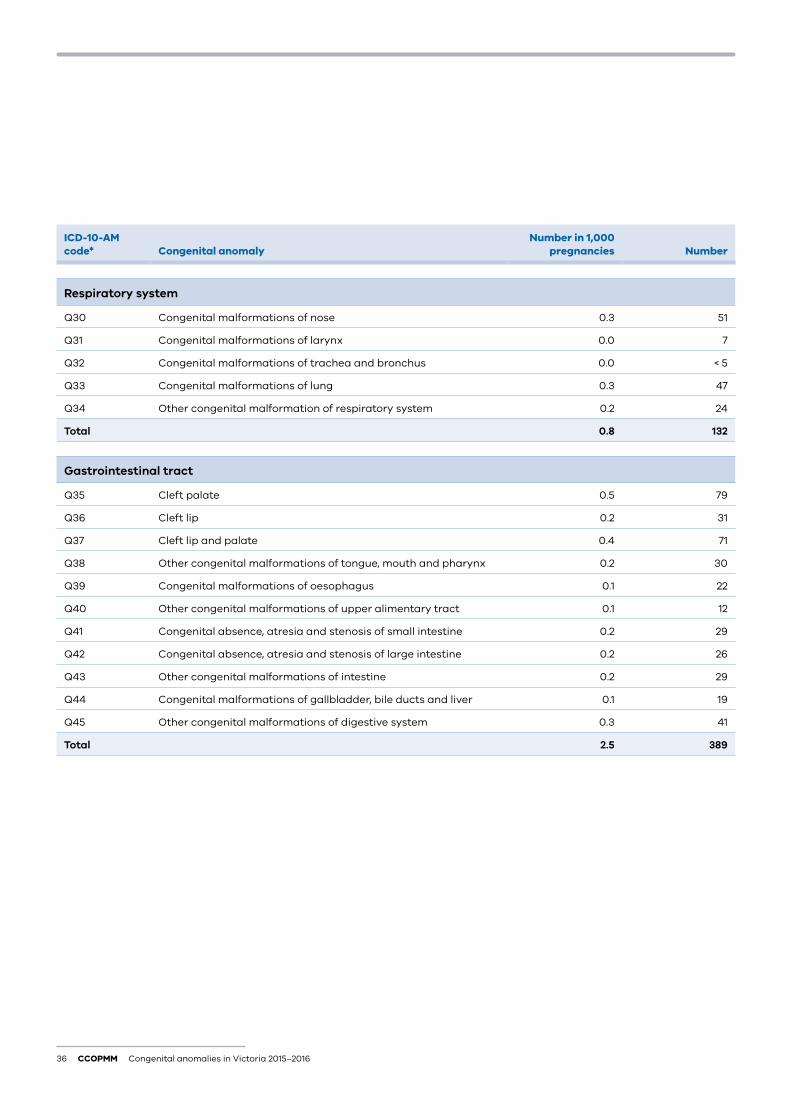
36 CCOPMM Congenital anomalies in Victoria 2015–2016
ICD-10-AM code* Congenital anomaly
Number in 1,000 pregnancies Number
Respiratory system
Q30 Congenital malformations of nose 0.3 51
Q31 Congenital malformations of larynx 0.0 7
Q32 Congenital malformations of trachea and bronchus 0.0 < 5
Q33 Congenital malformations of lung 0.3 47
Q34 Other congenital malformation of respiratory system 0.2 24
Total 0.8 132
Gastrointestinal tract
Q35 Cleft palate 0.5 79
Q36 Cleft lip 0.2 31
Q37 Cleft lip and palate 0.4 71
Q38 Other congenital malformations of tongue, mouth and pharynx 0.2 30
Q39 Congenital malformations of oesophagus 0.1 22
Q40 Other congenital malformations of upper alimentary tract 0.1 12
Q41 Congenital absence, atresia and stenosis of small intestine 0.2 29
Q42 Congenital absence, atresia and stenosis of large intestine 0.2 26
Q43 Other congenital malformations of intestine 0.2 29
Q44 Congenital malformations of gallbladder, bile ducts and liver 0.1 19
Q45 Other congenital malformations of digestive system 0.3 41
Total 2.5 389
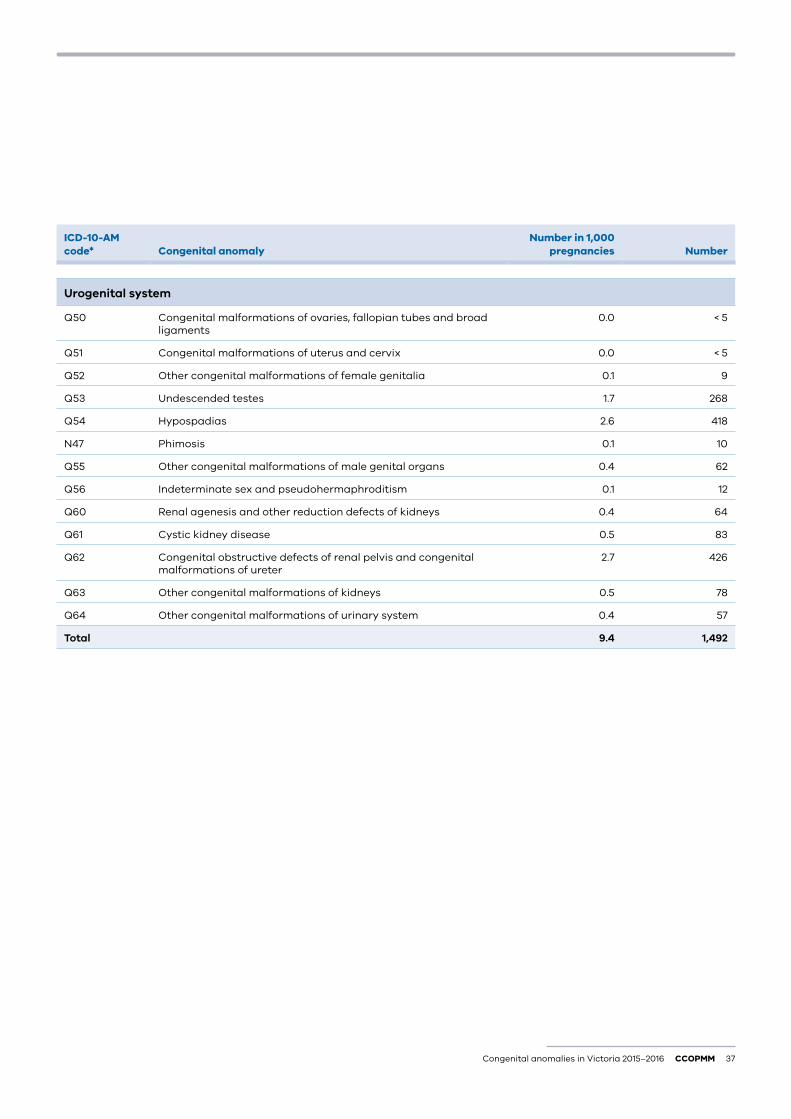
Congenital anomalies in Victoria 2015–2016 CCOPMM 37
ICD-10-AM code* Congenital anomaly
Number in 1,000 pregnancies Number
Urogenital system
Q50 Congenital malformations of ovaries, fallopian tubes and broad ligaments
0.0 < 5
Q51 Congenital malformations of uterus and cervix 0.0 < 5
Q52 Other congenital malformations of female genitalia 0.1 9
Q53 Undescended testes 1.7 268
Q54 Hypospadias 2.6 418
N47 Phimosis 0.1 10
Q55 Other congenital malformations of male genital organs 0.4 62
Q56 Indeterminate sex and pseudohermaphroditism 0.1 12
Q60 Renal agenesis and other reduction defects of kidneys 0.4 64
Q61 Cystic kidney disease 0.5 83
Q62 Congenital obstructive defects of renal pelvis and congenital malformations of ureter
2.7 426
Q63 Other congenital malformations of kidneys 0.5 78
Q64 Other congenital malformations of urinary system 0.4 57
Total 9.4 1,492
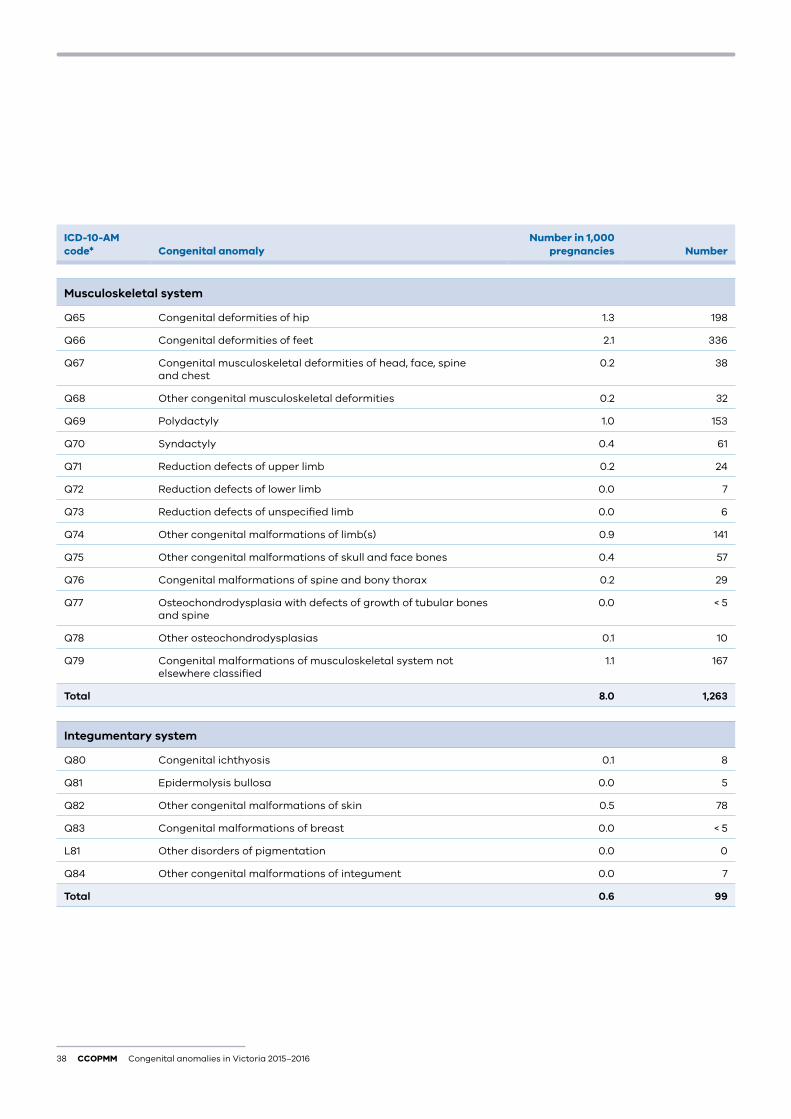
38 CCOPMM Congenital anomalies in Victoria 2015–2016
ICD-10-AM code* Congenital anomaly
Number in 1,000 pregnancies Number
Musculoskeletal system
Q65 Congenital deformities of hip 1.3 198
Q66 Congenital deformities of feet 2.1 336
Q67 Congenital musculoskeletal deformities of head, face, spine and chest
0.2 38
Q68 Other congenital musculoskeletal deformities 0.2 32
Q69 Polydactyly 1.0 153
Q70 Syndactyly 0.4 61
Q71 Reduction defects of upper limb 0.2 24
Q72 Reduction defects of lower limb 0.0 7
Q73 Reduction defects of unspecified limb 0.0 6
Q74 Other congenital malformations of limb(s) 0.9 141
Q75 Other congenital malformations of skull and face bones 0.4 57
Q76 Congenital malformations of spine and bony thorax 0.2 29
Q77 Osteochondrodysplasia with defects of growth of tubular bones and spine
0.0 < 5
Q78 Other osteochondrodysplasias 0.1 10
Q79 Congenital malformations of musculoskeletal system not elsewhere classified
1.1 167
Total 8.0 1,263
Integumentary system
Q80 Congenital ichthyosis 0.1 8
Q81 Epidermolysis bullosa 0.0 5
Q82 Other congenital malformations of skin 0.5 78
Q83 Congenital malformations of breast 0.0 < 5
L81 Other disorders of pigmentation 0.0 0
Q84 Other congenital malformations of integument 0.0 7
Total 0.6 99
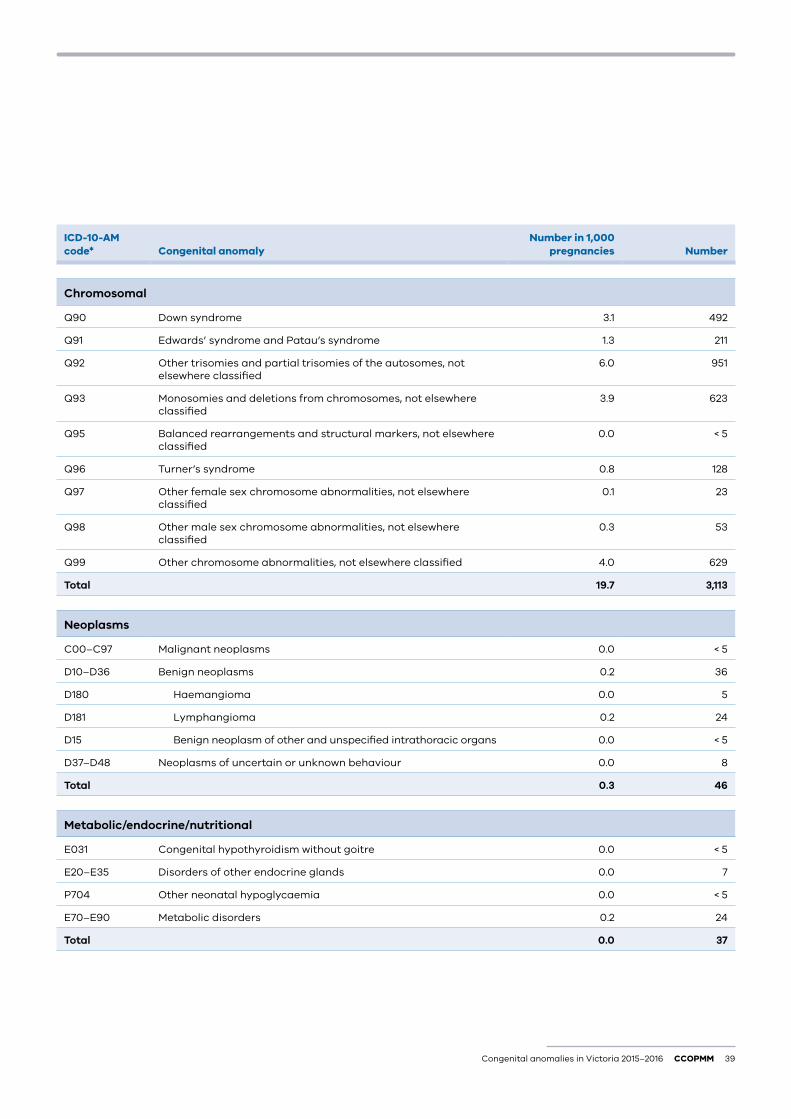
Congenital anomalies in Victoria 2015–2016 CCOPMM 39
ICD-10-AM code* Congenital anomaly
Number in 1,000 pregnancies Number
Chromosomal
Q90 Down syndrome 3.1 492
Q91 Edwards’ syndrome and Patau’s syndrome 1.3 211
Q92 Other trisomies and partial trisomies of the autosomes, not elsewhere classified
6.0 951
Q93 Monosomies and deletions from chromosomes, not elsewhere classified
3.9 623
Q95 Balanced rearrangements and structural markers, not elsewhere classified
0.0 < 5
Q96 Turner’s syndrome 0.8 128
Q97 Other female sex chromosome abnormalities, not elsewhere classified
0.1 23
Q98 Other male sex chromosome abnormalities, not elsewhere classified
0.3 53
Q99 Other chromosome abnormalities, not elsewhere classified 4.0 629
Total 19.7 3,113
Neoplasms
C00–C97 Malignant neoplasms 0.0 < 5
D10–D36 Benign neoplasms 0.2 36
D180 Haemangioma 0.0 5
D181 Lymphangioma 0.2 24
D15 Benign neoplasm of other and unspecified intrathoracic organs 0.0 < 5
D37–D48 Neoplasms of uncertain or unknown behaviour 0.0 8
Total 0.3 46
Metabolic/endocrine/nutritional
E031 Congenital hypothyroidism without goitre 0.0 < 5
E20–E35 Disorders of other endocrine glands 0.0 7
P704 Other neonatal hypoglycaemia 0.0 < 5
E70–E90 Metabolic disorders 0.2 24
Total 0.0 37
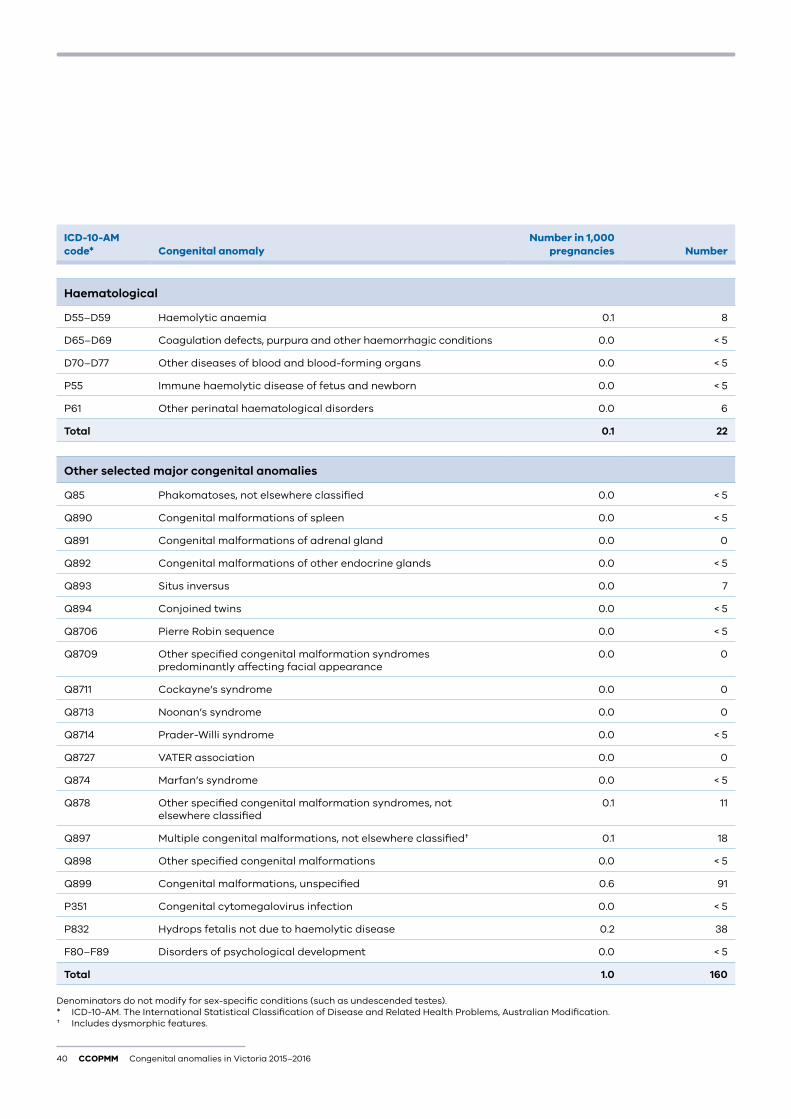
40 CCOPMM Congenital anomalies in Victoria 2015–2016
ICD-10-AM code* Congenital anomaly
Number in 1,000 pregnancies Number
Haematological
D55–D59 Haemolytic anaemia 0.1 8
D65–D69 Coagulation defects, purpura and other haemorrhagic conditions 0.0 < 5
D70–D77 Other diseases of blood and blood-forming organs 0.0 < 5
P55 Immune haemolytic disease of fetus and newborn 0.0 < 5
P61 Other perinatal haematological disorders 0.0 6
Total 0.1 22
Other selected major congenital anomalies
Q85 Phakomatoses, not elsewhere classified 0.0 < 5
Q890 Congenital malformations of spleen 0.0 < 5
Q891 Congenital malformations of adrenal gland 0.0 0
Q892 Congenital malformations of other endocrine glands 0.0 < 5
Q893 Situs inversus 0.0 7
Q894 Conjoined twins 0.0 < 5
Q8706 Pierre Robin sequence 0.0 < 5
Q8709 Other specified congenital malformation syndromes predominantly affecting facial appearance
0.0 0
Q8711 Cockayne’s syndrome 0.0 0
Q8713 Noonan’s syndrome 0.0 0
Q8714 Prader-Willi syndrome 0.0 < 5
Q8727 VATER association 0.0 0
Q874 Marfan’s syndrome 0.0 < 5
Q878 Other specified congenital malformation syndromes, not elsewhere classified
0.1 11
Q897 Multiple congenital malformations, not elsewhere classified† 0.1 18
Q898 Other specified congenital malformations 0.0 < 5
Q899 Congenital malformations, unspecified 0.6 91
P351 Congenital cytomegalovirus infection 0.0 < 5
P832 Hydrops fetalis not due to haemolytic disease 0.2 38
F80–F89 Disorders of psychological development 0.0 < 5
Total 1.0 160
Denominators do not modify for sex-specific conditions (such as undescended testes).* ICD-10-AM. The International Statistical Classification of Disease and Related Health Problems, Australian Modification.† Includes dysmorphic features.
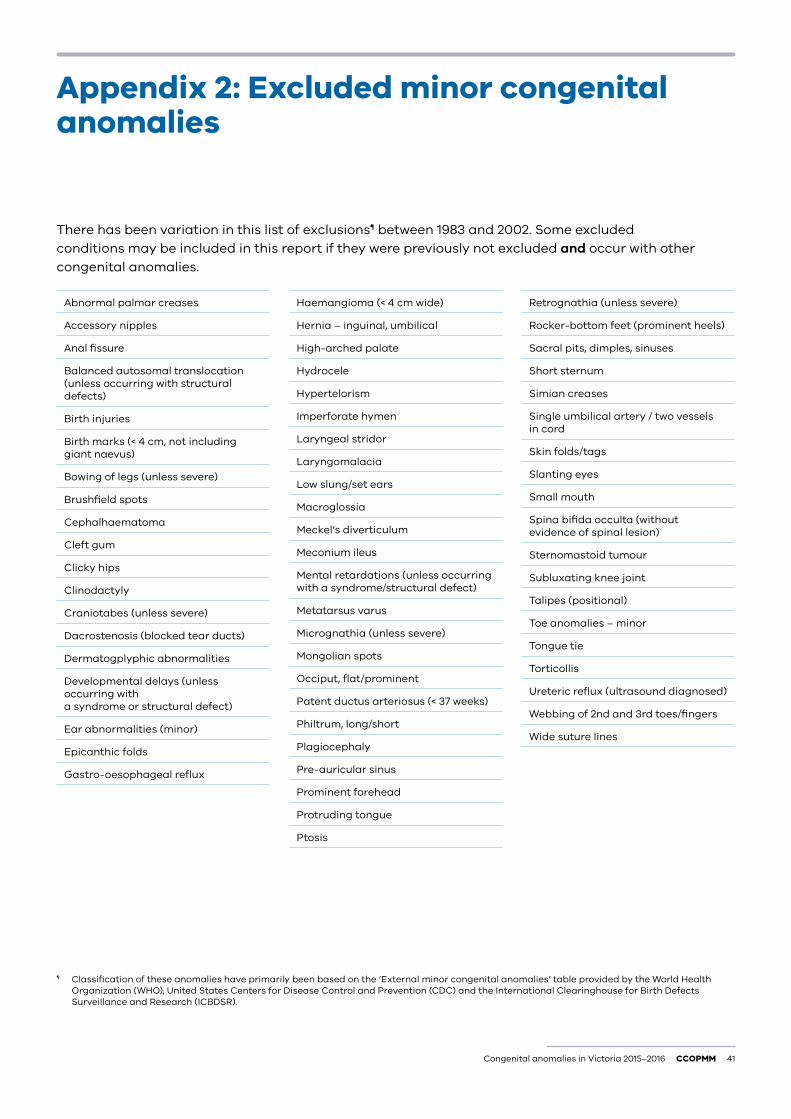
Congenital anomalies in Victoria 2015–2016 CCOPMM 41
Appendix 2: Excluded minor congenital anomalies
There has been variation in this list of exclusions¶ between 1983 and 2002. Some excluded conditions may be included in this report if they were previously not excluded and occur with other congenital anomalies.
¶ Classification of these anomalies have primarily been based on the ‘External minor congenital anomalies’ table provided by the World Health Organization (WHO), United States Centers for Disease Control and Prevention (CDC) and the International Clearinghouse for Birth Defects Surveillance and Research (ICBDSR).
Haemangioma (< 4 cm wide)
Hernia – inguinal, umbilical
High-arched palate
Hydrocele
Hypertelorism
Imperforate hymen
Laryngeal stridor
Laryngomalacia
Low slung/set ears
Macroglossia
Meckel’s diverticulum
Meconium ileus
Mental retardations (unless occurring with a syndrome/structural defect)
Metatarsus varus
Micrognathia (unless severe)
Mongolian spots
Occiput, flat/prominent
Patent ductus arteriosus (< 37 weeks)
Philtrum, long/short
Plagiocephaly
Pre-auricular sinus
Prominent forehead
Protruding tongue
Ptosis
Abnormal palmar creases
Accessory nipples
Anal fissure
Balanced autosomal translocation (unless occurring with structural defects)
Birth injuries
Birth marks (< 4 cm, not including giant naevus)
Bowing of legs (unless severe)
Brushfield spots
Cephalhaematoma
Cleft gum
Clicky hips
Clinodactyly
Craniotabes (unless severe)
Dacrostenosis (blocked tear ducts)
Dermatogplyphic abnormalities
Developmental delays (unless occurring with a syndrome or structural defect)
Ear abnormalities (minor)
Epicanthic folds
Gastro-oesophageal reflux
Retrognathia (unless severe)
Rocker-bottom feet (prominent heels)
Sacral pits, dimples, sinuses
Short sternum
Simian creases
Single umbilical artery / two vessels in cord
Skin folds/tags
Slanting eyes
Small mouth
Spina bifida occulta (without evidence of spinal lesion)
Sternomastoid tumour
Subluxating knee joint
Talipes (positional)
Toe anomalies – minor
Tongue tie
Torticollis
Ureteric reflux (ultrasound diagnosed)
Webbing of 2nd and 3rd toes/fingers
Wide suture lines
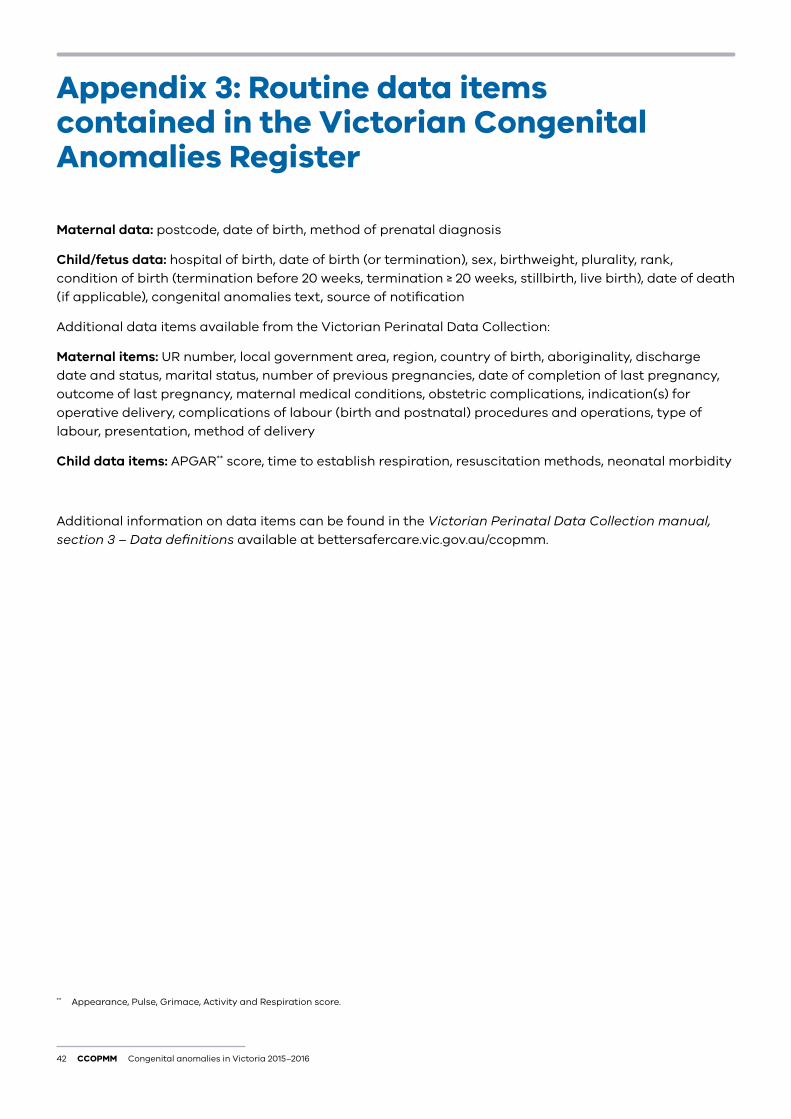
42 CCOPMM Congenital anomalies in Victoria 2015–2016
Appendix 3: Routine data items contained in the Victorian Congenital Anomalies Register
Maternal data: postcode, date of birth, method of prenatal diagnosis
Child/fetus data: hospital of birth, date of birth (or termination), sex, birthweight, plurality, rank, condition of birth (termination before 20 weeks, termination ≥ 20 weeks, stillbirth, live birth), date of death (if applicable), congenital anomalies text, source of notification
Additional data items available from the Victorian Perinatal Data Collection:
Maternal items: UR number, local government area, region, country of birth, aboriginality, discharge date and status, marital status, number of previous pregnancies, date of completion of last pregnancy, outcome of last pregnancy, maternal medical conditions, obstetric complications, indication(s) for operative delivery, complications of labour (birth and postnatal) procedures and operations, type of labour, presentation, method of delivery
Child data items: APGAR** score, time to establish respiration, resuscitation methods, neonatal morbidity
Additional information on data items can be found in the Victorian Perinatal Data Collection manual, section 3 – Data definitions available at bettersafercare.vic.gov.au/ccopmm.
** Appearance, Pulse, Grimace, Activity and Respiration score.
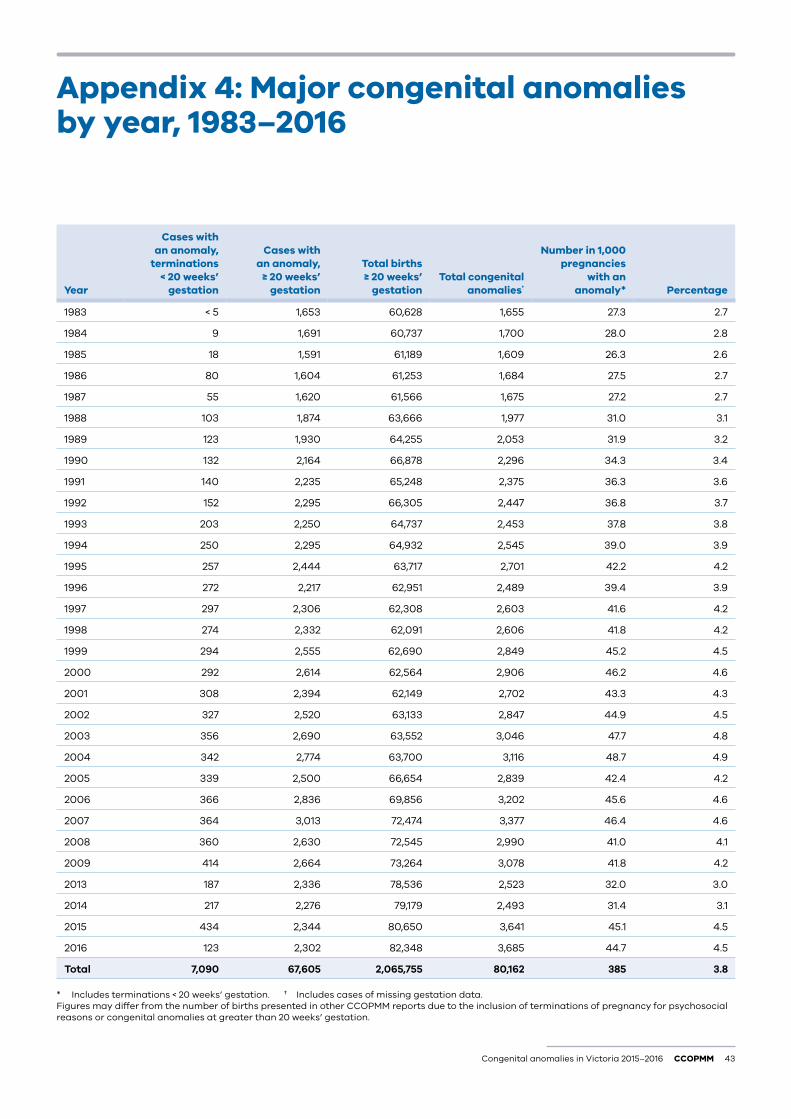
Congenital anomalies in Victoria 2015–2016 CCOPMM 43
Appendix 4: Major congenital anomalies by year, 1983–2016
Year
Cases with an anomaly,
terminations < 20 weeks’
gestation
Cases with an anomaly,
≥ 20 weeks’ gestation
Total births ≥ 20 weeks’
gestationTotal congenital
anomalies†
Number in 1,000 pregnancies
with an anomaly* Percentage
1983 < 5 1,653 60,628 1,655 27.3 2.7
1984 9 1,691 60,737 1,700 28.0 2.8
1985 18 1,591 61,189 1,609 26.3 2.6
1986 80 1,604 61,253 1,684 27.5 2.7
1987 55 1,620 61,566 1,675 27.2 2.7
1988 103 1,874 63,666 1,977 31.0 3.1
1989 123 1,930 64,255 2,053 31.9 3.2
1990 132 2,164 66,878 2,296 34.3 3.4
1991 140 2,235 65,248 2,375 36.3 3.6
1992 152 2,295 66,305 2,447 36.8 3.7
1993 203 2,250 64,737 2,453 37.8 3.8
1994 250 2,295 64,932 2,545 39.0 3.9
1995 257 2,444 63,717 2,701 42.2 4.2
1996 272 2,217 62,951 2,489 39.4 3.9
1997 297 2,306 62,308 2,603 41.6 4.2
1998 274 2,332 62,091 2,606 41.8 4.2
1999 294 2,555 62,690 2,849 45.2 4.5
2000 292 2,614 62,564 2,906 46.2 4.6
2001 308 2,394 62,149 2,702 43.3 4.3
2002 327 2,520 63,133 2,847 44.9 4.5
2003 356 2,690 63,552 3,046 47.7 4.8
2004 342 2,774 63,700 3,116 48.7 4.9
2005 339 2,500 66,654 2,839 42.4 4.2
2006 366 2,836 69,856 3,202 45.6 4.6
2007 364 3,013 72,474 3,377 46.4 4.6
2008 360 2,630 72,545 2,990 41.0 4.1
2009 414 2,664 73,264 3,078 41.8 4.2
2013 187 2,336 78,536 2,523 32.0 3.0
2014 217 2,276 79,179 2,493 31.4 3.1
2015 434 2,344 80,650 3,641 45.1 4.5
2016 123 2,302 82,348 3,685 44.7 4.5
Total 7,090 67,605 2,065,755 80,162 385 3.8
* Includes terminations < 20 weeks’ gestation. † Includes cases of missing gestation data.Figures may differ from the number of births presented in other CCOPMM reports due to the inclusion of terminations of pregnancy for psychosocial reasons or congenital anomalies at greater than 20 weeks’ gestation.
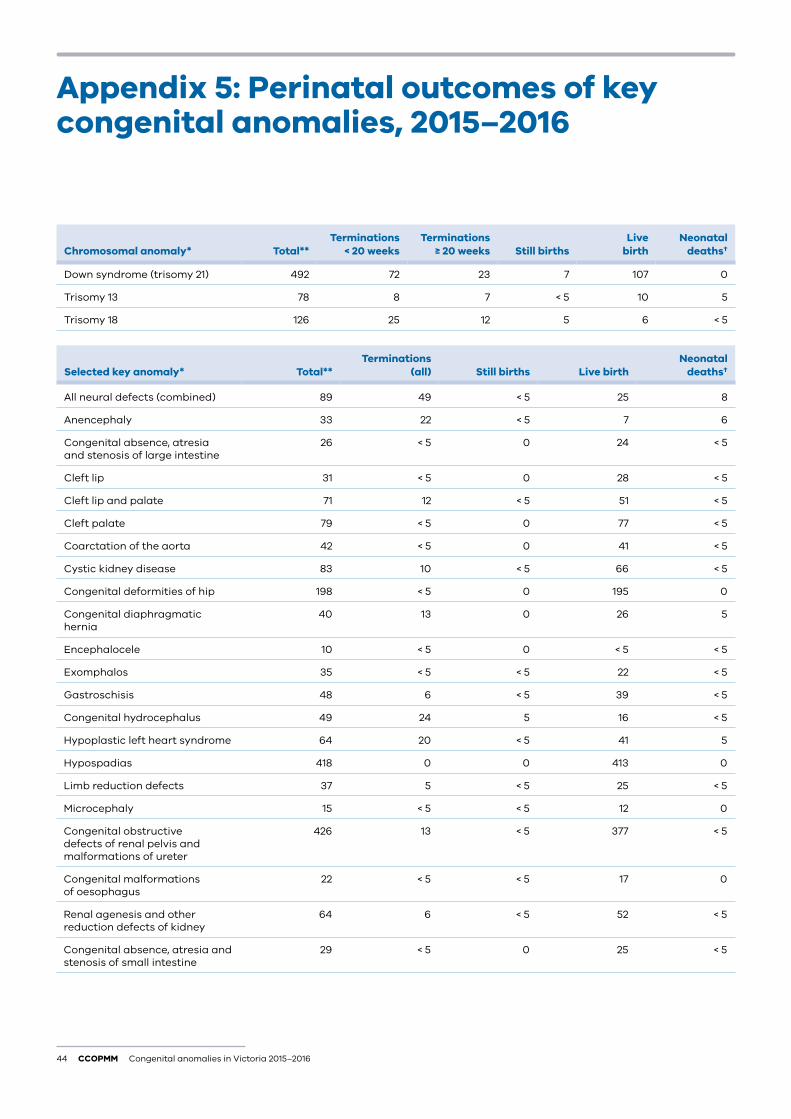
44 CCOPMM Congenital anomalies in Victoria 2015–2016
Chromosomal anomaly* Total**Terminations
< 20 weeksTerminations
≥ 20 weeks Still birthsLive
birth Neonatal
deaths†
Down syndrome (trisomy 21) 492 72 23 7 107 0
Trisomy 13 78 8 7 < 5 10 5
Trisomy 18 126 25 12 5 6 < 5
Selected key anomaly* Total** Terminations
(all) Still births Live birthNeonatal
deaths†
All neural defects (combined) 89 49 < 5 25 8
Anencephaly 33 22 < 5 7 6
Congenital absence, atresia and stenosis of large intestine
26 < 5 0 24 < 5
Cleft lip 31 < 5 0 28 < 5
Cleft lip and palate 71 12 < 5 51 < 5
Cleft palate 79 < 5 0 77 < 5
Coarctation of the aorta 42 < 5 0 41 < 5
Cystic kidney disease 83 10 < 5 66 < 5
Congenital deformities of hip 198 < 5 0 195 0
Congenital diaphragmatic hernia
40 13 0 26 5
Encephalocele 10 < 5 0 < 5 < 5
Exomphalos 35 < 5 < 5 22 < 5
Gastroschisis 48 6 < 5 39 < 5
Congenital hydrocephalus 49 24 5 16 < 5
Hypoplastic left heart syndrome 64 20 < 5 41 5
Hypospadias 418 0 0 413 0
Limb reduction defects 37 5 < 5 25 < 5
Microcephaly 15 < 5 < 5 12 0
Congenital obstructive defects of renal pelvis and malformations of ureter
426 13 < 5 377 < 5
Congenital malformations of oesophagus
22 < 5 < 5 17 0
Renal agenesis and other reduction defects of kidney
64 6 < 5 52 < 5
Congenital absence, atresia and stenosis of small intestine
29 < 5 0 25 < 5
Appendix 5: Perinatal outcomes of key congenital anomalies, 2015–2016
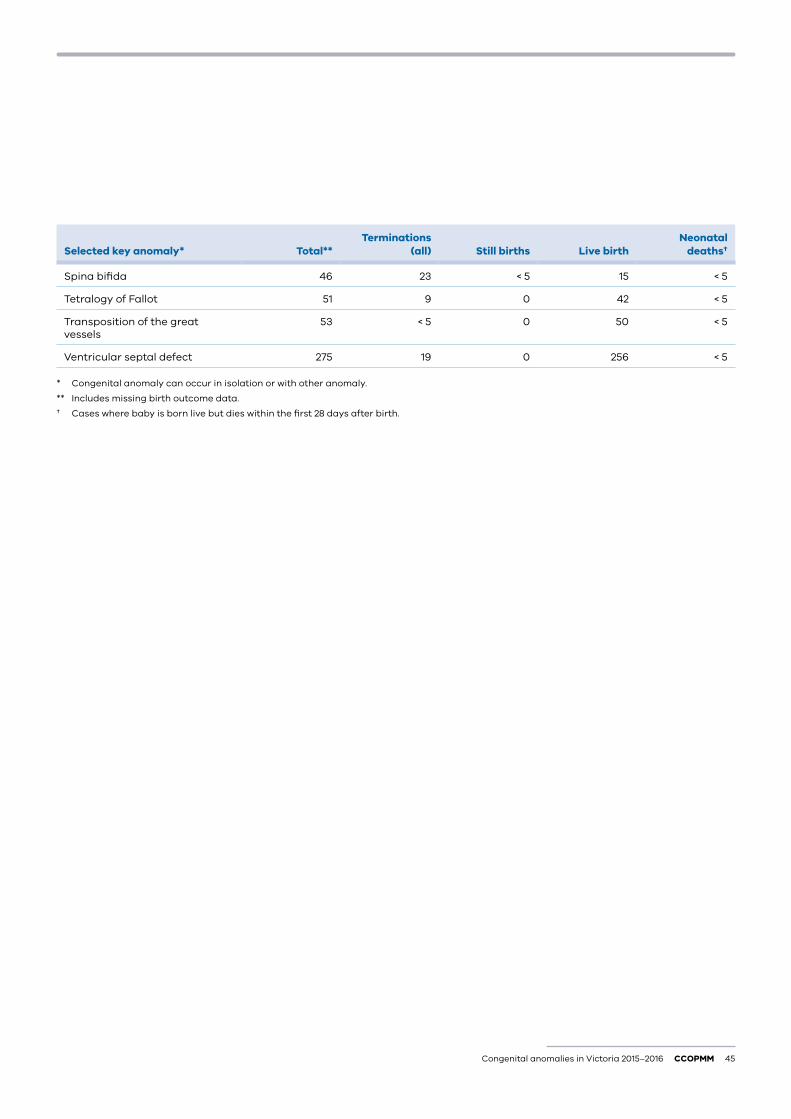
Congenital anomalies in Victoria 2015–2016 CCOPMM 45
Selected key anomaly* Total** Terminations
(all) Still births Live birthNeonatal
deaths†
Spina bifida 46 23 < 5 15 < 5
Tetralogy of Fallot 51 9 0 42 < 5
Transposition of the great vessels
53 < 5 0 50 < 5
Ventricular septal defect 275 19 0 256 < 5
* Congenital anomaly can occur in isolation or with other anomaly.
** Includes missing birth outcome data.
† Cases where baby is born live but dies within the first 28 days after birth.
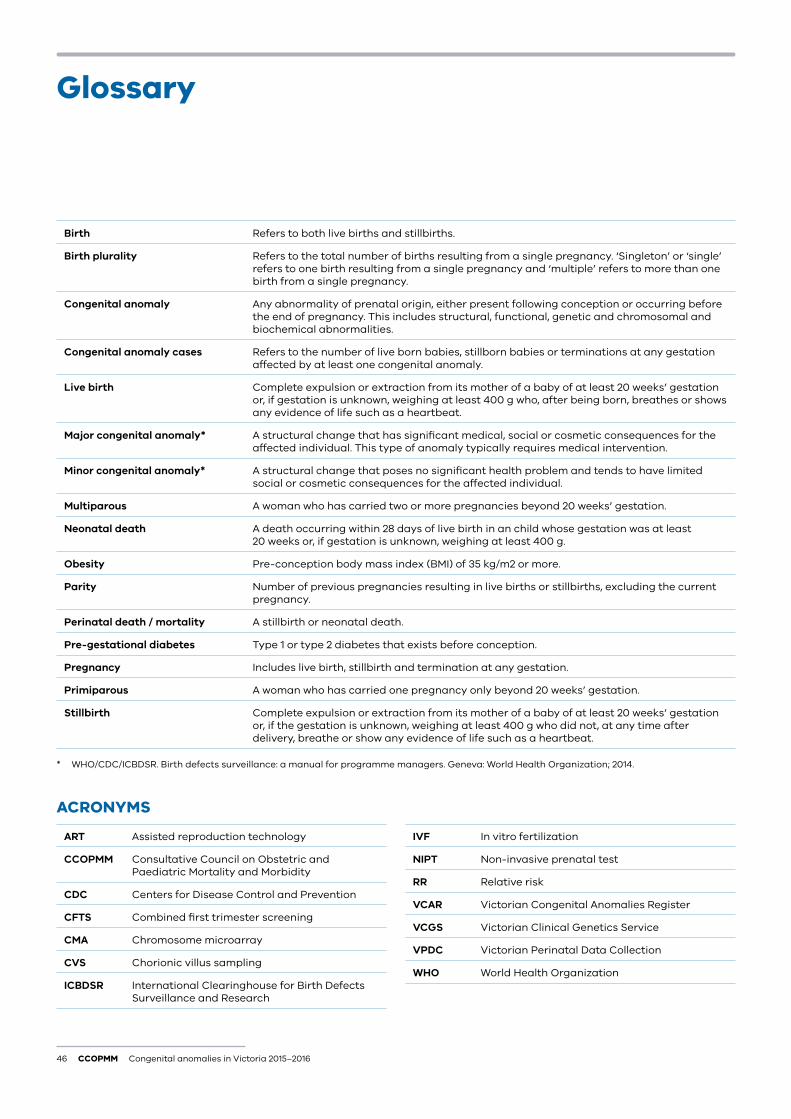
46 CCOPMM Congenital anomalies in Victoria 2015–2016
Birth Refers to both live births and stillbirths.
Birth plurality Refers to the total number of births resulting from a single pregnancy. ‘Singleton’ or ‘single’ refers to one birth resulting from a single pregnancy and ‘multiple’ refers to more than one birth from a single pregnancy.
Congenital anomaly Any abnormality of prenatal origin, either present following conception or occurring before the end of pregnancy. This includes structural, functional, genetic and chromosomal and biochemical abnormalities.
Congenital anomaly cases Refers to the number of live born babies, stillborn babies or terminations at any gestation affected by at least one congenital anomaly.
Live birth Complete expulsion or extraction from its mother of a baby of at least 20 weeks’ gestation or, if gestation is unknown, weighing at least 400 g who, after being born, breathes or shows any evidence of life such as a heartbeat.
Major congenital anomaly* A structural change that has significant medical, social or cosmetic consequences for the affected individual. This type of anomaly typically requires medical intervention.
Minor congenital anomaly* A structural change that poses no significant health problem and tends to have limited social or cosmetic consequences for the affected individual.
Multiparous A woman who has carried two or more pregnancies beyond 20 weeks’ gestation.
Neonatal death A death occurring within 28 days of live birth in an child whose gestation was at least 20 weeks or, if gestation is unknown, weighing at least 400 g.
Obesity Pre-conception body mass index (BMI) of 35 kg/m2 or more.
Parity Number of previous pregnancies resulting in live births or stillbirths, excluding the current pregnancy.
Perinatal death / mortality A stillbirth or neonatal death.
Pre-gestational diabetes Type 1 or type 2 diabetes that exists before conception.
Pregnancy Includes live birth, stillbirth and termination at any gestation.
Primiparous A woman who has carried one pregnancy only beyond 20 weeks’ gestation.
Stillbirth Complete expulsion or extraction from its mother of a baby of at least 20 weeks’ gestation or, if the gestation is unknown, weighing at least 400 g who did not, at any time after delivery, breathe or show any evidence of life such as a heartbeat.
* WHO/CDC/ICBDSR. Birth defects surveillance: a manual for programme managers. Geneva: World Health Organization; 2014.
ACRONYMS
Glossary
ART Assisted reproduction technology
CCOPMM Consultative Council on Obstetric and Paediatric Mortality and Morbidity
CDC Centers for Disease Control and Prevention
CFTS Combined first trimester screening
CMA Chromosome microarray
CVS Chorionic villus sampling
ICBDSR International Clearinghouse for Birth Defects Surveillance and Research
IVF In vitro fertilization
NIPT Non-invasive prenatal test
RR Relative risk
VCAR Victorian Congenital Anomalies Register
VCGS Victorian Clinical Genetics Service
VPDC Victorian Perinatal Data Collection
WHO World Health Organization
Congenital anomalies in Victoria 2015–2016 CCOPMM 47
References
1. Australian Institute of Health and Welfare 2017. Australia’s mothers and babies 2015—in brief. Perinatal statistics series no. 33. Cat no. PER 91. Canberra: AIHW.
2. World Health Organization. Congenital anomalies, 2015. Available at: http://www.who.int/mediacentre/factsheets/fs370/en/.
3. Vinceti M, Malagoli C, Rothman KJ, Rodolfi R, Astolfi G, Calzolari E, Puccini A, Bertolotti M, Lunt M, Paterlini L, Martini M. Risk of birth defects associated with maternal pregestational diabetes. European Journal of Epidemiology, 2014;29(6):411–8.
4. Stothard KJ, Tennant PW, Bell R, Rankin J. Maternal overweight and obesity and the risk of congenital anomalies: a systematic review and meta-analysis. JAMA. 2009;301(6):636–50.
5. Bower C, Rudy E, Callaghan A, Quick J, Nassar N. Age at diagnosis of birth defects. Birth Defects Research A, Clinical and Molecular Teratology, 2010;88(4):251–5.
6. World Health Organisation, Centers for Disease Control, International Clearinghouse for Birth Defects Surveillance and Research 2014, Birth defects surveillance: a manual for programme managers. Geneva: World Health Organization.
7. Victorian Perinatal Data Collection. Victorian Perinatal Data Collection (VPDC) Manual version. 6.0, January 2018. Available at: https://www2.health.vic.gov.au/hospitals-and-health-services/quality-safety-service/consultative-councils/council-obstetric-paediatric-mortality/perinatal-data-collection.
8. Lumley J, Palma S, Fischer M, Robertson H. The tip of the iceberg: a validation study of the Victorian Congenital Malformations/Birth Defects Register. Australian Paediatric Journal, 1988;24:244–6.
9. Kilkenny M, Riley M, Lumley J. Follow-up validation study of the Victorian Congenital Malformations Register. Journal of Paediatric and Child Health, 1995;31:323–25.
10. Riley M, Phyland S, Halliday J. Validation study of the Victorian Birth Defects Register, Journal of Paediatric and Child Health, 2004:40:544–8.
11. Riley M, Howard J, Dale K, Palma S, Halliday J. Validating notifications of pregnancy terminations for birth defects before 20 weeks’ gestation, Health Information Management, 2001;30: No.2.
12. Davey MA, Sloan ML, Palma S, Riley M, King J. Methodological processes in validating and analysing the quality of population-based data: a case study using the Victorian Perinatal Data Collection. Health Information Management Journal, 2013;42(3):12.
13. VSGS. Impact of recent advances in prenatal testing. The Partumpost, 2018:2(1), April. Available at: https://www.vcgs.org.au/sites/default/files/general/partum_post_v2i1%202018.pdf.
14. Abeywardana S, Sullivan EA 2008. Congenital anomalies in Australia 2002–2003. Birth anomalies series no. 3 Cat. no. PER 41. Sydney: AIHW National Perinatal Statistics Unit.
15. CDC ART and Multiple Births. https://www.cdc.gov/art/key-findings/multiple-births.html
16. Wen J, Jiang J, Ding C, Dai J, Liu Y, Xia Y, Liu J, Hu Z. Birth defects in children conceived by in vitro fertilization and intracytoplasmic sperm injection: a meta-analysis. Fertility and Sterility, 2012 Jun 30;97(6):1331–7.
17. Yan J, Huang G, Sun Y, Zhao X, Chen S, Zou S, Hao C, Quan S, Chen ZJ. Birth defects after assisted reproductive technologies in China: analysis of 15,405 offspring in seven centers (2004 to 2008). Fertility and Sterility, 2011 Jan 31;95(1):458–60.
18. Setti PE, Moioli M, Smeraldi A, Cesaratto E, Menduni F, Livio S, Morenghi E, Patrizio P. Obstetric outcome and incidence of congenital anomalies in 2351 IVF/ICSI babies. Journal of Assisted Reproduction and Genetics, 2016 Jun:1–7.
19. World Health Organisation: Congenital anomalies. http://www.who.int/en/news-room/fact-sheets/detail/congenital-anomalies.
20. Centre for Genetics Education: Fact Sheet 18. When parents are related – consanguinity. Available at: http://www.genetics.edu.au/publications-and-resources/facts-sheets/fact-sheet-18-when-parents-are-relatives-consanguinity.
21. Centers for Disease Control and Prevention: Commit to Healthy Choices to Help Prevent Birth Defects. https://www.cdc.gov/ncbddd/birthdefects/prevention.html.
22. The Royal Australian College of General Practitioners. Management of smoking in pregnant women. Available at: https://www.racgp.org.au/afp/2014/januaryfebruary/smoking-in-pregnant-women/.
23. Consultative Council on Obstetric and Paediatric Mortality and Morbidity 2017, Victoria’s mothers, babies and children 2016. Melbourne: Department of Health and Human Services.
24. World health Organization, Congenital anomalies, Fact sheet, Updated September 2016. Available at: http://www.who.int/mediacentre/factsheets/fs370/en/.