Embed Size (px)
Citation preview
Running head: GRAPHS AND CONFLICTING SCIENCE-RELATED TEXTS
1
Running Head: GRAPHS AND CONFLICTING SCIENCE-RELATED TEXTS
Comprehending conflicting science-related texts: Graphs as plausibility cues
accepted for publication in the journal Instructional Science (2013)
(The final publication is/will be available at http://link.springer.com)
Maj-Britt Isberner, Tobias Richter and Johanna Maier
University of Kassel
Katja Knuth-Herzig and Holger Horz
University of Frankfurt
Wolfgang Schnotz
University of Koblenz-Landau
Address for correspondence:
Maj-Britt Isberner
University of Kassel, Department of Psychology
Holländische Str. 36-38
34127 Kassel, Germany
E-mail: [email protected]
Telephone: +49-561 804 1905
Fax: +49-561 804 3586
Running head: GRAPHS AND CONFLICTING SCIENCE-RELATED TEXTS
2
Abstract
When reading conflicting science-related texts, readers may attend to cues which allow them to
assess plausibility. One such plausibility cue is the use of graphs in the texts, which are regarded
as typical of ‘hard science’. The goal of our study was to investigate the effects of the presence of
graphs on the perceived plausibility and situation model strength for conflicting science-related
texts, while including the influence of readers’ domain knowledge and their knowledge about
scientific visualization conventions as potential moderators of these effects. In an experiment
mimicking web-based informal learning, 77 university students read texts on controversial
scientific issues which were presented with either graphs or tables. Perceived plausibility and
situation model strength for each text were assessed immediately after reading; reader variables
were assessed several weeks prior to the experiment proper. The results suggest that graphs can
indeed serve as plausibility cues and thus boost situation model strength for texts which contain
them. This effect was mediated by the perceived plausibility of the information in the texts with
graphs. However, whether readers use graphs as plausibility cues in texts with conflicting
information seems to depend also on their amount of experience with scientific texts and graphs.
Keywords: graphs; multiple text comprehension; plausibility; science text comprehension
Running head: GRAPHS AND CONFLICTING SCIENCE-RELATED TEXTS
3
Comprehending conflicting science-related texts: Graphs as plausibility cues
When people read about topics which are currently debated controversially in science and
in the public – for example, the potential dangers of electromagnetic radiation – they are often
confronted with texts communicating information whose epistemic status is in dispute and
therefore unclear. Thus, building an adequate situation model – that is, a referential
representation of the situation (or state of affairs) discussed in the texts (van Dijk & Kintsch
1983) – presents a particular challenge. In this process, both characteristics of the text as well as
characteristics of the reader are likely to determine how the textual information is processed. In
particular, the subjective plausibility of the information presented by those texts may play an
important role (Lombardi & Sinatra 2012; Schroeder, Richter, & Hoever 2008). However,
readers are often unable to make in-depth judgments concerning the plausibility of the arguments
presented in scientific controversies because they lack the relevant knowledge of the content
domain. In large parts, this is due to the ever increasing complexity and dynamics of scientific
knowledge which has expanded the division of cognitive labor between members of modern
societies (Bromme, Kienhues, & Porsch 2010; Keil, Stein, Webb, Billings, & Rozenblit 2008;
Porsch & Bromme 2010). As a consequence, it seems to be a rational strategy for non-experts in
a field to consider not only the text content but also cues such as genre features when it comes to
judging the plausibility of the information which is communicated in science-related texts. One
such cue is whether or not a text contains graphs visualizing empirical data. Graphs are widely
used in science, and their prevalence is strongly correlated with the ‘hardness’ attributed to
scientific disciplines (e.g., Smith, Best, Stubbs, Johnston, & Archibald 2000). For this reason, it
seems likely that the presence of graphs is one of the genre features which readers may consider
as a plausibility cue. However, only readers possessing some experience with scientific texts and
graphs may be expected to use this cue in the comprehension of multiple texts on controversial
Running head: GRAPHS AND CONFLICTING SCIENCE-RELATED TEXTS
4
scientific issues. In the present study, we tested these assumptions in an experiment with
university students who read texts with and without graphs on two scientific controversies
currently debated in public.
The Role of Genre Features in Evaluating and Comprehending Multiple Documents
A growing body of research has been concerned with how readers learn from multiple
documents (e.g., Bråten, Strømsø, & Britt 2009; Britt, Rouet, & Perfetti 1999; Perfetti, Rouet, &
Britt 1999; Rouet, Favart, Britt, & Perfetti 1997; Stadtler & Bromme 2007; Stadtler, Scharrer, &
Bromme 2011). When learning with multiple science-related texts with conflicting information,
readers can increase their chance to achieve a coherent and adequate situational representation by
weighing the information from multiple texts according to some criteria, leading to different
strengths of the situation model for individual texts. One such criterion may be the content of the
texts themselves: For example, if readers judge texts as less plausible because they contain
argumentation errors they will also construct a weaker situation model for these texts (plausibility
effect; Schroeder et al 2008). However, non-experts are not always able to judge the plausibility
of the text content because they lack the relevant knowledge. According to the notion of a
cognitive division of labor (Keil et al. 2008), the knowledge accumulated in a society is not
distributed evenly across all of its members but forms clusters within individuals who are then
respected as experts in a specific subject area (Keil et al. 2008). In this way, the cognitive
division of labor may be regarded as an instance of the more general division of labor which
characterizes cultured societies. Just as the division of labor implies that many tasks can only be
accomplished by skilled individuals after years of training, the division of cognitive labor implies
that scientific knowledge can only be generated and evaluated competently by expert scientists.
In contrast, non-experts must rely on expert opinions to a large extent to get an understanding of
scientific controversies (Bromme et al. 2010). If this assumption holds, it becomes all the more
Running head: GRAPHS AND CONFLICTING SCIENCE-RELATED TEXTS
5
important for non-expert readers to use non-content characteristics such as genre features to make
up their mind whether they find science-related texts plausible or not. Genre features belong to
the broader category of source characteristics. In the literature on multiple text comprehension,
the term source is often used more or less synonymously with the term document. According to
Perfetti et al. (1999), the term bundles all characteristics of a document which pertain neither to
its content nor to its rhetorical goals. Thus, source characteristics include information about the
author(s) of a document such as their name(s), status, and motives, information about the context
in which a document was created, information about its formal characteristics such as language
and publication type, etc. In the domain of history where documents represent the most important
type of evidence, experts (but not novices such as high-school students) routinely apply a
sourcing heuristic which includes paying close attention to such source characteristics, which are
utilized, among other things, to assess the documents' trustworthiness (Wineburg 1991). Training
students in applying a sourcing heuristic can improve their document-based understanding of
historical events as indicated by the quality of essays they wrote on the event (Britt & Aglinskas
2002). Thus, source evaluation seems to be crucial for building an adequate mental representation
of historical events out of multiple documents.
Several studies suggest that considering source characteristics for an evaluation of
documents may also be beneficial for comprehending multiple texts on scientific issues. For
example, Bråten, Strømsø, and Salmerón (2011) found that undergraduate students differentiated
between the trustworthiness of different documents on climate change (such as excerpts from
textbooks and newspaper articles). Importantly, the students used source characteristics (e.g.,
author, publisher, or publication date) as well as the content of the texts to form their
trustworthiness judgments. A correlational study by Bråten et al. (2009) with university students
goes beyond these results by shedding light on the relationships of perceived trustworthiness and

Running head: GRAPHS AND CONFLICTING SCIENCE-RELATED TEXTS
6
comprehension of multiple documents on climate change. In this study, trustworthiness ratings of
the reliable document as well as considering document type as a criterion predicted
comprehension over and above prior knowledge.
At first sight, the reliance on non-content information such as genre features in judging
the plausibility of text information may appear to be a superficial and suboptimal strategy. Such a
view seems to be suggested by two-process models of persuasion such as the Elaboration
Likelihood Model (ELM, Petty & Cacioppo 1986) and the Heuristic-Systematic Model (HSM,
Chen & Chaiken 1999). According to these models, persuasive messages are processed via a
central route (or systematic processing strategy), directed at an evaluation of the message content
and characterized by effortful, elaborative processes, and via a peripheral route (or heuristic
processing strategy), directed at the peripheral, non-content cues (e.g., author expertise,
likeability of the source) and characterized by quick and efficient decision rules. Both models
assume that it depends on recipients' ability and motivation (for example, their intelligence and
personal involvement) and on situational factors (such as time pressure) to what extent they will
process the message via central route or peripheral route processes. The common reading of the
two-process models is that the two routes of processing are independent from one another and
that there is a trade-off between the persuasive impact of the two routes, implying that recipients
rely less on an evaluation of the message content the more they use peripheral cues (cf. the trade-
off hypothesis, Petty & Wegener 1998). However, whereas this assumption may be consistent
with much of the literature on the ELM (but see Petty & Wegener 1999), it is at variance with the
HSM and a number of empirical studies demonstrating interactions of central route and
peripheral route processes (cf. Bohner, Moskowitz, & Chaiken 1995; Reimer, Mata,
Katsikopoulos, & Opwis 2005). Thus, the persuasion literature provides evidence that source
characteristics such as genre features can be used alongside content for a thorough evaluation of
Running head: GRAPHS AND CONFLICTING SCIENCE-RELATED TEXTS
7
messages.
Starting from this general idea, the present study focuses on the question how the
presence of graphs in science-related texts affects perceived plausibility and comprehension of
the information communicated by these texts. For the purpose of the present study, graphs may
be defined as figures which contain at least one scale and convey quantitative information
(Cleveland 1984). Technically, graphs differ from many of the source characteristics which have
been investigated in previous studies (e.g., Bråten et al. 2009, 2011) because they are part of the
document itself but not, for example, characteristics of the author, the publication outlet etc.
Moreover, graphs are used to communicate quantitative information such as the results of
empirical studies. However, it is important to note that more often than not, the information
contained by graphs could as well be communicated by means of other representational devices,
most notably in form of tables or by reporting data in the text itself (for examples from the
domain of psychology, see the publication manual of the American Psychological Association
2005). In this sense, despite the fact that graphs communicate content, their presence in a science-
related text may be regarded as a genre feature which characterizes scientific texts and, in run,
can be used by readers as a cue to the plausibility of the information communicated in the text.
We will pursue this argument in more detail in the next section.
Graphs Visualizing Empirical Data as Plausibility Cues
When reading science-related documents about controversial issues, the presence of
graphs may be an important cue for assessing a documents' plausibility. According to Latour
(1990), graphs that visualize empirical data are central to science and have strong persuasive
power, because they allow displaying complex relations rather easily (Tufte 1983). As these
graphs are widely used in the so-called ‘hard sciences’, they have become generally associated
with scientificity. Accordingly, readers may perceive graphs as a kind of signal that a text
Running head: GRAPHS AND CONFLICTING SCIENCE-RELATED TEXTS
8
contains plausible information (Latour 1990).
One of the first systematic investigations of the use of graphs in different scientific
disciplines was done by Cleveland (1984). He analyzed 2300 journal articles from 46 journals
from the natural and the social sciences with respect to the relative space which graphs occupy in
the journal articles (fractional graph area). The mean fractional graph area for natural science
journals was .14 which is far larger than the mean fractional graph area of .03 in social science
journals, with almost no overlap of the distribution of the journal means. Given that a main
purpose of articles in natural science journals and social science journals alike is to present data,
this difference in graph use is striking. Smith et al. (2000) undertook an extension of Cleveland's
study by collecting 'hardness'-ratings from psychology students and scientists for the seven
scientific disciplines from which journals in his study were taken. These ratings ranged from 3
(sociology) over 6 (psychology) to 9 (physics) and showed an almost perfect linear relationship
and a correlation of .97 with the mean fractional graph areas. In addition, Smith et al. (2000)
asked the same respondents to rate the scientific 'hardness' of the subfields of 25 journals
published by the American Psychological Association. Again, they found an almost perfect linear
relationship and a correlation of .93 between the mean fractional graph areas and the ‘hardness’
attributed to the scientific disciplines (which ranged from behavioral neuroscience to educational
psychology, see also Smith, Best, Stubbs, Archibald, & Roberson-Nay 2002). Thus, there was a
strong linear and positive relationship between perceived 'hardness' and the use of graphs both
between different scientific disciplines and between different subfields of one single discipline
(psychology). In contrast, the prevalence of the two other major devices to describe quantitative
information or relationships, equations and tables, has been found to be either uncorrelated with
hardness (Arsenault, Smith, & Beauchamp 2006), or even inversely related (Smith et al. 2002).
Why are graphs used so frequently to communicate scientific results? According to Smith
Running head: GRAPHS AND CONFLICTING SCIENCE-RELATED TEXTS
9
et al. (2002), they have a number of advantages over other types of inscriptions. Most
importantly, they are more readable than, for example, tables, and facilitate the recognition and
comparison of patterns, because they combine automated perceptual processes with semantic
cognitive processes (Kosslyn 1994; Tufte 1983). They convey a sense of ‘visual witnessing’, i.e.,
a vicarious experience of the state of affairs they represent. Graphs are assumed to influence
mental model construction more directly due to their inherent structural properties (Schnotz
2005; Schnotz & Bannert 2003; Wainer 1997). Furthermore, the visual argument hypothesis
posits that graphs have a computational advantage over linguistically communicated information
(see Vekiri 2002, for an overview). For example, by coding properties and relations between
elements in a spatial manner, graphs facilitate not only recognition but also information search
and enable direct and easy perceptual inferences about abstract relationships such as relative
magnitudes or trajectories (Larkin & Simon 1987).
These features can explain why graphs are employed so frequently to communicate
empirical data in the natural sciences. This frequent use, in turn, provides a rationale for readers
to use the presence of graphs in a document as a cue to its plausibility when they are confronted
with multiple documents on controversial scientific issues whose validity they cannot evaluate
based on content alone.
Reader Characteristics in the Comprehension of Texts with Graphs
Using graphs as plausibility cues may be a rational strategy but not all readers are
expected to apply this strategy. Rather, only readers who have acquired at least a basic familiarity
with visualizations in science-related texts should be able to identify and use graphs as
plausibility cues. In order to get an idea of the use of graphs in science-related texts and their
distribution across texts associated with different degrees of 'hardness', readers must already have
gained some experience with a number of science-related texts. Thus, it seems reasonable to
Running head: GRAPHS AND CONFLICTING SCIENCE-RELATED TEXTS
10
assume that the association of graphs with plausibility is learnt and hence, the ability to use this
association in reading science-related texts increases with readers' experience. Studies which
have investigated the use of source information in the comprehension of multiple documents in
the domain of history provide some indirect support for this assumption. Several of these studies
suggest that experts make extensive use of source characteristics whereas novices often fail to use
source characteristics. Wineburg (1991), for example, found evidence for extensive use of source
information in historians reading multiple documents from their field of expertise (i.e., they
evaluated each source document before reading it, and compared information to their knowledge
as well as to information from previously read texts before integrating it into their mental model)
but not in high school students reading the same documents. Similarly, Britt and Aglinskas
(2002) found that high-school and university students often do not pay attention to source
information in learning with multiple texts until they are made aware of the fact that this
information can be a valuable cue to evaluate the source. Rouet and colleagues asked students of
psychology and students of history on a comparable level of academic training to read primary
and secondary documents about a historical event (Rouet et al. 1997). History students gave
source information more weight in rating the usefulness of documents and based their statements
in an essay on the event more strongly on primary sources than the psychology students.
Despite the fact that all of these studies refer to the domain of history and none of them
considered the role of graphs, they suggest at least indirectly that readers' experience with
scientific texts and conventions might play a role in the use of graphs as plausibility cues. In this
study, we considered two indicators of this construct: domain knowledge concerning the topic of
the text and knowledge about visualization conventions, i.e. general rules governing the design of
graphs in scientific publications. Domain knowledge is one of the most important prerequisites
and one of the most powerful predictors of comprehension. Among other things, domain
Running head: GRAPHS AND CONFLICTING SCIENCE-RELATED TEXTS
11
knowledge is essential for interpreting incoming text information and creating a stable memory
representation of the text content (Kintsch 1988), for bridging and elaborative inferences which
help readers to achieve coherent and rich representation of the text content (e.g., Best, Rowe,
Ozuru, & McNamara 2005; Graesser & Bertus 1998), and for constructing a situation model (van
Dijk & Kintsch 1983). Knowledge about visualization conventions is a specific type of
knowledge about rhetorical conventions. In text comprehension research, knowledge about
rhetorical conventions has mostly been studied with regard to generic knowledge about
conventional text structures (text or genre schemata and schematic superstructures) and linguistic
devices signaling rhetorical relationships between text ideas (e.g., Lorch, Lorch, & Inman 1993;
Meyer 1975). This type of knowledge supports readers in extracting the main ideas of texts,
drawing inferences, and integrating it with prior knowledge (van Dijk & Kintsch 1983, Ch. 7).
In the present research, we focus on a different possible role of domain knowledge and
knowledge about visualization conventions: We investigate whether these reader characteristics
make the use of graphs as plausibility cues more likely. Rouet et al. (1997) have proposed (for
the domain of history) that generic knowledge about information sources (e.g., text types) and
domain knowledge are likely to develop in close connection to each other during academic
training, with the result that they form interrelated and overlapping dimensions of individual
differences. In the present study, we adopted this proposal by assuming that domain knowledge
and knowledge about visualization conventions are closely interrelated dimensions of individual
differences which affect the use of graphs as plausibility cues in much the same way. For this
reason, both variables were treated as indicators of a more general construct which may be
termed amount of experience with scientific texts and graphs.
Another generic reader characteristic which should be of importance for the
comprehension of multiple science texts with conflicting information is the individual working
Running head: GRAPHS AND CONFLICTING SCIENCE-RELATED TEXTS
12
memory capacity for text. On a general level, working memory capacity may be regarded as the
cognitive capacity which is needed for holding information active for further processing over
relatively short periods of time but also for carrying out the cognitive processes operating on this
information (Baddeley 1986). The overall capacity is limited and varies between individuals. In
comprehending texts, readers are constantly required to actively maintain verbal information in
order to connect it to new information which is encountered later. At the same time, they need to
process this information. Thus, reading may be regarded as a dual (or rather, multiple) task which
requires working memory (Daneman & Carpenter 1980). In particular, elaborative and other
strategic cognitive activities which are particularly relevant for deep comprehension of text are
likely to draw heavily on working memory capacity. In order to control for individual differences
in this capacity, we included the Reading Span task developed by Daneman and Carpenter (1980)
which includes a storage and a processing component (the latter partly overlapping with verbal
fluency, Daneman 1991) and taps into the capacity of central executive functions in processing
verbal material.
Rationale of the Present Experiment
We investigated the effect of graphs on the processing of multiple texts with conflicting
information by asking participants to study two texts taking opposite stances on a controversial
science topic, while systematically varying the presence of graphs in the texts. The graphs
conveyed only information that was already provided by the text itself. Furthermore, the
information conveyed in the graphs was peripheral with regard to the scientific controversy. This
ensured that any effect of the presence of graphs could be attributed to the graphs serving as a
plausibility cue, rather than to the graphs facilitating comprehension or enhancing the
argumentative power of the text in which they were embedded.
We presented the texts in a web-based environment mimicking an informal learning
Running head: GRAPHS AND CONFLICTING SCIENCE-RELATED TEXTS
13
setting. The web-based environment was designed in a way that broadly resembled the design of
an online science magazine with an entry page that provided titles and short "teaser" texts along
with links to the two experimental texts. Each text was either presented with two graphs – which
should induce an impression of scientificity, thereby increasing the perceived plausibility of the
text for readers familiar with scientific conventions – or with two tables, which should not have
this effect because of the nonexistent (or inversed) relationship between the use of tables and
perceived scientificity (Arsenault et al. 2006; Smith et al. 2002). Two instances of graphs and
tables were used in order to achieve a stronger manipulation. According to Arsenault et al. (2006)
and Smith et al. (2002), the perceived scientificity of a publication depends on the amount of
graphs in a text rather than the mere presence of graphs. In order to test the generalizability of the
results, we used texts on two different controversies: the dangers of electromagnetic radiation and
the potential of biomass as the ecological energy source of the future.
The strength of the situation model and plausibility ratings for information conveyed by
the texts were assessed as dependent variables. As potential moderator variables of the effects of
the presence of graphs on situation model strength and plausibility ratings, domain knowledge
and knowledge of scientific visualization conventions were assessed several weeks prior to the
experiment proper. Both types of knowledge were assumed to be aspects of one underlying and
more general construct, i.e. the amount of experience with scientific texts and graphs, and to exert
the same effects. Accordingly, they were combined into one variable in the primary analyses. In
order to back up this interpretation, additional analyses were conducted in which the two types of
knowledge were entered as separate variables. Considering its relevance for integrating
information within and across texts and other types of elaborative processing, working memory
capacity (measured with the Reading Span task, Daneman & Carpenter 1980) was included as a
control variable.
Running head: GRAPHS AND CONFLICTING SCIENCE-RELATED TEXTS
14
As discussed previously, the presence of graphs is strongly associated with perceptions of
publications as instances of ‘hard science’ (Smith et al. 2002), which suggests that the presence
of graphs makes the information contained in a text appear more plausible, even when the graphs
do not provide any information over and above the text itself. However, not all readers should be
able to use graphs as cues to the plausibility of a text. Rather, the use of graphs as plausibility
cues presupposes a basic amount of experience with scientific texts, including the way graphs are
used in these texts. Therefore, we expected the effect of graphs on the perceived plausibility of
the information conveyed by the texts to be moderated by the amount of experience with science
texts and graphs (Hypothesis 1). A positive effect of graphs on the perceived plausibility of text
information should occur only in readers who possess a relatively high amount of experience
with scientific texts and graphs and it should increase with readers' experience. Furthermore, we
assumed – in line with the plausibility effect (Schroeder et al. 2008) –, that readers who perceive
the text with graphs as more plausible should also weight this text more strongly in situation
model construction (Hypothesis 2). Finally, we expected the former effects to be mediated by the
latter (Hypotheses 3; mediated moderation, Muller, Judd, & Yzerbyt 2005).
Method
Participants
Seventy-seven students (55 women and 22 men) from the University of Cologne
(Germany) and the University of Applied Sciences in Olten (Switzerland) with an average age of
29.1 years (SD = 7.4) participated in the study. Their domains of study were psychology (33.3%),
applied psychology (61.5%), and other social sciences (5.1%), all of which involve reading of
scientific texts but have little overlap with the topics of the experimental texts used in this study.
Most of the students (94.7%) were at the bachelor level (≤ 6 semesters), with none below the
second semester (average number of semesters: M = 4.03, SD = 2.01). They received course
Running head: GRAPHS AND CONFLICTING SCIENCE-RELATED TEXTS
15
credits for participation.
Text and Picture Material
Texts. Four accessible texts about two currently debated and controversial scientific
issues were used as experimental texts. Two of the texts discussed biomass as the ecological
source of energy of the future whereas the other two texts discussed potential health risks of
electromagnetic radiation emitted by cell phones. In a pilot study with 12 topics, an independent
sample of 120 university students had rated these two topics as mildly interesting (biomass: M =
2.32, SD = 1.20; electromagnetic radiation: M = 2.01, SD = 1.10; ratings on a scale from 0 = not
interesting at all to 4 = very interesting). They were selected because agreement to both sides of
the controversy was nearly balanced. We asked participants in the pilot study to rate their
agreement with two statements which represented the core arguments of either side of the
controversy (e.g., Can bio fuels produced from plants [e.g., bio fuels made out of corn] secure
our energy supplies in the future? Position A: Substituting fossil fuels by biomass can decrease
carbon dioxide emissions. Therefore bio fuels made out of plants are more eco-friendly than
fossil fuels. Position B: The mass production of biomass requires extending agriculture at the
expense of rain forests. Therefore the ecobalance of bio fuels made out of plants is negative.) For
the two selected topics, the mean agreement differences were the smallest of all 12 topics
(biomass: M = 0.03, SD = 1.60; electromagnetic radiation: M = 0.38, SD = 1.44; ratings were
provided on a scale from 0 = do not agree to 4 = fully agree).
The texts were constructed on the basis of science-related journal articles from reputable
German magazines which are accessible over the internet (e.g., Spiegel Online,
http://www.spiegel.de; Spektrum der Wissenschaft, http://www.spektrum.de). In a first step, two
texts taking the same stance in the controversy were constructed for each topic, resulting in eight
texts in total with a length of approximately 1200 words (range: 1186 – 1209 words). These eight
Running head: GRAPHS AND CONFLICTING SCIENCE-RELATED TEXTS
16
texts were pilot-tested with an independent sample of 225 university students, each of whom
judged two of the texts with regard to their difficulty, credibility, and the number, quality, and
clarity of the arguments in each text. Based on these ratings, we chose a subset of four texts (two
for each issue) that were comparable to each other regarding all of the characteristics (ranges of
characteristics measured with a 7 point scale, with 1 marking the low and 7 the high end of the
scale: comprehensibility: 5.3 – 5.8, plausibility: 4.7 – 5.3, interestingness: 4.6 – 5.7, ease of
identifying the text’s position in the controversy: 4.6 – 5.3; range of perceived number of
arguments measured with an open question: 5 – 6.1). The average readability score (determined
with the German adaption of the Flesch’s Reading Ease Index, Amstad 1978) was 52.5 with a
range from 50 to 55, indicating moderate difficulty. The two texts selected for each topic
represented contrary positions in the controversy. Accordingly, one of the texts on biomass
argued for the claim that biomass has the potential to be the ecological energy of the future (pro
stance) whereas the other text claimed that biomass is not an ecologically beneficial substitute for
mineral oil (contra stance). Likewise, one of the texts on electromagnetic radiation emitted by
cell phones argued for the claim that cell phones cause health risks (pro stance) whereas the other
text argued against this position (contra stance).
Graphs. For each of the texts, two graphs (one line graph and one box plot) and two
tables providing the same information as the graphs were constructed (see Appendix for an
example). Both graphs and tables only contained information that was also given in the text itself.
Moreover, the information that was provided in the graphs and tables was not essential for
understanding the text and did not contribute to the strength of its arguments (for example, one
graph displayed the percentage of people who reported that they could not live without their cell
phones).
Dependent Variables
Running head: GRAPHS AND CONFLICTING SCIENCE-RELATED TEXTS
17
Situation model strength. Situation model strength was assessed with 24 test items
(sentences) per text with a verification task (modified after Schmalhofer & Glavanov 1986).
Participants’ task was to judge for each test item whether it matched the state of affairs described
in the text or not. Out of the 24 test items, eight were paraphrases of sentences from the text,
eight were inferences not explicitly provided by the text but matching its contents, and eight were
distracters that did not represent a sensible inference from the text but shared some superficial
content aspects. Paraphrase items were constructed by changing the word order of a sentence
included in the text and replacing content words with synonyms. In this way, the similarity of the
sentence to the text surface was reduced but the explicit content of the sentence was kept intact.
In contrast, inference items represented information that participants had to infer to build an
adequate situation model of the text content.
The measure for situation model strength was based on the proportions of yes-responses
to inference items and yes-responses to distracter items in the verification task. First, these
proportions were probit-transformed to normalize their distributions. The probit transformation is
based on the assumption that the proportion reflects the cumulative proportion of a normally
distributed variable. The proportion is probit-transformed by determining the corresponding z-
value to which 5 is added to avoid negative values (e.g., Cohen, Cohen, West, & Aiken 2003, p.
241). Afterwards, the probit-transformed proportions of yes-responses to the distracter items were
subtracted from the probit-transformed proportions of yes-responses to the inference items
(similar to computing the signal detection measure d’, see Schmalhofer & Glavanov 1986 for
details).
Plausibility. For each of the paraphrase items used in the verification task, participants
also indicated (in a separate block of responses) whether they found the statement expressed in
the item plausible (“yes”) or not (“no”). They were instructed to consider in their judgment
Running head: GRAPHS AND CONFLICTING SCIENCE-RELATED TEXTS
18
whether they hold the view that the statement is (likely to be) true or not. They were also told that
there were no correct or incorrect answers but that they were asked to express their personal
opinion. For each text, we calculated the proportion of paraphrases that participants found
plausible as an indicator of perceived plausibility.
Assessment of Reader Characteristics
Amount of experience with scientific texts and graphs. A measure of the amount of
experience with scientific texts and graphs was based on two knowledge tests, prior (domain)
knowledge and knowledge about visualization conventions. Prior knowledge of the two issues
was assessed with multiple choice questions (one correct answer, two distracters, and the
possibility to indicate nescience). The two scales reached internal consistencies (Cronbach’s α) of
.64 for the biomass issue (16 items) and .64 for the electromagnetic radiation issue (18 items)
(internal consistencies for each topic estimated for the subsamples of participants who later
received experimental texts on the topic). The mean item difficulties were .26 (biomass) and .28
(electromagnetic radiation) in the present sample, indicating an overall low level of prior domain
knowledge. Participants’ knowledge about visualization conventions in scientific texts was
measured with a multiple choice test (one correct answer, two distracters, and the possibility to
indicate nescience). The test comprised questions concerning characteristics of scientific texts,
the use of graphics in scientific texts in general, as well as the use of boxplots and line graphs in
particular (e.g., What can be read off the ordinate in a line graph? a) The values of the dependent
variable, b) the deviation of measured values from expected values, c) the extreme values, d) I
don’t know). The test consisted of 21 items and reached an internal consistency (Cronbach’s α) of
.61 in the present sample. Based on the assumption that prior domain knowledge and knowledge
about visualization conventions represent two partly overlapping but complementary facets of
general scientific literacy skills, these two variables were combined into one measure of the
Running head: GRAPHS AND CONFLICTING SCIENCE-RELATED TEXTS
19
amount of experience with scientific texts and graphs by computing and averaging the z-scores of
the two variables.
Working memory capacity. Participants’ working memory capacity was measured with
a computer-based version of the Reading Span (Oberauer, Süß, Schulze, Willhelm, & Wittmann
2000). The Reading Span task is a complex span task that requires participants to memorize
information while performing other mental operations. Participants judge the validity of true
(e.g., Every bike has two wheels) and false (e.g., The sun fits into a closet) sentences which are
presented in cycles of three up to seven sentences. At the end of each cycle, they are asked to
write down the final words of all sentences presented in that cycle. The mean proportion of end-
of-sentence words which were remembered in the correct order was taken as an indicator of
participants’ working memory capacity. In terms of Baddeley’s (1986) working memory model,
the Reading Span task draws on the capacity of the central executive and the phonological loop,
both of which are central to text comprehension and reading.
Procedure
The assessment of the reader characteristics at both universities as well as the experiment
proper in Cologne took place in group sessions with up to 6 participants in lab rooms or computer
rooms of the participating universities. In Olten, for practical reasons, the experiment proper was
conducted in a classroom with all 48 participants simultaneously. The experiment was supervised
and it was made sure that participants worked individually. Participants read either the two texts
on biomass or the two texts on electromagnetic radiation in a self-paced fashion. The texts were
presented browser-based in form of an online web-site that mimicked typical informal learning
settings. The layout of the webpage was simple and held constant over all experimental
conditions. Thus, it provided no hints concerning the trustworthiness of the webpage. On the
entry page, participants were provided with the text headlines and could choose which text they
Running head: GRAPHS AND CONFLICTING SCIENCE-RELATED TEXTS
20
wanted to read first. When they had finished reading one text, participants performed the
verification task on the test items for this text. The verification task was followed by a
recognition task for the same set of items (results are not reported here). Finally, participants
provided plausibility judgments for the test items. In all tasks participants gave their responses by
selecting one of two radio buttons labeled ‘yes’ and ‘no’. The test items were presented in a
different fixed random order in each task. After reading one text and responding to the test items,
participants repeated the same steps for the second text. The reason why comprehension and
plausibility assessments were administered right after each text rather than at the end of the
reading phase was that text position effects (such as a memory advantage for the second text)
should be excluded. At the end of the experiment, participants were thanked and debriefed.
Relevant reader characteristics were assessed on a separate occasion four weeks prior to the
experiment proper in order to minimize carry-over effects.
Design
The core experimental design was a one factorial (presence of graphs: graphs vs. tables)
within-subjects design. In addition, the topic of the texts (biomass vs. electromagnetic radiation)
was controlled for as a between-subjects factor. The combination of the presence of graphs with
text stance (pro vs. contra), the order in which links to the texts were presented on the entry page
of the experiment (for all participants, this order was identical to the order in which the texts were
read), and the order of subsequent assessments were counterbalanced across participants by
means of eight experiment versions per topic. Participants’ working memory capacity and their
amount of experience with scientific texts and graphs served as covariates.
Results
Our hypotheses on the role of graphs as plausibility cues in the comprehension of
conflicting science-related texts were tested by three sets of interrelated analyses. First, we tested
Running head: GRAPHS AND CONFLICTING SCIENCE-RELATED TEXTS
21
whether the perceived plausibility of information from texts with graphs compared to texts with
tables increased with participants’ amount of experience with scientific texts and graphs
(Hypothesis 1). For these analyses, we used a variant of ANCOVA that allows modeling
interactions of covariates and within-subjects factors (Judd, Kenny, & McClelland 2001).
Second, we used the same type of model to test whether participants who perceived the
text with graphs as more plausible also built a stronger situation model for this text (plausibility
effect; Hypothesis 2). In these analyses, the differences of perceived plausibility between the text
with graphs and the text with tables were included as covariate. Amount of experience with
scientific texts and graphs was included as additional covariate.
In a third set of analyses, we addressed the question of whether the hypothesized
interactions of amount of experience with scientific texts and graphs on the one hand with the
presence of graphs on the other hand would exert indirect effects on situation model strength
through perceived plausibility. Technically, Hypotheses 1 and 2 imply a mediated moderation
model because the interaction effects of amount of experience and the presence of graphs in the
text on situation model strength are assumed to be mediated by perceived plausibility (Muller et
al. 2005). Interactions of a metric covariate and a within-subjects treatment with two levels are
equivalent to main effects of the covariate with the differences between the two treatment levels
as dependent variables (Judd et al. 2001, p. 119). Accordingly, the mediated moderation
relationships implied by our hypotheses can be addressed by estimating and testing the indirect
effects that amount of experience with scientific texts and graphs (Hypothesis 3) exerts on the
differences in situation model strength (dependent variable) through the differences in perceived
plausibility (mediating variable) between the text with graphs and the text with tables.
For estimating the standard errors of the indirect effects and testing them for significance,
we used the bootstrapping technique proposed by Preacher and Hayes (2008). Bootstrapping is
Running head: GRAPHS AND CONFLICTING SCIENCE-RELATED TEXTS
22
superior to alternative techniques for testing indirect effects (such as the Sobel test or the
stepwise procedure proposed by Baron & Kenny 1986) because it does not rely on the
assumption that the sampling distribution of the indirect effect is normal. The assumption of
normality is often unrealistic, particularly in small samples. The bootstrapping technique usually
yields greater power than the alternative techniques while keeping type-I error low (Hayes 2009;
Preacher & Hayes 2008; Shrout & Bolger 2002).
In all analyses, the text topic, the assignment of texts to the conditions with graphs or with
tables, the order in which texts were read, and participants’ working memory capacity were
included as control variables. Categorical predictors (text topic, assignment of texts to
experimental conditions, reading order of the texts) were contrast-coded (-1 vs. 1) and continuous
predictors (amount of experience with scientific texts and graphs, working memory capacity,
differences in perceived plausibility) were z-standardized prior to entering them into the model.
All hypothesis tests were based on a type-I-error probability of .05. Table 1 provides descriptive
statistics and correlations of the theoretically relevant variables and major control variables.
Effects of Graphs on Perceived Plausibility
Hypothesis 1 predicted that a text with graphs would be perceived as more plausible by
participants with relatively strong experience with scientific texts and graphs but not by
participants with relatively weak experience. An ANCOVA for within-subject designs with
amount of experience with scientific texts and graphs as covariate and the proportion of
paraphrases of text sentences judged as plausible as dependent variable yielded an interaction of
amount of experience with scientific texts and graphs and the presence of graphs, F (1, 70) = 6.5,
p < .05, η2 = .09. For interpreting the interaction, we estimated the simple slopes of amount of
experience with scientific texts and graphs for the plausibility judgments concerning the text with
Running head: GRAPHS AND CONFLICTING SCIENCE-RELATED TEXTS
23
graphs and the text with tables (Figure 1). In addition, we estimated and compared the perceived
plausibility of the text with graphs and the text with tables for participants with a relatively high
amount of experience (one standard deviation above the sample mean) and participants with a
relatively low amount of experience (one standard deviation below the mean). Please note that
these comparisons do not reflect estimates for groups of participants but exemplary point
estimates of the differences between the text with graphs and the text with tables at specific
values of the covariate. In line with Hypothesis 1, the perceived plausibility of the text with
graphs increased with participants’ amount of experience with scientific texts and graphs (B =
0.05, SEB = 0.02, p = .05, one-tailed, ∆R2 = .05) whereas the slope of this variable was not
significant in the text with tables (B = -0.02, SEB = 0.02, p = .17, one-tailed). Participants with a
relatively high amount of experience perceived the text with graphs as more plausible (M = .78,
SEM = 0.03) than the text with tables (M = .74, SEM = 0.03) although this difference was not
significant at one standard deviation above the sample mean, t (69) = 1.4, p = .09 (one-tailed). In
contrast, participants with a relatively low amount of experience perceived the text with tables as
more plausible (M = .77, SEM = 0.03) than the text with graphs (M = .69, SEM = 0.03), t (69) = -
2.25, p < .05 (one-tailed). In sum, the interaction largely matched the pattern predicted by
Hypothesis 1 except for the finding that the plausibility disadvantage for the text with graphs at a
relatively low level of experience was more pronounced than the plausibility advantage at a
relatively high level of experience. Apart from the interaction effect predicted by Hypothesis 1,
no other effects were significant.
In supplementary analyses, we explored whether the predicted interaction of the presence
of graphs with amount of experience with scientific texts and graphs would also be obtained with
each of the two component variables, domain knowledge and knowledge about visualization
Running head: GRAPHS AND CONFLICTING SCIENCE-RELATED TEXTS
24
conventions. In a model with domain knowledge as covariate the interaction of this variable
marginally failed to reach significance, F (1, 70) = 3.9, p = .05, η2 = .05. In the model with
knowledge about visualization conventions as covariate the corresponding interaction was
slightly stronger and significant, F (1, 70) = 4.2, p < .05, η2 = .06. In a model including both
covariates their interactions with the presence of graphs were no longer significant.
In sum, the ANCOVA results for perceived plausibility as dependent variable largely
corroborated Hypothesis 1. The higher participants' amount of experience with scientific texts
and graphs, the more they were inclined to perceive the information provided by the text with
graphs as more plausible than the information provided by the text with tables. Interestingly, the
pattern of the interaction was such that participants with less experience did not perceive both
texts as equally plausible but found the text with tables more plausible than the one with graphs.
In other words, whereas graphs served as plausibility cues for participants with a relatively high
amount of experience with scientific texts and graphs, the absence of graphs (or the presence of
tables that replaced them) seemed to play a similar role for participants with a relatively low
amount of experience. However, it must be noted that this part of the interaction was not
predicted and can be interpreted in several ways. We will return to this issue in the Discussion.
In the supplementary analyses, domain knowledge and knowledge about visualization
conventions tended to exert parallel and overlapping effects on the use of graphs as plausibility
cues, each of which are weaker than the effect of the combined variable. Taken together, this
pattern of results supports the idea that as far as the use of graphs as plausibility cues is
concerned, domain knowledge and knowledge about visualization conventions may be regarded
as aspects of one underlying construct.
Effects of Graphs on Situation Model Strength
Running head: GRAPHS AND CONFLICTING SCIENCE-RELATED TEXTS
25
According to Hypothesis 2, participants perceiving the text with graphs as more plausible
should also weight this text more strongly in situation model construction compared to the text
with tables (plausibility effect, Schroeder et al. 2008). An ANCOVA with the differences in
perceived plausibility (plausibility of the text with graphs minus plausibility of the text with
tables, with a symmetrical distribution around a mean not significantly different from zero, t (77)
= -0.79, p = .43) and amount of experience with scientific texts and graphs as covariates and
situation model strength as dependent variable revealed an interaction of the differences in
perceived plausibility with the presence of graphs, F (1, 69) = 4.2, p < .05, η2 = .06. The pattern
underlying the interaction was consistent with Hypothesis 2 (Figure 2a). The differences in
perceived plausibility did not have an effect on the situation model for the text with graphs (B =
0.00, SEB = 0.10, p = .50, one-tailed) but exerted a negative effect on the situation model for the
text with tables (B = -0.22, SEB = 0.09, p < .05, one-tailed, ∆R2 = .06). Participants who perceived
the text with graphs as the more plausible one (point estimate at a plausibility difference of one
standard deviation above the mean) also showed a stronger situation model for this text (M =
1.96, SEM = 0.13) than for the text with tables (M = 1.70, SEM = 0.12), t(69) = 1.7, p < .05 (one-
tailed). In contrast, in participants who perceived the text with graphs as the less plausible one
(point estimate at a plausibility difference of one standard deviation below the mean), situation
models for the text with graphs and the text with tables did not differ in strength, t(69) = -1.3, p =
.10 (one-tailed).
In addition to the effect of perceived plausibility, we found a strong positive main effect
of working memory capacity, F (1, 69) = 14.2, p < .001, η2 = .17. Moreover, there was a positive
overall effect of amount of experience with scientific texts and graphs on situation model
strength, F (1, 69) = 6.4, p < .05, η2 = .08. However, this effect was qualified by an ordinal
Running head: GRAPHS AND CONFLICTING SCIENCE-RELATED TEXTS
26
interaction of amount of experience and the presence of graphs, F (1, 69) = 4.2, p < .05, η2 = .06.
Simple slopes analyses revealed a pattern of effects of amount of experience with scientific texts
and graphs that ran counter that of perceived plausibility (Figure 2b). Whereas the effect of
amount of experience on the situation model for the text with graphs was positive but not
significant (B = 0.08, SEB = 0.10, p = .20, one-tailed), there was a strong positive effect on the
situation model for the text with tables (B = 0.31, SEB = 0.10, p < .01, one-tailed, ∆R2 = .12).
Taken together, the data exhibited the plausibility effect in favor of the situation model for
the text with graphs as predicted by Hypothesis 2. Interestingly, we also found a positive effect of
amount of experience with scientific texts and graphs but only for the text with tables. One
possible interpretation of this effect, which runs counter the plausibility effect, is that sufficient
amount of experience with scientific texts prompted participants to elaborate on the content of the
text they found less plausible. We will follow this issue up in more detail in the Discussion
section.
Indirect Effects on Situation Model Strength Through Perceived Plausibility
The final set of analyses aimed at linking the results reported in the previous two sections
to each other by establishing mediation effects. Combining Hypothesis 1 and Hypothesis 2,
Hypothesis 3 predicted an indirect effect of the interaction of amount of experience with
scientific texts and graphs on the one hand and the presence of graphs on the other hand on
situation model strength through perceived plausibility. In particular, the stronger participants’
amount of experience with scientific texts and graphs, (a) the more they should be inclined to
perceive the text with graphs as more plausible than the text with tables (mediator), and (b) the
more they perceive the text with graph as more plausible than the text with tables, in turn, the
stronger the situation model for the text with graphs should be relative to the situation model for
Running head: GRAPHS AND CONFLICTING SCIENCE-RELATED TEXTS
27
the text with tables (dependent variable). Together, these two paths should form an indirect effect
of the amount of experience with scientific texts and graphs on the differences of the two texts in
situation model strength (text with graphs minus text with tables) via their differences in
perceived plausibility.
Figure 3 provides the path coefficients for the mediator model implied by Hypothesis 3.
Consistent with this hypothesis and with the previous analyses, the coefficients of the path from
amount of experience with scientific texts and graphs to the differences in perceived plausibility
and of the path from the differences in perceived plausibility to the differences in situation model
strength were positive and significantly different from zero. The estimate of the indirect effect
from amount of experience with scientific texts and graphs via differences in perceived
plausibility to the differences in situation model strength was 0.066, with the 90%-confidence
interval ranging from 0.013 to 0.167 (bias-corrected estimates, 5000 bootstrap samples; cf.
Preacher & Hayes 2008). The fact that the 90%-confidence interval does not include zero implies
that the indirect effect of amount of experience with scientific texts and graphs on the differences
in situation model strength via the differences in perceived plausibility was significant at a type-I
error probability of .05 (one-tailed). Accordingly, Hypothesis 3 was supported.
The mediator model revealed additional findings of interest (Figure 3). On top of its
positive indirect effect via the differences in perceived plausibility, amount of experience with
scientific texts and graphs exerted a negative direct effect on the differences in situation model
strength. Thus, the negative direct effect of experience on the situation model difference canceled
out its positive indirect effect. As noted already for the ANCOVA results for situation model
strength, this pattern of effects might be explained by assuming that amount of experience with
scientific texts and graphs is involved in different and sometimes antagonistic processing routes.
On the one hand, it increases the likelihood that graphs are perceived as plausibility cues,
Running head: GRAPHS AND CONFLICTING SCIENCE-RELATED TEXTS
28
yielding an advantage for the text with graphs. On the other hand, amount of experience with
scientific texts and graphs might also be the basis for other types of elaborative processing which
might have counteracted the effects of perceived plausibility on situation model strength. We will
return to this issue in the Discussion.
Discussion
In order to test the hypothesis that graphs can serve as plausibility cues und thus influence
the processing of science-related texts on a controversial topic, we asked participants to read two
texts taking opposite stances on a controversial scientific issue while varying the presence of
graphs in the texts. As dependent variables, we measured situation model strength for each text
after reading, as well as plausibility ratings for information contained in the texts. As reader
variables, amount of experience with scientific texts and graphs (comprising the two aspects
domain knowledge and knowledge of scientific visualization conventions) and working memory
capacity were assessed several weeks prior to the experiment proper and included in the analysis
as covariates.
In line with our predictions, we found an interaction of the presence of graphs and the
amount of experience with scientific texts and graphs on perceived plausibility. This interaction
was due to the fact that amount of experience with scientific texts and graphs had a significant
effect only on the processing of the text with graphs: The higher the amount of experience, the
higher the perceived plausibility of the text with graphs. As a result, readers with a relatively
higher amount of experience tended to perceive the text with graphs as more plausible than the
text with tables. This supports the general assumption that graphs can enhance the perceived
plausibility of the information they accompany when readers possess experience with scientific
texts and graphs. The finding supports the notion that readers with a relatively higher amount of
experience are aware of the association of graphs with scientificity (e.g., Smith et al.2000). It is
Running head: GRAPHS AND CONFLICTING SCIENCE-RELATED TEXTS
29
also in line with the suggestion by Rinck (2008) that readers with more experience in reading
graphs may rely more heavily on graphical information when reading scientific texts. However, it
must be noted that we also found that readers with a relatively low amount of experience with
scientific texts and graphs tended to perceive the text with graphs as less plausible than the text
with tables. This part of the interaction of the presence of graphs with readers' amount of
experience with scientific texts and graphics was not predicted and thus is open for interpretation.
It seems possible, for example, that the graphs (in particular the somewhat less common
boxplots), which did not really provide information over and above the text itself, introduced
extraneous cognitive load in participants with a relatively low amount of experience, which might
have led to a lower proportion of plausibility judgments by decreasing processing fluency (for the
fluency-plausibility link, see, for example, Brown & Nix 1996).
The more participants perceived the text with graphs as more plausible than the text with
tables, the weaker was their situation model for the text with tables. Thus, the data exhibited a
plausibility effect (Schroeder et al. 2008), which means that information which is perceived as
plausible was weighed more strongly in situation model construction, and that less plausible
information was more likely to be rejected. However, the plausibility effect, which puts the text
with tables at a disadvantage, was cancelled out by a reverse direct effect of the amount of
experience with scientific texts and graphs: The higher the amount of experience, the stronger the
situation model for the text with tables.
Using path analysis, we were able to connect these two sets of findings in one single
mediation model. In particular, we found support for the idea that the use of graphs as a
plausibility cue by participants with a relatively high amount of experience with scientific texts
and graphs and, in turn, the effects of perceived plausibility on situation model strength form a
mediational pathway. Through this pathway, amount of experience with scientific texts and
Running head: GRAPHS AND CONFLICTING SCIENCE-RELATED TEXTS
30
graphs benefits comprehension of the text with graphs by increasing its relative plausibility.
However, there was also a direct effect of the amount of experience with scientific texts and
graphs on situation model strength which ran counter the mediational effect of the amount of
experience through plausibility. This effect attenuated the situation model difference between the
text with graphs and the text with tables. Accordingly, amount of experience with scientific texts
and graphs seems to work in two different and complementary ways: On the one hand, readers
with more experience with scientific texts and graphs are more likely to perceive the text with
graphs as more plausible and, as a consequence, weight the information from this text more
strongly in situation model construction. On the other hand, their relatively higher amount of
experience enables them to build a stronger situation model for the text with tables. As a result,
readers with a relatively high amount of experience with scientific texts and graphs are able to
construct a strong situation model for both the text with graphs and the text with tables but
different mechanisms are likely to be in effect in the two types of texts. Whereas for text with
graphs, perceived plausibility seems to play a mediating role, the present data provide no hints at
the mechanism which accounts for the better situation model for text with tables. However, the
text comprehension literature provides ample evidence and suggests several ways in which
domain knowledge as well as rhetoric knowledge can benefit situation model construction (for
example, general construction and integration mechanisms, Kintsch 1988, or bridging and
elaborative inferences, Best et al. 2005; Graesser & Bertus 1998). Given that readers with a
relatively higher amount of experience found the information in the text with tables less
plausible, it seems possible that they elaborated more on the information provided in this text in
order to make an informed decision about its plausibility (Richter 2011).
The present study raises a number of further questions regarding the mechanisms and the
scope of the effects of graphs found in this study. First of all, the present experiment did not
Running head: GRAPHS AND CONFLICTING SCIENCE-RELATED TEXTS
31
differentiate between different types of graphs and, hence, does not contribute to a clarification
which properties of graphs cause readers to use them as plausibility cues. The visual argument
hypothesis (Vekiri 2002) and similar approaches (e.g., Schnotz 2005) suggest that the crucial
factor might be the computational advantage of graphs and their related feature of making
complex (and often abstract and invisible) states of affairs visible and easily understandable. If
this view is correct, using graphs with an increased computational load should decrease their
effectiveness as plausibility cues. A second possibility, which coheres well with the visual
argument hypothesis and the results of the present experiment, is that the use of graphs as
plausibility cues depends on some kind of statistical learning, which puts the amount of
experience with scientific texts and graphs in the foreground. According to this possibility,
graphs would gradually acquire their power to serve as plausibility cues when a reader learns to
associate the presence of graphs with the perceived ‘hardness’ of scientific studies. In order to
test this hypothesis directly, measures of the actual amount of reading scientific texts combined
with a longitudinal study design would be desirable. Another implication of the assumption that
the use of graphs as plausibility cues is learnt and develops with academic training is that graphs
containing errors or graphs which are not designed in accordance with conventional design
principles do not convey a sense of plausibility (quite to the contrary, they should cause a sense
of implausibility).
A related question which is raised by the present study and would be worthwhile to
pursue in future research is whether the power of graphs to serve as plausibility cues is tied
exclusively to their appearance in scientific texts. In addition to scientific publications in the
natural sciences, graphs are frequently used in popular science texts and even in mass media
publications (often with errors, Tufte 1983). If graphs unfold a persuasive power in these
publications, this power is likely to be borrowed at least in part from the use of graphs in
Running head: GRAPHS AND CONFLICTING SCIENCE-RELATED TEXTS
32
scientific texts. Thus, experience with popular science publications alone should not enable
readers to use graphs as plausibility cues in learning with conflicting scientific texts.
It must be noted that the present experiment suffers from certain limitations which should
be overcome in future research. One limitation concerns the fact that comprehension (situation
model strength) was assessed for the individual texts only. We did not assess how the presence of
graphs impacts the integration of information across texts with conflicting information, which is a
major issue in research on multiple documents comprehension (e.g., Bråten et al. 2009, 2011;
Perfetti et al. 1999). The present results suggest that readers with a relatively high amount of
experience with scientific texts and graphs give information from texts with graphs more weight
in situation model construction than information from texts with tables. We would assume that a
similar pattern occurs in the integration of information across texts: For example, readers with a
relatively high amount of experience with scientific texts and graphs should favor information
from texts with graphs when actively comparing arguments from texts with conflicting
information. A second limitation concerns the way plausibility was measured. The approach
taken in this experiment was to assess plausibility judgments towards information actually taken
from the experimental texts. Whereas this approach has the advantages of being less abstract and
of focusing the plausibility ratings on the text contents, it might also be associated with certain
problems. One problem is the surface similarity to the verification task used to assess situation
model strength. This similarity might have created a method-induced dependency between the
two tasks which might partly account for the plausibility effect. At any rate, it would be desirable
to include more general ratings of plausibility or trustworthiness directed at texts as a whole in
follow-up research. This would link the research on graphs as plausibility cues more strongly to
existing studies on multiple (science) text comprehension where rating or ranking tasks directed
at texts as a whole are quite common (e.g., Bråten et al. 2009, 2011). Another potential limitation
Running head: GRAPHS AND CONFLICTING SCIENCE-RELATED TEXTS
33
is that the overall level of prior domain knowledge was quite low, which caused a lower variance
and, as a consequence, a relatively low internal consistency of the prior knowledge measures. The
restricted variance and reliability of the prior knowledge measures might have contributed to the
overall surprisingly low correlations of the prior knowledge measures with comprehension
(situation model strength). A broader range of prior knowledge would also help to examine the
relationship of prior knowledge with knowledge about visualization conventions more closely.
Finally, the fact that no measures of cognitive processes were collected renders any conclusions
concerning the mechanisms underlying the use of graphs as plausibility cues preliminary. In
future studies, we plan to use on-line measures such as reading times and eye-tracking measures
which should allow some insights in the allocation of cognitive resources between the different
texts as well as between texts and graphs during reading. One question of particular interest is
whether the use of graphs as plausibility cues may under some conditions go along with a more
superficial processing of the text information (as predicted by a strict dual-route view, Petty &
Cacioppo 1986) or whether it generally increases cognitive resources allocated to the text
content, resulting in deeper processing. In order to clarify the possibility that not only the
presence of graphs but also the presence of tables might prompt particular cognitive processes,
these experiments should include another control condition which features neither graphs nor
tables.
To sum up, the present study suggests that lack of graphs (or presence of tables) induces
more critical and elaborative processing in readers with a relatively high amount of experience
with scientific texts and graphs. However, readers with a relatively high amount of experience
also seem to use the presence of graphs as a plausibility cue, which weakens their situation model
for texts with tables. Given the strong correlation of graph use and the perceived 'hardness' of
scientific publications, the use of graphs as plausibility cues might be a rational strategy for non-
Running head: GRAPHS AND CONFLICTING SCIENCE-RELATED TEXTS
34
experts who are often unable to judge the plausibility of science-related information based on the
content of information alone (cf. the division of cognitive labor, Keil et al. 2008). Instructional
interventions directed at fostering learning with multiple texts on controversial science topics
should strengthen students’ knowledge about scientific visualization conventions and make them
aware of the possibility to use graphs as one of several plausibility cues for weighting
information in knowledge construction.

Running head: GRAPHS AND CONFLICTING SCIENCE-RELATED TEXTS
35
Acknowledgments
This research was supported by grants RI 1100/4-1, RI 1100/4-2 and SCHN 665/5-1 of the
Special Priority Program 1409 ‘‘Science and the General Public: Understanding Fragile and
Conflicting Scientific Evidence’’ of the German Research Foundation (Deutsche
Forschungsgemeinschaft).
Running head: GRAPHS AND CONFLICTING SCIENCE-RELATED TEXTS
36
References
Amstad, T. (1978). Wie verständlich sind unsere Zeitungen? [How understandable are our
newspapers?]. Unpublished doctoral dissertation, University of Zürich, Switzerland.
Arsenault, D.J., Smith, L.D., & Beauchamp, E.A. (2006). Visual inscriptions in the scientific
hierarchy: Mapping the treasures of science. Scientific Communication, 27, 376-428.
Baddeley, A.D. (1986). Working memory. New York: Oxford University Press.
Baron, R.M., & Kenny, D.A. (1986). The moderator-mediator variable distinction in social
psychological research: Conceptual, strategic and statistical considerations. Journal of
Personality and Social Psychology, 51, 1173-1182.
Best, R.M., Rowe, M., Ozuru, Y. & McNamara, D.S. (2005). Deep-level comprehension of
science texts: The role of the reader and the text. Topics in Language Disorders, 25, 65-
83.
Bohner, G., Moskowitz, G., & Chaiken, S. (1995). The interplay of heuristic and systematic
processing of social information. European Review of Social Psychology, 6, 33-68.
Bråten, I. Strømsø, H., & Britt, A. (2009). Trust matters: Examining the role of source evaluation
in students’ construction of meaning within and across multiple texts. Reading Research
Quarterly, 44, 6-28.
Bråten, I., Strømsø, H., & Salmerón, L. (2011). Trust and mistrust when students read multiple
information sources about climate change. Learning and Instruction, 21, 180-192.
Britt, M.A., & Aglinskas, C. (2002). Improving students’ ability to identify and use source
information. Cognition and Instruction, 20, 485-522.
Britt, M.A., Rouet, J.-F., & Perfetti, C.A. (1999). Content integration and source separation in
learning from multiple texts. In S. R. Goldman, A. C. Graesser, & P. van den Broek
Running head: GRAPHS AND CONFLICTING SCIENCE-RELATED TEXTS
37
(Eds.), Narrative comprehension, causality, and coherence: Essays in honor of Tom
Trabasso. Mahwah, NJ: Erlbaum.
Bromme, R., Kienhues, D., & Porsch, T. (2010). Who knows what and who can we believe?
Epistemological beliefs are beliefs about knowledge (mostly) attained from others. in L.
D. Bendixen & F.C. Feucht (Eds.), Personal epistemology in the classroom: Theory,
research, and implications for practice (pp. 163-193). Cambridge: Cambridge University
Press.
Brown, A. S., & Nix, L. A. (1996). Turning lies into truths: Referential validation of falsehoods.
Journal of Experimental Psychology: Learning, Memory, and Cognition, 22, 1088–1100.
Chen, S., & Chaiken, S. (1999). The heuristic-systematic model in its broader context. In S.
Chaiken & Y. Trope (Eds.), Dual-process theories in social psychology (pp. 73-96). New
York: Guilford.
Cleveland, W.S. (1984). Graphs in scientific publications. The American Statistician, 38, 261-
269.
Cohen, J., Cohen, P., West, S.G., & Aiken, L.S. (2003). Applied multiple regression/correlation
analysis for the behavioral sciences (3rd. ed.). Mawah, NJ: Erlbaum.
Daneman, M. (1991). Working memory as a predictor of verbal fluency. Journal of
Psycholinguistic Research, 6, 445-464.
Daneman, M., & Carpenter, P.A. (1980). Individual differences in working memory and reading.
Journal of Verbal Learning & Verbal Behavior, 19, 450-466.
Graesser, A.C., & Bertus, E.L. (1998). The construction of causal inferences while reading
expository texts on science and technology. Scientific Studies of Reading, 2, 247-269.
Hayes, A.F. (2009). Beyond Baron and Kenny: Statistical mediation analysis in the new
millennium. Communication Monographs, 76, 408-420.
Running head: GRAPHS AND CONFLICTING SCIENCE-RELATED TEXTS
38
Judd, C.M., Kenny, D.A., & McClelland, G.H. (2001). Estimating and testing mediation and
moderation in within-subject designs. Psychological Methods, 6, 115-134.
Keil, F.C., Stein, C., Webb, L., Billings, V.D., &Rozenblit, L. (2008). Discerning the division of
cognitive labor: An emerging understanding of how knowledge is clustered in other
minds. Cognitive Science, 32, 259–300.
Kintsch, W. (1988). The role of knowledge in discourse comprehension: A construction-
integration model. Psychological Review, 95, 163-182.
Kosslyn, S.M. (1994). Elements of graph design. New York: W. H. Freeman.
Larkin, J.H., & Simon, H.A. (1987). Why a diagram is (sometimes) worth ten thousand words.
Cognitive Science, 11, 65–99.
Latour, B. (1990). Drawing things together. In M. Lynch & S. Woolgar (Eds.), Representation in
scientific practice (pp. 19–68). Cambridge, MA: MIT Press.
Lombardi, D., & Sinatra, G. (2012). College students' perceptions about the plausibility of
human-induced climate change. Research in Science Education, 42, 201-217.
Lorch, R.F., Lorch, E.P., & Inman, W.E. (1993). Effects of signaling topic structure on text
recall. Journal of Educational Psychology, 85, 281-290.
Meyer, B.J.F. (1975). The organization of prose and its effects on memory. Amsterdam: North
Holland.
Muller, D., Judd, C.M., & Yzerbyt, V.Y. (2005). When moderation is mediated and mediation is
moderated. Journal of Personality and Social Psychology, 89, 852-863.
Oberauer, K., Süß, H.-M., Schulze, R., Wilhelm, O., & Wittmann, W.W. (2000). Working
memory capacity - facets of a cognitive ability construct. Personality and Individual
Differences, 29, 1017-1045.
Running head: GRAPHS AND CONFLICTING SCIENCE-RELATED TEXTS
39
Perfetti, C.A., Rouet, J.-F., & Britt, M.A. (1999). Toward a theory of documents representation.
In H. van Oostendorp & S. Goldman (Eds.), The construction of
mental representations during reading (pp. 99-122). Mahwah, NJ: Erlbaum.
Petty, R.E., & Cacioppo, J.T. (1986). Communication and persuasion: Central and peripheral routes
to attitude change. New York: Springer.
Petty, R. E., & Wegener, D. T. (1998). Attitude change: Multiple roles for persuasion variables. In D.
T. Gilbert, S. T., Fiske, & G. Lindzey (Eds.), Handbook of social psychology (4th ed., Vol. 1,
pp. 323-390). New York: McGraw-Hill.
Petty, R. E. & Wegener, D. T. (1999). The elaboration likelihood model: Current status and
controversies. In S. Chaiken & Y. Trope (Eds.), Dual-process theories in social
psychology (pp. 41-72). New York: Guilford Press.
Porsch, T., & Bromme, R. (2010). Effects of epistemological sensitization on source choices.
Instructional Science [Online document]. DOI: 10.1007/s11251-010-9155-0
Preacher, K.J., & Hayes, A.F. (2008). Asymptotic and resampling strategies for assessing and
comparing indirect effects in multiple mediator models. Behavior Research Methods, 40, 879-
891.
Reimer, T., Mata, R., Katsikopoulos, K., & Opwis, K. (2005). On the interplay between heuristic
and systematic processes in persuasion. In B.G. Bara, L. Barsalou, & M. Bucciarelli
(Eds.), Proceedings of the Twenty-Seventh Annual Conference of the Cognitive Science
Society (pp. 1833-1838). Mahwah, NJ: Lawrence Erlbaum Associates.
Richter, T. (2011). Cognitive flexibility and epistemic validation in learning from multiple texts.
In J. Elen, E. Stahl, R. Bromme, & G. Clarebout (Eds.), Links between beliefs and
cognitive flexibility. Berlin: Springer.
Rinck, M. (2008). The Interaction of Verbal and Pictorial Information in Comprehension and
Running head: GRAPHS AND CONFLICTING SCIENCE-RELATED TEXTS
40
Memory. In J-F. Rouet, W. Schnotz, & R. Lowe (Eds.). Understanding Multimedia
Documents (pp. 185-200). New York: Springer.
Rouet, J.-F., Favart, M., Britt, M.A., & Perfetti, C.A. (1997). Studying and using multiple
documents in history: Effects of discipline expertise. Cognition and Instruction, 15, 85-
106.
Schmalhofer, F. & Glavanov, D. (1986). Three components of understanding a programmer’s
manual: Verbatim, propositional, and situational representations. Journal of Memory and
Language, 25, 279-294.
Schnotz, W. (2005). An integrated model of text and picture comprehension. In R.E. Mayer
(Ed.), Cambridge handbook of multimedia learning (pp. 49-69). Cambridge: Cambridge
University Press.
Schnotz, W., & Bannert, M. (2003). Construction and interference in learning from multiple
representations. Learning and Instruction, 13, 141-156.
Schroeder, S., Richter, T., & Hoever, I. (2008). Getting a picture that is both accurate and stable:
Situation models and epistemic validation. Journal of Memory and Language, 59, 237-
259.
Shrout, P.E., & Bolger, N. (2002). Mediation in experimental and nonexperimental studies: New
procedures and recommendations. Psychological Methods, 7, 422-445.
Smith, L.D., Best, L.A., Stubbs, D.A., Archibald, A.B. & Roberson-Nay, R. (2002). Constructing
knowledge: The role of graphs and tables in hard and soft psychology. American
Psychologist, 57, 749-761.
Smith, L.D., Best, L.A., Stubbs, D.A., Johnston, J., & Archibald, A.B. (2000). Scientific graphs
and the hierarchy of the sciences: A Latourian survey of inscription practices. Social
Studies of Science, 30, 73–94.
Running head: GRAPHS AND CONFLICTING SCIENCE-RELATED TEXTS
41
Stadtler, M., & Bromme, R. (2007). Dealing with multiple documents on the WWW: The role of
metacognition in the formation of documents models. International Journal of Computer
Supported Collaborative Learning, 2, 191-210.
Stadtler, M., Scharrer, L., & Bromme, R. (2011). How reading goals and rhetorical signals
influence recipients’ recognition of intertextual conflicts. In L. Carlson, C. Hoelscher, &
T.F. Shipley (Eds.), Proceedings of the 33rd Annual Conference of the Cognitive Science
Society (pp. 1346 -1351). Austin, TX: Cognitive Science Society.
Tufte, E.R. (1983). The visual display of quantitative information. Cheshire, Cn: Graphics Press.
van Dijk, T.A., & Kintsch, W. (1983). Strategies of discourse comprehension. New York:
Academic Press.
Vekiri, I. (2002). What is the value of graphical displays in learning? Educational Psychology
Review, 14, 261-312.
Wainer, H. (1997). Some multivariate displays for NAEP results. Psychological Methods, 2, 34–
63.
Wineburg, S.S. (1991). Historical problem solving: A study of the cognitive processes used in the
evaluation of documentary and pictorial evidence. Journal of Educational Psychology, 83,
73-87.
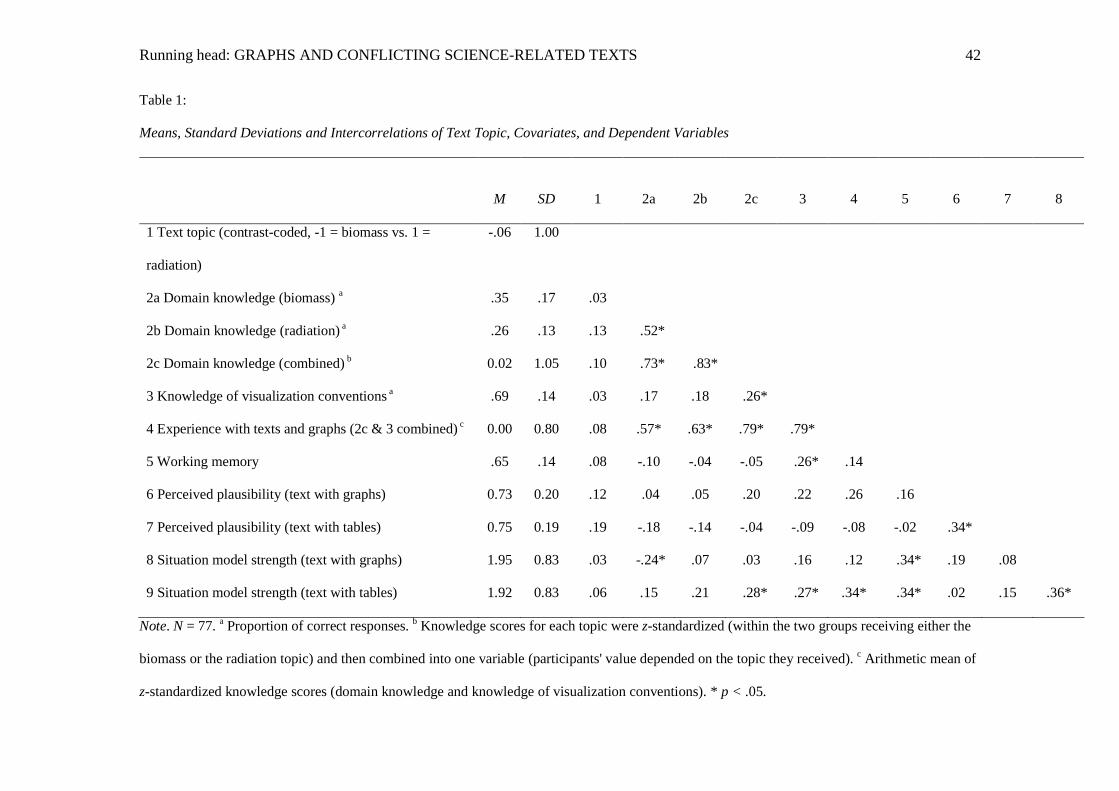
Running head: GRAPHS AND CONFLICTING SCIENCE-RELATED TEXTS
42
Table 1:
Means, Standard Deviations and Intercorrelations of Text Topic, Covariates, and Dependent Variables
M SD 1 2a 2b 2c 3 4 5 6 7 8
1 Text topic (contrast-coded, -1 = biomass vs. 1 =
radiation)
-.06 1.00
2a Domain knowledge (biomass) a .35 .17 .03
2b Domain knowledge (radiation) a .26 .13 .13 .52*
2c Domain knowledge (combined) b 0.02 1.05 .10 .73* .83*
3 Knowledge of visualization conventions a .69 .14 .03 .17 .18 .26*
4 Experience with texts and graphs (2c & 3 combined) c 0.00 0.80 .08 .57* .63* .79* .79*
5 Working memory .65 .14 .08 -.10 -.04 -.05 .26* .14
6 Perceived plausibility (text with graphs) 0.73 0.20 .12 .04 .05 .20 .22 .26 .16
7 Perceived plausibility (text with tables) 0.75 0.19 .19 -.18 -.14 -.04 -.09 -.08 -.02 .34*
8 Situation model strength (text with graphs) 1.95 0.83 .03 -.24* .07 .03 .16 .12 .34* .19 .08
9 Situation model strength (text with tables) 1.92 0.83 .06 .15 .21 .28* .27* .34* .34* .02 .15 .36*
Note. N = 77. a Proportion of correct responses. b Knowledge scores for each topic were z-standardized (within the two groups receiving either the
biomass or the radiation topic) and then combined into one variable (participants' value depended on the topic they received). c Arithmetic mean of
z-standardized knowledge scores (domain knowledge and knowledge of visualization conventions). * p < .05.
Running head: GRAPHS AND CONFLICTING SCIENCE-RELATED TEXTS
43
Figure captions
Fig. 1 Perceived plausibility of texts with graphs and with tables as a function of participants’
amount of experience with scientific text and graphs. The graph shows simple regression lines;
error bars represent the standard error of the mean for selected point estimates on the regression
line (* p < .05).
Fig. 2 Situation model strength for texts with graphs and with tables as a function of (a)
differences in perceived plausibility (text with graphs minus text with tables) and (b) participants’
amount of experience with scientific texts and graphs. The graphs show simple regression lines;
error bars represent the standard error of the mean for selected point estimates on the regression
line (* p < .05).
Fig. 3 Mediator model depicting the indirect effect of amount of experience with scientific texts
and graphs on differences in situation model strength (text with graphs minus text with tables) via
differences in perceived plausibility (path coefficients with standard error; * p < .05).
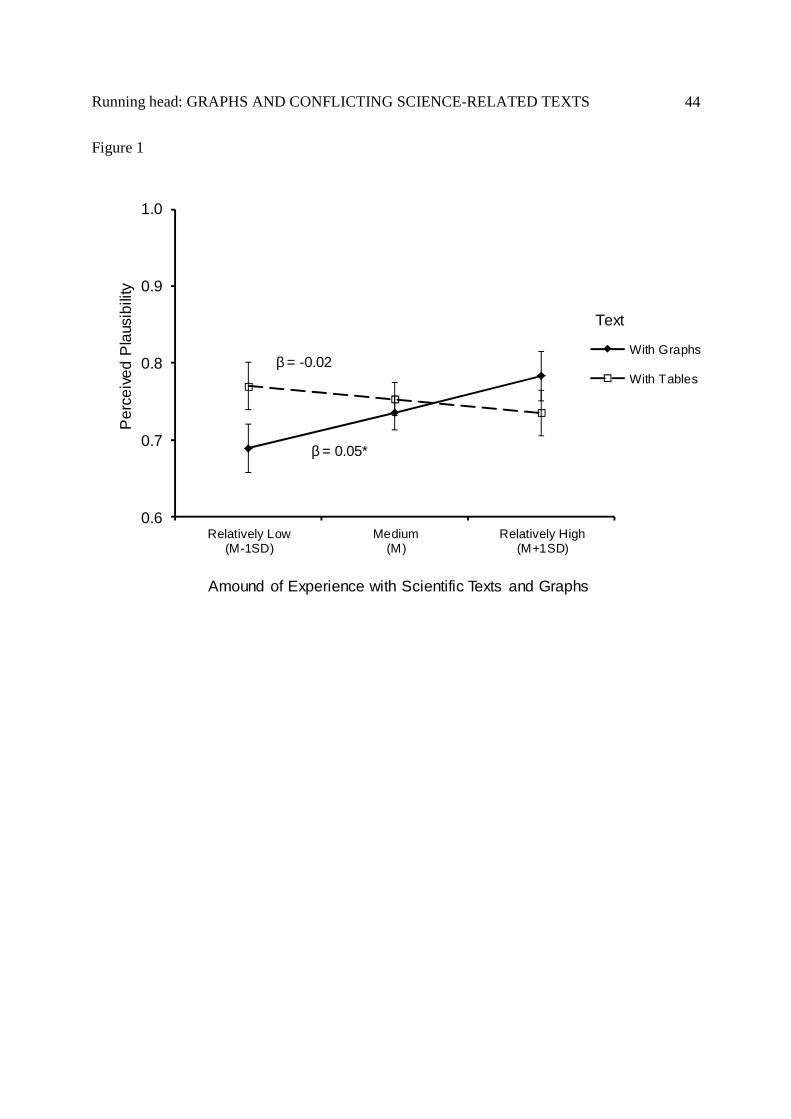
Running head: GRAPHS AND CONFLICTING SCIENCE-RELATED TEXTS
44
Figure 1
0.6
0.7
0.8
0.9
1.0
Relatively Low(M-1SD)
Medium(M)
Relatively High(M+1SD)
Amound of Experience with Scientific Texts and Graphs
With Graphs
With Tables
Text
Per
ceiv
ed P
laus
ibili
ty
β = 0.05*
β = -0.02
Running head: GRAPHS AND CONFLICTING SCIENCE-RELATED TEXTS
45
Figure 2
a)
1.5
1.6
1.7
1.8
1.9
2.0
2.1
2.2
2.3
2.4
Relatively Low(M-1SD)
Medium(M)
Relatively High(M+1SD)
Plausibility Difference
With Graphs
With Tables
Text
Situ
atio
n M
odel
Str
engt
h
β = -0.22*
β = 0.00
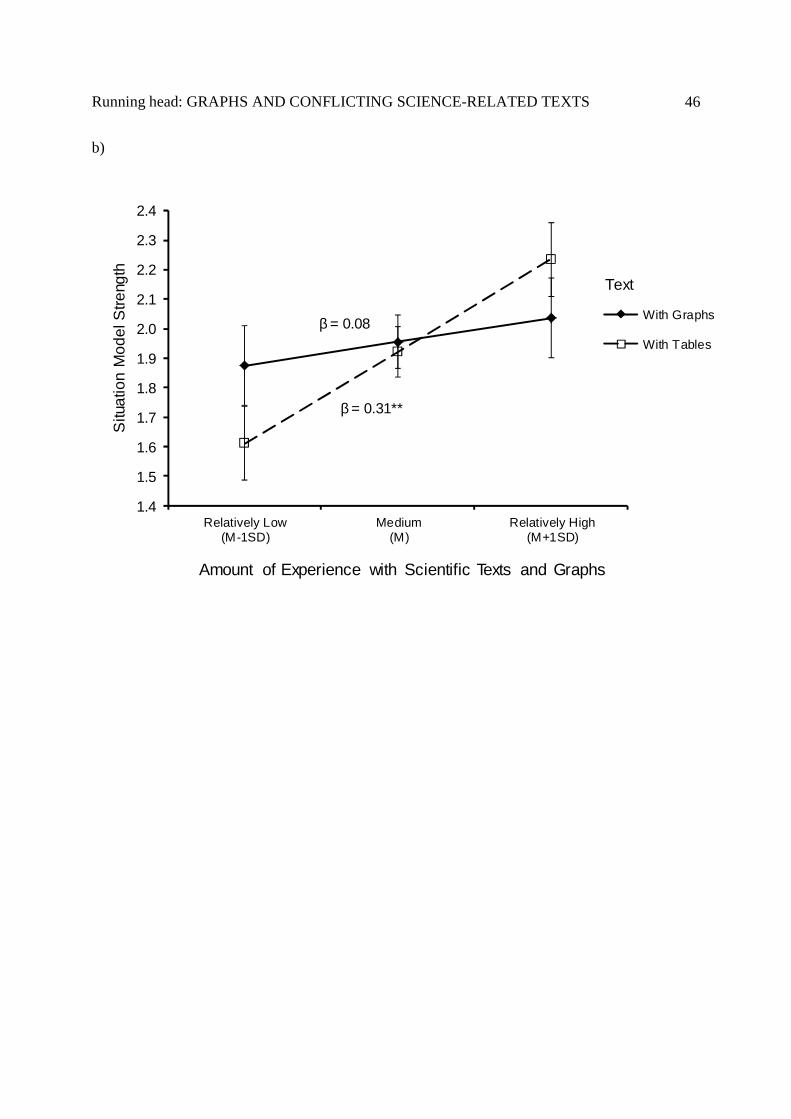
Running head: GRAPHS AND CONFLICTING SCIENCE-RELATED TEXTS
46
b)
1.4
1.5
1.6
1.7
1.8
1.9
2.0
2.1
2.2
2.3
2.4
Relatively Low(M-1SD)
Medium(M)
Relatively High(M+1SD)
Amount of Experience with Scientific Texts and Graphs
With Graphs
With Tables
Text
Situ
atio
n M
odel
Stre
ngth
β = 0.08
β = 0.31**
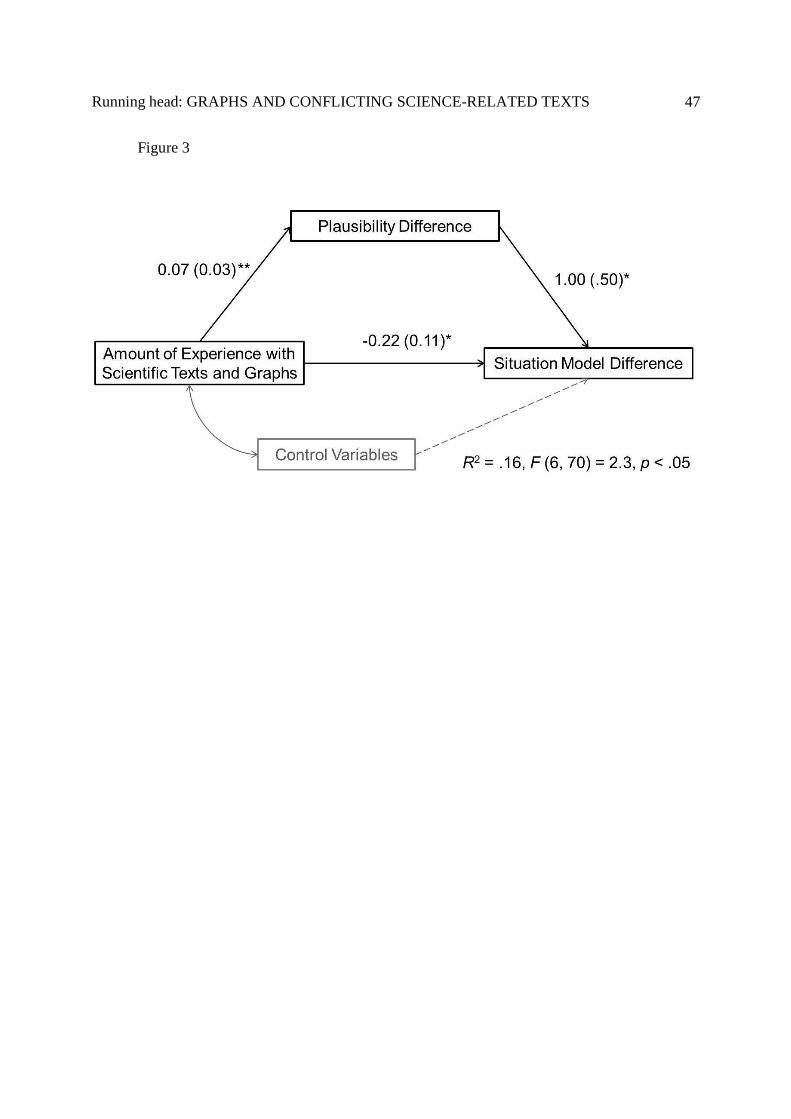
Running head: GRAPHS AND CONFLICTING SCIENCE-RELATED TEXTS
47
Figure 3

Running head: GRAPHS AND CONFLICTING SCIENCE-RELATED TEXTS
48
Appendix
Graphs and tables used as experimental stimuli
Fig. 4 Examples of the graphs and tables (in German) used as stimuli in the experiment: A line
graph (a) and a boxplot (c) with corresponding tables ((b) and (d), respectively) representing
information from the texts on electromagnetic radiation
Running head: GRAPHS AND CONFLICTING SCIENCE-RELATED TEXTS
49
Figure 4
a)
b)
Running head: GRAPHS AND CONFLICTING SCIENCE-RELATED TEXTS
50
c)
d)


![2.??????????????? ?????? ???????.ppt [Read-Only]...5 @inbox.ru-kassel.de 10-11 November Duschanbe Разработана программа по развитию малой и средней](https://img.pdfslide.us/doc/110x75/5ee3f07dad6a402d666d7153/2-ppt-read-only-5-inboxru-kasselde-10-11.jpg)