Embed Size (px)
Citation preview

CONFIDENTIAL
2010 Executive Team Off-Site
June 15, 2010
page 2page 2
Ground Rules for Today’s Discussion
• Don’t shoot the messenger
• No finger pointing
• It’s not about the past, it’s about the future

page 3page 3
Introduction
• At our last off-site, we reviewed concerning trends in our industry and our own business and determined immediate steps we could take to offset the DVD decline
• Since October, we've made progress, making difficult decisions to cut headcount and reduce our overall cost base
• However, negative market trends continue to impact our business
• Our profits are below the level we need to sustain the business
• As a group, we need to agree on specific actions to improve profitability while protecting the creative integrity of our business

CONFIDENTIAL
Actions Taken Since Oct 2009 Executive Team Off-Site

page 5
– Headcount reductions
– Loading OH into greenlight models
– Move talent costs to post-breakeven
– IT outsourced to India
– Reduced Television development
– Abolish contracts below SVP level
– Reduced marketing spend
– Moved shared services for Europe
– Imageworks move to Vancouver
– Analyzed/validated approach to Netflix and Redbox
– Reduce total capital required by our films
Action Items from Previous Off-Site
– Implement new SPHE operating model
– Bring FEARnet to breakeven (investing in linear near-term)
– Early Windows / Home Theater
– Reduce number of films released each year
– Reduce film development costs
– Bring Crackle to breakeven
CompletedCompleted Discussed and/or In ProgressDiscussed and/or In Progress

page 6
Since our last Off-Site, SPE has executed significant headcount reductions
$1,541$1,494
$1,374
$0
$200
$400
$600
$800
$1,000
$1,200
$1,400
$1,600
$1,800
FY 11BeforeFY09CRP
FY11BeforeFY10CRP
FY11AfterBothCRPs
$MM
22%21%
19%
0%
5%
10%
15%
20%
25%
30%
FY 11Before
FY09 CRP
FY11Before
FY10 CRP
FY11AfterBothCRPs
% o
f R
even
ues
7,9727,667
7,077
0
1,000
2,000
3,000
4,000
5,000
6,000
7,000
8,000
9,000
BeforeFY09 CRP
BeforeFY10 CRP
AfterBothCRPs
# o
f P
eop
le
Gross Overhead (1)Gross Overhead (1) % of Revenues% of Revenues HeadcountHeadcount
Down $120 MM
8.0%
Down 2% pts
Down 590 employees
7.7%
Down $47 MM
3.1%
Down 1% pts
Down 305 employees
3.8%
Note: (1) Gross overhead is before depreciation and portion of overhead capitalized to product; Savings on a net overhead basis were $108MM resulting in 9% savings in net overhead (from $1,234MM to $1,135MM)Note: (1) Gross overhead is before depreciation and portion of overhead capitalized to product; Savings on a net overhead basis were $108MM resulting in 9% savings in net overhead (from $1,234MM to $1,135MM)

page 7
SPE had been greenlighting some films that were not profitable after applying operational costs
Columbia Films Greenlit BEFORE January 2010Columbia Films Greenlit BEFORE January 2010
1.7%
6.1%
3.8%2.9%
1.6%
10.6%
7.9%
-7.0%
-3.3%
-5.8%-4.9%
-2.5%
3.8%
1.3%
-8.0%
-6.0%
-4.0%
-2.0%
0.0%
2.0%
4.0%
6.0%
8.0%
10.0%
12.0%
Zookeeper* Green Hornet How Do YouKnow?
Eat Pray Love Restless Battle LA Social Network
Gro
ss P
rofi
t M
arg
in
Gross Before Ops OH Net After Ops OH
* At the time of greenlight, MGM distributed domestic theatrical. Accordingly, operational OH was applied to only SPE’s 50% share of the production cost.* At the time of greenlight, MGM distributed domestic theatrical. Accordingly, operational OH was applied to only SPE’s 50% share of the production cost.

page 8
Incorporating operational overhead into the greenlight process has improved projected profitability
Columbia Films Greenlit AFTER January 2010Columbia Films Greenlit AFTER January 2010
10.2%
7.4%
10.5%
16.2%
21.8%
16.4%15.3%
11.7%
7.2%
3.8%
0.9%
3.6%
8.3%
15.5%
8.9%10.6%
3.5% 3.9%
0.0%
5.0%
10.0%
15.0%
20.0%
25.0%
Smurfs
Hotel T
ransy
lvan
ia
Prem
ium
Rush
Just
Go W
ith It
30 M
inute
s or L
ess
Jack
and J
ill
Win
ter's
Dis
conte
nt
Anonymous
Bad Tea
cher
Gro
ss P
rofi
t M
arg
in
Gross Before Ops OH Net After Ops OH
Operational costs equal 25% of a film’s budgeted production costOperational costs equal 25% of a film’s budgeted production cost

Estimated Savings: FY11 Slate vs. FY04 Slate Marketing costs are continuing to decrease
Source: Inflation for Media based on historical data and forecasts provided by the CTMPG Media Department, Universal McCann and Magna Global. Inflation for Basics based on Consumer Price Index (CPI-U) data from the US Bureau of Labor Statistics and the Federal Reserve Economic Projections Report –
January 2010. Note: Columbia FY11 worldwide P&A estimated to be $1,061 mil, Screen Gems worldwide P&A estimated to be $393 mil page 9
$228
$96
$0
$50
$100
$150
$200
$250
$300
$350
Inflation Adjusted Savings
Columbia Screen Gems
$323$323
Inflation Adjusted SavingsInflation Adjusted Savings
$82
$0
$50
$100
$150
$200
$250
$300
$350
Actual Savings
SPE Total
Actual SavingsActual Savings
% of FY04 Mktg. Spend% of FY04 Mktg. Spend 11%11%

The gap between actual production costs and greenlight has narrowed
Columbia Production Costs vs. Greenlight, FY06 – FY10Columbia Production Costs vs. Greenlight, FY06 – FY10
$81
$53$47
$34
$20
11%
10%
2%
4%
5%
$0
$10
$20
$30
$40
$50
$60
$70
$80
$90
FY06A FY07A FY08A FY09A FY10A
$ M
M
0%
2%
4%
6%
8%
10%
12%
Overage (Final Prod. Costs - Greenlight) Variance %
Note: Production costs do not include co-financing benefit
page 10
$841MM / $760MM$841MM / $760MM
$1,145MM / $1,092MM$1,145MM / $1,092MM
$530MM / $483MM$530MM / $483MM
$908MM / $875MM$908MM / $875MM
$875MM / $854MM$875MM / $854MM
Actual / GreenlightActual / Greenlight
page 11page 11
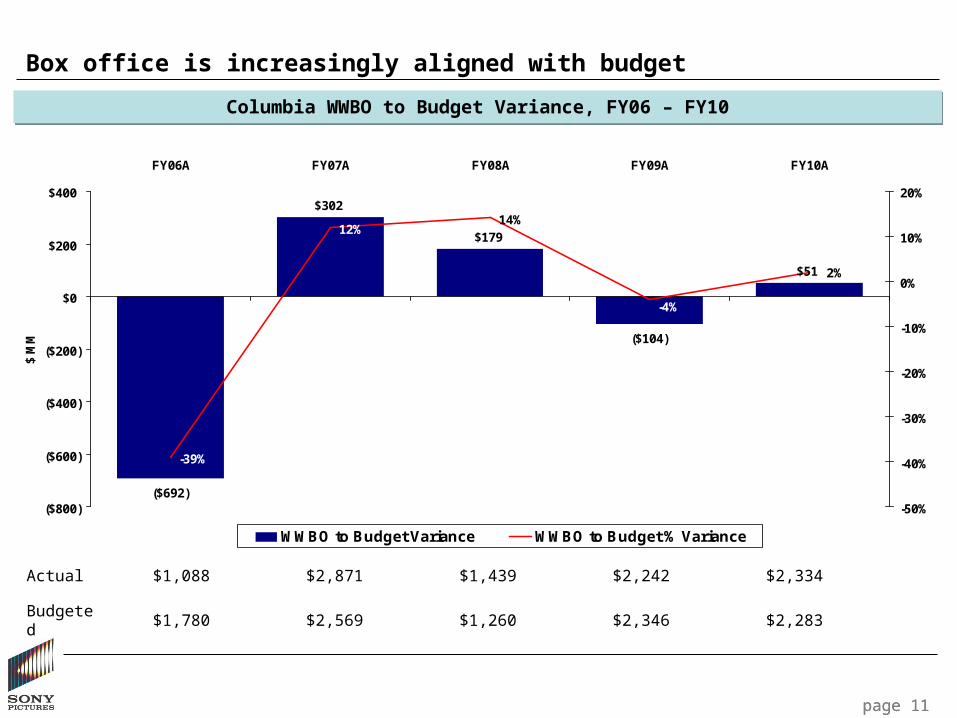
Box office is increasingly aligned with budget
Columbia WWBO to Budget Variance, FY06 – FY10Columbia WWBO to Budget Variance, FY06 – FY10
($692)
$302
$179
($104)
$51
14%
-39%
2%
-4%
12%
($800)
($600)
($400)
($200)
$0
$200
$400
FY06A FY07A FY08A FY09A FY10A
$ M
M
-50%
-40%
-30%
-20%
-10%
0%
10%
20%
WWBO to Budget Variance WWBO to Budget % Variance
Actual $1,088 $2,871 $1,439 $2,242 $2,334
Budgeted $1,780 $2,569 $1,260 $2,346 $2,283
page 12
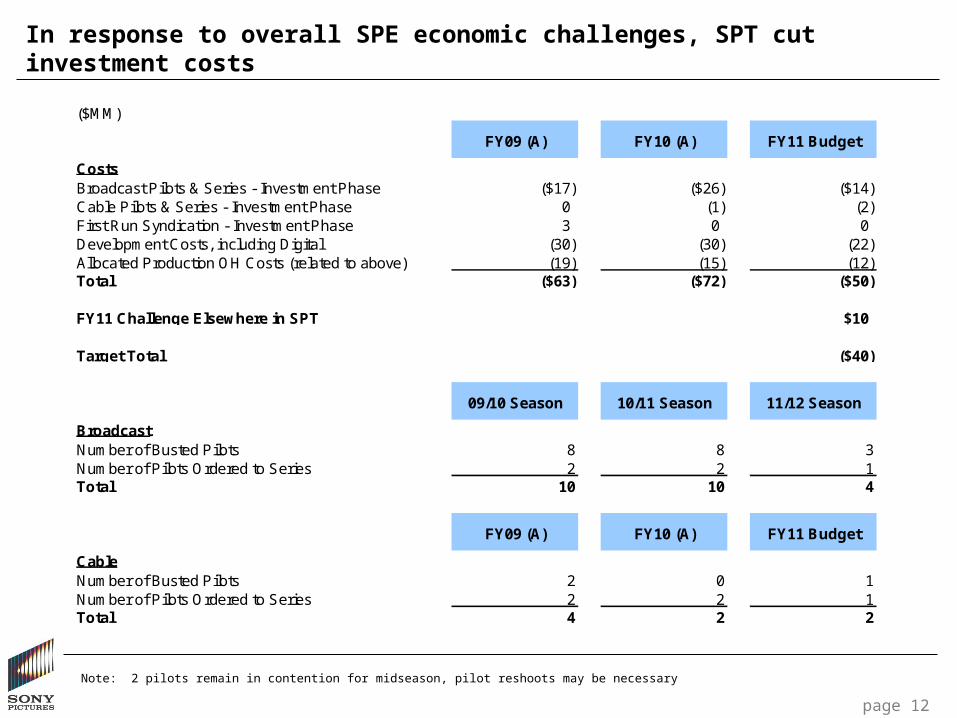
In response to overall SPE economic challenges, SPT cut investment costs
Note: 2 pilots remain in contention for midseason, pilot reshoots may be necessary
($MM)
FY09 (A) FY10 (A) FY11 Budget
CostsBroadcast Pilots & Series - Investment Phase ($17) ($26) ($14)Cable Pilots & Series - Investment Phase 0 (1) (2)First Run Syndication - Investment Phase 3 0 0Development Costs, including Digital (30) (30) (22)Allocated Production OH Costs (related to above) (19) (15) (12)Total ($63) ($72) ($50)
FY11 Challenge Elsewhere in SPT $10
Target Total ($40)
09/10 Season 10/11 Season 11/12 Season
BroadcastNumber of Busted Pilots 8 8 3Number of Pilots Ordered to Series 2 2 1Total 10 10 4
FY09 (A) FY10 (A) FY11 Budget
CableNumber of Busted Pilots 2 0 1Number of Pilots Ordered to Series 2 2 1Total 4 2 2

CONFIDENTIAL
Market Trends

page 14
Market trends continue to create challenges across business lines
Business SegmentBusiness Segment Market TrendsMarket Trends
Theatrical Production & Distribution
Home Entertainment
TV Production & Distribution
• Despite publicly stating costs must be managed, Studios continue to bid-up talent and production and marketing costs have not dropped sufficiently
• Diminished availability of film financing with attractive terms
• Franchise films remain critical to driving studio profitability
• DVD new release sell-through is down 34% but seems to be stabilizing
• For the first time, rental transactions and revenues are down
• Catalog revenues are down double digits
• Shift within rental to Netflix and kiosks putting brick & mortar rentailers into bankruptcy
• Brick and mortar closures reducing shelf space of WWAG and SPC titles
• Ad spending is rebounding for cable and local stations
• Broadcast ad revenues rebounded in 2009; total broadcast revenues have growth potential with the addition of subscriber fees
• International networks and production growing
• Pay TV deals are declining in value

page 15page 15
U.S. New Release Sell-Through Performance Trends
4%
11%
1%
-10%
-17%
-13%
-29%
-23%
-34% -35% -34%
-28%
-34%
2006-2009 Sell Through Performance Against Box Office Across All Major StudiosQuarter-on-Quarter % Change from CY2006
2006 to 2007 2006 to 2008 2006 to 2009
Q1 Q2 Q3 Q4 Q1 Q2 Q3 Q4 Q1 Q2 Q3 Q4 Q1(1)
2006 to 2010
Source: Nielsen Home Scan, title-level analysis, major studios include Fox, Lionsgate, Paramount, SPHE, Universal, Warner, and Disney (includes distributed lines); box office adjusted for inflation and 3-D admissions
Notes: (1) 1Q10: First 12 weeks, performance for titles released on or after February 9, 2010 is forecasted
Recent performance provides an early indicator that sell-through may be leveling-offRecent performance provides an early indicator that sell-through may be leveling-off

page 16page 16
U.S. Sell-Through Performance By Box Office Level
0.12
0.14
0.17
0.210.22
0.11
0.14
0.18
0.18
0.15
0.18
0.19
0.08
0.10
0.12
0.14
0.16
0.18
0.20
0.22
0.24
2006 2007 2008 2009
$10 to $25 Million
$25 to $75 Million
$75 Million Plus
Change: -25%
Change: -39%
Change: -46%
2006-2009 Retail Units Per Domestic AdmissionFor All Genres and All Studios
Since 2006, overall box office factors have fallen 30%; however, films at the lower end of the box office range have suffered much worse decline
Since 2006, overall box office factors have fallen 30%; however, films at the lower end of the box office range have suffered much worse decline
Source: NielsenNotes: Films in analysis include all studios and genres

page 17page 17
0.2 0.3
1.2
0.3
0.3
1.6
1Q09 1Q10
U.S. Total Rental
2009-2010 1Q Rental Turns(Millions of Transactions)
83150
461
56
543
62
1Q09 1Q10
-15.1%
+81.1%
-1.3%681 672
2009-2010 1Q Rental Consumer Revenues($ Billions)
B&M/O Price $2.89 $2.59
Kiosk
B&M and Online
-23.9%
+66.8%
-11.5%2.0
1.8
Kiosk Price $2.15 $1.98
Avg Price $2.95 $2.65
-10.4%
-7.9%
-10.3%
Kiosk % Txn 12% 22%
Kiosk
B&M and Online
Redbox Kiosks 13,826 23,795
B&M Stores 8,613 5,723
+72.1%
-33.6%
Netflix Subs 10.3MM 14.0MM +35.5%
+83.5%
+10.0% VOD+9.8%
VOD
VOD Price $4.70 $4.69 -0.2%
Source: Rentrak, Screen DigestNotes: VOD (IPVOD + Cable/Satellite VOD), Redbox kiosk, B&M store, and Netflix subscriber counts as of quarter end, B&M store count includes all chains tracked by Rentrak

page 18page 18
0.1 0.1
1.01.2
1Q09 1Q10
U.S. Physical Total Catalog (Film, TV, DTV) Sell-Through
2009-2010 1Q Total Catalog POS (1)
(Millions of Transactions)
3 6
84102
1Q09 1Q10
-16.8%
+93.5%
-13.7%104
90
2009-2010 1Q Total Catalog Consumer Revenues (1)
($ Billions)
DVD Price $12.13 $11.60
Blu-ray
DVD-20.4%
+56.3%
-16.7%1.3
1.1
BD Price $21.59 $17.44
Avg Price $12.39 $11.96
-4.3%
-19.2%
-3.4%
DVD
Blu-ray
BD % 3% 6%
Source: Nielsen Home ScanNotes: (1) Includes Theatrical, DTV, TV

page 19page 19
Jan Through May
SPHE Catalog Performance Gross Profit Per Unit
$1.20
$2.14
CY09 CY10
-44%
Notes: Operational data - excludes return reserve adjustments
• Data for January through May is preliminary and is partially driven by year-to-year slate differences
• However, the drop is significant enough to raise concerns about market trends, including:
– Heavy returns driven by market decline
– Increased pricing pressure at retail, especially on Blu-ray
– Increasing COGS with increasing mix of Blu-ray
% Margin 46% 32%

page 20
U.S. Top 25 BD New Release Titles
Rank Title Box Office GenreRelease
Date StudioNG 8-Wk
POSCombined 8-Week POS BO Index
1 Avatar $749.1 Action/Adventure 4/22/10 FOX 3,665,939 10,816,379 192 Dark Knight $533.3 Action/Adventure 12/9/08 WHV 1,994,543 10,985,535 213 Hangover $277.3 Comedy 12/15/09 WHV 1,444,992 7,784,428 284 Star Trek $257.7 Science Fiction 11/17/09 PARA 1,369,647 4,884,700 195 Harry Potter and the Half-Blood Prince $302.0 Family 12/8/09 WHV 1,164,719 7,202,453 246 Up $293.0 Family 11/10/09 DISN 1,084,977 7,448,446 257 Transformers: Revenge of the Fallen $402.1 Action/Adventure 10/20/09 DRMW 1,018,066 5,992,225 158 Inglourious Basterds $120.5 Action/Adventure 12/15/09 UNIV 850,166 3,405,093 289 Iron Man $318.4 Action/Adventure 9/30/08 PARA 832,035 6,157,204 19
10 Terminator Salvation $125.3 Action/Adventure 12/1/09 WHV 748,303 2,366,196 1911 Twilight Saga: New Moon $296.6 Drama 3/20/10 SMMT 654,202 5,383,131 1812 2012 $166.1 Action/Adventure 3/2/10 SPHE 651,766 2,585,371 1613 District 9 $115.6 Science Fiction 12/22/09 SPHE 635,710 2,158,365 1914 Sherlock Holmes $209.0 Mystery Suspense 3/30/10 WHV 563,687 2,448,705 1215 Wall-E $223.8 Family 11/18/08 DISN 515,259 7,328,318 3316 X-Men Origins: Wolverine $179.9 Action/Adventure 9/15/09 FOX 471,613 2,792,969 1617 Blind Side $256.0 Drama 3/23/10 WHV 456,740 5,260,608 2118 Quantum of Solace $168.4 Action/Adventure 3/24/09 MGM 436,650 2,002,520 1219 G.I. Joe: The Rise of Cobra $150.2 Action/Adventure 11/3/09 PARA 411,098 2,600,329 1720 Watchmen $107.5 Action/Adventure 7/21/09 WHV 404,935 1,952,697 1821 Public Enemies $97.1 Action/Adventure 12/8/09 UNIV 398,619 1,719,767 1822 Wanted $134.5 Action/Adventure 12/2/08 UNIV 389,463 2,717,030 2023 Princess and the Frog $104.4 Family 3/16/10 DISN 376,359 3,147,145 3024 Angels & Demons $133.4 Mystery Suspense 11/24/09 SPHE 368,404 2,142,860 1625 Indiana Jones and the Kingdom of the Crystal Skull$317.1 Action/Adventure 10/14/08 PARA 357,420 5,117,202 16
Best Performing Blu-ray Titles Based on Actual or Projected First Eight Weeks of SalesBest Performing Blu-ray Titles Based on Actual or Projected First Eight Weeks of Sales
Note 1: Titles include nationally projected sales through May 30, 2010.Note 2: SPHE titles are highlighted in yellow.Note 3: Box office indices have not been adjusted for changes in average ticket price but do incorporate modifications for 3-D admissions.
SPE’s dollar share of the top 25 BD titles is 8% compared to 15% market share for all new releases in 2010 year-to-date
SPE’s dollar share of the top 25 BD titles is 8% compared to 15% market share for all new releases in 2010 year-to-date

Rank Title Box Office Genre MSRP Release Date Studio YTD Units1 TOY STORY $191.8 Family $39.99 3/23/2010 DISN 514,3482 TOY STORY 2 $245.9 Family $39.99 3/23/2010 DISN 454,1203 DARK KNIGHT $533.3 Action/Adventure $35.99 12/9/2008 WHV 136,2024 IRON MAN $318.4 Action/Adventure $39.99 9/30/2008 PARA 107,3605 GLADIATOR $187.7 Action/Adventure $39.99 9/1/2009 DRMW 87,5156 FIGHT CLUB $37.0 Drama $34.99 11/17/2009 FOX 80,2107 SAVING PRIVATE RYAN $216.2 Action/Adventure $39.99 5/4/2010 DRMW 77,0918 BOONDOCK SAINTS $0.0 Action/Adventure $29.99 2/10/2009 FOX 71,5039 WATCHMEN $107.5 Action/Adventure $24.98 7/21/2009 WHV 64,057
10 WIZARD OF OZ $0.0 Family $84.99 9/29/2009 WHV 63,66011 SNOW WHITE $0.0 Family $59.99 10/6/2009 DISN 60,83912 BRAVEHEART $75.6 Action/Adventure $39.99 9/1/2009 PARA 60,43713 GONE WITH THE WIND $0.0 Drama $84.99 11/17/2009 WHV 57,69314 300 $210.6 Action/Adventure $34.99 7/31/2007 WHV 55,75715 BATMAN BEGINS $205.3 Action/Adventure $28.99 7/8/2008 WHV 53,84016 BOURNE ULTIMATUM $227.5 Action/Adventure $29.98 1/19/2010 UNIV 53,75317 MATRIX $171.4 Science Fiction $34.99 3/31/2009 WHV 52,15218 QUANTUM OF SOLACE $168.4 Action/Adventure $39.99 3/24/2009 MGM 51,63619 BOURNE IDENTITY $121.7 Action/Adventure $29.98 1/19/2010 UNIV 48,62120 INDEPENDENCE DAY $306.2 Science Fiction $34.99 12/4/2007 FOX 47,45421 TWILIGHT $192.8 Drama $34.99 5/5/2009 SMMT 44,49722 BOURNE SUPREMACY $176.1 Action/Adventure $29.98 1/19/2010 UNIV 43,97423 SUPER TROOPERS $18.5 Comedy $39.99 12/9/2008 FOX 43,25124 GRAN TORINO $148.1 Drama $35.99 6/9/2009 WHV 42,85825 CORALINE $75.3 Family $69.98 7/21/2009 UNIV 42,764
U.S. Top 25 BD Catalog Titles
Top 25 2010 YTD Catalog Blu-ray TitlesYear to Date Performance for Catalog Blu-ray Titles through May 30, 2010
Top 25 2010 YTD Catalog Blu-ray TitlesYear to Date Performance for Catalog Blu-ray Titles through May 30, 2010
* Catalog titles are defined as titles with a street date greater than 26 weeks or titles with a source year greater than 2 years oldNote 1: There are 2,770 catalog titles released to date in 2010.Note 2: The Top 25 titles constitute 24.9% of the Blu-ray catalog sales total in 2010.
* Catalog titles are defined as titles with a street date greater than 26 weeks or titles with a source year greater than 2 years oldNote 1: There are 2,770 catalog titles released to date in 2010.Note 2: The Top 25 titles constitute 24.9% of the Blu-ray catalog sales total in 2010. page 21
**
CONFIDENTIAL
Impact on SPE

page 23
SPE’s overall profit remains challenged and increasingly dependent on monetizations to achieve targets
(4)
244
513378
605
276 265411
275 221 177 128258
7
516
57
50
7 52
187
70330
155
40322
(62) (23)
254 251
1,029
435
655
283317
597
345
489
349
450
550
(50)
150
350
550
750
950
1,150
FY01A FY02A FY03A FY04A FY05A FY06A FY07A FY08A FY09A FY10A FY11Budget
FY12VirtualFCST
FY13PriorMRP
$MM
Overall SPE Operating EBIT (w/o Monetizations) Monetizations Challenge Restructuring Charge TBD
Notes: Monetizations incl one-time events/sales of int’l networks (SET India, E!, HBO, Cinenova, Viva, TMC), GSN, Telemundo, KirchMedia, Netflix, Bohbot, and Studio Asset FY09 and FY10 include restructuring charges (1) Includes $63MM from prior MRP plus $259MM shortfall of MPG forecast vs. prior MRP
SPE Overall EBIT with Monetizations IdentifiedSPE Overall EBIT with Monetizations Identified
(1)

Goodwill Impairment Overview
• SPE has $1.1 billion of goodwill which was created from Sony Corp’s acquisition of Columbia Pictures and SPE’s purchase of companies for more than the fair value of the net identifiable assets of the target company
• SPE determines the fair value using a Discounted Cash Flow (DCF) model and compares the fair value to the carrying amount
– If the fair value is above the carrying amount, no impairment charge is needed
– If the fair value is below the carrying amount, an impairment charge will be required
• If this year’s performance and projections (i.e., MRP and budget) are below the projections used in last’s year impairment test, we are at risk of taking a sizable operating expense to write-off goodwill
page 24

page 25
Actions taken since the prior Off-Site have narrowed, but not eliminated the FY11 EBIT gap
FY11 EBITFY11 EBIT
$ MM
Note: (1) After $23MM of restructuring charges and $3MM of 3D network startup costs
(1)
Achieving monetization target may require divesting reliable sources of income, potentially including our interest in Spider-Man merchandise and the Music Publishing catalog
Achieving monetization target may require divesting reliable sources of income, potentially including our interest in Spider-Man merchandise and the Music Publishing catalog
419
(31)
349
155
70
40
$108
100
177
(23)
($100)
($50)
$0
$50
$100
$150
$200
$250
$300
$350
$400
$450Initial Roll-Up
FY10 CRPSavings Release Shifts
Budg. Op.EBIT
RestructuringCharges
Other MPChallenges Monetizations Budget
Addt'lMonetizationsRequested by
TokyoTotal Tokyo
Request

$ MM FY06A FY07A FY08A FY09A FY10AFY11
Budget
Operating Cash Flow (52) 499 594 273 (216) (193)
Capital Expenditures (179) (126) (170) (188) (162) (77)
Interest, Dividends & Taxes (145) (224) (257) (212) (194) (252)
Operating Cash Flow ($376) $149 $167 ($127) ($572) ($522)
Investments, Monetizations, and Challenges (5) (35) 16 (216) 359 583
Other (59) (61)
Net Cash Flow ($382) $114 $184 ($343) ($272) $0
page 26
With negative cash flow and limited access to capital, we need to carefully evaluate where we invest
Source: SPE FinanceNotes: 1. Includes 2waytraffic acquisition
2. Includes $5MM SEL Marketing and $54MM Restructuring Costs3. Includes $5MM in 3D Network Start-up Costs and $56MM in Restructuring Costs.
(1)
(2) (3)

CONFIDENTIAL
Competitor Landscape
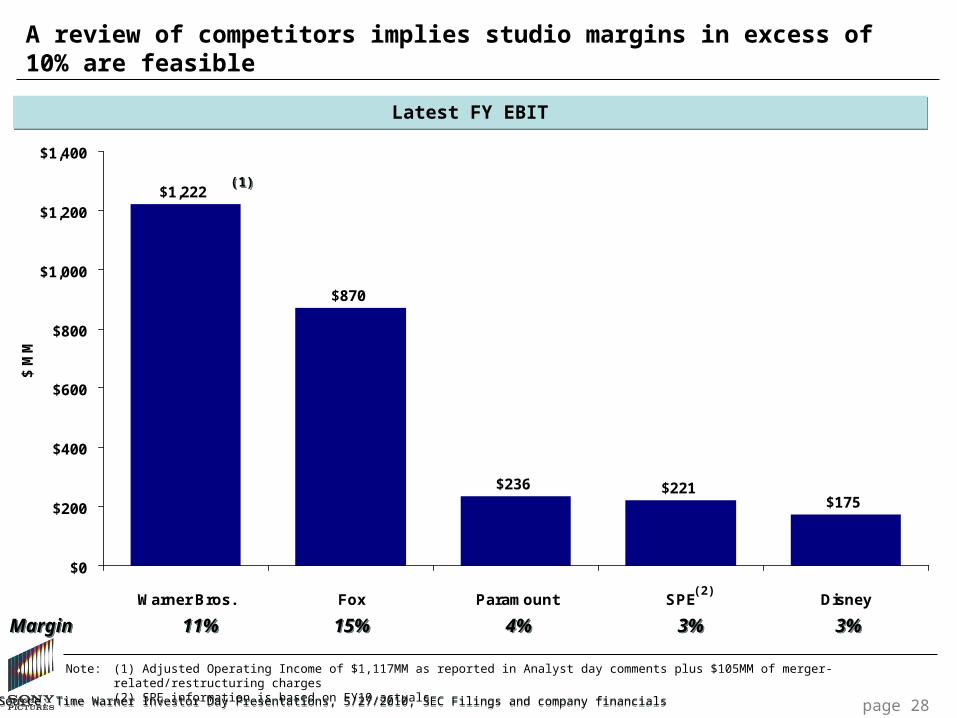
A review of competitors implies studio margins in excess of 10% are feasible
$1,222
$870
$236 $221$175
$0
$200
$400
$600
$800
$1,000
$1,200
$1,400
Warner Bros. Fox Paramount SPE Disney
$ M
M
Latest FY EBITLatest FY EBIT
Note: (1) Adjusted Operating Income of $1,117MM as reported in Analyst day comments plus $105MM of merger-related/restructuring charges(2) SPE information is based on FY10 actuals
page 28
MarginMargin 11%11% 15%15% 4%4% 3%3%
(1)(1)
(2)
3%3%
Source: Time Warner Investor Day Presentations, 5/27/2010, SEC Filings and company financialsSource: Time Warner Investor Day Presentations, 5/27/2010, SEC Filings and company financials

Warner Bros.’ revenue mix is similar to SPE’s although at a larger scale
page 29page 29page 29page 29
CY09 Warner Bros. RevenueCY09 Warner Bros. Revenue FY10 SPE RevenueFY10 SPE Revenue
TV32%
Other10%
Film58%
RevenueRevenue $11.1BN$11.1BN $7.7BN$7.7BN
% Margin% Margin 11%11% 3%3%
TV29%
Film71%
EBITEBIT $1,222MM$1,222MM $221MM$221MM
Note: (1) Adjusted Operating Income of $1,117MM as reported in Analyst day comments plus $105MM of merger-related/restructuring charges
(1)(1)
Source: Time Warner Investor Day Presentations, 5/27/2010; Morgan Stanley financial model, May 5, 2010; SPE Corp DevSource: Time Warner Investor Day Presentations, 5/27/2010; Morgan Stanley financial model, May 5, 2010; SPE Corp Dev

Comparison of Warner Bros. and SPE EBIT
page 30
CY09 Warner Bros. EBIT (1)CY09 Warner Bros. EBIT (1) FY10 SPE Operating EBITFY10 SPE Operating EBIT
Note: (1) Adjusted Operating Income of $1,117MM as reported in Analyst day comments plus $105MM of merger-related/restructuring charges
$1,222
$611
$611
CY 2009
TV Film
MarginsMargins
9%9%
18%18% $221
$132$89
FY 2010
TV Film
MarginsMargins
2%2%
6%6%
11%11%
3%3%
% of Total% of Total
50%50%
50%50%
% of Total% of Total
40%40%
60%60%
Source: Time Warner Investor Day Presentations, 5/27/2010; Morgan Stanley financial model, May 5, 2010, SPE Corp Dev Source: Time Warner Investor Day Presentations, 5/27/2010; Morgan Stanley financial model, May 5, 2010, SPE Corp Dev

page 31page 31
Warner Bros. Stated Strategy: Leadership Driven By Event Film Strategy and Scale
• Build franchises and utilize competitive advantages
• Maximize value through all windows
• Focus on quality and cost-efficiency
• Access capital through partnerships
Source: Time Warner Investor Day Presentations, 5/27/2010Source: Time Warner Investor Day Presentations, 5/27/2010

Title
Domestic B.O.
($MM) Title
Domestic B.O.
($MM)
The Dark Knight $533.3 Spider-Man 3 $336.5Harry Potter and the Half-Blood Prince 302.0 Hancock 227.9Harry Potter and the Order of the Phoenix 292.0 Quantum of Solace 168.4The Hangover 277.3 2012 166.1I Am Legend 256.4 Paul Blart: Mall Cop 146.3The Blind Side 256.0 Angels & Demons 133.4300 210.6 Cloudy with a Chance of Meatballs 124.9Sherlock Holmes 209.0 Superbad 121.5Sex and the City 152.6 Ghost Rider 115.8Gran Torino 148.1 District 9 115.6Rush Hour 3 140.1 Step Brothers 100.5Get Smart 130.3 You Don't Mess with the Zohan 100.0Terminator Salvation 125.3Four Christmases 120.1Hairspray (2007) 118.9Ocean's Thirteen 117.2Watchmen 107.5Journey to the Center of the Earth 101.7Total $3,598.5 $1,856.9
2400 SKUs 19% 1600 SKUs 13%
Warner Bros. and SPE Films with over $100 mil DBO – Last 3 Years
Films with > $100MM
DBOCY07-CY09
Films with > $100MM
DBOCY07-CY09
Warner Bros.Warner Bros. SPESPE
Source: BoxOfficeMojo
page 32
WB generated 94% more DBO from large films over the last 3 yearsWB generated 94% more DBO from large films over the last 3 years

page 33page 33
Drivers of CY09 Film Profits – Theatrical Releases
Warner Bros. & New Line Warner Bros. & New Line CTMPG & SPWAGCTMPG & SPWAG
$MM$MM $MM$MM
Source: BoxOfficeMojo, SPE Finance.* IBO for SPE territories only.
WB’s WWBO was 12% greater than SPE’s and DBO was 39% greater
WB’s WWBO was 12% greater than SPE’s and DBO was 39% greater
Title DBO IBO WWBOHarry Potter and the Half Blood Prince 302.0 632.0 934.0 The Hangover 277.3 190.0 467.3 The Blind Side 256.0 45.8 301.8 Sherlock Holmes 209.0 307.8 516.8 Terminator Salvation 125.3 - 125.3 Watchmen 107.5 77.8 185.3 He's Just Not That Into You 94.0 85.0 179.0 Where the Wild Things Are 77.2 23.0 100.2 The Final Destination (3D) 66.5 116.3 182.8 Friday the 13th (2009) 65.0 26.4 91.4 17 Again 64.2 72.1 136.3 The Time Traver's Wife 63.4 37.8 101.2 Ghosts of Girlfriends Past 55.3 47.0 102.3 My Sister's Keeper 49.2 46.5 95.7 Orphan 41.6 35.1 76.7 Ninja Assasin 38.1 23.5 61.6 Invictus 37.5 84.8 122.3 The Informant! 33.3 8.5 41.8 Observe and Report 24.0 3.0 27.0 Under the Sea 3D 22.4 1.4 23.8 Shorts 20.9 8.0 28.9 The Invention of Lying 18.5 13.7 32.2 Inkheart 17.3 45.1 62.4 The Box 15.1 16.5 31.6 Whiteout 10.3 7.6 17.9 Chandni Chowk to China 0.9 12.5 13.4 Total 2,091.8 1,967.2 4,059.0
Title DBO IBO WWBO2012 166.1 603.5 769.6 Paul Blart: Mall Cop 146.3 37.0 183.3 Angels & Demons 133.4 352.6 486.0 Terminator Salvation - 241.0 241.0 *Cloudy With A Chance of Meatballs 124.9 110.5 235.4 District 9 115.6 67.0 182.6 *Julie & Julia 94.1 35.4 129.5 The Ugly Truth 88.9 116.4 205.3 Zombieland 75.6 26.7 102.3 Michael Jackson's This Is It 72.1 188.8 260.9 Obsessed 68.3 5.6 73.9 The Taking of Pelham 123 65.5 84.7 150.2 Underworld: Rise of the Lycans 45.8 36.0 81.8 *Year One 43.3 19.0 62.3 Planet 51 42.2 2.7 44.9 *The Pink Panther 2 35.9 40.0 75.9 Did You Hear About the Morgans 29.6 51.6 81.2 The Stepfather (2009) 29.1 2.1 31.2 The International 25.5 34.7 60.2 Fired Up 17.2 1.4 18.6 Armored 16.0 4.9 20.9 Not Easily Broken 16.0 4.9 20.9 Int'l Motion Picture Prods (7 Titles) 2.0 25.4 27.4 Sony Pictures Classics (20 Titles) 54.3 15.2 69.5 *Total 1,507.7 2,107.1 3,614.8

page 34page 34
Drivers of CY09 Film Profits – Home Entertainment Releases
Warner Bros. & New Line Warner Bros. & New Line Columbia & Screen GemsColumbia & Screen GemsSource: Rentrak
Library Size: 2,400 SKUsLibrary Size: 2,400 SKUs Library Size: 1,600 SKUsLibrary Size: 1,600 SKUs
WB Catalog is 50% larger than SPE's, which could mean $250MM in incremental profit (based on SPE catalog and flow profit of $500MM)
WB Catalog is 50% larger than SPE's, which could mean $250MM in incremental profit (based on SPE catalog and flow profit of $500MM)
Title
8-Week Total ST & Rental
Revenue
8-Week B.O.
Factor
Hangover $170.1 28.1Harry Potter and the Half-Blood Prince $146.5 23.9Gran Torino $77.2 23.0Terminator Salvation $58.5 18.9Watchmen $55.2 18.2Four Christmases $45.4 13.2He's Just Not That Into You $32.7 13.3Body of Lies $32.1 17.4Yes Man $27.3 7.4My Sister's Keeper $26.9 21.2Nights in Rodanthe $26.6 18.0Ghosts of Girlfriends Past $25.6 11.117 Again $25.0 12.6Pride and Glory $20.8 20.4Appaloosa $20.6 18.8Friday the 13th $15.6 7.5Orphan $14.6 8.9Inkheart $14.3 22.0Observe and Report $13.2 11.4
Total $848.2
Title
8-Week Total ST & Rental
Revenue
8-Week
B.O. Factor
2012 $65.0 15.6District 9 $59.4 18.7Paul Blart: Mall Cop $58.0 12.1Angels & Demons $58.0 16.1Michael Jackson's This Is It $45.1 29.3Julie & Julia $43.5 16.4Ugly Truth $38.4 15.0Seven Pounds $38.2 13.0Underworld: Rise of the Lycans $37.9 30.3Taking of Pelham 1 2 3 $36.8 15.5Cloudy With a Chance of Meatballs $36.8 13.1Zombieland $33.9 17.5Obsessed $25.9 10.0International $19.8 12.9Year One $18.6 9.7Planet 51 $18.4 18.0Boondock Saints II: All Saints Day $17.2 69.7Did You Hear About the Morgans? $12.4 10.2Stepfather $9.6 7.4Not Easily Broken $9.4 28.6Halloween II $9.2 9.8Fired Up $8.5 9.9Armored $7.6 11.7
Total $707.8

page 35page 35
WB TV Strategy
• Invest in A+ talent
• Maximize reach, scale and diversification of product portfolio
• Expand production internationally
Source: Time Warner Investor Day Presentations, 5/27/2010Source: Time Warner Investor Day Presentations, 5/27/2010

Comparison of WBTV and SPT Scripted Broadcast Network Activity
page 36
2005-2010 Network Scripted Pilot Activity and Results2005-2010 Network Scripted Pilot Activity and Results
Warner Bros. is estimated to spend $120MM annually in gross development or 4x our investment after considering likely recoupments
Warner Bros. is estimated to spend $120MM annually in gross development or 4x our investment after considering likely recoupments
Notes: Pilot activity for Big 4 broadcast networks (excludes CW)
Source: SPT
Warner Bros. SPT
Successes Successes
Seasons Pilots Series # Programs Pilots Series # Programs
2005-06 17 10 1 Old Christine 6 3 02006-07 16 11 0 10 5 2 Rules of Eng., Til Death2007-08 15 6 2 Big Bang Theory, Chuck 9 3 02008-09 (Strike) 5 3 2 The Mentalist, Fringe 4 2 02009-10 15 8 1 The Middle 10 2 1 Community2010-11* 17 8 * Season yet to start 10 3 * Season yet to startTotal (2005-09) 68 38 6 39 15 3
Ratios 56% 9% 38% 8%

page 37page 37
Drivers of CY09 TV Profits
Source: SPTSource: SPT
Network (WB 32, SPT 11) Cable (WB 10, SPT 11)
WBTV / Horizon CY 2009
SPTCY 2009
A significant portion of successful/returning network shows are sourced from external producers (e.g., WB & SPE)
A significant portion of successful/returning network shows are sourced from external producers (e.g., WB & SPE)
Indicates cancelled
shows
Indicates cancelled
shows
Big Bang Theory (CBS) Beautiful Life (CW)
Chuck (NBC) Cold Case (CBS)
Fringe (FOX) Eastwick (ABC)
Gossip Girl (CW) Eleventh Hour (CBS)
One Tree Hill (CW) ER (NBC)
Smallville (CW) Hank (ABC)
Southland (NBC) Here Come the Newlyweds (ABC)
Supernatural Hitched or Ditched (CW)
The Bachelor (ABC) More to Love (FOX)
The Bachelorette (ABC) Old Christine (CBS)
The Mentalist (CBS) Privileged (CW)
The Middle (ABC) Pushing Daisies (ABC)
True Beauty (Bankable Prod) (ABC) Terminator: Sarah Connor (FOX)
Two and a Half Men (CBS) The Forgotten (ABC)
V (ABC) There Goes the Neighborhood (CBS)
Vampire Diaries (CW) Without a Trace (CBS)
Community (NBC) Brothers (FOX)
Days of Our Lives (NBC) Sit Down Shut Up (FOX)
Rules of Engagement (CBS) The Unusuals (ABC)
Shark Tank (ABC) Til Death (FOX)
Sing-Off (NBC)
The Young and the Restless (CBS)
Dragon Tales (PBS)
High School Reunion (TV LAND)
Leave it to Lamas (E!)
Man vs Cartoon (TRU TV)
Randy Jackson Presents ABDC (MTV)
Dark Blue (TNT
Lopez Tonight (TBS)
The Closer (TNT)
Nip/Tuck (FX)
The Cougar (TV LAND)
Trust Me (TNT)
Breaking Bad (AMC)
Damages (FX)
Drop Dead Diva (LIFE)
Hawthorne (TNT)
Make My Day (TV LAND)
My Boys (TBS)
Newlywed Game (GSN)
Rescue Me (FX)
10 Items or Less (TBS)
Spectacular Spider-Man (DXD)
The Beast (A&E)

page 38page 38
Drivers of CY09 TV Profits
Source: SPTSource: SPT
Indicates cancelled showsIndicates cancelled shows
Syndication (WB 8, SPT 6)
WBTV / Horizon CY 2009
SPTCY 2009
Ellen Degeneres
Extra
Judge Jeanine Pirro
Judge Mathis
People's Court
TMZ
Bonnie Hunt Show
Tyra Banks
Off-Net Syndication (WB 6, SPT 2)
Cold Case (TNT)
Friends (TBS)
George Lopez (NICK)
Sex and the City (Distribution only) (TBS)
Two and a Half men (FX)
Without a Trace (TNT)
Dr Oz
Jeopardy
Wheel of Fortune
Judge David Young
Judge Hatchett
Judge Karen
Seinfeld (TBS)
King of Queens (TBS)

page 39page 39
Key TV Production Deals
Warner Bros.Warner Bros. SPESPE
Source: SPTWarner Bros. is estimated to spend $120MM annually in gross development or 4x our investment
after considering likely recoupmentsWarner Bros. is estimated to spend $120MM annually in gross development or 4x our investment
after considering likely recoupments
AbramsBank/LevyBruckheimerBurkChulackCorddryDavolaFilgo / FilgoFleissHellerJinks / CohenJohnsonKauffmanKatalystKelleyKingKohan / MutchnickKripkeLevinsonLizer
LorreMalinsMcGMimounNaderNutterOrci / KurtzmanPedowitzPinknerReiff/VorisSavageSchwartzShephard / RobinSilverWeintraubWellingWellsWernerWolper / Wolper
Barnow/Firek
Berman
Falls
Gilligan
Grodner
Guarascio/Port
Happy Madison
Hertz
Kessler/Zelman/Kessler
Millar/Gough
Moore
Orman
Raimi
Sikowitz
Tarses, J.
Tarses, M.
Tolan/Wimer
Yuspa/Goldsmith

CONFIDENTIAL
Motion Picture Group

page 41
Sources of Motion Picture Group EBIT (In-year)
Notes: 1. Excludes $38MM Kirch Media Payment2. Includes $35MM development write-offs for Spider-Man 4 ($25MM) and Moneyball ($10MM)3. After reclassifying $20MM of costs as corporate. Excludes $5MM restructuring charge 4. Excludes $195MM on monetizations and operating challenges5. Flow equals EBIT from titles released 4 through 10 fiscal years prior; Catalog equals EBIT from titles released over 10 fiscal years prior
($MM) FY07A FY08A FY09A FY10A FY11 Budget
Current Year ($271) ($249) ($269) ($240) ($438)
Prior Year $284 $468 $358 $336 $236
2nd Prior Year $151 $92 $165 $156 $103
Catalog & Flow $482 $509 $410 $372 $500
Development ($98) ($73) ($69) ($121) ($78)
Overhead ($175) ($186) ($206) ($182) ($164)
Total $373 $561 $389 $320 $160
(1)
(2)
(3)
(4)
(5)
(6)
6. Excludes $7MM restructuring charge6. Excludes $7MM restructuring charge

Production and releasing investment increased through the FY11 budget, while ultimate slate profitability declined
Source: SPE Finance and MPGNote: Ultimate slate profit after Ops OH. Ops OH assumed to be $200 mil in ’08, and $270 mil in each year thereafter. Note: Ultimate profit before Ops OH from FY08 to FY11 = $467, $266, $234, $229 Note: Ultimate profit excludes monetizations and challenges
Columbia & Screen GemsColumbia & Screen Gems
$267
($36) ($41)
($1,422)
($1,679)
($2,023)
($2,467)
($4)
($3,000)
($2,500)
($2,000)
($1,500)
($1,000)
($500)
$0
$500
FY08 FY09 FY10 FY11 Budget
$M
M
Ultimate Slate Profit After Cap and Ops OH Total Prod & P&A
page 42

page 43
$221
($53) ($71) ($89)
$310
$402
$515
$352
(600)
(400)
(200)
0
200
400
600
FY08 FY09 FY10 FY11 Virtual FCST
$M
M
($ In millions)
Compensation continues to exceed Columbia’s gross profit on an ultimate basis
Source: MPGNotes: (1) Columbia GP is ultimate profit net of financing impact, capitalized OH and operational OH. Ultimate profit before Ops OH from FY08 to FY11 = $401,
$197, $179, $161. Ops OH assumed to be $180 mil in ’08 and $250 mil in each year thereafter
Columbia Gross Profit (1) vs. Total Talent CompensationColumbia Gross Profit (1) vs. Total Talent Compensation
Gross Profit
Contingent Compensation
Up-Front Fees
TALENT SHARE OF TOTAL AVAILABLE PROFITS (SPE GP + TALENT TOTAL COMPENSATION)58% 115% 116% 134%
77156
201 237
233
246
314
115
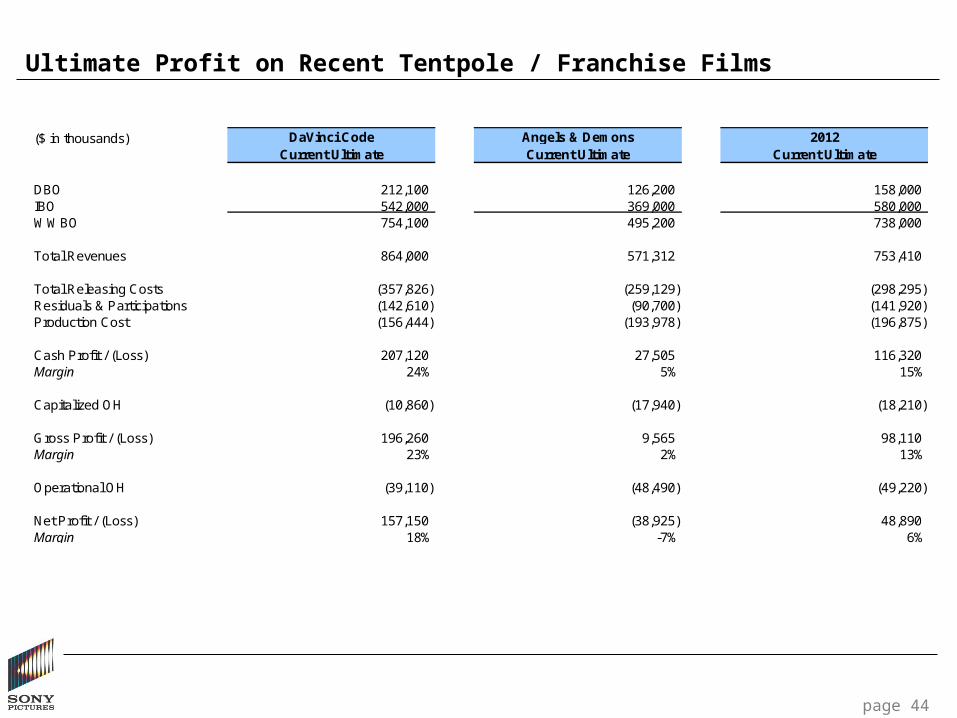
Ultimate Profit on Recent Tentpole / Franchise Films
page 44
($ in thousands) DaVinci Code Angels & Demons 2012Current Ultimate Current Ultimate Current Ultimate
DBO 212,100 126,200 158,000 IBO 542,000 369,000 580,000 WWBO 754,100 495,200 738,000
Total Revenues 864,000 571,312 753,410
Total Releasing Costs (357,826) (259,129) (298,295) Residuals & Participations (142,610) (90,700) (141,920) Production Cost (156,444) (193,978) (196,875)
Cash Profit / (Loss) 207,120 27,505 116,320 Margin 24% 5% 15%
Capitalized OH (10,860) (17,940) (18,210)
Gross Profit / (Loss) 196,260 9,565 98,110 Margin 23% 2% 13%
Operational OH (39,110) (48,490) (49,220)
Net Profit / (Loss) 157,150 (38,925) 48,890 Margin 18% -7% 6%

Ultimate Profit on Upcoming Tentpole / Franchise Films
page 45
($ in thousands)
Girl With The Dragon Tattoo MIB 3
Spider-Man (2012) ex.
Merch.Spider-Man
(2012) w/ Merch. Ghostbusters 3
Release Date 4th Quarter 2011 May 25, 2012 July 3, 2012 July 3, 2012 4th Quarter 2012
DBO 100,000 $230,000 $275,000 $275,000 $225,000IBO 175,000 356,000 400,000 400,000 375,000 WWBO 275,000 586,000 675,000 675,000 600,000
Total Revenues 330,690 $649,160 $706,530 $766,530 $639,200
Total Releasing Costs (173,080) (274,060) (326,630) (326,630) (278,680) Residuals & Participations (27,220) (112,810) (62,790) (63,790) (83,070) Production Cost (100,000) (210,000) (200,000) (200,000) (175,000)
Cash Profit / (Loss) 30,390 52,290 117,110 176,110 102,450 Margin 9% 8% 17% 23% 16%
Capitalized OH (9,000) (18,900) (18,000) (18,000) (15,750)
Gross Profit / (Loss) 21,390 33,390 99,110 158,110 86,700 Margin 6% 5% 14% 21% 14%
Operational OH * (25,000) (52,500) (50,000) (50,000) (43,750)
Net Profit / (Loss) (3,610) (19,110) 49,110 108,110 42,950 Margin -1% -3% 7% 14% 7%
Note 1 (as of 4/2010): Spider-Man 1 gross profit = $485.9 mil; Spider-Man 2 gross profit = $303.7 mil; Spider-Man 3 gross profit =$231.2 mil. All figures are before Ops OH Note 2 (as of 6/2010): Spider-Man 1 gross profit = $442.2 mil; Spider-Man 2 gross profit = $244.3 mil; Spider-Man 3 gross profit =$159.3 mil. All figures are after Ops OH
Note 1 (as of 4/2010): Spider-Man 1 gross profit = $485.9 mil; Spider-Man 2 gross profit = $303.7 mil; Spider-Man 3 gross profit =$231.2 mil. All figures are before Ops OH Note 2 (as of 6/2010): Spider-Man 1 gross profit = $442.2 mil; Spider-Man 2 gross profit = $244.3 mil; Spider-Man 3 gross profit =$159.3 mil. All figures are after Ops OH
**

page 46
Recent SG films have been greenlit at margins below historical levels
Screen Gems Films Greenlit AFTER Operational CostsScreen Gems Films Greenlit AFTER Operational Costs
5.2%
-0.9%
11.3%10.2%
8.6%
-3.4%
3.2%
13.5%
4.3% 4.3%
-6.0%
-4.0%
-2.0%
0.0%
2.0%
4.0%
6.0%
8.0%
10.0%
12.0%
14.0%
16.0%
BONE DEEP
DEATH AT A
FUNERAL
EASY A
THE ROOM
MATE
STRAW D
OGS
PRIEST
BURLESQUE
RESIDENT E
VIL 4
(3D)
LOVE, DON'T
LET M
E DOW
N
FRIENDS W
ITH B
ENEFITS
Gro
ss P
rofi
t M
arg
in
Net After Ops OH
page 47
5060
79 81
61
87
117 121
151
9587
66
80
0
20
40
60
80
100
120
140
160
180
200
FY99 FY00 FY01 FY02 FY03 FY04 FY05 FY06 FY07 FY08 FY09 FY10 FY11
$MM
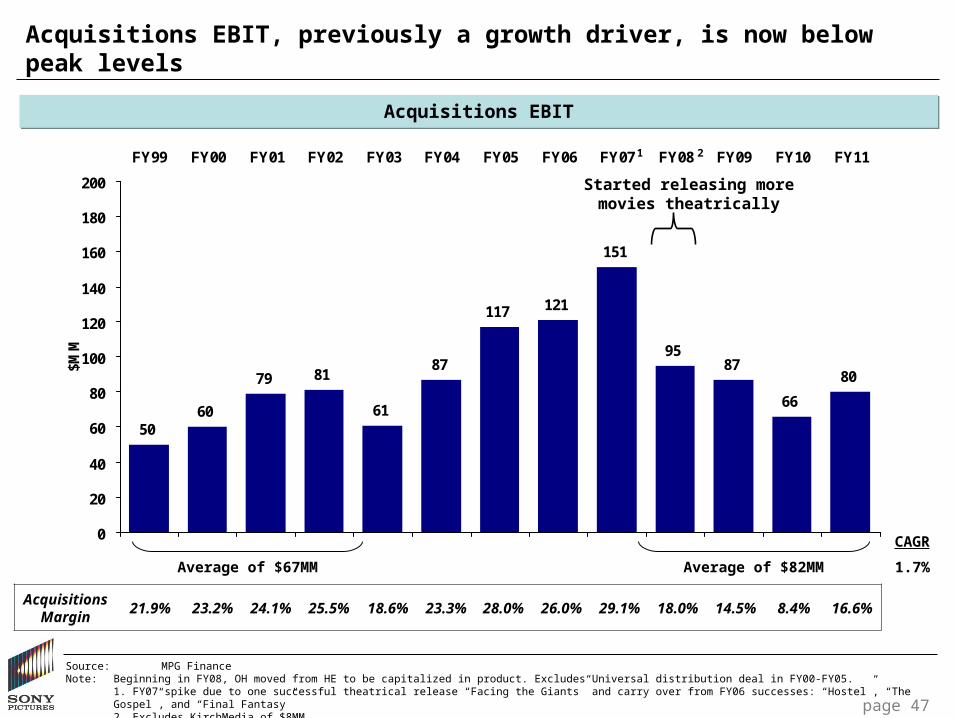
Acquisitions EBIT, previously a growth driver, is now below peak levels
CAGR
1.7%
Acquisitions Margin
21.9% 23.2% 24.1% 25.5% 18.6% 23.3% 28.0% 26.0% 29.1% 18.0% 14.5% 8.4% 16.6%
Source: MPG FinanceNote: Beginning in FY08, OH moved from HE to be capitalized in product. Excludes Universal distribution deal in FY00-FY05.
1. FY07 spike due to one successful theatrical release “Facing the Giants” and carry over from FY06 successes: “Hostel”, “The Gospel”, and “Final Fantasy”2. Excludes KirchMedia of $8MM
Started releasing more movies theatrically
Average of $67MM Average of $82MM
1 2
Acquisitions EBITAcquisitions EBIT

page 48
Estimated Profitability for SPA Films
Source: MPGNotes: (1) 20% of production costs
SmurfsHotel
TransylvaniaArthur Christmas Pirates!
Greenlight Current Variance Greenlight Current Variance
Release Date 8/3/2011 9/21/2012 11/11/2011 11/11/2011 9/28/2012 TBD 2012
DBO $125,000 $120,000 $75,000 $75,000 $0 $65,000 $65,000 $0IBO 190,000 120,000 120,000 120,000 0 115,000 115,000 0WWBO $315,000 $240,000 $195,000 $195,000 $0 $180,000 $180,000 $0
Total Revenues 380,310 316,940 292,320 243,770 (48,550) 275,620 219,030 (56,590)
Total Releasing Costs (183,730) (156,390) (163,490) (148,430) 15,060 (146,750) (132,150) 14,600Residuals & Participations (24,620) (3,940) (12,120) (10,810) 1,310 (18,820) (14,020) 4,800Production Cost (122,360) (102,000) (97,000) (99,000) (2,000) (65,000) (72,000) (7,000)
Cash Profit / (Loss) 49,600 54,610 19,710 (14,470) (34,180) 45,050 860 (44,190)Margin 13% 17% 7% NA 16% 0%
Capitalized OH (11,010) (23,300) (14,550) (9,900) 4,650 (6,500) (7,200) (700)
Gross Profit / (Loss) 38,590 31,310 5,160 (24,370) (29,530) 38,550 (6,340) (44,890)Margin 10% 10% 2% NA 14% NA
Operational OH (1)(24,470) (20,400) (19,400) (19,800) (400) (13,000) (14,400) (1,400)
Net Profit / (Loss) 14,120 10,910 (14,240) (44,170) (29,930) 25,550 (20,740) (46,290)
Margin 4% 3% NA NA 9% NA

CONFIDENTIAL
Television

page 50
SPT EBIT
Note: Following amounts are excluded; ($38mm) bad debt in FY05, and Kirch Recovery of $25mm and $62mm in FY07 and FY08. FY10 Restructure cost of ($10mm) also excluded. Distribution G&A includes restated amounts in FY04, FY05, FY06, FY08, FY09, and FY10 of 8,9,9,10,11,14,and 12 respectively related to US
distribution, Marketing, and Research
FY04 FY05 FY06 FY07 FY08 FY09 FY10FY11 Bud
US ProductionCurrent Series: Broadcast 23 20 (17) 15 (5) 7 (11) (3) Current Series: Cable 4 (6) (2) 8 7 2 18 9 Current Series: First Run Syndication 6 (19) 2 (23) (1) (1) 8 16 All Non-Scripted including ER (incl.Dig.) (3) (2) 2 Development Expense (23) (22) (25) (28) (35) (28) (28) (22)
Current Series, Pilots and Development 10 (27) (42) (28) (34) (23) (15) 2
Wheel of Fortune, Jeopardy!, Soaps 210 154 169 140 146 133 142 128 Library 92 93 87 74 85 115 70 63 Third Party Distribution 60 25 16 14 4 8 8 - Seinfeld 117 58 54 31 40 21 11 33 All Other Products (11) (5) (5) 7 (5) (11) - 2 Net G&A (31) (33) (32) (36) (39) (48) (43) (36)
Current Annuities, Library and Overhead 438 292 289 230 231 219 188 190
US Production EBIT 448 265 247 202 197 196 174 192
GSN Equity Earnings 3 5 6 9 17 16 18 24 Fearnet Equity Earnings - - - (3) (6) (4) - - Crack le & Digital Studio (9) (22) (25) (16) (5)
International Networks Before Monetizatiions 12 28 41 34 71 97 117 142
International Production 6 7 9 4 7 10 10 20
Distribution (G&A and Acq Prod) (34) (41) (34) (55) (58) (64) (52) (51)
Total TV EBIT before Monetizations 435 264 269 183 206 225 251 322
Network Monetizatiions 7 40 7 - 42 70 330 Starz/Encore Bonus 30 37 48 48 48 48 50 50
IGT Advance 53 9 34 10 30 10
Total TV EBIT 525 350 358 241 326 354 631 372
Actual

CONFIDENTIAL
Implications and Required Actions

Without improvement, profits are likely to remain at roughly $200MM
page 52
Notes: 1. Assumes 15% decline equals $10MM profit loss x 2 years
Potential Risk & Growth by FY13Potential Risk & Growth by FY13
$ MM$ MM
FY11 EBIT $177
Risk / Decline
TV Annuities Decline (Historical decline of 7% per year) TBDBrick & mortar rentailer bankruptcies (40) Sell-through New Release Risk (50)
Catalog / Flow from HE (1)
(20) OH growth if 5% per year (100)
($210) + TBDGrowthNetworks 100 International TV Production 30 M&A ("Acquired EBIT") TBDTV Syndication 50 Early Window / Home Theater 25
Slate Improvements (Incl. Franchises, Ticket Prices, 3D) TBDAnimated Profits (If still breakeven in FY13) 0IT Outsourcing / Shared Services 10 Digital Backbone 5Other OH Reductions TBD
$220 + TBD
Net Increase $10 + TBD
Potential EBIT by FY13 Approx. $200MM
page 53page 53
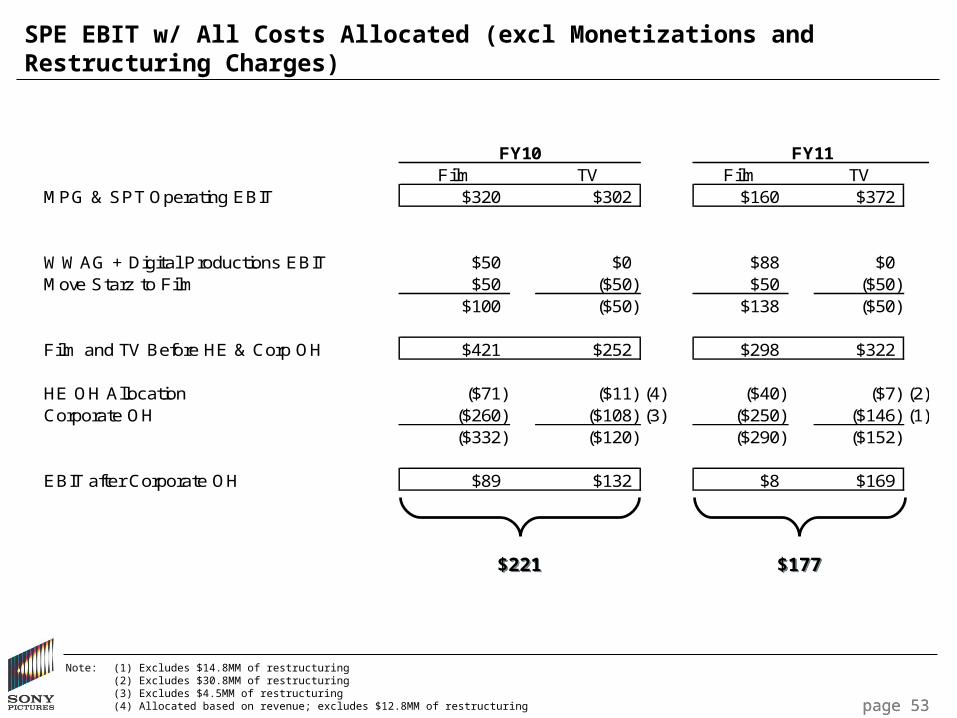
SPE EBIT w/ All Costs Allocated (excl Monetizations and Restructuring Charges)
Note: (1) Excludes $14.8MM of restructuring(2) Excludes $30.8MM of restructuring(3) Excludes $4.5MM of restructuring(4) Allocated based on revenue; excludes $12.8MM of restructuring
FY10 FY11Film TV Film TV
MPG & SPT Operating EBIT $320 $302 $160 $372
WWAG + Digital Productions EBIT $50 $0 $88 $0Move Starz to Film $50 ($50) $50 ($50)
$100 ($50) $138 ($50)
Film and TV Before HE & Corp OH $421 $252 $298 $322
HE OH Allocation ($71) ($11) (4) ($40) ($7) (2)Corporate OH ($260) ($108) (3) ($250) ($146) (1)
($332) ($120) ($290) ($152)
EBIT after Corporate OH $89 $132 $8 $169
$221$221 $177$177

page 54
EBIT Growth Required to Achieve Potential Targets
FY11 EBIT Before Monetizations, Challenges, and Restructuring Charges (1)FY11 EBIT Before Monetizations, Challenges, and Restructuring Charges (1)
Notes: 1. HE Overhead % allocation is based on % of MPG and TV revenues recognized in HE2. Film includes MPG, Acquisitions, SPI/SPA, Starz plus HE retained EBIT before OH + 94% of HE overhead3. TV excluding Starz + 6% of HE overhead4. Corporate overhead allocated based on revenues
Achieve $500MMAchieve $500MM
Achieve 10% Margin
Achieve 10% Margin
($MM) EBIT Before Allocated OH EBIT After Allocated OH
Film TV
Corporate &
HE OH Total Film (2)
TV (3)
Total
Revenues $4,525 $2,637 $7,162 $4,525 $2,637 $7,162
EBIT $298 $322 ($443) $177 $8 $169 $177 Margin 7% 12% 2% 0% 6% 2%
+$215 +$108 +$323= = =
$223 $277 $5005% 11% 7%
+$359 +$180 +$539= = =
$367 $349 $7168% 13% 10%

Areas of focus and investment
• Are there additional tentpole / franchise opportunities we should pursue?
• Should we shift a portion of our investment in “singles and doubles” to tentpole / franchise films?
• Are we utilizing our development spend on the right people and projects?
• Are we investing the right amount in our TV networks?
• Are we investing the right amount in our broadcast TV business?
Sources of capital for investment
• Do we fund new investments by reallocating capital, or do we make the case for more cash from Tokyo?
• How can we better manage our cash flow?
Profitability
• What is the appropriate level of profitability for our business?
• Are there additional steps we can take to increase our films’ revenues and decrease production, marketing and talent costs?
• Are there opportunities for further reorganization and cost saving?
• What can we do to improve our short term profitability, while still protecting our future?
Process• How do we track our progress against the initiatives we have discussed today?
page 55page 55
Key Questions
Prioritizing Investment
Policies and Procedures
• Prioritize investment on higher margin films (higher greenlight margin thresholds)
• Incorporate more aggressive HE declines in greenlights
• Skew slate toward films that are less exposed to risk of declines in home
entertainment
• Process for managing tentpole / franchise discussions
• Better cash management, including in International Production
page 56

Growth Opportunities for Discussion
• Secure additional film tentpoles / franchises
• Invest in TV production (secure additional syndicated comedies and broadcast dramas)
• Launch / acquire new TV networks
• Early Windows / Home Theater
• Make VOD more compelling (breadth of titles, partner for better search) to shift rental to higher margin VOD
• Acquire new product for TV networks (e.g., rights to sports franchises)
• Originals for digital networks
• Acquired film product
• Rent-a-system deals
How do we prioritize opportunities and which will move the needle?
Are we willing and able to invest near-term EBIT for long-term profits?
Are we willing to “buy EBIT” with cash?
page 57
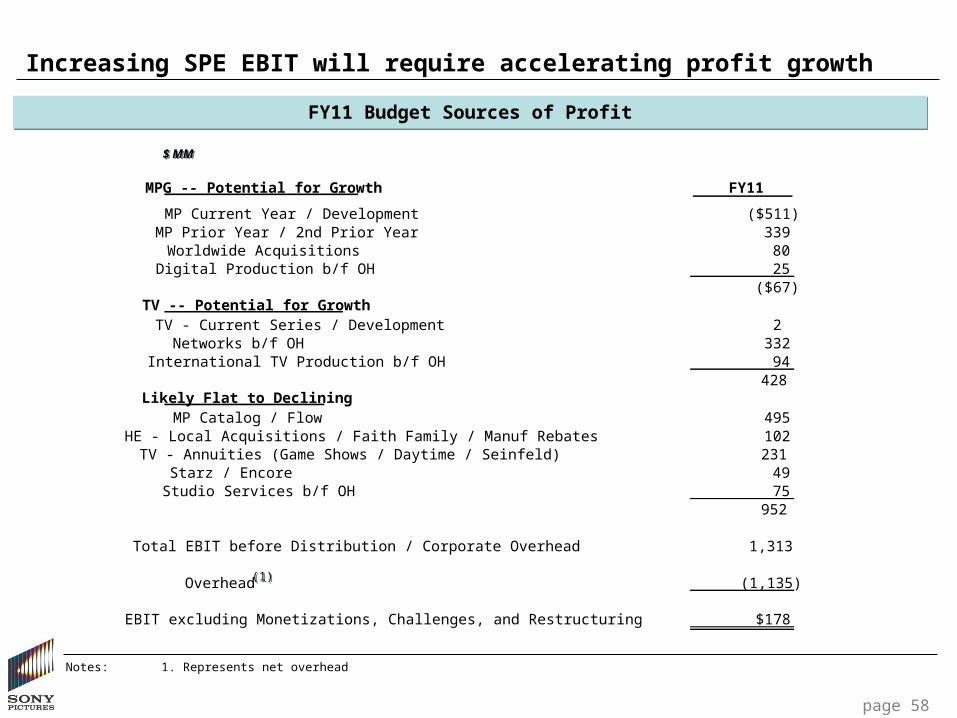
Increasing SPE EBIT will require accelerating profit growth
page 58
FY11 Budget Sources of ProfitFY11 Budget Sources of Profit
$ MM$ MM
Notes: 1. Represents net overhead
(1)(1)
MPG -- Potential for Growth FY11
MP Current Year / Development ($511)MP Prior Year / 2nd Prior Year 339 Worldwide Acquisitions 80 Digital Production b/f OH 25
($67)TV -- Potential for Growth
TV - Current Series / Development 2 Networks b/f OH 332 International TV Production b/f OH 94
428 Likely Flat to Declining
MP Catalog / Flow 495 HE - Local Acquisitions / Faith Family / Manuf Rebates 102 TV - Annuities (Game Shows / Daytime / Seinfeld) 231 Starz / Encore 49 Studio Services b/f OH 75
952
Total EBIT before Distribution / Corporate Overhead 1,313
Overhead (1,135)
EBIT excluding Monetizations, Challenges, and Restructuring $178

To improve profitability, we also need to continue to address our cost base
page 59
FY11 Budget SPE Cost Base(1)FY11 Budget SPE Cost Base(1)
Notes: 1. Excludes $57MM of “all other” expenses2. Represents net overhead
(2)(2)
($MM) FY11
Film Production (MPG, WAG, SPA, HE) ($1,605)Film Development (88)
Film Prints & Other Releasing Costs (234) Marketing (Theatrical) (1,039) Sub-total (P&A) (1,273)
HE Manufacturing (net of $70m rebate) (462) HE Marketing (243)
Television Production Costs/Profit Participation & Residuals (1,147) TV Development (31) TV Marketing (45) TV Other Releasing costs (69)
Network Broadcast Rights (472) Network Operating Costs (64) Network Marketing (147)
Sub-total (Overhead) (1,135)
Total Expense: (6,781)

CONFIDENTIAL
APPENDIX

Sources of Leading Tentpole / Franchise Films
To generate franchise hits, competing studios draw on internal assets (e.g. Theme Parks or Publishing arms) or acquire
established properties (e.g. Toys, Books, Comics)
Year Name
Gross Domestic
B.O.Studio
DistributorProperty Source
2008 The Dark Knight $533 WB Acquired Publishing Arm2009 Transformers: Revenge of the Fallen $402 P/DW Hasbro Toy License2007 Transformers $319 P/DW Hasbro Toy License2009 Up $293 Dis Internal Development2006 Cars $244 Dis Internal Development2009 Avatar $748 Fox Internal Development2005 Star Wars: Episode III - Revenge of the Sith $380 Fox Internal Development2008 Indiana Jones and the Kingdom of the Crystal Skull $317 Par. Internal Development2005 Chronicles of Narnia: The Lion, the Witch and the Wardrobe $292 Dis Licensed Book Property2006 Night at the Museum $251 Fox Licensed Book Property2007 Shrek the Third $323 P/DW Licensed Book Property2009 The Twilight Saga: New Moon $297 Sum. Licensed Book Property2009 Harry Potter and the Half-Blood Prince $302 WB Licensed Book Property2007 Harry Potter and the Order of the Phoenix $292 WB Licensed Book Property2005 Harry Potter and the Goblet of Fire $290 WB Licensed Book Property2006 X-Men: The Last Stand $234 Fox Marvel License2007 Spider-Man 3 $337 Sony Marvel License2008 Iron-Man $318 MVL/P/DIS Owned Comic Book Publishing Arm2006 Pirates of the Caribbean: Dead Man's Chest $423 Dis Owned Theme Park2007 Pirates of the Caribbean: At World's End $309 Dis Owned Theme Park2009 Star Trek $258 Par. Owned TV Studio
page 61
Source: BoxOfficeMojo.comSource: BoxOfficeMojo.com

Sources of SPE Tentpole / Franchises
NameProperty Source
Proven Franchise with Future Release PlansGhostbusters Internal DevelopmentMen in Black Acquired Comic Book PropertyResident Evil Licensed Game PropertyRobert Langdon (Da Vinci Code) Licensed Book PropertySpider-Man Marvel LicenseUnderworld Internal Development
Proven Franchise with Potential Release PlansBad Boys Internal DevelopmentGhost Rider Marvel License
Upcoming / Recent Potential Franchises / SequelsBattle: Los Angeles Internal DevelopmentCloudy w/ A Chance of Meatballs Licensed Book PropertyDistrict 9 AcquiredGreen Hornet Licensed Comic & TV PropertyHotel Transylvania Int. Dev. / Public DomainKarate Kid Internal DevelopmentPaul Blart: Mall Cop Internal DevelopmentPineapple Express Internal DevelopmentPirates! Internal DevelopmentPriest Licensed Comic Book PropertySalt Internal DevelopmentSmurfs Licensed TV PropertyTintin Licensed Book PropertyZombieland Internal DevelopmentZookeeper Ext. Dev. / Co-fi with MGM
Potential Franchises in Development21 Jump Street Licensed TV PropertyChitty Chitty Bang Bang Licensed PlayGirl w/ The Dragon Tattoo Licensed Book PropertyGoosebumps Licensed Book PropertyMasters of the Universe Licensed TV PropertySinbad Int. Dev. / Public Domain
page 62

page 63
FY07 – FY11 Columbia & Screen Gems SlateFY07A FY08A FY09A FY10A FY11 Budget
SILENT HILL SPIDER-MAN 3 MADE OF HONOR ANGELS AND DEMONS KARATE KID
RV I KNOW WHO KILLED ME YOU DON'T MESS WITH THE ZOHAN TAKING OF PELHAM 1 2 3 GROWN UPS
DA VINCI CODE SUPER BAD HANCOCK YEAR ONE SALT
CLICK FEEL THE NOISE STEP BROTHERS UGLY TRUTH THE OTHER GUYS
MONSTER HOUSE WE OWN THE NIGHT PINEAPPLE EXPRESS JULIE & JULIA EAT, PRAY, LOVE
TALLADEGA NIGHTS 30 DAYS OF NIGHT THE HOUSE BUNNY ZOMBIELAND SOCIAL NETWORK
CROSSOVER WALK HARD: THE DEWEY COX ST. NICK AND NORAH'S INF. PLAYLIST MICHAEL JACKSON'S THIS IS IT VIRGINITY HIT
GRIDIRON GANG VANTAGE POINT PASSENGERS 2012 HOW DO YOU KNOW
ALL THE KING'S MEN THE OTHER BOLEYN GIRL QUANTUM OF SOLACE DID YOU HEAR ABOUT THE MORGANS GREEN HORNET
GRUDGE 2 21 SEVEN POUNDS BOUNTY HUNTER JUST GO WITH IT
MARIE ANTOINETTE PAUL BLART: MALL COP BATTLE LA
RUNNING WITH SCISSORS (TS) THE PINK PANTHER 2 RESTLESS
STRANGER THAN FICTION THE INTERNATIONAL
CASINO ROYALE
THE HOLIDAY
THE PURSUIT OF HAPPYNESS
CATCH AND RELEASE
THE MESSENGERS
GHOST RIDER
PREMONITION (TS)
REIGN OVER ME
STOMP THE YARD VACANCY PROM NIGHT OBSESSED DEATH AT A FUNERAL
THE COVENANT RESIDENT EVIL 3 LAKEVIEW TERRACE STEPFATHER TAKERS
THIS CHRISTMAS QUARANTINE ARMORED RESIDENT EVIL: AFTERLIFE
FIRST SUNDAY NOT EASILY BROKEN LEGION EASY A
UNTRACEABLE UNDERWORLD 3 DEAR JOHN BURLESQUE
FIRED UP COUNTRY STRONG
MARDI GRAS
THE ROOMMATE
THE PRIEST
Ultimate Profit b/f OH
$619 $467 $266 $234 $229
ColumbiaColumbia
Screen Gems
Screen Gems

page 64
Estimated Profitability for SPA Films
Source: MPGNotes: (1) 20% of production costs
Open Season Franchise
Surf's UpCloudy with a
Chance of Meatballs
Release DateOS 9/29/2006
OS2 1/27/2009 6/8/2007 9/18/2009
DBO $85,100 $58,800 $125,000IBO 112,200 90,200 117,000WWBO $197,300 $149,000 $242,000
Total Revenues 419,860 263,214 316,819
Total Releasing Costs (241,801) (195,807) (168,469)Residuals & Participations (6,310) (3,370) (4,950)Production Cost (110,650) (99,500) (117,700)
Cash Profit / (Loss) 61,099 (35,463) 25,700Margin 15% NA 8%
Capitalized OH (13,000) (19,500) (30,300)
Gross Profit / (Loss) 48,099 (54,963) (4,600)Margin 11% NA NA
Operational OH (1) (22,130) (19,900) (23,540)
Net Profit / (Loss) 25,969 (74,863) (28,140)Margin 6% NA NA

Cost Cutting – Immediate Impact
Cost Cutting – Immediate Impact
Cost Cutting – 3-5 Years to Fully
Impact P&L
Cost Cutting – 3-5 Years to Fully
Impact P&L
Growth – 3-5 Years to Fully Impact P&L
Growth – 3-5 Years to Fully Impact P&L
page 65
OH – Hiring Freeze $33 -- $55 3-5% of $1.1BNFilm Marketing Expense $75 -- $100 7.5-10% of $1BNSub-Total $108 -- $155
Film Production Expense $80 -- $160 5-10% of $1.6BNMPG Development $15 -- $20Sub-Total $95 $180
New Film Franchise $40 -- $80 "Like Spider-Man 4" Syndicated 1/2 Hr Comedy $25 -- $35Syndicated 1 Hr Drama $30 -- $40Int'l Uplift from 1 Hr. Drama $35 -- $50Early Windows $25 -- $50 $4-$6MM per film on 12 FilmsGSN Buy-up $20 -- $30 Grows as amortization decreasesSub-Total $175 -- $285
Total Potential $375 -- $625
Total of Cost Cuts+ 50% of Growth
$285 -- $485
Strawman of Actions to Pursue
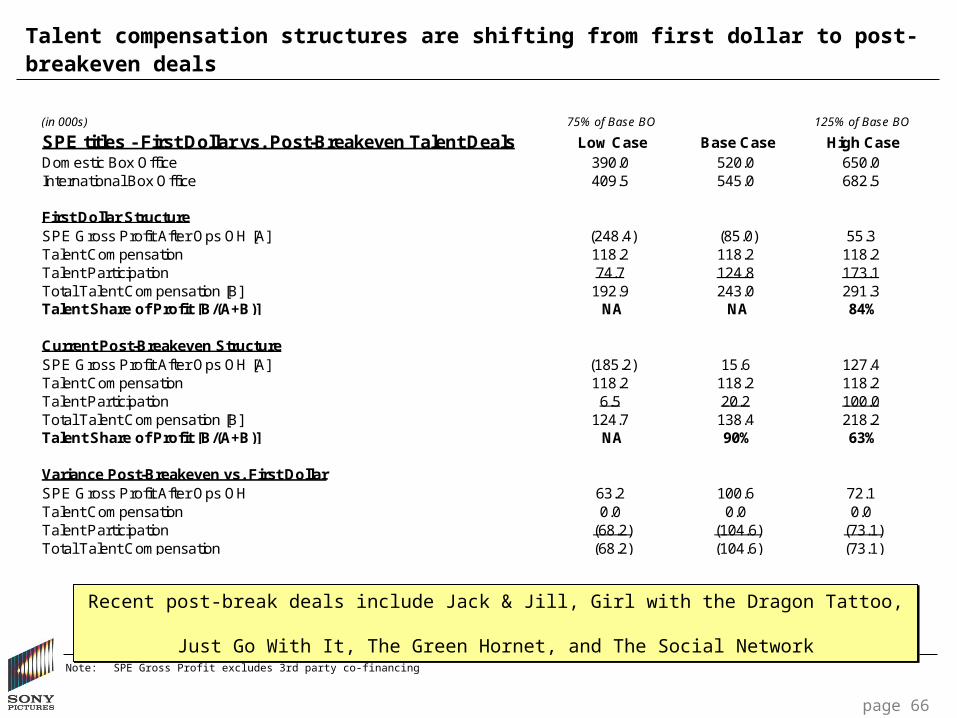
Talent compensation structures are shifting from first dollar to post-breakeven deals
Note: SPE Gross Profit excludes 3rd party co-financing
page 66
(in 000s) 75% of Base BO 125% of Base BO
SPE titles - First Dollar vs. Post-Breakeven Talent Deals Low Case Base Case High CaseDomestic Box Office 390.0 520.0 650.0International Box Office 409.5 545.0 682.5
First Dollar StructureSPE Gross Profit After Ops OH [A] (248.4) (85.0) 55.3Talent Compensation 118.2 118.2 118.2Talent Participation 74.7 124.8 173.1Total Talent Compensation [B] 192.9 243.0 291.3Talent Share of Profit [B/(A+B)] NA NA 84%
Current Post-Breakeven StructureSPE Gross Profit After Ops OH [A] (185.2) 15.6 127.4Talent Compensation 118.2 118.2 118.2Talent Participation 6.5 20.2 100.0Total Talent Compensation [B] 124.7 138.4 218.2Talent Share of Profit [B/(A+B)] NA 90% 63%
Variance Post-Breakeven vs. First DollarSPE Gross Profit After Ops OH 63.2 100.6 72.1Talent Compensation 0.0 0.0 0.0Talent Participation (68.2) (104.6) (73.1)Total Talent Compensation (68.2) (104.6) (73.1)
Recent post-break deals include Jack & Jill, Girl with the Dragon Tattoo, Just Go With It, The Green Hornet, and The Social Network
Recent post-break deals include Jack & Jill, Girl with the Dragon Tattoo, Just Go With It, The Green Hornet, and The Social Network

page 67page 67
SPHE Domestic FY05-FY10 2nd Prior / Catalog / Flow Gross Profit
$217
$165$149 $146
$119$126
$114
FY05 FY06 FY07 FY08 FY09 FY10 FY11Bud.
SPHE Domestic FY05-FY10 2nd Prior / Flow / Catalog GP($ Millions)
SPHE Domestic FY05-FY10 2nd Prior / Flow / Catalog GP Margin(% of Revenue)
60%53%
46% 44% 42%
49%43%
FY05 FY06 FY07 FY08 FY09 FY10 FY11Bud.

The domestic television market is showing signs of recovery as ad revenues stabilize for broadcast networks and grow for cable and local stations
$13,652
$11,415
$6,889
$2,844
$15,800
$8,620
$3,757
$17,500
$11,349
$13,703
$0
$2,000
$4,000
$6,000
$8,000
$10,000
$12,000
$14,000
$16,000
$18,000
$20,000
AdvertisingRevenue
ProgrammingExpenses
Net OperatingRevenue
ProgrammingExpenses
Net AdvertisingRevenue
2009 2013
$3,341Ads
$3,444Fees
$104 Other
$4,347Ads
$4,147Fees
$126 Other
$ in millions
Broadcast Net Ad Revenue and Programming Expense
2009 vs. 2013
Broadcast Net Ad Revenue and Programming Expense
2009 vs. 2013
Select Cable Network Revenue and Programming Expense
2009 vs. 2013
Select Cable Network Revenue and Programming Expense
2009 vs. 2013
Local TV Station Advertising Revenue
2009 vs. 2013
Local TV Station Advertising Revenue
2009 vs. 2013
0%
0%
25%
32%
Source: SNL Kagan, May 2010Broadcast networks include ABC, CBS, Fox and NBC; Cable networks include A&E, AMC, FX Network, TBS, TNT, USANote: (1) Local TV station net advertising revenue includes both local and national spots
11%
(1)
page 68
• Net Advertising up from ’08 to ’09• Future upside beyond ad revenue
from sub fees
• Net Advertising up from ’08 to ’09• Future upside beyond ad revenue
from sub fees

Scripted shows are increasing as a percentage of primetime
page 69page 69page 69page 69
Source: SPTNote 1: Scripted and non-scripted excludes sports and news programming (60 MIN, 20/20,etc)Note 2: Total primetime hours by network: ABC, NBC, CBS = 22 hours; FOX = 15 hours; CW = 10 hours per week)
24% 23% 18%
57% 64%
18% 20% 18%
58%
2008/2009 2009/2010 2010/2011
U.S. Primetime Programming Mix by SeasonU.S. Primetime Programming Mix by Season
Sports / News
Non-Scripted
Scripted
2% -2%
-1% 7%
-1%-5%

page 70
Sources of Motion Picture Group EBIT
Notes: 1. Excludes $38MM Kirch Media Payment2. Excludes $195MM on monetizations and operating challenges3. Includes $35MM development write-offs for Spider-Man 4 ($25MM) and Moneyball ($10MM)4. After reclassifying $20MM of costs as corporate 5. Flow equals EBIT from titles released 4 through 10 fiscal years prior; Catalog equals EBIT from titles released over 10 fiscal years prior
$373
$561
$389
$313
$154
$0
$100
$200
$300
$400
$500
$600
FY07 Actual FY08 Actual FY09 Actual FY10 Actual FY11 Budget
$MM
Current Year Releases
Current year losses excluding challenges
are forecast to increase significantly
Current Year Releases
($271) ($249) ($269) ($240) ($433)
Flow / Catalog / Prior & 2nd Prior
$917 $1,069 $932 $863 $834
Development ($98) ($73) ($69) ($121) ($78)
OH ($175) ($186) ($206) ($189) ($169)
(1)
(2)
(3)
(4)
(5)

page 71
Film Development Spend
$42 $39 $45$32 $34 $31 $27
$92
$66 $53
$43
$80
$53
$2
$1
$4$3
$4
$3
$136
$106$98
$79 $82
$115
$83
$45
($10)
$10
$30
$50
$70
$90
$110
$130
$150
FY 05 FY 06 FY 07 FY 08 FY 09 FY 10 FY 11 Budget
$MM
Columbia Term Deals Columbia Projects Screen Gems & IMPP
Film Development Spend, FY05 – FY14Film Development Spend, FY05 – FY14

$292 $289
$230 $231$219
$188 $190$176 $177
($27)($42)
($28) ($34)($23) ($15)
$2$16
$51
(100)
(50)
0
50
100
150
200
250
300
350
FY05 FY06 FY07 FY08 FY09 FY10 FY11Budget
FY12 FY13
$M
Current Annuities, Library, and OH Current Series, Pilots and Development
page 72page 72page 72($ In millions)
Television Production and Distribution Business
Source: SPTNote: (1) Includes: WOF, Jeopardy, Young and the Restless, and Days of Our Lives and Library product. Excludes IGT
• Annuities and Library product have declined
• The decrease has been partially mitigated by decreased investment level in new product
• However, shoring-up earnings requires continuing to create syndicated hits
(1)

page 73page 73page 73
Although pilots are forecasted to decrease by over 50%, SPE forecast still assumes a syndicated hit
*
Source: SPTNote: * 2 pilots remain in contention for midseason, pilot reshoots may be necessary

SPT International Production Business
$7$9
$4$7
$10 $10
$20
$35
$50
$0
$10
$20
$30
$40
$50
$60
FY05 FY06 FY07 FY08 FY09 FY10 FY11 FY12 FY13
$M
M
SPT International Production Financial Summary FY05-FY13SPT International Production Financial Summary FY05-FY13
Source: SPTNote: FY09 through FY11 excludes restructuring costs
page 74

page 75page 75page 75page 75
Source: SPTNote: (1) Excludes Crackle
$33 $47$82
$109$135
$40 $7
$42
$70
$330
$73
$41
$124
$179
$465
$169
$210
$270
$54
$0
$50
$100
$150
$200
$250
$300
$350
$400
$450
$500
FY05 FY06 FY07 FY08 FY09 FY10 FY11 FY12 FY13
$MM
Operations Monetizations & One-Offs
Monetizations / One-OffsFY05: $28MM Latin America equity swap; $12MM Cinenova settlementFY06: $7MM Cinenova settlementFY08: $33MM HBO Asia sale; $9MM E! Latin America saleFY09: $25MM Spectrum sale; $45MM one-time HBO LAG payment to not exercise right to buy-upFY10: $85MM GSN /FUN transaction; $245MM HBO CE and HBO LAG sales
26% CAGR
50% CAGR
Networks continues strong growth and expects to double EBIT in 3 years
Networks Business EBIT (1)Networks Business EBIT (1)