Embed Size (px)
Citation preview
conference papers
1628 # 2002 International Union of Crystallography � Printed in Denmark ± all rights reserved Acta Cryst. (2002). D58, 1628±1632
Experimental observations and numerical modelling of diffusion-driven crystallisation processes
Luigi Carotenuto,a* Chiara Piccolo,ab Dario Castagnolo,a Marcello Lappa,a Alessandra Tortoraa and Juan Manuel Garcìa-Ruizc
aMARS Center, Via E. Gianturco 31, I-80146 Napoli, Italy, bDepartment of Space Science and Engineering, University of Naples “Federico II”, P.le V. Tecchio 80, I-80125 Napoli, Italy, and cLaboratorio de Estudios Cristallogràficos, Instituto Andaluz de la Tierra, CSIC/Universidad de Granada, Av. Fuentenueva s/n, E-18002 Granada, Spain. E-mail: [email protected]
This paper reports experimental results and modelling on the crystallisation processes induced by counter diffusion method of a precipitant agent in a lysozyme protein solution. Comparison between experimental observations and numerical simulations in the presence of convection and sedimentation and without them (suppressed using gel) provides a validation of the model. Different values of the initial protein concentration are used, in order to investigate the effects of supersaturation conditions on the process, and in particular on nucleation. The model and the experimental approach may represent a useful methodology for the determination of the parameters and conditions that may lead to protein crystallisation. A Mach-Zehnder interferometer is used to monitor the transport dynamics in situ in the fluid phase by observing the compositional field. The effect of the solute transport gives rise to a "nucleation front" that propagates inside the protein solution. The crystal formation, caused by progressing of the front, results in a modulation in time and in space (similar to Liesegang patterns), due to the non-linear interplay among transport, crystal nucleation and growth. Both experimental observation and numerical modelling show spatial and size distributions of crystals that demonstrate comparable evidences of the phenomena.
Keywords: Counter-diffusion method; interferometry; agarose gel, protein crystal growth
1. Introduction
The understanding of the crystal growth process is often difficult in terrestrial laboratory. In fact, even in absence of free surfaces where the Marangoni effect may induce convection, gravity causes either crystal sedimentation or density-driven and convective flows, generated around growing crystal surfaces. These phenomena are generally observed when nucleation occurs in liquid solutions (Piccolo et al., 2002).
In order to uncouple these effects, our study has been performed by locking the protein solution inside agarose gel. The gel pore size is 0.509 µm since its concentration is 1% w/v (Maaloum et al., 1998). Using gel prevents convective mixing, provides conditions for pure-diffusive regime, and, therefore, represents a method to simulate microgravity environment on ground. However, it is not still completely elucidated if the gel acts on both nucleation and crystallisation process. The studies performed up to now have clarified that the physical properties of gels and their interactions with protein depend strongly on the gel itself, on the protein and on their concentration. For example some authors (Vidal et al., 1999) assessed that the gel could inhibit or promote the nucleation,
depending on the gel itself: respectively, silica gel could be a nucleation inhibitor and agarose could be a nucleation promoter. Thiessen (1994) showed that the promoting effect of the agarose gel inverts itself at a value of the agarose concentration of 0.4%w/v, and the same behaviour is reproduced for different concentration of the precipitant agent. The same author sustained that a value of 0.4%w/v was the best condition to ensure stability of the gel matrix without restricting the crystal growth. Nevertheless, the author underlined that tests within a great concentration range is necessary to give a more definitive interpretation. Other authors (Maaloum et al., 1998) demonstrated the effect of the concentration and of the ionic strength on the pore diameter of the gel.
In the light of the above arguments, it seems that a complete understanding of the influence of the gel on nucleation and crystal growth is still lacking and further investigations are needed in order to asses whether or not gel is the optimal environment for protein crystal growth.
Microgravity conditions on board space laboratories may represent an alternative to the gel. Nevertheless, residual accelerations are present in these laboratories, consequently sedimentation and natural convection still occur. Some recent experiments, performed in the International Space Station, have demonstrated that the level of residual accelerations induces motion of crystals (Vergara et al., 2002).
For these reasons, the understanding of the role of microgravity for protein crystal growth and its eventual benefit for obtaining high quality crystals is to be investigated furthermore. Particularly relevant is the interplay between nucleation and growth, on one side, and transport phenomena in fluid phase induced by residual accelerations, on the other one.
The present work intends to deepen such interplay both on Earth and in Space. Low g environment conditions are simulated using gel on Earth, in order to prepare an experiment in microgravity, foreseen on board International Space Station (ISS).
The approach followed in the work is based on the comparison between experimental observations and computer simulation based on a model that couples transport in liquid phase, nucleation and crystal growth. In the following, the experimental method and the model are described. Then the experimental results are reported and compared with the numerical simulations.
2. Material and methods
2.1. Experimental methods
Protein crystallisation is performed by counter-diffusion technique (Garcia-Ruiz & Moreno 1994). The experimental configuration consists of a crystallisation chamber where a precipitant agent solution is collocated above a gellified protein solution. This set-up prevents convective mixing and provides a stable interface between the two solutions. Furthermore the counter-diffusion method can be particularly suitable to produce macromolecular crystals, because: i) the counteracting phenomena that take place during the process self-limit the maximum value of supersaturation that is actually reached during the crystallisation, thus establishing better conditions for obtaining relatively large single crystals; ii) a range of supersaturation values is established in different locations along the protein solution during the process, allowing to scan different crystallisation conditions in the same experiment. Both these features are of interest for the growth of macromolecular crystals.
Hen egg white (HEW) lysozyme (purchased from Sigma) is buffered with 50 mM sodium acetate, pH = 4.5. A solution of sodium acetate and 1% agarose gel is prepared; HEW lysozyme protein is added in this solution until the desired concentration. The initial concentration ranges from 40 to 80 mg/ml. Mixing of gel and
Acta Cryst. (2002). D58, 1628±1632 Carotenuto et al. 1629
conference papers
Table 1 Geometrical and physical parameters used both for simulations and experiments. L, H, W are the length, height and width of the chamber respectively. The subscript (1) and (2) refers to lysozyme and NaCl respectively, C is the initial concentration.
Parameter Unit Value L (cm) 1 H (cm) 4 W (cm) 0.1 Height of the protein chamber (cm) 1.95 D1 (cm2/s) 10-6 D2 (cm2/s) 10-5 C1 (mg/ml) 40,60,80 C2 (mg/ml) 140
protein is carried out just before filling up the bottom of the cell. The introduction of the protein in the gel solution and the filling of the lower part of the cell are to be done rapidly, with all the materials kept at about 45 °C. When the solution becomes gelled, a solution of sodium chloride is injected from the upper part of the cell. The cell is made of quartz and has optically flat walls with size of 5 cm x 1 cm x 0.1 cm.
Crystallisation occurs by diffusion of the salt in the part of the cell containing the protein solution; in fact, lysozyme diffuses more slowly than salt (see Table 1). Neither crystal sedimentation nor fluid motion can be expected at 1% agarose concentration (Garcia-Ruiz et al., 2001). All the experiments were performed at 25 °C.
A Mach Zehnder interferometer (Malacara, 1992) is used to study the transport dynamics in the fluid phase. Linear polarised light emitted by a 5 mW He-Ne laser, after spatial filtering, is divided by a cubic beam splitter in a reference beam (RB) and in a test beam (TB), that goes through the sample. Another beam splitter, which is used to produce the interference pattern, superimposes these two beams. In fact, any local changes in the composition of the solution induces a change in the refractive index n, that causes the loss of flatness of the wave front of the TB, while the RB retains its flat wave front. The analysis of the interferometry pattern allows one to evaluate changes of n field in the sample.
The interferometric pattern is magnified by a microscope objective and observed simultaneously by a CCD digital camera (1280 x 1024 pixels). The recorded images are in turn transferred to a computer for further analysis. The field of view covers an area of 6.5 x 6.5 mm2 that initially includes the interface. During the experiments, the cell is moved upward, in order to scan the half-bottom part of the cell, where the crystallisation process occurs in the gel matrix.
A similar interferometric method was used by McPherson et al (1999) to give a direct evidence of the quasi stable depletion zone that forms around growing crystal in space. This result could explain the improved quality of macromolecular crystals grown in microgravity.
2.2. Mathematical model and numerical method
The diffusion of a solute is governed by the following equations:
i
2i
i CDt
C ∇=∂
∂
(1)
where t is time, C is the concentration, Di is the diffusion coefficient, and the subscript "i" ranges from 1 to 2, which corresponds to lysozyme and NaCl respectively. In order to simulate the real experimental conditions, the effect of a non-planar salt-gel interface is taken into account. This assumption is motivated since surface tension effects deviate this interface from horizontal displacement. The distribution of salt at the initial time is supposed to follow the shape of the gel meniscus. The shape is modelled using a sin(x)
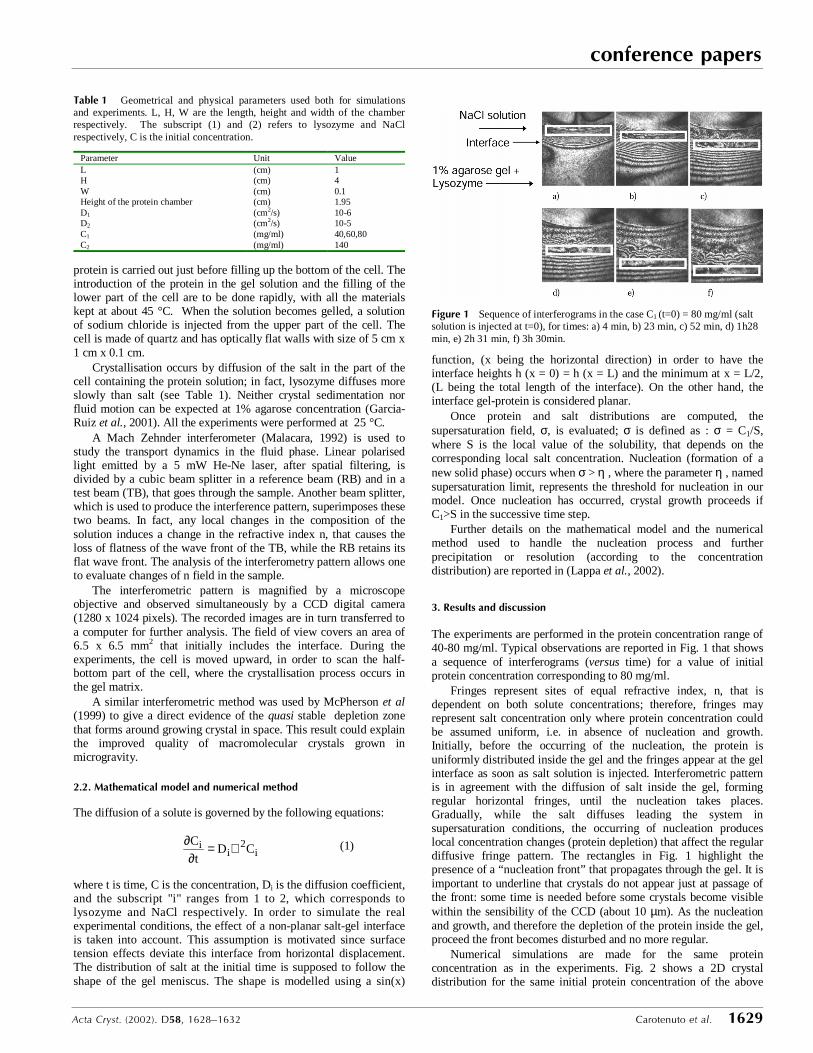
Figure 1 Sequence of interferograms in the case C1 (t=0) = 80 mg/ml (salt solution is injected at t=0), for times: a) 4 min, b) 23 min, c) 52 min, d) 1h28 min, e) 2h 31 min, f) 3h 30min.
function, (x being the horizontal direction) in order to have the interface heights h (x = 0) = h (x = L) and the minimum at x = L/2, (L being the total length of the interface). On the other hand, the interface gel-protein is considered planar.
Once protein and salt distributions are computed, the supersaturation field, σ, is evaluated; σ is defined as : σ = C1/S, where S is the local value of the solubility, that depends on the corresponding local salt concentration. Nucleation (formation of a new solid phase) occurs when σ > η , where the parameter η , named supersaturation limit, represents the threshold for nucleation in our model. Once nucleation has occurred, crystal growth proceeds if C1>S in the successive time step.
Further details on the mathematical model and the numerical method used to handle the nucleation process and further precipitation or resolution (according to the concentration distribution) are reported in (Lappa et al., 2002).
3. Results and discussion
The experiments are performed in the protein concentration range of 40-80 mg/ml. Typical observations are reported in Fig. 1 that shows a sequence of interferograms (versus time) for a value of initial protein concentration corresponding to 80 mg/ml.
Fringes represent sites of equal refractive index, n, that is dependent on both solute concentrations; therefore, fringes may represent salt concentration only where protein concentration could be assumed uniform, i.e. in absence of nucleation and growth. Initially, before the occurring of the nucleation, the protein is uniformly distributed inside the gel and the fringes appear at the gel interface as soon as salt solution is injected. Interferometric pattern is in agreement with the diffusion of salt inside the gel, forming regular horizontal fringes, until the nucleation takes places. Gradually, while the salt diffuses leading the system in supersaturation conditions, the occurring of nucleation produces local concentration changes (protein depletion) that affect the regular diffusive fringe pattern. The rectangles in Fig. 1 highlight the presence of a “nucleation front” that propagates through the gel. It is important to underline that crystals do not appear just at passage of the front: some time is needed before some crystals become visible within the sensibility of the CCD (about 10 µm). As the nucleation and growth, and therefore the depletion of the protein inside the gel, proceed the front becomes disturbed and no more regular.
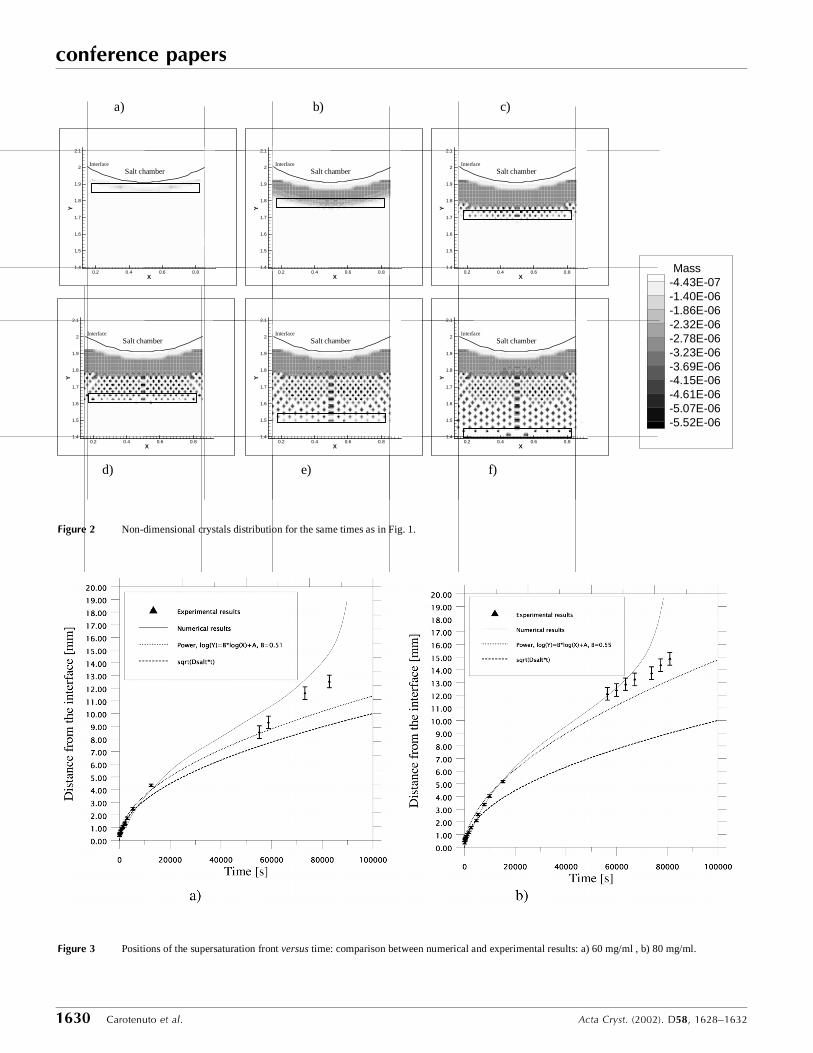
Numerical simulations are made for the same protein concentration as in the experiments. Fig. 2 shows a 2D crystal distribution for the same initial protein concentration of the above
conference papers
1630 Carotenuto et al. Acta Cryst. (2002). D58, 1628±1632
Figure 2 Non-dimensional crystals distribution for the same times as in Fig. 1.
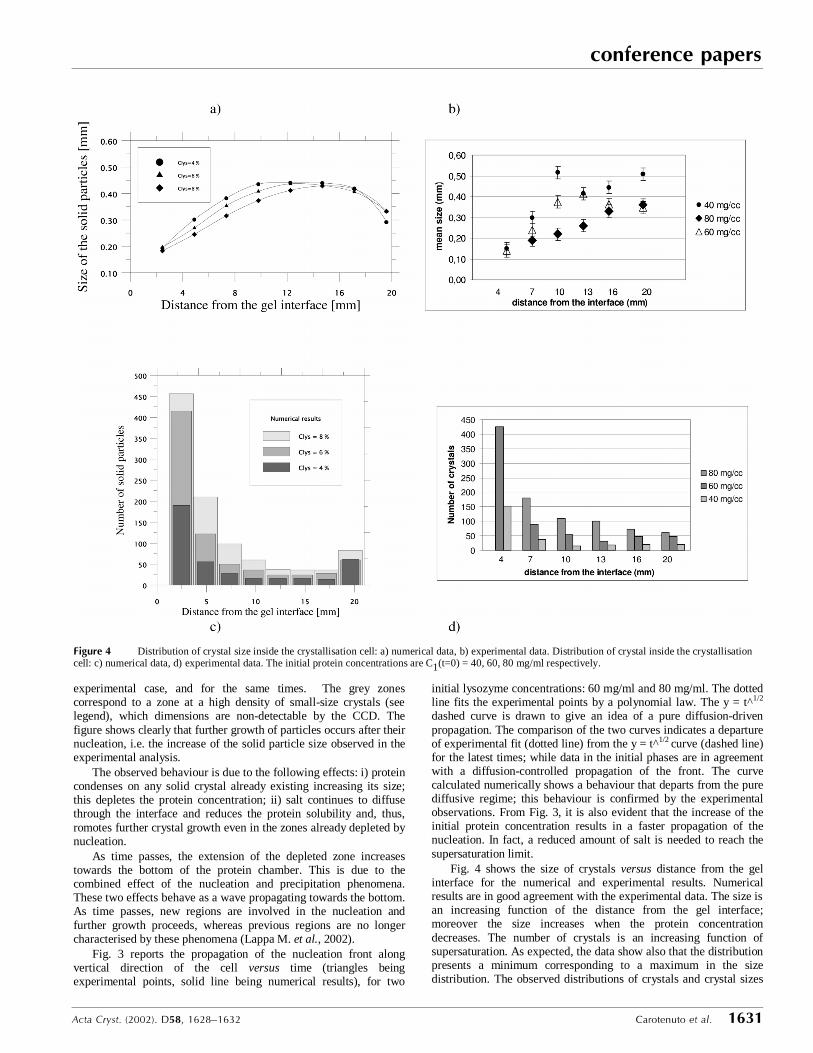
Figure 3 Positions of the supersaturation front versus time: comparison between numerical and experimental results: a) 60 mg/ml , b) 80 mg/ml.
Mass-4.43E-07-1.40E-06-1.86E-06-2.32E-06-2.78E-06-3.23E-06-3.69E-06-4.15E-06-4.61E-06-5.07E-06-5.52E-06
0.2 0.4 0.6 0.8X
1.4
1.5
1.6
1.7
1.8
1.9
2
2.1
Y
Salt chamberInterface
0.2 0.4 0.6 0.8X
1.4
1.5
1.6
1.7
1.8
1.9
2
2.1
Y
Salt chamberInterface
0.2 0.4 0.6 0.8X
1.4
1.5
1.6
1.7
1.8
1.9
2
2.1
Y
Salt chamberInterface
0.2 0.4 0.6 0.8X
1.4
1.5
1.6
1.7
1.8
1.9
2
2.1
Y
Salt chamberInterface
0.2 0.4 0.6 0.8X
1.4
1.5
1.6
1.7
1.8
1.9
2
2.1
Y
Salt chamberInterface
0.2 0.4 0.6 0.8X
1.4
1.5
1.6
1.7
1.8
1.9
2
2.1
Y
Salt chamberInterface
b) a) c)
e) d) f)
Acta Cryst. (2002). D58, 1628±1632 Carotenuto et al. 1631
conference papers
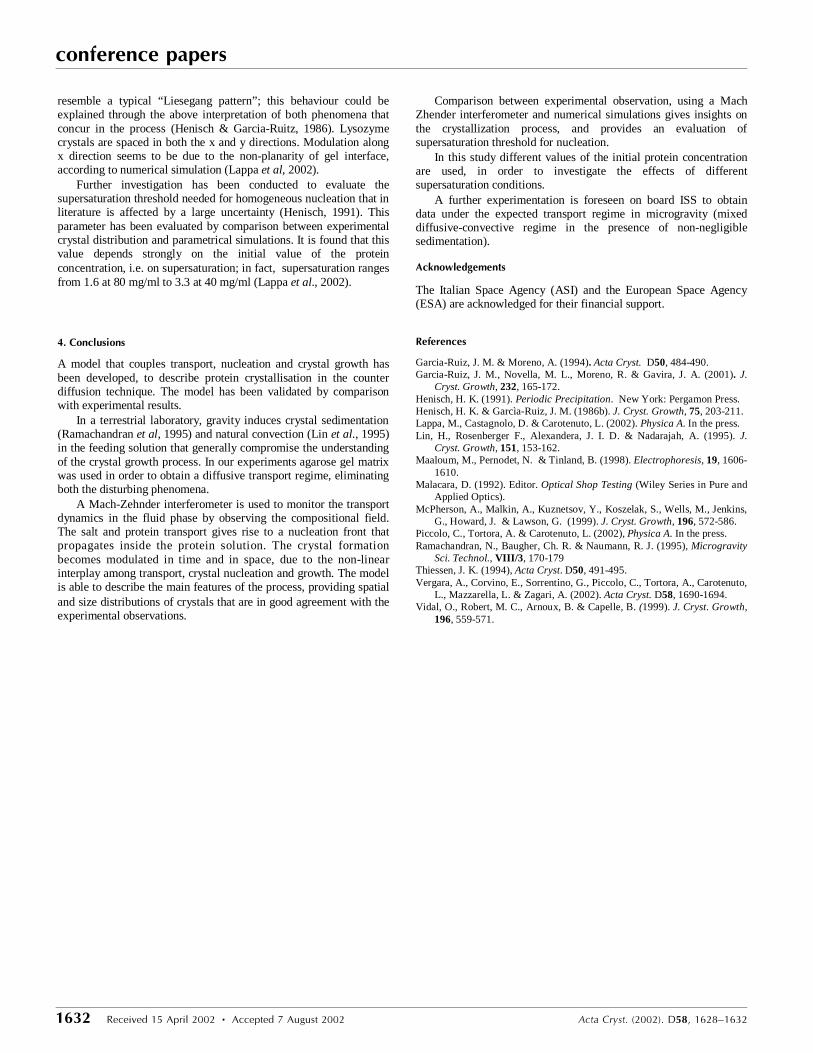
Figure 4 Distribution of crystal size inside the crystallisation cell: a) numerical data, b) experimental data. Distribution of crystal inside the crystallisation cell: c) numerical data, d) experimental data. The initial protein concentrations are C1(t=0) = 40, 60, 80 mg/ml respectively.
experimental case, and for the same times. The grey zones correspond to a zone at a high density of small-size crystals (see legend), which dimensions are non-detectable by the CCD. The figure shows clearly that further growth of particles occurs after their nucleation, i.e. the increase of the solid particle size observed in the experimental analysis.
The observed behaviour is due to the following effects: i) protein condenses on any solid crystal already existing increasing its size; this depletes the protein concentration; ii) salt continues to diffuse through the interface and reduces the protein solubility and, thus, romotes further crystal growth even in the zones already depleted by nucleation.
As time passes, the extension of the depleted zone increases towards the bottom of the protein chamber. This is due to the combined effect of the nucleation and precipitation phenomena. These two effects behave as a wave propagating towards the bottom. As time passes, new regions are involved in the nucleation and further growth proceeds, whereas previous regions are no longer characterised by these phenomena (Lappa M. et al., 2002).
Fig. 3 reports the propagation of the nucleation front along vertical direction of the cell versus time (triangles being experimental points, solid line being numerical results), for two
initial lysozyme concentrations: 60 mg/ml and 80 mg/ml. The dotted line fits the experimental points by a polynomial law. The y = t^1/2
dashed curve is drawn to give an idea of a pure diffusion-driven propagation. The comparison of the two curves indicates a departure of experimental fit (dotted line) from the y = t^1/2 curve (dashed line) for the latest times; while data in the initial phases are in agreement with a diffusion-controlled propagation of the front. The curve calculated numerically shows a behaviour that departs from the pure diffusive regime; this behaviour is confirmed by the experimental observations. From Fig. 3, it is also evident that the increase of the initial protein concentration results in a faster propagation of the nucleation. In fact, a reduced amount of salt is needed to reach the supersaturation limit.
Fig. 4 shows the size of crystals versus distance from the gel interface for the numerical and experimental results. Numerical results are in good agreement with the experimental data. The size is an increasing function of the distance from the gel interface; moreover the size increases when the protein concentration decreases. The number of crystals is an increasing function of supersaturation. As expected, the data show also that the distribution presents a minimum corresponding to a maximum in the size distribution. The observed distributions of crystals and crystal sizes
conference papers
1632 Received 15 April 2002 � Accepted 7 August 2002 Acta Cryst. (2002). D58, 1628±1632
resemble a typical “Liesegang pattern”; this behaviour could be explained through the above interpretation of both phenomena that concur in the process (Henisch & Garcia-Ruitz, 1986). Lysozyme crystals are spaced in both the x and y directions. Modulation along x direction seems to be due to the non-planarity of gel interface, according to numerical simulation (Lappa et al, 2002).
Further investigation has been conducted to evaluate the supersaturation threshold needed for homogeneous nucleation that in literature is affected by a large uncertainty (Henisch, 1991). This parameter has been evaluated by comparison between experimental crystal distribution and parametrical simulations. It is found that this value depends strongly on the initial value of the protein concentration, i.e. on supersaturation; in fact, supersaturation ranges from 1.6 at 80 mg/ml to 3.3 at 40 mg/ml (Lappa et al., 2002).
4. Conclusions
A model that couples transport, nucleation and crystal growth has been developed, to describe protein crystallisation in the counter diffusion technique. The model has been validated by comparison with experimental results.
In a terrestrial laboratory, gravity induces crystal sedimentation (Ramachandran et al, 1995) and natural convection (Lin et al., 1995) in the feeding solution that generally compromise the understanding of the crystal growth process. In our experiments agarose gel matrix was used in order to obtain a diffusive transport regime, eliminating both the disturbing phenomena.
A Mach-Zehnder interferometer is used to monitor the transport dynamics in the fluid phase by observing the compositional field. The salt and protein transport gives rise to a nucleation front that propagates inside the protein solution. The crystal formation becomes modulated in time and in space, due to the non-linear interplay among transport, crystal nucleation and growth. The model is able to describe the main features of the process, providing spatial and size distributions of crystals that are in good agreement with the experimental observations.
Comparison between experimental observation, using a Mach Zhender interferometer and numerical simulations gives insights on the crystallization process, and provides an evaluation of supersaturation threshold for nucleation.
In this study different values of the initial protein concentration are used, in order to investigate the effects of different supersaturation conditions.
A further experimentation is foreseen on board ISS to obtain data under the expected transport regime in microgravity (mixed diffusive-convective regime in the presence of non-negligible sedimentation).
Acknowledgements
The Italian Space Agency (ASI) and the European Space Agency (ESA) are acknowledged for their financial support. References
Garcia-Ruiz, J. M. & Moreno, A. (1994). Acta Cryst. D50, 484-490. Garcia-Ruiz, J. M., Novella, M. L., Moreno, R. & Gavira, J. A. (2001). J.
Cryst. Growth, 232, 165-172. Henisch, H. K. (1991). Periodic Precipitation. New York: Pergamon Press. Henisch, H. K. & Garcìa-Ruiz, J. M. (1986b). J. Cryst. Growth, 75, 203-211. Lappa, M., Castagnolo, D. & Carotenuto, L. (2002). Physica A. In the press. Lin, H., Rosenberger F., Alexandera, J. I. D. & Nadarajah, A. (1995). J.
Cryst. Growth, 151, 153-162. Maaloum, M., Pernodet, N. & Tinland, B. (1998). Electrophoresis, 19, 1606-
1610. Malacara, D. (1992). Editor. Optical Shop Testing (Wiley Series in Pure and
Applied Optics). McPherson, A., Malkin, A., Kuznetsov, Y., Koszelak, S., Wells, M., Jenkins,
G., Howard, J. & Lawson, G. (1999). J. Cryst. Growth, 196, 572-586. Piccolo, C., Tortora, A. & Carotenuto, L. (2002), Physica A. In the press. Ramachandran, N., Baugher, Ch. R. & Naumann, R. J. (1995), Microgravity
Sci. Technol., VIII/3 , 170-179 Thiessen, J. K. (1994), Acta Cryst. D50, 491-495. Vergara, A., Corvino, E., Sorrentino, G., Piccolo, C., Tortora, A., Carotenuto,
L., Mazzarella, L. & Zagari, A. (2002). Acta Cryst. D58, 1690-1694. Vidal, O., Robert, M. C., Arnoux, B. & Capelle, B. (1999). J. Cryst. Growth,
196, 559-571.


![arXiv:1611.04043v1 [physics.comp-ph] 12 Nov 20162 9.Octave INTRODUCTION TheePolyScat (ePS) suite, developed and released by Lucchese & co-workers(Gianturco et al. 1994)(Natalense and](https://img.pdfslide.us/doc/110x75/5f8306de64340e6c31069dfc/arxiv161104043v1-12-nov-2016-2-9octave-introduction-theepolyscat-eps-suite.jpg)