Embed Size (px)
Citation preview
Application Note
Conducting Gain Compression Measurements Utilizing Peak Power Sensors
Today’s communication air interface standards – for example 5G, CDMA, 802.11ax, 802.16, DOCSIS 3.x, DVB-T2, and ATSC 3 – incorporate complex communication signals such as high order QAM (512, 1024) and orthogonal frequency-division multiplexing (OFDM) to efficiently transmit information. Even today’s satellite communication systems have gone from quadrature phase shift keying (QPSK) signals to relatively complex multilevel (or higher-order) phase shift keying (8PSK) signals and their variants. The signal complexity increases when systems employ multiple carriers in comparison to a single carrier.
While complex communication signals can transmit information very efficiently, they exhibit large and random amplitude and power variations. For instance, an OFDM signal consists of tens to hundreds of carriers, with each having different phase and amplitude during any one symbol period depending on the modulation scheme they support. Since each carrier transmits symbols in synchronous with other carriers, instantaneous signal power from all the carriers can add constructively or destructively. Hence, power of a complex signal (such as OFDM signal) vary greatly. The commonly used term for describing the wide signal power variation of complex signals is peak to average power ratio (PAPR). Another commonly used term to describe the signal power variation is crest factor.
These complex signals are also not very tolerant to nonlinear distortion that inevitably occurs while they are processed by communication subsystems such as power amplifiers, frequency up/down-converters, etc. In order to minimize distortion, devices and subsystems have to be operated close to the linear region. This implies that devices have to be operated at much lower average output power levels to minimize nonlinear effects at peaks of complex signals. To minimize the impact on the design and production of today’s communication systems, it is imperative that robust measurement methods be used to help characterize and quantify the effect these nonlinearities will have on complex signals. These methods would go a long way in identifying the highest possible average output power levels at acceptable levels of distortion due to nonlinearity.
2
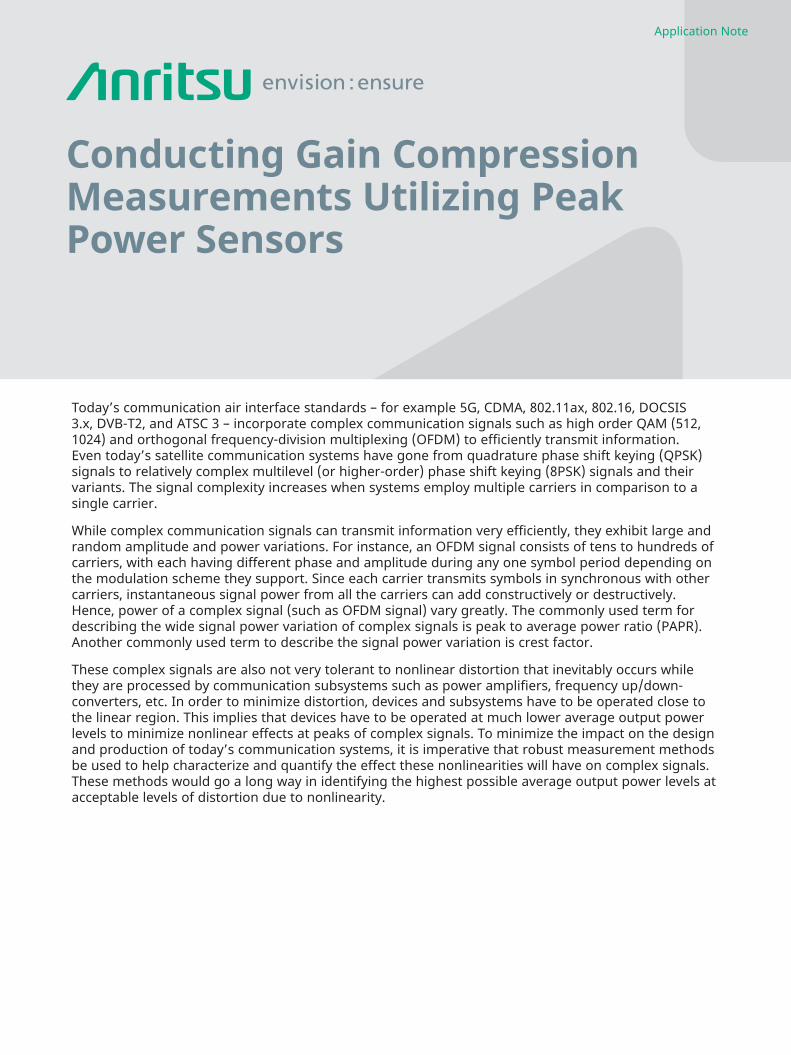
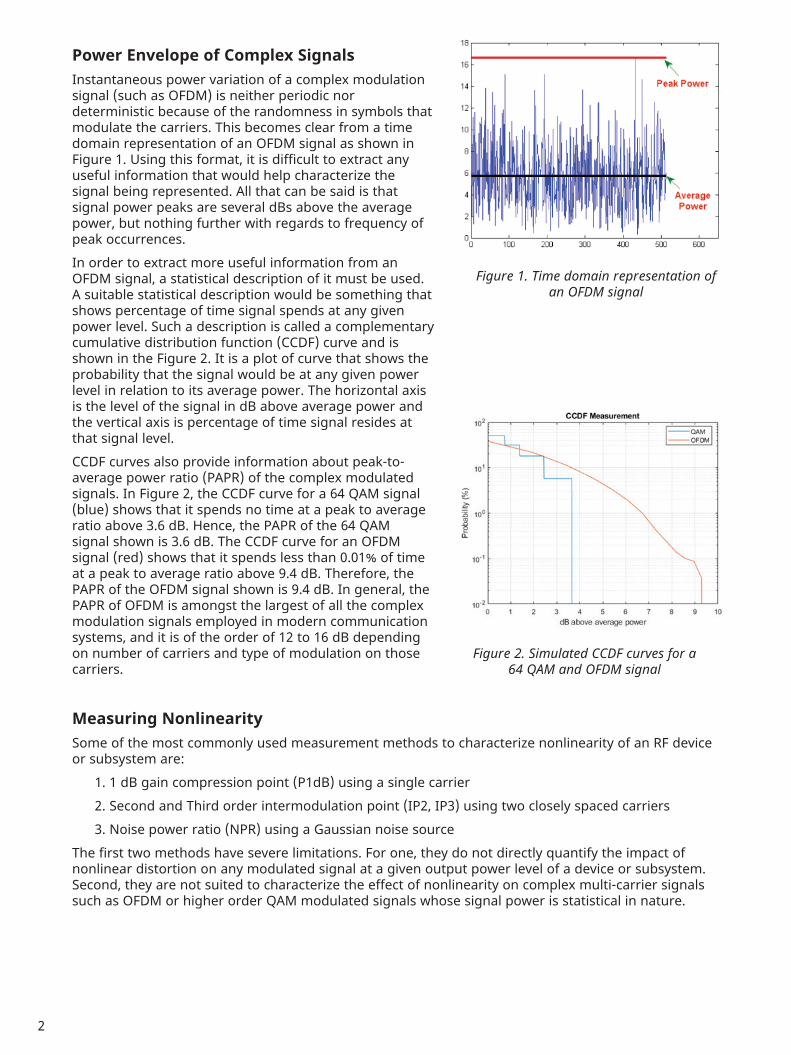
Power Envelope of Complex SignalsInstantaneous power variation of a complex modulation signal (such as OFDM) is neither periodic nor deterministic because of the randomness in symbols that modulate the carriers. This becomes clear from a time domain representation of an OFDM signal as shown in Figure 1. Using this format, it is difficult to extract any useful information that would help characterize the signal being represented. All that can be said is that signal power peaks are several dBs above the average power, but nothing further with regards to frequency of peak occurrences. In order to extract more useful information from an OFDM signal, a statistical description of it must be used. A suitable statistical description would be something that shows percentage of time signal spends at any given power level. Such a description is called a complementary cumulative distribution function (CCDF) curve and is shown in the Figure 2. It is a plot of curve that shows the probability that the signal would be at any given power level in relation to its average power. The horizontal axis is the level of the signal in dB above average power and the vertical axis is percentage of time signal resides at that signal level. CCDF curves also provide information about peak-to- average power ratio (PAPR) of the complex modulated signals. In Figure 2, the CCDF curve for a 64 QAM signal (blue) shows that it spends no time at a peak to average ratio above 3.6 dB. Hence, the PAPR of the 64 QAM signal shown is 3.6 dB. The CCDF curve for an OFDM signal (red) shows that it spends less than 0.01% of time at a peak to average ratio above 9.4 dB. Therefore, the PAPR of the OFDM signal shown is 9.4 dB. In general, the PAPR of OFDM is amongst the largest of all the complex modulation signals employed in modern communication systems, and it is of the order of 12 to 16 dB depending on number of carriers and type of modulation on those carriers.
Measuring NonlinearitySome of the most commonly used measurement methods to characterize nonlinearity of an RF device or subsystem are:
1. 1 dB gain compression point (P1dB) using a single carrier2. Second and Third order intermodulation point (IP2, IP3) using two closely spaced carriers3. Noise power ratio (NPR) using a Gaussian noise source
The first two methods have severe limitations. For one, they do not directly quantify the impact of nonlinear distortion on any modulated signal at a given output power level of a device or subsystem. Second, they are not suited to characterize the effect of nonlinearity on complex multi-carrier signals such as OFDM or higher order QAM modulated signals whose signal power is statistical in nature.
Figure 1. Time domain representation of an OFDM signal
Figure 2. Simulated CCDF curves for a 64 QAM and OFDM signal
3
The noise power ratio method overcomes these limitations by simulating a multicarrier with a band-limited Gaussian noise signal. This method has been in existence for a long time and was predominantly used to measure nonlinear distortions in frequency-division multiple access (FDMA) systems. A notch is placed at the center of the band-limited Gaussian noise signal and the signal is applied at the input of the device under measurement. The intermodulation products caused due to nonlinearity in the device under measurement fill up the notch when measured at the output of the device. The ratio of noise power outside the notch to that within is an indirect indication of the nonlinearity impact on a multicarrier signal. However, the NPR measurement is limited by two factors. First, the depth of the notch in the center of the band-limited Gaussian signal itself becomes a hard measurement limit. Second is the possibility of the notch being filled up by intermodulation products generated by the measuring device, such as a spectrum analyzer. A spectrum analyzer’s mixer and IF amplifiers can generate intermodulation products and add to the fill within the notch. An NPR measurement setup requires an expensive spectrum analyzer. The placement of a high-quality notch at the center of the band-limited Gaussian signal requires a vector signal generator, which is another very expensive piece of equipment. An alternative method to characterizing the impact of device nonlinearity on complex signals is to establish 1 dB compression point (P1dB) by measuring and comparing the CCDF curve of a band-limited Gaussian noise signal power at the input and output of the device under test (DUT) simultaneously. A band-limited Gaussian noise signal has very similar characteristics to a complex multicarrier signal, such as OFDM or high-order QAM. The band-limited Gaussian signal can simply be pulse modulated to facilitate measurement by a pulse or peak power sensor, such as the Anritsu MA244xxA peak power sensor. Alternatively, it can use amplitude or I/Q modulation on a carrier at a desired frequency of characterization. This method establishes the P1dB point using a signal with PAPR similar to the ones used in today’s communication systems rather than a pure unmodulated carrier signal.
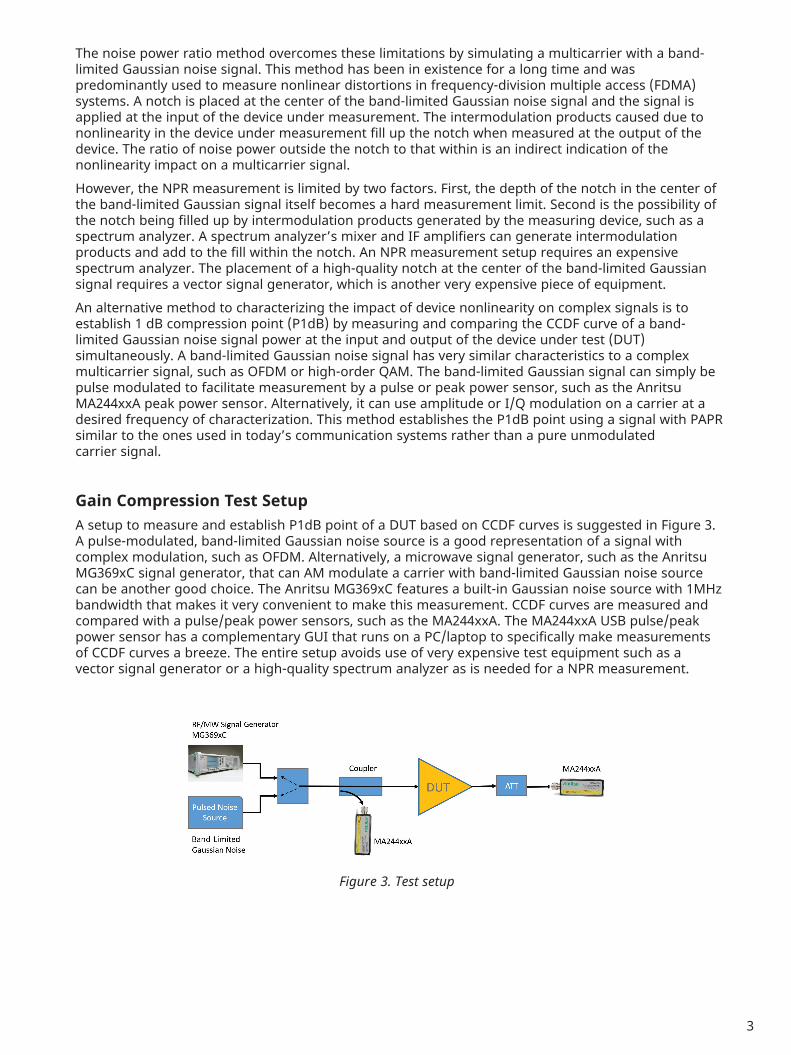
Gain Compression Test SetupA setup to measure and establish P1dB point of a DUT based on CCDF curves is suggested in Figure 3. A pulse-modulated, band-limited Gaussian noise source is a good representation of a signal with complex modulation, such as OFDM. Alternatively, a microwave signal generator, such as the Anritsu MG369xC signal generator, that can AM modulate a carrier with band-limited Gaussian noise source can be another good choice. The Anritsu MG369xC features a built-in Gaussian noise source with 1MHz bandwidth that makes it very convenient to make this measurement. CCDF curves are measured and compared with a pulse/peak power sensors, such as the MA244xxA. The MA244xxA USB pulse/peak power sensor has a complementary GUI that runs on a PC/laptop to specifically make measurements of CCDF curves a breeze. The entire setup avoids use of very expensive test equipment such as a vector signal generator or a high-quality spectrum analyzer as is needed for a NPR measurement.
Figure 3. Test setup
4
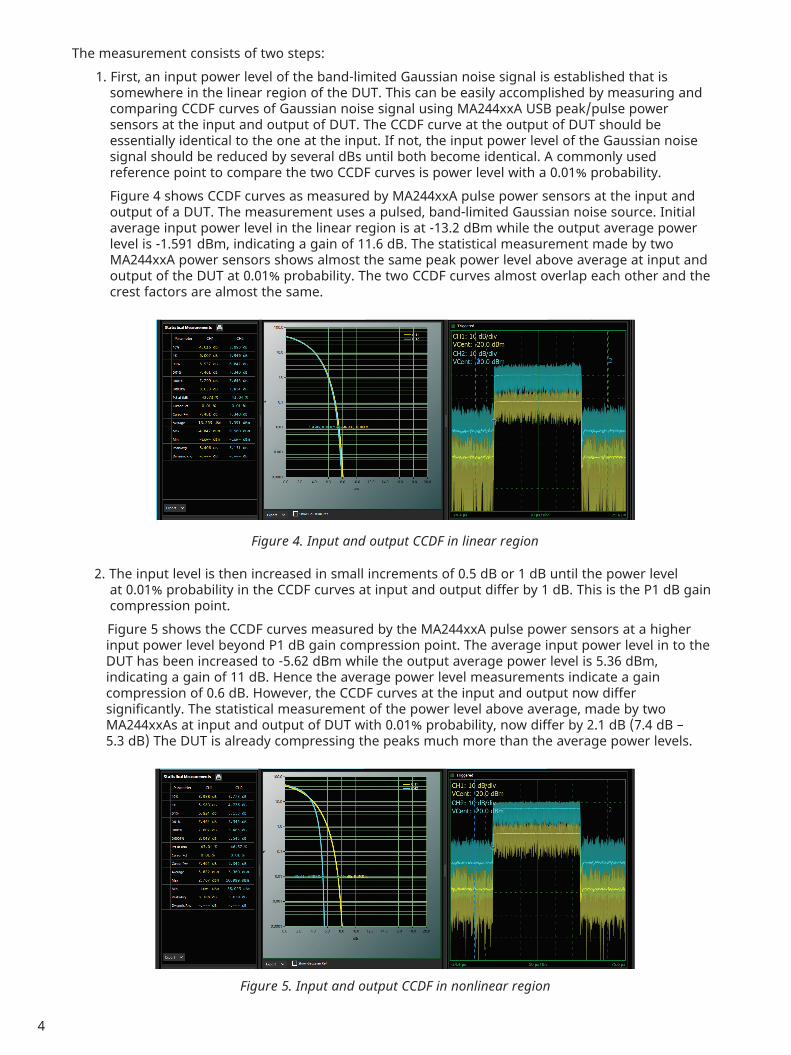
The measurement consists of two steps:1. First, an input power level of the band-limited Gaussian noise signal is established that is
somewhere in the linear region of the DUT. This can be easily accomplished by measuring and comparing CCDF curves of Gaussian noise signal using MA244xxA USB peak/pulse power sensors at the input and output of DUT. The CCDF curve at the output of DUT should be essentially identical to the one at the input. If not, the input power level of the Gaussian noise signal should be reduced by several dBs until both become identical. A commonly used reference point to compare the two CCDF curves is power level with a 0.01% probability. Figure 4 shows CCDF curves as measured by MA244xxA pulse power sensors at the input and output of a DUT. The measurement uses a pulsed, band-limited Gaussian noise source. Initial average input power level in the linear region is at -13.2 dBm while the output average power level is -1.591 dBm, indicating a gain of 11.6 dB. The statistical measurement made by two MA244xxA power sensors shows almost the same peak power level above average at input and output of the DUT at 0.01% probability. The two CCDF curves almost overlap each other and the crest factors are almost the same.
2. The input level is then increased in small increments of 0.5 dB or 1 dB until the power level at 0.01% probability in the CCDF curves at input and output differ by 1 dB. This is the P1 dB gain compression point. Figure 5 shows the CCDF curves measured by the MA244xxA pulse power sensors at a higher input power level beyond P1 dB gain compression point. The average input power level in to the DUT has been increased to -5.62 dBm while the output average power level is 5.36 dBm, indicating a gain of 11 dB. Hence the average power level measurements indicate a gain compression of 0.6 dB. However, the CCDF curves at the input and output now differ significantly. The statistical measurement of the power level above average, made by two MA244xxAs at input and output of DUT with 0.01% probability, now differ by 2.1 dB (7.4 dB – 5.3 dB) The DUT is already compressing the peaks much more than the average power levels.
Figure 4. Input and output CCDF in linear region
Figure 5. Input and output CCDF in nonlinear region
5
ConclusionThe CCDF curves approach to measuring a P1 dB compression point has significant advantages when compared to more traditional methods:
1. The CCDF measurement method uses signals with similar characteristics to the ones used in today’s communication systems. In contrast, traditional methods use single- and two-tone signals, which are not good representations of signals with complex modulation such as OFDM.
2. The CCDF approach utilizes low-cost noise sources and wideband USB peak power sensors. Measurement setups for other traditional approaches require expensive test equipment, such as spectrum analyzers or vector signal generators, which can be many multiples of the price of a USB sensor.
3. USB power sensors are much more accurate in making power measurement than spectrum analyzer.
In summary, the CCDF approach provides a more accurate measurement using signals that are similar to those used in today’s communication systems, all at a lower cost.

11410-01199 Rev. A Printed in United States 2020-06©2020 Anritsu Company. All Rights Reserved.
® Anritsu All trademarks are registered trademarks of their respective companies. Data subject to change without notice. For the most recent specifications visit: www.anritsu.com
• United States Anritsu Company450 Century Parkway, Suite 190, Allen, TX 75013 U.S.A. Phone: +1-800-Anritsu (1-800-267-4878)• Canada Anritsu Electronics Ltd.700 Silver Seven Road, Suite 120, Kanata, Ontario K2V 1C3, Canada Phone: +1-613-591-2003 Fax: +1-613-591-1006• Brazil Anritsu Electrônica Ltda.Praça Amadeu Amaral, 27 - 1 Andar 01327-010 - Bela Vista - Sao Paulo - SP - Brazil Phone: +55-11-3283-2511 Fax: +55-11-3288-6940• Mexico Anritsu Company, S.A. de C.V.Blvd Miguel de Cervantes Saavedra #169 Piso 1, Col. Granada Mexico, Ciudad de Mexico, 11520, MEXICO Phone: +52-55-4169-7104• United Kingdom Anritsu EMEA Ltd.200 Capability Green, Luton, Bedfordshire LU1 3LU, U.K. Phone: +44-1582-433200 Fax: +44-1582-731303• France Anritsu S.A.12 avenue du Québec, Batiment Iris 1-Silic 612, 91140 VILLEBON-SUR-YETTE, France Phone: +33-1-60-92-15-50 Fax: +33-1-64-46-10-65• Germany Anritsu GmbHNemetschek Haus, Konrad-Zuse-Platz 1 81829 München, Germany Phone: +49-89-442308-0 Fax: +49-89-442308-55• Italy Anritsu S.r.l.Via Elio Vittorini 129, 00144 Roma Italy Phone: +39-06-509-9711 Fax: +39-6-502-2425
• Sweden Anritsu ABIsafjordsgatan 32C, 164 40 KISTA, Sweden Phone: +46-8-534-707-00• Finland Anritsu ABTeknobulevardi 3-5, FI-01530 VANTAA, Finland Phone: +358-20-741-8100 Fax: +358-20-741-8111• Denmark Anritsu A/Sc/o Regus Winghouse, Ørestads Boulevard 73, 4th floor, 2300 Copenhagen S, Denmark Phone: +45-7211-2200• Russia Anritsu EMEA Ltd. Representation Office in RussiaTverskaya str. 16/2, bld. 1, 7th floor. Moscow, 125009, Russia Phone: +7-495-363-1694 Fax: +7-495-935-8962• Spain Anritsu EMEA Ltd. Representation Office in SpainPaseo de la Castellana, 141. Planta 5, Edificio Cuzco IV 28046, Madrid, Spain Phone: +34-91-572-6761• United Arab Emirates Anritsu EMEA Ltd. Dubai Liaison Office902, Aurora Tower, P O Box: 500311- Dubai Internet City Dubai, United Arab Emirates Phone: +971-4-3758479 Fax: +971-4-4249036• India Anritsu India Pvt Ltd.6th Floor, Indiqube ETA, No.38/4, Adjacent to EMC2, Doddanekundi, Outer Ring Road, Bengaluru – 560048, India Phone: +91-80-6728-1300 Fax: +91-80-6728-1301• Singapore Anritsu Pte. Ltd.11 Chang Charn Road, #04-01, Shriro House Singapore 159640 Phone: +65-6282-2400 Fax: +65-6282-2533
• Vietnam Anritsu Company LimitedRoom No. 1635, 16th Floor, ICON 4 Tower, 243A De La Thanh Street, Lang Thuong Ward, Dong Da District, Hanoi, Vietnam Phone: +84-24-3760-6216 Fax: +84-24-6266-2608• P. R. China (Shanghai) Anritsu (China) Co., Ltd.Room 2701-2705, Tower A, New Caohejing International Business Center No. 391 Gui Ping Road Shanghai, 200233, P.R. China Phone: +86-21-6237-0898 Fax: +86-21-6237-0899• P. R. China (Hong Kong) Anritsu Company Ltd.Unit 1006-7, 10/F., Greenfield Tower, Concordia Plaza, No. 1 Science Museum Road, Tsim Sha Tsui East, Kowloon, Hong Kong, P. R. China Phone: +852-2301-4980 Fax: +852-2301-3545• Japan Anritsu Corporation8-5, Tamura-cho, Atsugi-shi, Kanagawa, 243-0016 Japan Phone: +81-46-296-6509 Fax: +81-46-225-8352• Korea Anritsu Corporation, Ltd.5FL, 235 Pangyoyeok-ro, Bundang-gu, Seongnam-si, Gyeonggi-do, 13494 Korea Phone: +82-31-696-7750 Fax: +82-31-696-7751• Australia Anritsu Pty Ltd.Unit 20, 21-35 Ricketts Road, Mount Waverley, Victoria 3149, Australia Phone: +61-3-9558-8177 Fax: +61-3-9558-8255• Taiwan Anritsu Company Inc.7F, No. 316, Sec. 1, NeiHu Rd., Taipei 114, Taiwan Phone: +886-2-8751-1816 Fax: +886-2-8751-1817
Specifications are subject to change without notice.


![Repeatability and reproducibility of compression strength ......ASTM International standard test method E9, [2] first established in 1924, is a con sensus standard for conducting](https://img.pdfslide.us/doc/110x75/6129edc123d782008d486766/repeatability-and-reproducibility-of-compression-strength-astm-international.jpg)