Embed Size (px)
Citation preview

BRAYTON CYCLE(THE IDEAL CYCLE FOR GAS-TURBINE ENGINES)
1

OPEN-CYCLE GAS-TURBINE ENGINE2
❑ First proposed by George Brayton.
❑ Currently used for Gas turbines.
❑ Gas turbine:
✓ Internal combustion engine.
✓ Uses liquid fuel or gas.
❑ Gas turbines operate on an open cycle.

OPEN-CYCLE GAS-TURBINE ENGINE3
1-2 : Fresh air is compressed to hightemperature and pressure.
2-3: High-pressure air proceeds intothe combustion chamber, wherethe fuel is burned at constantpressure.
3-4: Combustion products enter theturbine for producing power.
The exhaust gases leaving the turbine arethrown out

BRAYTON CYCLE4
✓ The open gas-turbine cycle can bemodeled as a closed cycle, byutilizing the air-standardassumptions.
✓ Compression & expansion processesremain the same.
✓ combustion process is replaced by aconstant-pressure heat-additionprocess from an external source.
✓ exhaust process is replaced by aconstant-pressure heat-rejectionprocess to the ambient air.

P-V DIAGRAM FOR BRAYTON CYCLE5
Brayton cycle is made up
of four reversible processes:
✓ 1-2 Isentropic compression
✓ 2-3 Constant-pressure heat addition
✓ 3-4 Isentropic expansion
✓ 4-1 Constant-pressure heat rejection

T-S DIAGRAM FOR BRAYTON CYCLE6
Brayton cycle is made up
of four reversible processes:
✓ 1-2 Isentropic compression
✓ 2-3 Constant-pressure heat addition
✓ 3-4 Isentropic expansion
✓ 4-1 Constant-pressure heat rejection

THERMAL EFFICIENCY OF BRAYTON CYCLE7
���� = ��(�4 � �1) and ��� = �� �3 � �2
��ℎ =�
���
���
= 1 �����
���
= 1 ���−�
�
��−�
�
= 1 ���(�
�/�
�−�)
��(�
�/�
�−�)
❑ Processes 1-2 and 3-4 are isentropic, and P2 = P3 and P4 = P1.
❑����
=��
��
γ−�/γ=
��
��
γ−�/γ=
����
❑ ��� = � ��
��(���)/� where rP=pressure ratio = P2/P1

EFFECT OF PRESSURE RATIO8
✓ The highest temperature in the cycle
occurs at the end of the combustion
process (state 3), and it is limited by
the maximum temperature that the
turbine blades can withstand.
✓ This also limits the pressure ratios
that can be used in cycle.

9
EFFECT OF PRESSURE RATIO
✓ For a fixed turbine inlet temperature T3,
the net work output per cycle increases
with the pressure ratio, reaches a
maximum, and then starts to decrease.
✓ There should be a compromise
between the pressure ratio (thus the
thermal efficiency) and the
net work output.
✓ In most common designs, the pressure
ratio of gas turbines ranges from about
11-16.

1
JOULE-THOMSON EXPANSION
Lecture No. 32/33

JOULE-THOMSON EXPANSION
2

Throttling valves 3
❑ Throttling valves are any kind of flow-restricting devices that cause a
significant pressure drop in the fluid.
❑ Some familiar examples are :

Joule Thomson effect4
❑ Unlike turbines, they produce a pressure drop without involving any work.
❑ The pressure drop in the fluid is often accompanied by a large drop in
temperature, and for that reason throttling devices are commonly used in
refrigeration and air-conditioning applications.
❑ The magnitude of the temperature drop (or, sometimes, the temperature
rise) during a throttling process is governed by a property called the Joule
Thomson coefficient.

Joule Thomson effect5
❑ Throttling valves are usually small devices, and the flow through them may
be assumed to be adiabatic (q ≈ 0) since there is neither sufficient time nor
large enough area for any effective heat transfer to take place.
❑ Also, there is no work done (w = 0), and the change in potential energy, if
any, is very small.
❑ Even though the exit velocity is often considerably higher than the inlet
velocity, in many cases, the increase in kinetic energy is insignificant.
❑ Then the conservation of energy equation for this single-stream steady-flow
device reduces to (See Equation 12 of Lecture 9):
hi = hout
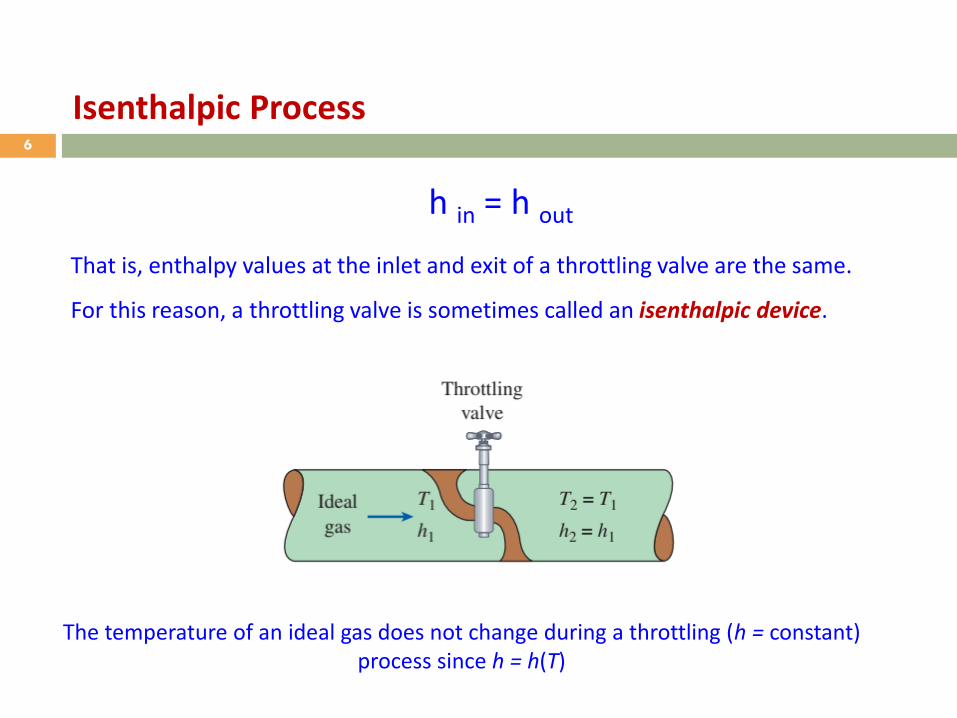
Isenthalpic Process6
h in = h out
That is, enthalpy values at the inlet and exit of a throttling valve are the same.
For this reason, a throttling valve is sometimes called an isenthalpic device.
The temperature of an ideal gas does not change during a throttling (h = constant) process since h = h(T)

Joule-Thomson coefficient7
❑ Temperature of the fluid may remain unchanged, or it may even increase or
decrease during a throttling process.
❑ The temperature behavior of a fluid during a throttling (h = constant)
process is described by the Joule-Thomson coefficient, defined as:
𝜇 =𝜕𝑇
𝜕𝑃ℎ

Joule-Thomson coefficient8
❑ Thus the Joule-Thomson coefficient is a measure of the change in
temperature with pressure during a constant-enthalpy process.
❑ If
< 0 Temperature increases
µJT = 0 Temperature remains constant
> 0 Temperature decreases
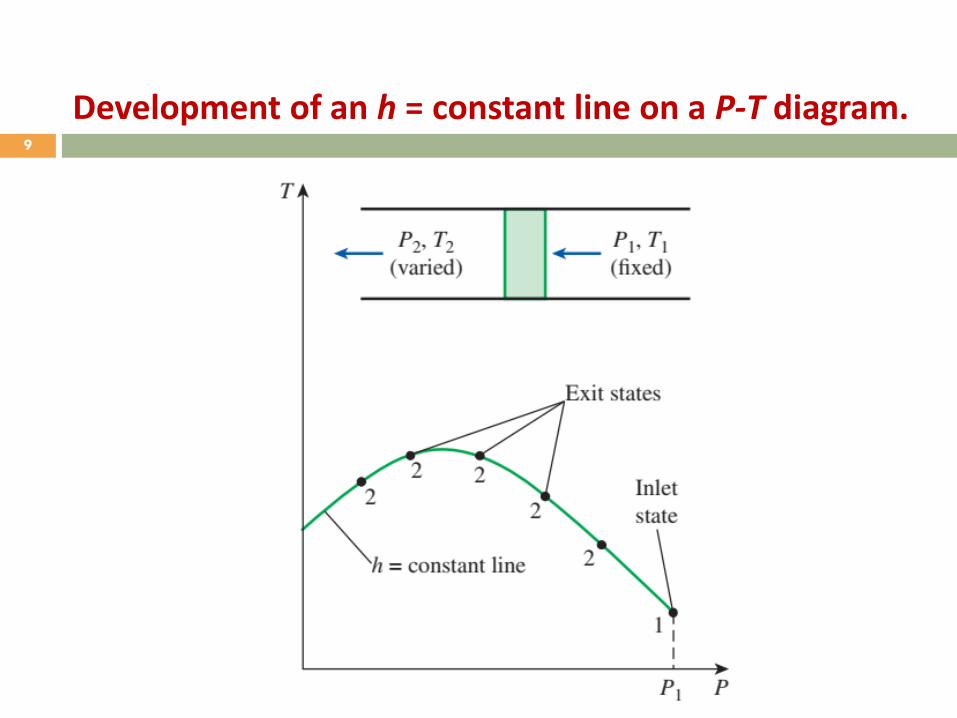
Development of an h = constant line on a P-T diagram. 9
10
❑ A careful look at its defining equation reveals that the Joule-Thomson
coefficient represents the slope of h = constant lines on a T-P diagram.
❑ Such diagrams can be easily constructed from temperature and pressure
measurements alone during throttling processes.
❑ A fluid at a fixed temperature and pressure T1 and P1 (thus fixed enthalpy) is
forced to flow through a porous plug, and its temperature and pressure
downstream (T2 and P2) are measured.
❑ The experiment is repeated for different sizes of porous plugs, each giving a
different set of T2 and P2. Plotting the temperatures against the pressures
gives us an h = constant line on a T-P diagram.
Development of an h = constant line on a P-T diagram.
11
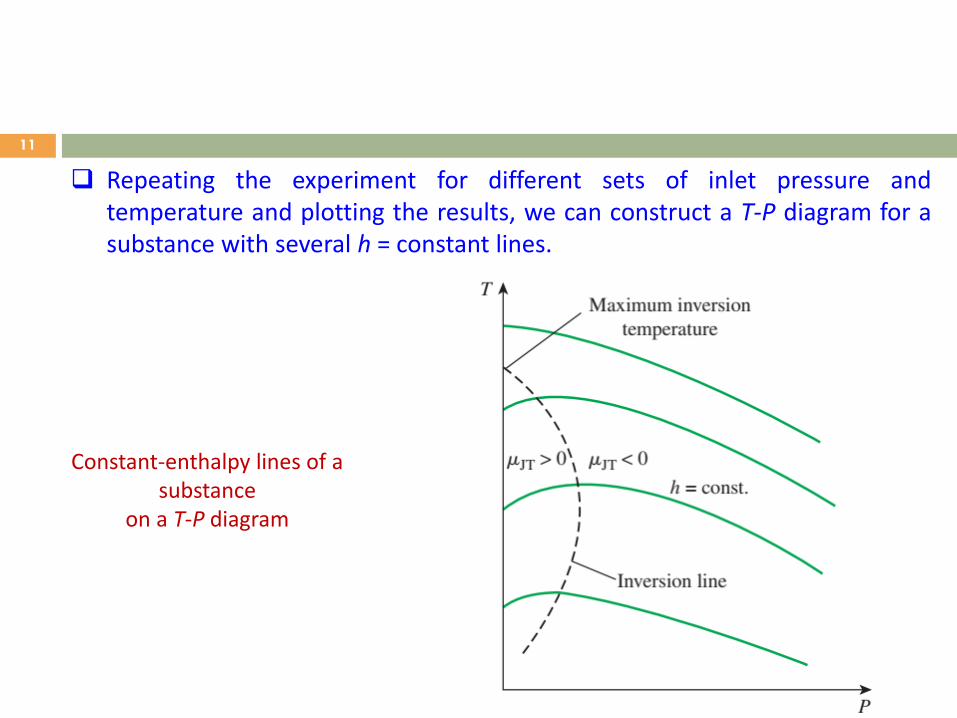
❑ Repeating the experiment for different sets of inlet pressure andtemperature and plotting the results, we can construct a T-P diagram for asubstance with several h = constant lines.
Constant-enthalpy lines of a substance
on a T-P diagram

12
❑ Some constant-enthalpy lines on the T-P diagram pass through a point of
zero slope.
❑ The line that passes through these points is called the inversion line, and the
temperature at a point where a constant-enthalpy line intersects the
inversion line is called the inversion temperature.
❑ The temperature at the intersection of the P = 0 line (ordinate) and the
upper part of the inversion line is called the maximum inversion
temperature.
❑ The slopes of the h = constant lines are negative (µJT < 0) at states to the
right of the inversion line and positive (µJT > 0) to the left of the inversion
line.

13
❑ A throttling process proceeds along a constant-enthalpy line in the direction
of decreasing pressure, that is, from right to left.
❑ Therefore, the temperature of a fluid increases during a throttling process
that takes place on the right-hand side of the inversion line.
❑ However, the fluid temperature decreases during a throttling process that
takes place on the left-hand side of the inversion line.
❑ It is clear from this diagram that a cooling effect cannot be achieved by
throttling unless the fluid is below its maximum inversion temperature.
❑ This presents a problem for substances whose maximum inversion
temperature is well below room temperature.

14
❑ The decrease in temperature as the pressure drops corresponds to a
decrease in molecular kinetic energy, the molecular potential energy must
be increasing or else energy conservation would be violated. We can say the
molecules are more stable when they are closer together at the higher
pressure and, consequently, that attractive forces are dominant in this
region. The temperature will increase as pressure decreases, indicating that
repulsive forces dominate the behavior in this region.
❑ These two regions are separated by the inversion line, where the slope of T
vs. P is zero and where attractive and repulsive interactions exactly balance.
❑ For a given pressure, the temperature at which these interactions balance is
known as the Boyle temperature.

15
❑ Joule-Thomson expansion can be used to liquefy gases if it is performed in
the region where µJT > 0 to the left of the inversion line.
❑ Liquefaction is an important process industrially (e.g. liquid nitrogen and
helium).
Liquefaction

16
(a) Basic liquefaction process using Joule–Thomson expansion(b) Linde process

17
❑ The gas is first compressed from state 1 to 2 to increase its pressure.
However, during compression, the temperature of the gas also rises. It is
then cooled from state 2 to state 3 to lower its temperature.
❑ These two processes are intended to bring it to the left region of inversion
curve and to put it in a state where a throttling process will bring it into the
two phase region.
❑ It now goes through an isenthalpic Joule-Thomson expansion, from state 3
to state 4, where the temperature drops low enough to lead to
condensation.
❑ The vapor and liquid streams at states 5 and 6, respectively, are then
separated.
Liquefaction
18
❑ An improvement to the liquefaction process is shown in Figure b. In this
process, an additional heat exchanger is employed to recover the energy
from the non-condensed gas. This gas is then recycled. The process depicted
in Figure b is known as the Linde process.
Liquefaction

19
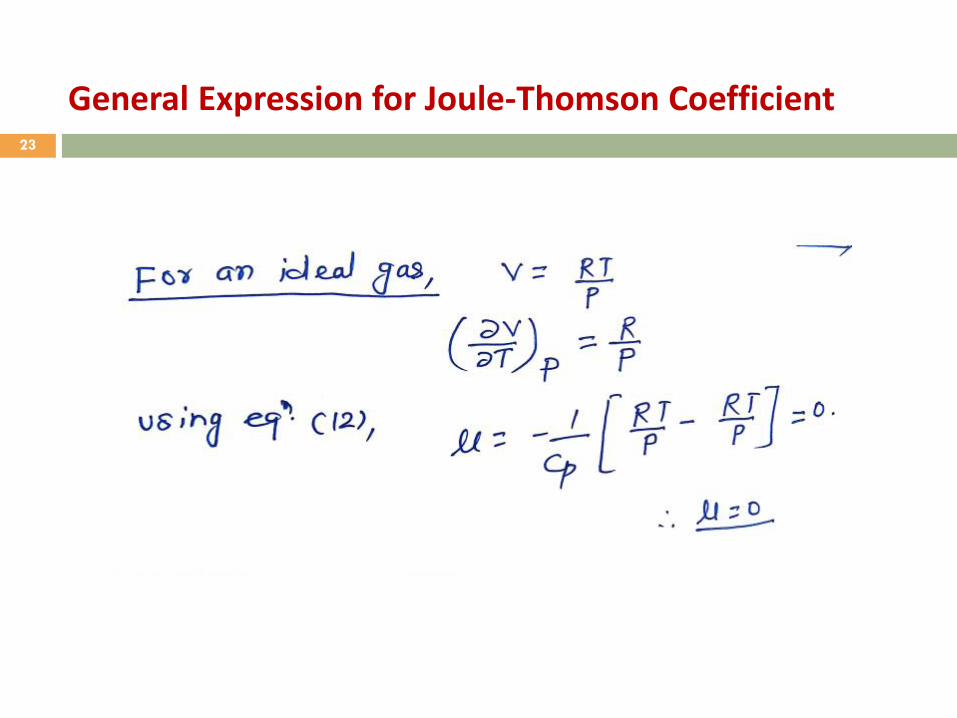
General Expression for Joule-Thomson Coefficient

20
General Expression for Joule-Thomson Coefficient

21
General Expression for Joule-Thomson Coefficient

22
General Expression for Joule-Thomson Coefficient
23
General Expression for Joule-Thomson Coefficient

24
THANK YOU