Embed Size (px)
Citation preview

Experimental section
Materials
All chemicals were purchased from Guoyao Chemical Reagent Co. Ltd, Shanghai,
which were used without further purification. PG and NG was synthesized according
to the previous report S1. TBIB was synthesized according to our previous report.s2
Characterization
Proton nuclear magnetic resonance (1H NMR) spectra were measured on a Bruker
AM-400 spectrometer at room temperature with tetramethylsilane (TMS) as the
reference. Scanning electron microscope (SEM) images were attained by a Zeiss
scanning electron microscope. The samples for SEM detection were dropped in the
silicon pellet, dried and then sprayed by the gold. Transmission electron microscope
(TEM) were measured on a JEM-100CX II electron microscope. The samples for
TEM detection were dropped in the copper grid and air-dried. X-ray diffraction (XRD)
patterns were collected on a German Bruker/D8 Advanced diffractometer with Cu Kα
radiation (λ= 0.15406 nm, voltage 40 KV, current 40 mA). The samples were casted
onto cover glasses (18 mm × 18 mm) and dried to form thin film. AFM testing was
conducted with a Veeco Nanoscope Multimode Ш SPM and operated in tapping
contact mode at ambient temperature. The AFM sample was dropped on the mica
wafer and dried. Rheological properties were measured by a Thermo Haake RS6000
rheometer with cone and plate geometry (35 mm diameter, 0.105 mm cone gap). The
frequency spectra were conducted in the linear viscoelastic regime of the samples
determined from dynamic strain sweep measurements at 25 oC. CD and CPL were
collected with an Applied Photophysics ChirascanV100 model. FT-IR was
characterized on a Bruker ALPHA model, and KBr was used as the disperse media.
Sample preparation
PG, NG and TBIB were respectively dissolved in DMSO as concentrated stock
solutions (100 mM). In order to trigger the coassembly, a certain amount of stock
solutions was mixed together, followed by the addition of DI water. Taking the
preparation of PG/TBIB coassembly as an example. PG and TBIB were dissolved in
DMSO(1 mL) separately to obtain the stock solutions (100 mM). Then, PG stock
Electronic Supplementary Material (ESI) for Journal of Materials Chemistry C.This journal is © The Royal Society of Chemistry 2020

solution (30 μL)and TBIB stock solution (10 μL) were taken out by pipettes into a 1
mL vial, followed by gentle shaking to mix homogeneously. DI water (960 μL) was
added by a pipette into the stock solution mixture.The vial was sealed by a cap and
parafilm, and slightly shaken to make a homogenous phase(PG: TBIB = 3mM:1mM).
An aging period at least for 8 h at room temperature was applied. Dried samples for
FT-IR tests were prepared by centrifuging assemblies (5000 rpm, 10 mins), followed
by air-drying. XRD samples were obtained by drying centrifuged samples on glass
slides.
Computational Methods
Structural Parameterization for EGCG
The geometric structure of NG, PG and TBIB were built from the GaussView06
program. [S3] The configuration optimization of three molecules were performed by
Hartree-Fork method [S4, S5] at the B3LYP/6-31G*(d) basis by employing
Gaussian16 program. [S6] Then the electrostatic potential (ESP) was can be obtained
at the same parameters correspondingly. To acquire the topology files, the
Antechamber program in the Amber-Tools package was used to fit the restrained
electrostatic potential (RESP) charge [S7, S8], and then the Generalized Amber Force
Field (GAFF) was adopted to parameterized for bonded interaction of EGCG
molecule for subsequent MD simulations.
Design of system model
To elaborate the effect of self-assembly mechanism, two systematic models of
NG-TBIB and PG-TBIB were set up for the study with various molar ratios of NG/PG
to TBIB, which were 3:1. As shown in Scheme S1, for the initial coordinate of each
system, the pre-assembled 15TBIB-45NG and 15TBIB-45PG were respectively
immersed in the centre of suitable simulation box filled with TIP3P water, of which
the minimal distance from the solute to the box wall was 1.2 nm. The simulation box
sizes were 5.35×5.43×8.85 nm3 and 5.23×5.87×8.83 nm3, with a total of 25650 and
27453 atoms in the respective systems.

Scheme S1. The initial structure of pre-assembled NG-TBIB and PG-TBIB systems.
1.3 MD Simulation methods for pre-assembled system.
We performed all MD simulations using GROMACS 5.1.2 [S9] and adopted the
AMBER03 force field to parameterize the fibrillar Aβ17-42 pentamer [S10]. The
solvent used was the TIP3P water model [S11] and each system was neutralized by
five counterions (Na+). The temperature at 310 K was controlled by the V-rescale
temperature coupling. [S12] The barostat with constant pressure of 1 atm was
described by the Berendsen pressure coupling method. [S13] The LINCS algorithm
was utilized to restrain the atomic bonds of the organic molecules. [S14] The cut-off
distance for non-bonded interactions was set at 1 nm. The electrostatic interactions
were treated with particle mesh Ewald (PME) method with a cut-off of 1 nm. [S15]
Periodic boundary conditions were conducted in all three directions. Energy
minimization was carried out using the steepest descent algorithm prior to performing
dynamic simulations. MD simulations for the systems were carried out for 1000 ns
with a time step of 0.002 ps per integration step.
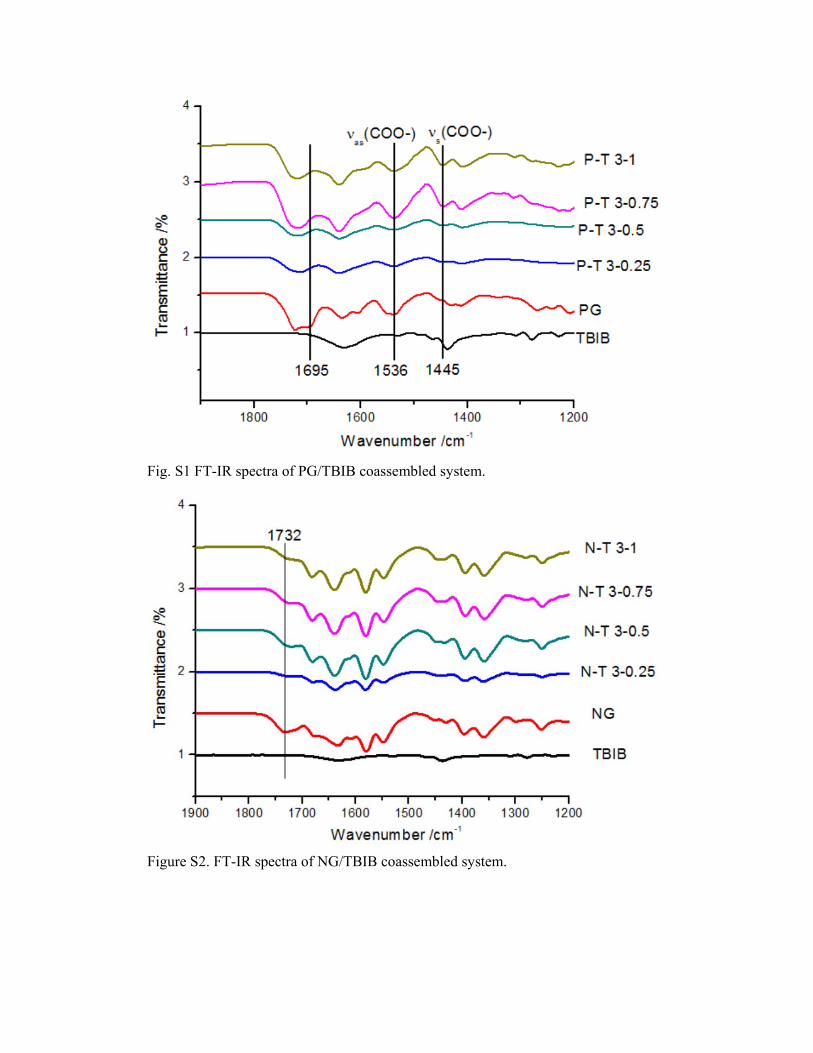
Fig. S1 FT-IR spectra of PG/TBIB coassembled system.
Figure S2. FT-IR spectra of NG/TBIB coassembled system.

Figure S3. Small and wide angle XRD patterns of PG-TBIB coassembled system.
Figure S4. XRD pattern of PG/NG/TBIB (3:3:1) coassembly.

Fig. S5 TEM images of different self-assembly modalities.
Fig. S6 Enlarged SEM image of NG/TBIB coassembly (3:1).

Fig. S7 Enlarged SEM image of PG/TBIB coassembly (3:1).

Fig. S8 Enlarged SEM image of PG/NG/TBIB coassembly (3:3:2).
Figure S9. CPL and fluorescent spectra of PG/TBIB coassembly. Ex = 350 nm
Figure S10. CPL and fluorescent spectra of PG/NG/TBIB coassembly. Results and Discussion rergarding MD simulations
The Hydrogen Bond evolution

Figure S11. (a) The average root-mean-square deviations (RMSD) of NG-TBIB
system during MD simulation. The hydrogen bond number of TBIB-SOL (b),
NG-SOL (c), NG-TBIB (d). (e) The representative snapshots of the equilibrium
configuration. NG and TBIB are shown in light pink and green, respectively, and the
hydrogen bond were highlighted in blue.
Figure S12. (a) The average root-mean-square deviations (RMSD) of PG-TBIB
system during MD simulation. The hydrogen bond number of PG-SOL (b),
TBIB-SOL (c), PG-TBIB (d). (e) The representative snapshots of the equilibrium
configuration. PG and TBIB are shown in light purple and green, respectively, and the
hydrogen bond were highlighted in blue.

The energy evolution
Figure S13. The Coulomb energy of (a1) NG, (b1) TBIB, (c1) NG-SOL, (d1)
TBIB-SOL and (e) NG-TBIB; The van der Waals (vDW) energy of (a2) NG, (b2)
TBIB, (c2) NG-SOL, (d2) TBIB-SOL and (f) NG-TBIB.

Figure S14. The Coulomb energy of (a1) PG, (b1) TBIB, (c1) PG-SOL, (d1)
TBIB-SOL and (e) OG-TBIB; The van der Waals (vDW) energy of (a2) PG, (b2)
TBIB, (c2) PG-SOL, (d2) TBIB-SOL and (f) PG-TBIB.
References S1 P. Xing, L. Bai, H. Chen, P. H. Tham, A. Hao, Y. Zhao, ChemNanoMat 2015, 1, 517 – 527. S2 P. Xing, S. Z. F. Phua, X. Wei, Y. Zhao, Adv. Mater. 2018, 30, 1805175
S3 Dennington R, Keith T, Millam J. GaussView, version 5 [J]. Semichem Inc.:
Shawnee Mission, KS, 2009.
S4 Foresman J B, Frisch A E. Exploring chemistry with electronic structure methods:
a guide to using Gaussian [J]. 1996.
S5 Jensen F. Introduction to computational chemistry [M]. John wiley & sons, 2017.
S6 Frisch M J, Trucks G W, Schlegel H B, et al. Gaussian 16, Revision A. 03,
Gaussian [J]. Inc., Wallingford CT, 2016.
S7 Wang J, Cieplak P, Kollman P A. How well does a restrained electrostatic potential
(RESP) model perform in calculating conformational energies of organic and
biological molecules? [J]. Journal of computational chemistry, 2000, 21(12):
1049-1074.
S8 Du J, Qiu M, Guo L, et al. Computational study of the binding mechanism
between farnesoid X receptor α and antagonist
N-benzyl-N-(3-(tertbutyl)-4-hydroxyphenyl)-2, 6-dichloro-4-(dimethyl-amino)
benzamide [J]. Journal of Biomolecular Structure and Dynamics, 2019, 37(6):
1628-1640.
S9 Hess B., Kutzner C., Van Der Spoel D., Lindahl E. GROMACS 4: Algorithms for
Highly Efficient, Load-balanced, and Scalable Molecular Simulation. Journal of
chemical theory and computation, 4 (2008): 435-447.
S10 Duan Y., Wu C., Chowdhury S., Lee M. C., Xiong G., Zhang W., et al. A Point‐
charge Force Field for Molecular Mechanics Simulations of Proteins Based on
Condensed‐phase Quantum Mechanical Calculations. Journal of computational
chemistry. 24 (2003): 1999-2012.
S11 Price D. J., Brooks III C. L. A modified TIP3P water potential for simulation with

Ewald simulation. The Journal of chemical physics, 121 (2004): 10096-10103.
S12 Bussi, G., Donadio, D. & Parrinello, M. Canonical sampling through velocity
rescaling. J. Chem. Phys. 126, 014101 (2007).
S13Berendsen H. J., Postma J. V., van Gunsteren W. F., DiNola A. R. H. J., Haak J. R.
Molecular dynamics with coupling to an external bath. The Journal of chemical
physics, 81 (1984): 3684-3690.
S14 Hess B., Bekker H., Berendsen H. J., Fraaije J. G. LINCS: a linear constraint
solver for molecular simulations. Journal of computational chemistry, 18 (1997):
1463-1472.
S15 Darden T, York D, Pedersen L. Particle mesh Ewald: An N⋅ log (N) method for
Ewald sums in large systems [J]. The Journal of chemical physics, 1993, 98(12):
10089-10092.


![data.1000gost.rudata.1000gost.ru/catalog/Data2/1/4293797/4293797057.pdf · ТИ И ® В © Й [Ш РО ЕЖ Т т ш - © 4? ПШ [М]П1Ш[ЕЖ©Н © . [т \ р ш ш ш и ш](https://img.pdfslide.us/doc/110x75/6021448a6c83685ffb6f211e/data-4-oe1.jpg)