Embed Size (px)
Citation preview

Conditioning Inspection on Unknown Bridge Foundations
Helsin WANG1, Chih-Hsin HU
2, Chung-Yue WANG
3
1 Institute of Bridge Engineering, China Engineering Consultants, Inc.; Taipei, Taiwan; Phone: +886-2-8732-
5567 ext.1218, Fax: +886-2-2736-5222; e-mail: [email protected] 2 HCK Geophysical Company; Taipei, Taiwan; e-mail: [email protected]
3 Department of Civil Engineering, National Central University; Taoyuan, Taiwan; e-mail:
Abstract Non-destructive testing (NDT) inspection has been veri fi ed to effi ciently know the current conditioning of
bridge foundations. In this paper, NDT techniques were required to inspect the unknown foundations on a damaged heritage railroad bridge for further rehabilitation in Taiwan. Three proposed NDT methods, electrical
resistivity tomography, ultra-seismic method, and parallel seismic method, were conducted to identify the bridge foundation depths. Post proof excavation and boring exploration were provided to verify the reliability of these
inspection results. The electrical resistivity tomography inspection reasonably identifies the upper portion of soil layers and depth of granite lining layer of the foundations. Being compared with site subsurface results, the ultra-
seismic and parallel seismic methods present a precise ability to determine the bridge foundation depths. Keywords: Unknown foundation, electrical resistivity tomography, ultra-seismic, parallel seismic, proof
excavation, borehole exploration
1. Introduction
The as-built condition of foundations is a crucial key to evaluate bridge stability for bridge
engineers. For example, materials deterioration, scour variation, or structural cracking could
undermine the foundation capacity of a bridge. Furthermore, lacking foundation dimension could impede of rating the flood or earthquake resistance on old bridges.
For more than forty years, non-destructive testing (NDT) or instrumentation inspection has
been developed to rapidly evaluate the condition of bridge foundations [1-4]. Currently, both
surface reflection technique, including impulse response and ultra-seismic (US) methods, and direct transmission technique, such as sonic logging and parallel seismic (PS) methods, are
commonly used to assess the integrity of concrete piles, drilled shafts, and caissons in field [1,
5-6]. Some geophysical methods, like electrical resistivity tomography (ERT) etc., were
introduced to subsurface and substructure investigation in past few years (e.g., [2, 4, 7]). In
general, the ERT images provide outstanding identification on the interface between foundation and soil/rock and their foundation type. The ultra-seismic and parallel seismic
methods have more precise ability to determine foundation depths.
Since bridge conditions may vary from dry riverbed, floodplain, to flowing water, the type of
NDT inspection is associated with site situation. Field construction record or post-excavation results is strongly suggested to verify the reliability of NDT inspection results [8]. Meanwhile,
in practical a more reasonable NDT inspection principle is suggested by comparing multi-type
inspection results if direct information is unavailable [2, 3]. Wang et al. [3] suggest that an
effective instrumentation inspection should consist of two inspecting methods at least in order to obtain solid conclusions.
2. Background
A steel truss river-crossing railroad bridge was built in 1913 and assigned as a cultural
heritage bridge in southern Taiwan since 1987, as shown in Figure 1. A new prestressed
11th European Conference on Non-Destructive Testing (ECNDT 2014), October 6-10, 2014, Prague, Czech Republic

concrete railroad bridge was constructed along its upstream side and replaced its
transportation function. During 2005 to 2009, this cultural heritage bridge was partially damaged by three successive typhoons. A 200-m long bridge section from P7 to P12 was
completely swept away in the main channel. The maintenance agency decided to rehabilitate
the remnant bridge. Unfortunately, its subsurface design information cannot be found in the
current bridge archive. Therefore, instrumentation inspection was proposed in order to
determine the foundation conditions of piers from P1 to P7.
The target bridge was composed of 24 spans, each 63.5 m in length (1,524 meters in length)
and 15.1 m in height. Each superstructure was supported with two exquisite and robust brick-
masonry piers. Each exposed oblong-shaped pier was constructed with 3 different geometrical
dimensions at least (Figure 1(a)). The most upper portion of a pier was constructed of bricks and partial granite blocks with a dimension of 7.55 m in length, 2.83 m in width, and 3.1 m in
height. The middle portion of a pier was constructed with granite blocks but with a larger
dimension of 8.7 m in length, 4.03 m in width, and 3.64 m in height. The lowest exposed pier
was comprised granite lining with a dimension of 9.5 m in length and 5.2 m in width. The
real types and depths of the covered bridge foundations were still left for inspection.
Figure 1. Site images on the damaged heritage railroad bridge
3. Instrumentation inspection
The instrumentation inspection was developed along the target bridge from piers P1 to P7 as
shown in Figure 2. Two sections of ERT probe layout were developed along piers P1~P3 and
P4~P6 of the target bridge. Two wave-based inspections, US and PS methods, were conducted on pier P4. In addition, boring exploration and site proof excavation were
conducted on P4/P6 and P4, respectively, in order to verify the NDT inspection results.
Figure 2. Inspection section along the target bridge Figure 3. Schematic representation of ERT arrangement
From Google map
(b) (a)
P7 P6 P5
P4
New railroad bridge
Cultural heritage bridge
New railroad bridge
Cultural heritage bridge
P12
P13
Direction of flow

3.1 Electrical Resistivity Tomography
ERT is to develop an artificial potential field by probing a pair of current electrodes around a
target zone (Figure 3). One pair of electrodes are used to measure the ground potential
difference. The underground apparent electric resistivity is functions of potential intensity,
potential difference, and relative positions. Traditionally, the measured resistivity image with a display mode of visible-light spectrum, corresponding resistivity values from over 1,000 to
less than 1 Ω-m, illustrates the resistivity intensity distributions in space. Since in field
mineral composition, grain size, mineral formation, water content, and ion concentration can
affect detected apparent electric resistivity, higher conductivity values on resistivity images
could be identified as the locations of steel-content structures, anomalies, or pollutants.
Figure 4 presents the ERT inspection results alongside the target bridge from P1 to P6. The
lengths of two ERT layout sections are 180 and 165 meters for sections of P1~P3 and P4~P6,
respectively. Electrode spacing is selected as 3 meters in order to detect the depths of
foundations and soil layers up to 25 meters. The resistivity values of granite lining piers usually range more than 5,000 Ω-m and display as gray contour [7]. Based on the limited ERT
images, the bottom of the 3rd
granite lining is identified at 5 meters, at least, below the ground
surface. Due to concrete blocks arming around pier P6, its measured resistivity image is
interfered with concrete blocks and corresponding bottom depth is relatively uncertain. Three-layer resistivity intensity distribution indicates the subsurface profile from the ground surface
as three soil layers, 2~3 m sand layer, 3~9 m sand/gravel layer, and 9~15 m clay layer,
corresponding resistivity values of 10-100, 100-1,000, and <30 Ω-m, respectively.
Figure 4. Electrical resistivity tomography outcomes along the target bridge: P1~P3 (upper) and P4~P6 (lower)

3.3 Parallel Seismic Method
The parallel seismic method is conducted by using a hammer to generate artificial elastic
waves onto a foundation. The transmitting waves are measured at different depths in an
adjacent borehole. Sensor spacing is selected as 0.5 meters from the ground surface
downward to a depth of 37 meters. Each measured signal is plotted in a sequence of its corresponding depth from top to tip. Wave diffraction echoes represent the consequence from
source effect when waves meet an obstacle. Waveform changes, such as direct waves, shear
waves, and surface waves, indicate the interface of different media when waves travel through.
Wave sequence discontinuity is supposed to be found at the interface of different materials.
Figure 5 shows the measured horizontal and vertical waveforms from the parallel seismic
method around P4. The waveform discontinuity is marked at elevation positions of 13.8, 1.8, -
1.2, and -15.2 meters, i.e. at depths of 5, 17, 20, and 34 meters, respectively, with an identical
measurement error value of ±0.5 meters. The interface at 5 meters deep indicates the bottom
of the 3rd
granite lining, consistent with the finding in the ERT image (Figure 4). The rest predicted interfaces are suggested to be identified by using other geophysical inspecting
methods or the direct findings from proof excavation or site borehole [3, 4, 8].
Figure 5. Parallel seismic testing results on pier P4
3.2 Ultra-Seismic Method
The ultra-seismic method is performed on one side of a partially exposed foundation

component by aligning several receivers in an equidistant linear fashion. A heavy hammer
then is used to strike the component surface, thereby generating small artificial seismic waves. As the shock waves are transmitted through the foundation components, reflection waves are
generated at the interface of the component material and the stratum (sand/soil/grave/rock and
so forth). Due to variations in acoustic impedance, the direct and reflection seismic waves can
be recorded directly by multiple-channel seismograms and used to correlate the travel time of
artificial seismic waves in the target foundation. Contrasting this data with waveform imaging can yield a more accurate estimate of the interfaces of foundation components and its
reflection depths.
Figure 6 indicates the ultra-seismic inspection results at P4. The vertical or horizontal
waveform sequence or imaging from multiple sensors is displayed in a sequence of its corresponding depth horizontally. The direct arrival waves and reflection waves can identify
trigger time T1 and terminal time T2, respectively. For example, the trigger time, T1, and
terminal time, T2, are -0.33 msec and 11.27 msec, respective, for vertical waveform sequence
(Figure 6(a)). The wave velocity is around 1,205 m/sec. The distance is 6.9 meters away from
sensor No.8. The computed foundation depth is around 4.9±0.25 meters from the ground surface, consistent with the findings in the ERT image (Figure 4) and parallel seismic method
(Figure 5). For the horizontal waveform imaging, the trigger time, T1, and terminal time, T2,
are 0.61 msec and 18.33 msec, respective, (Figure 6(b)). The wave velocity is around 1,960
m/sec. The foundation depth is around 17.36±0.25 meters from the ground surface, which can
be identified as the 2nd
interface at the depth of 17±0.5 meters found in the parallel seismic method (Figure 5). This implies that there is a 12-m-deep 4
th–layer pier lining existing right
below the granite block lining, the 3rd
–layer pier lining. This finding is used to be verified by
other geophysical inspecting methods or the direct evidence from proof excavation or site
borehole [3, 4, 8].
Figure 6. (a) Vertical and (b) horizontal waveform sequences of ultra-seismic testing conducted on pier P4
4. Inspection Verification
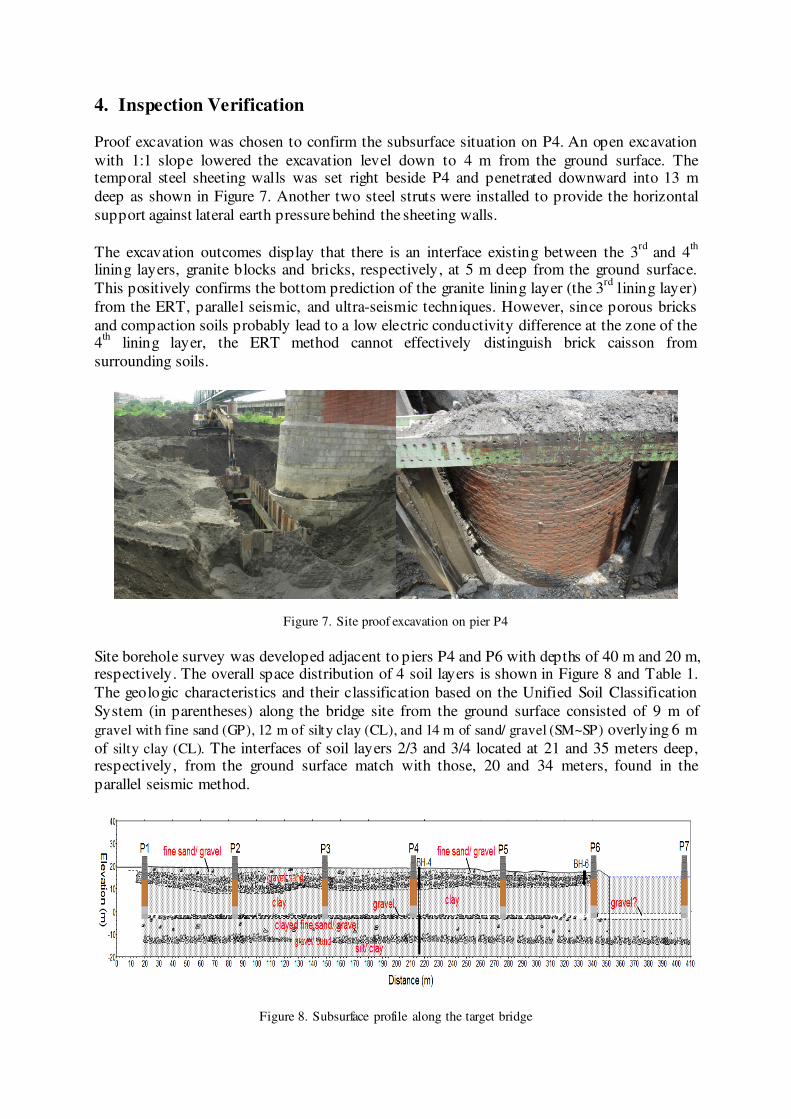
Proof excavation was chosen to confirm the subsurface situation on P4. An open excavation
with 1:1 slope lowered the excavation level down to 4 m from the ground surface. The temporal steel sheeting walls was set right beside P4 and penetrated downward into 13 m
deep as shown in Figure 7. Another two steel struts were installed to provide the horizontal
support against lateral earth pressure behind the sheeting walls.
The excavation outcomes display that there is an interface existing between the 3rd and 4
th
lining layers, granite blocks and bricks, respectively, at 5 m deep from the ground surface.
This positively confirms the bottom prediction of the granite lining layer (the 3rd
lining layer)
from the ERT, parallel seismic, and ultra-seismic techniques. However, since porous bricks
and compaction soils probably lead to a low electric conductivity difference at the zone of the 4
th lining layer, the ERT method cannot effectively distinguish brick caisson from
surrounding soils.
Figure 7. Site proof excavation on pier P4
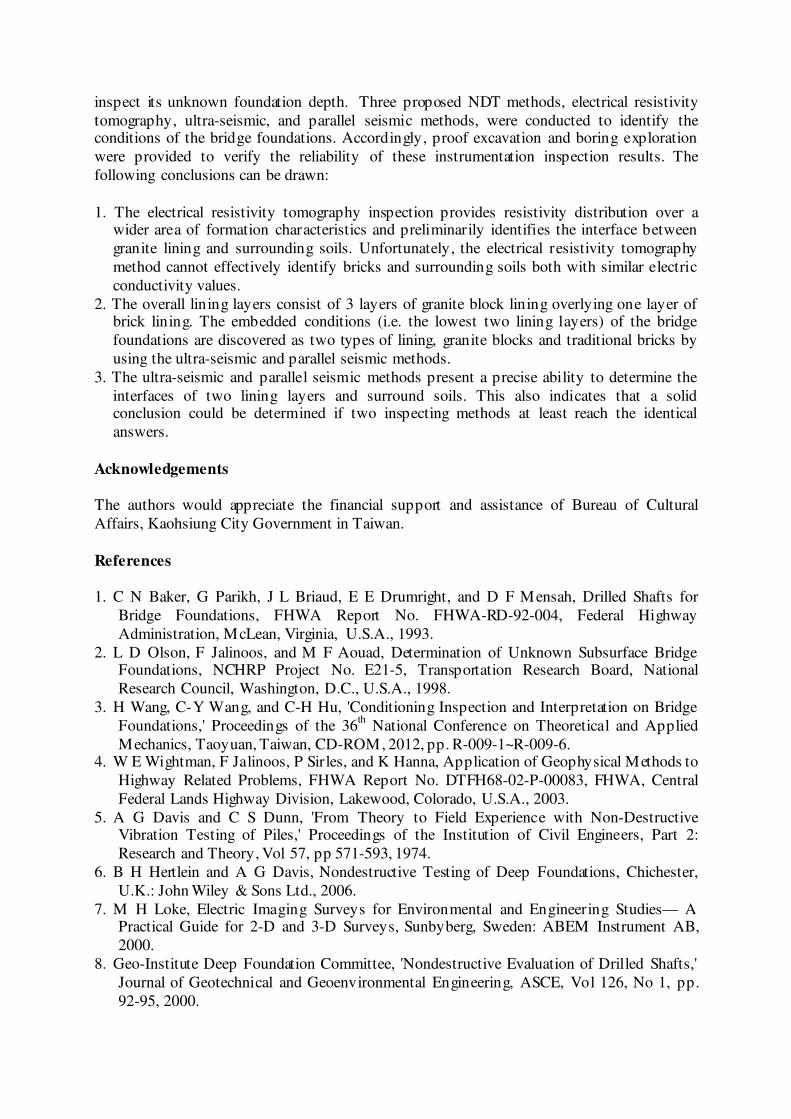
Site borehole survey was developed adjacent to piers P4 and P6 with depths of 40 m and 20 m, respectively. The overall space distribution of 4 soil layers is shown in Figure 8 and Table 1.
The geologic characteristics and their classification based on the Unified Soil Classification
System (in parentheses) along the bridge site from the ground surface consisted of 9 m of
gravel with fine sand (GP), 12 m of silty clay (CL), and 14 m of sand/ gravel (SM~SP) overlying 6 m
of silty clay (CL). The interfaces of soil layers 2/3 and 3/4 located at 21 and 35 meters deep, respectively, from the ground surface match with those, 20 and 34 meters, found in the
parallel seismic method.
Figure 8. Subsurface profile along the target bridge

Table 1. Overall subsurface classification along the target bridge
Layer Soil classification Elevation (m) Depth (m) Penetration resistant value, N
1 Gravel with fine sand (GP) 19~10 9 42~66
2 Silty clay (CL) 10~-2 12 4~7
3 Sand/ gravel (SM~SP) -2~-16 14 59~82
4 Silty clay (CL) -16~-22 6 25~49
The comprehensive results from these investigation methods are graphically summarized in Figure 9 at pier P4. This pier penetrates into the ground up to 17 meters. The 4-layer lining
pier consists of 3 layers of granite blocks with varying heights of 3.1~3.6 meters overlying on
13-m long brick lining. The ERT, parallel seismic, and ultra-seismic techniques have good
inspection ability to identify the interface of lining layers 3 and 4 of the pier. The parallel
seismic and ultra-seismic methods provide mutual identification on the interface of lining layer 4 of P4 and its surrounding clay. In addition, the interface of soil layers 2/3 can be
effectively detected by using the ERT and parallel seismic methods. The interface of soil
layers 3/4 can be effectively detected by using the parallel seismic method.
Figure 9. Subsurface profile at position of pier P4
5. Conclusions In order to preserve a cultural heritage railroad bridge, NDT techniques were required to
inspect its unknown foundation depth. Three proposed NDT methods, electrical resistivity
tomography, ultra-seismic, and parallel seismic methods, were conducted to identify the conditions of the bridge foundations. Accordingly, proof excavation and boring exploration
were provided to verify the reliability of these instrumentation inspection results. The
following conclusions can be drawn:
1. The electrical resistivity tomography inspection provides resistivity distribution over a wider area of formation characteristics and preliminarily identifies the interface between
granite lining and surrounding soils. Unfortunately, the electrical resistivity tomography
method cannot effectively identify bricks and surrounding soils both with similar electric
conductivity values.
2. The overall lining layers consist of 3 layers of granite block lining overlying one layer of brick lining. The embedded conditions (i.e. the lowest two lining layers) of the bridge
foundations are discovered as two types of lining, granite blocks and traditional bricks by
using the ultra-seismic and parallel seismic methods.
3. The ultra-seismic and parallel seismic methods present a precise ability to determine the
interfaces of two lining layers and surround soils. This also indicates that a solid conclusion could be determined if two inspecting methods at least reach the identical
answers.
Acknowledgements
The authors would appreciate the financial support and assistance of Bureau of Cultural
Affairs, Kaohsiung City Government in Taiwan.
References
1. C N Baker, G Parikh, J L Briaud, E E Drumright, and D F Mensah, Drilled Shafts for
Bridge Foundations, FHWA Report No. FHWA-RD-92-004, Federal Highway
Administration, McLean, Virginia, U.S.A., 1993.
2. L D Olson, F Jalinoos, and M F Aouad, Determination of Unknown Subsurface Bridge Foundations, NCHRP Project No. E21-5, Transportation Research Board, National
Research Council, Washington, D.C., U.S.A., 1998.
3. H Wang, C-Y Wang, and C-H Hu, 'Conditioning Inspection and Interpretation on Bridge
Foundations,' Proceedings of the 36th National Conference on Theoretical and Applied
Mechanics, Taoyuan, Taiwan, CD-ROM, 2012, pp. R-009-1~R-009-6. 4. W E Wightman, F Jalinoos, P Sirles, and K Hanna, Application of Geophysical Methods to
Highway Related Problems, FHWA Report No. DTFH68-02-P-00083, FHWA, Central
Federal Lands Highway Division, Lakewood, Colorado, U.S.A., 2003.
5. A G Davis and C S Dunn, 'From Theory to Field Experience with Non-Destructive Vibration Testing of Piles,' Proceedings of the Institution of Civil Engineers, Part 2:
Research and Theory, Vol 57, pp 571-593, 1974.
6. B H Hertlein and A G Davis, Nondestructive Testing of Deep Foundations, Chichester,
U.K.: John Wiley & Sons Ltd., 2006.
7. M H Loke, Electric Imaging Surveys for Environmental and Engineering Studies— A Practical Guide for 2-D and 3-D Surveys, Sunbyberg, Sweden: ABEM Instrument AB,
2000.
8. Geo-Institute Deep Foundation Committee, 'Nondestructive Evaluation of Drilled Shafts,'
Journal of Geotechnical and Geoenvironmental Engineering, ASCE, Vol 126, No 1, pp.
92-95, 2000.