Embed Size (px)
Citation preview
CONDITION OF GROUNDFISH
RESOURCES OF THE GULF OF ALASKA REGION
AS ASSESSED IN 1986
Edited by
Richard L. Major
Northwest and Alaska Fisheries CenterNational Marine Fisheries Service
National Oceanic and Atmospheric Administration7600 Sand Point Way NE.
BIN C15700, Bldg. 4Seattle, Washington 98115
July 1987

This document is available to the public through:
National Technical Information ServiceU.S. Department of Commerce5285 Port Royal RoadSpringfield, VA 22161
iii
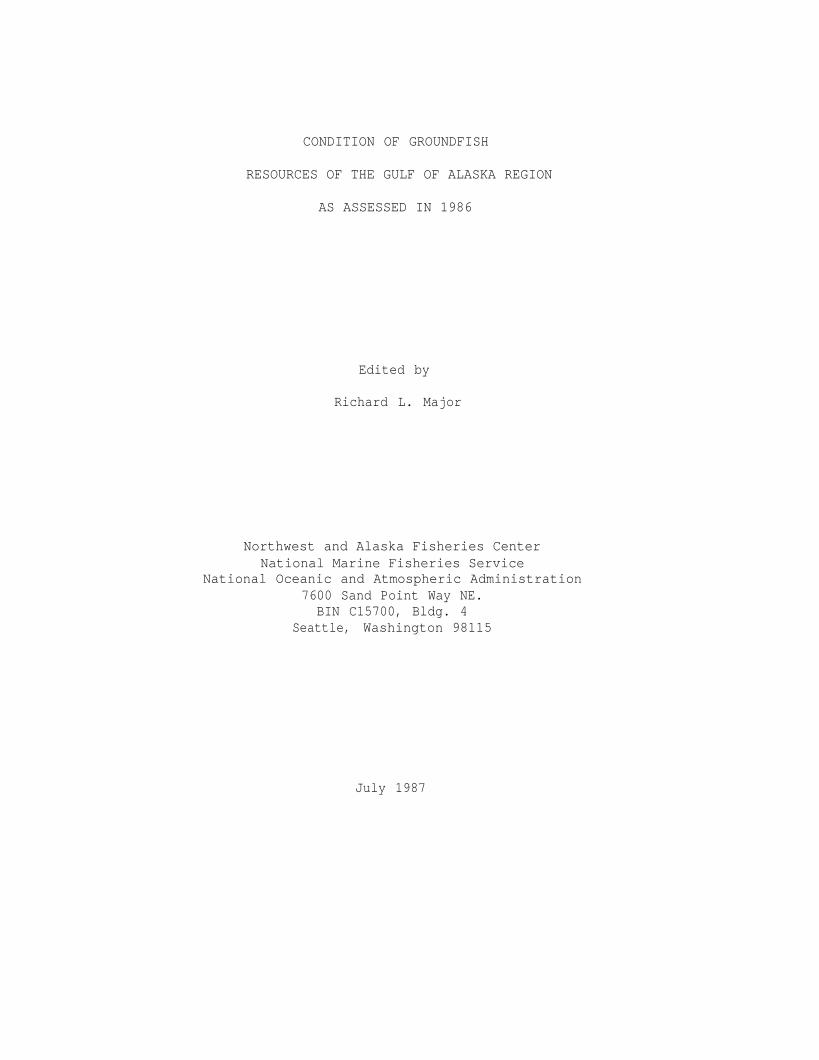
Gulf of Alaska: International North Pacific Fisheries Commissionstatistical areas (Shumagin, Chirikof, Kodiak, Yakutat, and Southeasternand North Pacific Fishery Management Council regulatory areas (Western,Central, and Eastern).

V
PREFACE
The all-nation catch of groundfish in the Gulf of Alaska in 1985 was321,920 metric tons (t), down 10% from 356,309 t in 1984 (Table A). The 1984catch had, in turn, been the largest since the Magnuson Fishery Conservationand Management Act was implemented in 1977. Reduced catches of walleyepollock (Theragra chalcogramma), Pacific cod (Gadus macrocephalus), the Pacificocean perch complex of Sebastes alutus, and four similar congeneric species,and flatfish were the main contributors to the decline--down 7.1, 38.4, 75.6,and 55.1%, respectively Although the decline in the pollock catch was notthat great in terms of percentage, it was the greatest factor in terms ofsheer weight--a ,21,867 t decline for pollock; a 34,389 t decline overall.
All elements of the fishing fleet were not equally affected. The totalallowable level of foreign fishing was reduced sharply from 1984 levels;,-down82.2 and 68.6% for pollock and cod, respectively, and down to token amounts'-:'.-for the remaining species or species groups. As a direct result, the foreigncatch was down 68.2% for pollock, 42.8% for cod, and was practically eliminatedfor the other categories. The joint venture and U.S. domestic components ofthe fishery continued to increase, with the joint venture portion of the overallcatch increasing from 61.6% in 1984 to 76.8% in 1985 and the U.S. domesticportion increasing from 3.6% in 1984 to 10.5% in 1985. For certain selectfishes, however, the U.S. domestic share of the total catch became verylarge: 89.4% of the various rockfishes (Sebastes spp.), for example, and97.7% of the sablefish (Anoplopoma fimbria).
Presented here are 14 contributions by U.S. scientists dealing with theGulf of Alaska groundfish resources. Ten papers summarize information oncommercially important species or groups of species. There are also descrip-tions of 1) the commercial fisheries for pollock in 1985 and 1986, 2) researchon the age composition and recruitment of Pacific ocean perch, and 3) the1986 acoustic assessment of the pollock population. Finally, the 1986 U.S.research surveys are reviewed and plans for 1987 are outlined.

vi

v i i
ix
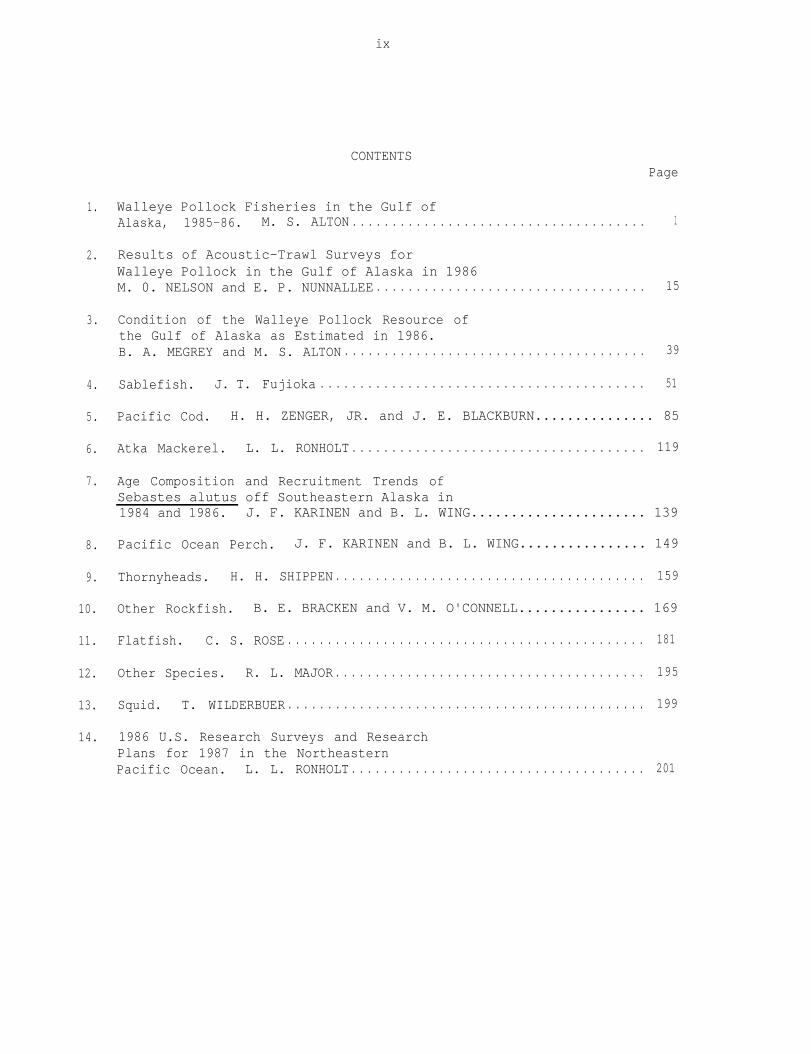
CONTENTSPage
1. Walleye Pollock Fisheries in the Gulf ofAlaska, 1985-86. M. S. ALTON . . . . . . . . . . . . . . . . . . . . . . . . . . . . . . . . . . . . . 1
2. Results of Acoustic-Trawl Surveys forWalleye Pollock in the Gulf of Alaska in 1986M. 0. NELSON and E. P. NUNNALLEE . . . . . . . . . . . . . . . . . . . . . . . . . . . . . . . . . . 15
3. Condition of the Walleye Pollock Resource ofthe Gulf of Alaska as Estimated in 1986.B. A. MEGREY and M. S. ALTON . . . . . . . . . . . . . . . . . . . . . . . . . . . . . . . . . . . . . . 39
4. Sablefish. J. T. Fujioka . . . . . . . . . . . . . . . . . . . . . . . . . . . . . . . . . . . . . . . . . 51
5. Pacific Cod. H. H. ZENGER, JR. and J. E. BLACKBURN............... 85
6. Atka Mackerel. L. L. RONHOLT . . . . . . . . . . . . . . . . . . . . . . . . . . . . . . . . . . . . . 119
7. Age Composition and Recruitment Trends ofSebastes alutus off Southeastern Alaska in1984 and 1986. J. F. KARINEN and B. L. WING...................... 139
8. Pacific Ocean Perch. J. F. KARINEN and B. L. WING................ 149
9. Thornyheads. H. H. SHIPPEN . . . . . . . . . . . . . . . . . . . . . . . . . . . . . . . . . . . . . . . 159
10. Other Rockfish. B. E. BRACKEN and V. M. O'CONNELL................ 169
11. Flatfish. C. S. ROSE . . . . . . . . . . . . . . . . . . . . . . . . . . . . . . . . . . . . . . . . . . . . . 181
12. Other Species. R. L. MAJOR . . . . . . . . . . . . . . . . . . . . . . . . . . . . . . . . . . . . . . . 195
13. Squid. T. WILDERBUER . . . . . . . . . . . . . . . . . . . . . . . . . . . . . . . . . . . . . . . . . . . . . 199
14. 1986 U.S. Research Surveys and ResearchPlans for 1987 in the NortheasternPacific Ocean. L. L. RONHOLT . . . . . . . . . . . . . . . . . . . . . . . . . . . . . . . . . . . . . 201
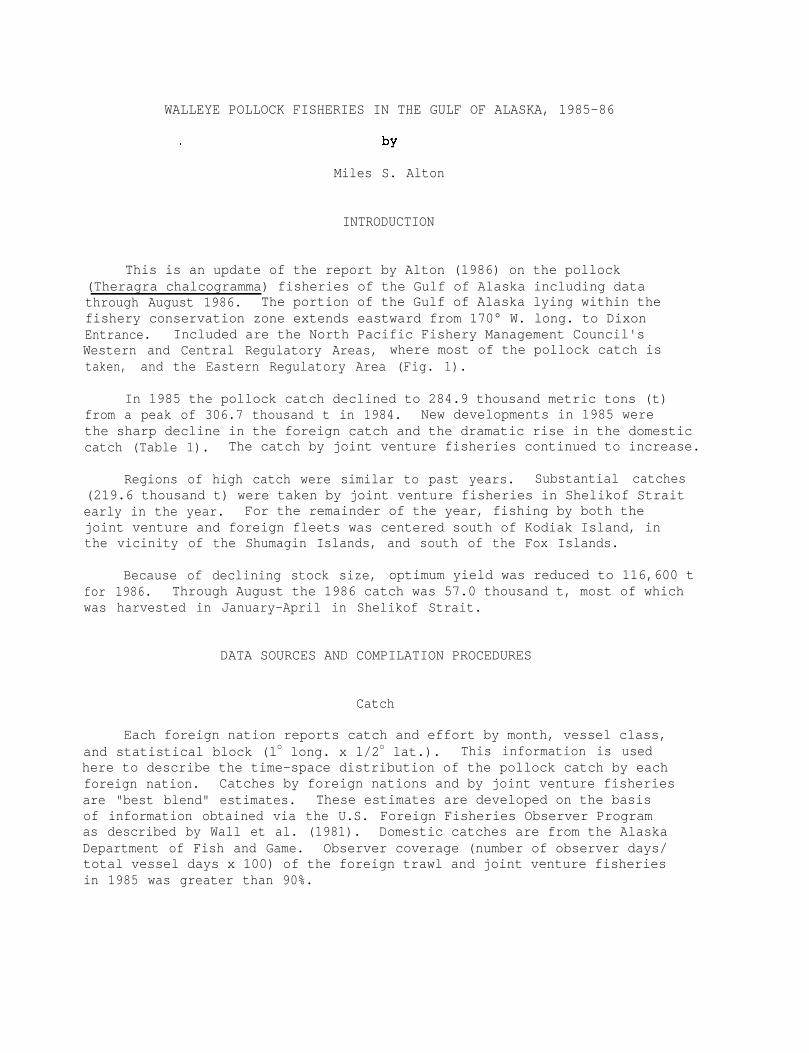
WALLEYE POLLOCK FISHERIES IN THE GULF OF ALASKA, 1985-86
Miles S. Alton
INTRODUCTION
This is an update of the report by Alton (1986) on the pollock(Theragra chalcogramma) fisheries of the Gulf of Alaska including datathrough August 1986. The portion of the Gulf of Alaska lying within thefishery conservation zone extends eastward from 170° W. long. to DixonEntrance. Included are the North Pacific Fishery Management Council'sWestern and Central Regulatory Areas, where most of the pollock catch istaken, and the Eastern Regulatory Area (Fig. 1).
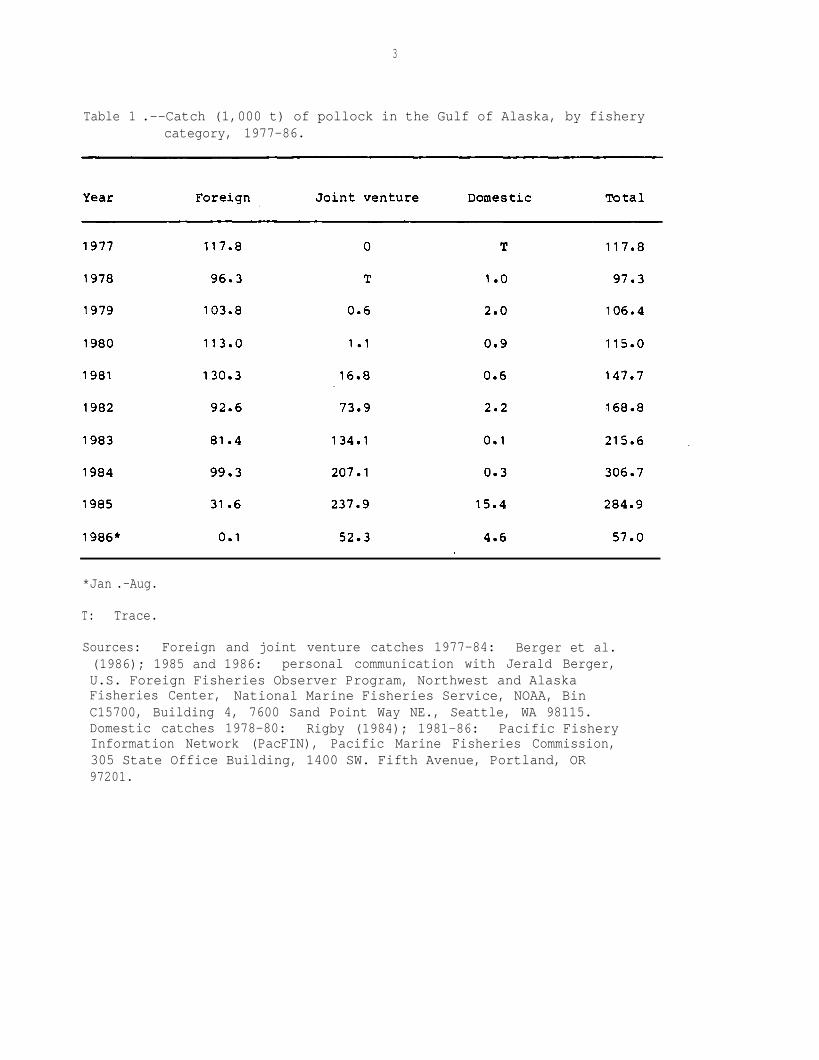
In 1985 the pollock catch declined to 284.9 thousand metric tons (t)from a peak of 306.7 thousand t in 1984. New developments in 1985 werethe sharp decline in the foreign catch and the dramatic rise in the domesticcatch (Table 1). The catch by joint venture fisheries continued to increase.
Regions of high catch were similar to past years. Substantial catches(219.6 thousand t) were taken by joint venture fisheries in Shelikof Straitearly in the year. For the remainder of the year, fishing by both thejoint venture and foreign fleets was centered south of Kodiak Island, inthe vicinity of the Shumagin Islands, and south of the Fox Islands.
Because of declining stock size, optimum yield was reduced to 116,600 tfor 1986. Through August the 1986 catch was 57.0 thousand t, most of whichwas harvested in January-April in Shelikof Strait.
DATA SOURCES AND COMPILATION PROCEDURES
Catch
Each foreign nation reports catch and effort by month, vessel class,and statistical block (lo long. x l/2o lat.). This information is usedhere to describe the time-space distribution of the pollock catch by eachforeign nation. Catches by foreign nations and by joint venture fisheriesare "best blend" estimates. These estimates are developed on the basisof information obtained via the U.S. Foreign Fisheries Observer Programas described by Wall et al. (1981). Domestic catches are from the AlaskaDepartment of Fish and Game. Observer coverage (number of observer days/total vessel days x 100) of the foreign trawl and joint venture fisheriesin 1985 was greater than 90%.

2
Figure 1. --Geographical areas of the central and western Gulf of Alaska.
3
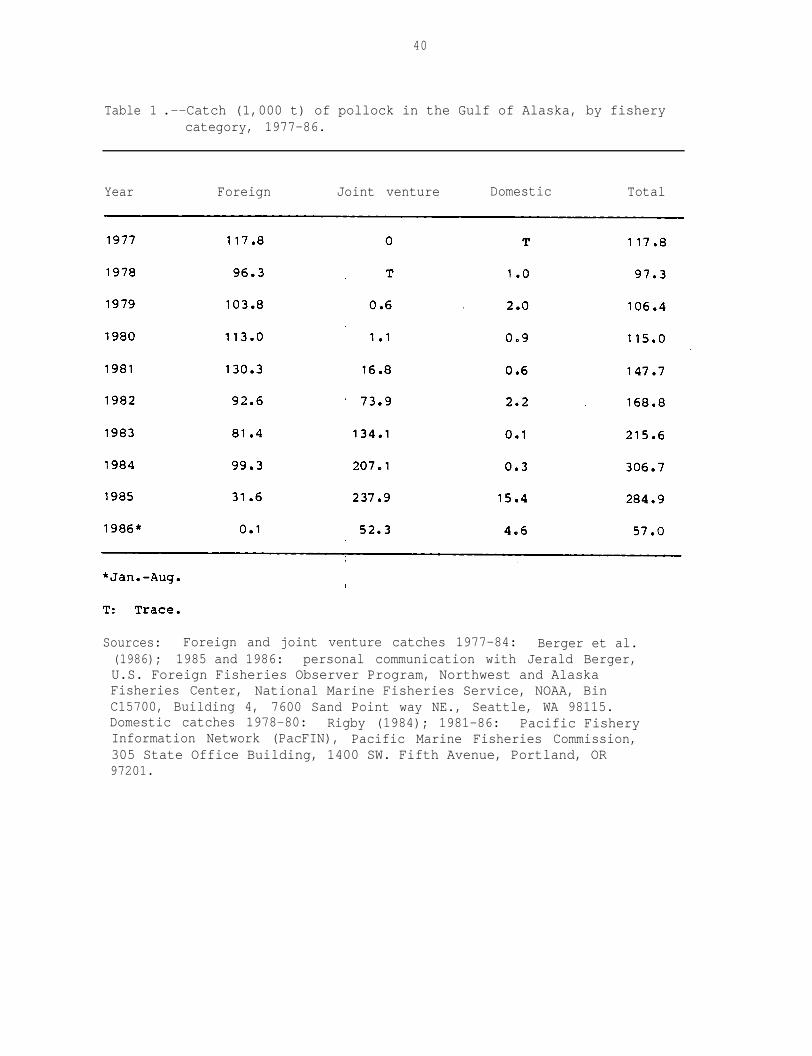
Table 1 .--Catch (1,000 t) of pollock in the Gulf of Alaska, by fisherycategory, 1977-86.
*Jan .-Aug.
T: Trace.
Sources: Foreign and joint venture catches 1977-84: Berger et al.(1986); 1985 and 1986: personal communication with Jerald Berger,U.S. Foreign Fisheries Observer Program, Northwest and AlaskaFisheries Center, National Marine Fisheries Service, NOAA, BinC15700, Building 4, 7600 Sand Point Way NE., Seattle, WA 98115.Domestic catches 1978-80: Rigby (1984); 1981-86: Pacific FisheryInformation Network (PacFIN), Pacific Marine Fisheries Commission,305 State Office Building, 1400 SW. Fifth Avenue, Portland, OR97201.

4
Length and Age Composition
Estimates of the length and age composition of the foreign and jointventure catches are also based on data collected by U.S. observers aboardforeign trawlers and processors. A description of the sampling proceduresused by the observers to obtain length information and age structures wasgiven by Nelson et al. (1981). Procedures for determining the age ofpollock from otoliths was described by LaLanne (1979), and the procedurefor estimating the age composition of the pollock catch was given byAlton and Deriso (1983).
CATCH INFORMATION
Foreign Fisheries
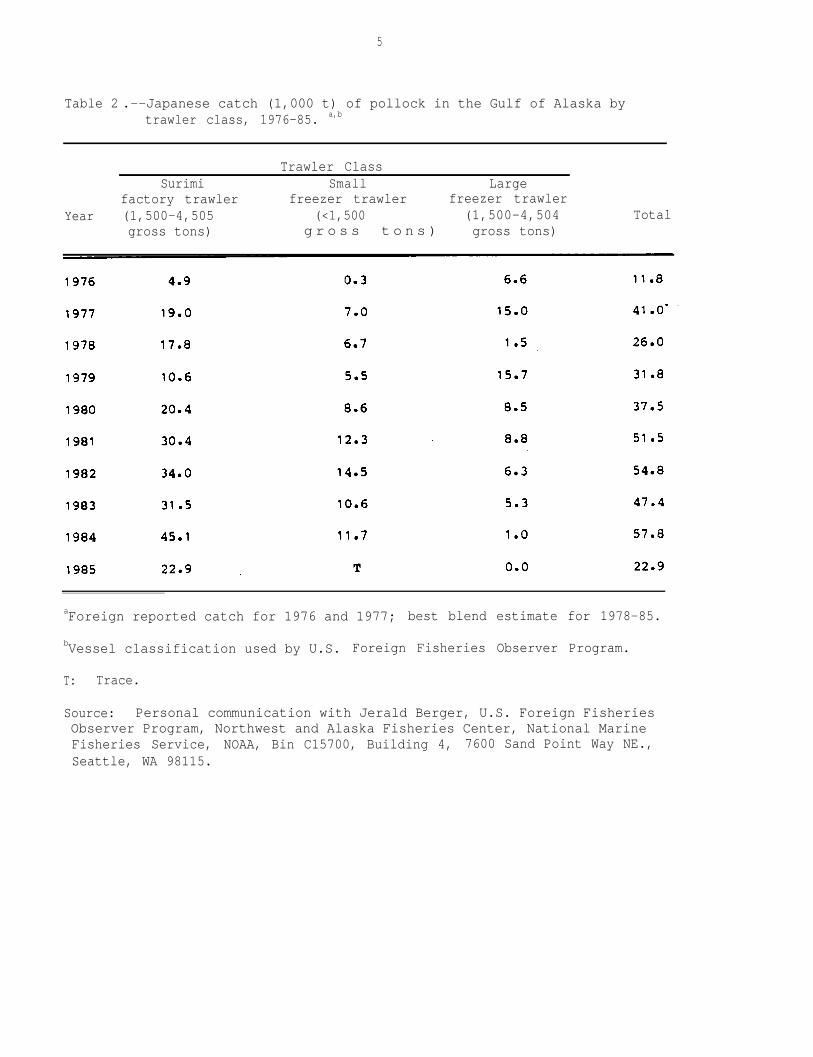
Japan and the Republic of Korea (ROK) were the only foreign nationsthat harvested pollock in the Gulf of Alaska in 1985. Japanese fisheriesaccounted for 8% (22.9 thousand t) of the total pollock catch and ROK foronly 3% (8.6 thousand t). The overall foreign catch of pollock declinedfrom 99.3 thousand t in 1984 to 31.6 thousand t in 1985, a 68% decrease.
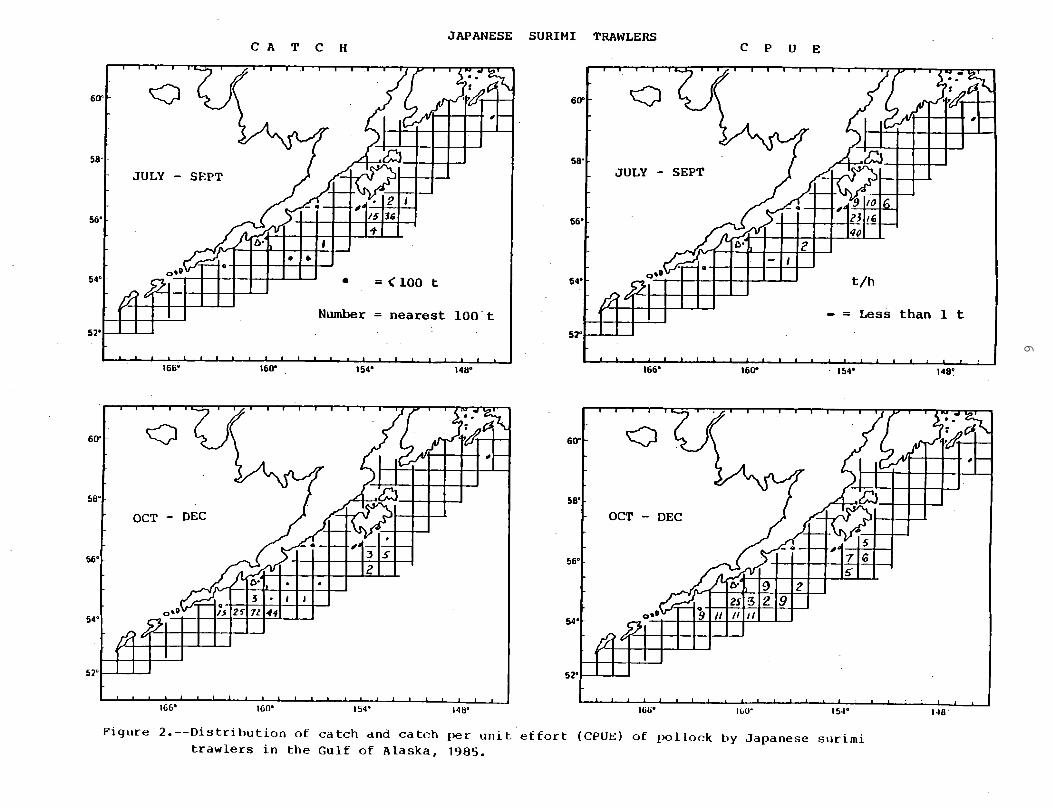
In the Japanese fisheries most of the catch was taken by surimitrawlers (Table 2). These vessels concentrated their effort in tworegions: south of Kodiak Island July-December and in the vicinity of theShumagin Islands October-December (Fig. 2). Catch per unit effort (CPUE)was highest in the Kodiak region in July-September but highest in theShumagin Island region in the fall.
In contrast to the Japanese fishery, ROK trawlers took most of theircatch just south of the Fox Islands--mainly in the fall quarter (Fig. 3).The CPUE on the Fox Islands grounds decreased from summer to fall,
Joint Venture Fisheries
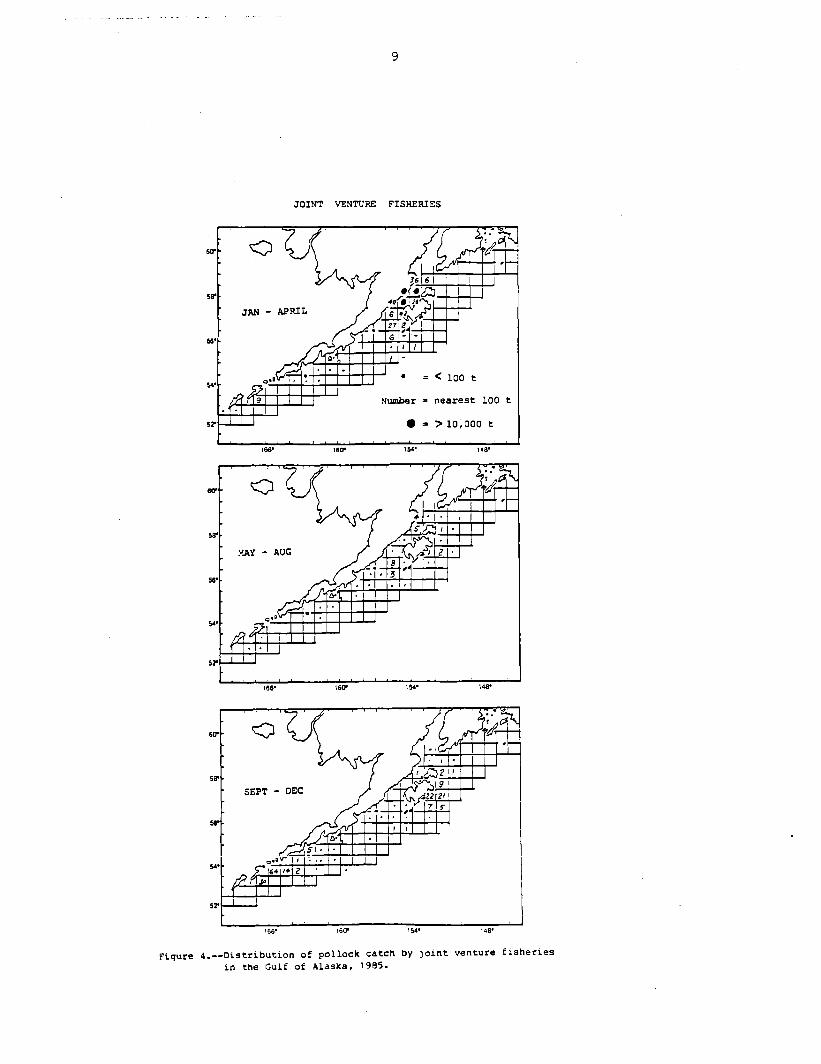
The catch by joint venture fisheries continued to climb in 1985,reaching almost 238 thousand t and representing 84% of the total catch(Table 3). Most was taken on the spawning grounds of Shelikof StraitJanuary-April. The catch dropped off during spring and summer months butincreased in the fall when fishing was concentrated south of Kodiak Islandand south of the Fox Islands (Fig. 4).
Domestic Fisheries
There was a dramatic increase of the pollock catch by domesticfisheries in 1985 (Table 3). Most of the 15.4 thousand t catch waslanded at shore-based plants (13.9 thousand t) with the remainder (1.5thousand t) being taken by catcher-processors. The catch in the westernRegulatory Area (8.5 thousand t) was slightly greater than that from theCentral Regulatory Area (6.9 thousand t).
5
Table 2 .--Japanese catch (1,000 t) of pollock in the Gulf of Alaska bytrawler class, 1976-85. a,b
SurimiTrawler Class
Small Largefactory trawler freezer trawler freezer trawler
Year (1,500-4,505 (<1,500 (1,500-4,504 Totalgross tons) g r o s s t o n s ) gross tons)
aForeign reported catch for 1976 and 1977; best blend estimate for 1978-85.
bVessel classification used by U.S. Foreign Fisheries Observer Program.
T: Trace.
Source: Personal communication with Jerald Berger, U.S. Foreign FisheriesObserver Program, Northwest and Alaska Fisheries Center, National MarineFisheries Service, NOAA, Bin C15700, Building 4, 7600 Sand Point Way NE.,Seattle, WA 98115.
6


8
Table 3 .--Catch (t) of pollock in the Gulf of Alaska, by fisherycategory and by North Pacific Fishery Management Councilregulatory area, 1985.
*Includes 15 t taken in longline fisheries.
T: Trace.
Sources: Foreign and joint venture catches: personal communicationwith Jerald Berger, U.S. Foreign Fisheries Observer Program, Northwestand Alaska Fisheries Center, National Marine Fisheries Service, NOAA,Bin C15700, Building 4, 7600 Sand Point Way NE., Seattle, WA 98115.Domestic catch: Pacific Fishery Information Network (PacFIN), PacificMarine Fisheries Commission, 305 State Office Building, 1400 SW. FifthAvenue, Portland, OR 97201.
10
LENGTH AND AGE-COMPOSITION
Outside the Shelikof Strait region in 1985 the fisheries continued,as in 1984, to take fish that had a unimodal length distribution (Fig. 5).Modal lengths were 46 to 50 cm depending upon the fishery, and weregreater than those of last year (44-47 cm). The increasing mode reflectsthe continued dominance of the strong year classes of 1978 (7-year-oldfish) and 1979 (6-year-old fish) (Table 4).
On the spawning grounds in Shelikof Strait, two length modes werepresent (Fig. 5). The smaller (23 cm) mode represents 2-year-old fish ofthe 1983 year class; the larger mode represents a mixture of older fishdominated by the 1978 and 1979 year classes. The 1982 year class (as3-year-old fish) was poorly represented in the catch from Shelikof Strait,which may be an indication that its abundance relative to other year classesis low.
11
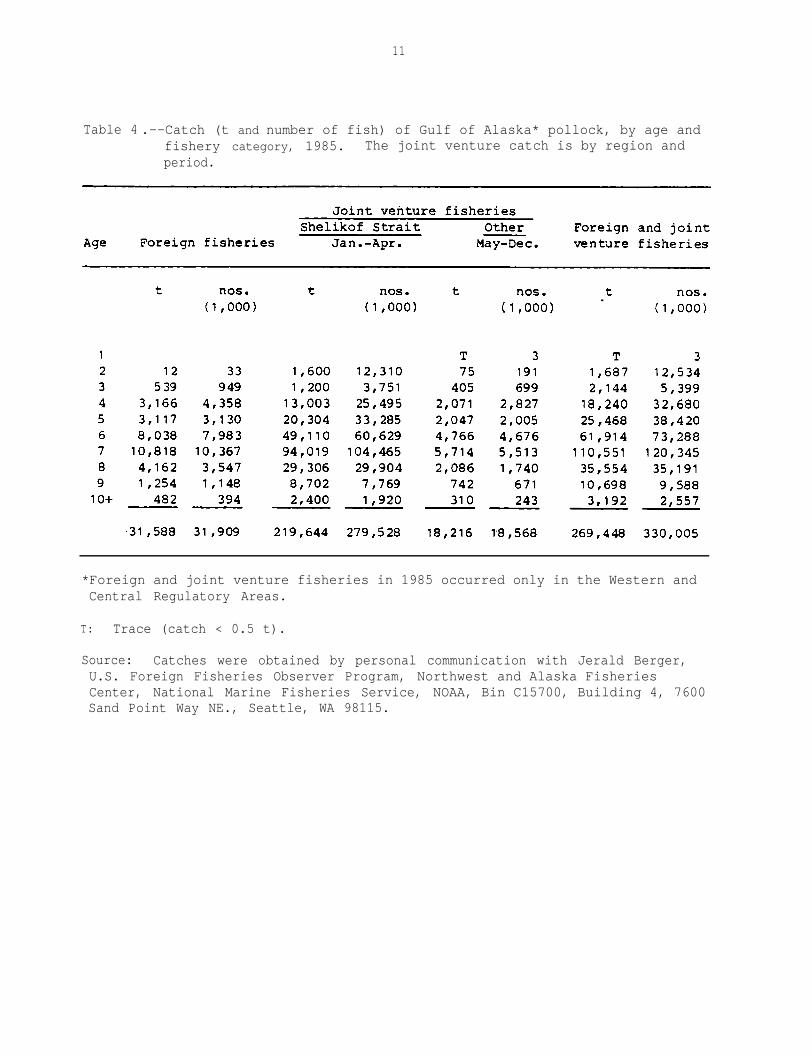
Table 4 .--Catch (t and number of fish) of Gulf of Alaska* pollock, by age andfishery category, 1985. The joint venture catch is by region andperiod.
*Foreign and joint venture fisheries in 1985 occurred only in the Western andCentral Regulatory Areas.
T: Trace (catch < 0.5 t).
Source: Catches were obtained by personal communication with Jerald Berger,U.S. Foreign Fisheries Observer Program, Northwest and Alaska FisheriesCenter, National Marine Fisheries Service, NOAA, Bin C15700, Building 4, 7600Sand Point Way NE., Seattle, WA 98115.
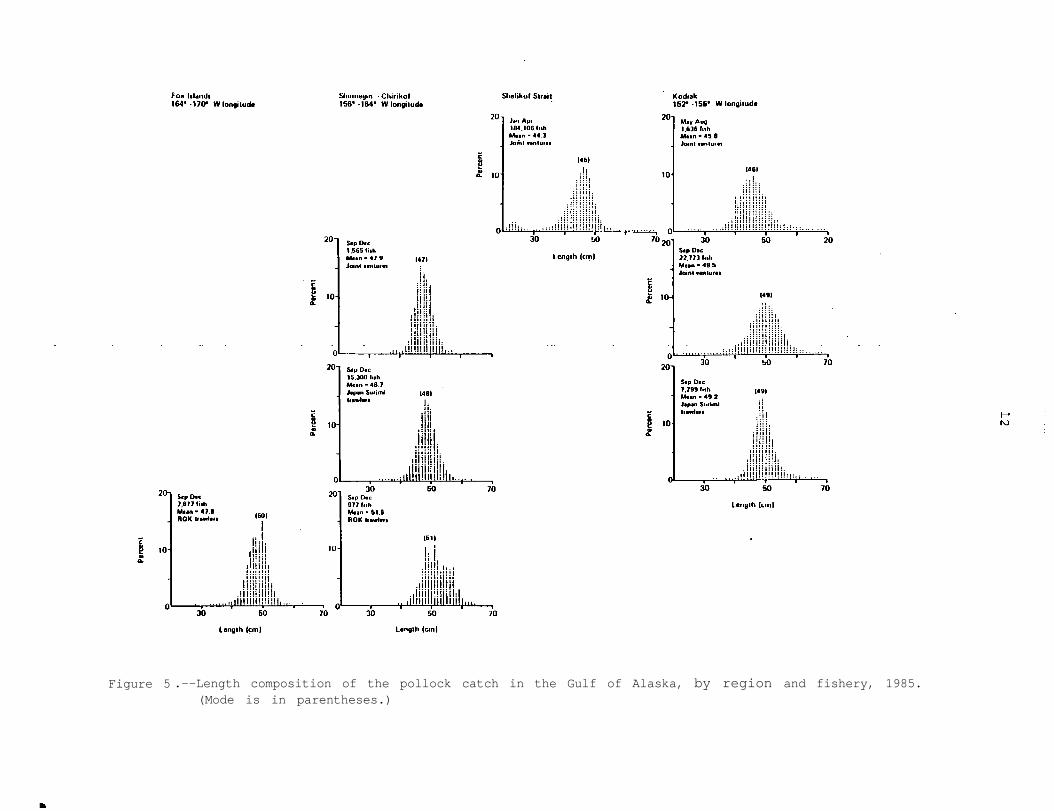
Figure 5 .--Length composition of the pollock catch in the Gulf of Alaska, by region and fishery, 1985.(Mode is in parentheses.)
13
REFERENCES
Alton, M. S. 1986. Walleye pollock fisheries of the Gulf of Alaska, 1984-85.In R. L. Major (editor), Condition of groundfish resources of the Gulfof Alaska region as assessed in 1985, p. 1-21. U.S. Dep. Commer., NOAATech. Memo. NMFS F/NWC-106.
Alton, M., and R. Deriso. 1983. Pollock. In D. Ito and J. Balsiger (editors),Condition of groundfish resources of the Gulf of Alaska in 1982, p. l-62.U.S. Dep. Commer., NOAA Tech. Memo. NMFS F/NWC-52.
Berger, J. D., J. E. Smoker, and K. A. King. 1986. Foreign andcatches and allocations in the Pacific Northwest and Alaskaunder the Magnuson Fishery Management and Conservation Act,U.S. Dep. Commer., NOAA Tech. Memo. NMFS F/NWC-99, 53 p.
joint venturefishing area1977-84.
LaLanne, J. J. 1979. The validity and consistency of age determinationsfrom otoliths of Pacific pollock (Theraga chalcogramma). Int. NorthPac. Fish. Comm., Annu. Rep. 1977:99-107.
Nelson, R., Jr., R. French, and J. Wall. 1981. Sampling by U.S. observerson foreign fishing vessels in the eastern Bering Sea and Aleutian Islandsregion, 1977-78. U.S. Natl. Mar. Fish. Serv., Mar. Fish. Rev. 43(5):1-19.
Rigby, P. W. 1984. Alaskan domestic groundfish fishery for the years 1970through 1980 with a review of two historic fisheries--Pacific cod (Gadusmacrocephalus,) and Sablefish (Anoplopoma fimbria). Alaska Dep. FishGame, Tech. Data Rep. 108. 446 p.
Wall, J., R. French, and R. Nelson, Jr. 1981. Foreign fisheries in the Gulf ofAlaska, 1977-78. U.S. Natl. Mar. Fish. Serv., Mar. Fish. Rev. 43(5):20-35.

RESULTS OF ACOUSTIC-TRAWL SURVEYS FORWALLEYE POLLOCK IN THE GULF OF ALASKA IN 1986
Martin 0. Nelson and Edmund P. Nunnallee
INTRODUCTION
During March-April 1986, acoustic-trawl surveys of Gulf of Alaska walleyepollock (Theragra chalcogramma) stocks were conducted in Shelikof Straitusing the National Oceanic and Atmospheric Administration (NOAA) vesselMiller Freeman and in a major part of the gulf region outside of the straitby the Soviet research vessel Gissar. Three echo integrator-midwater trawlsurveys of the Shelikof spawning stock were completed. The survey periodswere : 1) March 5-12, 2) March 13-21, and 3) March 22-30. The surveys, whichwere comparable to those conducted in 1981 and 1983-85 (Nelson and Nunnallee1985; Nelson and Nunnallee 1986), were designed to provide age-specificbiomass and population estimates of the midwater (off-bottom) component ofthe pollock stock during that portion of the prespawning-spawning period whenthe abundance of adult fish was at a maximum. Another main objective of theShelikof surveys was to collect data on the in situ target strength (acousticreflectivity) of individual pollock using dual beam and split beam acousticsystems.
A highly qualitative echo sounder-trawl (midwater and bottom) survey ofthe area between Kodiak Island and Yakutat was conducted aboard the Gissarduring March 19-29 as part of an effort to determine the distribution andrelative abundance of spawning pollock in areas other than Shelikof Strait. Inaddition, the Gissar carried out an ichthyoplankton survey of the entire gulfarea approximately between Cape St. Elias and Unimak Pass, March 29-April 18.During this survey, trawl sampling was done opportunistically on concentrationsof pollock observed on the echo sounder.
This report presents the pollock abundance estimates obtained from the1986 Shelikof surveys and compares them with estimates from prior years. Italso describes the principal results of the Gissar's surveys.
SURVEY AND ANALYSIS METHODS
Shelikof Strait Surveys
Acoustic data were collected with a 38 kHz echo sounder interfaced tocomputer systems programmed to implement echo integration and target strengthdata collection (dual beam and split beam). The sounder's transducer washoused in a deadweight body that was towed at an average depth of approximately17 m. The entire acoustic system was calibrated before and after the surveys.Echo sign was sampled with a Diamond 1000 midwater trawl equipped with 6 ft x9 ft steel V doors and a cable netsounder system (the same trawl was used forall surveys conducted during 1981-85). Its vertical mouth opening was 15-18 mand the codend mesh size (stretched measure) was 3.8 cm.

16
Survey operations were conducted 24 hours per day along zig-zag tracklinepatterns which covered the area between the 91 m (50 fm) bottom depth contourson either side of the strait (Fig. 1). Each survey was run "down" the strait,i.e., in a NE. to SW. direction, and the average distance between adjacenttransects was approximately 5 nautical miles (nmi). Average vessel speed onthe tracklines was approximately 9 knots (kn). Echo integrator density esti-mates were obtained along each transect at 5-minute intervals for each of upto 30 non-overlapping depth strata between 15 m below the transducer and thebottom. Usually, targets located more than about 3 m above the bottom couldbe detected and distinguished from bottom echoes.
Midwater trawl hauls were made during each survey to provide data on thebiological composition of the pollock stock and on the occurrence and lengthdistributions of other midwater species. The distribution of trawl haulstations was roughly proportional to the relative abundance of pollock echosign. The duration of each haul depended on the density of the target echosign, the time required to accurately position the trawl, and the time necessary(based on interpretation of the netsounder echo display) to capture a sampleof fish large enough to satisfy biological sampling requirements. The averagetrawl towing speed was approximately 3 kn. Standard catch sorting andenumeration procedures were used to provide estimates of weight and numbersby species for each haul. The total catch was sorted, except when it exceededapproximately 2,500 lbs. Pollock length, sex, age (from otoliths) andmaturity composition data were obtained from a randomly selected sample, fromeach haul. Collections of individual pollock weight data were stratified bylength.
Pollock biomass estimates for each survey were determined by multiplyingthe average biomass density per unit surface area (kg/m2) by the survey area.The surface density estimates were calculated by summing volumetric densities(kg/m3) over depth. The echo integrator data were scaled to estimates ofabsolute density by using the following average target strength1/ estimates:1) -23 dB/kg for age-l pollock, 2) -27 dB/kg for age-2 fish, and 3) -31.3 dB/kgfor age-3 fish and older. Because species other than pollock occurred in minorquantities, no corrections were made for their contribution to the echointegrator output.
Age-specific biomass and population estimates and population lengthdistributions were calculated for each survey, using the total biomass estimate,length frequency data, a length-weight relationship, and an age-length key.The abundance estimation procedure and the methods used to estimate confidenceintervals for the total biomass estimates were basically the same as thosedescribed by Traynor and Nelson (1985).
Soviet Research Vessel Gissar Surveys
Echo sounder data (paper records and a color scope display) were obtainedusing a 25 kHz echo sounder-operated with a hull mounted transducer. Rough
1/ "Average target strengthi"is the target strength of the average scatteringcross section.

Figure l .--Acoustic survey tracklines and midwater trawl stations, 1986 Shelikof Strait pollock surveys.
18
estimates of relative density ("low," "medium," and "high") were made from anexamination of the paper records.
A rope trawl ("RT/TM 118") was used to sample midwater echo sign. Thistrawl had a vertical mouth opening of about 60 m with mesh sizes (stretchedmeasure) ranging from 80 cm forward to 3 cm in the codend. On-bottom samplingwas done with a trawl which had a 9 m vertical mouth opening and a codend linermesh size of about 2 cm. Both trawls were fished with 3.5 m oval steel doors.
During its first survey (March 19-291, the Gissar operated 24 hours perday along a parallel transect trackline that covered a bottom depth range of50 m to 750 m in the region between Kodiak Island and Yakutat. The distancebetween transects was usually 10 nmi and the survey was done at an averagevessel speed of 11 kn. Both midwater and bottom trawl hauls were made toidentify echo sign and provide biological information on pollock and otherspecies. The enumeration and sampling of trawl catches followed standardizedprocedures which were similar to those employed on the Miller Freeman duringthe Shelikof Strait survey.
During the Gissar's ichthyoplankton survey (March 29-April 181, trawlsampling was limited to relatively large concentrations of pollock observedon the echo sounder while traveling between stations. Also, estimates of therelative abundance of pollock were not obtained from the echo sounder recordscollected during the ichthyoplankton survey.
RESULTS OF SHELIKOF STRAIT SURVEYS
Sampling Effort and Species Composition of Trawl Catches
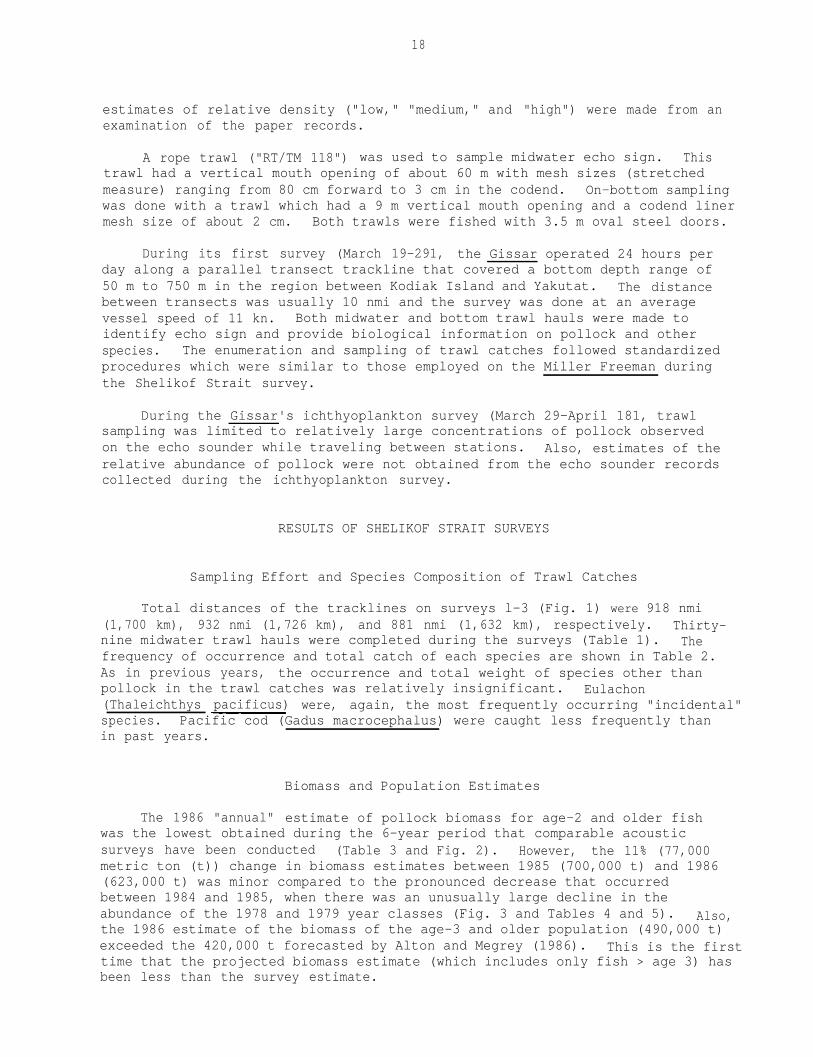
Total distances of the tracklines on surveys l-3 (Fig. 1) were 918 nmi(1,700 km), 932 nmi (1,726 km), and 881 nmi (1,632 km), respectively. Thirty-nine midwater trawl hauls were completed during the surveys (Table 1). Thefrequency of occurrence and total catch of each species are shown in Table 2.As in previous years, the occurrence and total weight of species other thanpollock in the trawl catches was relatively insignificant. Eulachon(Thaleichthys pacificus) were, again, the most frequently occurring "incidental"species. Pacific cod (Gadus macrocephalus) were caught less frequently thanin past years.
Biomass and Population Estimates
The 1986 "annual" estimate of pollock biomass for age-2 and older fishwas the lowest obtained during the 6-year period that comparable acousticsurveys have been conducted (Table 3 and Fig. 2). However, the 11% (77,000metric ton (t)) change in biomass estimates between 1985 (700,000 t) and 1986(623,000 t) was minor compared to the pronounced decrease that occurredbetween 1984 and 1985, when there was an unusually large decline in theabundance of the 1978 and 1979 year classes (Fig. 3 and Tables 4 and 5). Also,the 1986 estimate of the biomass of the age-3 and older population (490,000 t)exceeded the 420,000 t forecasted by Alton and Megrey (1986). This is the firsttime that the projected biomass estimate (which includes only fish > age 3) hasbeen less than the survey estimate.

19
Table 1 .--Midwater trawl haul station and catch data for 1986 Shelikof Strait pollock surveys.
T: Catch < 1 lb.

20
Table 2 .--Frequency of occurrence and total catch by species in 39 midwatertrawl hauls made during the 1986 Shelikof Strait pollock surveys.
21
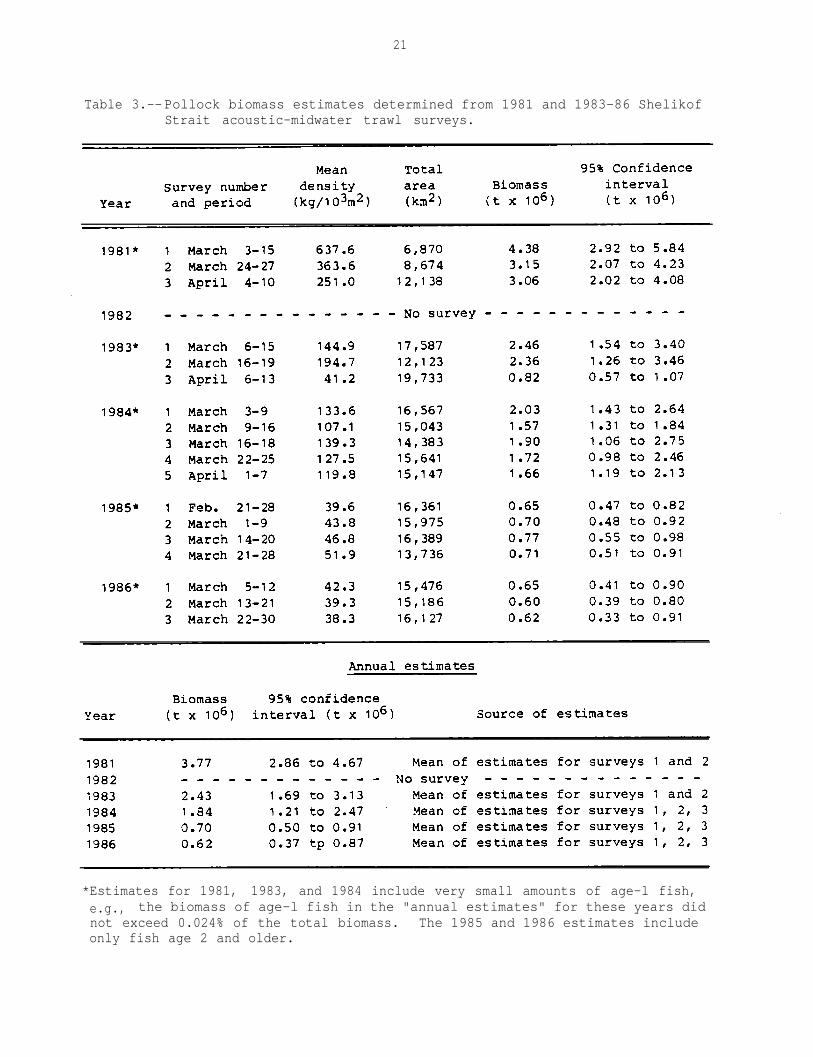
Table 3.--Pollock biomass estimates determined from 1981 and 1983-86 ShelikofStrait acoustic-midwater trawl surveys.
*Estimates for 1981, 1983, and 1984 include very small amounts of age-l fish,e.g., the biomass of age-l fish in the "annual estimates" for these years didnot exceed 0.024% of the total biomass. The 1985 and 1986 estimates includeonly fish age 2 and older.
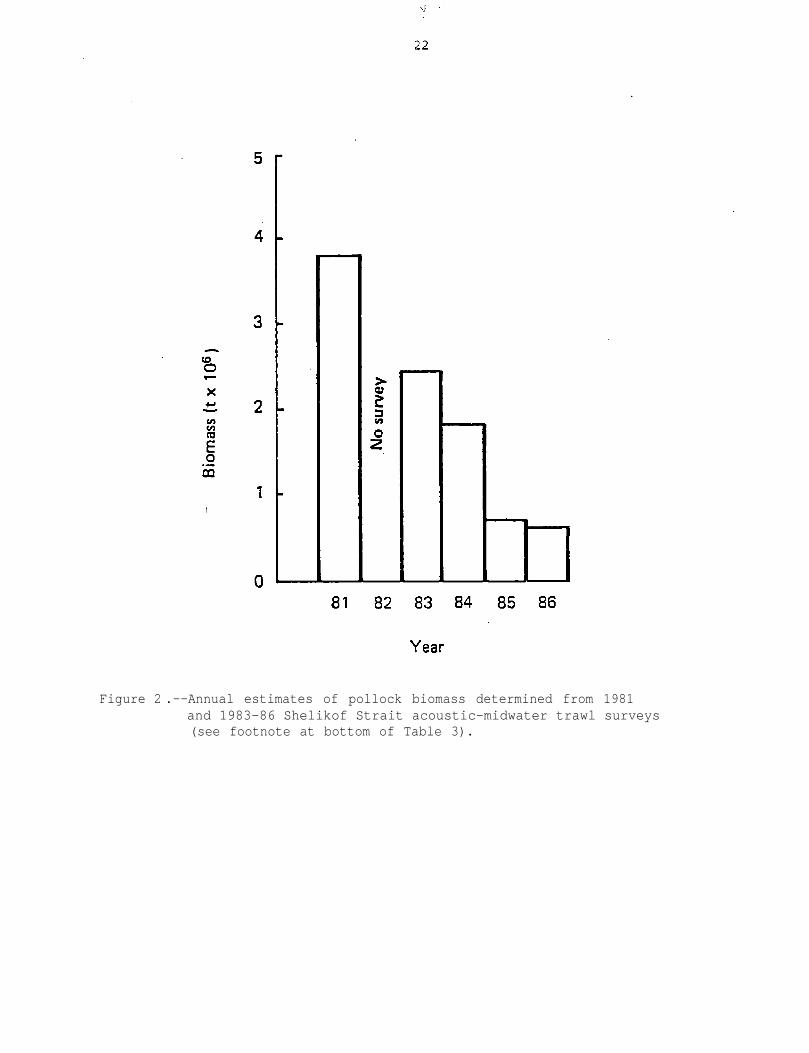
Figure 2 .--Annual estimates of pollock biomass determined from 1981and 1983-86 Shelikof Strait acoustic-midwater trawl surveys(see footnote at bottom of Table 3).
23
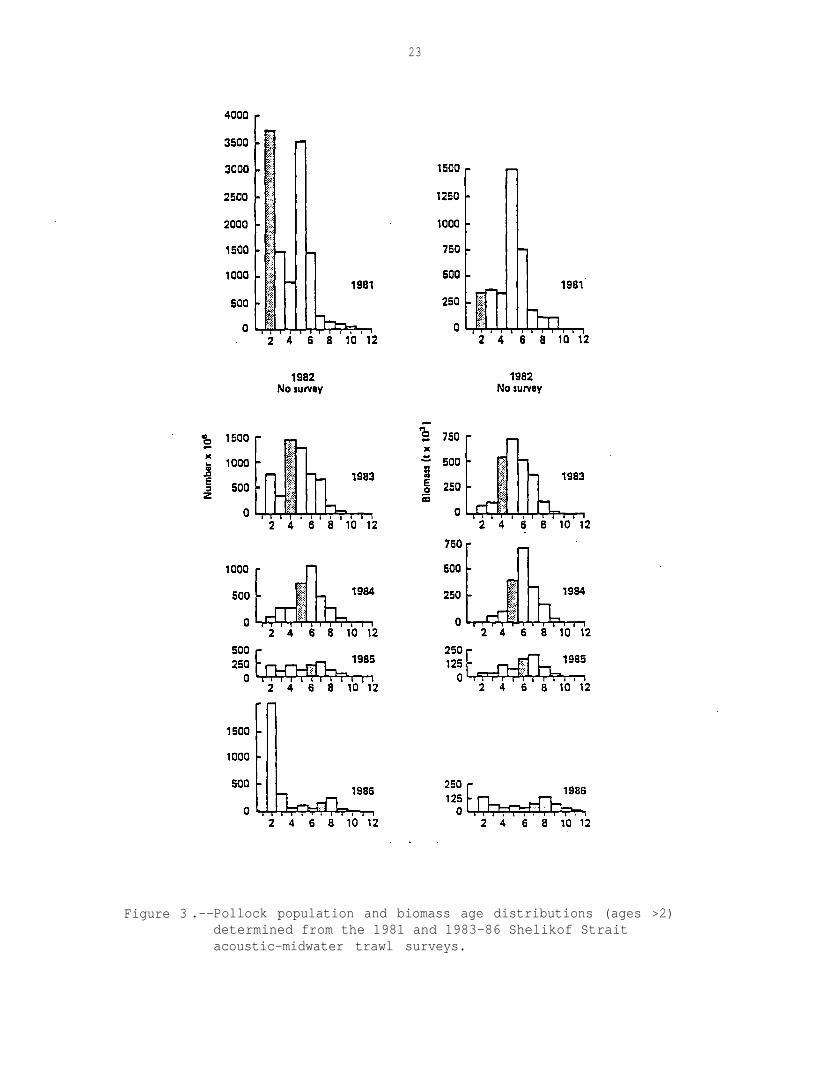
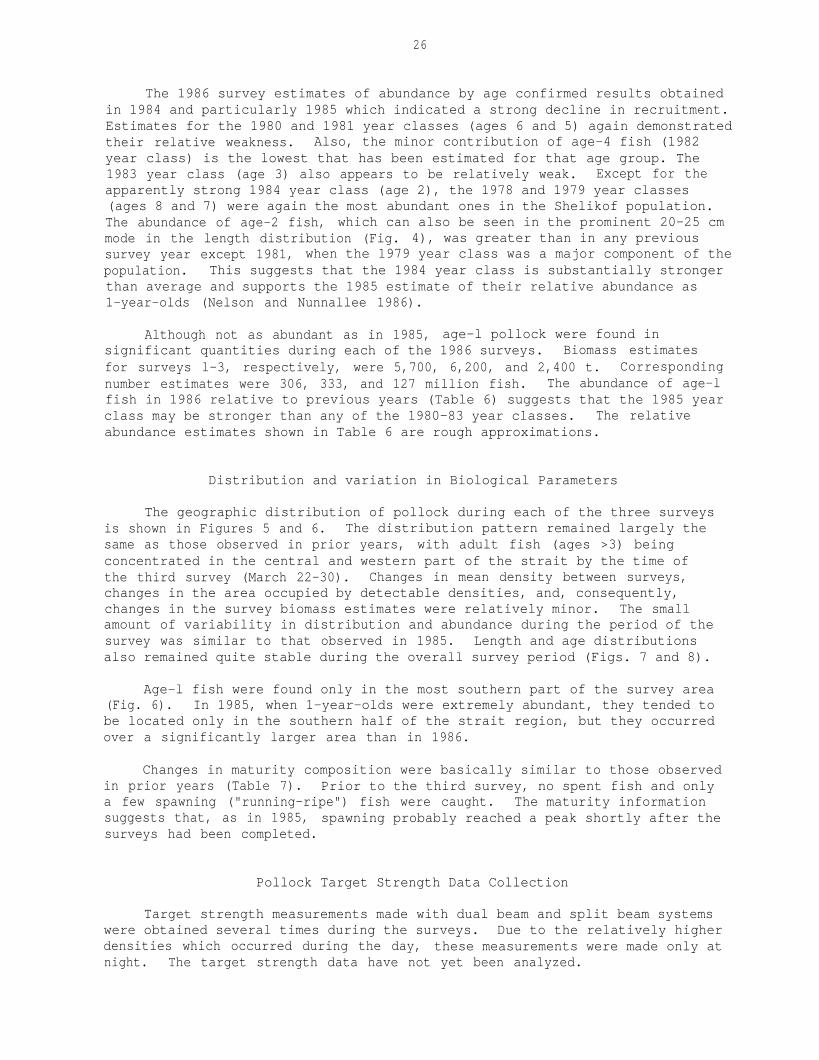
Figure 3 .--Pollock population and biomass age distributions (ages >2)determined from the 1981 and 1983-86 Shelikof Straitacoustic-midwater trawl surveys.
24

26
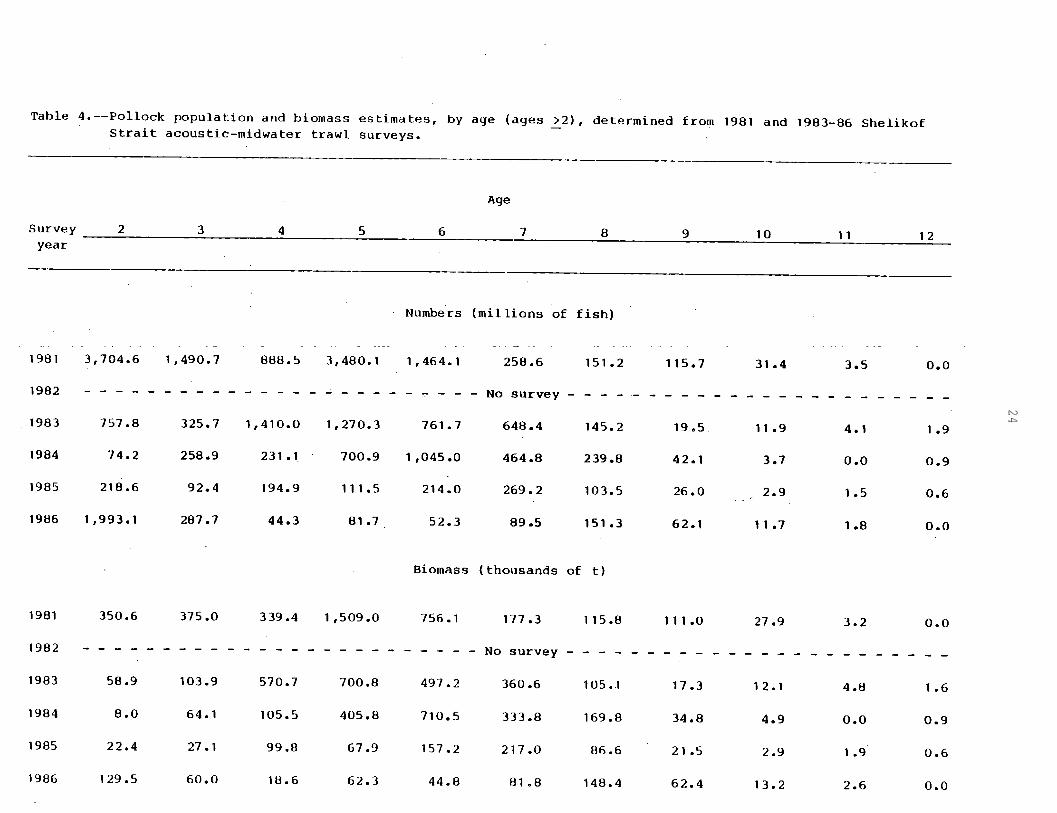
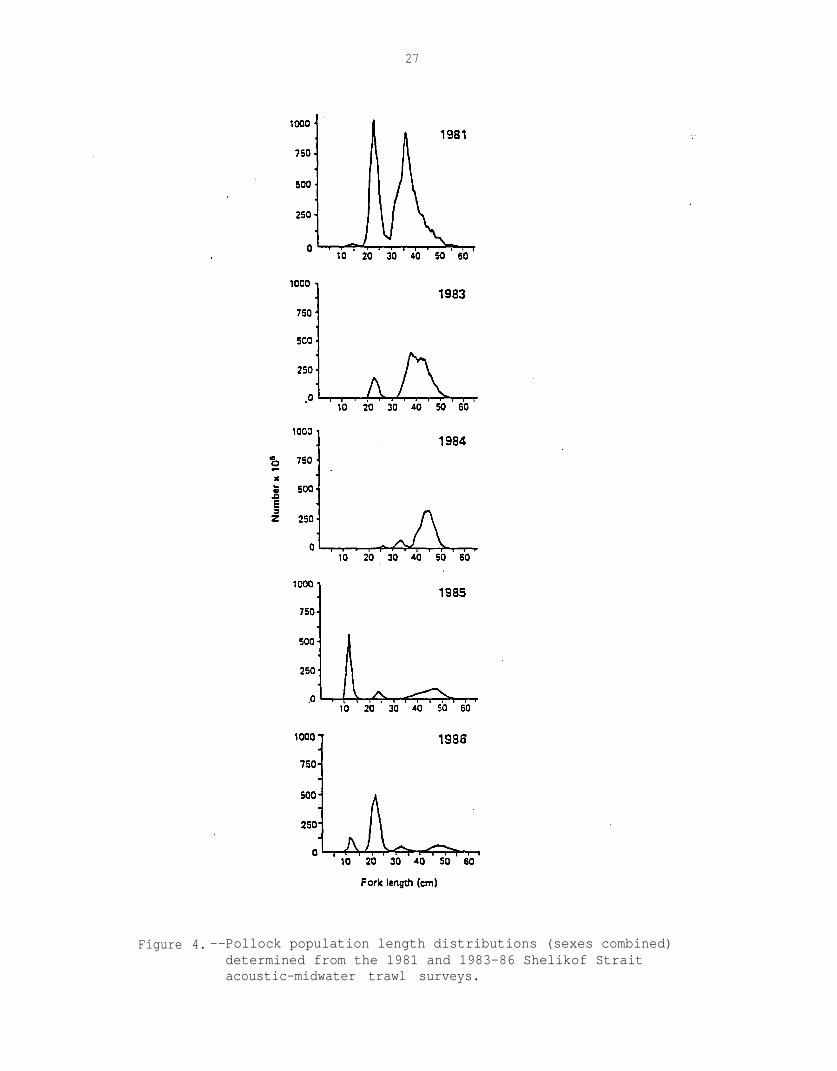
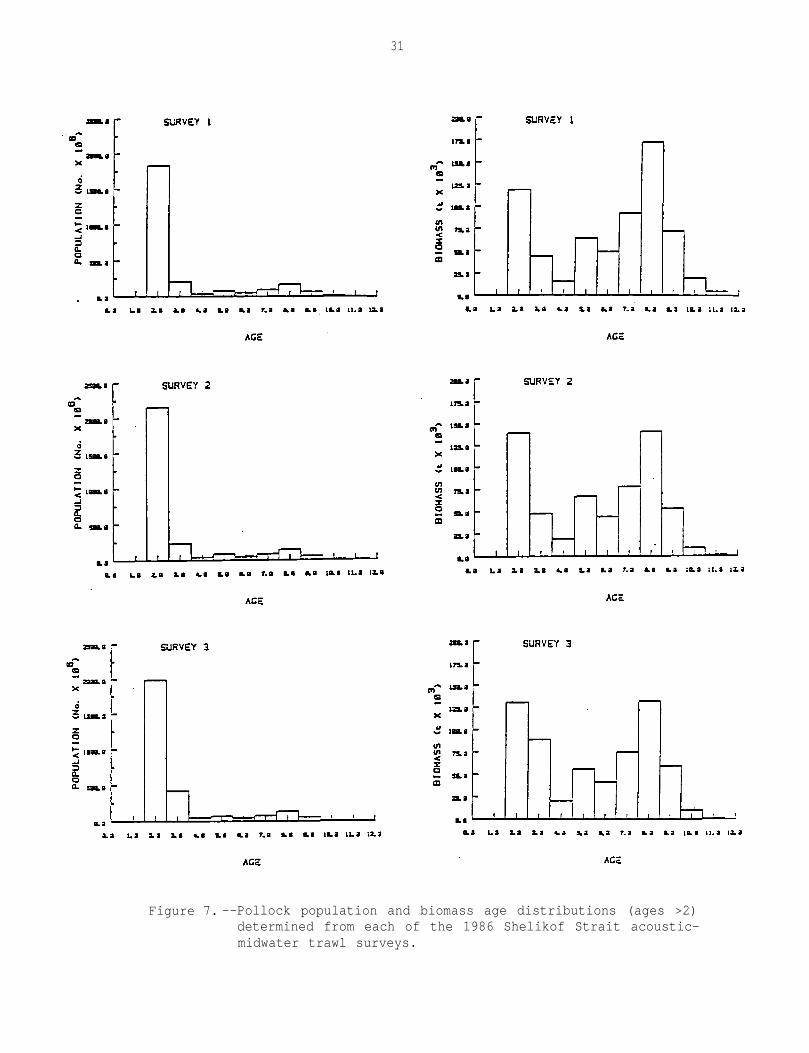
The 1986 survey estimates of abundance by age confirmed results obtainedin 1984 and particularly 1985 which indicated a strong decline in recruitment.Estimates for the 1980 and 1981 year classes (ages 6 and 5) again demonstratedtheir relative weakness. Also, the minor contribution of age-4 fish (1982year class) is the lowest that has been estimated for that age group. The1983 year class (age 3) also appears to be relatively weak. Except for theapparently strong 1984 year class (age 2), the 1978 and 1979 year classes(ages 8 and 7) were again the most abundant ones in the Shelikof population.The abundance of age-2 fish, which can also be seen in the prominent 20-25 cmmode in the length distribution (Fig. 4), was greater than in any previoussurvey year except 1981, when the 1979 year class was a major component of thepopulation. This suggests that the 1984 year class is substantially strongerthan average and supports the 1985 estimate of their relative abundance as1-year-olds (Nelson and Nunnallee 1986).
Although not as abundant as in 1985, age-l pollock were found insignificant quantities during each of the 1986 surveys. Biomass estimatesfor surveys l-3, respectively, were 5,700, 6,200, and 2,400 t. Correspondingnumber estimates were 306, 333, and 127 million fish. The abundance of age-lfish in 1986 relative to previous years (Table 6) suggests that the 1985 yearclass may be stronger than any of the 1980-83 year classes. The relativeabundance estimates shown in Table 6 are rough approximations.
Distribution and variation in Biological Parameters
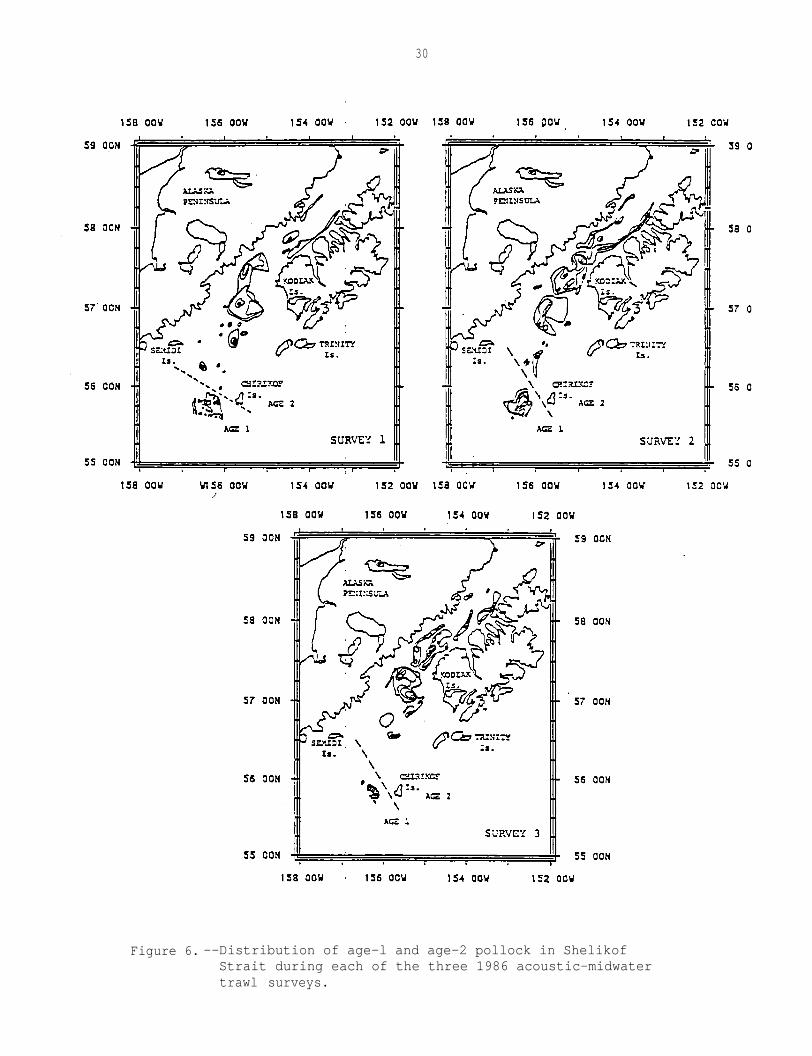
The geographic distribution of pollock during each of the three surveysis shown in Figures 5 and 6. The distribution pattern remained largely thesame as those observed in prior years, with adult fish (ages >3) beingconcentrated in the central and western part of the strait by the time ofthe third survey (March 22-30). Changes in mean density between surveys,changes in the area occupied by detectable densities, and, consequently,changes in the survey biomass estimates were relatively minor. The smallamount of variability in distribution and abundance during the period of thesurvey was similar to that observed in 1985. Length and age distributionsalso remained quite stable during the overall survey period (Figs. 7 and 8).
Age-l fish were found only in the most southern part of the survey area(Fig. 6). In 1985, when 1-year-olds were extremely abundant, they tended tobe located only in the southern half of the strait region, but they occurredover a significantly larger area than in 1986.
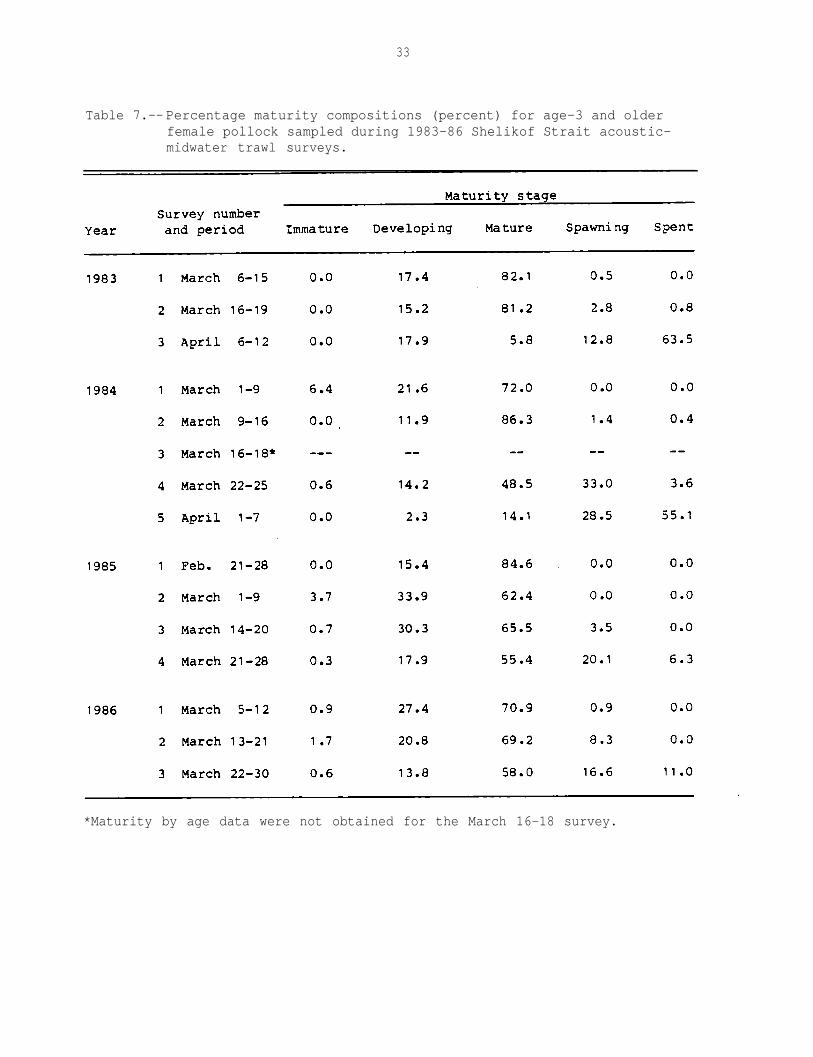
Changes in maturity composition were basically similar to those observedin prior years (Table 7). Prior to the third survey, no spent fish and onlya few spawning ("running-ripe") fish were caught. The maturity informationsuggests that, as in 1985, spawning probably reached a peak shortly after thesurveys had been completed.
Pollock Target Strength Data Collection
Target strength measurements made with dual beam and split beam systemswere obtained several times during the surveys. Due to the relatively higherdensities which occurred during the day, these measurements were made only atnight. The target strength data have not yet been analyzed.
27
Figure 4. --Pollock population length distributions (sexes combined)determined from the 1981 and 1983-86 Shelikof Straitacoustic-midwater trawl surveys.

28
Table 6 .--Relative abundance of age-l pollock determined fromShelikof Strait acoustic-midwater trawl surveys in1981 and 1983-86.

Figure 5 .--Distribution of adult pollock (ages >3) in ShelikofStrait during each of the three 1986 acoustic-midwatertrawl surveys.
30
Figure 6. --Distribution of age-l and age-2 pollock in ShelikofStrait during each of the three 1986 acoustic-midwatertrawl surveys.
31
Figure 7. --Pollock population and biomass age distributions (ages >2)determined from each of the 1986 Shelikof Strait acoustic-midwater trawl surveys.
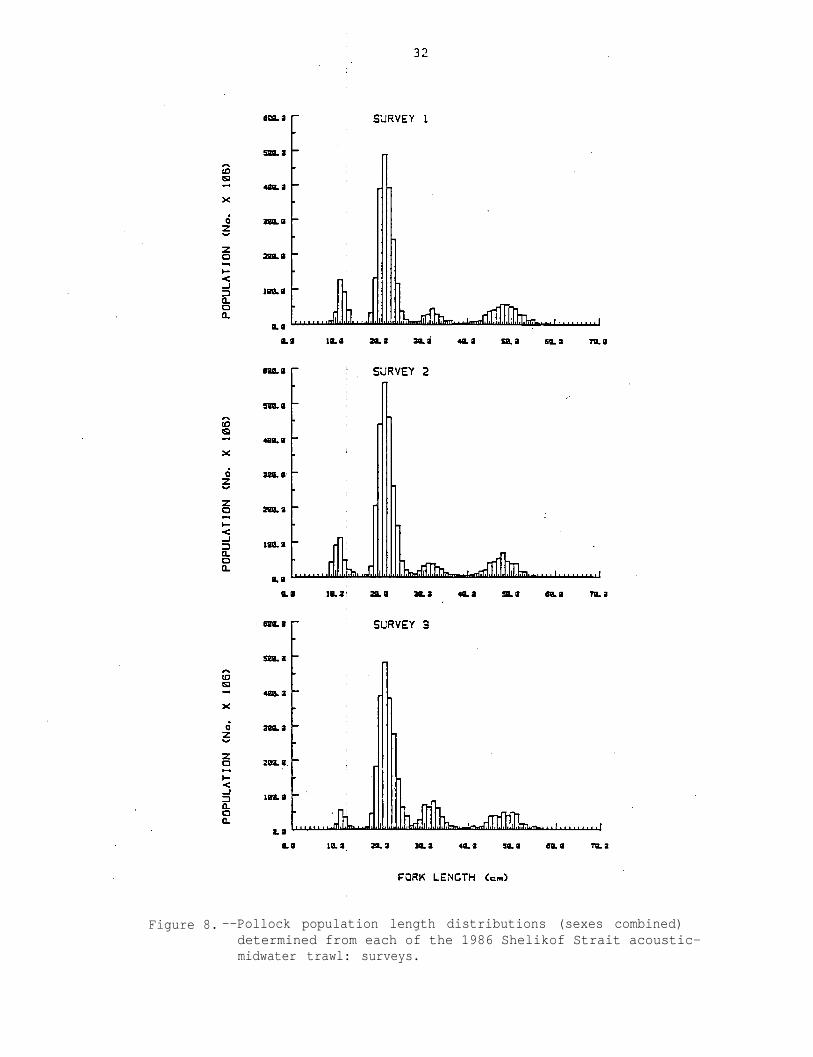
Figure 8. --Pollock population length distributions (sexes combined)determined from each of the 1986 Shelikof Strait acoustic-midwater trawl: surveys.
33
Table 7.-- Percentage maturity compositions (percent) for age-3 and olderfemale pollock sampled during 1983-86 Shelikof Strait acoustic-midwater trawl surveys.
*Maturity by age data were not obtained for the March 16-18 survey.

34
RESULTS OF SOVIET RESEARCH VESSEL GISSAR SURVEYS
The area covered by the Gissar's echo sounder survey and most of its trawlsampling is shown in Figure 9. Twenty-eight of 33 trawl hauls (Table 8) madeduring the two surveys were located in this area. The other five hauls,numbers 29-33 in Table 8, were made between Kodiak Island and Unimak Passduring the ichthyoplankton survey. The aggregations of echo sign outlined inFigure 9 indicate locations where pollock or other fish were detected inmidwater. The data from the Gissar's surveys, which were partially affectedby on-board sampling problems, are still being examined. The remainderof this section is a synopsis of the main results of the surveys.
No large concentrations of adult (ages > 3) pollock were found in thearea between Kodiak Island and Yakutat. There were only two significantmidwater trawl catches of adults in this area. These occurred southwest ofMiddleton Island (haul 7) and near Amatuli Trench (haul 25). Each of theother five midwater trawl catches of pollock in this area (hauls 1, 4, 5, 23,and 28) were mainly or entirely juvenile fish (ages 1 and 2). Small quanti-ties of adult fish were taken in five of the seven bottom trawl hauls. Itappears that most of the echo sign observed in the area between Kodiak Islandand Middleton Island was due to the presence of juvenile pollock (ages 1 and2). This is based on an examination of the echo signatures and the resultsof the midwater trawl sampling. Bottom trawl catches made in the areas whereconcentrations of echo sign were located in the eastern side of the gulf(hauls 12, 13, 15, and 16) indicate that the sign was due mainly to rockfish,particularly rougheye rockfish (Sebastes aleutianus) and Pacific ocean perch(Sebastes alutus).
Pollock were caught in each of the five midwater trawl hauls made duringthe ichthyoplankton survey between Kodiak Island and Unimak Pass. Three ofthe catches (hauls 30, 32, and 33) were entirely adult fish.
DISCUSSION
The results of the 1986 Shelikof pollock surveys were basically inagreement with forecasts of the abundance and age composition of the stock.Unlike the situation observed in previous years, the survey biomass estimateof 493,000 t for adult fish (ages > 3) exceeded by 17% the forecast estimate(420,000 t). The reason for this reversal in the trend for the biomassprojections to exceed the survey estimates is unknown. However, it may berelated to the fact that, since 1982, the Shelikof joint venture catch hasbecome an increasingly large fraction of the total Gulf of Alaska catch.Megrey and Alton (1986) speculated that the increasing importance of thejoint venture fishery relative to the foreign fishery may be one reason whydifferences between the acoustic survey and catch-at-age analysis estimatesof biomass decreased noticeably between 1983 and 1985. (The joint venturefishery is essentially a spring fishery, taking place at about the same timeand location as the acoustic surveys. The smaller foreign fishery does notsimilarly coincide with the acoustic surveys.) Although the agreement between
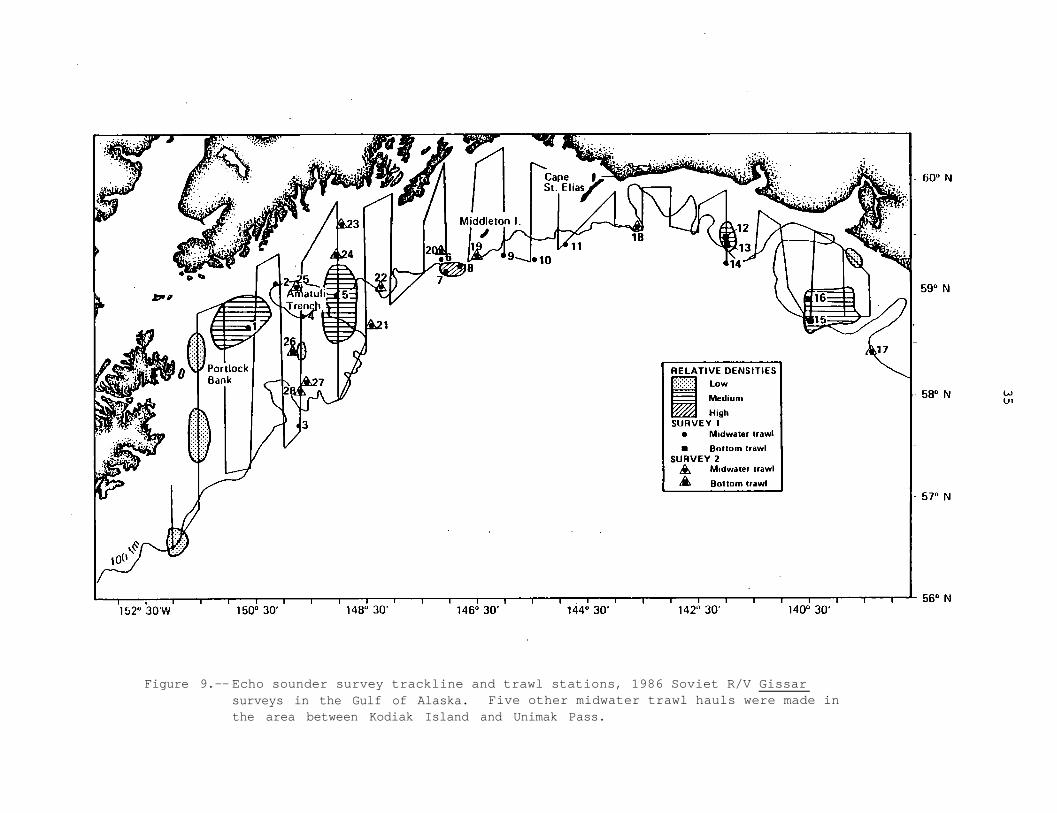
Figure 9.-- Echo sounder survey trackline and trawl stations, 1986 Soviet R/V Gissarsurveys in the Gulf of Alaska. Five other midwater trawl hauls were made inthe area between Kodiak Island and Unimak Pass.
36
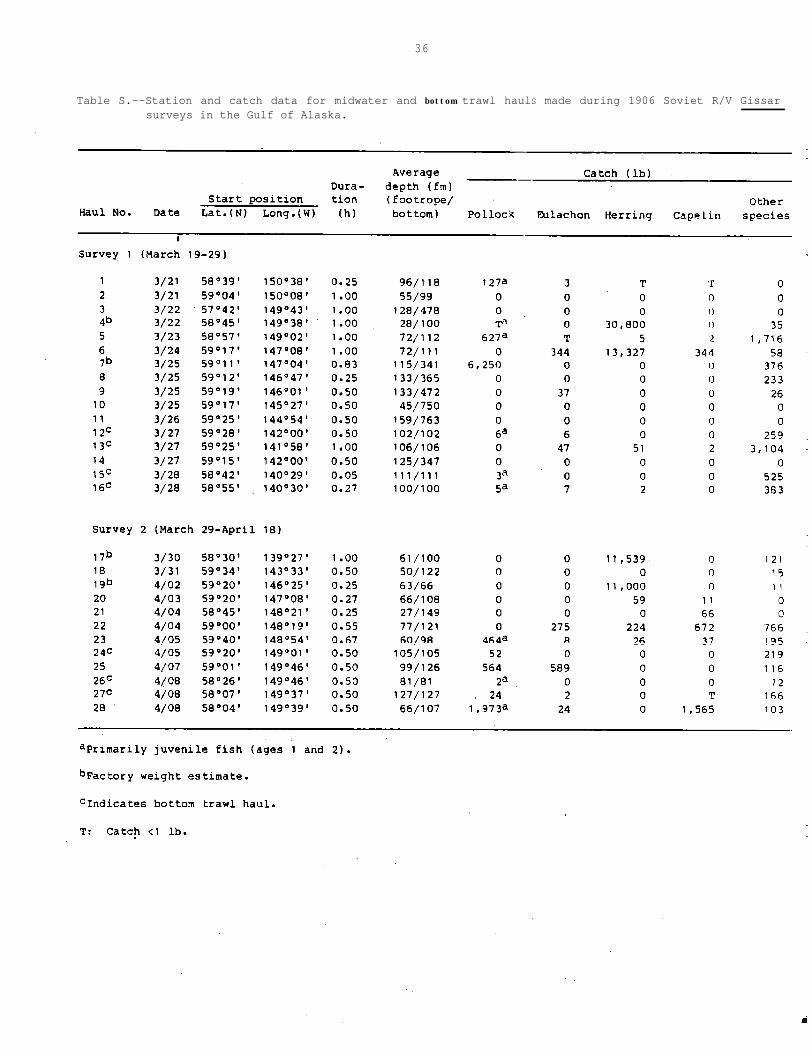
Table S.--Station and catch data for midwater and bottom trawl haulS made during 1906 Soviet R/V Gissarsurveys in the Gulf of Alaska.
37
survey and fishery-based analyses is relatively high, it is still apparentthat a basic issue affecting assessment and management of the gulf pollockresource is our lack of reliable information on the relationship between theShelikof stock and the total resource. The Gissar's survey results, likethose from other limited survey efforts conducted outside Shelikof Strait(Nelson and Nunnallee 1985), suggest that most of the spawning by westernGulf of Alaska pollock occurs in the strait. However, a more comprehensivesurvey of the gulf, including waters seaward of the Continental Shelf, isneeded to better define the stock structure and biology of gulf pollock.
As discussed by Nelson and Nunnallee (1985) and Nelson and Nunnallee(1986), improvements in acoustic survey techniques are needed to betterdefine the accuracy of the survey biomass estimates. In particular, it isimportant to obtain size-specific in situ estimates of pollock target strengthduring the surveys and to compare them to the estimates that have been usedto date. As indicated in this report, both dual beam and split beam measure-ments were obtained in 1986, and results of their analysis will be availablein 1987.
Research on Gulf of Alaska pollock in 1987 will include: 1) continuationof the Shelikof survey program in a manner comparable to that conducted in1986 (i.e., a series of surveys will be conducted in March); 2) analysis andfurther collection of pollock target strength data; and 3) more detailedanalysis of the pollock catch and biological data available from the Shelikofsurveys.

38
REFERENCES
Alton, M. S., and B. A. Megrey. 1986. Condition of the walleye pollockresource of the Gulf of Alaska as estimated in 1985. In R. L. Major(editor), Condition of groundfish resources of the Gulf of Alaskaas assessed in 1985, p. 51-77. U.S. Dep. Commer., NOAA Tech. Memo.NMFS F/NWC-106.
Megrey, B. A., and M. S. Alton. 1986. Condition of the walleye pollockresource of the Gulf of Alaska as estimated in 1986, p. 157. In R. L.Major (editor), Condition 'of groundfish resources of the Gulf of Alaskaregion as assessed in 1986. Northwest and Alaska Fisheries Center,National Marine Fisheries Service, NOAA, 7600 Sand Point Way NE., BINC15700, Bldg. 4, Seattle, WA 98115. (Document submitted to theInternational North Pacific Fisheries Commission in October, 1986.)
Nelson, M. O., and E. P. Nunnallee. 1985. Acoustic-midwater trawl surveysof spawning walleye pollock in the Shelikof Strait region, 1980-81and 1983-84. In R. L. Major (editor), Condition of groundfish resourcesof the Gulf of Alaska assessed in 1984, p. 179-206. U.S. Dep. Commer.,NOAA Tech. Memo. NMFS F/NWC-80.
Nelson, M. O., and E. P. Nunnallee. 1986. Results of acoustic-midwatertrawl surveys for walleye pollock in Shelikof Strait, 1985. InR. L. Major (editor), Condition of groundfish resources of the Gulfof Alaska region as assessed in 1985, p. 23-49. U.S. Dep. Commer.,NOAA Tech. Memo. NMFS F/NWC- 106.
Traynor, J. J., and M. 0. Nelson. 1985. Methods of the U.S. hydroacoustic(echo integrator-midwater trawl) survey. In R. G. Bakkala andK. Wakabayashi (editors), Results of cooperative U.S.-Japan groundfishinvestigation in the Bering Sea during May-August 1979, p. 30-34. Int.North Pac. Fish. Comm., Bull. 44.
39
CONDITION OF THE WALLEYE POLLOCK RESOURCEOF THE GULF OF ALASKA AS
ESTIMATED IN 1986
Bernard A. Megrey and Miles S. Alton
INTRODUCTION
We continue to treat the walleye pollock (Theragra chalcogramma) thatinhabit the western Gulf of Alaska (from the Fox Islands, 170° W. long., tothe vicinity of Prince William Sound, 147° W. long.) as one stock. Virtuallyall of the pollock catch from the Gulf of Alaska since 1982 has come fromthis region. Pollock in the eastern Gulf of Alaska (147° W. long. eastwardto Dixon Entrance) is considered a separate stock whose biomass was estimatedat 89,000 to 177,000 metric tons (t) from research surveys in the mid-1970s(Alton and Deriso 1983). Biomass of the western Gulf of Alaska stock hasdeclined to less than 500,000 t in 1986 from peak levels of over 2 million tin 1981-83 (Nelson and Nunnallee 1987, in this report). Biomass is expectedto increase in 1987.
Total removals from the stock have fallen from a peak of 306.7 thousand tin 1984 to 284.9 thousand t in 1985. Optimum yield (OY) was reduced by theNorth Pacific Fishery Management Council (NPFMC) to 100,000 t in 1986--116,000 tin the gulf overall (Table 1).
This report updates the assessment given by Alton and Megrey (1986) byproviding (1) the results of an age-structured analysis that include the mostrecent year (1985) of catch-at-age data, and (2) a 4-year forecast (1987-90)of annual abundance.
CHANGES IN ABUNDANCE DETERMINED FROM AGE-STRUCTURED ANALYSIS
The catch-at-age data set used as input data to this year's analysisconsists of estimates of pollock catch-at-age aggregated over all nations,vessel classes, and International North Pacific Fisheries Commission (INPFC)statistical areas, 1976-85. Also, fishery-independent data, consisting ofhydroacoustic biomass estimates of the Shelikof Strait spawning pollockpopulation for calendar years 1981, 1983, 1984, and 1985 (Nelson and Nunnallee1986), were incorporated into this year's analysis. A single set of averageweight-at-age values used in two previous analyses (Alton and Deriso 1983;Megrey 1985) were used in this analysis. These are shown below:
40
Table 1 .--Catch (1,000 t) of pollock in the Gulf of Alaska, by fisherycategory, 1977-86.
Year Foreign Joint venture Domestic Total
Sources: Foreign and joint venture catches 1977-84: Berger et al.(1986); 1985 and 1986: personal communication with Jerald Berger,U.S. Foreign Fisheries Observer Program, Northwest and AlaskaFisheries Center, National Marine Fisheries Service, NOAA, BinC15700, Building 4, 7600 Sand Point way NE., Seattle, WA 98115.Domestic catches 1978-80: Rigby (1984); 1981-86: Pacific FisheryInformation Network (PacFIN), Pacific Marine Fisheries Commission,305 State Office Building, 1400 SW. Fifth Avenue, Portland, OR97201.

41
Model Description and Methods
The CAGEAN separable, non-linear, log catch model (Deriso et al. 1985)was applied to the all-nation catch-at-age data using a constant naturalmortality rate of 0.4. All bootstrap means are based on 50 bootstrap replica-tions. Because the fishery changed in 1982 (Alton and Deriso 1983), the modelis configured to annually partition age-specific selectivities into a pre-1982(1976-81) group and a post-1982 (1982-85) group. For the pre-1982 group,selectivities are estimated for ages 3 to 6 over the period 1976-81. Ages7 to 10 are assumed to be fully recruited (i.e., selectivity = 1.0) over thepre-1982 period, so parameters for these selectivities are not estimated. Forthe post-1982 group,, selectivities for ages 3 to 6 are constrained to be equalto the 1976-81 values, while selectivities for ages 7 to 10 are allowed to beestimated from, the period 1982-85.
Deriso et al. (1987) discussed extensions to the CAGEAN model thatpermit the incorporation of fishery-independent data into the analysis. Oneof these extensions was implemented in this, year's analysis using populationbiomass estimates from hydroacoustic surveys.
Hydroacoustic population biomass estimates (Bh) for ages 3 to 10 wereused along with the catch biomass estimates (Bc) for ages 3 to 10 to calculatean annual full-recruitment exploitation fraction (u = Bc/Bh) for years 1981,1983, 1984, and 1985. Annual catch biomass estimates (Bc) were calculatedusing observed catch-at-age data (in numbers) multiplied by the averageweight-at-age values provided above. These calculated exploitation fractions,along with an estimate of natural mortality (M), are used to estimate theannual instantaneous full-recruitment fishing mortality rate (F) using theequation
Solutions for F from equation (1) are used as estimates of annual effective full-recruitment fishing effort in the effort-auxiliary sums of squares term of theCAGEAN model (see equation 9 in Deriso et al. 1985). This approach assumes thatthe relationship between fishing mortality and fishing effort is not exact. Inthis analysis the catchability coefficient is constrained to be equal to 1.0.
Annual effective-effort parameters estimated from the CAGEAN model canbe different from values calculated from equation (1). The degree of differencedepends on how strongly the effort-auxiliary sum of squares term is weighted.The weighting factor for the effort-auxiliary sum of squares term in thisyear's application was set to 0.5. This value is based on results of ananalysis of the sensitivity of the model output to the value of the weightingfactor.
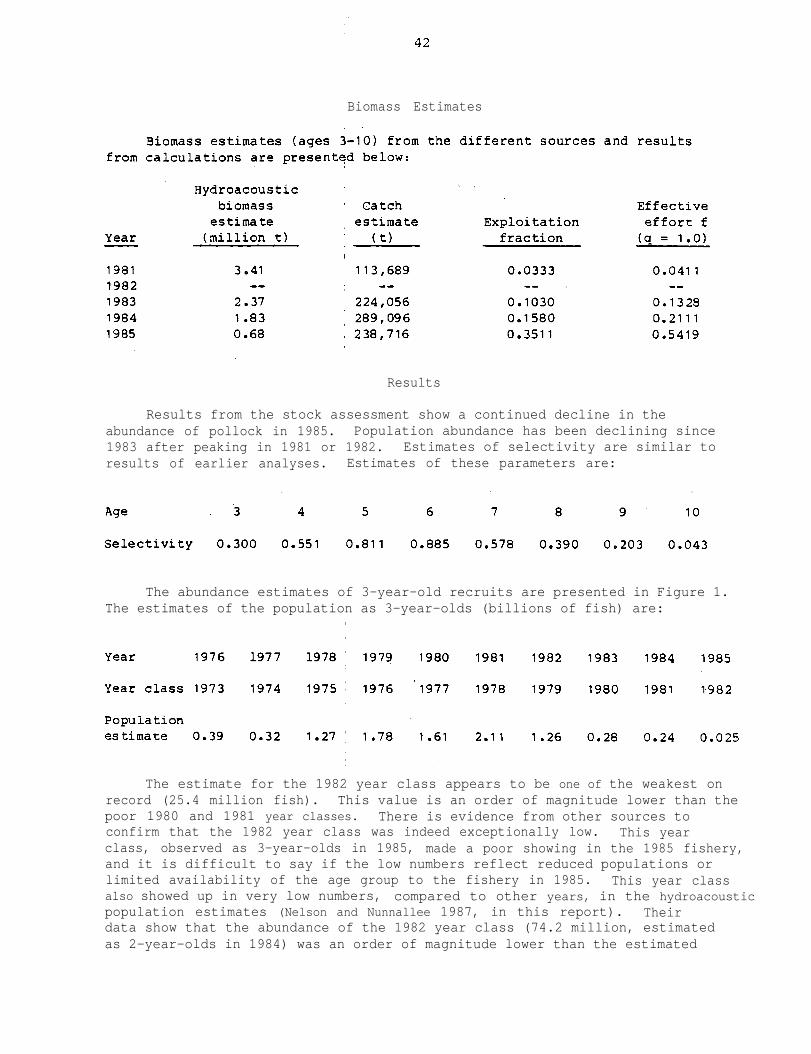
Biomass Estimates
Results
Results from the stock assessment show a continued decline in theabundance of pollock in 1985. Population abundance has been declining since1983 after peaking in 1981 or 1982. Estimates of selectivity are similar toresults of earlier analyses. Estimates of these parameters are:
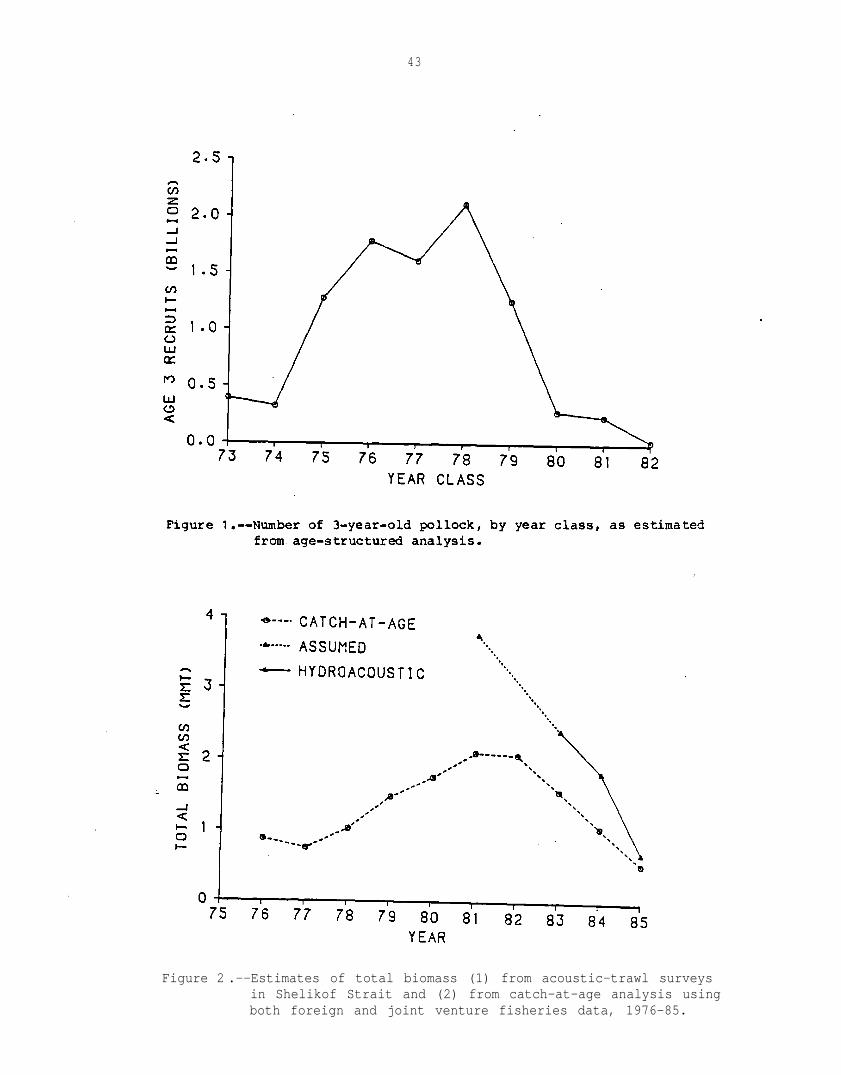
The abundance estimates of 3-year-old recruits are presented in Figure 1.The estimates of the population as 3-year-olds (billions of fish) are:
The estimate for the 1982 year class appears to be one of the weakest onrecord (25.4 million fish). This value is an order of magnitude lower than thepoor 1980 and 1981 year classes. There is evidence from other sources toconfirm that the 1982 year class was indeed exceptionally low. This yearclass, observed as 3-year-olds in 1985, made a poor showing in the 1985 fishery,and it is difficult to say if the low numbers reflect reduced populations orlimited availability of the age group to the fishery in 1985. This year classalso showed up in very low numbers, compared to other years, in the hydroacousticpopulation estimates (Nelson and Nunnallee 1987, in this report). Theirdata show that the abundance of the 1982 year class (74.2 million, estimatedas 2-year-olds in 1984) was an order of magnitude lower than the estimated
43
Figure 2 .--Estimates of total biomass (1) from acoustic-trawl surveysin Shelikof Strait and (2) from catch-at-age analysis usingboth foreign and joint venture fisheries data, 1976-85.
44
abundance of the 1981 year class (757.8 million estimated- as 2-year-olds in1983). Since 1984, when the 1982 year class was first observed as 2-year-olds,hydroacoustic population estimates from this year class as 3-year-olds in1985 and as 4-year-olds in 1986 have been far below estimates of the same agegroups in other years. The poor 1982 year class follows two back-to-back pooryear classes (1980 and 1981), thus contributing to the continual decline ofthe population biomass.
Estimates of total population biomass from the catch-at-age analysisagree well with independent hydroacoustic estimates (Fig. 2). The slopes ofthe decline from the two estimates over the 1983-84 period appear similar,but biomass estimates from catch-at-age analysis are lower than the hydroacousticestimates by an amount that is roughly constant. The estimates have all but con-verged in 1985.
FORECASTS OF ABUNDANCE: 1987-90
Projections of biomass (age 3 and older fish) in Shelikof Strait forearly 1987 and subsequent years are given for four recruitment scenarios andfive annual catch schedules. The projections were initiated using the 1986hydroacoustic-trawl survey estimate of biomass of age-3-and-older fish(490,000 t) and its age composition in numbers. Recruitment is defined as thenumber of 3-year-old fish present at the beginning of the year and is givenat three levels: 0.3 billion fish for poor recruitment, 0.9 billion fish foraverage recruitment, and 1.5 billion for strong recruitment. These levelswere approximated by averaging the population numbers of 3-year-olds estimatedfrom age-structured analysis (Fig. 1) for poor year classes (1973, 1974, 1980,and 1981), for strong year classes (1975-79), and for all year classes (1973-82). The levels for poor and average recruitment differed from those thatwere used in a previous forecast (Alton and Megrey 1986) where poor recruit-ment was 0.5 billion fish and average recruitment was 1.0 billion fish. Thenew levels reflect the results of the updated age-structured analysis presentedabove.
All four recruitment scenarios (Fig. 3) assume that the recruitment of the1983 year class in early 1986 was poor. For scenario A, recruitment is strongin 1987 (1984 year class) but only average for subsequent years (1988-90).That the 1984 year class is strong has so far been indicated by the exceptionalnumbers of this year class that have been found during the hydroacoustic-trawlsurveys in 1985 (l-year-olds) and in 1986 (2-year-olds) (Nelson and Nunnallee1987, in this report). For scenario B, however, the 1984 year class isconservatively set at average, and like scenario A, recruitment is average for1988-90. For both scenarios C and D recruitment is given as poor in 1989 and1990 because the recruiting 1986 and 1987 year classes were produced in yearswhen the spawning biomass was estimated to be low (1986) or projected to below (1987). We also assume that these biomasses are below the thresholdof levels having some likelihood of producing average-to-strong year classes.This will be discussed further in the following section. Other than thesepoor recruitment levels for 1989 and 1990, scenario C is identical to A, andD to B for the 1986-88 recruitment schedule (Fig. 3).
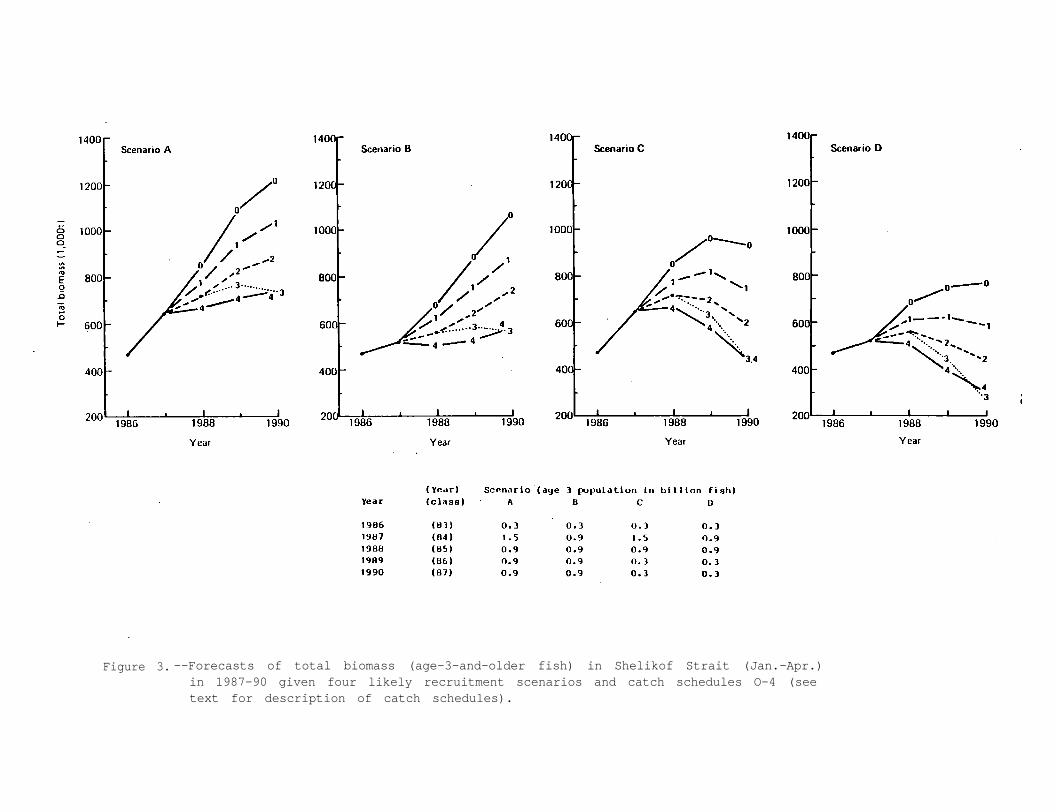
Figure 3. --Forecasts of total biomass (age-3-and-older fish) in Shelikof Strait (Jan.-Apr.)in 1987-90 given four likely recruitment scenarios and catch schedules O-4 (seetext for description of catch schedules).

46
For each scenario five projections were made, each having a differentannual catch schedule for years 1987-90. These schedules begin with a prelim-inary estimate of the 1986 catch and are as follows:
For all scenarios the biomass is expected to increase to 660,000 t in1987 if strong recruitment occurs or to 530,000 t if recruitment is onlyaverage. Beyond 1987 the biomass would continue to increase each year forthe most optimistic scenarios (A and B) and if the annual catch is 130,000 tor less (schedules 0 to 2). However, for the less optimistic scenarios thebiomass would markedly decline in 1989 and 1990 if annual catches followschedules 2 through 4. Even for the optimistic scenarios biomass would eithershow little gain, or even a loss, if catch schedules 3 and 4 are followed.The projections for 1988 and beyond have their value in showing the consequencesof catch levels set in 1987,
CONDITION OF STOCK
In the brief period for which we have estimates of changes in stock size,we have seen rapid rises as well as declines in biomass because of strong orweak pulses in recruitment. A series of weak year classes (1980-82 and possibly1983) contributed to the current decline in biomass. The decline was particu-larly sharp between 1984 and 1985 when the hydroacoustically assessed biomassdropped from 1,840,000 t to 700,000 t (Nelson and Nunnallee 1986). The bio-mass projection for 1985 (Alton and Rose 1985) was 1,200,000 t, an over-estimate of 71%. Alton and Megrey (1986) were not able to adequately explainthe discrepancy and discussed the possibility that a significant portion ofthe stock may not have been available for assessment in early 1985. Theseunavailable fish may have been near the sea bottom in Shelikof Strait beyondthe assessment reach of the hydroacoustical equipment or outside the ShelikofStrait area. Since the unavailable fish appeared to be mainly older fish, italso raised the possibility, that the decline was related to the older fishsuffering a higher natural mortality than estimated for the 1985 projection.
In contrast to the greatly overestimated 1985 projection, the 1986 projec-tion of 420,000 t (Alton and Megrey 1986) underestimated by 14% what was nydro-acoustically assessed (490,000 t). Projections so far have been consistentwith the acoustic assessment in terms of trends but inconsistent in theiraccuracy. Alton and Megrey (1986) forecasted that the 1986 biomass would bethe lowest on record, but that there would be an upswing in 1987 because ofthe likelihood of strong recruitment of the 1984 year class.
47
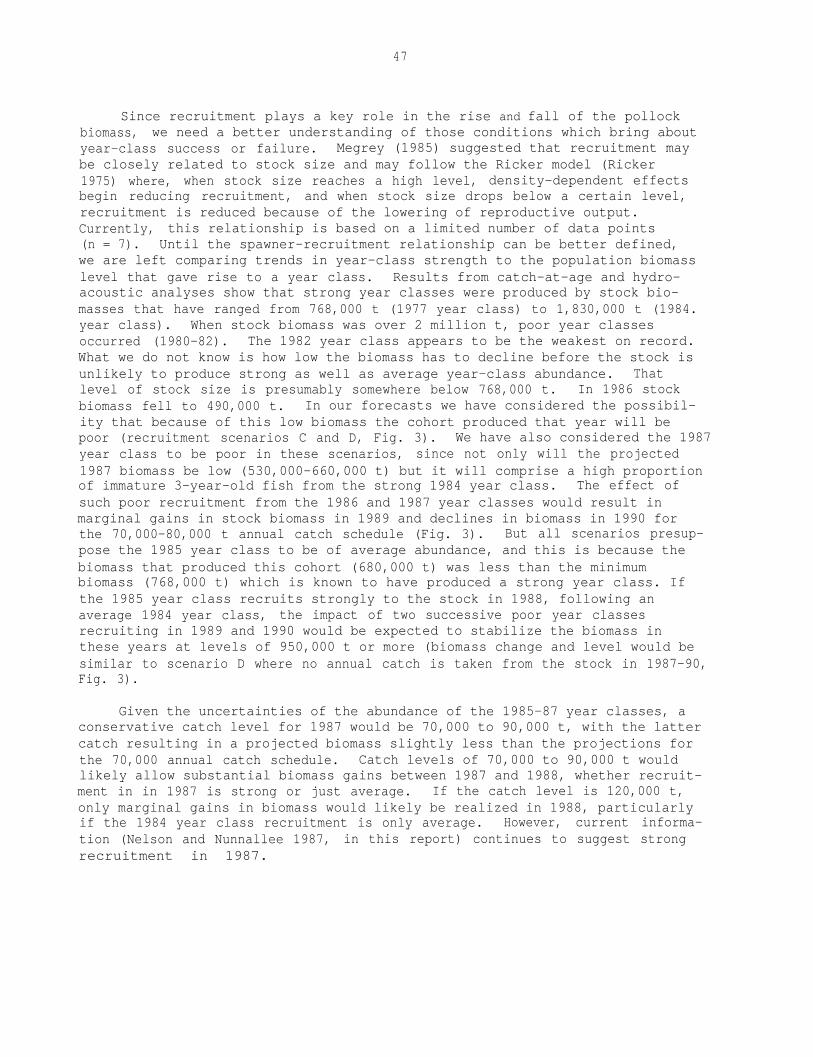
Since recruitment plays a key role in the rise and fall of the pollockbiomass, we need a better understanding of those conditions which bring aboutyear-class success or failure. Megrey (1985) suggested that recruitment maybe closely related to stock size and may follow the Ricker model (Ricker1975) where, when stock size reaches a high level, density-dependent effectsbegin reducing recruitment, and when stock size drops below a certain level,recruitment is reduced because of the lowering of reproductive output.Currently, this relationship is based on a limited number of data points(n = 7). Until the spawner-recruitment relationship can be better defined,we are left comparing trends in year-class strength to the population biomasslevel that gave rise to a year class. Results from catch-at-age and hydro-acoustic analyses show that strong year classes were produced by stock bio-masses that have ranged from 768,000 t (1977 year class) to 1,830,000 t (1984.year class). When stock biomass was over 2 million t, poor year classesoccurred (1980-82). The 1982 year class appears to be the weakest on record.What we do not know is how low the biomass has to decline before the stock isunlikely to produce strong as well as average year-class abundance. Thatlevel of stock size is presumably somewhere below 768,000 t. In 1986 stockbiomass fell to 490,000 t. In our forecasts we have considered the possibil-ity that because of this low biomass the cohort produced that year will bepoor (recruitment scenarios C and D, Fig. 3). We have also considered the 1987year class to be poor in these scenarios, since not only will the projected1987 biomass be low (530,000-660,000 t) but it will comprise a high proportionof immature 3-year-old fish from the strong 1984 year class. The effect ofsuch poor recruitment from the 1986 and 1987 year classes would result inmarginal gains in stock biomass in 1989 and declines in biomass in 1990 forthe 70,000-80,000 t annual catch schedule (Fig. 3). But all scenarios presup-pose the 1985 year class to be of average abundance, and this is because thebiomass that produced this cohort (680,000 t) was less than the minimumbiomass (768,000 t) which is known to have produced a strong year class. Ifthe 1985 year class recruits strongly to the stock in 1988, following anaverage 1984 year class, the impact of two successive poor year classesrecruiting in 1989 and 1990 would be expected to stabilize the biomass inthese years at levels of 950,000 t or more (biomass change and level would besimilar to scenario D where no annual catch is taken from the stock in 1987-90,Fig. 3).
Given the uncertainties of the abundance of the 1985-87 year classes, aconservative catch level for 1987 would be 70,000 to 90,000 t, with the lattercatch resulting in a projected biomass slightly less than the projections forthe 70,000 annual catch schedule. Catch levels of 70,000 to 90,000 t wouldlikely allow substantial biomass gains between 1987 and 1988, whether recruit-ment in in 1987 is strong or just average. If the catch level is 120,000 t,only marginal gains in biomass would likely be realized in 1988, particularlyif the 1984 year class recruitment is only average. However, current informa-tion (Nelson and Nunnallee 1987, in this report) continues to suggest strongrecruitment in 1987.

48
REFERENCES
Alton, M. S. 1986. Walleye pollock fisheries of the Gulf of Alaska, 1984-85.In R. L. Major (editor), Condition of groundfish resources of the Gulfof Alaska region as assessed in 1985, p. 1-21. U.S. Dep. Commer., NOAATech. Memo. NMFS F/NWC-106.
Alton, M., and R. Deriso. 1983. Pollock. In D. Ito and J. Balsiger (editors),Condition of groundfish resources of the Gulf of Alaska in 1982, p. l-62.U.S. Dep. Commer., NOAA Tech. Memo. NMFS F/NWC-52.
Alton, M. S., and B. A. Megrey. 1986. Condition of the walleye pollockresource of the Gulf of Alaska as estimated in 1985. In R. L. Major(editor), Condition of groundfish resources of the Gulf of Alaska regionas assessed in 1985, p. 51-77. U.S. Dep. Commer., NOAA Tech. Memo. NMFSF/NWC-106.
Berger, J. D., J. E. Smoker, and K. A. King. 1986. Foreign and joint venturecatches and allocations in the Pacific Northwest and Alaska fishing areaunder the Magnuson Fishery Management and Conservation Act, 1977-84.U.S. Dep. Commer., NOAA Tech. Memo. NMFS F/NWC-99, 53 p.
Deriso, R. B., T. J. Quinn II, and P. R. Neal. 1985. Catch-age analysiswith auxiliary information. Can. J. Fish. Aquat. Sci. 42(4):815-824.
Deriso, R. B., T. J. Quinn II, and P. R. Neal. 1987. Further aspects of thetheory of catch-age analysis with auxiliary information. Unpubl. manuscr.,9 P. Int. Pac. Halibut Comm., P.O. Box 95009, Seattle, WA. 98145-2009.
Megrey, B. A. 1985. Population dynamics of the Gulf of Alaska pollock:Preliminary results of an age-structured stock analysis and fishingpower study. In R. L. Major (editor), Condition of groundfish resourcesof the Gulf of Alaska region as assessed in 1985. Unpubl. manuscr.,p. 251-316. Northwest and Alaska Fish. Cent., Natl. Mar. Fish. Serv.,NOAA, 7600 Sand Point Way NE., BIN C15700, Bldg. 4, Seattle, WA 98115.(Document submitted to the annual meeting of the INPFC, Tokyo, Japan,October 1985.).
Nelson, M. O., and E. P. Nunnallee. 1986. Results of acoustic-midwater trawlsurveys for walleye pollock in Shelikof Strait, 1985. In R. L. Major(editor), Condition of groundfish resources of the Gulfof Alaska regionas assessed in 1985, p. 23-49. U.S. Dep. Commer., NOAA Tech. Memo. NMFSF/NW-106.
Nelson, M. O., and E. P. Nunnallee. 1987. Results of acoustic-trawl surveysfor walleye pollock in the Gulf of Alaska in 1986. In R. L. Major (editor),Condition of groundfish resources of the Gulf of Alaska region as assessedin 1986, p. 15-38. Dep. of Commer., NOAA Tech. Memo. NMFS F/NWC-119.
Ricker, W. E. 1975. Computation and interpretation of biological statisticsof fish populations. Bull. Fish. Res. Board Can. 191, 382 p.

49
Rigby, P. W. 1984. Alaskan domestic groundfish fishery for the years 1970through 1980 with a review of two historic fisheries--Pacific cod (Gadusmacrocephalus) and Sablefish (Anoplopoma fimbria). Alaska Dep. FishGame, Tech. Data Rep. 108. 446 p.

SABLEFISH-
2/Jeffrey T. Fujioka
INTRODUCTION
The sablefish (Anoplopoma fimbria) resource in the northeastern PacificOcean extends from northern Mexico to the Gulf of Alaska, westward to theAleutian Islands, and into the Bering Sea. This resource has been harvestedby U.S. and Canadian fishermen since the early 1900s, but catches were rela-tively small and generally limited to areas near fishing ports from Californiato southeastern Alaska. Annual catches in the Gulf of Alaska averaged about1,500 metric tons (t) in 1930-50, and exploitation rates remained low untilJapanese longliners began operations in the eastern Bering Sea in 1958. TheJapanese fishery expanded rapidly and took as much as 30,000 t in the BeringSea as early as 1962 (Narita 1983). The Japanese longline fleet expanded in1963 to the Aleutian Island region and the Gulf of Alaska. Catches rapidlyescalated until the record all-nation catch from the northeastern pacificOcean reached 67,000 t in 1972 and averaged about 50,000 t in 1973-76.
Evidence of declining stock abundance has led to significant fisheryrestrictions since 1977, and total catches have been reduced substantially.Until 1977, the majority of the sablefish harvest was taken from the Gulf ofAlaska. But beginning in 1978, regulations on foreign fleets in the Gulf ofAlaska, coupled with sharply increased U.S. effort off Washington-California,reduced the proportion of total sablefish harvested in the gulf. Catches in1978-83 averaged 13,695 t off Washington-California, 3,212 t off Canada, 612 tin the Aleutian Islands, 2,164 t in the Bering Sea, and 9,206 t in the Gulfof Alaska. Catches in the gulf have increased steadily since 1982 to approxi-mately 21,000 t in 1986.
FISHERY STATISTICS
A summary of the annual sablefish landings from the Gulf of Alaska, bynation, is given in Table 1. The harvest was first expanded in 1963 by theaddition of the Japanese trawl fisheries. The reported landings exceeded15,000 t in 1968, corresponding to the start of the Japanese longline fishery.
1/This report is a revised update of Fujioka (1986).
2/Auke Bay Laboratory, Northwest and Alaska Fisheries Center, National MarineFisheries Service, NOAA, P.O. Box 210155, Auke Bay, AK 99821.

52
Table 1 .--Catch (t) of sablefish (Anoplopoma fimbria) in the Gulf of Alaska,by nation, 1958-86.
Year U.S. Canada Japan U.S.S.R. ROKa Total
aRepublic of Korea.bIncludes 250 t by Taiwan.CIncludes 1,048 t by Taiwan.dIncludes 55 t by Mexico and 18 t by joint venture fisheries.eIncludes 20 t by joint venture fisheries.fIncludes 4 t by Poland.gIncludes 1 t by joint venture fisheries.hIncludes 275 t by joint venture fisheries.rIncludes 528 t by joint venture fisheries and 8 t by Poland.jIncludes 675 t caught by freezer boats and landed in Washington state and174 t taken in Prince William Sound. Neither catch was reported to PacFIN.
kIncludes 226 t by joint venture fisheries.lIncludes 45 t by joint venture fisheries (PacFin report no. 002, 12 March1987).
Sources: 1958-83: Stauffer (1985); 1984-86: Pacific Fishery Information Network(PaCFIN), Pacific Marine Fisheries Commission, 305 State Office Building, 1400 SW.Fifth Avenue, Portland; OR 97201; 1985 (catches in footnote j): personalcommunication with Fritz Funk, Alaska-Department of Fish and, Game, P.O. Box3-2000, Juneau, AK 99802.
53
Catches peaked in 1972 at 37,503 t and averaged 27,715 t in 1973-76. Incompliance with the Magnuson Fishery Conservation and Management Act, catchquotas were first implemented in 1977. The foreign harvest of sablefish hassince declined from 15,961 t in 1977 to 38 t in 1985 and 1 t in 1986. U.S.domestic harvests in 1976-82 averaged 2,113 t, but increased to 9,122 t by1984 (including 528 t taken by joint venture fisheries). The domestic sable-fish fishery completely replaced the directed foreign fishery in the NorthPacific Fishery Management Council (NPFMC) Central and Eastern RegulatoryAreas by 1984 and nearly so in the NPFMC Western Regulatory Area in 1985.The U.S. domestic harvest climbed to 12,441 t in 1985 although the jointventure catch (which is included) decreased from 528 to 226 t. The U.S.domestic harvest in 1986 increased to 20,793 t, of which only 45 t was takenby joint venture fisheries.
During its existence, the directed foreign sablefish fishery in the Gulfof Alaska was regulated to the use of longline gear. Allowance for incidentalcatches of sablefish in trawls continued, and in 1979-84 the incidentalcatches were 686 t, 1,422 t, 919 t, 540 t, 514 t, and 371 t, respectively(average 742 t). Domestic sablefish gear in the gulf through 1983 consistedalmost exclusively of longlines. Trap gear caught 105 t in 1984 and 2,141 tin 1985 (18% of the gulf-wide domestic catch). The longline fishery harvested77% of the domestic catch in 1985, and the remaining 5% was harvested primarilyby the trawl fishery (Table 2). In 1986, the longline fishery harvestedroughly 75% of the domestic catch; the trawl fishery, 16%; and trap gear, 10%(Table 3).
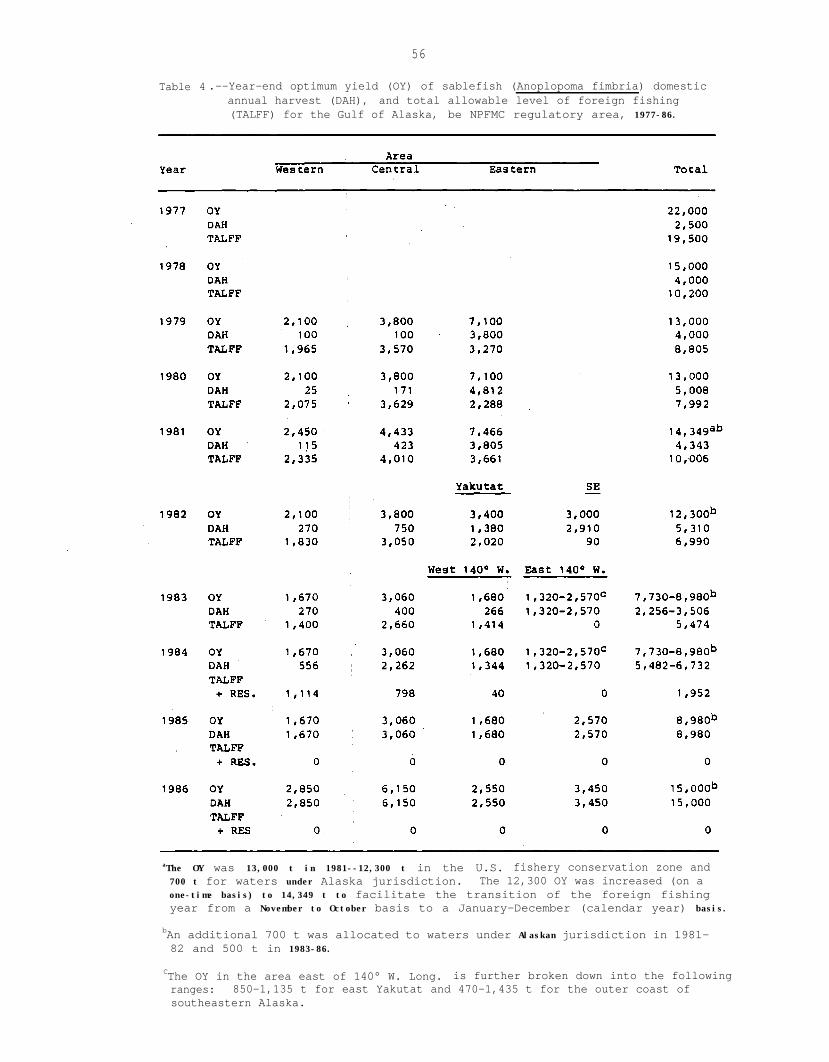
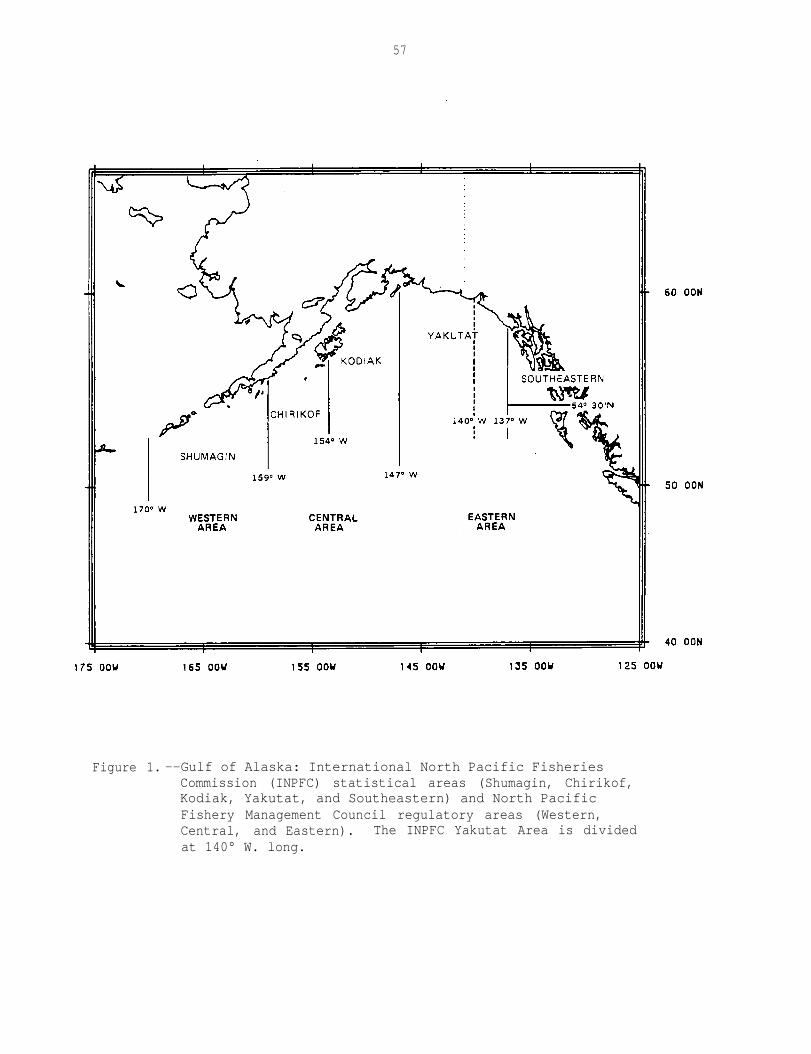
The gulf-wide optimum yield (OY) was set at 22,000 t in 1977 (Table 4).The OY was reduced to 15,000 t in 1978 and 13,000 t in 1979 by the implementa-tion of the fishery management plan (FMP) for the Gulf of Alaska groundfishfishery. Furthermore, the OY was prorated-- 2,100 t to the Western RegulatoryArea (International North Pacific Fisheries Commission (INPFC) ShumaginStatistical Area), 3,800 t to the Central Regulatory Area (INPFC Chirikof andKodiak Areas), and 7,100 t to the Eastern Regulatory Area (INPFC Yakutat andSoutheastern Areas). The 1981 OY was 13,000 t (12,300 t in the fisheryconservation zone (FCZ) and 700 t in waters under Alaskan jurisdiction).Temporarily, the 12,300 t in the FCZ was increased by 16.7% and the seasonwas expanded to 14 months to make the reporting and calendar years coincide.In 1982, for the first time, the NPFMC Eastern Regulatory Area OY of 6,400 twas partitioned into the INPFC Yakutat and southeastern Areas. Gulf-wide,the OY remained at 13,000 t. Amendment 11 to the FMP in 1983 established OYat 8,230 to 9,480 t, 75% of equilibrium yield (ZY). To allocate OY, theEastern Regulatory Area was repartitioned in 1983 into subareas east and westof 140° W. long. The subarea west of 140° W. long. consists of the westernpart of the INPFC Yakutat Area, and the subarea east of 140° W. long. consistsof the eastern portion of the INPFC Yakutat Area and the portion of the INPFCSoutheastern Area lying outside Alaskan jurisdiction. The subarea east of140° W. long., although considered as a single area in terms of OY allocation,is managed as two areas--East Yakutat and Southeastern (Fig. 1). The 1983 OYwas maintained in 1984 and 1985. The OY was increased in 1986 to 15,000 tand allocated to the regulatory areas in proportion to the estimated biomassat depths >400 m: 2,850 t to the Western Regulatory Area, 6,150 t to theCentral Regulatory Area, and 6,000 t to the Eastern Regulatory Area.
54
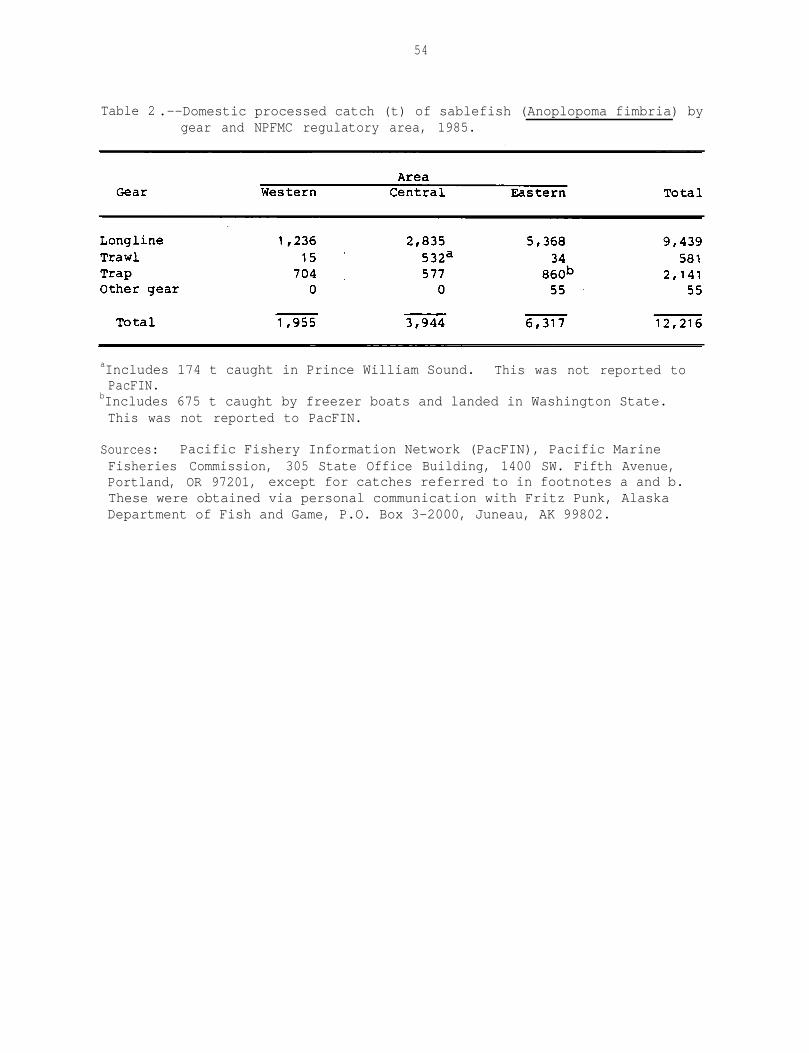
Table 2 .--Domestic processed catch (t) of sablefish (Anoplopoma fimbria) bygear and NPFMC regulatory area, 1985.
aIncludes 174 t caught in Prince William Sound. This was not reported toPacFIN.
bIncludes 675 t caught by freezer boats and landed in Washington State.This was not reported to PacFIN.
Sources: Pacific Fishery Information Network (PacFIN), Pacific MarineFisheries Commission, 305 State Office Building, 1400 SW. Fifth Avenue,Portland, OR 97201, except for catches referred to in footnotes a and b.These were obtained via personal communication with Fritz Punk, AlaskaDepartment of Fish and Game, P.O. Box 3-2000, Juneau, AK 99802.

55
Table 3 .--Domestic catch (t) of sablefish (Anoplopoma fimbria) in the Gulf ofAlaska, by gear and NPFMC regulatory area, 1986.
Source: Pacific Fishery Information Network (PacFIN), Pacific Marine FisheriesCommission, 305 State Office Building, 1400 SW. Fifth Avenue, Portland, OR97201 (report no. 124, 16 February 1987).
56
Table 4 .--Year-end optimum yield (OY) of sablefish (Anoplopoma fimbria) domesticannual harvest (DAH), and total allowable level of foreign fishing(TALFF) for the Gulf of Alaska, be NPFMC regulatory area, 1977-86.
aThe OY was 13,000 t in 1981--12,300 t in the U.S. fishery conservation zone and700 t for waters under Alaska jurisdiction. The 12,300 OY was increased (on aone-time basis) to 14,349 t to facilitate the transition of the foreign fishingyear from a November to October basis to a January-December (calendar year) basis.
bAn additional 700 t was allocated to waters under Alaskan jurisdiction in 1981-82 and 500 t in 1983-86.
CThe OY in the area east of 140° W. Long. is further broken down into the followingranges: 850-1,135 t for east Yakutat and 470-1,435 t for the outer coast ofsoutheastern Alaska.
57
Figure 1. --Gulf of Alaska: International North Pacific FisheriesCommission (INPFC) statistical areas (Shumagin, Chirikof,Kodiak, Yakutat, and Southeastern) and North PacificFishery Management Council regulatory areas (Western,Central, and Eastern). The INPFC Yakutat Area is dividedat 140° W. long.
58
Annual landings averaged 72% of the OY each year for 6 years immediatelyfollowing 1976. Domestic landings during this same period averaged 54% ofthe expected domestic annual harvest (DAH). Foreign landings exceeded theinitial allocations of total allowable level of foreign fishing (TALFF) but,of the final allocations, averaged 87% and, in 1983, equaled 91%. The U.S.harvest exceeded the DAH for the first time in 1983 and exceeded the DAH,which had been increased, in 1984. The U.S. fishery received (and eventuallyexceeded) the entire OY in 1985 and 1986.
CONDITION OF THE STOCKS
Stock Structure
Experiments to identify sablefish stocks in the Gulf of Alaska continue.Scientists from the National Marine Fisheries Service (NMFS), the AlaskaDepartment of Fish and Game (ADF&G), Japan, and Canada have released taggedsablefish over the past several years. There is disagreement on the degreeof interchange of fish between regions. Wespestad et al. (1983) reportedthat interregional migration is small in comparison to stock size within eachregion, and agreed with previous reports (Low et al. 1976; Wespestad et al.1978) that management of the resource is best conducted by geographicregion. Bracken (1982), however, described an analysis of gulf-wide sablefishtagging data and suggested that sablefish move extensively throughout theGulf of Alaska. His analysis showed that fish <60 cm fork length (FL) tendedto move westward, whereas those 260 cm FL tended to migrate eastward.
Fujioka and Shaw (1985) also studied the movement of sablefish in theGulf of Alaska. In a preliminary summary, the numbers of tagged fish releasedin each INPFC area in 1978-82 and recovered in the INPFC Southeastern Area in1979-83 were adjusted by dividing the number recovered by the number (in1,000s) released per area and year. These "release-adjusted" recoveriesyielded an estimate of the composition of recoveries in the INPFC SoutheasternArea that would have resulted if 1,000 tagged fish had been released annuallyin each INPFC area. On this basis, 54 to 69% of the recoveries in the INPFCSoutheastern Area were from other INPFC areas.
Bracken (1982) also presented a conceptual model that identified south-eastern Alaska and British Columbia as a pooling area for large fish andshowed that much of the spawning is in that region. Small fish inhabit theshallow nearshore areas and then enter deep water in their third or fourthyear. From there, a significant portion of the fish migrate to the openocean and move westward until reaching maturity. A large portion of themature fish then migrate back into the eastern gulf to spawn. Bracken (1982)concluded by recommending management of sablefish as a single gulf-widestock with OY prorated over all regulatory areas, and suggested that lowerharvest levels throughout the gulf would speed rebuilding of the depletedspawning population in the INPFC Southeastern Area.
Beamish and McFarlane (1983) concluded from their tagging studies that alarge portion of juvenile sablefish reared in Queen Charlotte Sound andHecate Strait, British Columbia, move north to Gulf of Alaska waters.
59
Conversely, most tagged adult sablefish were recovered close to the releasearea, indicating that the adult population is composed of subpopulations orgroups. Based on these results, Beamish and McFarlane (1983) contended thatadult sablefish in the Canadian zone should be managed separately and shouldnot be managed as a part of one large stock off the west coast of NorthAmerica. In a review of U.S. tagging studies, Dark (1983) found apparentlysimilar northward movement of small (40-65 cm FL) sablefish released offAlaska and Washington but less movement of fish >65 cm FL.
Gharrett et al. (1983) reexamined electrophoretic data on sablefish.Their new interpretation suggested that some geographic separation of geneti-cally distinct stocks exists. They separated eight Gulf of Alaska collections(excluding seamount samples) into groups with major divisions at KodiakIsland, about 140° W. long. in the INPFC Yakutat Area, and in the vicinity ofCape Addington in the INPFC Southeastern Area.
Tagged fish released by NMFS from southeastern Alaska inside waters inChatham Strait and recovered in outside waters generally are not caught northof the entrance to Chatham Strait, but are caught south as far as the INPFCCharlotte Statistical Area off British Columbia.3/
Currently, management of sablefish in the Gulf of Alaska is by fivemanagement regions: the NPFMC Western and Central Regulatory Areas, thewestern and eastern portions of the Eastern Regulatory Area, and the portionof INPFC Southeastern Area not under Alaskan jurisdiction. Clearly, thequestions of migration and stock structure, basic to rational management ofsablefish, are yet unresolved.
Year-Class Strength
Year-class strength is an important consideration in studying the dynamicsof fish populations. The examination of fish length data (mean fork lengthsand length frequency distributions) is, in turn, one way of monitoring thestrength of year classes. Several sources provided length data on the sablefishpopulation in the Gulf of Alaska--the Japanese longline fishery, 1969-83; theNMFS trap indexing surveys in southeastern Alaska, 1978-86; the Japan-U.S.cooperative longline surveys, 1979-85; and the 1984 triennial survey (theU.S.-Japan cooperative bottom trawl survey in the central and western gulfand complementary surveys in the eastern gulf).
Several authors (Balsiger and Alton 1981; Sasaki 1982; McFarlane and.Beamish 1983; Funk and Bracken 1984) have reported strong recruitment fromthe 1977 year class. The 1979 NMFS trap indexing survey (Fig. 2) providedone of the first opportunities to observe the emergence of the 1977 yearclass--as a mode in the length frequency distribution at 45-50 cm FL. Themode moves to the right (increases) with time and, by 1983, either dominates
3/- Personal communication with Michael Sigler, Auke Bay Laboratory, Northwest
and Alaska Fisheries Center, National Marine Fisheries Service, NOAA, P.O.Box 210155, Auke Bay, AK 99821.

Figure 2.--Length frequency distribution of sablefish (Anoplopoma fimbria) in
National Marine Fisheries Service trap-indexing surveys in the Gulfof Alaska, 1978-86.
61
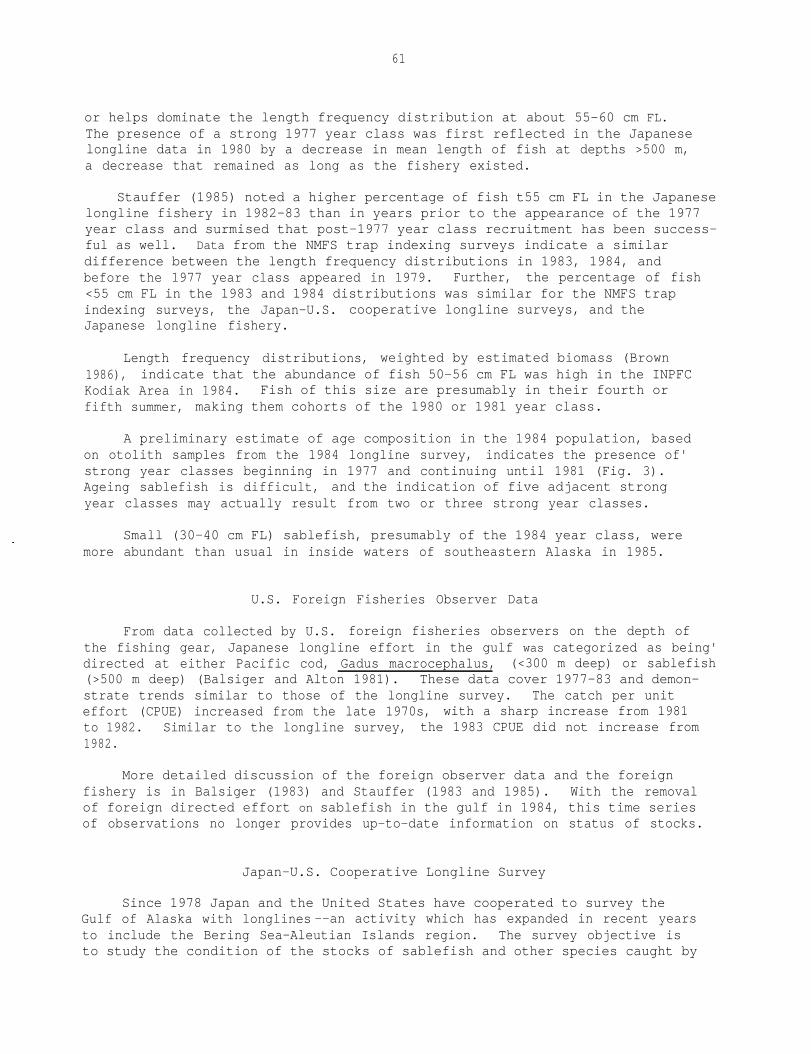
or helps dominate the length frequency distribution at about 55-60 cm FL.The presence of a strong 1977 year class was first reflected in the Japaneselongline data in 1980 by a decrease in mean length of fish at depths >500 m,a decrease that remained as long as the fishery existed.
Stauffer (1985) noted a higher percentage of fish t55 cm FL in the Japaneselongline fishery in 1982-83 than in years prior to the appearance of the 1977year class and surmised that post-1977 year class recruitment has been success-ful as well. Data from the NMFS trap indexing surveys indicate a similardifference between the length frequency distributions in 1983, 1984, andbefore the 1977 year class appeared in 1979. Further, the percentage of fish<55 cm FL in the 1983 and 1984 distributions was similar for the NMFS trapindexing surveys, the Japan-U.S. cooperative longline surveys, and theJapanese longline fishery.
Length frequency distributions, weighted by estimated biomass (Brown1986), indicate that the abundance of fish 50-56 cm FL was high in the INPFCKodiak Area in 1984. Fish of this size are presumably in their fourth orfifth summer, making them cohorts of the 1980 or 1981 year class.
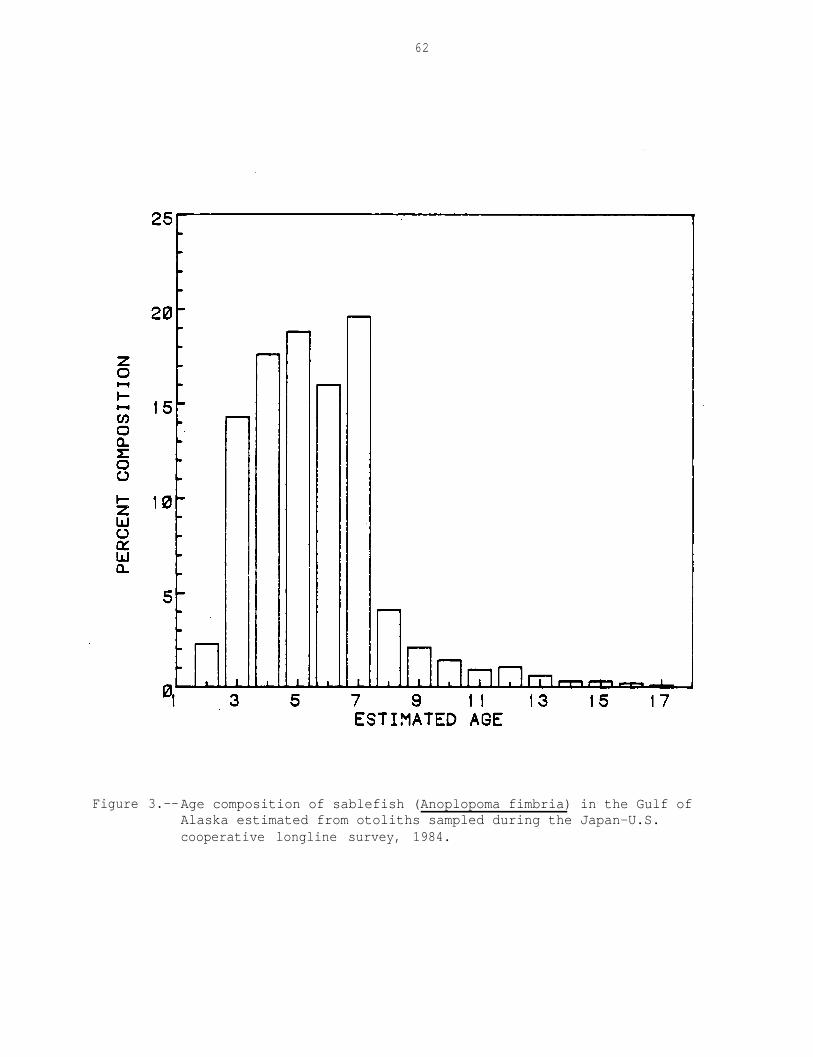
A preliminary estimate of age composition in the 1984 population, basedon otolith samples from the 1984 longline survey, indicates the presence of'strong year classes beginning in 1977 and continuing until 1981 (Fig. 3).Ageing sablefish is difficult, and the indication of five adjacent strongyear classes may actually result from two or three strong year classes.
Small (30-40 cm FL) sablefish, presumably of the 1984 year class, weremore abundant than usual in inside waters of southeastern Alaska in 1985.
U.S. Foreign Fisheries Observer Data
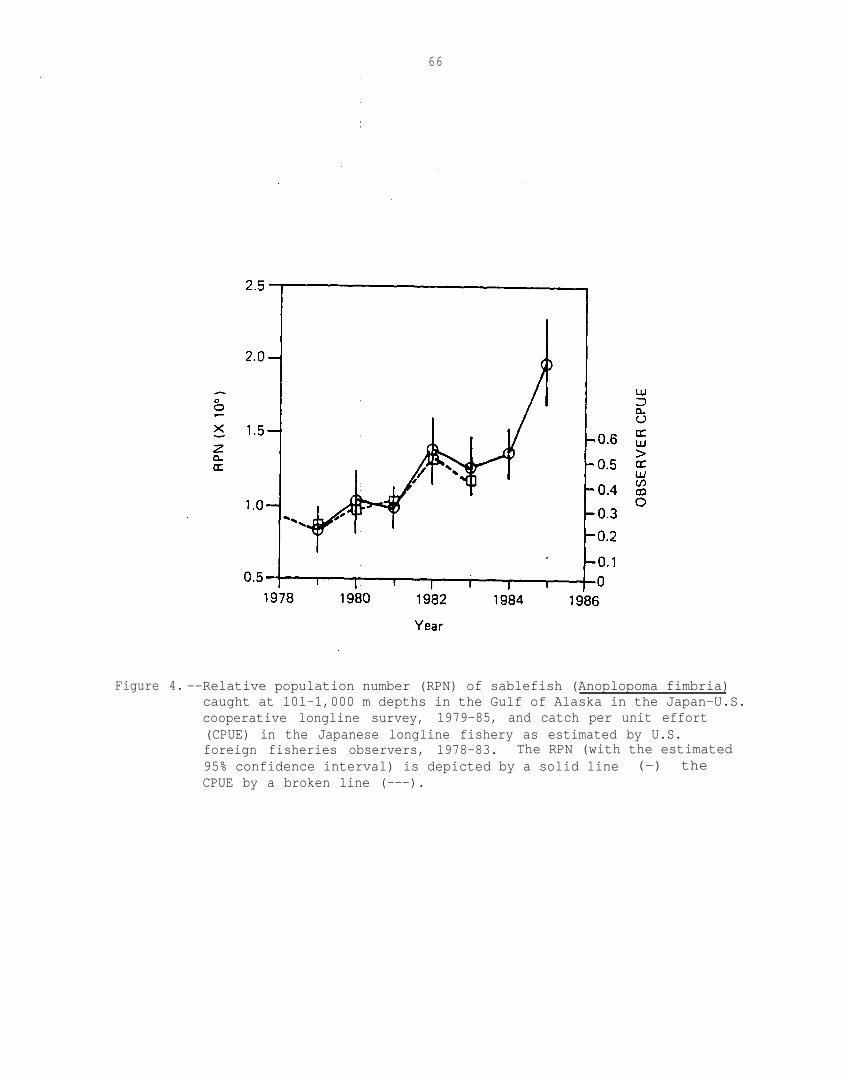
From data collected by U.S. foreign fisheries observers on the depth ofthe fishing gear, Japanese longline effort in the gulf was categorized as being'directed at either Pacific cod, Gadus macrocephalus, (<300 m deep) or sablefish(>500 m deep) (Balsiger and Alton 1981). These data cover 1977-83 and demon-strate trends similar to those of the longline survey. The catch per uniteffort (CPUE) increased from the late 1970s, with a sharp increase from 1981to 1982. Similar to the longline survey, the 1983 CPUE did not increase from1982.
More detailed discussion of the foreign observer data and the foreignfishery is in Balsiger (1983) and Stauffer (1983 and 1985). With the removalof foreign directed effort on sablefish in the gulf in 1984, this time seriesof observations no longer provides up-to-date information on status of stocks.
Japan-U.S. Cooperative Longline Survey
Since 1978 Japan and the United States have cooperated to survey theGulf of Alaska with longlines --an activity which has expanded in recent yearsto include the Bering Sea-Aleutian Islands region. The survey objective isto study the condition of the stocks of sablefish and other species caught by
62
Figure 3.--Age composition of sablefish (Anoplopoma fimbria) in the Gulf ofAlaska estimated from otoliths sampled during the Japan-U.S.cooperative longline survey, 1984.

63
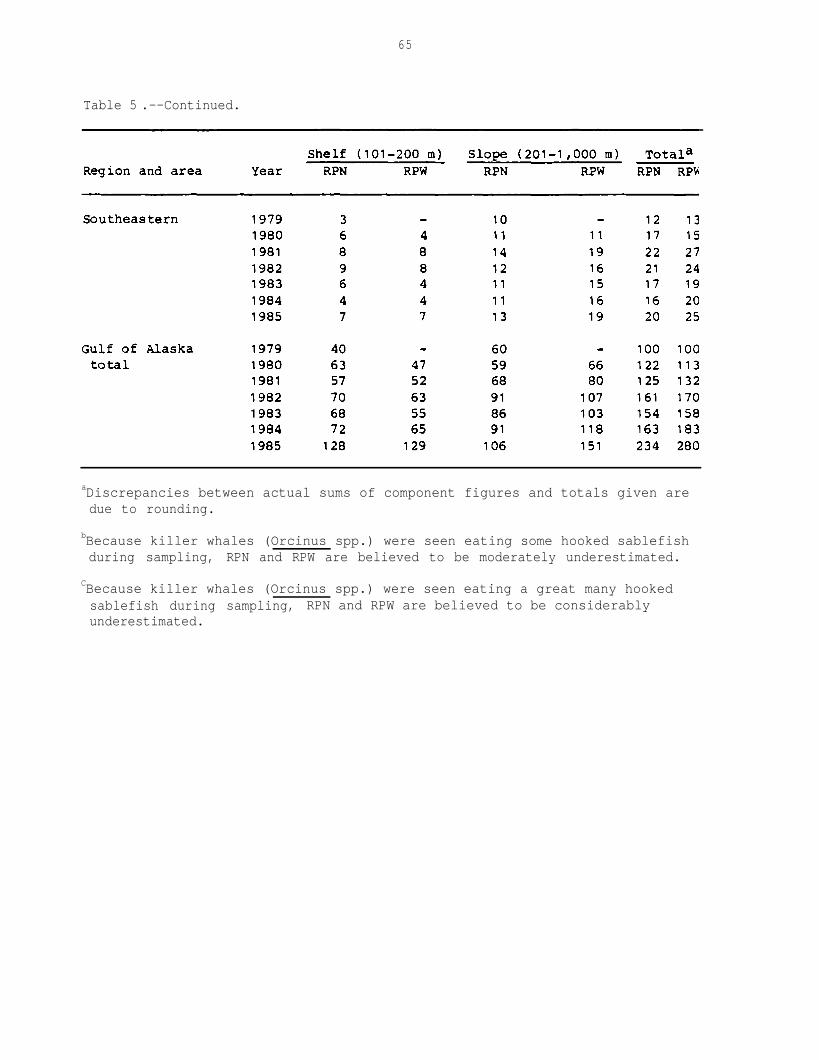
longline. The relative abundance and size structure of sablefish in thenortheastern Pacific Ocean and Bering Sea based on the results of thesesurveys have been updated by Sasaki (1983a, 1983b, 1984a, 1984b, 1985, and1986) for 1979-85, including a comparison with a 1969 Japanese survey in theGulf of Alaska. Sasaki presents two indices of population abundance: relativepopulation number (RPN) and relative population weight (RPW). The RPW, anindex of biomass, is a summation of the CPUE in units of catch weight forthe longline gear for each of several depth categories, multiplied by thearea of the fishing grounds that lie in those depth categories. Index valueshave been summarized by Sasaki (1986) by INPFC area and bottom depth strata101-200 m and 201-1,000 m for 1979-85 (Table 5). The 1978 survey results wereexcluded because the fishing techniques were not standardized until 1979.
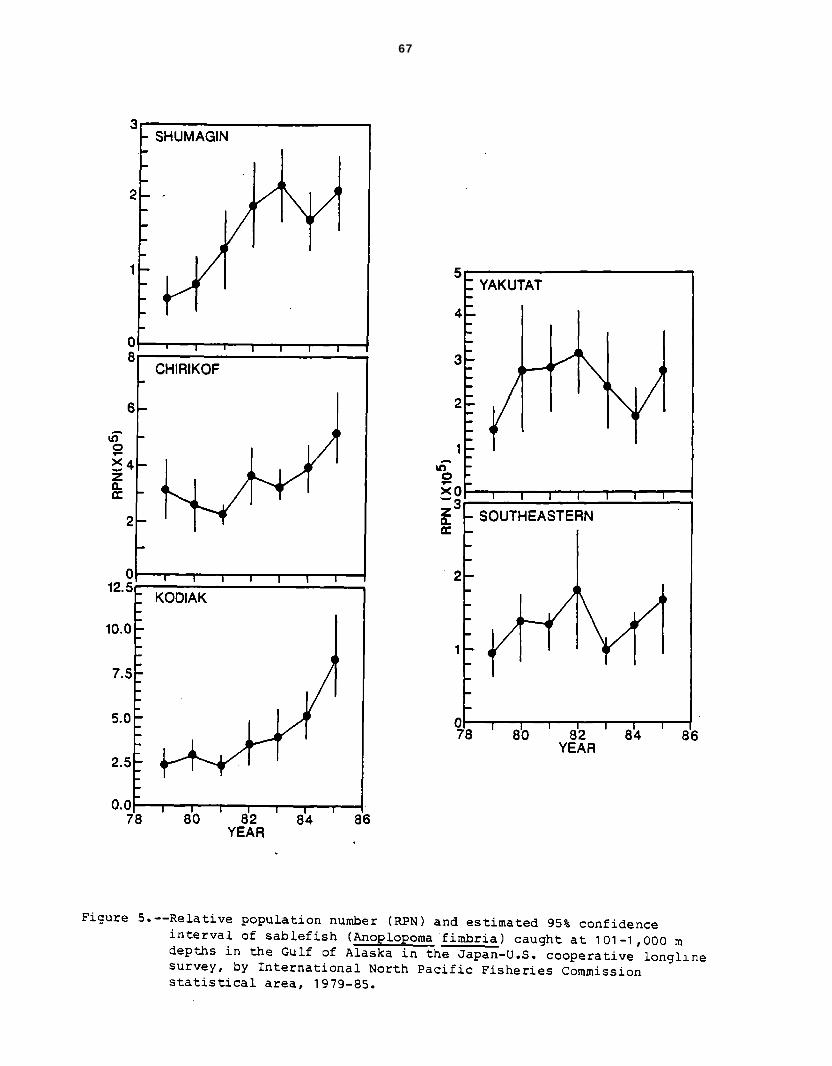
The 1985 RPW for the Gulf of Alaska (depths l0l-1,000 m pooled) reportedby Sasaki (1986) was 2.8 times the 1979 RPW and 1.5 times the 1984 RPW. The1985 RPW exceeded the 1984 RPW in each INPFC area and was the highest eversurveyed in each area except the Southeastern Area. Similarly, the 1985 RPNwas 2.3 times the 1979 RPN and 1.4 times the 1984 RPN. Sigler and Fujioka(1987) extended the analysis by computing confidence intervals for the RPNs.They reported that the increase in RPN between 1979 and 1984 was significantgulf-wide and in the INPFC Shumagin and Kodiak Areas, but not in the INPFCChirikof, Yakutat, and Southeastern Areas (Figs. 4 and 5). Further, theincrease in RPN between 1984 and 1985 was significant gulf-wide, but not soin any of the individual areas.
Two-thirds of the increase in RPW reported by Sasaki (1986) was in the101-200 m stratum--a stratum where indexing is highly variable (Sigler andFujioka 1987). Also, the potential for a significant overestimate seemslikely in the 101-200 m stratum because 1) this stratum is sampled onlyalong its deeper perimeter and 2) sampling often covers less than half ofthe depth range. The area within the 101-200 m stratum (which is quitelarge) is therefore represented by catch rates obtained solely along theperimeter adjacent to the continental slope (customarily considered to besablefish habitat). This concern about using catch rates obtained along theouter edge of the stratum to represent the entire stratum was borne out bythe observation that catch rates obtained during the 1984 U.S.-Japan coopera-tive bottom trawl survey adjacent to the slope in the Shumagin, Chirikof,Kodiak, and Western Yakutat Areas at depths 101-200 m exceeded the catchrates in the corresponding flat and gulley areas4/. In the 1985 longlinesurvey, the average beginning depth sampled in the 101-200 m depth stratumwas 127 m in the Shumagin Area, 148 m in the Chirikof Area, 165 m in the KodiakArea, 182 m in the Yakutat Area, and 155 m in the Southeastern Areas5/.
41 Personal communication with Eric Brown, Resource Assessment and conservationEngineering Division, Northwest and Alaska Fisheries Center, NationalMarine Fisheries Service, NOAA, 7600 Sand Point Way NE., Bin C15700, Building4, Seattle, WA 98115.
5/ Personal communication with David Clausen, Auke Bay Laboratory, Northwestand Alaska Fisheries Center, National Marine Fisheries Service, NOAA, P.O.Box 210155, Auke Bay, AK 99281.

64
Table 5 .--Relative population number (RPN) and relative population weight(RPW) of sablefish (Anoplopoma fimbria) on the Continental Shelfand continental slope of the eastern Bering Sea, Aleutian region,and Gulf of Alaska in summer, 1979-85. The values are shown aspercentage of 1979 value in the Gulf of Alaska (from Sasaki 1986).
65
Table 5 .--Continued.
aDiscrepancies between actual sums of component figures and totals given aredue to rounding.
bBecause killer whales (Orcinus spp.) were seen eating some hooked sablefishduring sampling, RPN and RPW are believed to be moderately underestimated.
CBecause killer whales (Orcinus spp.) were seen eating a great many hookedsablefish during sampling, RPN and RPW are believed to be considerablyunderestimated.
66
Figure 4. --Relative population number (RPN) of sablefish (Anoplopoma fimbria)caught at l0l-1,000 m depths in the Gulf of Alaska in the Japan-U.S.cooperative longline survey, 1979-85, and catch per unit effort(CPUE) in the Japanese longline fishery as estimated by U.S.foreign fisheries observers, 1978-83. The RPN (with the estimated95% confidence interval) is depicted by a solid line (-) theCPUE by a broken line (---).
67

68
In Table 6 the RPNs and RPWs are grouped into three strata--the 101-200 mstratum used by Sasaki (1986) is maintained, but Sasaki's 201-1,000 m stratumis divided into two strata: 201-400 and 401-1,000 m. In addition to theincrease in the 101-200 m stratum (already discussed), Table 6 reveals thatthe 401-1,000 m stratum also contributed greatly to the overall increasein RPN and RPW between 1984 and 1985 (up 45 and 55%, respectively). Theindices of population abundance did not increase as much in the 201-400 mstratum as in the 101-200 and 401-l ,000 m depth strata. The estimates inthe 201-400 m stratum are tenuous however because much of the stratum is inShelikof Strait, Amatuli Trough, and Marmot Gulley--areas where there was nosampling. When calculating the index, these areas were assumed to have thesame density as the adjacent slope area within the stratum. Concern aboutthe validity of the assumption 'has not been completely allayed by the obser-vation that (in the 1984 U.S.-Japan bottom trawl survey) catch rates in theseareas were similar to those on the adjacent slope (Brown 1986).
It may also be appropriate to examine the population increase in 1985 interms of fish length. To achieve this the RPNs, pooled into two depth strata(101-400 and 401-1,000 m) were plotted by length in two ways: 1) using datacollected in 1985 per se and 2) using data collected in 1984 and then projectedto 1985 on the basis of expected growth. Note that in the 101-400 m stratumthe observed RPN exceeded the projected RPN mostly in the smaller lengthcategories (Fig. 61, while in the 401-1,000 m stratum the observed RPNexceeded the projected RPN over the entire range of lengths (Fig. 7).
1984 Triennial Trawl Survey
Sasaki (1984b) revised sablefish biomass estimates based on additionalcomparisons of area-swept biomass estimates from trawl surveys and 1983 RPWvalues, for the gulf. By various methods, three estimates (213,800, 509,700,and 643,200 t) were obtained. Because of the wide discrepancy in theseestimates, yield estimates based on these biomass figures were considered tobe tentative at best.
The 1984 triennial groundfish survey provided a basis for deriving newbiomass estimates of sablefish in the gulf. First, Wakabayashi and Teshima(1985) used the results of part of the U.S .-Japan survey to estimate sablefishbiomass in the central and western regions. By, applying the area-swepttechnique to the catches of the Japanese trawler, Japanese researchers cameup with estimates of 79,900 t, 91,700 t, and 209,300 t for the INPFC Shumagin,Chirikof, and Kodiak Areas, respectively.
U.S. scientists extended the analysis (Brown 1986). They noted, from astudy to measure the comparability of the two U.S. trawlers and the singleJapanese trawler, that the Japanese trawler was more efficient at capturingsablefish than were the U.S. trawlers. Biomass estimates, therefore, aresmaller if the catches by the Japanese trawler are converted to the efficiencyof the U.S. trawlers. If, on the other hand, the efficiency of the Japanesevessel is used as a standard, biomass estimates by U.S. scientists are similarto those reported by Wakabayashi and Teshima (1985).

6 9
Figure 6.--Size composition of sablefish (Anoplopoma fimbria) at 101-400 mdepths in the Gulf of Alaska, 1) observed in 1985 (-), and2) estimated for 1985 from 1984 size composition (---).
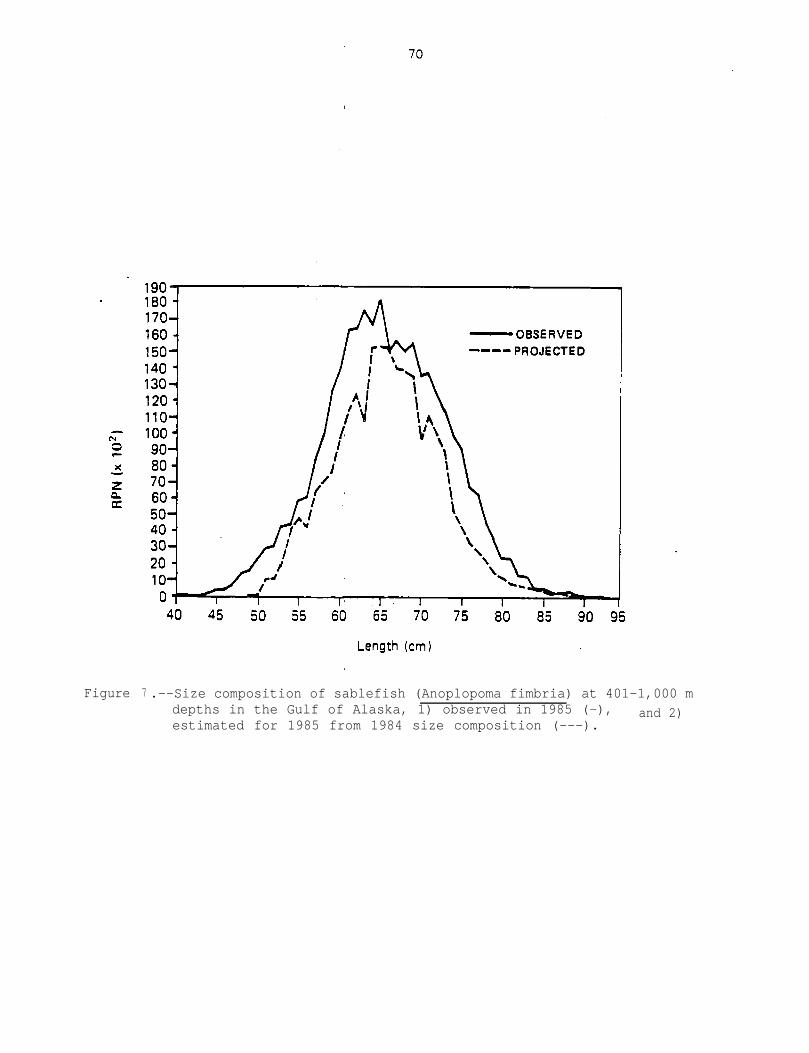
Figure 7 .--Size composition of sablefish (Anoplopoma fimbria) at 401-1,000 mdepths in the Gulf of Alaska, 1) observed in 1985 (-), and 2)estimated for 1985 from 1984 size composition (---).
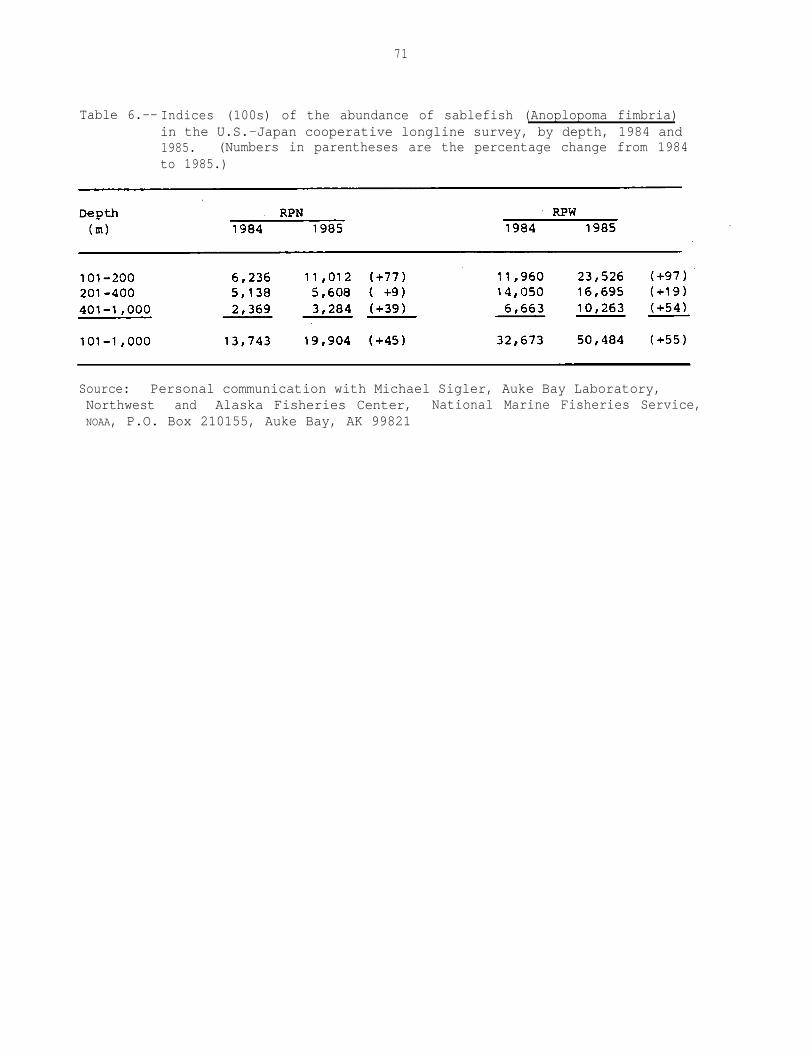
71
Table 6.-- Indices (100s) of the abundance of sablefish (Anoplopoma fimbria)in the U.S.-Japan cooperative longline survey, by depth, 1984 and1985. (Numbers in parentheses are the percentage change from 1984to 1985.)
Source: Personal communication with Michael Sigler, Auke Bay Laboratory,Northwest and Alaska Fisheries Center, National Marine Fisheries Service,NOAA, P.O. Box 210155, Auke Bay, AK 99821

72
An estimate of biomass resulting from preliminary analyses was reportedlast year (Fujioka 1986). This estimate incorporated net efficiency correctionfactors between nylon and polypropylene U.S. nets and the net used by theJapanese trawler. The biomass estimate assumed the most efficient net providesthe most accurate result. The Japanese net was the most efficient, and itsrelative efficiency generally increased with depth (Brown 1986). When theU.S. catch rates were modified by the appropriate ratios, the resulting pointestimate of the biomass of sablefish in the Gulf of Alaska was 536,416 t(since modified to 535,918 t)6/.
Much of the estimated biomass comes from the 101-200 m depth stratum,especially in the INPFC Kodiak and Southeastern Areas (60 and 69%,respectively). The 101-200 m stratum, provided 43% of the total biomassestimate for the gulf. Because, the areas within the 101-200 m stratum arelarge and the catch rates are highly variable, estimates of biomass must beviewed with caution.
Fish size was another element of the 1984 U.S.-Japan cooperative bottomtrawl survey in the central and' western Gulf of Alaska. Of particular interestis the relation between depth and fish size. In the stratum <200 m, between66 and 100% of the sablefish were <57 cm FL, whereas in the deeper strata,only 15-58% were <57 cm FL (Brown 1986). The prevalence of smaller fish inthe stratum <200 m has also been detected by longline surveys (Sasaki 1985).
Another objective of the 1984 surveys was to make preliminary investiga-tions into supplementing biomass estimates with longline observations. Rose(1986) compared trawl catch rates with longline catch rates from the 1984surveys and found that the relative catch rates varied with fish size. Thetrawl-to-longline catch ratio decreased as size increased, up to the 85-94 cmFL, but there were too few observations to estimate the ratio accurately.The catch rate ratio also appears to have varied between areas of the gulf,being lowest in the southeastern area7/.
NMFS Trap Indexing Survey
The NMFS trap indexing survey conducted annually since 1978 has providedanother alternative to foreign longline statistics as a means of assessingsablefish stocks in the INPFC Southeastern Area. Clausen (1987) has summarizedresults from 1978 to 1986 for small (<57 cm FL), medium (57-66 cm FL), andlarge (>67 cm FL) sablefish at each of four indexing sites: Capes Cross,Ommaney, Addington, and Muzon (Fig. 8).
6 / The estimate was adjusted on the basis of new information provided by EricBrown, January 12, 1987 (see footnote 4).
7/ Personal communication with Thomas Rutecki, Auke Bay Laboratory, Northwestand Alaska Fisheries Center, National Marine Fisheries Service, NOAA, P.O.Box 210155, Auke Bay, AK 99281.
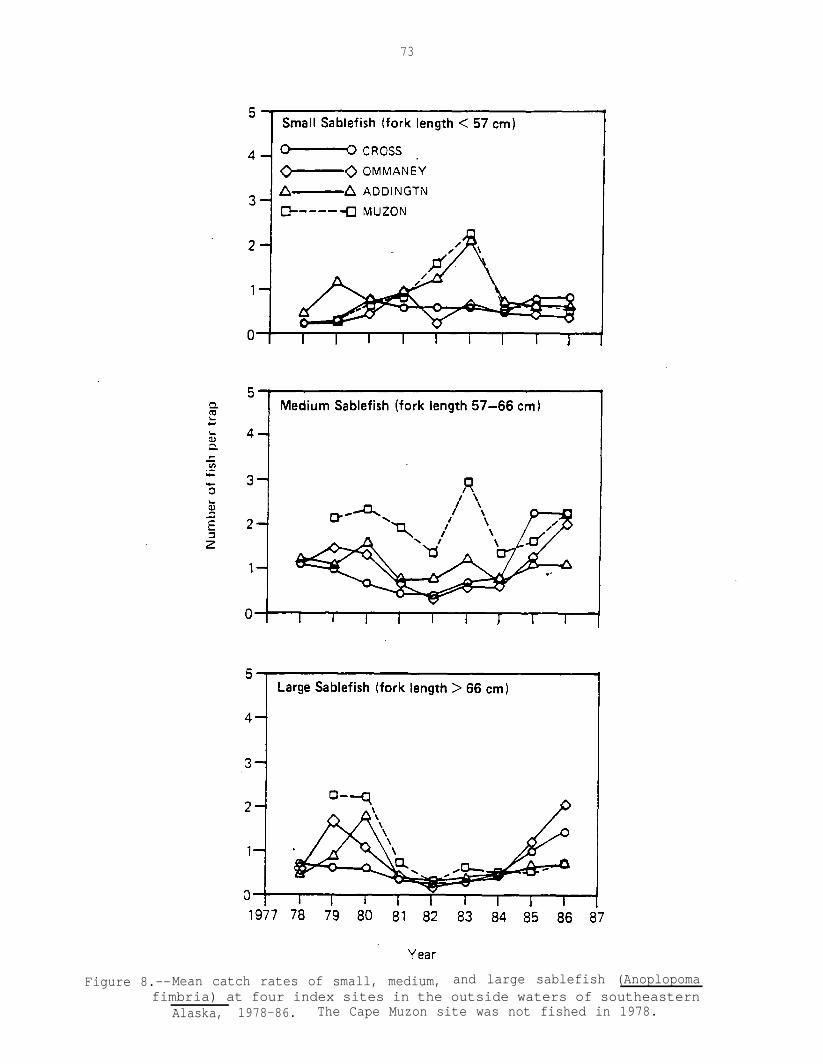
73
Figure 8.--Mean catch rates of small, medium, and large sablefish (Anoplopomafimbria) at four index sites in the outside waters of southeastern
Alaska, 1978-86. The Cape Muzon site was not fished in 1978.
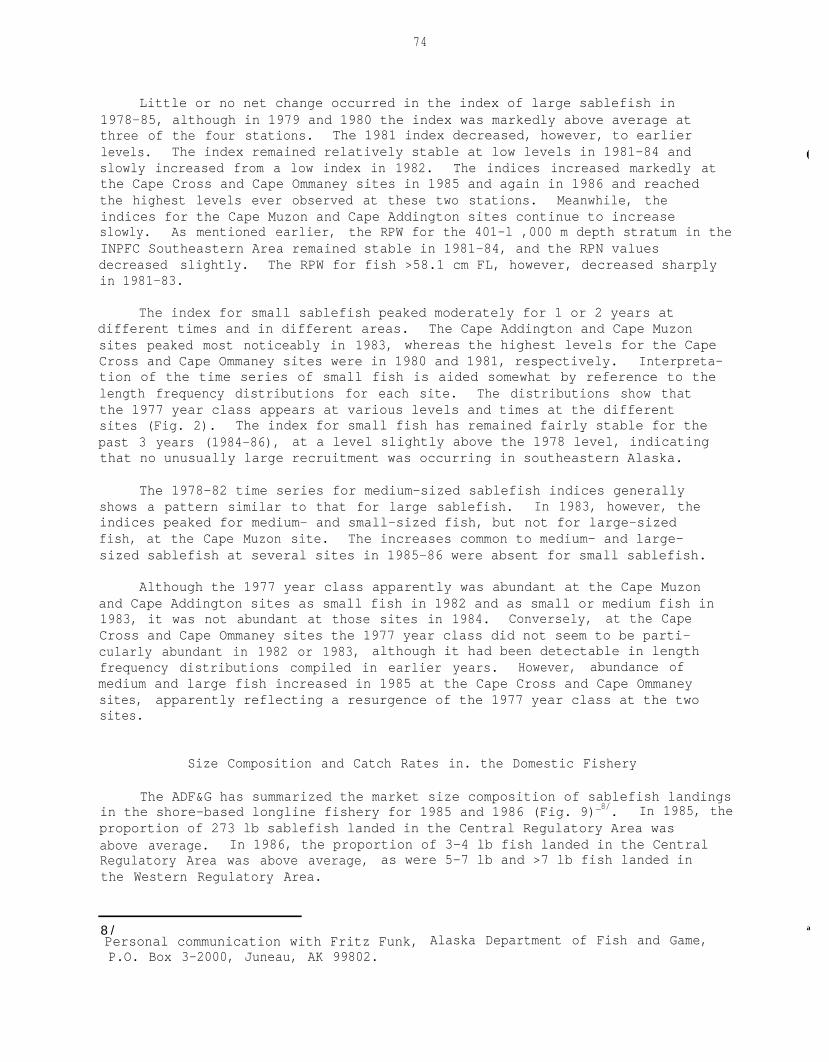
74
Little or no net change occurred in the index of large sablefish in1978-85, although in 1979 and 1980 the index was markedly above average atthree of the four stations. The 1981 index decreased, however, to earlierlevels. The index remained relatively stable at low levels in 1981-84 andslowly increased from a low index in 1982. The indices increased markedly atthe Cape Cross and Cape Ommaney sites in 1985 and again in 1986 and reachedthe highest levels ever observed at these two stations. Meanwhile, theindices for the Cape Muzon and Cape Addington sites continue to increaseslowly. As mentioned earlier, the RPW for the 401-l ,000 m depth stratum in theINPFC Southeastern Area remained stable in 1981-84, and the RPN valuesdecreased slightly. The RPW for fish >58.1 cm FL, however, decreased sharplyin 1981-83.
The index for small sablefish peaked moderately for 1 or 2 years atdifferent times and in different areas. The Cape Addington and Cape Muzonsites peaked most noticeably in 1983, whereas the highest levels for the CapeCross and Cape Ommaney sites were in 1980 and 1981, respectively. Interpreta-tion of the time series of small fish is aided somewhat by reference to thelength frequency distributions for each site. The distributions show thatthe 1977 year class appears at various levels and times at the differentsites (Fig. 2). The index for small fish has remained fairly stable for thepast 3 years (1984-86), at a level slightly above the 1978 level, indicatingthat no unusually large recruitment was occurring in southeastern Alaska.
The 1978-82 time series for medium-sized sablefish indices generallyshows a pattern similar to that for large sablefish. In 1983, however, theindices peaked for medium- and small-sized fish, but not for large-sizedfish, at the Cape Muzon site. The increases common to medium- and large-sized sablefish at several sites in 1985-86 were absent for small sablefish.
Although the 1977 year class apparently was abundant at the Cape Muzonand Cape Addington sites as small fish in 1982 and as small or medium fish in1983, it was not abundant at those sites in 1984. Conversely, at the CapeCross and Cape Ommaney sites the 1977 year class did not seem to be parti-cularly abundant in 1982 or 1983, although it had been detectable in lengthfrequency distributions compiled in earlier years. However, abundance ofmedium and large fish increased in 1985 at the Cape Cross and Cape Ommaneysites, apparently reflecting a resurgence of the 1977 year class at the twosites.
Size Composition and Catch Rates in. the Domestic Fishery
The ADF&G has summarized the market size composition of sablefish landingsin the shore-based longline fishery for 1985 and 1986 (Fig. 9)_8/. In 1985, theproportion of 273 lb sablefish landed in the Central Regulatory Area wasabove average. In 1986, the proportion of 3-4 lb fish landed in the CentralRegulatory Area was above average, as were 5-7 lb and >7 lb fish landed inthe Western Regulatory Area.
8 / Personal communication with Fritz Funk, Alaska Department of Fish and Game,P.O. Box 3-2000, Juneau, AK 99802.
a
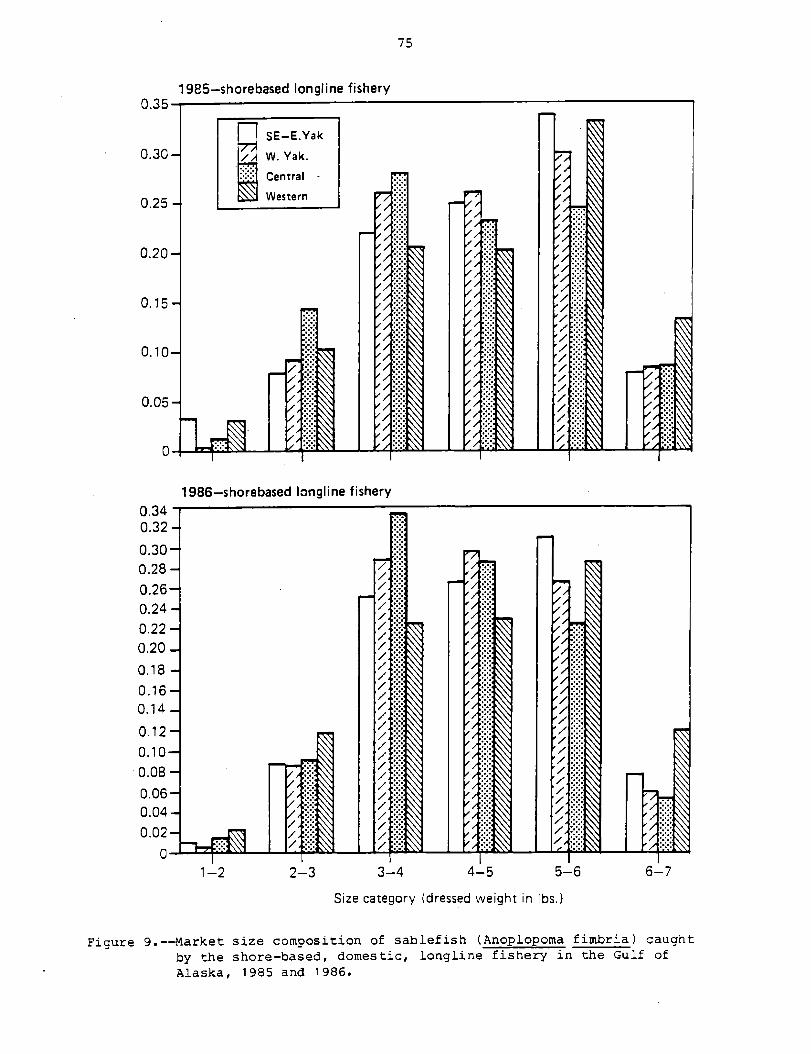
76
Bracken and O'Connell (1986) reported on longline fisheries monitoringin 1980-85 and recommended caution when using the fishery catch rates toindicate abundance. They noted that changes in any of several factors canconfound the interpretation of this information: hook type, market demand forsmall fish, and preferred method of dressing fish.
POTENTIAL YIELD
Estimates of Maximum Sustainable Yield
Although the sablefish resource is managed by broad geographic region,the long-term productivity in each region is assumed to be related to theoverall condition of the resource. Japanese and U.S. scientists have estimatedmaximum sustainable yield (MSY) of the resource as a whole, and apportionedMSY to each region based on historic production trends. The Japanese estimateof MSY for the entire resource! from California to the Bering Sea is 69,000 t.Using essentially the same general production model as the Japanese, but witha different weighting of data between regions, Low and Wespestad (1979)estimated MSY for the California to Bering Sea resource at 50,300 t.
By broad region, historical catches were categorized as being from theBering Sea (25%), the Aleutian Islands (4%), the Gulf of Alaska (47%), andthe British Columbia-Washington region (25%). (These percentages, which addup to 101, probably reflect a rounding error.) The apportioned MSY estimateswere then compared to those de-rived from general production models appliedregion by region. The resulting mean and overall estimate of MSY was 25,100 tfor the Gulf of Alaska (Low and Wespestad 1979). This estimate updated theMSY range of 22,000 to 25,000 t used in the FMP. Production models, however,are most appropriate for relatively short-lived species in which annualrecruitment is relatively stable. It is questionable whether a time series ofcatch and effort data is appropriate for general production modeling ofsablefish stocks, given that the life span of sablefish may be much longerthan previously thought and the fishery apparently is supported by infrequentstrong year classes (McFarlane and Beamish 1983).
Equilibrium Yield
The determination of EY values for past years is documented by Balsiger(1983) and Stauffer (1983). Annual adjustments in EY for the areas west of140° W. long. have been based on changes in annual CPUE of the Japaneselongline fishery and MSY estimates derived from surplus production models ofthe foreign longline fishery. For the areas east of 140° W. long., the EYwas based on annual landings prior to 1980. In 1982, EY in the NPFMC EasternArea was reduced by 50% because of the decline observed in the NMFS trapindexing surveys from 1980 to 1981. The EY established in 1982 was not modifiedfor 1983 even though the condition of the resource appeared to be improving.
Funk and Bracken (1984) used an age-structured model to project futurebiomass levels and annual surplus production. Their model analysis is sensitiveto initial age composition, biomass values, and projected average level ofrecruitment. They initiated the model with age composition determined by alength frequency analysis of the 1982 Japanese longline survey. Their assumedconstant recruitment for age-3 fish was set at the average abundance of the
77
1976, 1978, and 1979 year classes that they estimated from the longlinesurvey data. The model was run using biomass estimates of 171,240 t (derivedfrom surplus production modeling of historic CPUE data) and 256,481 t(derived from a comparison of the 1982 RPW values to biomass estimates fromtrawl surveys in the Aleutian Islands reported by Sasaki (1983b)). Using thebiomass estimates (171,240 and 256,481 t), they forecasted annual surplusproduction values for 1984 at 19,200 t and 26,100 t, respectively. Thesevalues are approximately double the EY range of 10,965 to 12,630 t for 1982and 1983.
A preliminary estimate of biomass projections is shown in Figure 10.These projections are based on the estimated 1984 size composition of thegulf population obtained from the cooperative longline survey, the vonBertalanffy growth parameters K = 0.249 and Linf = 73.62 obtained from otolithsamples from the 1984 longline survey, the observed catches in 1985 and 1986,the preliminary biomass estimate from the 1984 trawl survey, and mortalityrates applied equally to all sizes. The results show that the instantaneousgrowth rate of the fish recruited to the surveyed population by 1984 wouldhave gone from g = 0.130 for 1984 to 1985, g = 0.103 for 1985 to 1986, andg = 0.081 for 1986 to 1987. Then, the EY for 1987 would be approximatelyequal to (0.081 - M) times B(86) (the biomass at the end of the 1986 fishingseason). For trial values of M = 0.00, 0.05, and 0.10, population biomasswas projected from a 1984 value of 535,000 t to B(86) = 642,000, 580,000, and524,000 t, respectively, with corresponding EY estimates of 52,000, 18,000,and (0 t, respectively.
These estimates apply only to fish recruited to the survey gear by 1984;any recruitment or increase in availability since then is not included. In1985, however, significant recruitment as well as an increase in availabilityor catchability or both to the longline survey gear apparently occurred assuggested by the increase in RPN at all sizes and depths. To partiallyaccount for the increased recruitment, the 1985 size composition is projectedback to an estimated 1984 size composition which is then equated to the 1984trawl survey biomass estimate. The reasoning for this is based on an assump-tion that the 1980 or 1981 year class had fully recruited to the trawl surveyby 1984 but not to the longline survey until 1985. Projecting this estimatedpopulation forward results in only slightly higher growth rates and EY esti-mates.
Ignoring recruitment in these projections seems reasonable for theseyears because there has been little indication that strong year classes willrecruit to the longline gear by 1987. If a strong 1984 year class shouldresult, it is likely that the year class would be evident in any 1987 surveysconducted on the shelf but would not recruit strongly to the longline fisheryuntil 1988. This delay in recruitment would allow projections to be made fora 1988 fishery. If significant unexpected changes should occur in the 1986longline survey, analysis will be completed in time for revised recommendations,if necessary, for the 1987 fishery.
Although an estimate of EY cannot be determined with useful accuracy,the sablefish population in the gulf is apparently well above any thresholdlevel that may exist and is large relative to catch levels. Thus, the short-term biologically acceptable catch would apparently allow a much larger
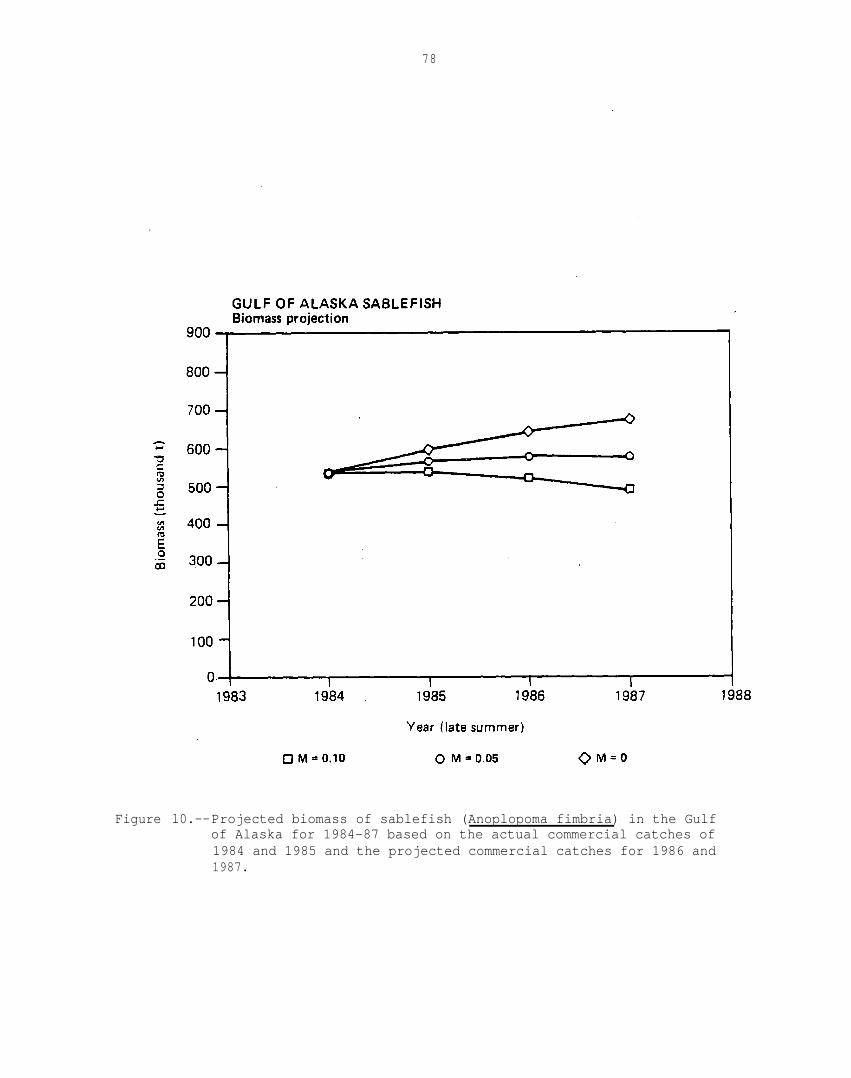
78
Figure l0.--Projected biomass of sablefish (Anoplopoma fimbria) in the Gulfof Alaska for 1984-87 based on the actual commercial catches of1984 and 1985 and the projected commercial catches for 1986 and1987.

79
increase than prudent management should allow to occur in 1 year. It isrecommended that OY levels be allowed to rise slowly above current catchlevels and the status of stocks be monitored carefully.
In past years, the apportionment of EY among INPFC areas was based onhistorical catch patterns. A more appropriate criterion for apportioning EYwould consider the available biomass in each area, the size composition ofthe harvest in each area, and size-related growth and mortality rates. TheOY in 1986 was apportioned approximately to the distribution of biomass inthe 401-1,000 m depth stratum as estimated hastily from results of the 1984longline survey and preliminary results of the 1985 longline survey. Thebiomass in the shallower depth was not considered as a criterion for appor-tionment because 1) the biomass in the shallower depth was composed of smallerfish, 2) the biomass estimates there were highly susceptible to error, and 3)the major target fishery operates at greater depths. Subsequent analysis ofthe 1985 survey reestimated the 1985 RPW distribution (Table 7) and showedthat fish in the 101-200 m depth stratum were smaller than average, whereasfish in the 201-400 m depth stratum were similar in size to those in the401-1,000 m stratum; their potential growth rates were 16, 9, and 8%, respec-tively (Sigler 1986). As pointed out earlier, within the 101-200 m and the201-400 m depth strata, much of the bottom lies away from the slope, wherethe longline survey does not sample and where potentially large errors couldgo undetected.
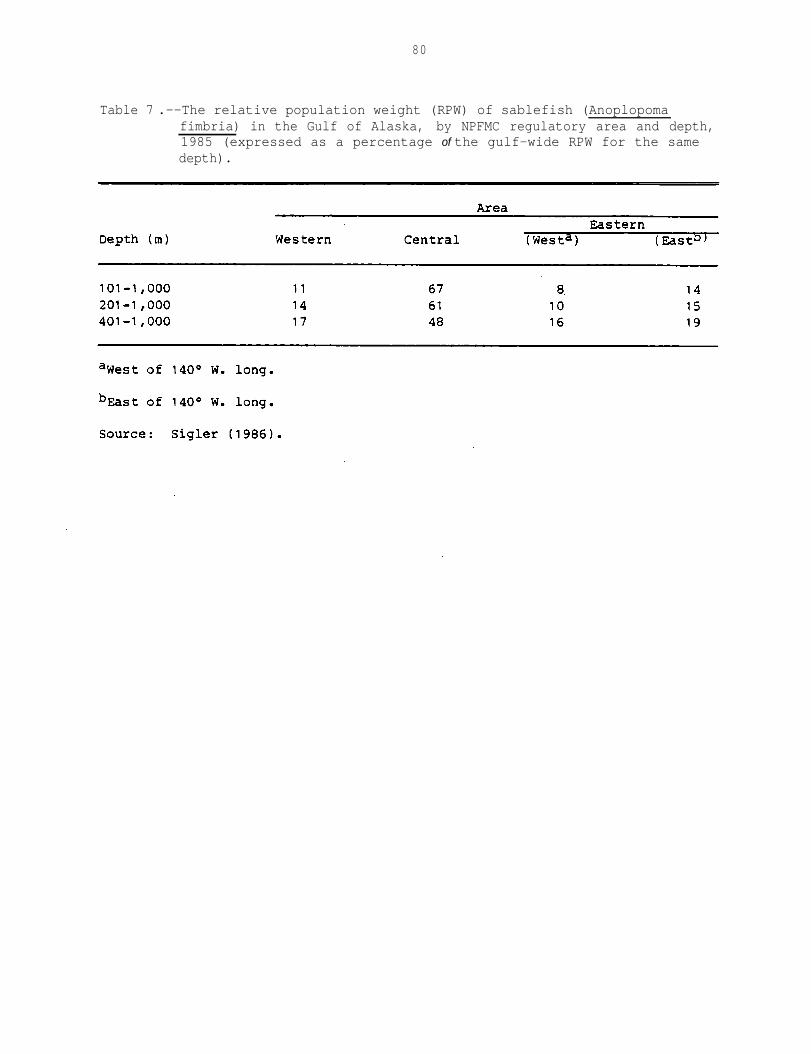
80
Table 7 .--The relative population weight (RPW) of sablefish (Anoplopomafimbria) in the Gulf of Alaska, by NPFMC regulatory area and depth,1985 (expressed as a percentage of the gulf-wide RPW for the samedepth).

81
REFERENCES
Balsiger, J. 1983. Sablefish. In D. H. Ito and J. W. Balsiger (editors),Condition of groundfish resources of the Gulf of Alaska in 1982, p. 63-86.U.S. Dep. Commer., NOAA Tech. Memo. NMFS F/NWC-52.
Balsiger J., and M. Alton. 1981. Condition of sablefish and pollock in theGulf of Alaska in 1981. Unpubl. manuscr., 40 p. Northwest and AlaskaFish. Cent., Natl. Mar. Fish. Serv., NOAA, 7600 Sand Point Way NE., BinC15700, Bldg. 4, Seattle, WA 98115. (Document submitted at the 1981 annualmeeting of the INPFC.)
Beamish R. J., and G. A. McFarlane. 1983. Summary of results of the Canadiansablefish tagging program. In Proceedings of the International SablefishSymposium, p. 147-183. Lowell Wakefield Fisheries Symposia Series, Univ.Alaska, Fairbanks, Alaska Sea Grant Rep. 83-8.
Bracken, B. E. 1982. Sablefish (Anoplopoma fimbria) migration in the Gulfof Alaska based on gulf-wide tag recoveries, 1973-81. Alaska Dep. FishGame, Inf. Leafl. 199, 24 p.
Bracken, B. E., and V. M. O'Connell. 1986. Longline fisheries monitoring inthe eastern Gulf of Alaska, 1980-1985. Unpubl. rep., 62 p. Alaska Dep.Fish Game, P.O. Box 667, Petersburg, AK 99833.
Brown, E. S. 1986. Preliminary results of the 1984 U.S.-Japan cooperativebottom trawl survey of the central and western Gulf of Alaska. In R. L.Major (editor), Condition of groundfish resources of the Gulf of Alaskaregion as assessed in 1985, p. 259-296. U.S. Dep. Commer., NOAA Tech.Memo. NMFS F/NWC-106.
Clausen, D. 1987. Relative abundance of sablefish in southeastern Alaska,based on trap index surveys in 1978-85. Unpubl. manuscr., 58 p. Auke BayLaboratory, Northwest and Alaska Fish. Cent., Natl. Mar. Fish. Serv.,NOAA, P.O. Box 210155, Auke Bay, AK 99821.
Dark, T. A. 1983. Movement of tagged sablefish released at abundance indexsites off southeastern Alaska, Washington, Oregon, and California during1978-81. In Proceedings of the International Sablefish Symposium, p. 191-207. Lowell Wakefield Fisheries Symposia Series, Univ. Alaska, Fairbanks,Alaska Sea Grant Rep. 83-8.
Fujioka, J. 1986. Sablefish. In R. L. Major (editor), Condition ofgroundfish resources of the Gulf of Alaska region as assessed in 1985,p. 79-108. U.S. Dep. Commer., NOAA Tech. Memo. NMFS F/NWC-106.
Fujioka, J., and F. Shaw. 1985. Progress report to sablefish tag analysisworking group. Unpubl. manuscr., 15 p. Auke Bay Lab., Northwest andAlaska Fish. Cent., Natl. Mar. Fish. Serv., NOAA, P.O. Box 210155, AukeBay, AK 99821.
82
Funk, F., and B. E. Bracken. 1984. Status of the Gulf of Alaska sablefish(Anoplopoma fimbria) resource in 1983. Alaska Dep. Fish Game., Inf.Leafl. 235, 55 p.
Gharrett, A. J., M..A. Thomason, and L. N. Wishard. 1983. Progress in thestudy of the biochemical genetics of sablefish. In Proceedings of theInternational Sablefish Symposium, p. 143-146. -Lowell Wakefield FisheriesSymposia Series, Univ. Alaska, Fairbanks, Alaska Sea Grant Rep. 83-8.
LOW, L. L., G. K. Tanonaka, and H. H. Shippen. 1976. Sablefish of thenortheastern Pacific Ocean and Bering Sea. NWAFC Processed Rep., 115 p.Northwest and Alaska Fish. Cent., Natl. Mar. Fish. Serv., NOAA, 7600 SandPoint Way NE., Bin C15700, Bldg. 4, Seattle, WA 98115.,
Low, L. L., and V. Wespestad. 1979. General production models on sablefishin the North Pacific. Unpubl. rep., 16 p. Northwest and Alaska Fish.Cent., Natl. Mar. Fish. Serv., NOAA, 7600 Sand Point Way NE., Bin C15700,Bldg. 4, Seattle, WA 98115.
McFarlane G. A., and R. J. Beamish. 1983. Overview of the fishery andmanagement strategy for sablefish (Anoplopoma fimbria) off the west coastof Canada. In Proceedings of the International Sablefish Symposium,
P. 13-35. Lowell Wakefield Fisheries Symposia Series, Univ. Alaska,Fairbanks, Alaska Sea Grant Rep. 83-8.
Narita, R. E. 1983. Sablefish. In R. G. Bakkala and L. L. Low (editors),Condition of groundfish resources of the eastern Bering Sea and AleutianIslands region in 1982, p. lll-125. U.S. Dep. Commer., NOAA Tech. Memo.NMFS F/NWC-42.
Rose, C. S. 1986. A comparison of catch rates of sablefish by bottom trawlsand longlines. In R. L. Major (editor), Condition of groundfish resourcesof the Gulf of Alaska region as assessed in 1985, p. 297-304. U.S. Dep.Commer., NOAA Tech. Memo. NMFS F/NWC-106.
Sasaki, T. 1982. Condition of sablefish stocks in the North Pacific.Unpubl. manuscr., 41 p. Far Seas Fisheries Research Laboratory, FisheriesAgency of Japan, 1000 Orido, Shimizu 424, Japan.
Sasaki, T. 1983a. Condition of sablefish stocks in recent years in theeastern Bering Sea, Aleutian region and Gulf of Alaska based on the resultsof field surveys. In Proceedings of the International Sablefish Symposium,p. 255-264. Lowell Wakefield Fisheries Symposia Series, Univ. Alaska,Fairbanks, Alaska Sea Grant Rep. 83-8.
Sasaki, T. 1983b. Relative abundance and size structure of sablefish in theeastern Bering Sea, Aleutian region and Gulf of Alaska based on the resultsof Japan-U.S. joint longline surveys from 1979 to 1982. In Proceedings ofthe International Sablefish Symposium, p. 239-253. Lowell WakefieldFisheries Symposia Series, Univ. Alaska, Fairbanks, Alaska Sea Grant Rep.83-8.

83
Sasaki, T. 1984a. A prompt report on Japan-U.S. joint longline survey byAnyo Maru No. 21 in 1983. Unpubl. manuscr., 21 p. Far Seas Fisheries- - - -Research Laboratory, Fisheries Agency of Japan, 1000 Orido, Shimizu 424,Japan.
Sasaki, T. 1984b. Condition of sablefish stocks in the eastern Bering Sea,Aleutian Region, and Gulf of Alaska in 1983. Unpubl. manuscr., 19 p.Far Seas Fisheries Research Laboratory, Fisheries Agency of Japan, 1000Orido, Shimizu 424, Japan.
Sasaki, T. 1985. Preliminary report on the Japan-U.S. joint longline surveyby Ryusho Maru No. 15 in 1984. Unpubl. manuscr., 22 p. Far Seas FisheriesResearch Laboratory,-- -Fisheries Agency of Japan, 1000 Orido, Shimizu, Japan.
Sasaki, T. 1986. Stock assessment of sablefish in the eastern Bering Sea,Aleutian Islands region, and the Gulf of Alaska. Unpubl. manuscr., 33 p.Far Seas Fisheries Research Laboratory, Fisheries Agency of Japan, 1000Orido, Shimizu 424, Japan.
Sigler, M. 1986. Supplemental analyses of the results of the Japan-U.S.cooperative longline survey in the Gulf of Alaska, 1985. Unpubl. manuscr.,21 p. Auke Bay Lab., Northwest and Alaska Fish. Cent., Natl. Mar. Fish.Serv., NOAA P.0. BOX 210155, Auke Bay, AK 99821.
Sigler M., and J. T. Fujioka. 1987. Variability in relative populationnumbers of sablefish, Anoplopoma fimbria, in the Gulf of Alaska, 1985.Unpubl. manuscr., 29 p. Auke Bay Lab., Northwest and Alaska Fish. Cent.,Natl. Mar. Fish. Serv., NOAA, P.O. Box 210155, Auke Bay, AK 99821.
Stauffer, G. 1983. Sablefish. In G. Stauffer (editor), Condition of ground-fish resources in the Gulf of Alaska region as assessed in 1983, p. 3-1 to3-36. NWAFC Processed Rep. 84-02. Northwest and Alaska Fish. Cent., Natl.Mar. Fish. Serv., NOAA, 7600 Sand Point Way NE., Bin C15700, Bldg. 4, Seattle,WA 98115. (Document submitted at the 1983 annual meeting of the INPFC.)
Stauffer, G. D. 1985. Sablefish. In R. L. Major (editor), Condition ofgroundfish resources of the Gulf of Alaska region as assessed in 1984,p. 35-68. U.S. Dep. Commer., NOAA Tech. Memo. NMFS F/NWC-80.
Wakabayashi K., and K. Teshima. 1985. Preliminary results on biomassestimation based on the Japanese trawl survey in the Gulf of Alaska in1984. Unpubl. manuscr., 13 p. Far Seas Fisheries Research Laboratory,Fisheries Agency of Japan, 1000 Orido, Shimizu, 424, Japan.
Wespestad, V. G., K. Thorsen, and S. A. Mizroch. 1978. Movement of sablefish(Anoplopoma fimbria) in the northeastern Pacific Ocean as determined bytagging experiments (1971-1977). NWAFC Processed Rep,, 54 p. Northwestand Alaska Fish. Cent., Natl. Mar. Fish. Serv., NOAA, 7600 Sand Point WayNE., BIN C15700, Bldg. 4, Seattle, WA 98115.
Wespestad, V. G, K. Thorsen, and S. A. Mizroch. 1983. Movement of sablefish,Anoplopoma fimbria, in the northeastern Pacific Ocean as determined bytagging experiments (1971-80). U.S. Natl. Mar. Fish. Serv., Fish. Bull.81(2):415-420.
PACIFIC COD-
2 /Harold H. Zenger, Jr. and James E. Blackburn
INTRODUCTION
In North American waters, Pacific cod (Gadus macrocephalus) occur on theContinental Shelf and upper slope from Santa Monica Bay, California (34° N.lat.) through the Gulf of Alaska, Aleutian Islands, and eastern Bering Sea toNorton Sound (Bakkala et al. 1981).
Since the Magnuson Fishery Conservation and Management Act (MFCMA) of1977 went into effect, various regulations have been implemented by the NorthPacific Fishery Management Council (NPFMC) that affected cod fisheries in theGulf of Alaska and allowed catches to reach their historic highs in 1980-83.Amendment 2 to the Fishery Management Plan (FMP) for groundfish in the Gulfof Alaska allowed a year-round directed foreign longline fishery for Pacificcod west of 157O W. long. beyond 12 miles, beginning in 1979. Amendment 4permitted foreign longlining for Pacific cod from 140 to 157° W. long. beyond12 miles except that fishing would be closed within the 400 m isobath duringthe U.S. Pacific halibut, (Hippoglossus stenolepis), season. Those regulationsallowed more intensive foreign exploitation of one or two unusually largeyear classes of Pacific cod which have now passed peak production.
Since 1977, the importance of Pacific cod in Gulf of Alaska groundfishcatches has grown and receded. After increasing from 2,256 metric tons (t)in 1977 to 36,401 t in 1983, the annual total catch dropped to 14,307 t in1985 (Table 1). The decreases in 1984 and 1985 were mostly due to reductionsin catches by the Japanese, who limited their longline operations for Pacificcod to the International North Pacific Fisheries Commission (INPFC) Shumaginand Chirikof Statistical Areas to reduce the incidental catch of sablefish(Anoplopoma fimbria).
At this time, management of Pacific cod in the Gulf of Alaska has notreached a critical point because the stocks are relatively large in relation-ship to the optimumyield (OY). Recent harvest levels have been well belowOY, and it is likely that they will remain so in all but the NPFMC WesternRegulatory Area because of regulations imposed to protect sablefish stocks.(The Western Regulatory Area is the INPFC Shumagin Area, the CentralRegulatory Area is composed of the INPFC Chirikof and Kodiak Areas, and theEastern Regulatory Area refers to the combined INPFC Yakutat and SoutheasternAreas.)
1/This report is an update of Zenger and Blackburn (1986).
2 /'Alaska Department of Fish and Game, 211 Mission Road, Kodiak, AK 99615.

86
Table 1 .--Catch (t) of Pacificcod in the Gulf of Alaska, by fisherycategory, 1971-85a.
aForeign catches 1971-76 are foreign-reported catches; foreigncatches 1977-85 are best-blend estimates.
bRepublic of Korea.
Sources: Foreign catches 1971-76: Forrester et al. (1983). Foreigncatches 1977-84 and joint venture catches 1978-84: Berger et al. (1986).Foreign and joint venture catches ,1985: personal communication withJerald Berger, U.S. Foreign Fisheries Observer Program, Northwest andAlaska Fisheries Center, National Marine Fisheries Service, NOAA, 7600Sand Point Way NE., BIN C15700, Building 4, Seattle, WA 98115. U.S.catches 1971-80: Rigby (1984). U.S. catches 1981-85: Pacific FisheryInformation Network (PacFIN),, Pacific Marine Fisheries Commission,305 State Office Building, 1400 SW. Fifth Avenue, Portland, OR 97201.
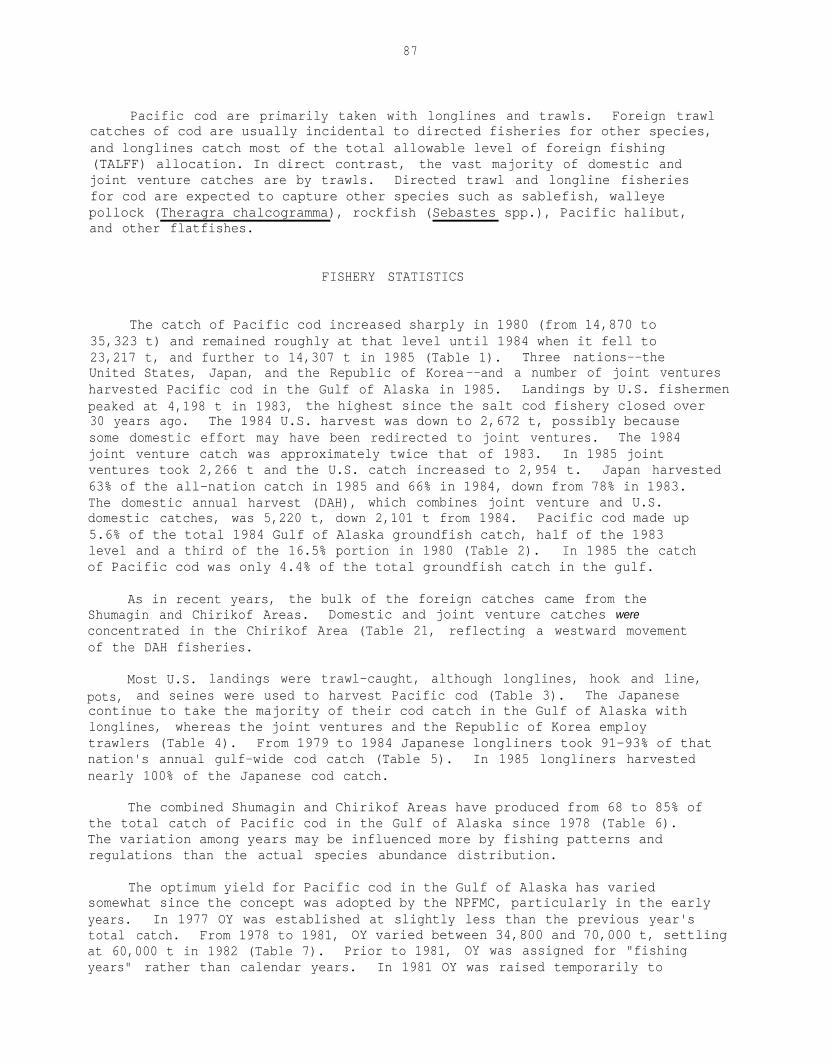
87
Pacific cod are primarily taken with longlines and trawls. Foreign trawlcatches of cod are usually incidental to directed fisheries for other species,and longlines catch most of the total allowable level of foreign fishing(TALFF) allocation. In direct contrast, the vast majority of domestic andjoint venture catches are by trawls. Directed trawl and longline fisheriesfor cod are expected to capture other species such as sablefish, walleyepollock (Theragra chalcogramma), rockfish (Sebastes spp.), Pacific halibut,and other flatfishes.
FISHERY STATISTICS
The catch of Pacific cod increased sharply in 1980 (from 14,870 to35,323 t) and remained roughly at that level until 1984 when it fell to23,217 t, and further to 14,307 t in 1985 (Table 1). Three nations--theUnited States, Japan, and the Republic of Korea--and a number of joint venturesharvested Pacific cod in the Gulf of Alaska in 1985. Landings by U.S. fishermenpeaked at 4,198 t in 1983, the highest since the salt cod fishery closed over30 years ago. The 1984 U.S. harvest was down to 2,672 t, possibly becausesome domestic effort may have been redirected to joint ventures. The 1984joint venture catch was approximately twice that of 1983. In 1985 jointventures took 2,266 t and the U.S. catch increased to 2,954 t. Japan harvested63% of the all-nation catch in 1985 and 66% in 1984, down from 78% in 1983.The domestic annual harvest (DAH), which combines joint venture and U.S.domestic catches, was 5,220 t, down 2,101 t from 1984. Pacific cod made up5.6% of the total 1984 Gulf of Alaska groundfish catch, half of the 1983level and a third of the 16.5% portion in 1980 (Table 2). In 1985 the catchof Pacific cod was only 4.4% of the total groundfish catch in the gulf.
As in recent years, the bulk of the foreign catches came from theShumagin and Chirikof Areas. Domestic and joint venture catches wereconcentrated in the Chirikof Area (Table 21, reflecting a westward movementof the DAH fisheries.
Most U.S. landings were trawl-caught, although longlines, hook and line,pots, and seines were used to harvest Pacific cod (Table 3). The Japanesecontinue to take the majority of their cod catch in the Gulf of Alaska withlonglines, whereas the joint ventures and the Republic of Korea employtrawlers (Table 4). From 1979 to 1984 Japanese longliners took 91-93% of thatnation's annual gulf-wide cod catch (Table 5). In 1985 longliners harvestednearly 100% of the Japanese cod catch.
The combined Shumagin and Chirikof Areas have produced from 68 to 85% ofthe total catch of Pacific cod in the Gulf of Alaska since 1978 (Table 6).The variation among years may be influenced more by fishing patterns andregulations than the actual species abundance distribution.
The optimum yield for Pacific cod in the Gulf of Alaska has variedsomewhat since the concept was adopted by the NPFMC, particularly in the earlyyears. In 1977 OY was established at slightly less than the previous year'stotal catch. From 1978 to 1981, OY varied between 34,800 and 70,000 t, settlingat 60,000 t in 1982 (Table 7). Prior to 1981, OY was assigned for "fishingyears" rather than calendar years. In 1981 OY was raised temporarily to
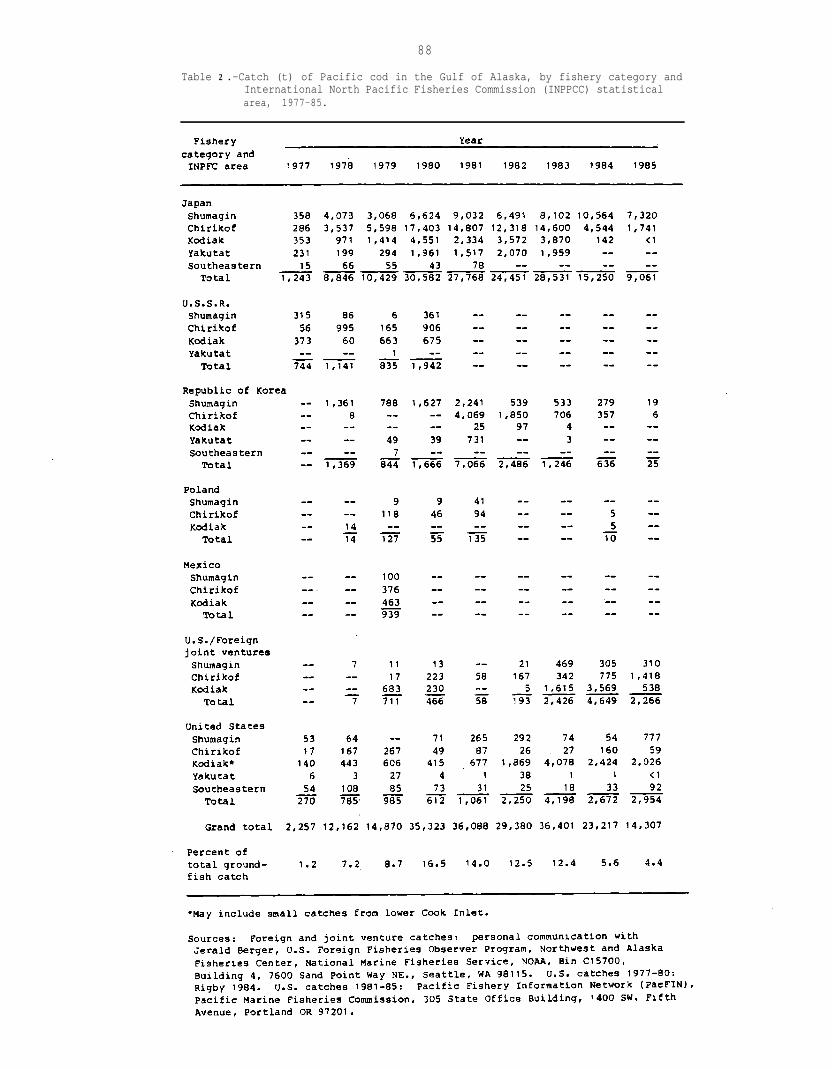
88
Table 2 .-Catch (t) of Pacific cod in the Gulf of Alaska, by fishery category andInternational North Pacific Fisheries Commission (INPPCC) statisticalarea, 1977-85.

89
Table 3.--Annual U.S. landings (t) of Pacific cod in the Gulf of Alaska,by gear type, 1981-85.
Source: Pacific Fishery Information Network (PacFIN), Pacific Marine-Fisheries Commission, 305 State Office Building, 1400 SW. Fifth Avenue,Portland, OR 97201.
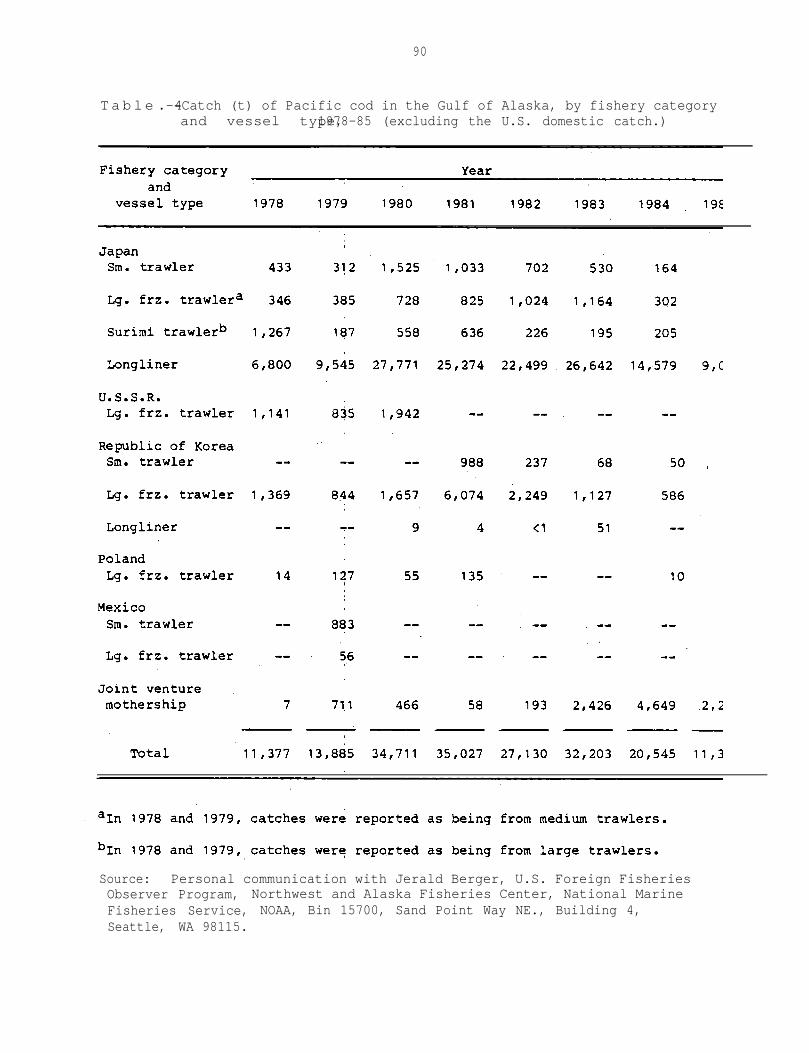
90
T a b le 4.--Catch (t) of Pacific cod in the Gulf of Alaska, by fishery categoryand vessel type,1978-85 (excluding the U.S. domestic catch.)
Source: Personal communication with Jerald Berger, U.S. Foreign FisheriesObserver Program, Northwest and Alaska Fisheries Center, National MarineFisheries Service, NOAA, Bin 15700, Sand Point Way NE., Building 4,Seattle, WA 98115.

91
Table 5 .--Japanese longline catch (t) of Pacific cod by InternationalNorth Pacific Fisheries Commission statistical area, and thepercentage of Japanese all-gear catch that was taken bylongline, 1978-85.
Source: Personal communication with Jerald Berger, U.S. ForeignFisheries Observer Program, Northwest and Alaska Fisheries Center,National Marine Fisheries Service, NOAA, Bin C15700, Building 4,7600 Sand Point Way NE., Seattle, WA 98115.

92
Table 6 .--Catch (t) of Pacific cod in the Gulf of Alaska byInternational North Pacific Fisheries Commission statisticalarea, 1977-85.
Sources: Foreign and joint venture catches: personal communicationwith Jerald Berger, U.S. Foreign Fishery Observer Program, Northwestand Alaska Fisheries Center, National Marine Fisheries Service, NOAA,Bin C15700, Building 4, 7600 Sand Point Way NE., Seattle, WA 98115.U.S. catches 1977-80: Rigby 1984. U.S. catches 1981-85: PacificFishery Information Network (PacFIN), Pacific Marine FisheriesCommission, 305 State Office Building, 1400 SW. Fifth Avenue,Portland, OR 97201.
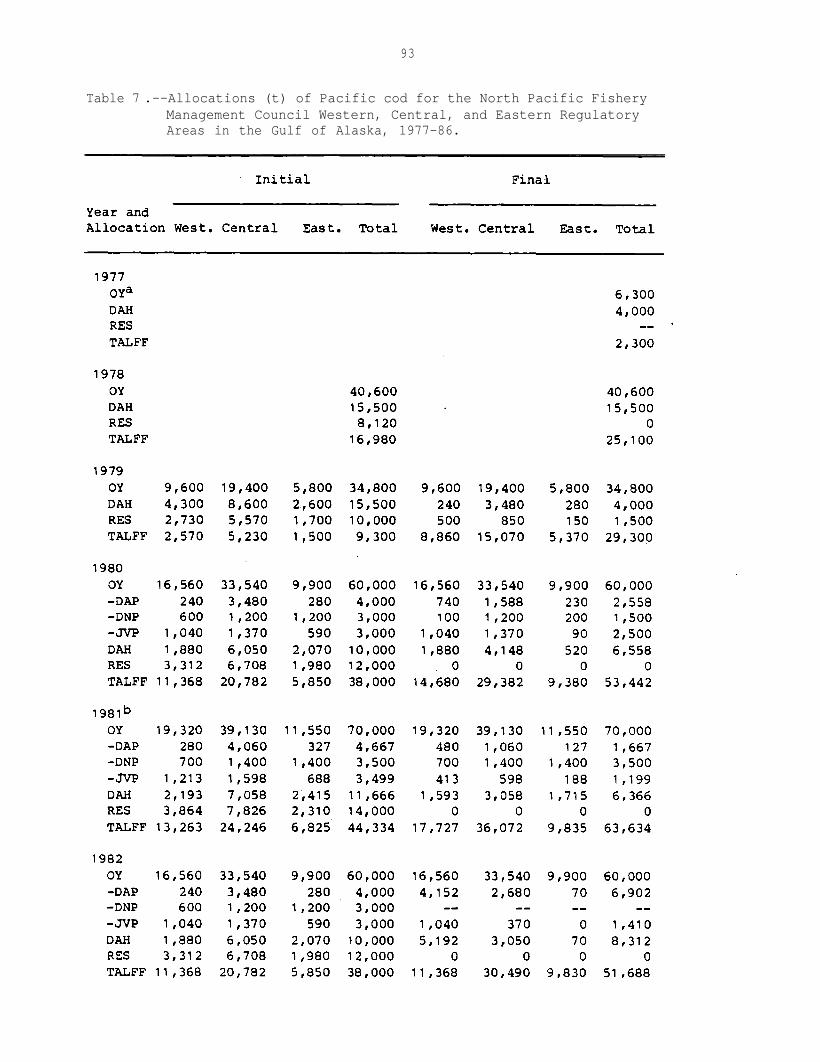
93
Table 7 .--Allocations (t) of Pacific cod for the North Pacific FisheryManagement Council Western, Central, and Eastern RegulatoryAreas in the Gulf of Alaska, 1977-86.

94
95
70,000 t and the fishing year was extended until December 31 to allow subse-quent OY's to cover calendar years. In 1986 the total OY was raised to 75,000 tand the geographic distribution was changed to 40, 44, and 16% in the Western,Central, and Eastern Regulatory Areas, respectively. Previously that distribu-tion had been 28, 56, and 16%.
Proportional distribution of catches in the respective regulatory areaswas relatively steady from 1979 to 1983, although in 1984 and 1985,the vastmajority of cod catches came from the Western and Central Regulatory Areas(Table 8). This was due in large part to the absence of Japanese longlinersin the INPFC Yakutat and Kodiak Areas after 1983. (Japanese longliners fishingfor Pacific cod voluntarily limited their activities to the INPFC Shumaginand Chirikof Areas during those years.) Japanese longline vessels were per-mitted to target Pacific cod only in waters shallower than 350 m in order toreduce incidental catches of sablefish. Catches of Pacific cod in all threeregulatory areas were well below the final total OY allocations, especiallyin the Eastern Regulatory Area (Tables 7 and 8).
Total initial allocations of Pacific cod for 1985 reflected a continuingtrend toward increasing the domestic catch and a gradual phasing out offoreign fishing. The initial TALFF on 1 January 1985 was 10,000 t, less thanhalf of the 23,830 t initial TALFF allocation on 1 January 1984, and lessthan a third of the 32,518 t final allocation for 1984 (Table 7). Two hundredt of additional TALFF were allocated by the end of 1985. The initial 1986TALFF was increased to 11,640 t.
CONDITION OF THE STOCKS
Because the population structure of Pacific cod is poorly understood,the resource is primarily managed by geographic subdivision. Thus, theWashington-to-California, British Columbia, Aleutian Island, Bering Sea, andGulf of Alaska regions are each considered to have separate stocks. As taggingstudies in the Gulf of Alaska, Aleutian Islands, and Bering Sea progress,more informationon the validity of this assumption will become available.Discussions here concerning the condition of the Gulf of Alaska stock aredeveloped along two lines: 1) resource assessment surveys and port sampling,and 21 size composition and catch per unit effort (CPUE) of the Japaneselongline fishery based on data collected by the U.S. Foreign FisheriesObserver Program. Effort data for domestic and joint venture fisheriesare not yet available to facilitate the use of production models. Growthand natural mortality rates for Pacific cod from the Gulf of Alaska arenot well-defined.
Resource Assessment Surveys
The 1984 U.S.-Japan Cooperative Bottom Trawl Survey
The 1984 U.S.-Japan cooperative bottom trawl survey was conducted bypersonnel from the Northwest and Alaska Fisheries Center in Seattle,Washington, with extensive cooperation from the Fishery Agency of Japan,

96
Sources: Foreign and joint venture catches: personal communicationwith Jerald Berger, U.S. Foreign Fisheries Observer Program, Northwestand Alaska Fisheries Center, National Marine Fisheries Service, NOAA,Bin C15700, Building 4, 7600 Sand Point Way NE., Seattle, WA 98115.U.S. catches 1977-80: Rigby (1984). U.S. catches 1981-85: PacificFishery Information Network (PacFIN), Pacific Marine FisheriesCommission, 305 State Office Building, 1400 SW. Fifth Avenue,Portland, OR 97201.
97
which contributed a chartered research vessel and scientists from the FarSeas Fisheries Laboratory in Shimizu, Japan. The general objective of thework was to determine the abundance, distribution, and biological conditionof groundfish stocks in the central and western Gulf of Alaska, June-October1984. The survey was the most comprehensive ever completed in the region.Eight hundred and twenty-three demersal trawl stations ranging in depth from27 to 823 m were sampled between Cape St. Elias (144° W. long.) and theIslands of Four Mountains (170° W. long.) by the chartered U.S. trawlersMorning Star and Ocean Spray and the chartered Japanese trawler Daikichi Maru- -No. 37. Subsequent to the above-mentioned survey, NMFS personnel from theAuk Bay Laboratory in Juneau, Alaska, surveyed the eastern Gulf of Alaskafrom Cape. St. Elias to Dixon Entrance (132° W. long.) aboard the MorningStar. Catches of Pacific cod by the three types of trawls employed werestandardized by fishing power coefficients and adjusted to the most efficienttrawl. The adjusted catches were used to calculate CPUE by INPFC area and100-m depth interval (Table 9). The CPUE by depth was highest in the 101-200m interval in each INPFC area, and by area (within the 101-200 m interval)was highest in the INPFC Shumagin Area. Beyond the 201-300 m interval, theabundance of cod was low.
Total biomass estimated from the results of the 1984 U.S.-Japan coopera-tive bottom trawl survey (between 144 and 170° W. long) was 538,820 t, with a95% confidence interval of 389,623-688,016 t (Table 9). Of the five INPFCareas, biomass was greatest in the INPFC Kodiak Area. Biomass was estimatedat 170,128 t in the INPFC Shumagin Area (Western Regulatory Area) and343,747 t in the combined INPFC Chirikof and Kodiak Areas (Central RegulatoryArea). This is very close to the 1:2 proportional allocation used to assignregional OY's prior to 1986. Biomass in the remaining area covered by theU.S.-Japan survey (the INPFC Yakutat Area west of 144° W. long.) was estimatedat 24,945 t.
There is evidence, however, that computed biomass for the INPFC YakutatArea as a whole may be less reliable. The estimated biomass of cod in thewestern half of the INPFC Yakutat Area (24,945 t) was much greater than inthe eastern half (8,077 t). If one is willing to assume a more or less uni-form distribution of Japanese longline effort in the east-central Gulf ofAlaska during 1982 and 1983, the historical catch data (Zenger 1985) suggestthat cod have been more or less equally abundant in the two subareas. Itseems likely that lack of extensive sampling by the 1984 NMFS survey in the101-200 m interval in the eastern Yakutat subarea (and the INPFC SoutheasternArea) resulted in low biomass estimates. Until better data are available, itdoes not seem unreasonable to assume that biomass in the INPFC Yakutat Areaas a whole was about 50,000 t--roughly twice that in the western subarea.
Neither the 1984 survey data nor the historical catch data provide abasis for generating a biomass estimate for the INPFC Southeastern Area.Lacking that, there can be no biomass estimate for the Eastern RegulatoryArea (INPFC Yakutat and Southeastern Areas combined).
A first-order estimate of yield for the Gulf of Alaska Pacific codstocks in the INPFC Shumagin, Chirikof, and Kodiak Areas as assessed in June-August 1984 can be derived using Gulland's (1975) equation:
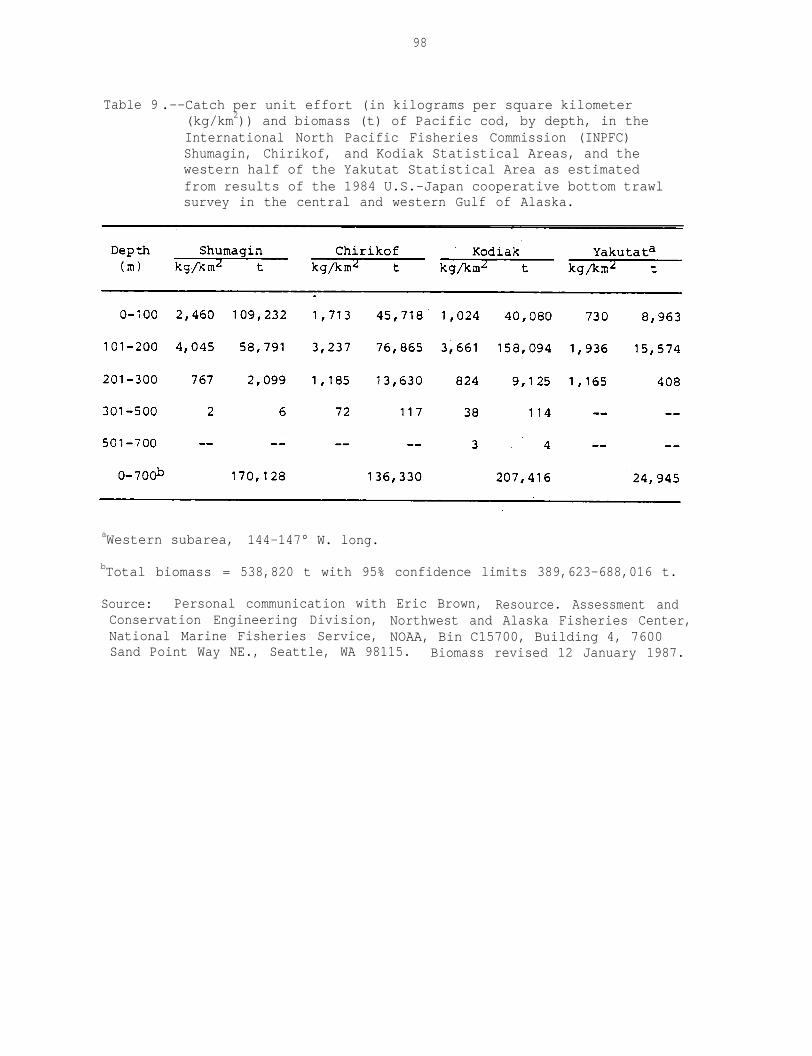
98
Table 9 .--Catch per unit effort (in kilograms per square kilometer(kg/km2)) and biomass (t) of Pacific cod, by depth, in theInternational North Pacific Fisheries Commission (INPFC)Shumagin, Chirikof, and Kodiak Statistical Areas, and thewestern half of the Yakutat Statistical Area as estimatedfrom results of the 1984 U.S.-Japan cooperative bottom trawlsurvey in the central and western Gulf of Alaska.
aWestern subarea, 144-147° W. long.
bTotal biomass = 538,820 t with 95% confidence limits 389,623-688,016 t.
Source: Personal communication with Eric Brown, Resource. Assessment andConservation Engineering Division, Northwest and Alaska Fisheries Center,National Marine Fisheries Service, NOAA, Bin C15700, Building 4, 7600Sand Point Way NE., Seattle, WA 98115. Biomass revised 12 January 1987.
99
The force of natural mortality, estimated at 0.45 by Bakkala and Wespestad(1985), has been applied here. Yield estimates for the INPFC Shumagin,Chirikof, and Kodiak Areas are 38,279, 30,674, and 46,669 t, respectively.(These numbers were recalculated, and they reflect a small change from thosereported last year in Zenger and Blackburn (1986).) Altogether, these threeINPFC areas--which constitute the Western and Central Regulatory Areas--havean estimated yield of 115,025 t, which is approximately twice the OY for1985 for the entire Gulf of Alaska.
Length frequencies from the 1984 U.S. -Japan cooperative bottom trawlsurvey of the central and western gulf provide a basis for examining otheraspects of the Gulf of Alaska cod stock (size frequency modes can be used toestimate ages, especially for younger fish). The large 1977-78 year classes,for example, have largely lost their predominance in the population, althoughbiomass-weighted size compositions show that they are probably still contri-buting a small amount to the total biomass in the largest size category(Fig. 1). In the INPFC Shumagin Area, age-2+ cod (frequency mode of approxi-mately 40 cm) were relatively abundant and their biomass contributed a signi-ficant amount to survey catches. That mode should correspond to the 1982.year class. In the INPFC Chirikof and Kodiak Areas, on the other hand, the 2+age group was not widely found in survey catches. Generally, it appears thatpost-1977 recruitment has been strong enough to maintain the Gulf of Alaskacod stock at a relatively high level, given its apparent underexploitationat this time. Age-O+ cod were found as a component of relatively densesemipelagic schools during the 1984 triennial survey along Shelikof Troughnortheast of Chirikof Island and in lower Shelikof Strait near the AlaskaPeninsula. The possibility of a strong 1984 year class of Pacific cod in theGulf of Alaska was investigated during a late summer 1985 trawl survey ofjuvenile groundfish in the Kodiak Island to Shumagin Island region. JuvenilePacific cod were rarely caught during the survey which was largely exploratoryin nature. A similar trawl survey for juvenile groundfish was conducted in1986.
The next update of the status of Pacific cod stocks in the Gulf of Alaskawill follow the triennial groundfish trawl survey to be conducted during thesummer of 1987.
Alaska Department of Fish and Game Groundfish Trawl Surveys
The Alaska Department of Fish and Game (ADF&G) conducted summer groundfishtrawl surveys in Shelikof Strait from 1980 to 1985, and in the Chignik areafrom 1981 to 1984. Size compositions indicate annual changes in the size-specific abundance indices of fish that were available to capture by trawl in
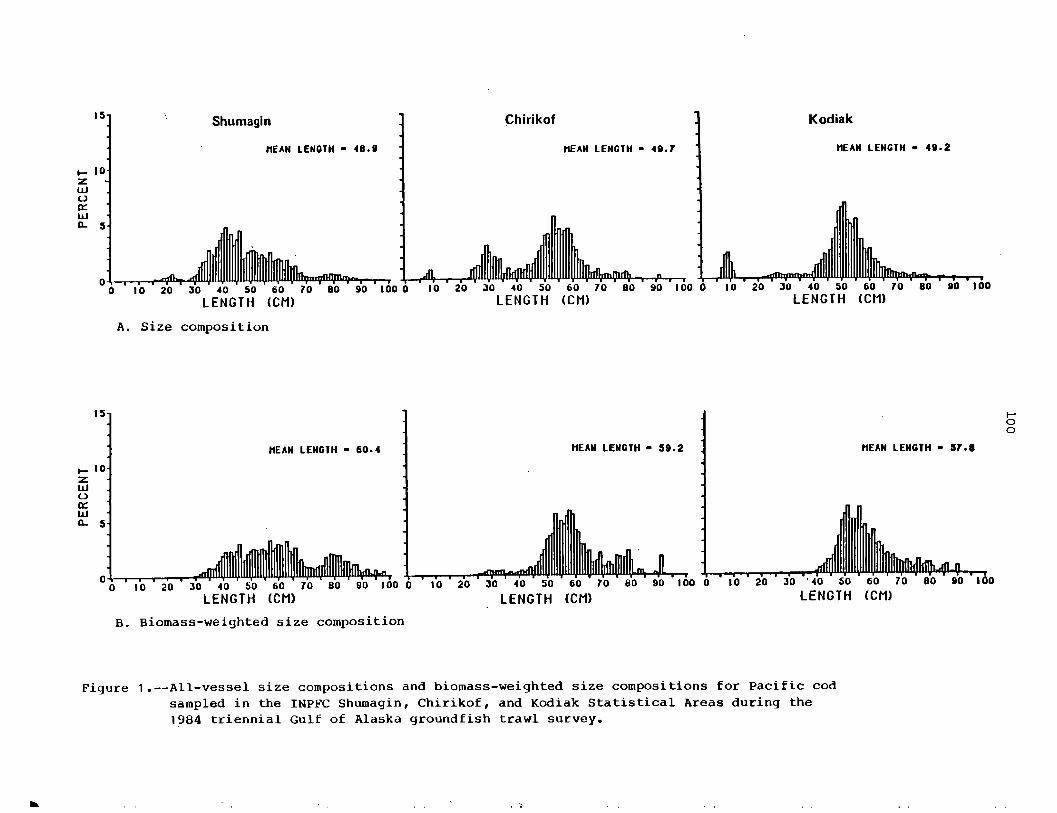
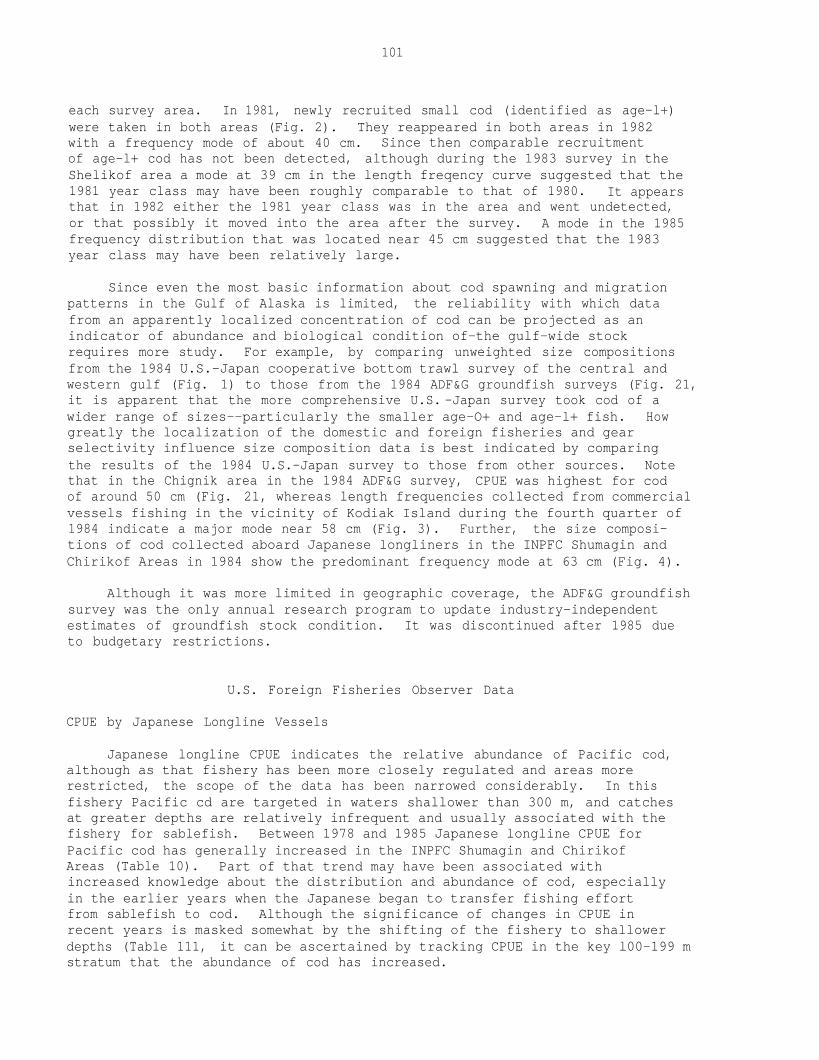
101
each survey area. In 1981, newly recruited small cod (identified as age-l+)were taken in both areas (Fig. 2). They reappeared in both areas in 1982with a frequency mode of about 40 cm. Since then comparable recruitmentof age-l+ cod has not been detected, although during the 1983 survey in theShelikof area a mode at 39 cm in the length freqency curve suggested that the1981 year class may have been roughly comparable to that of 1980. It appearsthat in 1982 either the 1981 year class was in the area and went undetected,or that possibly it moved into the area after the survey. A mode in the 1985frequency distribution that was located near 45 cm suggested that the 1983year class may have been relatively large.
Since even the most basic information about cod spawning and migrationpatterns in the Gulf of Alaska is limited, the reliability with which datafrom an apparently localized concentration of cod can be projected as anindicator of abundance and biological condition of-the gulf-wide stockrequires more study. For example, by comparing unweighted size compositionsfrom the 1984 U.S.-Japan cooperative bottom trawl survey of the central andwestern gulf (Fig. 1) to those from the 1984 ADF&G groundfish surveys (Fig. 21,it is apparent that the more comprehensive U.S. -Japan survey took cod of awider range of sizes--particularly the smaller age-O+ and age-l+ fish. Howgreatly the localization of the domestic and foreign fisheries and gearselectivity influence size composition data is best indicated by comparingthe results of the 1984 U.S.-Japan survey to those from other sources. Notethat in the Chignik area in the 1984 ADF&G survey, CPUE was highest for codof around 50 cm (Fig. 21, whereas length frequencies collected from commercialvessels fishing in the vicinity of Kodiak Island during the fourth quarter of1984 indicate a major mode near 58 cm (Fig. 3). Further, the size composi-tions of cod collected aboard Japanese longliners in the INPFC Shumagin andChirikof Areas in 1984 show the predominant frequency mode at 63 cm (Fig. 4).
Although it was more limited in geographic coverage, the ADF&G groundfishsurvey was the only annual research program to update industry-independentestimates of groundfish stock condition. It was discontinued after 1985 dueto budgetary restrictions.
U.S. Foreign Fisheries Observer Data
CPUE by Japanese Longline Vessels
Japanese longline CPUE indicates the relative abundance of Pacific cod,although as that fishery has been more closely regulated and areas morerestricted, the scope of the data has been narrowed considerably. In thisfishery Pacific cd are targeted in waters shallower than 300 m, and catchesat greater depths are relatively infrequent and usually associated with thefishery for sablefish. Between 1978 and 1985 Japanese longline CPUE forPacific cod has generally increased in the INPFC Shumagin and ChirikofAreas (Table 10). Part of that trend may have been associated withincreased knowledge about the distribution and abundance of cod, especiallyin the earlier years when the Japanese began to transfer fishing effortfrom sablefish to cod. Although the significance of changes in CPUE inrecent years is masked somewhat by the shifting of the fishery to shallowerdepths (Table 111, it can be ascertained by tracking CPUE in the key l00-199 mstratum that the abundance of cod has increased.

Figure 2.--Weighted length frequencies of Pacific cod sampled during annual Alaska Departmentof Fish and Game groundfish trawl surveys in the Shelikof Strait and Chignik areas,1980-85.
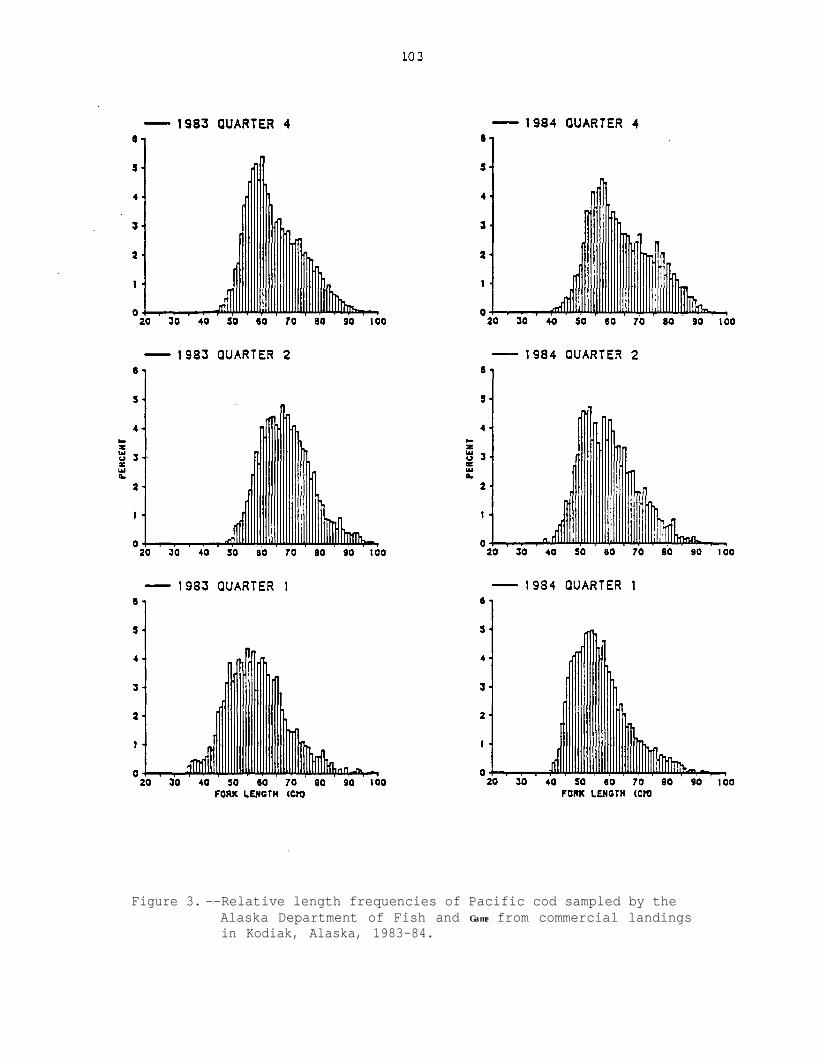
Figure 3. --Relative length frequencies of Pacific cod sampled by theAlaska Department of Fish and Game from commercial landingsin Kodiak, Alaska, 1983-84.

104
Figure 4. --Unweighted length frequencies and length frequencies expressedas metric tons of Japanese longline catches of Pacific codper centimeter of fork length, by quarter, 1979-84. (Catchestimates and length frequencies furnished by the U.S. foreignFisheries Observer Program, Seattle.)
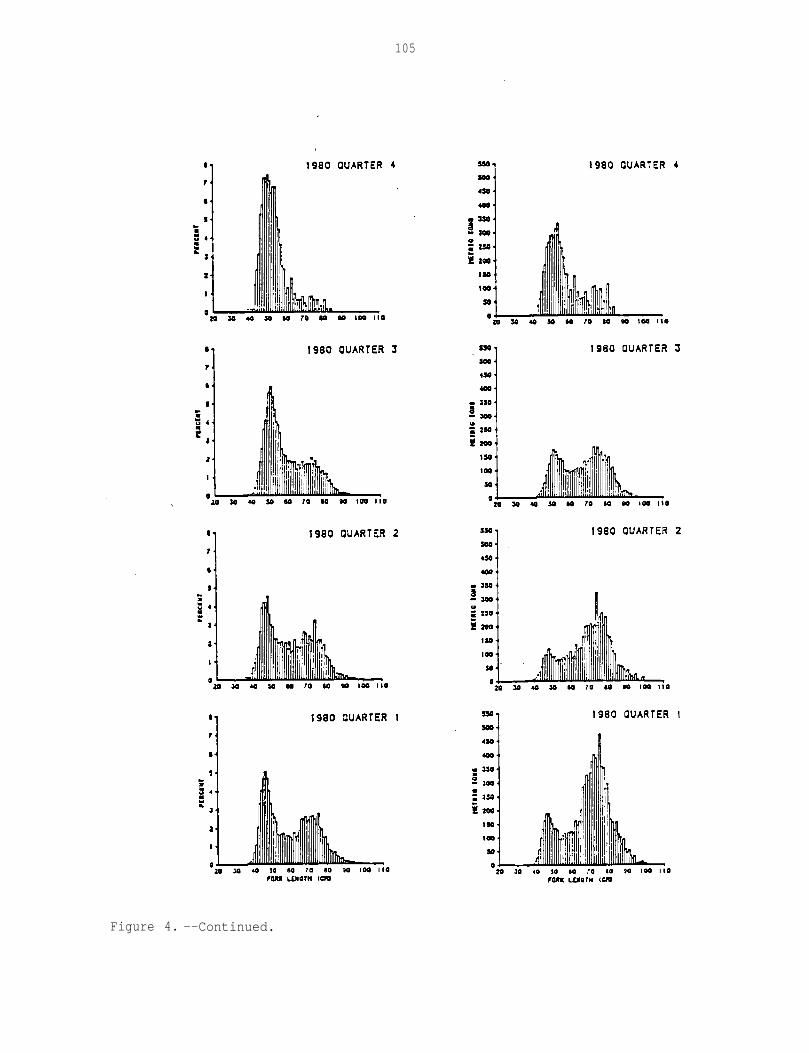
105
Figure 4. --Continued.

106
Figure 4. --Continued.
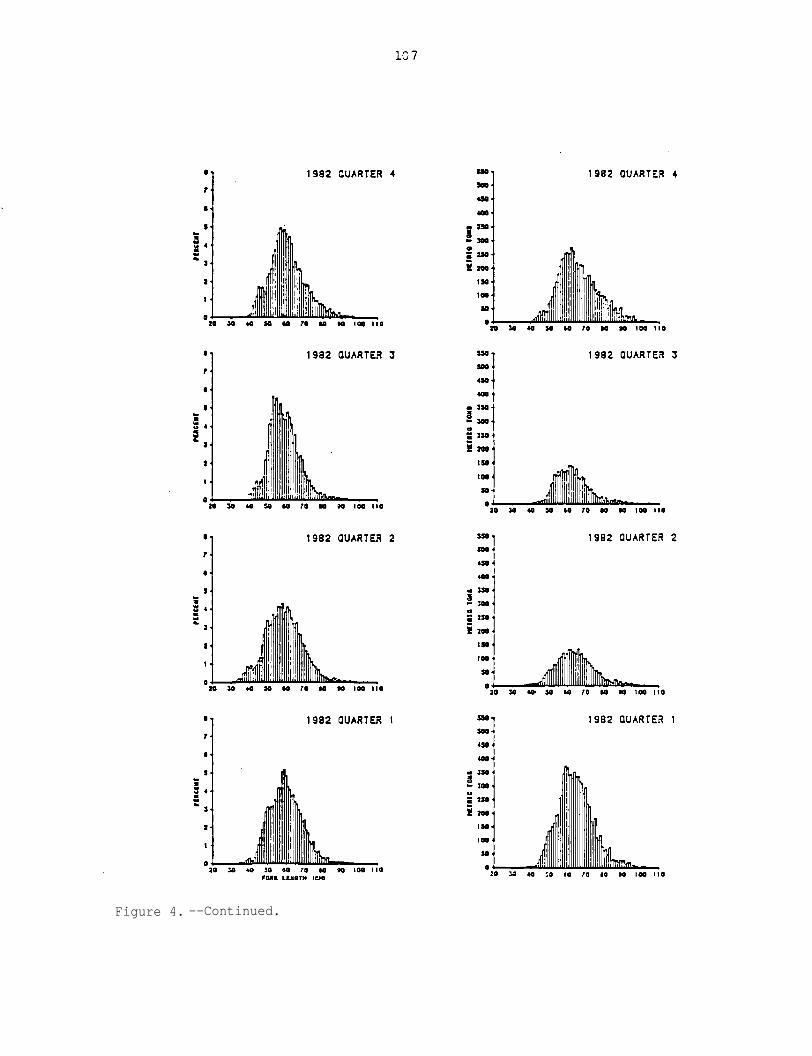
Figure 4. --Continued.
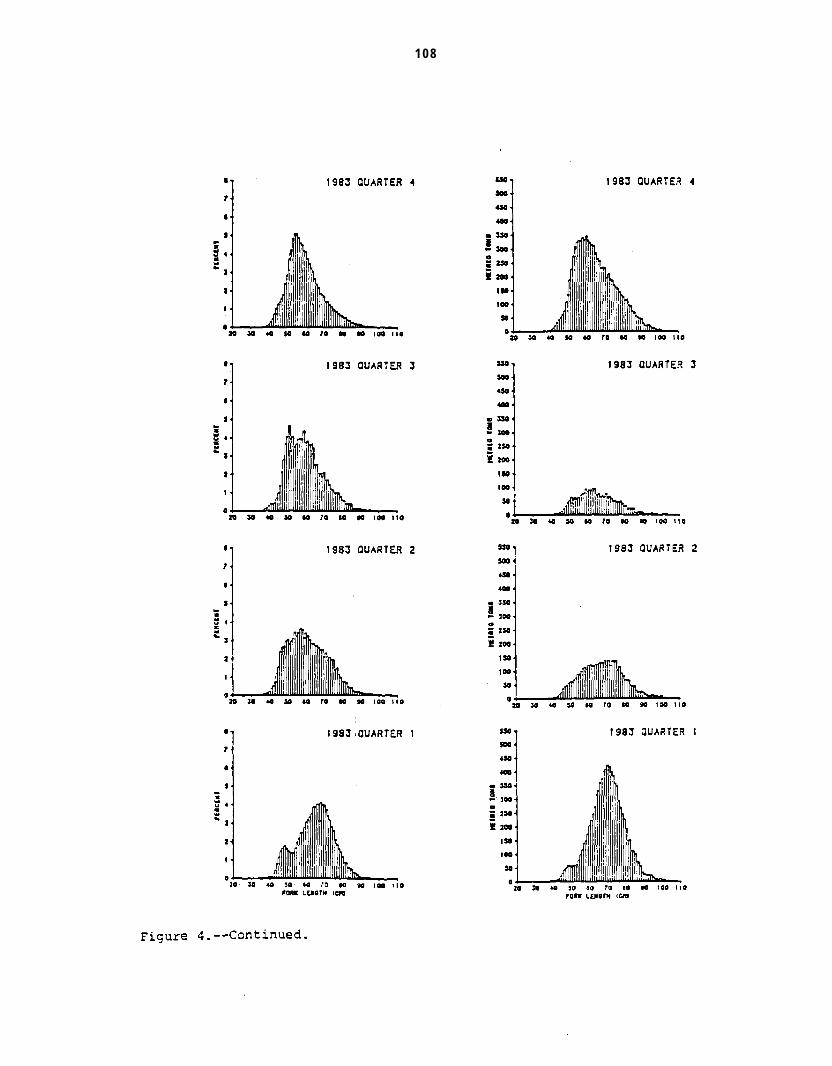
1 0 8

Figure 4. --Continued.
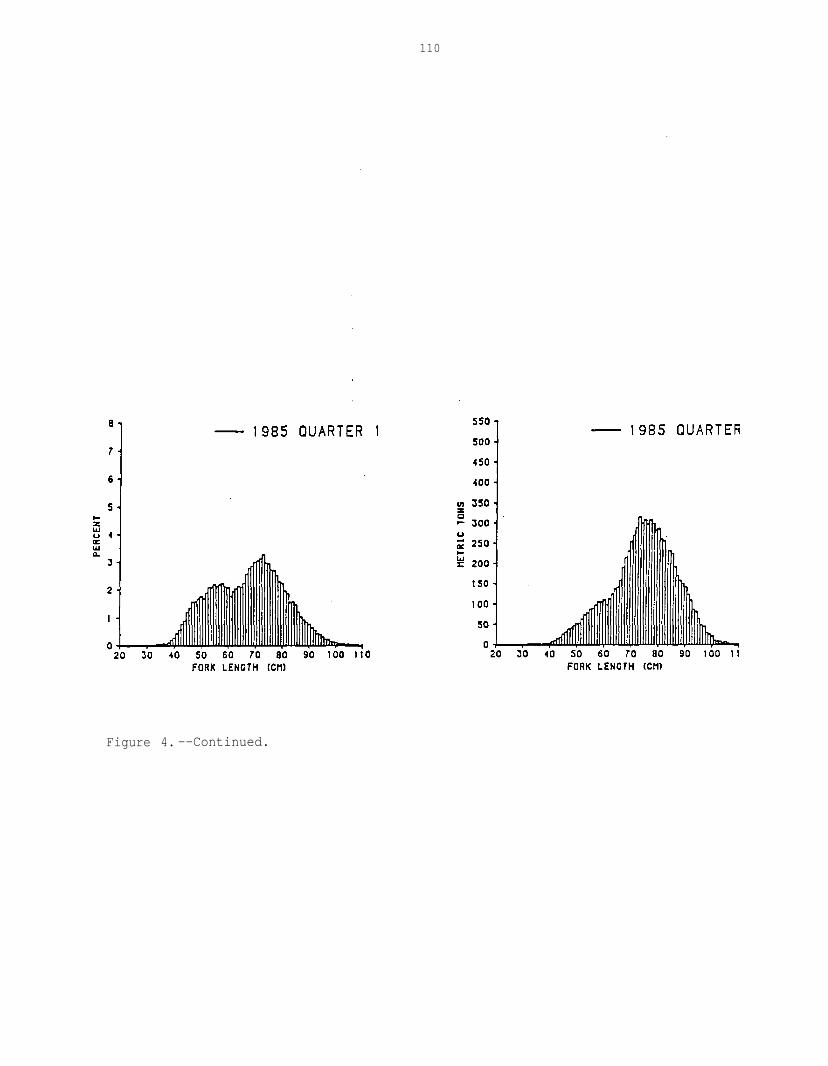
110
Figure 4. --Continued.
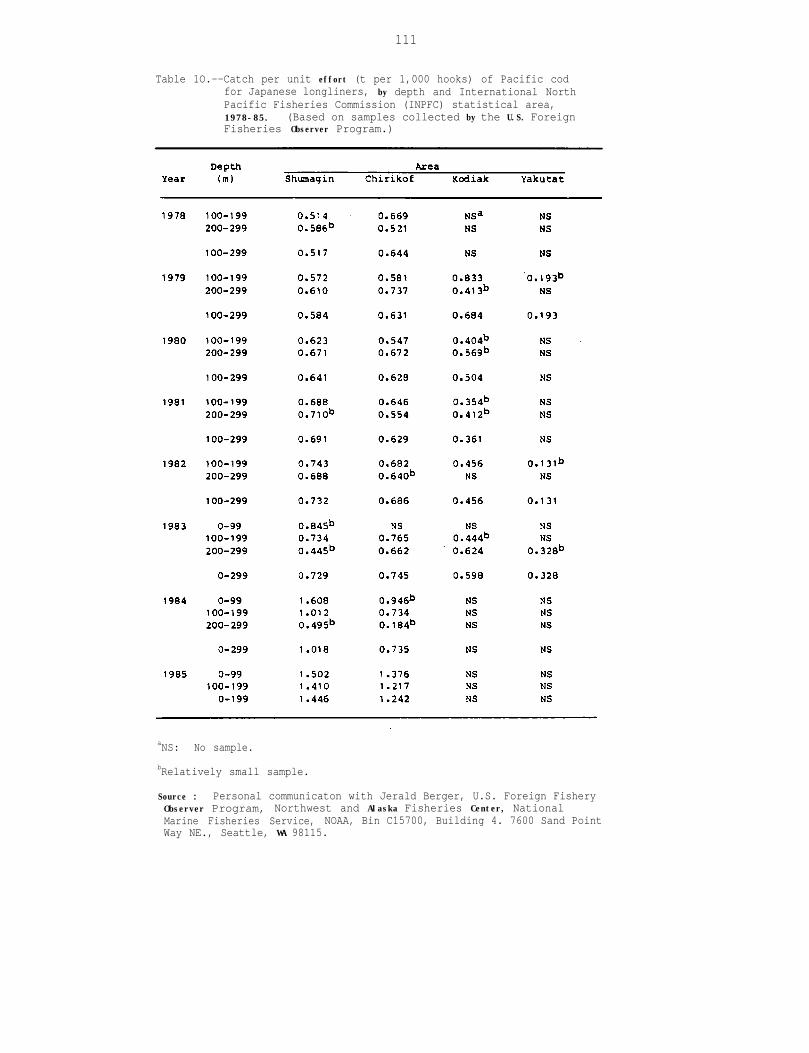
111
Table 1O.--Catch per unit effort (t per 1,000 hooks) of Pacific codfor Japanese longliners, by depth and International NorthPacific Fisheries Commission (INPFC) statistical area,1978-85. (Based on samples collected by the U.S. ForeignFisheries Observer Program.)
aNS: No sample.
bRelatively small sample.
Source : Personal communicaton with Jerald Berger, U.S. Foreign FisheryObserver Program, Northwest and Alaska Fisheries Center, NationalMarine Fisheries Service, NOAA, Bin C15700, Building 4. 7600 Sand PointWay NE., Seattle, WA 98115.
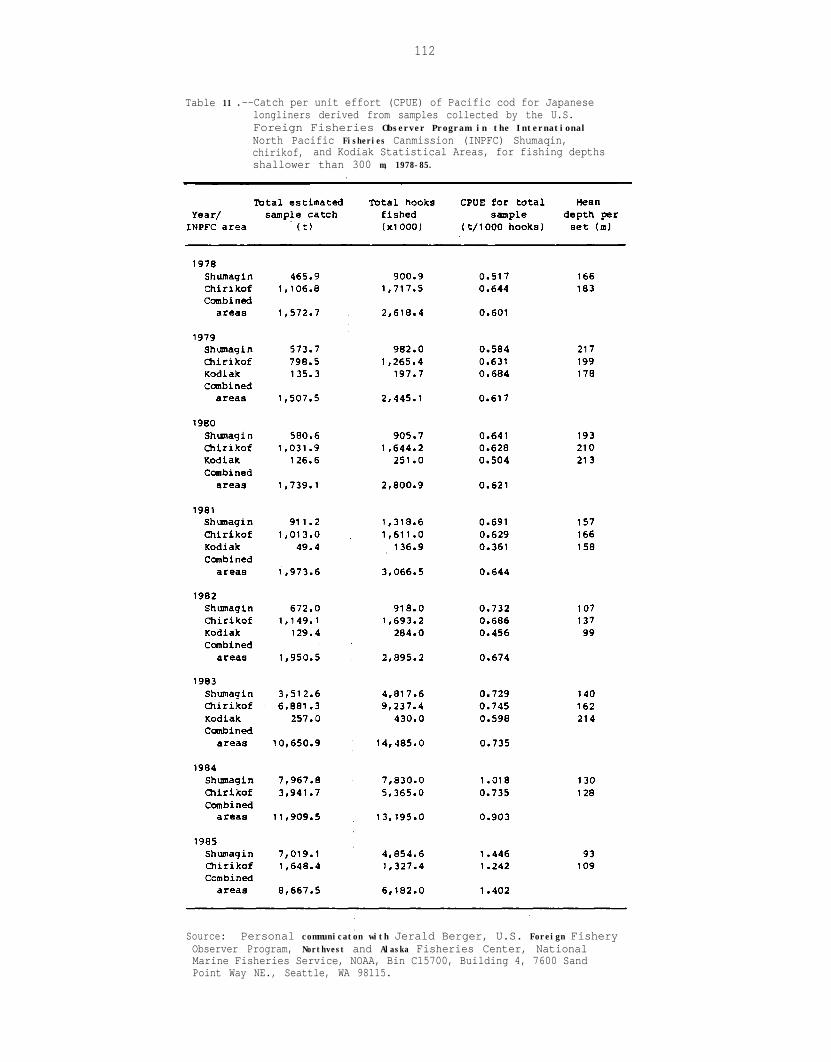
112
Table 11 .--Catch per unit effort (CPUE) of Pacific cod for Japaneselongliners derived from samples collected by the U.S.Foreign Fisheries Observer Program in the InternationalNorth Pacific Fisheries Canmission (INPFC) Shumaqin,chirikof, and Kodiak Statistical Areas, for fishing depthsshallower than 300 m, 1978-85.
Source: Personal communicaton with Jerald Berger, U.S. Foreign FisheryObserver Program, Northvest and Alaska Fisheries Center, NationalMarine Fisheries Service, NOAA, Bin C15700, Building 4, 7600 SandPoint Way NE., Seattle, WA 98115.

113
Ranked CPUE (kg/day) for the most, common species captured by the Japaneselongline fishery for Pacific cod shows that Pacific cod always ranks first,with Pacific halibut or sablefish second (Table 12). In 1983 and 1984 Pacifichalibut catch rates increased, probably because of the trend toward fishingin shallower waters, and the recent increase in the abundance of halibut. In1985 Japanese longliners fished only until early April and the CPUE of Pacifichalibut decreased somewhat from the previous 2 years.
It is appropriate to note here that another longline activity (Japan-U.S.longline surveys, 1978-85) suggests that cod recruitment has occurred duringeach year. Indices of abundance derived from that survey suggest that thecod population found deeper than 100 m in the Gulf of Alaska has been rela-tively stable since 1980 (Teshima 1986).
Size Composition of Pacific Cod Taken by Longliners
The most consistent and relatively long-term source of Pacific cod sizecomposition data from the Gulf of Alaska comes from the Japanese longlinefishery. Length frequency data from that fishery collected by the U.S.Foreign Fisheries Observer Program from 1979 to 1985 are summarized by 3-monthperiods in Figure 4. Length frequencies are weighted by the catch of Pacificcod for each quarter year. Resulting histograms show the relative contributionto the total quarterly catch made by each centimeter size group. Also includedwith the weighted size composition figures are unweighted length frequencies,since the miniscule biomass represented by the small fish often masks theirrelative year-class strengths. During the fourth quarter of 1979 a relativelyabundant group of fish appeared in the 40-50 cm interval, indicating thepresence of the 1977 year class in the fishery. The recruitment of the 1977year class (estimated as 3-year-olds from length-frequency modes) became morenotable in 1980 and with time, as the mode moved to the right and strengthened,the 1977 and possibly the 1978 year classes became the major contributors tothe Japanese longline fishery. (In the fourth quarter of 1980 there was onceagain a relatively large proportion of cod in the 40-50 cm range, suggestingthat the 1978 year class was also strong--although the overwhelming size ofthe preceding (1977) year class was such that the 1977 and 1978 year classescould not be separated by inspection of the frequency histograms). Indicationsare that there has been recruitment every year except 1984, and that the 1977,1978, and possibly the 1980 and 1982 year classes were relatively strong. Thelimited geographic distribution of the Japanese longline fleet and the early,abbreviated season may explain in part the lack of smaller fish in the 1984and 1985 catches.
POTENTIAL YIELD
Maximum sustainable yield (MSY) was estimated at 88,000-177,000 t by Lowet al. (1979) and at 95,000-190,000 t by Zenger and Cummings (1983) based onvarious Gulf of Alaska groundfish surveys that were conducted in 1980 and 1981.The results of the 1984 Gulf of Alaska triennial groundfish survey indicatethat the potential yield for the Western and Central Regulatory Areas is115,622 t with 95% confidence limits of approximately 87,000 to 154,000 t.

114
Table 12 .--Banked catch per unit effort (CPUE) in kilograms/day for thefour predominant species in Japanese longline catches fromdepths less than 300 m in the International North PacificFisheries Commission Shumagin, Chirikof, and KodiakStatistical Areas, 1979-85.
Source: Personal communication with Jerald Berger, U.S. ForeignFisheries Observer Program, Northwest and Alaska Fisheries Center,National Marine Fisheries Service, NOAA, Bin C15700, Building 4,7600 Sand Point Way NE., Seattle, WA 98115.

115
Although estimates for the INPFC Yakutat and Southeastern Areas were notincluded, the contribution by those areas would be relatively small, probablyan additional 10,000 t. The resulting estimate of mean yield (125,000 t) issomewhat smaller than the 1979 and 1982 estimates of 133,000 and 142,000 t.The current estimate was based on more cohesive data than the earlier estimates,with fewer unknown variables involved.
The OY has been maintained at about half of MSY in recent years. In 1986the OY was increased to 75,000 t to accommodate requests from the fishingindustry. This move was justified by the fact that the previous OY was low inrelation to the current estimated potential yield and that the ability tomonitor bycatches of Pacific halibut has improved greatly.
RESEARCH IN PROGRESS
Work is continuing to test the reliability of dorsal spines as agestructures. Pacific cod are being tagged as secondary objectives to otherprograms, principally to study their movements. Predator-prey relationshipsare being studied to enhance the information available for ecosystem modelling.
116
REFERENCES
Bakkala, R., S. Westrheim, K. Okada, C. Zhang, and E. Brown. 1981. Overalldistribution of Pacific cod in the North Pacific Ocean. Unpubl. manuscr.,11 p. Northwest and Alaska Fish. Cent., Natl. Mar. Fish. Serv., NOAA,BIN C15700, Bldg. 4, Sand Point Way NE., Seattle, WA 98115. (Documentsubmitted at the annual meeting of the INPFC, Vancouver, Canada, Nov.1986.)
Bakkala, R., and V. Wespestad. 1985. Pacific cod. In R. G. Bakkala andL. L. Low (editors), Condition of groundfish resources of the easternBering Sea and Aleutian Islands region in 1984, p. 37-50. U.S. Dep.Commer., NOAA Tech. Memo. NMFS F/NWC-83.
Berger, J. D., J. E. Smoker, and K. A. King. 1986. Foreign and joint venturecatches and allocations in the Pacific Northwest and Alaska fishing areasunder the Magnuson Fishery Conservation and Management Act, 1977-84.U.S. Dep. Commer., NOAA Tech. Memo. NMFS F/NWC-99, 53 p.
Forrester, C. R., R. G. Bakkala, K. Okada, and J. E. Smith. 1983. Groundfish,shrimp, and herring fisheries in the Bering Sea and northeast Pacific-historical catch statistics, 1971-1976. Int. North Pac. Fish. Comm.,Bull. 41, 100 p.
Gulland, J. A. 1975. Manual of methods for fisheries resource survey andappraisal. Part 5, Objectives and basic methods. FAO Fish. Tech. Pap.145, 29 p.
Low, L. L., M. Alton, V. Wespestad, and E. Brown. 1979. Condition of ground-fish stocks in the Gulf of Alaska. Unpubl. manuscr., 43 p. Northwestand Alaska Fish. Cent., 2725 Montlake Blvd. E., Seattle, WA 98112.(Document submitted to the annual meeting of the INPFC, Tokyo, Japan,Nov. 1979.)
Rigby, P. W. 1984. Alaska domestic groundfish fishery for the years 1970through 1980 with a review of two historic fisheries, Pacific cod (Gadusmacrocephalus) and sablefish (Anoplopoma fimbria). Alaska Dep. Fish Game,Tech. Rep. 108, 446 p.
Teshima, K. 1906. Stock assessment of Pacific cod in the eastern BeringSea, Aleutian Islands Region, and the Gulf of Alaska in 1986. Unpubl.manuscr., 22 p. Far Seas Fish. Res. Lab., Fisheries Agency of Japan,Shimizu, Japan.
Zenger. H. H., Jr. 1985. Summaries of Japanese reported longline catches of Pacific cod and sablefish in the Gulf of Alaska, 1978-83. U.S. Dep.Commer., NOAA Tech. Memo. NMFS F/NWC-82, 67 p.
Zenger, H. H., Jr. and N. Cummings. 1983. Pacific cod. In D. Ito and J.Balsiger (editors), Condition of groundfish resources in the Gulf ofAlaska in 1982, p. 87-109. U.S. Dep. Commer., NOAA Tech. Memo. NMFSF/NWC-52.

117
Zenger, H. H., Jr., and J. E. Blackburn. 1986. In R. L. Major (editor),Condition of groundfish resources in the Gulf of Alaska region asassessed in 1985, p. 109-138. U.S. Dep. Commer., NOAA Tech. Memo. NMFSF/NW-1 06.
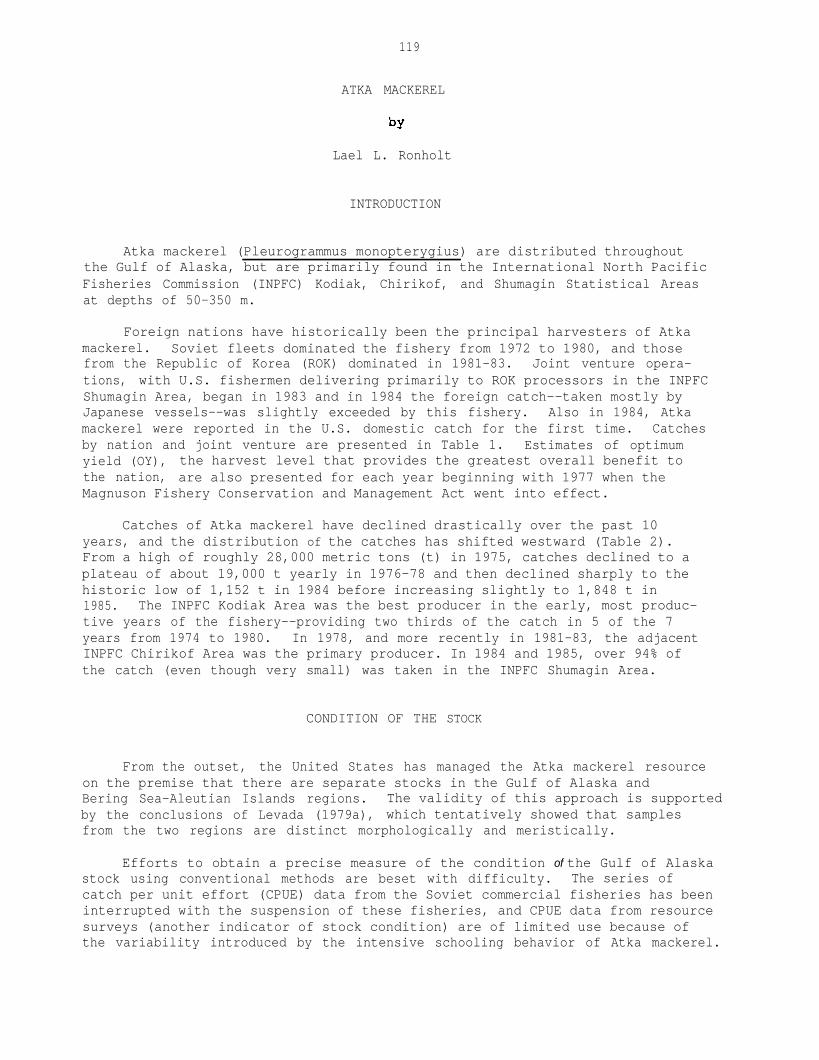
119
ATKA MACKEREL
Lael L. Ronholt
INTRODUCTION
Atka mackerel (Pleurogrammus monopterygius) are distributed throughoutthe Gulf of Alaska, but are primarily found in the International North PacificFisheries Commission (INPFC) Kodiak, Chirikof, and Shumagin Statistical Areasat depths of 50-350 m.
Foreign nations have historically been the principal harvesters of Atkamackerel. Soviet fleets dominated the fishery from 1972 to 1980, and thosefrom the Republic of Korea (ROK) dominated in 1981-83. Joint venture opera-tions, with U.S. fishermen delivering primarily to ROK processors in the INPFCShumagin Area, began in 1983 and in 1984 the foreign catch--taken mostly byJapanese vessels--was slightly exceeded by this fishery. Also in 1984, Atkamackerel were reported in the U.S. domestic catch for the first time. Catchesby nation and joint venture are presented in Table 1. Estimates of optimumyield (OY), the harvest level that provides the greatest overall benefit tothe nation, are also presented for each year beginning with 1977 when theMagnuson Fishery Conservation and Management Act went into effect.
Catches of Atka mackerel have declined drastically over the past 10years, and the distribution of the catches has shifted westward (Table 2).From a high of roughly 28,000 metric tons (t) in 1975, catches declined to aplateau of about 19,000 t yearly in 1976-78 and then declined sharply to thehistoric low of 1,152 t in 1984 before increasing slightly to 1,848 t in1985. The INPFC Kodiak Area was the best producer in the early, most produc-tive years of the fishery--providing two thirds of the catch in 5 of the 7years from 1974 to 1980. In 1978, and more recently in 1981-83, the adjacentINPFC Chirikof Area was the primary producer. In 1984 and 1985, over 94% ofthe catch (even though very small) was taken in the INPFC Shumagin Area.
CONDITION OF THE STOCK
From the outset, the United States has managed the Atka mackerel resourceon the premise that there are separate stocks in the Gulf of Alaska andBering Sea-Aleutian Islands regions. The validity of this approach is supportedby the conclusions of Levada (1979a), which tentatively showed that samplesfrom the two regions are distinct morphologically and meristically.
Efforts to obtain a precise measure of the condition of the Gulf of Alaskastock using conventional methods are beset with difficulty. The series ofcatch per unit effort (CPUE) data from the Soviet commercial fisheries has beeninterrupted with the suspension of these fisheries, and CPUE data from resourcesurveys (another indicator of stock condition) are of limited use because ofthe variability introduced by the intensive schooling behavior of Atka mackerel.
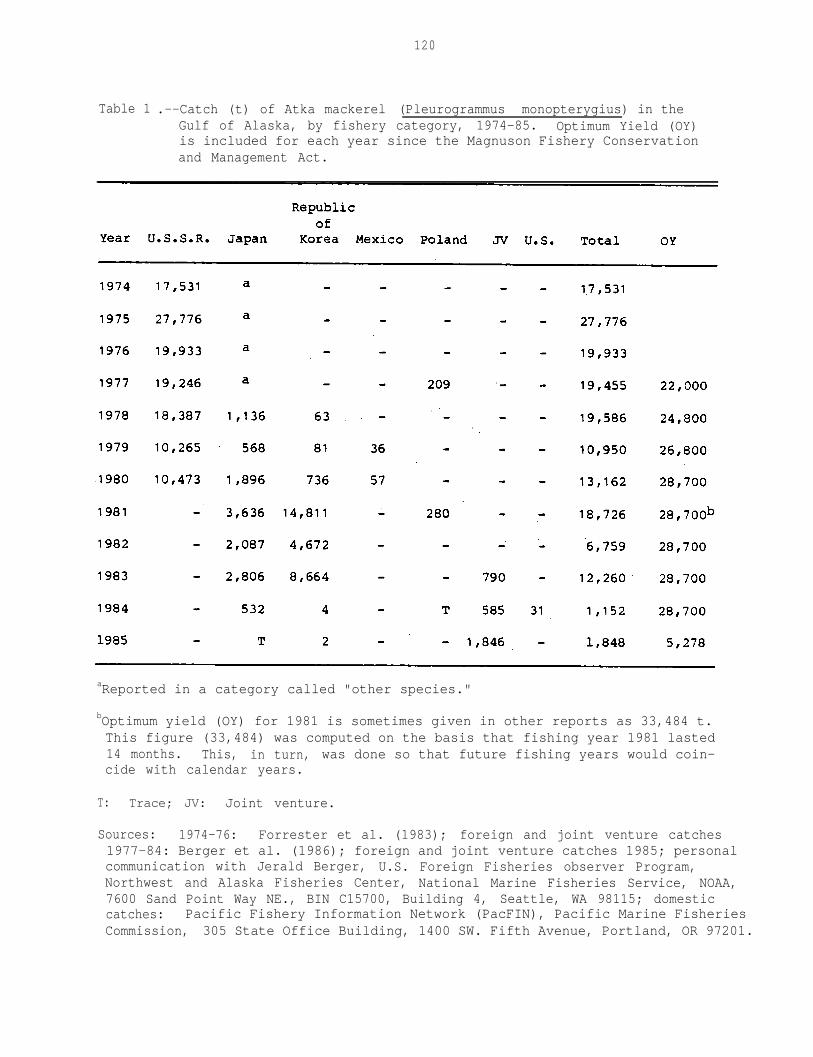
Table 1 .--Catch (t) of Atka mackerel (Pleurogrammus monopterygius) in theGulf of Alaska, by fishery category, 1974-85. Optimum Yield (OY)is included for each year since the Magnuson Fishery Conservationand Management Act.
120
aReported in a category called "other species."
bOptimum yield (OY) for 1981 is sometimes given in other reports as 33,484 t.This figure (33,484) was computed on the basis that fishing year 1981 lasted14 months. This, in turn,cide with calendar years.
was done so that future fishing years would coin-
T: Trace; JV: Joint venture.
Sources: 1974-76: Forrester et al. (1983); foreign and joint venture catches1977-84: Berger et al. (1986); foreign and joint venture catches 1985; personalcommunication with Jerald Berger, U.S. Foreign Fisheries observer Program,Northwest and Alaska Fisheries Center, National Marine Fisheries Service, NOAA,7600 Sand Point Way NE., BIN C15700, Building 4, Seattle, WA 98115; domesticcatches: Pacific Fishery Information Network (PacFIN), Pacific Marine FisheriesCommission, 305 State Office Building, 1400 SW. Fifth Avenue, Portland, OR 97201.

121
*Reported in a category called “other species."
T: Trace ROK: Republic of Korea, JV: Joint venture.
Sources: 1974-76: Forester et al. (19830, foreign and joint venture catches 1977-84:Berqer et al. (1986), foreign and joint venture catches 1985, personal communicationwith Jerald Berger, U.S. Foreign Fisheries Observer Program, Northwest and AlaskaFisheries Center, National Marine Fisheries Service, NOAA, 7600 Sand Point Way NE.,BIN C15700, Building 4. Seattle, WA 98115, domestic catches: Pacific FisheryInformation Network (PacFIN), Pacific Marine Fisheries Commission, 305 State OfficeBuilding, 1400 SW. Fifth Avenue, Portland, OR 97201.

122
Catch Data
Even without accompanying effort data, catch data can be used--to assessthe general condition of stock particularly when supported by associatedbiological data. Note, for example, the drastic decline of the catches inthe INPFC Kodiak Area --from an average 12,326 t in the period 1974-80 to anaverage of just 393 t in 1981-85, including a historical low of "only a trace"in 1985 (Table 2 and Fig. 1). The recent catches are indicative of thereduced biomass reported from research cruises. In 1981 the Soviet researchvessel Shantar, sampling on the usually productive Albatross Bank, was unableto locate any large concentrations of Atka mackerel. Similarly, in 1982Soviet scientists working aboard the research vessel Mys Dalniy were unableto obtain samples of Atka mackerel at the usual locations. Corroboratinginformation was obtained in 1984 during the U.S.-Japan cooperative bottomtrawl survey of the central and western Gulf of Alaska (Brown 1986). Basedon the small number of Atka mackerel taken in the INPFC Kodiak Area duringthe 1984 survey, biomass was estimated at only 516 t (Brown 1986). Further,an extensive U.S .-U.S.S.R. cooperative groundfish survey in 1985 produced noevidence of significant numbers of Atka mackerel in the INPFC Kodiak Area.
Catch data are too sporadic in the adjacent INPFC Chirikof Area to makesimilar long-term comparisons. Although landings in this area remainedhigher than in the INPFC Kodiak Area in 1982-83, they too decreased--to only58 t in 1984 and 3 t in 1985. Moreover, the U.S. resourcement assessment sur-vey took no Atka mackerel in the INPFC Chirikof Area in 1984, nor did the U.S.-U.S.S.R. survey in 1985.
Catches in the INPFC Shumagin Area were stable between 2,500 and 3,500 tin 1981-83, but this was assumed to be more reflective of the Total AllowableLevel of Foreign Fishing (TALFF) for the area (roughly 4,000 t) than of stockabundance. In 1984, when the foreign commercial catch in the INPFC ShumaginArea decreased to 1,087 t, the U.S.-Japan survey found Atka mackerel to bemore abundant there than in the other areas --with biomass being estimated at35,548 t, mostly in waters 100 m deep or less (Brown 1986). Only modestcatches of Atka mackerel were taken during the 1985 U.S .-U.S.S.R. cooperativesurvey.
Length
Fish length is another criterion for studying stock condition. For Atkamackerel in the Gulf of Alaska, data from the Soviet commercial fishery(collected either by the Soviet scientists or by the U.S. Foreign FisheriesObserver Program) and supplemented by data from U.S. research cruises are themost comprehensive in this regard. These data show that the proportion oflarger Atka mackerel in the INPFC Kodiak Area increased substantially between1971 and 1977, when 80% were 28-34 cm long, and 1981 and 1985, when at least86% were 40 cm or longer (Figs. 2 and 3). During the early years of thefishery, mean length of the samples fluctuated between 27 and 34 cm, indica-ting that the recruitment of young fish was consistently good. It is alsonoteworthy that fish 40 cm and larger were absent from the earlier (fishery)samples. The gradual increase of the mean and modal lengths and the absenceof yearclass pulses at the lower margin of the length frequency curve in

Year
Figure 1 .--Catch (t) of Atka mackerel (Pleurogrammus monopterygius) in theINPFC Kodiak Area and in the Gulf of Alaska as a whole,1 9 7 4 - 8 5 .
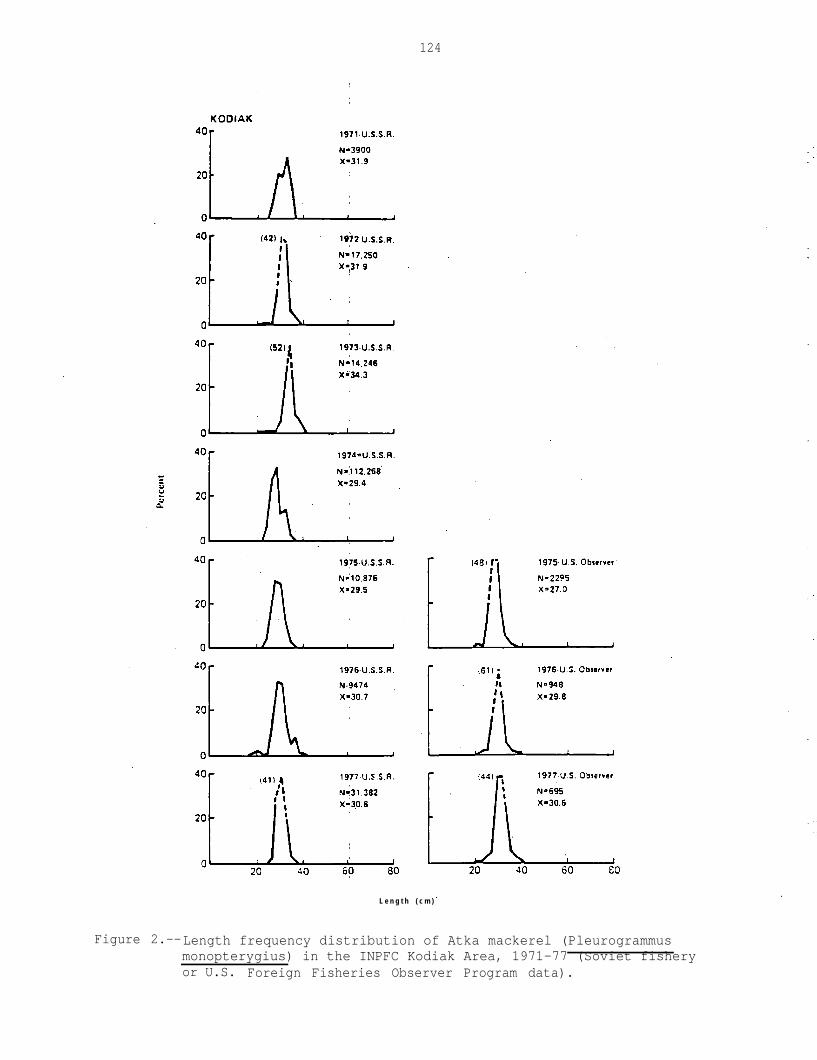
124
L e n g t h ( c m )
Figure 2.--Length frequency distribution of Atka mackerel (Pleurogrammusmonopterygius) in the INPFC Kodiak Area, 1971-77 (Soviet fisheryor U.S. Foreign Fisheries Observer Program data).
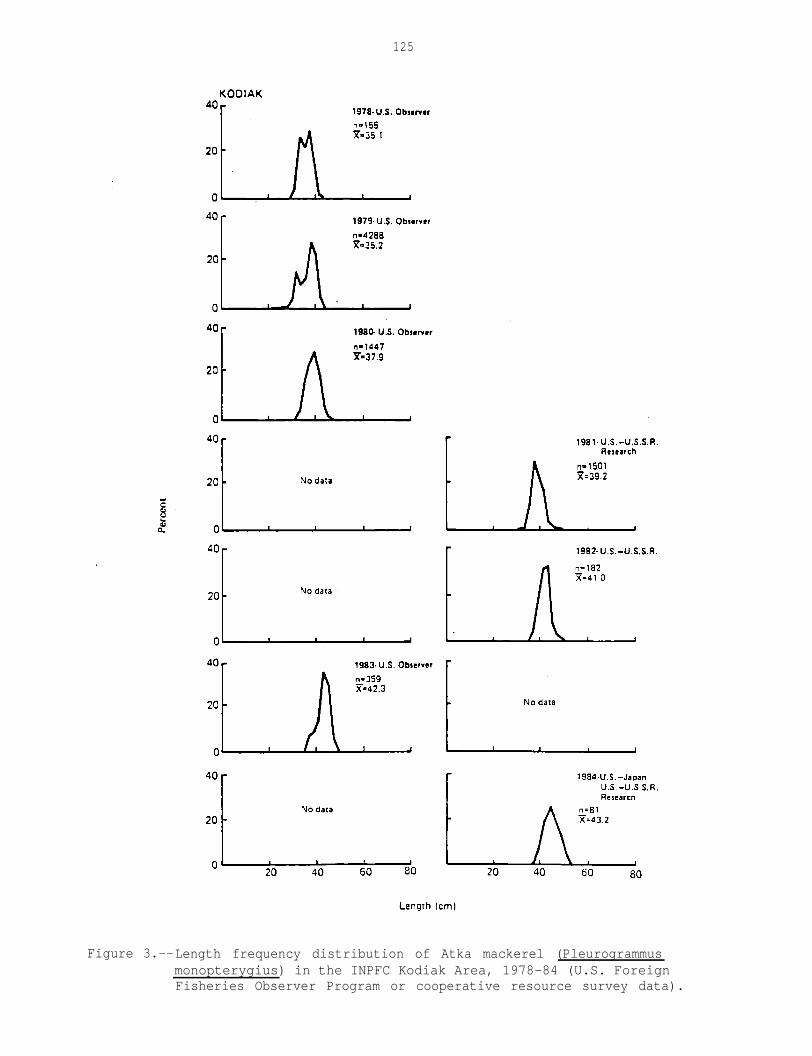
125
Figure 3.--Length frequency distribution of Atka mackerel (Pleurogrammusmonopterygius) in the INPFC Kodiak Area, 1978-84 (U.S. ForeignFisheries Observer Program or cooperative resource survey data).

126
recent years suggests that recruitment may be insufficient to maintain thestock at the high level once observed, or possibly that the recruitmentprocesses or even the conduct of the fishery itself have changed. The weakshowing of smaller fish in the 30 to 34 cm range was confirmed by data collectedby U.S. scientists aboard the Soviet research vessels Shantar and Mys Dalniyin the INPFC Kodiak Area in 1981-82, data from the Japanese commercial fisheryin 1983, data from the U.S. survey in 1984, and data from the U.S.-U.S.S.Rcooperative survey in 1985.
Length frequency data from the INPFC Chirikof Area are available fromthe Observer Program for 1978 and 1981-84, from the ROK commercial harvestfor 1981-84, and research surveys in 1984 (Fig. 4). In the INPFC ChirikofArea, as in the INPFC Kodiak Area, the mean length of samples taken in 1981-84has increased. Limited recruitment is indicated in the Observer Program datain 1982 and 1983, but not in 1984, nor in the ROK fishery samples. In 1984,both the observer and research data show a bimodal length frequency distri-bution, with modes at 39-42 and 45-47 cm.
Samples for the INPFC Shumagin Area are available from the U.S. ForeignFisheries Observer Program in 1980-84, the ROK commercial fishery in 1981-83(Fig. 51, the U.S.-U.S.S.R research surveys in 1982-85, and the joint venturefisheries-- U.S.-ROK (1983 and 1985) and U.S.-U.S.S.R. (1985) (Fig. 6). Thesedisplay increasing mean lengths from 1980 to present. The observer data andROK commercial fishing data indicate some recruitment in 1982, while theresearch surveys and the joint venture fishery data indicate additionalrecruitment in 1983-85.
Age composition is another commonly used indicator for studying stockcondition. However, because ages determined by Soviet scientists usingscales differ from those obtained by U.S. scientists using otoliths (Levada1979a; Levada 1979b; and Fadeev and Kharin 1981), the data offer firstapproximations at best.
Limited age samples are available for Atka mackerel in the INPFC KodiakArea. Observer samples were collected in 1978 and 1980 and resource assess-ment survey samples in 1982 and 1984.
Because most spawning in the Kodiak Area is completed by October (Fadeevand Kharin 1981) and the incubation period lasts 31-45 days, November 1 hasbeen selected as the birthday for the cohorts. Based on this criterion, theavailable age data indicate that since 1979 the stock in the Kodiak Area hasbeen dominated by the strong 1975 and 1977 year classes (Fig. 7).
Although the later samples,( 1982 and 1984) are quite small because of thelow abundance of Atka mackerel in the survey area, they show, nonetheless, thatthe 1975 and 1977 year classes are well represented. These data do not indicatethat there has been any substantial recruitment in the Kodiak Area in recentyears.

127
Length (cm)
Figure 4. --Length frequency distribution of Atka mackerel (Pleurogrammusmonopterygius) in the INPFC Chirikof Area, 1978-84(U.S. Foreign Fisheries Observer Program or Republic ofKorea fishery).
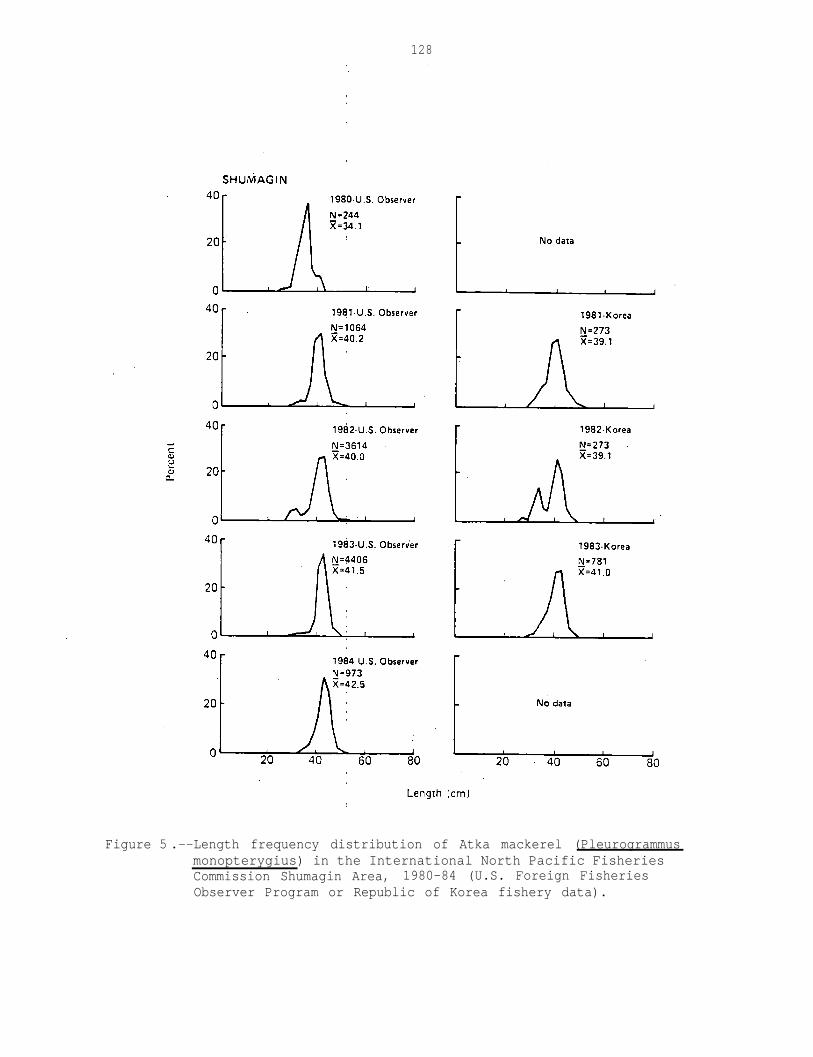
128
Figure 5 .--Length frequency distribution of Atka mackerel (Pleurogrammusmonopterygius) in the International North Pacific FisheriesCommission Shumagin Area, 1980-84 (U.S. Foreign FisheriesObserver Program or Republic of Korea fishery data).
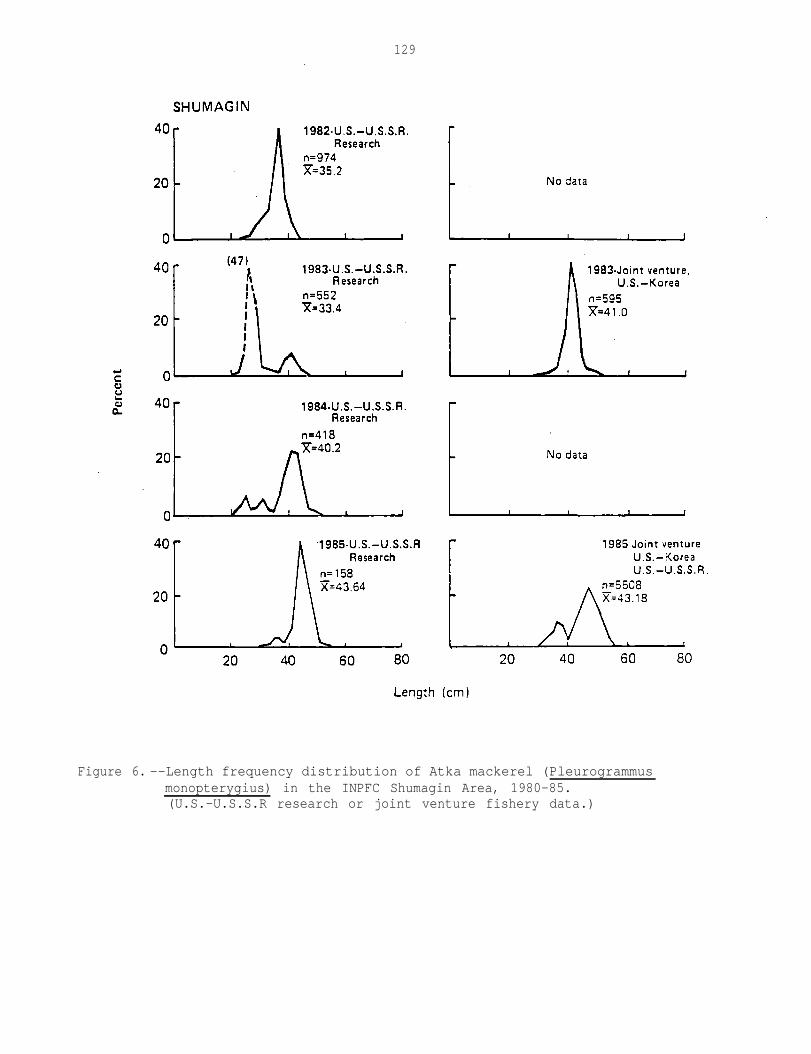
129
Figure 6. --Length frequency distribution of Atka mackerel (Pleurogrammusmonopterygius) in the INPFC Shumagin Area, 1980-85.(U.S.-U.S.S.R research or joint venture fishery data.)

130
Figure 7 .--Age composition of Atka mackerel (Pleurogrammus monopterygius)in the INPFC Kodiak Area, 1979, 1980, 1982, and 1984 (U.S.Foreign Fisheries Observer Program or cooperative resourcesurvey data).
131
Only one age sample, resource survey 1984, is available for Atka mackerelfrom the INPFC Chirikof Area. These data show that, among the older age groups,the 1977 year class was also dominant in the Chirikof Area. Significantly, thedata also indicate that there has been substantial recruitment in this area(Fig. 8).
There are two age samples from the INPFC Shumagin Area--one from the 1982resource assessment surveys and another from the 1984 Observer Program collec-tions. The data reveal that the 1977 year class was very dominant in thearea and that, although recruitment has generally been low, the 1982 yearclass is well represented (Fig. 8).
POTENTIAL YIELD
Estimates of Maximum Sustainable Yield
Maximum sustainable yield (MSY) is an average, over a reasonable length oftime, of the largest catch which can be taken continuously from a stock undercurrent environmental conditions. It normally is presented with a range ofvalues around its point estimate.
Early estimates of MSY necessarily were based on rather vague informationand assumptions. Soviet hydroacoustic surveys in the Aleutian Islands areain 1977 found eight concentrations of Atka mackerel with an estimated biomassof 110,000 t. Trawl surveys indicated a biomass thought to be as large in theGulf of Alaska. Most of the fish available to the trawls were 30 cm or longer-mature fish older than 3 or 4 years. On the basis of analyses of biologicalcharacteristics, Soviet scientists believed that 30% of the adult stock couldsafely be harvested. Accordingly, MSY for Atka mackerel in the Gulf of Alaskawas set at 33,000 t (North Pacific Fishery Management Council 1984).
In 1979 Soviet scientists conducted the first hydroacoustic and trawlsurvey of the western Gulf of Alaska between 148 and 164° W. long. (Fadeev1979). Their estimate of the biomass of Atka mackerel (32,447 t) became95,552 t when extrapolated to the entire Gulf of Alaska, including theunsurveyed areas east of 148° W. long. This agreed reasonably well with theestimated biomass of 110,000 t that had been projected on the basis of theAleutian survey. Subsequently, however, commercial fishing operations andresource assessment surveys have shown that Atka mackerel are not highlyabundant in the Gulf of Alaska east of 148° W. long. as was assumed by theSoviet scientists. It is likely, therefore, that the 32,447 t estimated toinhabit the area west of 148° W. long; is closer to the gulf-wide biomassthan the extrapolated estimate of 110,000 t.
Efimov (1984) tried a second approach. Employing a surplus productionmodel based on fishery data to circumvent problems with age determination, heestimated that between 1976 and 1979 biomass ranged from 69,210 to 89,167 t(Table 3) and that the MSY of harvestable fish, age 3 to 8 years, was 28,300 t.
It is appropriate to note, however, that the MSY of 28,300 t calculated byEfimov was based on years when biomass was high, as indicated by the limited

132
Figure 8.--Age composition of Atka mackerel in the INPFC Shumagin Area1 and the INPFC Chirikof Area (1984).(1984-85

133
Table 3 .--Mean catch per unit effort (CPUE), estimated biomass, and meanlength of Atka mackerel (Pleurogrammus monopterygius) in thein the Gulf of Alaska, 1971-80.
Sources: Mean CPUE 1975-79: Efimov (1984); 1980: Fadeev and Kharin (1981).Biomass: Efimov: (1984). Mean length 1971-77: Levada (1979b); 1978 and1979: personal communcation with Jerald Berger, U.S. Foreign FisheriesObserver Program, Northwest and Alaska Fisheries Center, National MarineFisheries Service, NOAA, 7600 Sand Point Way NE., Bin C15700, Building 4,Seattle, WA 98115; and 1980: Fadeev and Kharin (1981).

134
CPUE data available (Table 3) and the previously discussed stability of themean and modal lengths of fish in the commercial catch, rather than over along span of years.
The MSY also can be estimated using the equation developed by Alversonand Pereyra (1969) and modified by Gulland (1969):
MSY = a M Bo
where
a = constant 0.4 (Gulland) or 0.5 (Alverson and Pereyra),M = instantaneous natural mortality rate, and
BO= virgin biomass.
Using the values (a) = 0.4 and (M) = 0.6 (Efimov 1984) with Efimov'sminimum biomass estimate (Bo) of 69,210 t, a conservative MSY of 16,610 t canbe calculated for 3- to 5-year-old fish. Similarly, MSY of 26,750 t can beobtained using (a) = 0.5 and (M) = 0.6 with Efimov's maximum biomass estimate(Bo) of 89,167 t. The average of the two estimates is 21,680 t.
If, however, the biomass estimate (Bo) of the western gulf (36,100 t,rounded from Brown 1986) is used in conjunction with (a 1 values of 0.4 or0.5 and (M) = 0.6, MSY is estimated at 7,220 and 8,664 t, respectively.
Levada (1979b) reported that Atka mackerel were only found in smallnumbers in the commercial catches of the Gulf of Alaska before 1970, and thatthey occurred only in small numbers on the important Albatross and PortlockBanks prior to 1976. Within a year, however, there were large commercialcatches in these areas. One interpretation may be that Atka mackerel havenot always occurred in commercial concentrations in the Gulf of Alaska andthat the large catches and biomass estimates of the 1970's may reflect a"population explosion" and an accompanying geographic expansion of the stock.Based on this hypothesis, estimates of long-term MSY would be lower than anyof those computed above.
Estimates of Equilibrium Yield
Equilibrium yield (EY) is the annual or seasonal harvest which maintainsthe resource at approximately the same level of abundance (apart from theeffects of environmental variation) in succeeding seasons or years. It isusually less than MSY because abundance is normally not at the level whichproduces MSY.
From 1977 to 1984, the EY was set equal to the 33,000 t MSY that had,in turn, been derived from the early Soviet work (NPFMC 1984). By 1984,however, the decline of the catch in the historically important INPFC KodiakArea and the apparent low recruitment indicated that MSY was no longer attain-able and that EY should be set lower than MSY (Ronholt 1985). Based on
updated information on the condition of the stock, MSY was reestimated at7,800 t (the lower end of the range of estimates described earlier).

135
Estimates of Optimum Yield
The optimum yield (OY), after having been set at 87% of EY (28,700 t)in 1977-84, was determined by a new rationale for the 1985 fishing season.Noting the apparent-collapse of the stock based on information presented byRonholt (1985)(specifically, sharply declining catches, the westward shiftin distribution, and weak recruitment), the NPFMC sought to set OY as near tozero as was practical to allow the continued operations of the domestic,joint venture, and foreign fisheries. The OY was set at 4,678 t in the NPFMCWestern Regulatory Area (INPFC Shumagin Area), the same as in previous years,but reduced to 500 t and 100 t in the Central and Eastern Regulatory Areas.The latter amounts were intended to provide enough Atka mackerel for by-catchto allow fisheries targeting on other species to continue.
RECOMMENDATION
Based on the latest data--the continued decline of the commercial catches,low abundance as indicated by the resource assessment surveys, and the apparentlack of recruitment --it is recommended that OY again be held at a low levelfor the 1987 fishing season.
136
REFERENCES
Alverson, D. L., and W. T. Pereyra. 1969. Demersal fish explorations inthe northeastern Pacific Ocean--an evaluation of exploratory fishingmethods and analytical approaches to stock size and yield forecast.J. Fish. Res. Board Can. 26(8):1985-2001.
Berger, J. D., J. E. Smoker, and K. A. King. 1986. Foreign and joint venturecatches and allocations in the Pacific Northwest and Alaska fishingareas under the Magnuson Fishery Conservation and Management Act, 1977-84.U.S. Dep. Commer., NOAA Tech. Memo. NMFS F/NWC-99, 53 p.
Brown, E. S. 1986. Preliminary results of the 1984 U.S.-Japan cooperativebottom trawl survey of the central and western Gulf of Alaska. In R. L.Major (editor), Condition of groundfish resources of the Gulf of Alaskaregion as assessed in 1985, p. 259. U.S. Dep. Commer., NOAA Tech. Memo.NMFS F/NWC-106.
Efimov, Y. N. 1984. Stock condition and assessment of maximum sustainableyield of Atka mackerel in the Gulf of Alaska. Int. North Pac. Fish.comm., Bull. 42:82-84.
Fadeev, N. S. 1979. An analysis of the biomass of pollock, cod and Atkamackerel in the Gulf of Alaska as a consequence of a trawl survey inApril-May 1979 on th R/V Akademik Berg. Unpubl. manuscr., 13 p. PacificScientific Research Institute of Fisheries and Oceanography (TINRO),Vladivostok, U.S.S.R. (Document submitted at the U.S.-U.S.S.R. BilateralMeeting, 1979.)
Fadeev, N. S., and V. E. Kharin. 1981. Fisheries, size-and-age compositionand spawning terms of Atka mackerel on Albatross Bank (Gulf of Alaska).Unpubl. manuscr., 11 p. Pacific Scientific Research Institute ofFisheries and Oceanography (TINRO), Vladivostok, U.S.S.R. (Documentsubmitted at the U.S.-U.S.S.R. Bilateral Meeting, 1981.)
Forrester, C. R., R. G. Bakkala, K. Okada, and J. E. Smith. 1983. Groundfish,shrimp, and herring fisheries in the Northeast Pacific--historical catchstatistics, 1971-76. Int. North Pac. Fish. Comm., Bull. 41, 100 p.
Gulland, J. A. 1969. Manual of methods for fish stock assessment. Part 1.Fish population analysis. FAO Man. Fish. Sci. 4, 154 p.
Levada, T. P. 1979a. Comparative morphological study of Atka mackerel.Unpubl. manuscr., .7 p. Pacific Scientific Research Institute of Fisheriesand Oceanography (TINRO), Vladivostok, U.S.S.R. (Document submitted atthe U.S .-U.S.S.R. Bilateral Meeting, 1979.)
Levada, T. P. 1979b. Some data on biology and catch of Atka mackerel.Unpubl. manuscr., 13 p. Pacific Scientific Research Institute ofFisheries and Oceanography (TINRO), Vladivostok, U.S.S.R. (Documentsubmitted at the U.S .-U.S.S.R. Bilateral Meeting, 1980.)

137
North Pacific Fishery Management Council. 1984. Fishery management planfor the Gulf of Alaska groundfish fishery. Unpubl. manuscr., 200 p.North Pac. Fish. Manage. Counc., P.O. Box 103136, Anchorage, AK 96813.
Ronholt, L. L. 1985. Atka mackerel. In R. L. Major (editor), Condition ofgroundfish resources of the Gulf of Alaska region as assessed in 1984,p. 101-118. U.S. Dep. Commer., NOAA Tech. Memo. NMFS F/NWC-80.
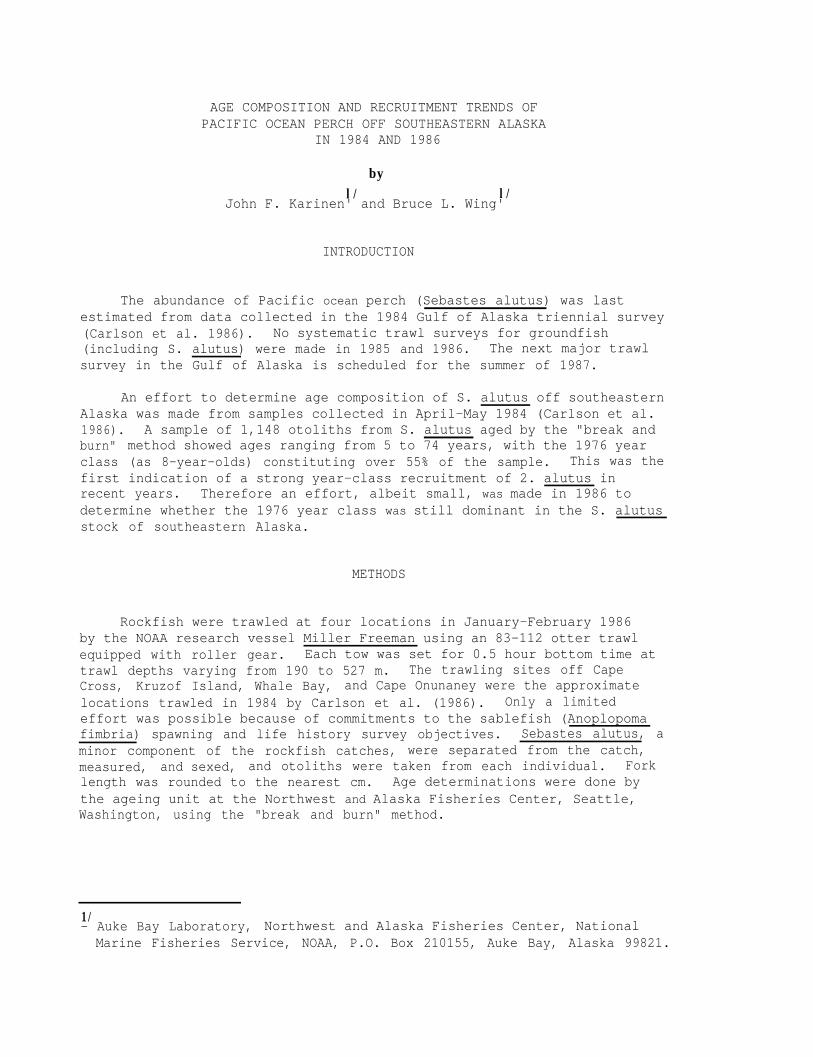
AGE COMPOSITION AND RECRUITMENT TRENDS OFPACIFIC OCEAN PERCH OFF SOUTHEASTERN ALASKA
IN 1984 AND 1986
byl/ l/
John F. Karinen' and Bruce L. Wing'
INTRODUCTION
The abundance of Pacific ocean perch (Sebastes alutus) was lastestimated from data collected in the 1984 Gulf of Alaska triennial survey(Carlson et al. 1986). No systematic trawl surveys for groundfish(including S. alutus) were made in 1985 and 1986. The next major trawlsurvey in the Gulf of Alaska is scheduled for the summer of 1987.
An effort to determine age composition of S. alutus off southeasternAlaska was made from samples collected in April-May 1984 (Carlson et al.1986). A sample of 1,148 otoliths from S. alutus aged by the "break andburn" method showed ages ranging from 5 to 74 years, with the 1976 yearclass (as 8-year-olds) constituting over 55% of the sample. This was thefirst indication of a strong year-class recruitment of 2. alutus inrecent years. Therefore an effort, albeit small, was made in 1986 todetermine whether the 1976 year class was still dominant in the S. alutusstock of southeastern Alaska.
METHODS
Rockfish were trawled at four locations in January-February 1986by the NOAA research vessel Miller Freeman using an 83-112 otter trawlequipped with roller gear. Each tow was set for 0.5 hour bottom time attrawl depths varying from 190 to 527 m. The trawling sites off CapeCross, Kruzof Island, Whale Bay, and Cape Onunaney were the approximatelocations trawled in 1984 by Carlson et al. (1986). Only a limitedeffort was possible because of commitments to the sablefish (Anoplopomafimbria) spawning and life history survey objectives. Sebastes alutus, aminor component of the rockfish catches, were separated from the catch,measured, and sexed, and otoliths were taken from each individual. Forklength was rounded to the nearest cm. Age determinations were done bythe ageing unit at the Northwest and Alaska Fisheries Center, Seattle,Washington, using the "break and burn" method.
1/- Auke Bay Laboratory, Northwest and Alaska Fisheries Center, NationalMarine Fisheries Service, NOAA, P.O. Box 210155, Auke Bay, Alaska 99821.
140
RESULTS
Of 130 S. alutus collected, 124 yielded ageable otoliths: 86 wifhinthe range of-interest (3-40 years); 38 at more than 40 years. Becausethese data showed some similarity to the age composition reported for thelarger 1984 sample, and because some interesting correlations appeared toexist between strong year-class groups and periods of warming in thenortheastern Gulf of Alaska, we elected to report on these few samplesand compare them with the 1984 age data for S. alutus.
The length of S. alutus taken at the four trawl stations ranged from23 to 40 cm. There-was a strong mode at 37 cm and minor modes at 28 and31 cm (Fig. 1). These length modes may correspond to modes in the agedistribution (Fig. 2). Fish aged as 6- and 8-year-olds may contributemost of the individuals in the 28 and 31 cm length modes, whereas fishover 10 years old probably contribute to the 37 cm mode. Length-agecorrelations within the rockfishes are highly variable, and within oursamples length was a poor estimator of age for fish older than 10 years(Fig. 3). Sixty-three percent of the 1986 sample were 5-10 years of ageand 25-36 cm in length.
DISCUSSION
Larger year classes of S. alutus in the 1984 catches (Table 1) andthe 1986 catches (Table 2) are grouped over the same general range ofyears. The 1984 data have relatively strong year classes: 1945, 1948,1950, 1952-56, 1958, 1972, and 1974-78. The 1986 data have a similartrend with some exceptions; relatively strong year classes representedwere 1948, 1950, 1952-56, 1968-70, 1972, and 1976-81. The fact that manyof the same year classes are represented in the small sample from 1986lends support to the idea that these years supported relatively strongyear classes of S. alutus.
Environmental data available from published literature are listed inTables 1 and 2 opposite the years of occurrence. These data show: 1) posi-tive, normal, or negative temperature anomalies of the near-surface watercolumn (O-200 m) at index site GOA 1 since 1975 and from stations nearthe sampling sites for 1950-60; 2) positive, normal, or negative temper-ature anomalies of sea-surface temperature for the Bering Sea; 3) incidenceof strong El Nino years in the North Pacific Ocean; and 4) years when theSitka Eddy (Tabata Eddy) was noted to be absent or present. Where dataare available, a positive correlation apparently exists between warm-wateryears and relatively strong year classes of S. alutus. The best correla-tion appears to be with the temperature anomaly of the upper 200 m of thewater column in the eastern Gulf of Alaska. A detailed statisticalanalysis of this apparent correlation will be attempted following thecollection and ageing of a large number of otoliths in 1987.
In recent years, especially 1977 and 1983, three factors--a strongEl Nino, positive temperature anomalies, and the presence of a SitkaEddy--co-occurred. Fish from the 1983 year class will not be availableto nets of the trawl surveys until 1987 or 1988, but 1976 and 1977 both

141
Figure 1 .--Length composition of Sebastes alutus collected January-February1986 off the southeastern Alaska (N = 130).
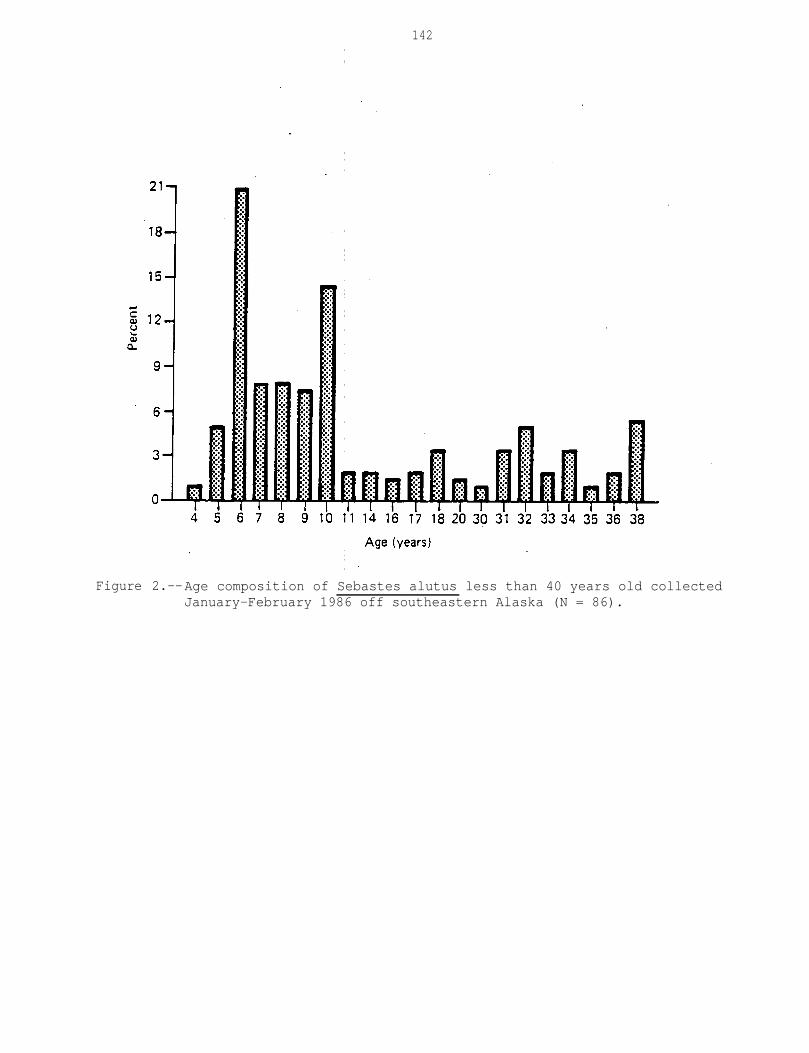
142
Figure 2.--Age composition of Sebastes alutus less than 40 years old collectedJanuary-February 1986 off southeastern Alaska (N = 86).
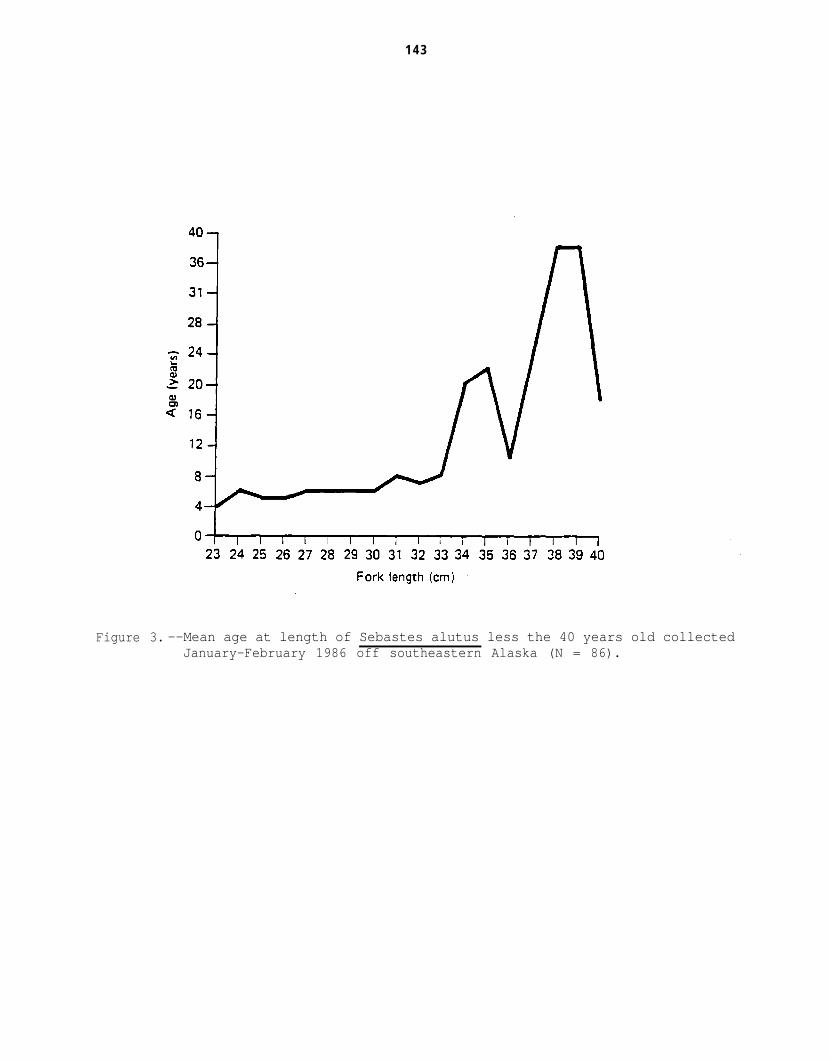
1 4 3
Figure 3. --Mean age at length of Sebastes alutus less the 40 years old collectedJanuary-February 1986 off southeastern Alaska (N = 86).
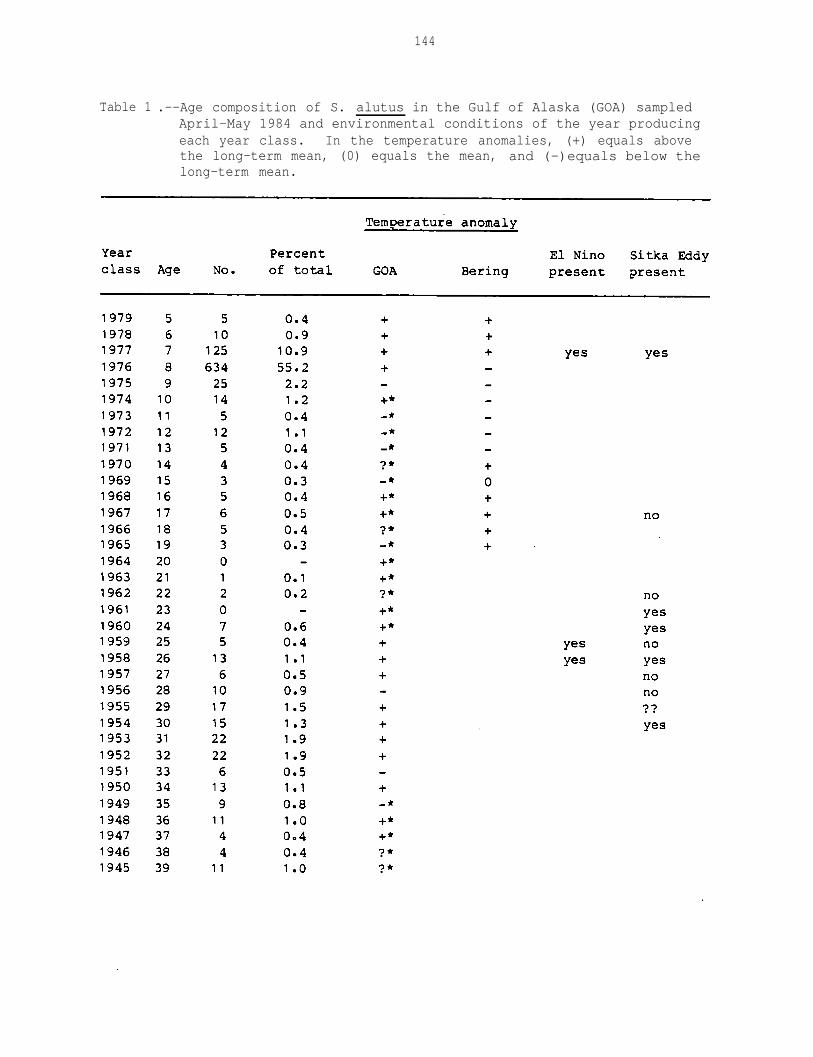
144
Table 1 .--Age composition of S. alutus in the Gulf of Alaska (GOA) sampledApril-May 1984 and environmental conditions of the year producingeach year class. In the temperature anomalies, (+) equals abovethe long-term mean, (0) equals the mean, and (-)equals below thelong-term mean.

145
Table 1 .--Continued.
*Preliminary data based on Sitka sea-surface temperatures.
Sources: Age data: Carlson et al. (1986); GOA temperature anomaly data 1950-59:Favorite and McLain (1972); GOA temperature anomaly data 1975-79: Royer (1985);Bering Sea temperature anomaly data: Niebauer (1985); El Nino presence: Cannonet al. (1985); Sitka Eddy presence: Mysak (1985).
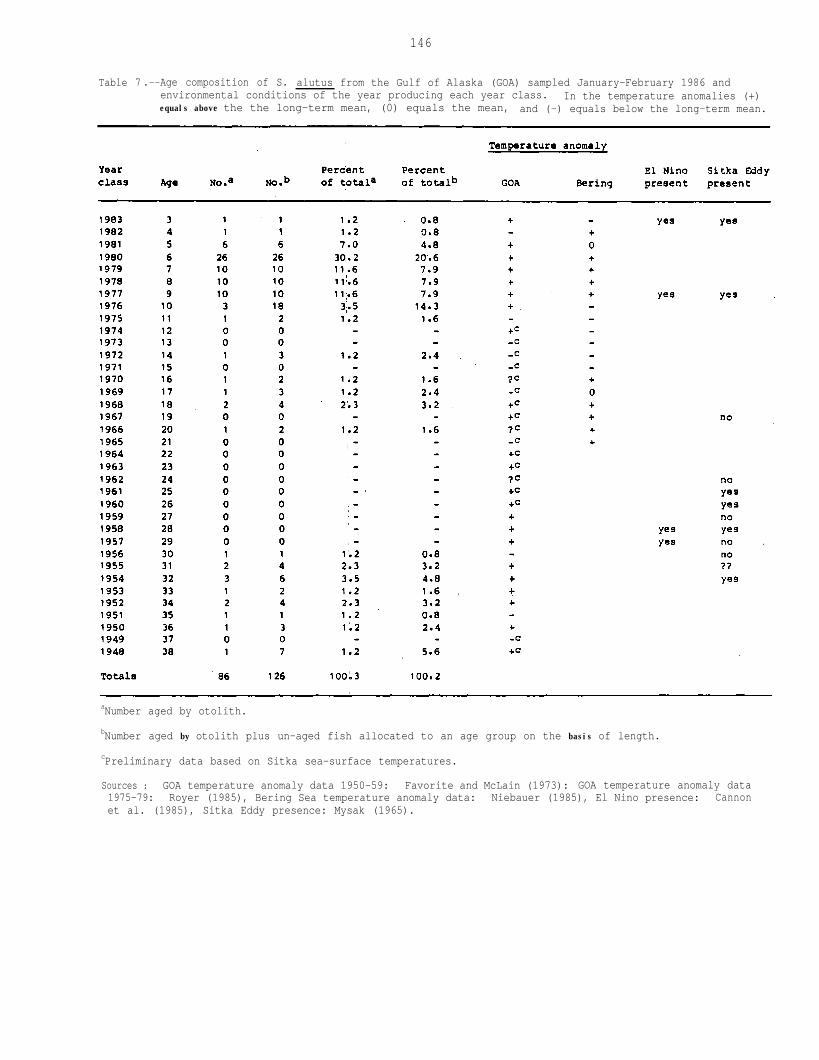
146
Table 7 .--Age composition of S. alutus from the Gulf of Alaska (GOA) sampled January-February 1986 andenvironmental conditions of the year producing each year class. In the temperature anomalies (+)equals above the the long-term mean, (0) equals the mean, and (-) equals below the long-term mean.
aNumber aged by otolith.
bNumber aged by otolith plus un-aged fish allocated to an age group on the basis of length.
cPreliminary data based on Sitka sea-surface temperatures.
Sources : GOA temperature anomaly data 1950-59: Favorite and McLain (1973): GOA temperature anomaly data1975-79: Royer (1985), Bering Sea temperature anomaly data: Niebauer (1985), El Nino presence: Cannonet al. (1985), Sitka Eddy presence: Mysak (1965).
147
produced fairly strong year classes. The large numbers of fish capturedfrom ages 5 to 10 could be an artifact of sampling and simply representavailability of these year classes before extensive fishing mortality andpredation affect them; however, the group of fish in year classes 1952-58and the correlationwith positive temperature anomalies appear to supportthe hypothesis that temperature is an influencing factor of S. alutusyear-class strength and survival.
Earlier reports on oceanography and fish biology support thehypothesis that thermal conditions influence year-class strengths.Favorite and McLain (1973) reported a correlation between warm years andstrong year classes 'of Pacific herring (Clupea harengus pallasi) between1952 and 1958, and other researchers (e.g., Bailey and Incze 1985) havealluded to a positive correlation between positive temperature anomaliesand S. alutus recruitment. If this correlation is real (which needs tobe confirmed by further data collection), then one may expect that 1983was a banner year for S. alutus recruitment. Hopefully, we will be able todiscern this within 2 or 3 years.
The question of whether 1976 was a good recruitment year, as indicatedby the 1984 data, is not succinctly borne out by the limited 1986 age data(only three fish were aged as being from the 1976 year class). However,when these three lo-year-old fish were supplemented by the 18 fish "aged"on the bases of length (Table 2) the 1976 year class appears to be strong.The inclusion of the 18 supplemental samples and the variability associatedwith the ageing process itself, and the desperate distributions of S. alutussuggest, however, that the conclusion that the 1976 year class is a-strongone be accepted with caution at this time. Clearly, additional samplingis required.
Nonetheless, it is suggested by the overall package of data presentedin this report that if the present warming trend in the North Pacific Ocean(Royer 1985) continues, we may expect a sequence of relatively strongeryear-class recruitments for S. alutus in the near future.

148
REFERENCES
Bailey, K. M., and L. S. Incze. 1985. El Nino and the early life historyand recruitment of fishes in temperate marine waters. In W. S.Wooster and D. L. Fluharty (editors), El Nino North: Nino effectsin the eastern subarctic Pacific Ocean, p. 143-165. Washington SeaGrant College Program, Univ. Washington, Seattle, WSG-WO85-3.
Cannon, G. A., R. K. Reed, and P. E. Pullen. 1985. Comparison of ElNino events off the Pacific Northwest. In W. S. Wooster, and D. L.Fluharty (editors), El Nino North: Nino effects in the easternsubarctic Pacific Ocean, p. 75-84. Washington Sea Grant CollegeProgram, Univ. Washington, Seattle, WSG-W085-3.
Carlson, H. R., D. H. Ito, R. E. Haight, T. L. Rutecki, and J. F. Karinen.1986. Pacific ocean perch. In R. L. Major (editor), Condition ofGroundfish Resources of the Gulf of Alaska Region as assessed in1985, p. 155-209. U.S. Dep. Commer., NOAA Tech. Memo. NMFS F/NWC-106.
Favorite, F., and D. R. McLain. 1973. Coherence in transpacific movementsof positive and negative anomalies of sea surface temperature, 1953-60.Nature 244: 139-143.
Mysak, L. A. 1985. On the interannual variability of eddies in theNortheast Pacific Ocean. In W. S. Wooster, and D. L. Fluharty(editors), El Nino North: Nino effects in the eastern SubarcticPacific Ocean, p. 97-106. Washington Sea Grant College Program.Univ. Washington, Seattle, WSG-W085-3.
Niebauer, H. J. 1985. Southern Oscillation/El Nino effects in the easternBering Sea. In W. S. Wooster, and D. L. Fluharty (editors), El NinoNorth : Nino effects in the eastern subarctic Pacific Ocean, p. 116-118.Washington Sea Grant College Program, Univ. Washington, Seattle, WSG-WO85-3.
Royer, T. C. 1985. Coastal temperatures and salinity anomalies in thenorthern Gulf of Alaska, 1970-1984. In W. S. Wooster, and D. L.Fluharty (editors), El Nino North: Nino effects in the easternSubarctic Pacific Ocean, p. 107-115. Washington Sea Grant CollegeProgram, Univ. Washington, Seattle, WSG-W085-3.
149
PACIFIC OCEAN PERCH
byl/
John F. Karinen' and Bruce L. Wing'l/
INTRODUCTION
The last major trawl efforts to assess the condition of the Pacific oceanperch complex (Sebastes alutus and four congeneric species) in the Gulf ofAlaska were the 1981 and 1984 triennial surveys (Shippen 1985). Data fromthese surveys were presented and discussed in status of stock documents(Shippen 1985; Carlson et al. 1986). Historical background is included inboth documents.
The Pacific ocean perch complex remains in a depressed condition, butit is probable that recent recruitments will improve the stocks within afew years (Carlson et al. 1986; Karinen and Wing (another chapter, also onPacific ocean perch) in this report). This paper summarizes and updatesimportant portions of the discussions in Shippen's and Carlson's papersrelating to fishery statistics, management actions, condition of the stock,and age composition. As the terms are used here, "Pacific ocean perch" and"Pacific ocean perch complex" refer to the five-species assemblage, while S.alutus refers to the single species.
FISHERY STATISTICS
History of the Fisheries
Commercial fishing for Pacific ocean perch began in the late 1940s inthe Pacific Northwest (Major and Shippen 1970). Foreign trawl fisheries inthe Gulf of Alaska began with Soviet fleets in the early 196Os, followed bythose of Japan in 1963, and the Republic of Korea (ROK) in 1966 (Chitwood1969). Massive efforts, primarily by the Soviets and Japanese, produced apeak catch of 348,598 metric tons (t) of rockfish in 1965--mostly 5. alutus.By 1977, annual catches were down to 23,453 t and, except for short-termincreases, they continued to decline thereafter (Carlson et al. 1986).
Current Catches
The 1985 all-nation catch of Pacific ocean perch in the Gulf of Alaskawas 1,087 t (Tables 1 and 2). This was 24% of the 1984 catch and reflectsa continuing decline in Pacific 'ocean perch allocations by the North Pacific
l/- Auke Bay Laboratory, Northwest and Alaska Fisheries Center, National Marine
Fisheries Service, NOAA, P. 0. Box 210155, Auke Bay, AK 99821.

150
Table 1 .--Catch, acceptable biological catch (ABC), and optimum yield (OY)(all t) of Pacific ocean perch in the Gulf of Alaska, by NorthPacific Fishery Management Council regulatory area, 1977-85.
Sources: Catch data 1977-84: Carlson et al. (1986); 1985: Pacific FisheryInformation Network (PacFIN), Pacific Marine Fisheries Commission,308 State Office Building, 1400 SW. Fifth Avenue, Portland, OR 97201.

151
Table 2 .--Catch (t) of Pacific ocean perch in the Gulf of Alaska,by fishery category and North Pacific Fishery ManagementCouncil regulatory area, 1981-85.
Sources: 1981-84: Carlson et al. (1986); 1985: Pacific FisheryInformation Network (PacFIN), Pacific Marine Fisheries Commission,305 State Office Building, 1400 SW. Fifth Avenue, Portland, OR 97201.
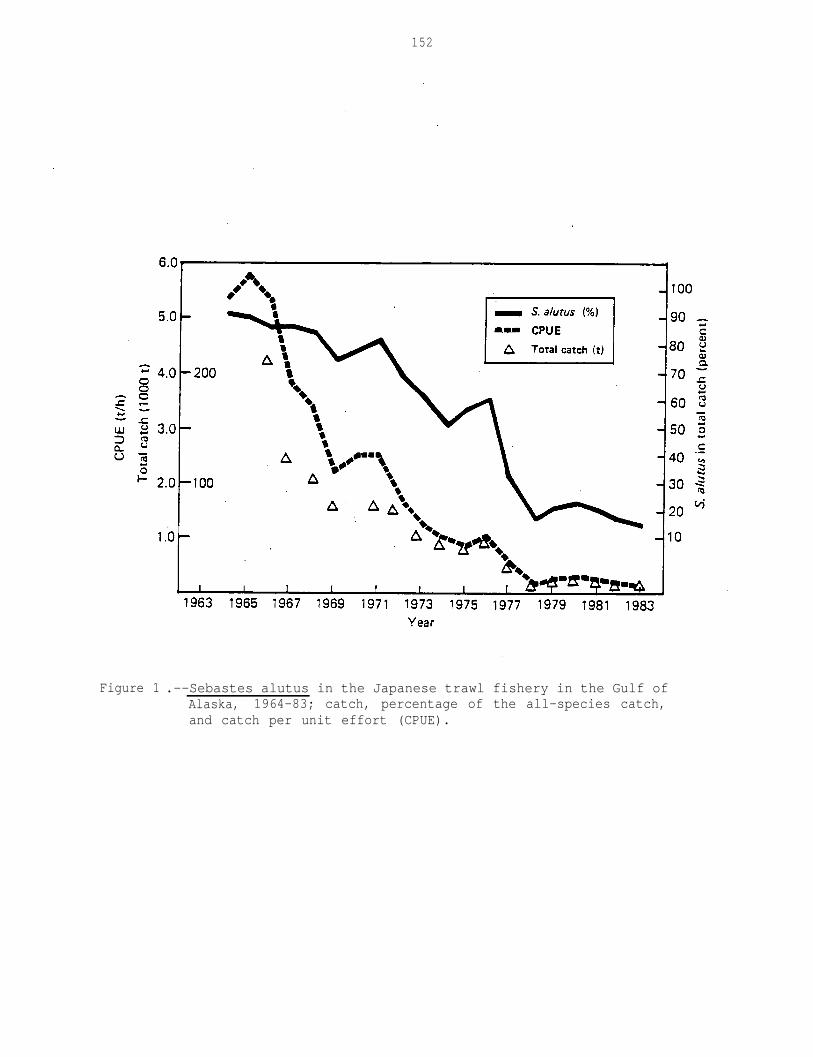
152
Figure 1 .--Sebastes alutus in the Japanese trawl fishery in the Gulf ofAlaska, 1964-83; catch, percentage of the all-species catch,and catch per unit effort (CPUE).
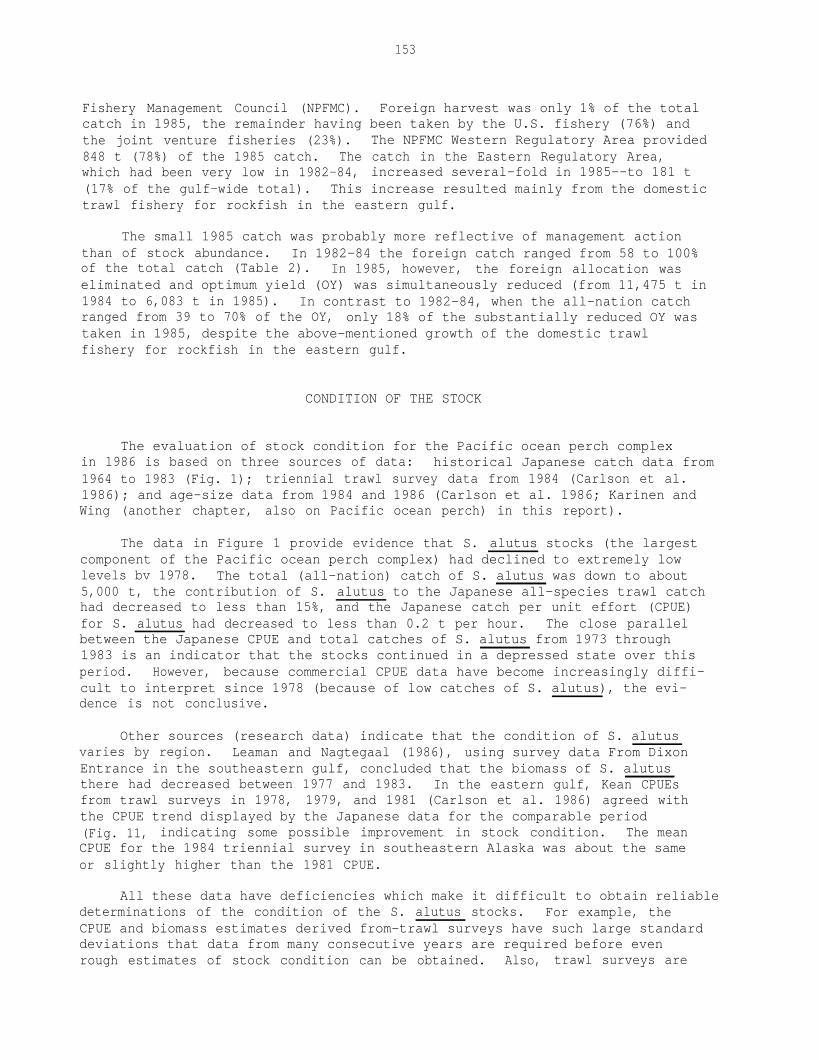
153
Fishery Management Council (NPFMC). Foreign harvest was only 1% of the totalcatch in 1985, the remainder having been taken by the U.S. fishery (76%) andthe joint venture fisheries (23%). The NPFMC Western Regulatory Area provided848 t (78%) of the 1985 catch. The catch in the Eastern Regulatory Area,which had been very low in 1982-84, increased several-fold in 1985--to 181 t(17% of the gulf-wide total). This increase resulted mainly from the domestictrawl fishery for rockfish in the eastern gulf.
The small 1985 catch was probably more reflective of management actionthan of stock abundance. In 1982-84 the foreign catch ranged from 58 to 100%of the total catch (Table 2). In 1985, however, the foreign allocation waseliminated and optimum yield (OY) was simultaneously reduced (from 11,475 t in1984 to 6,083 t in 1985). In contrast to 1982-84, when the all-nation catchranged from 39 to 70% of the OY, only 18% of the substantially reduced OY wastaken in 1985, despite the above-mentioned growth of the domestic trawlfishery for rockfish in the eastern gulf.
CONDITION OF THE STOCK
The evaluation of stock condition for the Pacific ocean perch complexin 1986 is based on three sources of data: historical Japanese catch data from1964 to 1983 (Fig. 1); triennial trawl survey data from 1984 (Carlson et al.1986); and age-size data from 1984 and 1986 (Carlson et al. 1986; Karinen andWing (another chapter, also on Pacific ocean perch) in this report).
The data in Figure 1 provide evidence that S. alutus stocks (the largestcomponent of the Pacific ocean perch complex) had declined to extremely lowlevels bv 1978. The total (all-nation) catch of S. alutus was down to about5,000 t, the contribution of S. alutus to the Japanese all-species trawl catchhad decreased to less than 15%, and the Japanese catch per unit effort (CPUE)for S. alutus had decreased to less than 0.2 t per hour. The close parallelbetween the Japanese CPUE and total catches of S. alutus from 1973 through1983 is an indicator that the stocks continued in a depressed state over thisperiod. However, because commercial CPUE data have become increasingly diffi-cult to interpret since 1978 (because of low catches of S. alutus), the evi-dence is not conclusive.
Other sources (research data) indicate that the condition of S. alutusvaries by region. Leaman and Nagtegaal (1986), using survey data From DixonEntrance in the southeastern gulf, concluded that the biomass of S. alutusthere had decreased between 1977 and 1983. In the eastern gulf, Kean CPUEsfrom trawl surveys in 1978, 1979, and 1981 (Carlson et al. 1986) agreed withthe CPUE trend displayed by the Japanese data for the comparable period(Fig. 11, indicating some possible improvement in stock condition. The meanCPUE for the 1984 triennial survey in southeastern Alaska was about the sameor slightly higher than the 1981 CPUE.
All these data have deficiencies which make it difficult to obtain reliabledeterminations of the condition of the S. alutus stocks. For example, theCPUE and biomass estimates derived from-trawl surveys have such large standarddeviations that data from many consecutive years are required before evenrough estimates of stock condition can be obtained. Also, trawl surveys are
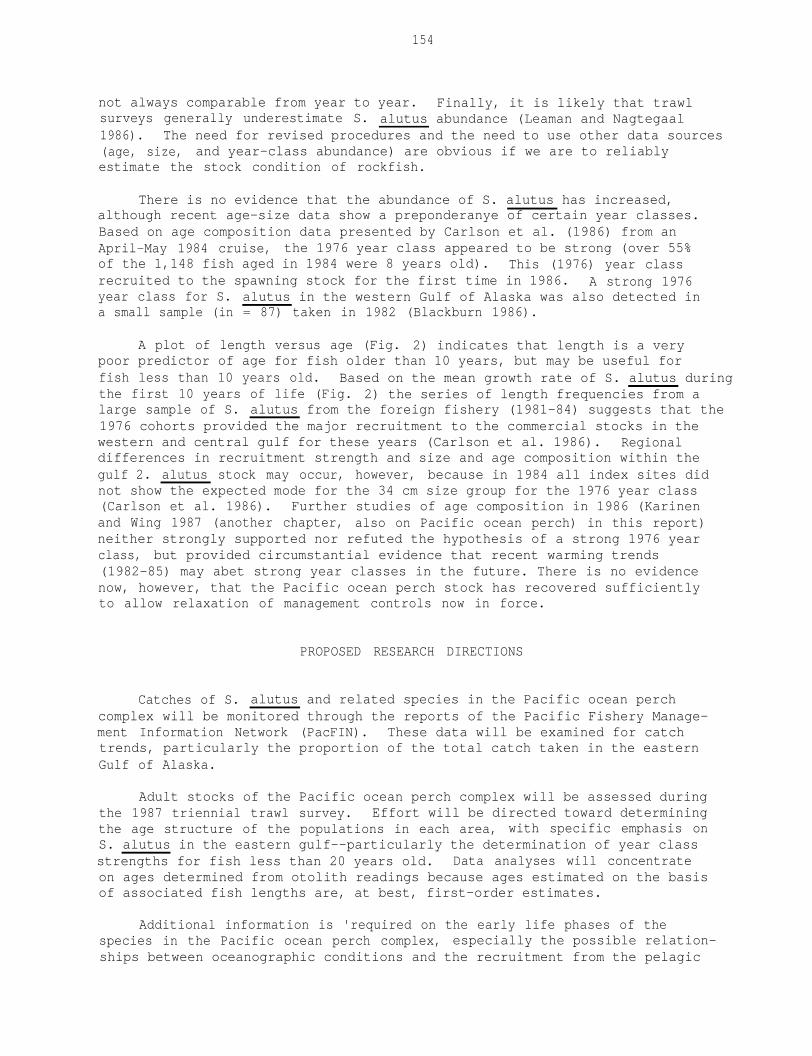
154
not always comparable from year to year. Finally, it is likely that trawlsurveys generally underestimate S. alutus abundance (Leaman and Nagtegaal1986). The need for revised procedures and the need to use other data sources(age, size, and year-class abundance) are obvious if we are to reliablyestimate the stock condition of rockfish.
There is no evidence that the abundance of S. alutus has increased,although recent age-size data show a preponderanye of certain year classes.Based on age composition data presented by Carlson et al. (1986) from anApril-May 1984 cruise, the 1976 year class appeared to be strong (over 55%of the 1,148 fish aged in 1984 were 8 years old). This (1976) year classrecruited to the spawning stock for the first time in 1986. A strong 1976year class for S. alutus in the western Gulf of Alaska was also detected ina small sample (in = 87) taken in 1982 (Blackburn 1986).
A plot of length versus age (Fig. 2) indicates that length is a verypoor predictor of age for fish older than 10 years, but may be useful forfish less than 10 years old. Based on the mean growth rate of S. alutus duringthe first 10 years of life (Fig. 2) the series of length frequencies from alarge sample of S. alutus from the foreign fishery (1981-84) suggests that the1976 cohorts provided the major recruitment to the commercial stocks in thewestern and central gulf for these years (Carlson et al. 1986). Regionaldifferences in recruitment strength and size and age composition within thegulf 2. alutus stock may occur, however, because in 1984 all index sites didnot show the expected mode for the 34 cm size group for the 1976 year class(Carlson et al. 1986). Further studies of age composition in 1986 (Karinenand Wing 1987 (another chapter, also on Pacific ocean perch) in this report)neither strongly supported nor refuted the hypothesis of a strong 1976 yearclass, but provided circumstantial evidence that recent warming trends(1982-85) may abet strong year classes in the future. There is no evidencenow, however, that the Pacific ocean perch stock has recovered sufficientlyto allow relaxation of management controls now in force.
PROPOSED RESEARCH DIRECTIONS
Catches of S. alutus and related species in the Pacific ocean perchcomplex will be monitored through the reports of the Pacific Fishery Manage-ment Information Network (PacFIN). These data will be examined for catchtrends, particularly the proportion of the total catch taken in the easternGulf of Alaska.
Adult stocks of the Pacific ocean perch complex will be assessed duringthe 1987 triennial trawl survey. Effort will be directed toward determiningthe age structure of the populations in each area, with specific emphasis onS. alutus in the eastern gulf--particularly the determination of year classstrengths for fish less than 20 years old. Data analyses will concentrateon ages determined from otolith readings because ages estimated on the basisof associated fish lengths are, at best, first-order estimates.
Additional information is 'required on the early life phases of thespecies in the Pacific ocean perch complex, especially the possible relation-ships between oceanographic conditions and the recruitment from the pelagic
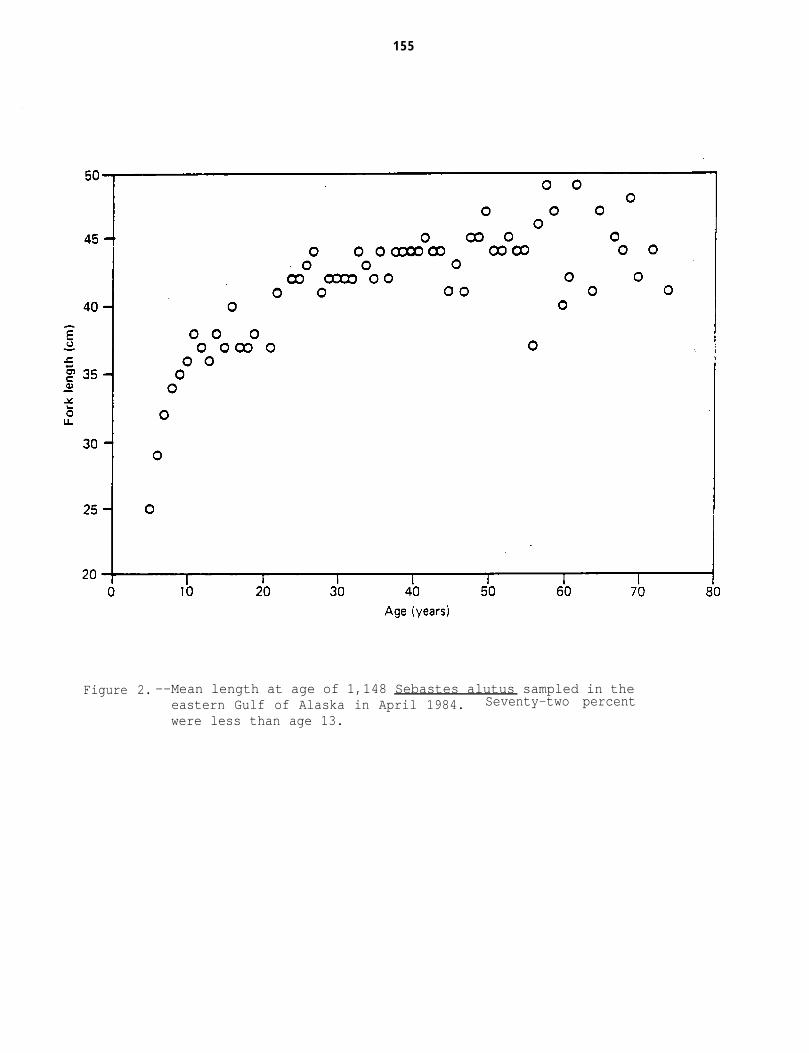
155
Figure 2. --Mean length at age of 1,148 Sebastes alutus sampled in theeastern Gulf of Alaska in April 1984. Seventy-two percent
were less than age 13.
156
larval stage to the benthic juvenile stage. Water column thermal profileswill be monitored with expendable bathythennographs (XBTS) during the triennialtrawl survey and the concordant sablefish survey studies. If opportunityarises, neuston net and bongo net samples will be taken to determine thedistributon of Sebastes spp. larvae and the potential relationship of theselarvae with the Sitka Eddy and the Alaska Coastal Current.
Hydroacoustic surveys constitute another effective tool for studying thebiology and population levels of schooling fishes and zooplankton. In 1987we intend to use hydroacoustic methods to examine the relationships of schoolingSebastes spp. to euphausiid distributions in the eastern Gulf of Alaska anddetermine the feasibility of monitoring 2. alutus in midwater with thesetechniques. Sebastes alutus may congregate to feed on discrete patches ofeuphausiids located on the Continental Shelf. Defining euphausiid-S. alutusrelationships may lead to improved methods-for accurately assessing-thedensities of Pacific ocean perch.

157
REFERENCES
Blackburn, J. E. 1986. Westward region commercial groundfish fisherymonitoring investigations, 1982-84. Alaska Dep. Fish Game, InformationalLeaflet No. 257, 87 p.
Carlson, H. R., D. H. Ito, R. E. Haight, T. L. Rutecki, and J. F. Karinen.1986. Pacific ocean perch. In R. L. Major (editor), Condition ofgroundfish resources of the Gulf of Alaska region as assessed in 1985,
P. 155-209. U.S. Dep. Commer., NOAA Tech. Memo. NMFS F/NWC-106.
Chitwood, P. E. 1969. Japanese, Soviet, and South Korean fisheries offAlaska, development and history through 1966. U.S. Fish Wildl. Serv.,Circ. 310, 34 p.
Karinen, J. F., and B. L. Wing. 1987. Age composition and recruitment trendsof Sebastes alutus off southeastern Alaska in 1984 and 1986. In R. L.Major (editor), Condition of groundfish resources of the Gulf of Alaskaas assessed in 1986, p. 139 to 148. U.S. Dep. Commer., NOAA Tech. Memo.NMFS F/NWC-119.
Leaman, B. M., and D. A. Nagtegaal. 1986. Biomass Survey of Rockfish Stocksin the Dixon Entrance --Southeast Alaska region, July 5-22, 1983 (R/VG. B. Reed and M/V Free Enterprise No. 1) Can. Tech. Rep. Fish. Aquat.- - -Sci. 1510, 63 p.
- -
Major, R. L., and H. H. Shippen. 1970. Synopsis of biological data on Pacificocean perch, Sebastodes alutus. U.S. Dep. Commer., NOAA Circ. 347, 38 p.
Shippen, H. H. 1985. Pacific ocean perch. In R. L. Major (editor), Conditionof groundfish resources of the Gulf of Alaska region as assessed in1984, p. 119-151. U.S. Dep. Commer., NOAA Tech. Memo. NMFS F/NWC-80.
THORNYHEADS
Herbert H. Shippen
INTRODUCTION
General Distribution
Two similar species are commonly referred to as thornyheads, thornyheadrockfish, or "idiots": the shortspine thornyhead (Sebastolobus alascanus) andthe longspine thornyhead (Sebastolobus altivelis). They inhabit deep watersfrom the Bering Sea to Baja California--the shortspine from 92 to 1,460 m andthe longspine from 370 to 1,600 m. Length ranges up to 75 cm for the shortspinevariety and up to 38 cm for the longspine. Overall, the shortspines are themore abundant of the two species. In the Gulf of Alaska longspine thornyheadshave rarely been taken in resource assessment surveys.
Multispecies Nature of the Fisheries
Although the flesh of thornyheads is highly regarded by fishermen, thespecies are ordinarily not the target objects of fisheries. They are taken,rather, in trawl and longline fisheries aiming at other species. According toAlverson et al. (1964), fishes commonly associated with thornyheads arearrowtooth flounder (Atheresthes stomias), Pacific ocean perch (Sebastesalutus), sablefish (Anoplopoma fimbria), rex sole (Glyptocephalus zachirus),Dover sole (Microstomus pacificus), shortraker rockfish (Sebastes borealis),rougheye rockfish (Sebastes aleutianus), and grenadiers (family Macrouridae).
FISHERY STATISTICS
Historical Catches
As an element of the deepwater community of demersal fishes, thornyheadshave been fished in the northeast Pacific Ocean since the late 19th century,when commercial trawling by U.S. and Canadian fishermen began. In the mid-1960s Soviet fleets arrived in the eastern Gulf of Alaska (Chitwood 1969),where they were soon joined by vessels from Japan and the Republic of Korea(ROK).
There are no records of the catches of thornyheads in these early fisheries.The first data began to accrue as part of the U.S. Foreign Fisheries ObserverProgram in 1977, when the catch in the Gulf of Alaska (as a whole) was estimatedat 1,163 t (Wall et al. 1978). From 1980 on, the observer program has generatedannual estimates of the foreign catch of thornyheads by International NorthPacific Fisheries Commission (INPFC) statistical area. Since 1982 the observerprogram has also estimated the catches of thornyheads in the joint venturefisheries. Finally (in 1984 for the first time), thornyheads were identifiedas a separate entity in the U.S. domestic catch statistics (Table 1).

160
Table 1 .--Catch (t) of thornyheads in the Gulf of Alaska by InternationalNorth Pacific Fisheries Commission statistical area and fisherycategory, 1980-85.
*Republic of Korea.
Sources: Foreign and joint venture catches: personal communication withJerald Berger, U.S. Foreign Fisheries Observer Program, Northwest andAlaska Fisheries Center, National Marine Fisheries Service, NOAA, BinC15700, Building 4, 7600 Sand Point Way NE., Seattle, WA 98115.U.S. catches: Pacific Fishery Information Network (PacFIN), PacificMarine Fisheries Commission, 305 State Office Building, 1400 SW.Fifth Avenue, Portland, OR 97201.
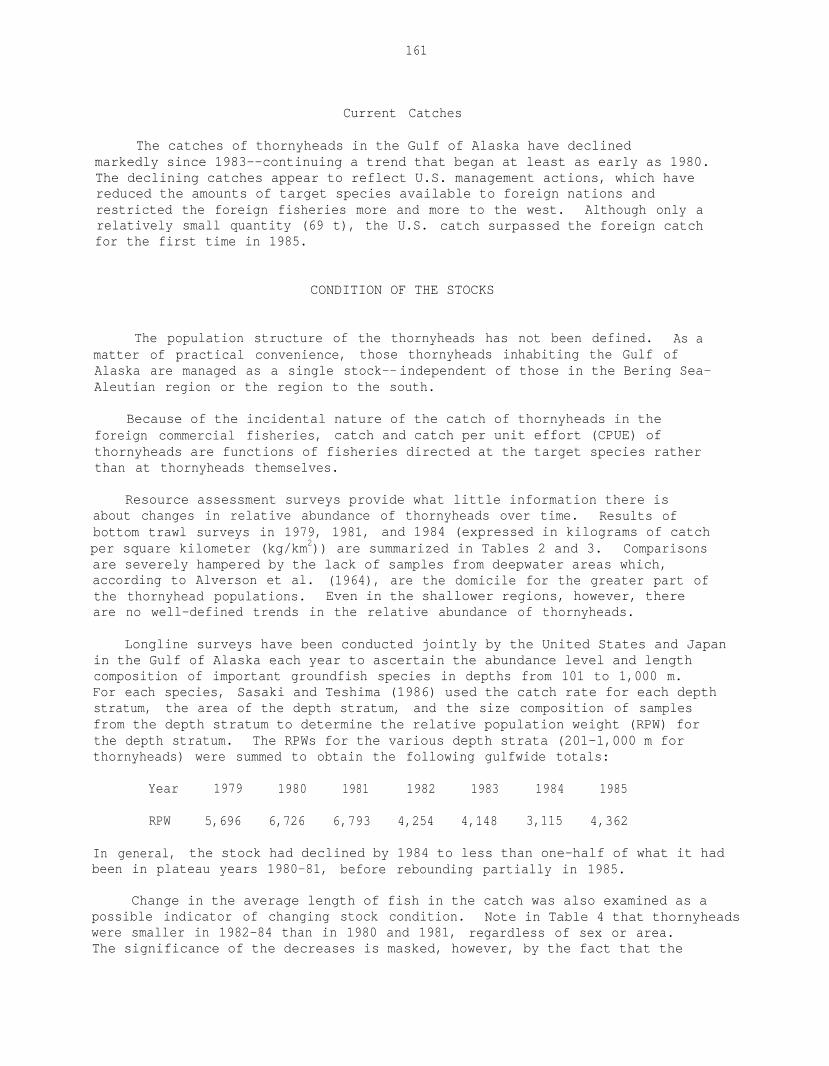
161
Current Catches
The catches of thornyheads in the Gulf of Alaska have declinedmarkedly since 1983--continuing a trend that began at least as early as 1980.The declining catches appear to reflect U.S. management actions, which havereduced the amounts of target species available to foreign nations andrestricted the foreign fisheries more and more to the west. Although only arelatively small quantity (69 t), the U.S. catch surpassed the foreign catchfor the first time in 1985.
CONDITION OF THE STOCKS
The population structure of the thornyheads has not been defined. As amatter of practical convenience, those thornyheads inhabiting the Gulf ofAlaska are managed as a single stock--independent of those in the Bering Sea-Aleutian region or the region to the south.
Because of the incidental nature of the catch of thornyheads in theforeign commercial fisheries, catch and catch per unit effort (CPUE) ofthornyheads are functions of fisheries directed at the target species ratherthan at thornyheads themselves.
Resource assessment surveys provide what little information there isabout changes in relative abundance of thornyheads over time. Results ofbottom trawl surveys in 1979, 1981, and 1984 (expressed in kilograms of catchper square kilometer (kg/km2)) are summarized in Tables 2 and 3. Comparisonsare severely hampered by the lack of samples from deepwater areas which,according to Alverson et al. (1964), are the domicile for the greater part ofthe thornyhead populations. Even in the shallower regions, however, thereare no well-defined trends in the relative abundance of thornyheads.
Longline surveys have been conducted jointly by the United States and Japanin the Gulf of Alaska each year to ascertain the abundance level and lengthcomposition of important groundfish species in depths from 101 to 1,000 m.For each species, Sasaki and Teshima (1986) used the catch rate for each depthstratum, the area of the depth stratum, and the size composition of samplesfrom the depth stratum to determine the relative population weight (RPW) forthe depth stratum. The RPWs for the various depth strata (201-1,000 m forthornyheads) were summed to obtain the following gulfwide totals:
Year 1979 1980 1981 1982 1983 1984 1985
RPW 5,696 6,726 6,793 4,254 4,148 3,115 4,362
In general, the stock had declined by 1984 to less than one-half of what it hadbeen in plateau years 1980-81, before rebounding partially in 1985.
Change in the average length of fish in the catch was also examined as apossible indicator of changing stock condition. Note in Table 4 that thornyheadswere smaller in 1982-84 than in 1980 and 1981, regardless of sex or area.The significance of the decreases is masked, however, by the fact that the
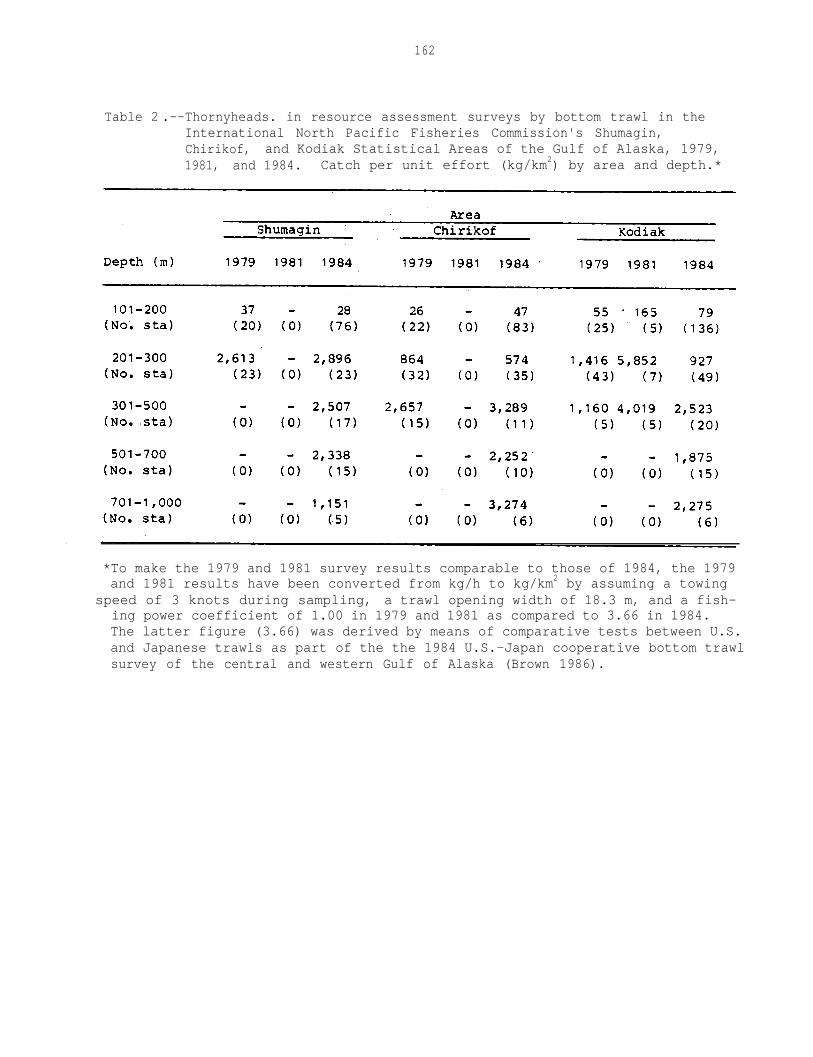
162
Table 2 .--Thornyheads. in resource assessment surveys by bottom trawl in theInternational North Pacific Fisheries Commission's Shumagin,Chirikof, and Kodiak Statistical Areas of the Gulf of Alaska, 1979,1981, and 1984. Catch per unit effort (kg/km2) by area and depth.*
*To make the 1979 and 1981 survey results comparable to those of 1984, the 1979and 1981 results have been converted from kg/h to kg/km2 by assuming a towing
speed of 3 knots during sampling, a trawl opening width of 18.3 m, and a fish-ing power coefficient of 1.00 in 1979 and 1981 as compared to 3.66 in 1984.The latter figure (3.66) was derived by means of comparative tests between U.S.and Japanese trawls as part of the the 1984 U.S.-Japan cooperative bottom trawlsurvey of the central and western Gulf of Alaska (Brown 1986).
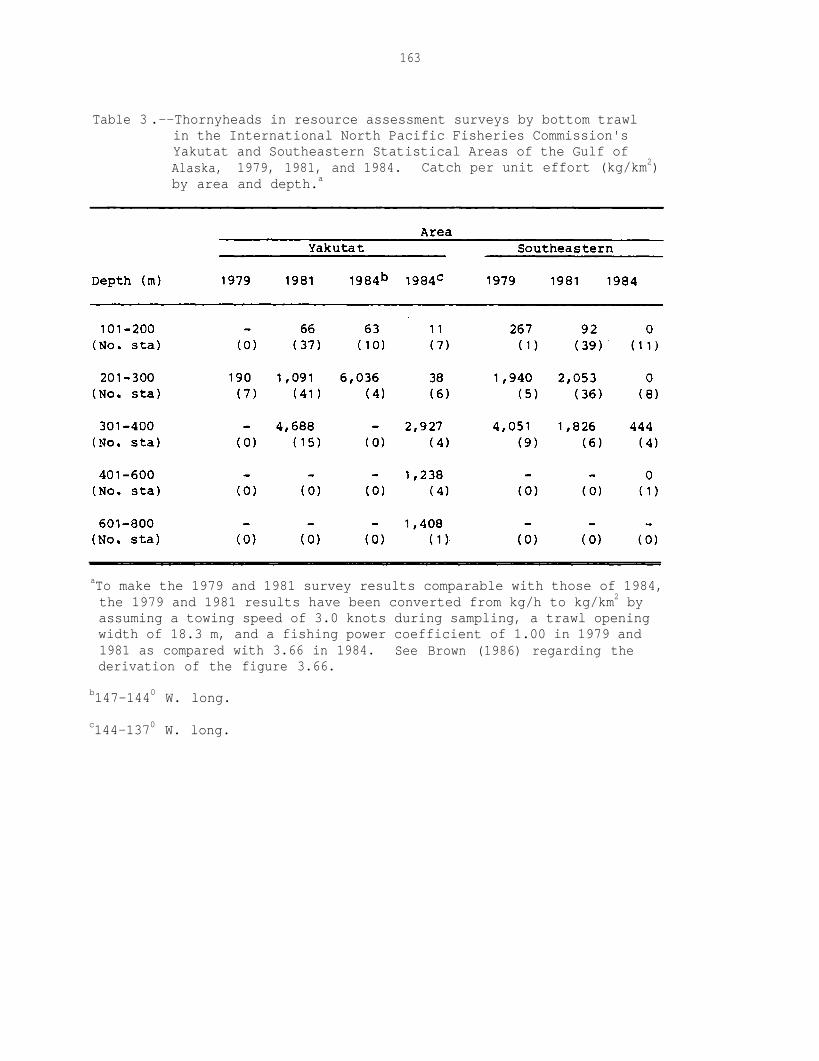
163
Table 3 .--Thornyheads in resource assessment surveys by bottom trawlin the International North Pacific Fisheries Commission'sYakutat and Southeastern Statistical Areas of the Gulf ofAlaska, 1979, 1981, and 1984. Catch per unit effort (kg/km2)by area and depth.a
aTo make the 1979 and 1981 survey results comparable with those of 1984,the 1979 and 1981 results have been converted from kg/h to kg/km2 byassuming a towing speed of 3.0 knots during sampling, a trawl openingwidth of 18.3 m, and a fishing power coefficient of 1.00 in 1979 and1981 as compared with 3.66 in 1984. See Brown (1986) regarding thederivation of the figure 3.66.
b147-1440 W. long.
c144-1370 W. long.
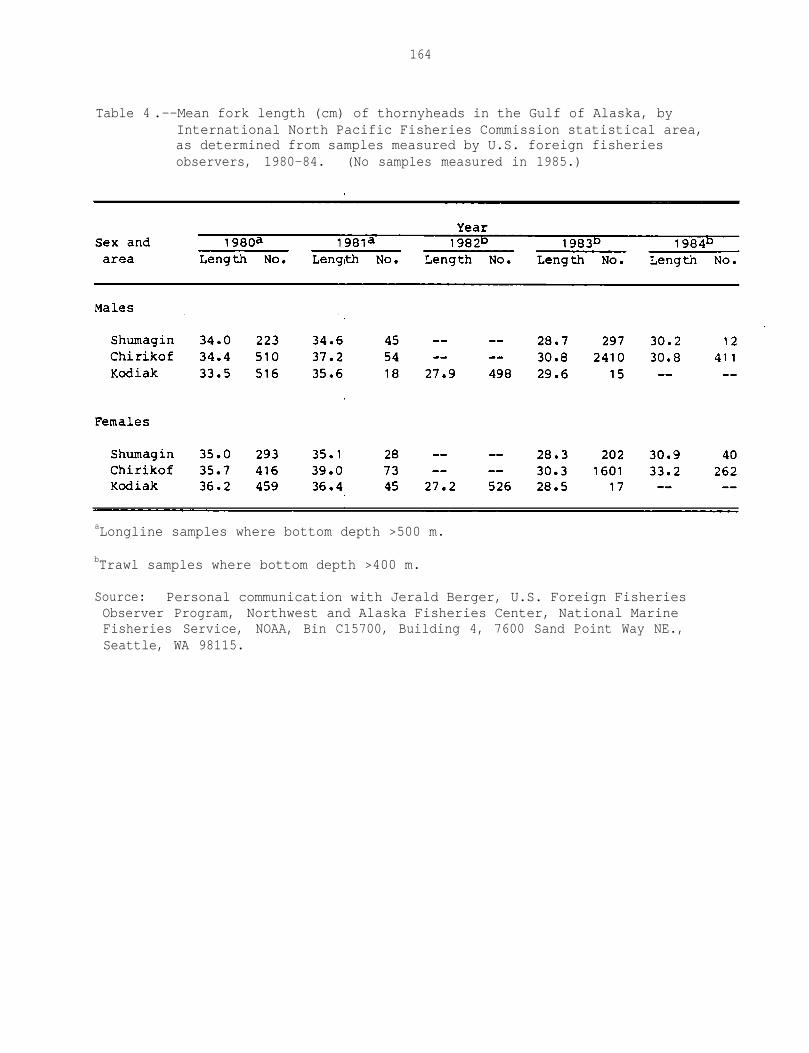
164
Table 4 .--Mean fork length (cm) of thornyheads in the Gulf of Alaska, byInternational North Pacific Fisheries Commission statistical area,as determined from samples measured by U.S. foreign fisheriesobservers, 1980-84. (No samples measured in 1985.)
aLongline samples where bottom depth >500 m.
bTrawl samples where bottom depth >400 m.
Source: Personal communication with Jerald Berger, U.S. Foreign FisheriesObserver Program, Northwest and Alaska Fisheries Center, National MarineFisheries Service, NOAA, Bin C15700, Building 4, 7600 Sand Point Way NE.,Seattle, WA 98115.
165
samples in 1980 and 1981 were essentially from longline fisheries operatingat bottom depths greater than 500 m, while those in 1982-84 were from trawlfisheries operating in areas where bottom depths were less than 400 m. Inthe longline surveys described by Sasaki (1985), no appreciable changes inthe mean length of shortspine thornyheads were observed (mean body length incentimeters: 1980, 34.1; 1981, 33.9; 1982, 35.0; 1983, 34.7; and 1984, 34.5).
POTENTIAL YIELD
Estimates of Maximum Sustainable Yield
From the time the first Fishery Management Plan for groundfish in theGulf of Alaska went into effect in 1979, maximum sustainable yield (MSY) forthornyheads has arbitrarily been set at 3,750 t. It was not until 1984,however, that it became possible to compare MSY to the estimated gulf-widestanding stock. The 1984 U.S.-Japan cooperative bottom trawl survey of thecentral and western Gulf of Alaska (which, together with a complementarysurvey by the National Marine Fisheries Service in the eastern gulf, is alsoreferred to as the triennial survey) yielded the first information about thestanding stock of thornyheads in the region. Samples were obtained throughoutall three INPFC statistical areas in the central and western gulf--the Shumagin,Chirikof, and Kodiak Areas. Most tows were in waters where bottom depthswere less than 700 m, although there were some tows in over 700 m. Takinginto account the CPUE expressed as kilograms/square kilometer (Table 2) andthe total area involved for each depth stratum, standing stock within theareas surveyed systematically during 1984 was estimated at 77,796 t (Table 5)(Brown 1986 (updated January 12, 1987) 1.
Sampling was less comprehensive in the INPFC Yakutat and SoutheasternAreas. On the basis of limited samples available, however, the standingstock of thornyheads has been estimated at 5,231 t in the INPFC Yakutat Areaand 267 t in the INPFC Southeastern Area (Table 5).
Thus, it turns out that the arbitrarily selected MSY for thornyheads inthe Gulf of Alaska is roughly 5% of the total estimated standing stock(83,294 t) estimated from the 1984 triennial survey.
Estimates of Equilibrium Yield
Because it is felt that MSY is presently attainable, equilibrium yield(EY) is set at MSY.
Acceptable Biological Catch
As in the past, there are no compelling biological reasons to set accept-able biological catch (ABC) above or below EY. It is recommended, therefore,that ABC remain at 3,750 t.
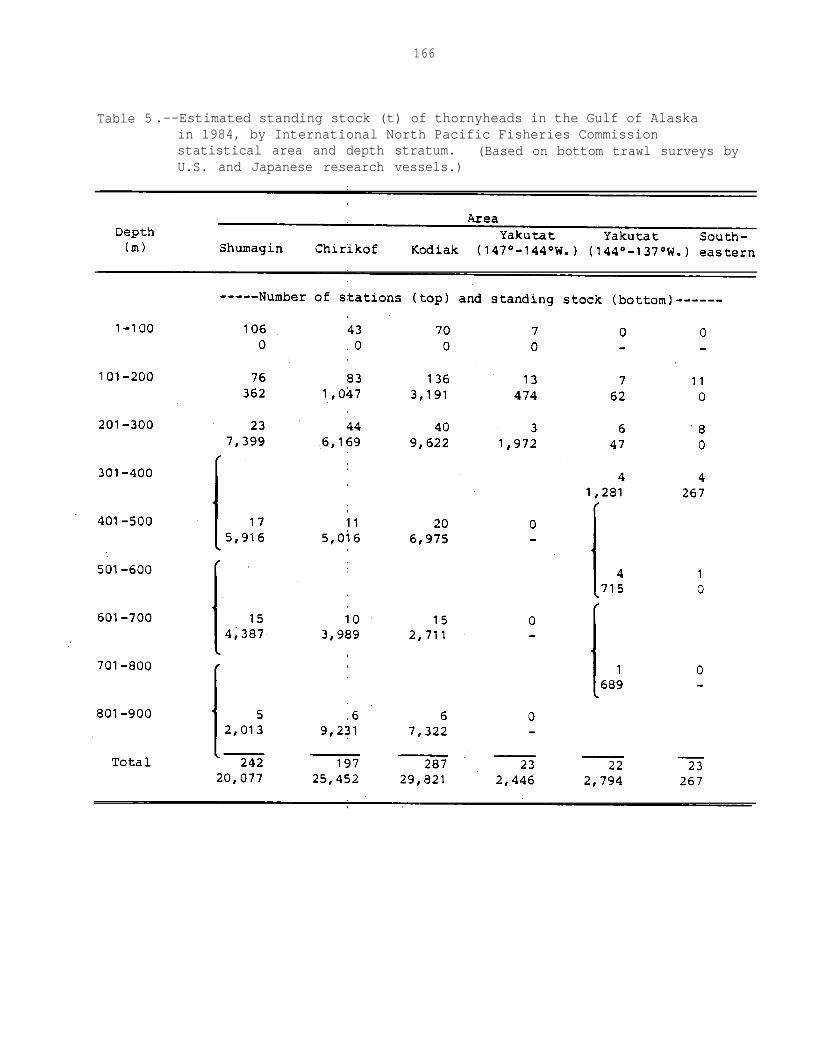
166
Table 5 .--Estimated standing stock (t) of thornyheads in the Gulf of Alaskain 1984, by International North Pacific Fisheries Commissionstatistical area and depth stratum. (Based on bottom trawl surveys byU.S. and Japanese research vessels.)

167
REFERENCES
Alverson, D. L., A. T. Pruter, and L. L. Ronholt. 1964. A study of demersalfishes and fisheries of the northeastern Pacific Ocean. H. R. MacMillanLectures in Fisheries, Inst. Fish., Univ. Brit. Columbia, Vancouver,B.C., 190 p.
Brown, E. S. 1986. Preliminary results of the 1984 U.S.-Japan cooperativebottom trawl survey of the-central and western Gulf of Alaska. In R. L.Major (editor), Condition of groundfish resources of the Gulf of Alaskaregion as assessed in 1985, p. 259. U.S. Dep. Commer., NOAA Tech. Memo.NMFS F/NWC- 106.
Chitwood, P. E. 1969. Japanese, Soviet, and South Korean fisheries off Alaska,development and history through 1966. U.S. Fish Wildl. Serv., Circ.310, 34 p.
Sasaki, T. 1985. Preliminary report on Japan-U.S. joint longline survey byRyusho Maru No. 15 in 1984. Unpubl. manuscr., 12 p. Far Seas FisheriesResearch Laboratory, Shimizu, Japan. (Document submitted at the U.S.-JapanBilateral Meeting, 1985.)
Sasaki, T., and K. Teshima. 1986. Data report on abundance indices offlatfishes, rockfishes, shortspine thornyhead and grenadiers based on theresults from Japan-U.S. joint longline surveys, 1979-1985. Unpubl.manuscr., 26 p. Far Seas Fisheries Research Laboratory, Shimizu, Japan.(Document submitted at the U.S .-Japan Bilateral Meeting, 1986.)
Wall, J., R. French, R. Nelson, Jr., and D. Hennick. 1978. Data from theobservations of foreign fishing fleets in the Gulf of Alaska, 1977.Unpubl. Manuscr., 28 p. Northwest and Alaska Fish. Cent., Natl. Mar.Fish. Serv., NOAA, 2725 Montlake Blvd. E., Seattle, WA 98112. (DocumentSubmitted to the annual meeting of the INPFC, Vancouver, B.C., Oct. 1978.)

OTHER ROCKFISH
byl/
Barry E. Bracken- and Victoria M. O'Connell
INTRODUCTION
Members of the family Scorpaenidae are distributed on or near theContinental Shelf throughout the world's oceans. In the Gulf of Alaska, thefamily is represented by over 30 species of the genus Sebastes and 2 speciesof the genus Sebastolobus. Beginning in 1980 and continuing to date (1987),these fishes have been divided into three management categories: thethornyheads (the two species of the genus Sebastolobus), the Pacific oceanperch (POP) complex (five species of the genus Sebastes with color and char-acteristics similar to Pacific ocean perch (Sebastes alutus), and "otherrockfish" (all species of the genus Sebastes not included in the POP complex)(Table 1). Twenty-eight species of other rockfish have been identified inthe Gulf of Alaska by fisheries observers and port samplers. Twenty speciesare caught regularly.
The species of the genus Sebastes can be divided into three groups, orassemblages (slope, shelf demersal, and shelf pelagic), on the basis of distri-bution and behavioral characteristics. Other rockfish of the slope assemblagehave long been harvested in the foreign trawl fisheries along the continentalslope primarily incidental to target fisheries on the POP complex (which arealso members of the slope assemblage). The species of the shelf demersalassemblage are the target of an expanding longline fishery in the southeasternportion of the eastern gulf, while the shelf pelagic assemblage is largelyunexploited at this time.
FISHERIES STATISTICS
Prior to the adoption of the current three-group management system(thornyheads; POP complex; other rockfish), the catch statistics for scorpaenidfishes were accrued and reported in a variety of ways, with the method varyingby nation and frequently by year. Nonetheless, it is reasonable to assumethat the POP complex comprised the bulk of the harvest. In recent years,estimates of the landings of the other two management groups, the thornyheadsand the other rockfish, have been obtained from U.S. observers aboard foreignand joint venture fishing vessels and by shore-based samplers in Kodiak andin ports in southeastern Alaska. Fairly accurate catch estimates are available
1 /Alaska Department of Fish and Game, P.O. Box 667, Petersburg, AK 99833.
2/Alaska Department of Fish and Game, P.O. Box 510, Sitka, AK 99835.

170
Table 1 .--Assemblages of rockfish in the Gulf of Alaska.
171
for the other rockfish management group since 1980 (Table 21, but speciesdefinition within that management group remains a problem.
The recent-year catch of other rockfish peaked in 1981 at 4,585 metrictons (t) and then declined substantially through 1984 (Fig. 1). Most of the1981 harvest of other rockfish (95%) was taken by foreign vessels, which havesince been phased out of the Gulf of Alaska rockfish fisheries by regulatorychanges. The slight increase noted in 1985 from 1984 is the result of anincrease in domestic harvests. The foreign and joint venture harvests werelargely displaced by domestic harvests in 1985.
Species breakdown of the other rockfish catch from the landing recordsis unreliable because most of the landings are entered in the unspecifiedrockfish category. It can generally be assumed, however, that most of theharvest in the foreign and joint venture fisheries were species in the slopeassemblage, as the majority were landed in the deeper water trawl fisheries.In the domestic fishery, 754 t (75%) of the 1984 and 771 t (46%) of the 1985landings in the other rockfish category were made by hook and line gear. Themajority of species landed in the hook and line fisheries are in the shelfdemersal rockfish assemblage, with two species--yelloweye rockfish andquillback rockfish--accounting for approximately 80% of the landed weight. Thedomestic trawl fisheries account for the remainder of the harvest, takingprimarily slope-dwelling species as did the foreign and joint venture trawlfisheries.
CONDITION OF STOCKS
Stock Structure
As mentioned earlier, rockfish of the genus Sebastes can be separatedinto three assemblages according to habitat and behavioral characteristics.The slope assemblage, which includes the POP complex, is generally found indepths greater than 250 m. The other two assemblages, shelf demersal andshelf pelagic, are generally found in depths less than 200 m and are separatedvertically in their habitat. The shelf demersal species spend all or nearlyall of the time on bottom associated with rocky reefs or pinnacles, while theshelf pelagic species spend at least a portion of the time off bottom and,although frequently associated with prominent geological features, are oftenfound offshore and not associated with definable submarine bottom structures.
Species diversity is highest in the eastern gulf and decreases to thewest. All three assemblages occur in abundance in the eastern gulf, withsubstantial decreases in the abundance of the shelf-dwelling assemblages westof 140° W. long. For this reason, all assemblages are managed together westof 140° W. long., while a separate harvest level is assigned to the shelfdemersal species in a portion of the International North Pacific FisheriesCommission (INPFC) Southeastern Statistical Area.
Fisheries which harvest shelf demersal and slope assemblages almostalways land catches with mixed species composition. Fisheries which harvestthe schooling shelf pelagic species are able to target on individual species
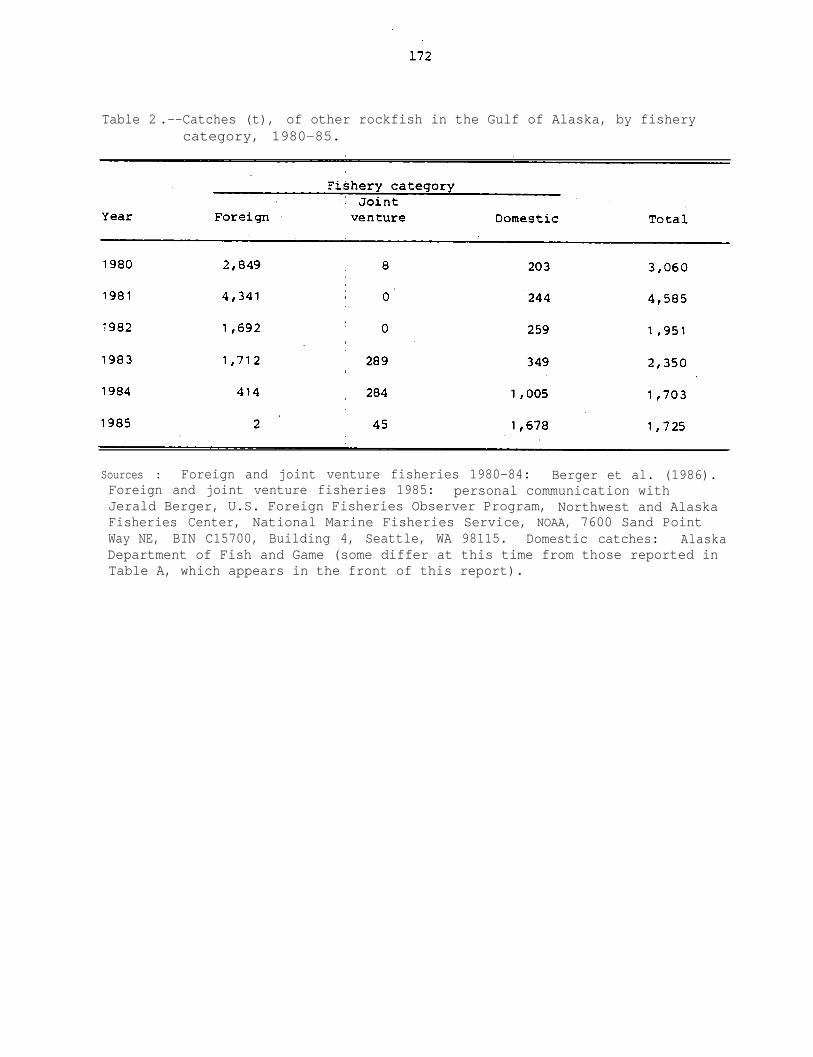
Table 2 .--Catches (t), of other rockfish in the Gulf of Alaska, by fisherycategory, 1980-85.
Sources : Foreign and joint venture fisheries 1980-84:Foreign and joint venture fisheries 1985:
Berger et al. (1986).personal communication with
Jerald Berger, U.S. Foreign Fisheries Observer Program, Northwest and AlaskaFisheries Center, National Marine Fisheries Service, NOAA, 7600 Sand PointWay NE, BIN C15700, Building 4, Seattle, WA 98115. Domestic catches: AlaskaDepartment of Fish and Game (some differ at this time from those reported inTable A, which appears in the front of this report).

173
Figure 1 .--Estimated catch of other rockfish in the foreign, joint venture,and domestic fisheries in the Gulf of Alaska, 1980-85 (datafrom Table 2).

174
to some extent. There is some overlap between assemblages at some lifehistory stages, but the assemblage groupings appear to offer adequate separa-tion for management of the adult fish in the three groups.
Stock Assessment
Survey Results
The 1984 National Marine Fisheries Service (NMFS) triennial surveyprovided abundance estimates for other rockfish in offshore waters of theGulf of Alaska. The triennial survey was made up of two parts--theU.S.-Japan cooperative trawl survey in the central and western gulf, and acomplementary NMFS survey in the eastern gulf.
The U.S.-Japan survey took significant numbers of only one species ofother rockfish in the areas surveyed. Biomass of dusky rockfish, a shelfpelagic species, was estimated at 25,589 t in the central and western gulf,with the bulk of the catch in the nearshore areas inside of where most foreignrockfish fisheries have operated (Brown 1986 (updated January 12, 1987)).traces of other species were found,
Onlywith densities of less than 1 kilogram
per hectare (kg/ha). Dusky rockfish were also taken in the eastern gulf sur-vey in the INPFC Yakutat Statistical Area at densities of approximately 3 kg/ha.That survey also captured silvergrey rockfish and redstripe rockfish at ratesof approximately 1 kg/ha. There have been no surveys for the shelf assemblagesin the eastern gulf and no rockfish surveys have been conducted anywherewithin the gulf since 1984.
Assessment of Shelf-Dwelling Species
Traditional methods of stock assessment are difficult to apply to theshelf rockfish assemblages, particularly the shelf demersal group. Maximumsustainable yield (MSY) is difficult to obtain because of the multi-speciesnature of the assemblage, the lack of biological data on the component species,and the lack of a time series of catch and effort data.
In many management schemes, catch per unit effort (CPUE) is used as anindicator of stock condition and abundance. The Alaska Department of Fishand Game (ADF&G) has been monitoring shore-based landings of other rockfishin the INPFC Southeastern Area since 1982. Most of the monitoring effort hasbeen in the ports of Sitka and Ketchikan (Fig. 2). The CPUE values depictedfor the Sitka area for 1986 are through June. The 1986 Ketchikan-area valuesare based on a very small sample and, for that reason, cannot be directlycompared to the 1984 and 1985 CPUE values for that area. The CPUE datacollected from the rockfish setline fishery is considered to have limitedusefulness for assessing stock condition because of the high mobility of therockfish fleet, changes in market demand, and advances in gear technologyover time (Bracken and O'Connell 1986). A description of the fishery, detaileddiscussion of monitoring methods, and results of domestic rockfish samplingare also reported in Bracken and O'Connell (1986).

Figure 2 .--Catch per unit effort (kilograms per hook) of shelf demersalrockfish landed in the Sitka and Ketchikan area, southeasternAlaska, 1982-86.

176
POTENTIAL YIELD
The gulf-wide optimum yield (OY) for other rockfish was set at 7,600 twhen the Gulf of Alaska Groundfish Fisheries Management Plan was implementedin 1978. That level was based on the lower bound of the catch of rockfishother than S.fisheries from
alutus and the two species of Sebastolobus in the foreign1973 through 1975. Since the 7,600 t OY was established, there
have been two important changes: 1) the four predominant species of Sebastes(excluding S. alutus) were removed from the other rockfish category andincluded with 2. alutus in the five-species POP complex (in 1979), and 2) aseparate OY was established for the two species of Sebastolobus (in 1980).There was no corresponding reduction in the other rockfish OY to compensatefor the removal of those species. In 1985, however, the gulf-wide OY forother rockfish was reduced to 5,000 t, of which 600 t were to be shelf demersalspecies in a portion of the INPFC Southeastern Area.
Slope Assemblage
Average harvest of the slope species in the trawl fisheries has averagedonly 2,133 t since 1980 (Table,3),recent years (Fig. 3).
with the catch declining substantially inIt is unclear whether the decline is the result of
stock reductions or of changes in fisheries regulations, or a combination ofthe two factors. However, with the reduction in landings and the poor showingof other rockfish in the triennial surveys, there is no evidence that theacceptable biological catch (ABC) for the other rockfish component of theslope assemblage exceeds the recent year average of 2,133 t, and it may be evenlower. Because landings of these species occur predominantly with landingsof the POP complex, and because they appear to be in such low abundance,consideration should be given, for management purposes, to combining the
slope assemblage with the POP complex.
Shelf Assemblages
Determining ABC levels for the shelf assemblages is even more difficult.There is virtually no data on shelf pelagic species other than the biomassestimates of dusky rockfish in the INPFC Yakutat Area and in the central andwestern gulf from the 1984 triennial survey. Other species in that groupalso appear in the shore-based landing in the INPFC Southeastern Area, but ininsignificant amounts (less than 4% of the landings by weight).
Harvest of shelf demersal species in the Sitka Area declined from 1984to 1985 and again the first 6 months of 1986 (relative to the first 6 monthsof 1985). It is unclear from the available, data whether the decline is theresult of market conditions, a reduction in fishing effort, or a decline inrockfish abundance. The CPUE for that area increased slightly from 1984 to1985 and then declined during the first 6 months of 1986 (Fig. 2).
In the Ketchikan area, the harvest increased from 1984 to 1985, butdeclined during the first half of 1986. The CPUE declined substantially inthe Ketchikan area between 1984 and 1985, but the 1986 sample size is toolimited to determine if the decline continued.
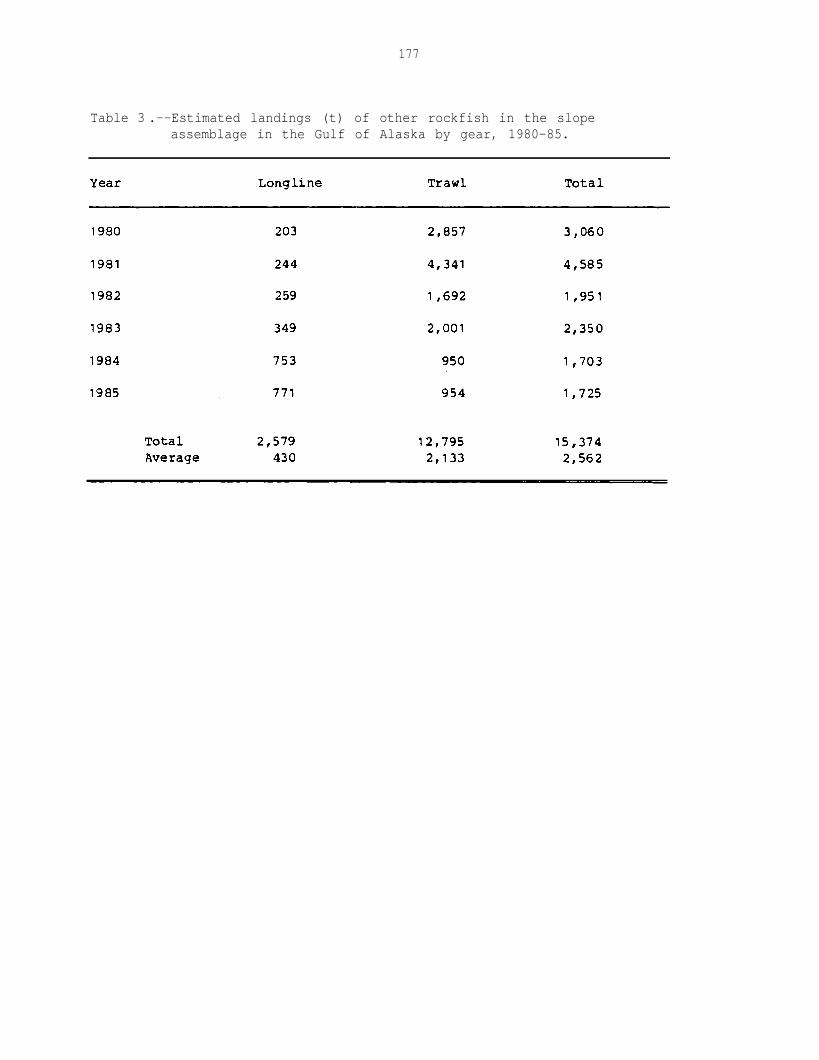
177
Table 3 .--Estimated landings (t) of other rockfish in the slopeassemblage in the Gulf of Alaska by gear, 1980-85.

178
Figure 3 .--Estimated catch of other rockfish by gear type in the Gulf ofAlaska, 1980-85.

179
There is no conclusive evidence that the harvest level in the ADF&G'sCentral Southeast Management District should be changed from the currentlevel of 600 t. The substantial decline in CPUE in the Ketchikan area from1984 to 1985 suggests that the current harvest level in that area may not besustainable. However, because data are inadequate, ABC cannot be determinedfor any of the nearshore species at this time. It is reasonable to assumethat because of the complex multispecies nature of the shelf assemblages,the extreme longevity of many species, and the apparent sensitivity toexploitation; sustainable yield levels are very low.
A comparison of suitable rockfish habitat in the shelf area from 20 to100 fathoms using large scale marine charts shows that the ADF&G CentralSoutheast Management District contains the highest percentage of suitablehabitat of the three southeast outside management districts. Expanding thecurrent 600 t central district quota to the remainder of the southeast areausing estimated suitable habitat as the primary criteria indicates that asustainable demersal shelf rockfish harvest for the entire southeast areawould be approximately 1,250 t (Bracken 1986). Of course, since this estimateis based on the current 600 t quota in the central district, it would haveto be adjusted if the 600 t quota is found to be inappropriate.
180
REFERENCES
Berger, J. D., J. E. smoker, and K. A. King. 1986. Foreign and joint venturecatches and allocations in the Pacific Northwest and Alaska fishingareas under the Magnuson Fisheries Conservation and Management Act,1977-84. U.S. Dep. Commer., NOAA Tech. Memo. NMFS F/NWC-99, 53 p.
Bracken, B. E. 1986. A habitat comparison approach to estimating yield levelsfor demersal shelf rockfish (Sebastes sp.) in the southeastern Gulf ofAlaska. Unpubl. manuscr., .17 p. Alaska Dep. Fish Game, P.O. Box 667,Petersburg, AK 99833.
Bracken, B. E., and V. M. O'Connell. 1986. Longline fisheries monitoring inthe eastern Gulf of Alaska, 1980-1985. Alaska Dep. Fish Game, Inf.Leaflet 258, 47 p.
Brown, E. S. 1986. Preliminary results of the 1984 U.S.-Japan cooperativesurvey of the central and western Gulf of Alaska. In R. L. Major (editor),Condition of groundfish resources of the Gulf of Alaska region as
assessed in 1985, p. 259. U.S. Dep. Commer., NOAA Tech. Memo. NMFSF/NWFC-106.

181
FLATFISH
Craig S. Rose
INTRODUCTION
This report deals with all flatfishes inhabiting the Gulf of Alaska,except Pacific halibut (Hippoglossus stenolepis). The major species, whichmade up 98% of the 1985 flatfish catch and account for 98% of the currentbiomass, are arrowtooth flounder (Atheresthes stomias) flathead sole(Hippoglossoides elassodon), rock sole (Lepidopsetta bilineata), rex sole(Glyptocephalus zachirus), Dover sole (Microstomus pacificus), yellowfin sole(Limanda aspera), and starry flounder (Platichthys stellatus). As a matter ofpractical convenience, the nonhalibut flatfish inhabiting the Gulf of Alaskahave been managed as a single stock.
This report describes the catches taken in 1985 (noting the continuedshift to U.S. harvesters and the decline in catch) and presents informationfrom resource assessment surveys that is relevant to flatfish management inthe gulf--including new estimates of potential yield. Catch data are dis-cussed in terms of International North Pacific Fisheries Commission (INPFC)statistical areas; data pertaining to potential yields are presented by NorthPacific Fishery Management Council (NPFMC) regulatory area. Figure 1 clari-fies the relationship of the two sets of areas.
FISHERY STATISTICS
Between 1981 and 1985, the fishery for flatfish in the Gulf of Alaskawent from one dominated by foreign (mostly Japanese) fleets, which took 97%of the catch in 1981, to one where 94% of the catch was harvested by U.S.trawlers (participating in the domestic or joint venture fisheries) in 1985(Table 1). During the same period, the catch declined 79%--from 14,866 to3,078 metric tons (t). The decline is not attributable to a diminishingresource, which is being harvested well below its potential yield, but isprimarily due to restrictions on the fisheries, particularly on the 'foreignfleets.
In contrast to the large catches of flatfish by foreign fleets in1978-84 (which were mostly incidental to fisheries targeting on otherspecies), 59% of the 1985 catch was in the INPFC Kodiak Statistical Area,where flatfishes were a major component of the total all-species catch. Mostof these fish were delivered to floating joint venture processors, althoughsome were processed by domestic shore plants.
The 1985 joint venture catch was 2,447 t--down 1,001 t from 1984. Withthe rapid decrease in the foreign flatfish catch (from 14,444 t in 1981 to170 t in 1985), the joint venture catch has become the dominant harvester offlatfish in the gulf.
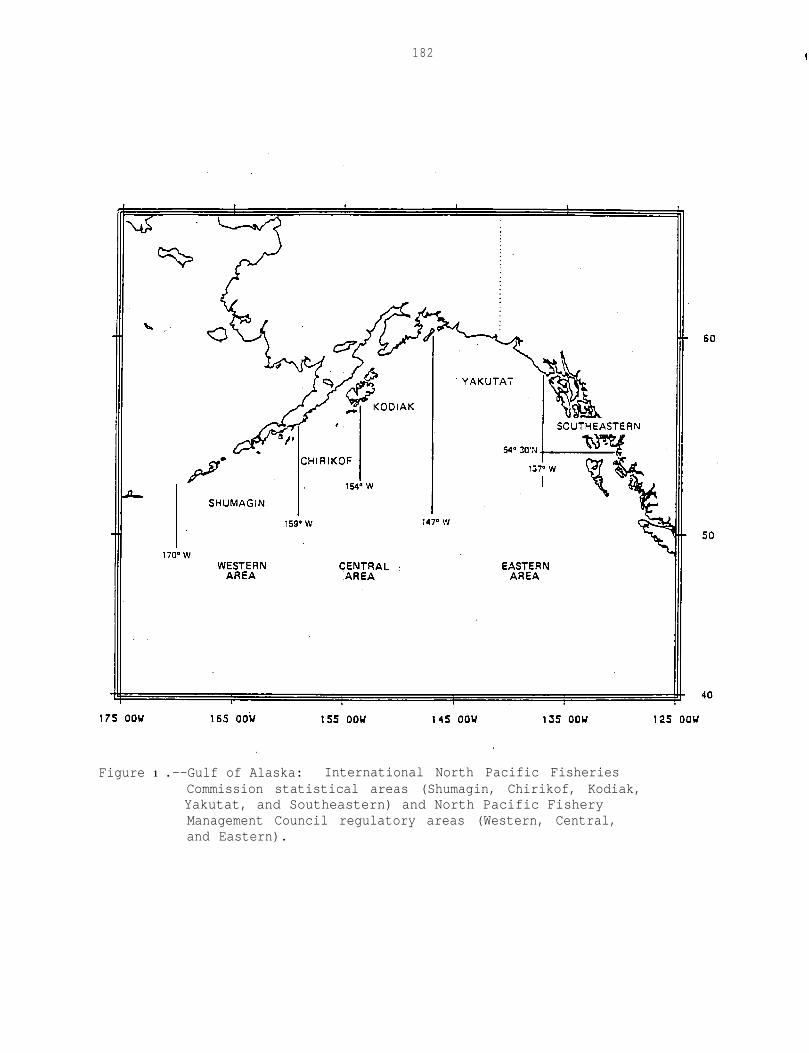
182
Figure 1 .--Gulf of Alaska: International North Pacific FisheriesCommission statistical areas (Shumagin, Chirikof, Kodiak,Yakutat, and Southeastern) and North Pacific FisheryManagement Council regulatory areas (Western, Central,and Eastern).
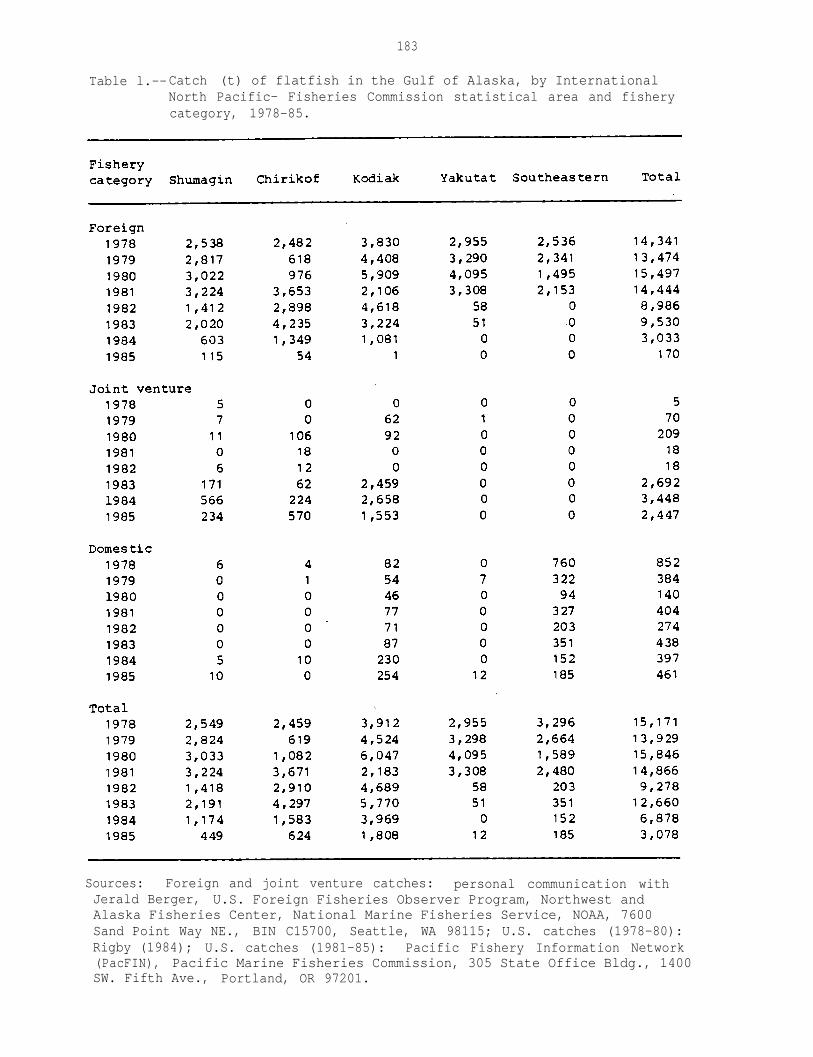
183
Table l.--Catch (t) of flatfish in the Gulf of Alaska, by InternationalNorth Pacific- Fisheries Commission statistical area and fisherycategory, 1978-85.
Sources: Foreign and joint venture catches: personal communication withJerald Berger, U.S. Foreign Fisheries Observer Program, Northwest andAlaska Fisheries Center, National Marine Fisheries Service, NOAA, 7600Sand Point Way NE., BIN C15700, Seattle, WA 98115; U.S. catches (1978-80):Rigby (1984); U.S. catches (1981-85): Pacific Fishery Information Network(PacFIN), Pacific Marine Fisheries Commission, 305 State Office Bldg., 1400SW. Fifth Ave., Portland, OR 97201.
184
As in past years, a large part of the 1985 flatfish catch was arrowtoothflounder (Table 21, which made up more than three-quarters of both the foreignand joint venture catches. Flathead sole and rock sole were the other majorspecies in these fisheries, followed by rex sole and Dover sole. Of the twospecies groups described by Rose (1986), the deep-water group made up approxi-mately 90% of both the foreign and joint venture catches, while the shallow-watergroup made up 83% of the domestic catch.
The most consistent component of the domestic fisheries has been thetrawl fishery for starry flounder in the inside waters of southeasternAlaska. That catch has remained between 100 and 300 t annually since 1978.The domestic flatfish fishery in the Kodiak area has continued the expansionbegun in 1984 and reached 254 t in 1985--162 t (63%) of which was rock sole.Rose (1986) indicated, however, that significant numbers of small flatheadsole and arrowtooth flounder, which would have been discarded at sea, wereprobably captured with the rock sole as well.
STOCK CONDITION
When the flatfish stocks of the gulf were evaluated last year (Rose1986), their potential yield was estimated from biomass estimates generatedby 1) a 1984 survey of the western and central gulf and 2) rough estimates ofmortality and growth rates. The eastern gulf was not included in the updatebecause the survey of that area included little sampling shallower than 200 m,the principal habitat for most, flatfishes in the gulf.
This year, the availability of age data from the 1984 surveys in thewestern and central gulf makes possible better estimates of mortality andgrowth parameters as well as age composition of four major species. There-fore, a new yield analysis has been carried out. Also, biomass estimatesfrom the 1984 surveys of the eastern gulf have been included this year. Itwas decided in retrospect that despite the sampling limitations of the 1984survey in that area (and the corresponding low precision of the biomassestimates) the estimates would nonetheless be more useful than the previousestimates, which were based on surveys done more than 10 years ago.
Biomass Estimates
Estimates of flatfish biomass from the eastern gulf were calculated andadded to those from the western and central gulf (Table 3). The 1984 surveyof the eastern gulf followed the methods for the slope portion of the surveyin the central and western gulf (described by Brown 1986). Catch rates forthe 18 successful stations in the 101-200 m depth range were used to estimatethe biomass of the entire shelf area in those depths. Some bias may resultbecause of the proximity of all those stations to the edge of the shelf. Asno sampling occurred in the 0-100 m depth stratum, the biomass of each speciesin that stratum was estimated by assuming that the proportion in shallowwater in the eastern gulf was the same as that found in the western andcentral gulf. This method does not provide estimates for species which occurexclusively in waters shallower than 100 m, and this may account for the

185
Table 2 .--Composition of the 1985 Gulf of Alaska flatfish catch (t), byfishery category and species (percentages of the grand total arein parentheses).
aLanded catches only, discards at sea not included.
bAll unidentified flatfish included in the "shallow-water, other" category.
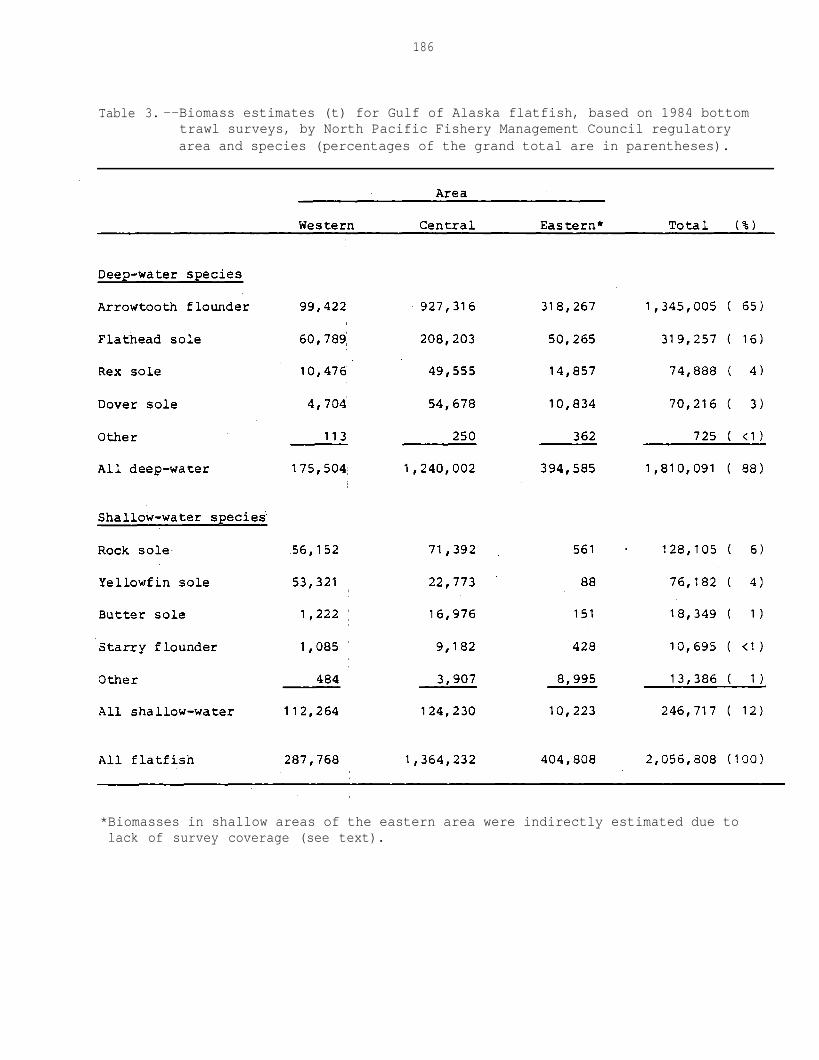
186
Table 3. --Biomass estimates (t) for Gulf of Alaska flatfish, based on 1984 bottomtrawl surveys, by North Pacific Fishery Management Council regulatoryarea and species (percentages of the grand total are in parentheses).
*Biomasses in shallow areas of the eastern area were indirectly estimated due tolack of survey coverage (see text).
187
relatively low biomass of the shallow-water group in that area. The result-ing total flatfish biomass estimate for the eastern gulf (404,808 t) isconsiderably higher than the previous estimate of 190,000 t and represents17% of the total gulf biomass for the nonhalibut flatfish group.
Biological Information
Age determinations were made for samples of arrowtooth flounder, flat-head sole, rock sole, and yellowfin sole. These species make up 91% of thecurrent flatfish biomass and constituted 85% of the 1985 catch. The data wereused to estimate their age compositions and growth characteristics (Figs. 2and 3). In addition, a catch curve analysis (Ricker 1975), using the agecomposition as a synthetic cohort, was used to estimate mortality rates,average recruitment, and age selectivity of the survey effort (Table 4).While this method is effective if recruitment and mortality are not too vari-able, it may result in biased estimates if either variable has an increasingor decreasing trend. A comparison of catches and biomass estimates indicatesthat the rate of fishing mortality has been less than 0.01 since at least1977. Therefore, mortalities from the catch curve analysis are considered toestimate the rate of natural mortality and the 1984 biomass approximates thatof a virgin stock. While these are the best estimates available, the mortalityestimates and the yield estimates which follow from them (see below) shouldbe used with caution, since they were derived from a synthetic cohort of oneyear's data.
YIELD
The growth, mortality, and age composition estimates described above wereused in two analyses to estimate potential yields of the key gulf flatfishstocks. The analysis used last year, from Gulland (1971), was repeated usingthe new mortality estimates (Table 5). This analysis used growth, mortality,and size-at-capture parameters to estimate the ratio of virgin biomass tomaximum sustainable yield. All mortality estimates were significantly higherthan their predecessors, resulting in higher production estimates. This wasespecially true for flathead sole, whose potential yield estimate exceededthat of the more abundant arrowtooth flounder because of a much highermortality rate (0.8 vs. 0.3).
The data were also used in a modified version of the analysis of Thompsonand Bell (1934) to examine the effect of different levels of fishing mortality(F) on yield. This analysis projected the yield of a cohort through itslifetime at each value of F, using the estimates of average recruitment,weight-at-age, and natural mortality. The principal modification was to usethe survey selectivities rather than a fixed age at entry to model recruit-ment. A comparison of survey and fishery size compositions indicated thatthis was a reasonable first approximation, although the survey did catch aslightly higher proportion of smaller individuals.
None of the four species examined (arrowtooth flounder, flathead sole,rock sole, and yellowfin sole) had reached a maximum yield even when F = 16.0,

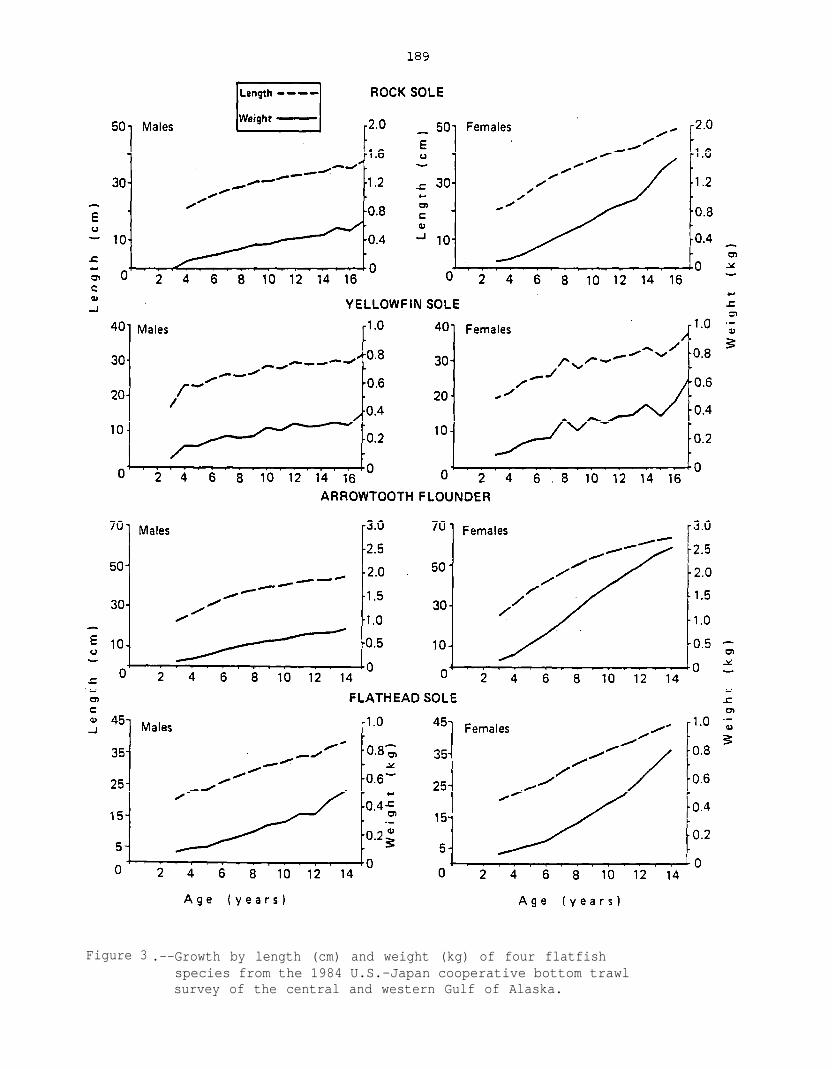
Figure 3 .--Growth by length (cm) and weight (kg) of four flatfishspecies from the 1984 U.S.-Japan cooperative bottom trawlsurvey of the central and western Gulf of Alaska.
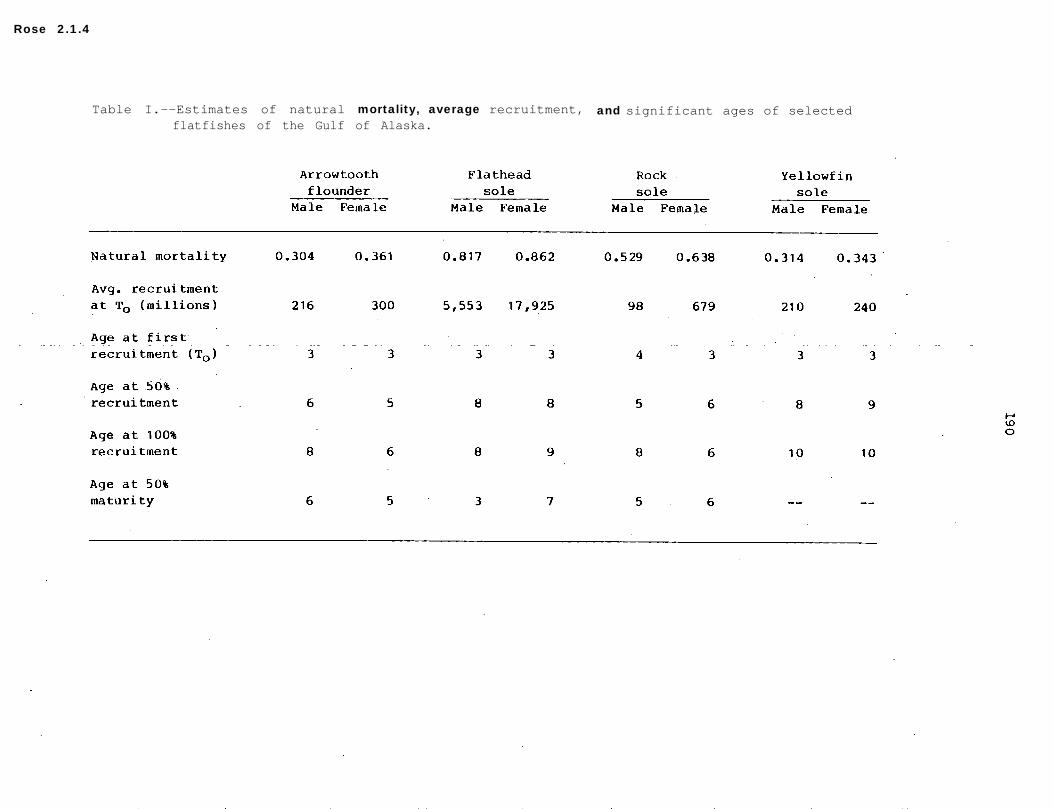
Rose 2.1.4
Table I.--Estimates of natural mortality, average recruitment, and significant ages of selectedflatfishes of the Gulf of Alaska.

Rose 2.3.2
Table 5 .--Maximum sustainable yield estimates (t) for selected Gulf of Alaska flatfish,based on 1984 bottom trawl surveys, by North Pacific Fishery ManagementCouncil regulatory area (percentages of the grand total are in parentheses).
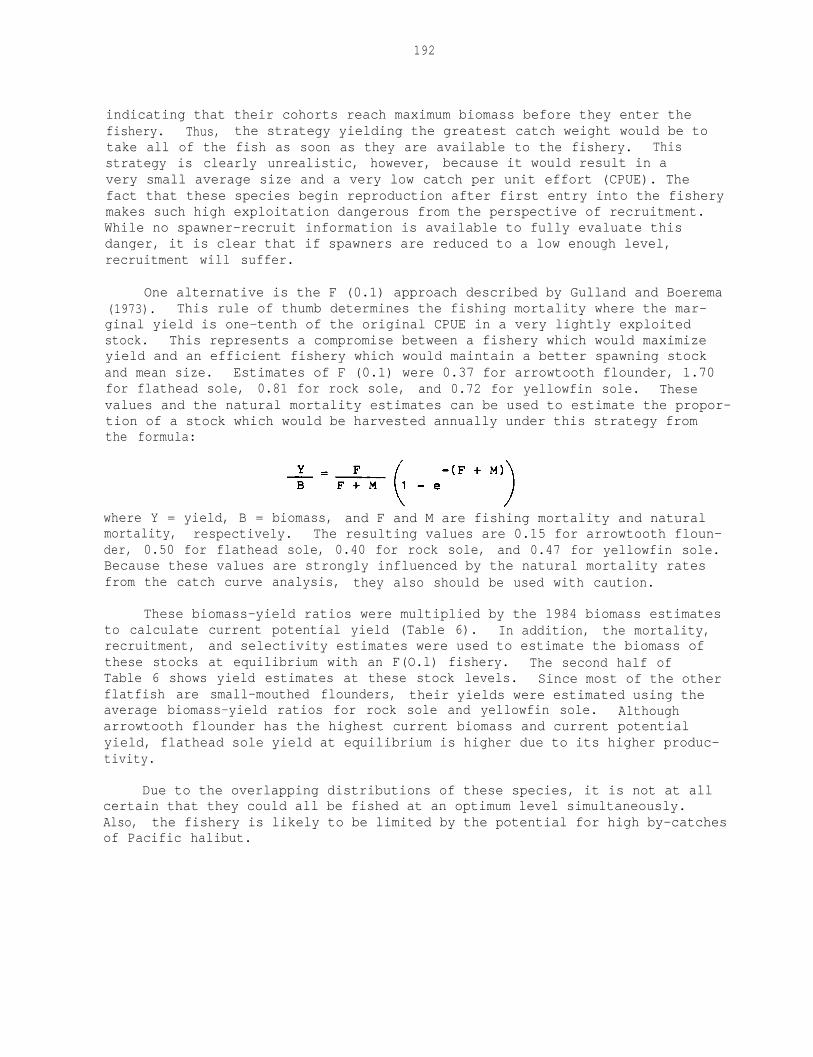
192
indicating that their cohorts reach maximum biomass before they enter thefishery. Thus, the strategy yielding the greatest catch weight would be totake all of the fish as soon as they are available to the fishery. Thisstrategy is clearly unrealistic, however, because it would result in avery small average size and a very low catch per unit effort (CPUE). Thefact that these species begin reproduction after first entry into the fisherymakes such high exploitation dangerous from the perspective of recruitment.While no spawner-recruit information is available to fully evaluate thisdanger, it is clear that if spawners are reduced to a low enough level,recruitment will suffer.
One alternative is the F (0.1) approach described by Gulland and Boerema(1973). This rule of thumb determines the fishing mortality where the mar-ginal yield is one-tenth of the original CPUE in a very lightly exploitedstock. This represents a compromise between a fishery which would maximizeyield and an efficient fishery which would maintain a better spawning stockand mean size. Estimates of F (0.1) were 0.37 for arrowtooth flounder, 1.70for flathead sole, 0.81 for rock sole, and 0.72 for yellowfin sole. Thesevalues and the natural mortality estimates can be used to estimate the propor-tion of a stock which would be harvested annually under this strategy fromthe formula:
where Y = yield, B = biomass, and F and M are fishing mortality and naturalmortality, respectively. The resulting values are 0.15 for arrowtooth floun-der, 0.50 for flathead sole, 0.40 for rock sole, and 0.47 for yellowfin sole.Because these values are strongly influenced by the natural mortality ratesfrom the catch curve analysis, they also should be used with caution.
These biomass-yield ratios were multiplied by the 1984 biomass estimatesto calculate current potential yield (Table 6). In addition, the mortality,recruitment, and selectivity estimates were used to estimate the biomass ofthese stocks at equilibrium with an F(O.l) fishery. The second half ofTable 6 shows yield estimates at these stock levels. Since most of the otherflatfish are small-mouthed flounders, their yields were estimated using theaverage biomass-yield ratios for rock sole and yellowfin sole. Althougharrowtooth flounder has the highest current biomass and current potentialyield, flathead sole yield at equilibrium is higher due to its higher produc-tivity.
Due to the overlapping distributions of these species, it is not at allcertain that they could all be fished at an optimum level simultaneously.Also, the fishery is likely to be limited by the potential for high by-catchesof Pacific halibut.
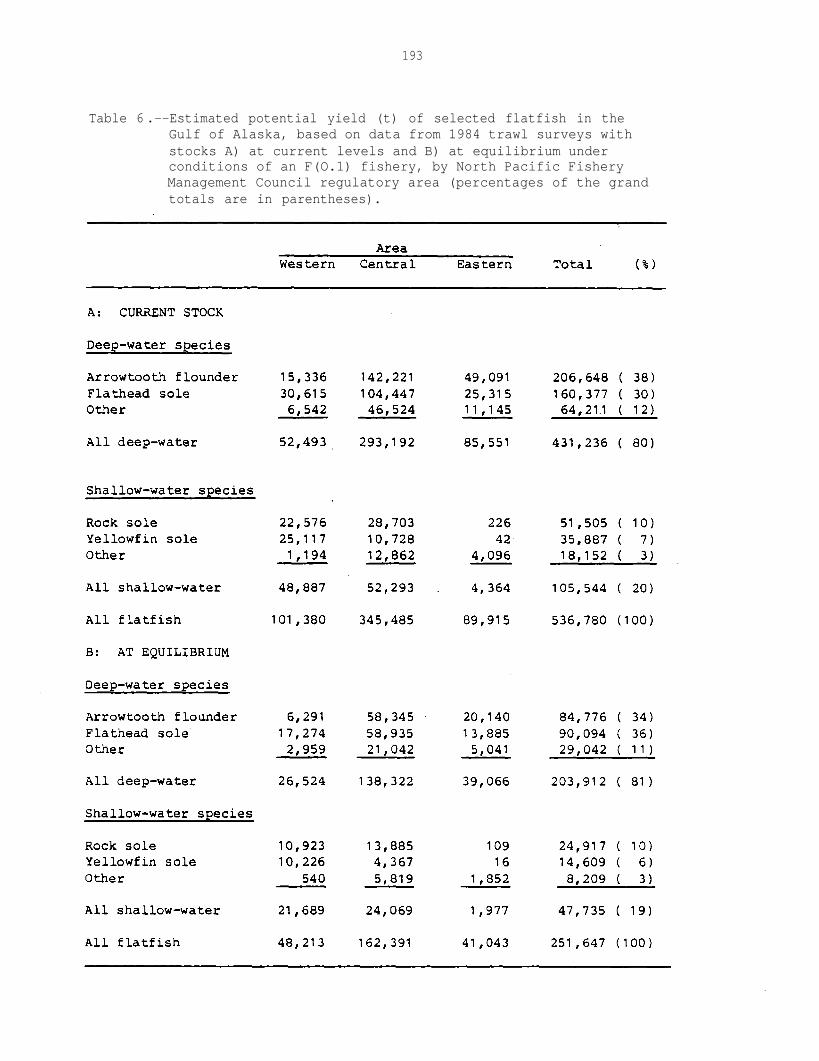
193
Table 6 .--Estimated potential yield (t) of selected flatfish in theGulf of Alaska, based on data from 1984 trawl surveys withstocks A) at current levels and B) at equilibrium underconditions of an F(O.1) fishery, by North Pacific FisheryManagement Council regulatory area (percentages of the grandtotals are in parentheses).

194
REFERENCES
Brown, E. S. 1986. Preliminary results of the 1984 U.S.-Japan cooperativebottom trawl survey of the central and western Gulf of Alaska. InR. L. Major (editor), Condition of groundfish resources of the Gulf ofAlaska as assessed in 1985, p. 259. U.S. Dep. Commer., NOAA Tech. Memo.NMFS F/NWC-106.
Gulland, J. A. 1971. The fish resources of the ocean. Fishing News (Books)Ltd., West Byfleet, Surrey, England, 255 p.
Gulland, J. A., and L. K. Boerema. 1973. Scientific advice on catch levels.U.S. Natl. Mar. Fish. Serv., Fish. Bull. 71(2):325-335.
Ricker, W. E. 1975. Computation and interpretation of biological statisticsof fish populations. Bull. Fish. Res. Board Can. 191, 382 p.
Rigby, P. W. 1984. Alaska domestic groundfish fishery for the years 1970through 1980 with a review of two historic fisheries--Pacific cod (Gadusmacrocephalus) and sablefish (Anoplopoma fimbria). Alaska Dep. FishGame, Tech. Data Rep. 108, 446 p.
Rose, C. S. 1986. Flatfish. In R. L. Major (editor), Condition of groundfishresources of the Gulf of Alaska as assessed in 1985, p. 235. U.S. Dep.Commer., NOAA Tech. Memo. NMFS F/NWC-106.
Thompson, W. F., and F. H. Bell. 1934. Biological statistics of the Pacifichalibut fishery, 2) Effect of changes in intensity upon total yield andyield per unit of gear. Rep. Int. Pac. Halibut Comm. 8, 49 p.
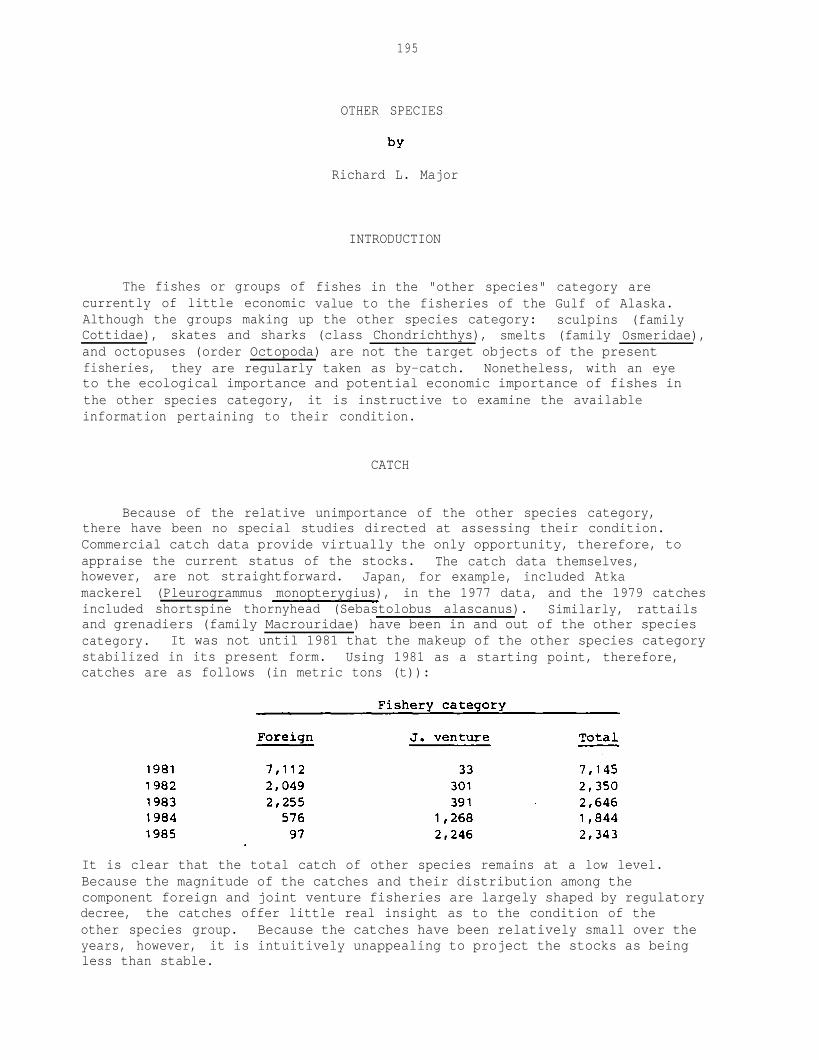
195
OTHER SPECIES
Richard L. Major
The fishes or groups ofcurrently of little economic
INTRODUCTION
fishes in the "other species" category arevalue to the fisheries of the Gulf of Alaska.
Although the groups making up the other species category: sculpins (familyCottidae), skates and sharks (class Chondrichthys), smelts (family Osmeridae),and octopuses (order Octopoda) are not the target objects of the presentfisheries, they are regularly taken as by-catch. Nonetheless, with an eyeto the ecological importance and potential economic importance of fishes inthe other species category, it is instructive to examine the availableinformation pertaining to their condition.
CATCH
Because of the relative unimportance of the other species category,there have been no special studies directed at assessing their condition.Commercial catch data provide virtually the only opportunity, therefore, toappraise the current status of the stocks. The catch data themselves,however, are not straightforward. Japan, for example, included Atkamackerel (Pleurogrammus monopterygius), in the 1977 data, and the 1979 catchesincluded shortspine thornyhead (Sebastolobus alascanus). Similarly, rattailsand grenadiers (family Macrouridae) have been in and out of the other speciescategory. It was not until 1981 that the makeup of the other species categorystabilized in its present form. Using 1981 as a starting point, therefore,catches are as follows (in metric tons (t)):
It is clear that the total catch of other species remains at a low level.Because the magnitude of the catches and their distribution among thecomponent foreign and joint venture fisheries are largely shaped by regulatorydecree, the catches offer little real insight as to the condition of theother species group. Because the catches have been relatively small over theyears, however, it is intuitively unappealing to project the stocks as beingless than stable.
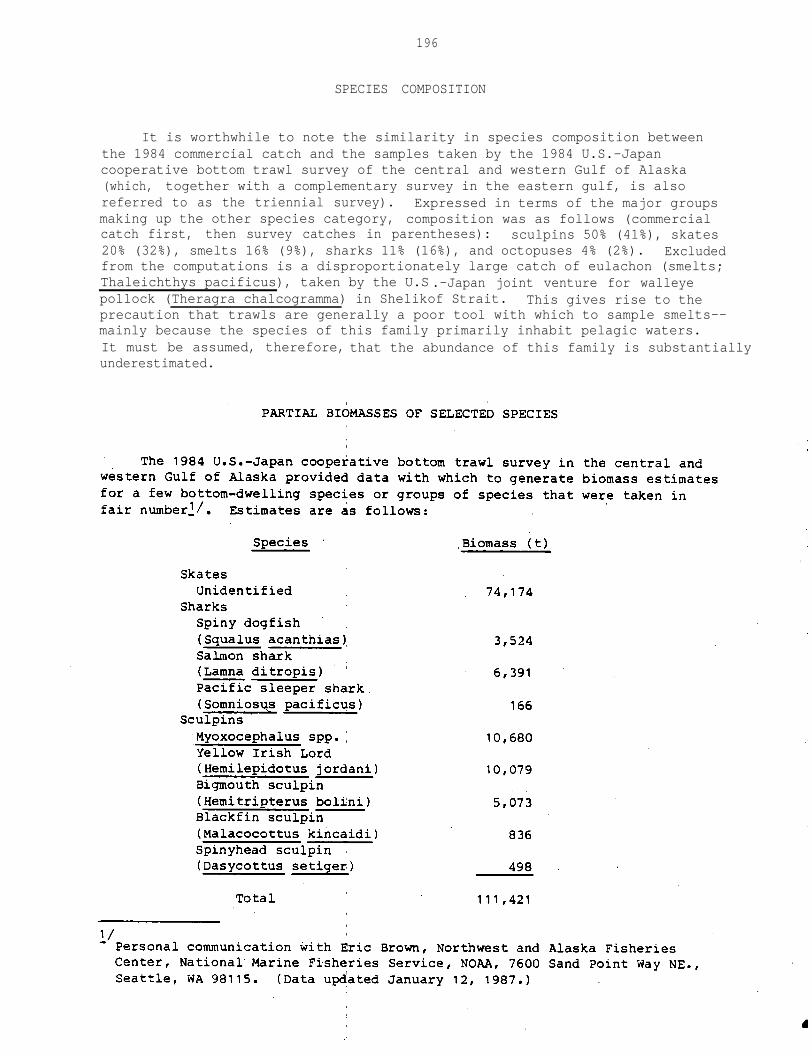
196
SPECIES COMPOSITION
It is worthwhile to note the similarity in species composition betweenthe 1984 commercial catch and the samples taken by the 1984 U.S.-Japancooperative bottom trawl survey of the central and western Gulf of Alaska(which, together with a complementary survey in the eastern gulf, is alsoreferred to as the triennial survey). Expressed in terms of the major groupsmaking up the other species category, composition was as follows (commercialcatch first, then survey catches in parentheses): sculpins 50% (41%), skates20% (32%), smelts 16% (9%), sharks 11% (16%), and octopuses 4% (2%). Excludedfrom the computations is a disproportionately large catch of eulachon (smelts;Thaleichthys pacificus), taken by the U.S .-Japan joint venture for walleyepollock (Theragra chalcogramma) in Shelikof Strait. This gives rise to theprecaution that trawls are generally a poor tool with which to sample smelts--mainly because the species of this family primarily inhabit pelagic waters.It must be assumed, therefore, that the abundance of this family is substantiallyunderestimated.
197
It is important to emphasize, for reasons of later discussion, that theso-called "total" biomass estimate is for the International North PacificFisheries Commission Shumagin, Chirikof, and Kodiak Statistical Areas only.Excluded, because data for the species of primary interest were scanty, arethe Yakutat and Southeastern Statistical Areas. Also, smelts (which couldmake up a large element in the other species category), octopuses, and manysculpins are not included.
MAXIMUM SUSTAINABLE YIELD, EQUILIBRIUM YIELD,ACCEPTABLE BIOLOGICAL CATCH, AND OPTIMUM YIELD
The maximum sustainable yield, equilibrium yield, and acceptable biologicalcatch have not been estimated for the other species category because of thedearth of information. Rather, the North Pacific Fishery Management Council,per terms of the Fishery Management Plan (FMP) for the Gulf of Alaska GroundfishFishery, sets optimum yield (OY) at 5% of the sum of the OYs for the nineother species categories. Using this procedure, the 1986 OY was 12,186 t.Considering that 12,186 t is only 11% of the bare minimum current biomassestimated above (and probably a much lower percentage of the real biomass),the procedure called for in the FMP does not jeopardize the well-being of theother species category. The population, in fact, could probably sustain ahigher harvest rate, providing that the weaker elements in the multispeciescomplex were not thereby imperiled.
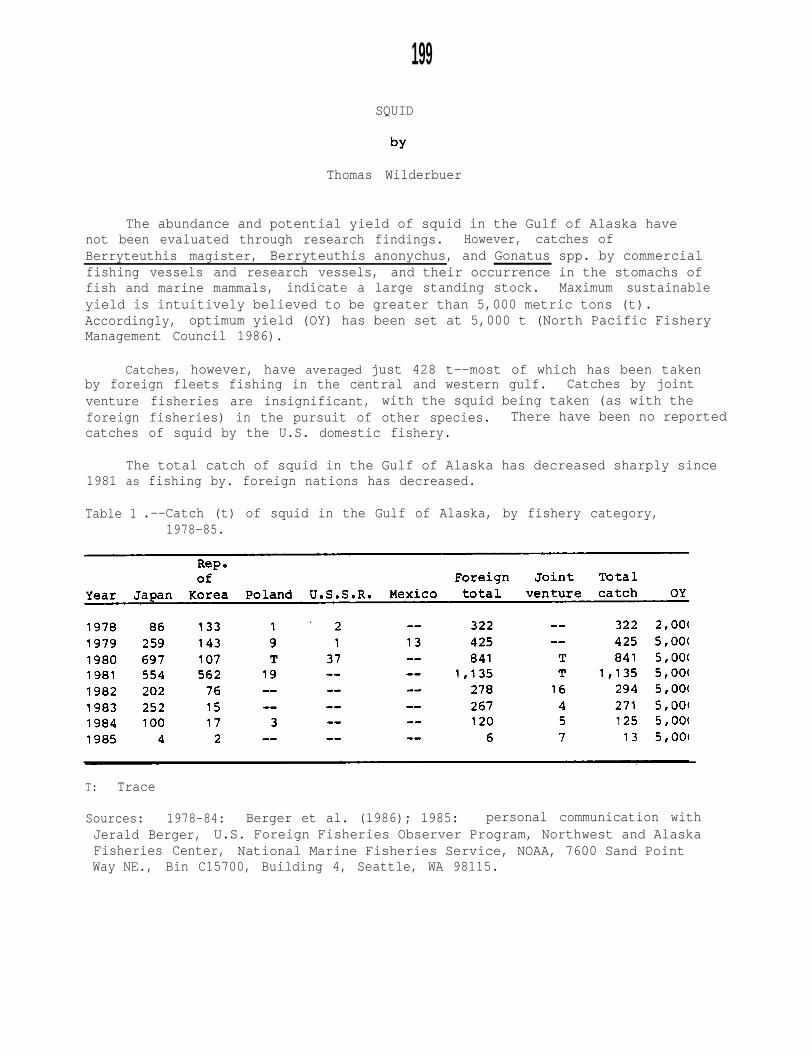
199
SQUID
Thomas Wilderbuer
The abundance and potential yield of squid in the Gulf of Alaska havenot been evaluated through research findings. However, catches ofBerryteuthis magister, Berryteuthis anonychus, and Gonatus spp. by commercialfishing vessels and research vessels, and their occurrence in the stomachs offish and marine mammals, indicate a large standing stock. Maximum sustainableyield is intuitively believed to be greater than 5,000 metric tons (t).Accordingly, optimum yield (OY) has been set at 5,000 t (North Pacific FisheryManagement Council 1986).
Catches, however, have averaged just 428 t--most of which has been takenby foreign fleets fishing in the central and western gulf. Catches by jointventure fisheries are insignificant, with the squid being taken (as with theforeign fisheries) in the pursuit of other species. There have been no reportedcatches of squid by the U.S. domestic fishery.
The total catch of squid in the Gulf of Alaska has decreased sharply since1981 as fishing by. foreign nations has decreased.
Table 1 .--Catch (t) of squid in the Gulf of Alaska, by fishery category,1978-85.
T: Trace
Sources: 1978-84: Berger et al. (1986); 1985: personal communication withJerald Berger, U.S. Foreign Fisheries Observer Program, Northwest and AlaskaFisheries Center, National Marine Fisheries Service, NOAA, 7600 Sand PointWay NE., Bin C15700, Building 4, Seattle, WA 98115.
200
REFERENCES
Berger, J. D., Smoker, J. E. and King, K. A. 1986. Foreign and jointventure catches and allocations in the Pacific Northwest and Alaskafishing areas under Magnuson Fishery Conservation and Management Act,1977-84. U.S. Dep. Commer., NOAA Tech. Memo. NMFS F/NWC-99, 53 p.
North Pacific Fishery Management Council. 1986. Fishery management planfor the Gulf of Alaska groundfish fishery. Unpubl. manuscr., 200 p.North Pac. Fish. Manage. Count., P.O. Box 103136, Anchorage, AK 99510.
201
1986 U.S. RESEARCH SURVEYS AND RESEARCH PLANSFOR 1987 IN THE NORTHEASTERN PACIFIC OCEAN
Lael L. Ronholt
FIELD RESEARCH CONDUCTED IN 1986
Gulf of Alaska
U.S. Research
Walleye pollock: hydroacoustic stock assessment--A hydroacousticsurvey to assess the magnitude of the walleye pollock spawning concentrationin Shelikof Strait was completed during March-April aboard the NOAAship Miller Freeman.
Walleye pollock: juveniles --During September-October a survey ofjuvenile (young-of-the-year) walleye pollock was conducted in theKodiak Island-Aleutian Peninsula areas of the Gulf of Alaska. Echosounding, midwater trawling, and on-bottom trawling were employedaboard the NOAA vessel John N. Cobb to study distribution and abundance.- - -
Walleye pollock: egg and larvae study--During April-May, ichthyo-plankton surveys focusing on the early life history of walleye pollockwere conducted aboard the NOAA vessel Miller Freeman. Specific objectiveswere to 1) estimate the magnitude of the spawning stock in ShelikofStrait from egg surveys, 2) relate the distribution of eggs and larvaeto oceanographic conditions, and 3) trace the drift and assess thefeeding condition of larvae. This research was part of the Fisheries-Oceanographic Experiment (FOX) (see below).
FOX--This multi-discipline, multi-agency research was undertakenin Shelikof Strait to examine the environment in which walleye pollockspawn and the young develop. The NOAA ship Miller Freeman provided theresearch platform for scientists from NOAA's Pacific Marine EnvironmentalLaboratory and the Northwest and Alaska Fisheries Center. This researchwas supported under the new NOAA initiative, FOCI (Fisheries-OceanographyCoordinated Investigations).
Sablefish: longline experiment--A longline gear experiment to studythe effects of hook spacing and soaking time on catch rates was conductedoff southeastern Alaska during June aboard the NOAA ship John N. Cobb.- - -
Sablefish: trap survey--The annual trap index survey off southeasternAlaska was conducted during July aboard the NOAA ship John N. Cobb.- - -
Sablefish: juvenile tagging--Juvenile sablefish were captured andtagged during July-August aboard the NOAA ship John N. Cobb.- - -
202
Sablefish: flesh quality--During January-February, sampling wasconducted aboard the NOAA ship John N. Cobb to study the flesh quality of- - sablefish and its relationship to water depth.
Sablefish: early life history-- During January-February, a survey tolocate spawning locations and to determine the timing of spawning of sable-fish was conducted aboard the NOAA ship Miller Freeman.
Pacific ocean perch: age composition--A trawl survey was conductedduring January-February aboard the NOAA ship Miller Freeman to providedata on the age composition of the Pacific ocean perch stock off south-eastern Alaska.
Cooperative Research
Sablefish: longline survey--The annual Japan-U.S. cooperative long-line survey of the Gulf of Alaska was conducted during July-Septemberaboard the Fukuyoshi Maru No. 8. This survey provides data on the distri-bution and abundance of Pacific cod, sablefish, and other deep-water species.
Ichthyoplankton: eggs and larvae--During March-April, the U.S. andthe U.S.S.R. conducted a cooperative ichthyoplankton survey in the centralGulf of Alaska aboard the Soviet research vessel Gissar. The survey wasincluded in the previously described FOX experiment.
walleye pollock: hydroacoustic-- A hydroacoustic survey to locate spawningconcentrations of walleye pollock was conducted in the eastern and centralportions of the Gulf of Alaska. Cooperative U.S .-U.S.S.R. survey operationswere conducted aboard the Soviet research vessel, Gissar during March.
U.S. West Coast Research
Groundfish: resource assessment--The fourth triennial trawl/hydroacousticsurvey of the groundfish resources on the west coast of the United States wasconducted during July-October using the charter vessels Pat San Marie and Alaska.- - PPrincipal species of interest for the 1986 survey were Pacific whiting,yellowtail rockfish, and canary rockfish.
Sablefish: trap index study--The annual trap index study to measurechanges in the abundance of sablefish along the west coast was conductedaboard the charter vessel American Viking during September-October. Also,sablefish were tagged as part of the continuing program to study their move-ments. Transition from rectangular to conical traps was completed during 1986.
203
FIELD RESEARCH PLANS FOR 1987
Gulf of Alaska
U.S. Research
Walleye pollock: juveniles-- A survey to study the distribution andrelative abundance of young-of-the-year walleye pollock is planned for thewestern Gulf of Alaska.
FOCI--Field research will continue and expand the studies on walleyepollock and larvae in Shelikof Strait--studies initially started asthe FOX program. A survey is planned during April-July aboard the NOAAship Miller Freeman to trace the development, distribution, drift, andfeeding condition of young-of-the-year walleye pollock through the earlyjuvenile stages.
Sablefish: longline survey--The first U.S. longline survey of thesablefish, Pacific cod, and other deep-water resources is scheduled forthe Gulf of Alaska during the summer of 1987.
Sablefish: longline experiments--Gear experiments to study the effectof hook spacing on the catch rates will continue in 1987 aboard the NOAAship John N. Cobb.- - -
Sablefish: habitat--A study designed to relate the distribution ofsablefish to habitat types is scheduled to begin in 1987.
Sablefish: feeding study--Also scheduled to begin in 1987 is a studyto obtain data on the feeding habits of sablefish.
Sablefish: trap surveys--The annual trap index off southeasternAlaska is expected to continue in 1987.
Pacific ocean perch: hydroacoustics--A program to begin assessing thePacific ocean perch stock off southeastern Alaska using hydroacoustictechniques is planned for 1987.
Walleye pollock: hydroacoustic resource assessment--A hydroacousticsurvey to assess the condition of the walleye pollock spawning concentrationin Shelikof Strait is planned for March of 1987, using the NOAA ship MillerFreeman.
Cooperative Research
Groundfish: resource assessment--A second cooperative U.S.-Japangroundfish resource assessment survey of the Gulf of Alaska is anticipatedduring the summer of 1987.
Sablefish: longline survey--The annual cooperative Japan-U.S. longlinesurvey for sablefish, Pacific cod, and other deepwater species is anticipatedfor the summer of 1987.

204
West Coast
Sablefish: abundance index--A survey is scheduled for August-Septemberoff the Washington and Oregon coast to obtain standardized catch per uniteffort and biological data for monitoring population changes of sablefish.Tagging will also be continued to study the movement of juveniles (particularlyinto Canadian fisheries) and tag loss.