Embed Size (px)
Citation preview
NATIONAL CENTER FOR EDUCATION STATISTICS
Statistical Analysis Report June 2000
Condition ofAmerica’sPublic SchoolFacilities: 1999
U.S. Department of EducationOffice of Educational Research and Improvement NCES 2000-032
NATIONAL CENTER FOR EDUCATION STATISTICS
Statistical Analysis Report June 2000
Condition ofAmerica’sPublic SchoolFacilities: 1999
Laurie LewisKyle SnowElizabeth FarrisWestat
Becky SmerdonStephanie CronenJessica KaplanAmerican Institutes for Research, in conjunctionwith the Education Statistics Services Institute
Bernie GreeneProject OfficerNational Center for Education Statistics
U.S. Department of EducationOffice of Educational Research and Improvement NCES 2000-032
U.S. Department of EducationRichard W. RileySecretary
Office of Educational Research and ImprovementC. Kent McGuireAssistant Secretary
National Center for Education StatisticsGary W. PhillipsActing Commissioner
The National Center for Education Statistics (NCES) is the primary federal entity for collecting, analyzing,and reporting data related to education in the United States and other nations. It fulfills a congressionalmandate to collect, collate, analyze, and report full and complete statistics on the condition of education inthe United States; conduct and publish reports and specialized analyses of the meaning and significanceof such statistics; assist state and local education agencies in improving their statistical systems; andreview and report on education activities in foreign countries.
NCES activities are designed to address high priority education data needs; provide consistent, reliable,complete, and accurate indicators of education status and trends; and report timely, useful, and highquality data to the U.S. Department of Education, the Congress, the states, other education policymakers,practitioners, data users, and the general public.
We strive to make our products available in a variety of formats and in language that is appropriate to avariety of audiences. You, as our customer, are the best judge of our success in communicatinginformation effectively. If you have any comments or suggestions about this or any other NCES productor report, we would like to hear from you. Please direct your comments to:
National Center for Education StatisticsOffice of Educational Research and ImprovementU.S. Department of Education1990 K Street NWWashington, DC 20006
June 2000
The NCES World Wide Web Home Page is:http://nces.ed.gov
Suggested CitationU.S. Department of Education, National Center for Education Statistics. Condition of America’s PublicSchool Facilities: 1999. NCES 2000-032, by Laurie Lewis, Kyle Snow, Elizabeth Farris, Becky Smerdon,Stephanie Cronen, and Jessica Kaplan. Bernie Greene, project officer. Washington, DC: 2000.
For ordering information on this report, writeU.S. Department of EducationED PubsP.O. Box 1398Jessup, MD 20794-1398
or by calling toll free 1-877-4ED-Pubs.
Content Contact:Bernie Greene(202) 502-7348
iii
EXECUTIVE SUMMARY
Background
Over the past decade, the physical condition ofAmerica's public schools has receivedconsiderable attention (e.g., Kozol 1991; Lewis etal. 1989). For example, a number of lawsuitschallenging school funding for facilities havedrawn attention to the poor conditions that manystudents encounter at school [e.g., RooseveltElementary School No. 66 v. Bishop, 877 P. 2d806 (Ariz. 1994)]. Newspaper stories andresearch studies describing poor ventilation,broken plumbing, and overcrowding have raisedconcerns about the effects of school facilities onteaching and learning. More importantly, someconditions, like sagging roofs or poor air quality,have raised serious questions about student andteacher safety.
The physical condition of schools is described ina series of reports based on a 1994 studyconducted by the United States GeneralAccounting Office (GAO). In addition, severalstudies have reported on school repair andconstruction costs, each with a somewhatdifferent focus. The 1994 GAO study providedestimates of the cost of repairs, renovations, andmodernizations to put schools into good overallcondition (U.S. GAO 1995a), while a more recentGAO study reported actual school constructionexpenditures for fiscal years 1990 through 1997(U.S. GAO 2000). Another report included actualcosts of completed school construction projects in1998 and projected expenditures for newconstruction, additions, and renovations for 1999(Abramson 1999). A report recently released bythe National Education Association (NEA) gave acost estimate of the funds needed for variouskinds of school infrastructure (including newconstruction) and education technology(NEA2000).
This report provides national data about thecondition of public schools in 1999 based on asurvey conducted by the National Center for
Education Statistics (NCES) using its FastResponse Survey System (FRSS). Specifically,this report provides information about thecondition of school facilities and the costs tobring them into good condition; school plans forrepairs, renovations, and replacements; the age ofpublic schools; and overcrowding and practicesused to address overcrowding. The resultspresented in this report are based on questionnairedata for 903 public elementary and secondaryschools in the United States. The responses wereweighted to produce national estimates thatrepresent all regular public schools in the UnitedStates. Information about the condition of schoolfacilities is based on questionnaire rating scalesrather than on physical observation of schoolconditions by outside observers.
Key Findings
Estimates of Cost to Put Buildings Into GoodCondition
A major barrier for schools to improve theirfacilities is the substantial cost (U.S. GAO1995a). If schools are unable to obtain thefunding they need to perform maintenance orconstruct new buildings when necessary, facilitiesproblems multiply, which can result not only inhealth and safety problems, but also in increasedcosts of repairs (Hansen 1992). Results of the1999 FRSS survey indicate that:
• Three-quarters of schools reported needing tospend some money on repairs, renovations,and modernizations to put the school’s onsitebuildings into good overall condition1 (table
1 Schools that reported on the questionnaire that the condition of any
type of onsite school building (original and temporary buildings,permanent addition) or any building feature (e.g., roofs, plumbing,electric power) was less than good (i.e., any type of building orbuilding feature was given a rating of adequate, fair, poor, orreplace) provided information about the cost of the needed repairs,renovations, and modernizations. This is somewhat different fromthe approach used by GAO in 1994, which prevents direct
iv
5). The total amount needed by schools wasestimated to be approximately $127 billion(see table 23 in appendix B).
• The average dollar amount per school forschools needing to spend money was about$2.2 million (see table 23 in appendix B).The average cost per student of repairs,renovations, and modernizations to put theschool into good overall condition among theschools that reported needing to spend moneywas $3,800 (table 5).
Types of School Buildings and OverallFacilities Conditions
Observations of school facilities have appeared inheadlines, speeches, and reports that focus on thedeteriorating environmental and physicalconditions of the nation’s schools. Results of the1999 FRSS survey confirm that although mostschools are in relatively good condition, manyschools are in less than adequate condition:
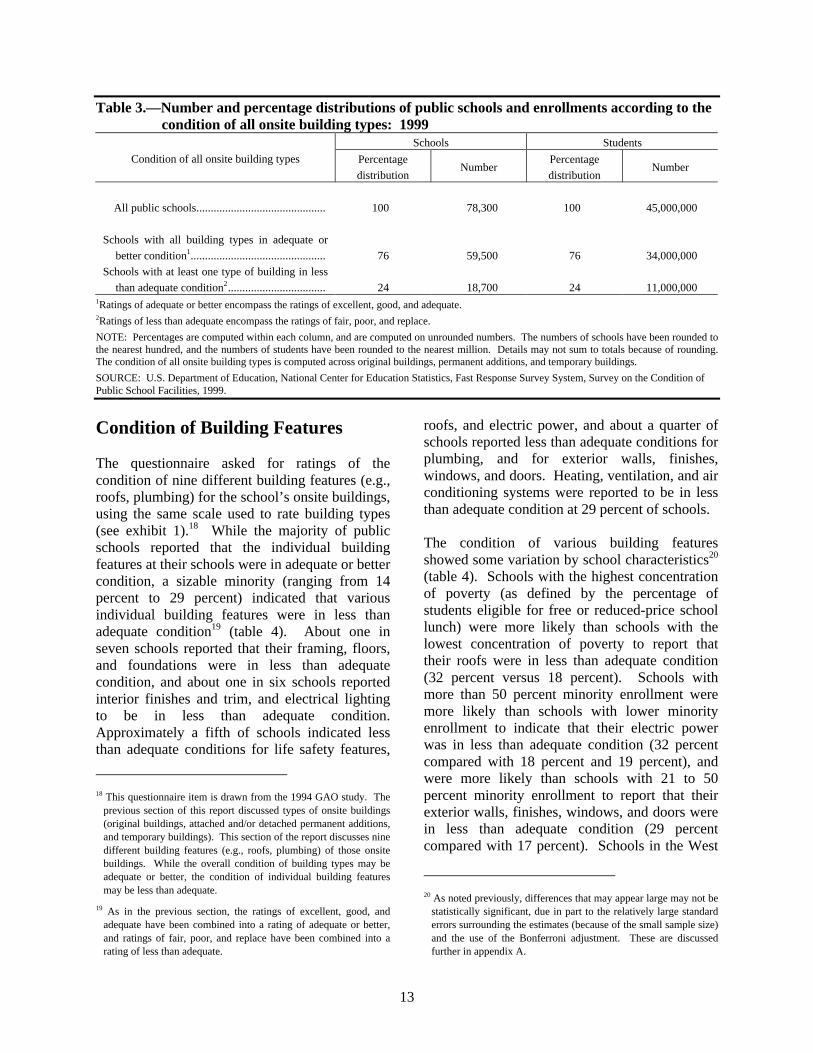
• One in four schools reported that at least onetype of onsite building (i.e., original andtemporary buildings, permanent additions)was in less than adequate condition.2
• Approximately 11 million students wereenrolled in schools reporting at least one typeof onsite building in less than adequatecondition (table 3). Of these students, about3.5 million attended schools where at leastone type of building was in poor condition orneeded to be replaced because it was non-operational or showed significantlysubstandard performance (see table 23 inappendix B).
• Eighty-one percent of schools reported thattheir original buildings were in adequate orbetter condition, 84 percent of those schoolswith permanent additions reported them to bein adequate or better condition, and 81percent of schools with temporary buildings
comparison of the cost estimates between the FRSS and GAOstudies.
2 This is based on types of onsite buildings, and does not includebuilding features. It is also based on ratings of less than adequatecondition, which includes the ratings of fair, poor, and replace.
reported them to be in adequate or bettercondition (table 1). This means thatapproximately one in five schools having aparticular type of building reported that thesebuilding types were in less than adequatecondition. This included 4 to 6 percentreporting buildings in poor condition (definedas consistent substandard performance), and 1to 2 percent reporting that buildings needed tobe replaced due to significantly substandardperformance or non-operational condition.
• The condition of original buildings andtemporary structures did not vary signi-ficantly by school characteristics3; however,the condition of permanent additions variedby concentration of poverty: schools with thehighest concentration of poverty (definedhere as 70 percent or more of the studentseligible for free or reduced-price lunch) weremore likely to report that their permanentadditions were in less than adequate conditionthan were schools with 20 to 39 percent orschools with less than 20 percent of theirstudents eligible for free or reduced-pricelunch (30 percent versus 13 percent and 8percent, respectively; table 2).
Condition of Building Features
The 1999 FRSS survey on the condition of publicschool facilities also collected information on thecondition of nine different building features:roofs; framing, floors, and foundations; exteriorwalls, finishes, windows, and doors; interiorfinishes and trim; plumbing; heating, ventilationand air conditioning; electric power; electricallighting; and life safety features. The 1999 FRSSsurvey found that:
3 The school characteristics used as analysis variables in this report
are school instructional level, school enrollment size, locale(central city, urban fringe/large town, rural/small town), region,percent minority enrollment, and percent of students in the schooleligible for free or reduced-price school lunch (which indicates theconcentration of poverty in the school). Throughout this report,differences (particularly those by school characteristics) that mayappear large may not be statistically significant. This is due in partto the relatively large standard errors surrounding the estimates(because of the small sample size) and the use of the Bonferroniadjustment to control for multiple comparisons.
v
• Fifty percent of schools reported that at leastone of the nine building features at theirschool was in less than adequate condition(table 4), and three-quarters of those schoolshad more than one building feature in lessthan adequate condition (figure 1). Schoolsin central cities were more likely than schoolsin urban fringe areas and large towns toreport at least one building feature as lessthan adequate (56 percent compared with 44percent; table 4). Schools with the highestconcentration of poverty (70 percent or moreof the students eligible for free or reduced-price lunch) were more likely to report that atleast one building feature was in less thanadequate condition than were schools with 20to 39 percent or schools with less than 20percent of their students eligible for free orreduced-price lunch (63 percent versus 45percent each).
• Approximately one-fifth of schools indicatedless than adequate conditions for life safetyfeatures, roofs, and electric power, and abouta quarter of schools reported less thanadequate conditions for plumbing, and forexterior walls, finishes, windows, and doors(table 4). Heating, ventilation, and airconditioning systems were reported to be inless than adequate condition at 29 percent ofschools.
Environmental Conditions
Environmental conditions, such as heating,ventilation, and air conditioning, are importantaspects of the day-to-day environment forstudents. The 1999 FRSS survey on the conditionof public school facilities also collectedinformation on satisfaction with six differentenvironmental conditions: lighting, heating,ventilation, indoor air quality, acoustics or noisecontrol, and physical security of buildings. Theresults of the 1999 FRSS survey indicate that:
• Forty-three percent of the schools reportedthat at least one of the six environmentalfactors was in unsatisfactory condition (table8), and approximately two-thirds of thoseschools had more than one environmentalcondition in unsatisfactory condition (figure
2). Ventilation was the environmentalcondition most likely to be perceived asunsatisfactory (26 percent of schools; table8). About a fifth of schools reported theywere unsatisfied with heating, indoor airquality, acoustics or noise control, and thephysical security of buildings, and 12 percentwere unsatisfied with lighting conditions.
• Schools in rural areas and small towns weremore likely than schools in urban fringe areasand large towns to report that at least one oftheir environmental conditions was unsatis-factory (47 percent compared with 37 per-cent; table 8). Schools with the highestconcentration of poverty were more likely toreport at least one unsatisfactory environ-mental condition than were schools with thelowest concentration of poverty (55 percentcompared with 38 percent).
• About one-third of schools were unsatisfiedwith the energy efficiency of the school, and38 percent were unsatisfied with theirflexibility of instructional space (see table 23in appendix B).
Plans for Repairs, Renovation, or Replacement
The condition of school facilities is continuouslychanging, and information about schools' futureplans for building or installing new structures oradditions, as well as plans to make major repairs,renovations, or replacements in the next 2 years,may provide insights into the future condition ofthese facilities. The 1999 FRSS survey foundthat:
• About two-thirds of public schools hadwritten long-range facilities plans that guidetheir planning for facilities improvements(table 12). One-fifth of schools reportedplans to build new attached and/or detachedpermanent additions in the next 2 years, and 1in 10 reported plans to install new temporarybuildings in the next 2 years (table 13).
• About half of the schools planned to makemajor repairs, renovations, or replacements toat least one building feature in the next 2years (table 14). Overall, 41 percent ofschools indicated plans to make major repairs
vi
or renovations to at least one building feature,and one-quarter planned to replace at leastone building feature in the next 2 years.
• Schools in less than adequate condition weremore likely to have plans for repairs,renovations, or replacement. While 46percent of schools in adequate or betteroverall condition reported plans to repair,renovate, or replace at least one buildingfeature in the next 2 years, 67 percent ofschools in less than adequate conditionreported such plans (figure 4).
Functional Age of Schools and SchoolConditions
A number of reports have raised concerns aboutthe age of America’s public schools (e.g., U.S.Department of Education 1999b). Because age ofthe building, by itself, may be somewhat lessimportant than its history of maintenance andrenovation, a more accurate indication of aschool's age is its functional age. Functional ageis defined as the age of the school based on theyear of the most recent renovation or the year ofconstruction of the main instructional building(s)if no renovation has occurred. Results of the1999 FRSS survey indicate that:
• In 1999, the average age of the maininstructional building(s) of public schoolswas 40 years, based on years since originalconstruction (table 17). Among schools thathad been renovated since construction, therenovation, on average, occurred 11 yearsago.
• The average functional age of schools, basedon the year of the most recent renovation orthe year of construction if no renovation hadoccurred, was calculated to be 16 years. Ingeneral, average functional age did not varyby school characteristics, although smallschools were older than medium or largeschools.
• The functional age of schools was found to berelated to their condition. Older schools weremore likely than newer schools to report lessthan adequate or unsatisfactory conditions(figure 6).
Overcrowding
Dramatic increases in enrollment due to the“baby-boom echo,” immigration, and migrationhave led many schools to enroll far more studentsthan they were designed to accommodate.4
Compounding these conditions are initiatives toreduce class size, resulting in the need for evenmore classrooms. As the public school systemcopes with such conditions, there is growingconcern about the degree of overcrowding thatmay exist in some schools. This report providesinformation about the extent to which publicschools are overcrowded, at capacity, orunderenrolled.5 Overcrowded schools weredefined as having an enrollment that was morethan 5 percent above the capacity of the school'spermanent instructional buildings and space (i.e.,overenrolled). Schools with enrollments within 5percent of the capacity of their permanentbuildings and space were considered to be atcapacity, and schools with enrollments more than5 percent below the capacity of their permanentbuildings and space were consideredunderenrolled. The 1999 FRSS survey indicatesthat:
• Overall, about half of public schools wereunderenrolled, about one-quarter were within5 percent of their capacity, and about aquarter were overcrowded, based on thecapacity of their permanent instructionalbuildings and space (table 19).
• Large schools were more likely than otherschools to be seriously overcrowded (morethan 25 percent overenrolled), while smallschools were more likely than other schoolsto be severely underenrolled (table 19).
4 Migration patterns (e.g., families moving out of particular areas)
and decisions families make with regard to their children’sschooling (e.g., private school enrollment) may also lead to adecline in enrollments among some public schools. These declinesmay result in schools that are underenrolled.
5 The proportion indicating the degree to which enrollment exceedsor falls below the capacity of the permanent buildings andinstructional space was calculated using the following formula:
X = [(total student enrollment) – (capacity ofpermanent instructional buildings and space)] /(capacity of permanent instructional buildings andspace).
vii
Schools with a high minority enrollment(more than 50 percent) were more likely thanschools with a low minority enrollment (5percent or less) to be seriously overcrowded.
• Schools that were classified as overcrowdedwere more likely than other schools to reportthat at least one type of onsite building was inless than adequate condition (figure 9).Overcrowded schools were also more likelythan other schools to have at least onebuilding feature in less than adequatecondition, and to have at least one environ-mental factor in unsatisfactory condition.
• About a third (36 percent) of schoolsindicated that they used portable classrooms,and 20 percent reported using temporaryinstructional space (table 22). Among theseschools, most reported using portables andtemporary instructional space to alleviateovercrowding.
Conclusions
Although the majority of America's publicschools are in adequate or better condition, asizable minority are not. About a quarter of theschools reported that at least one type of onsitebuilding was in less than adequate condition, halfreported that at least one building feature was inless than adequate condition, and about 4 out of10 reported at least one unsatisfactoryenvironmental condition. Data about thefunctional age of schools suggest that the oldestschools are most in need of attention, but thatmany of these schools do not have plans forimprovement. About three-quarters of publicschools do not have problems with overcrowding,but close to 10 percent have enrollments that aremore than 25 percent greater than the capacity oftheir permanent buildings. Collectively, thesedata provide a complex portrait of the currentphysical condition and crowding in America'spublic schools. Although the majority of schoolsare in adequate condition, functionally young, andnot overcrowded, a substantial number of schoolsare in poor condition, and some of them sufferfrom age and overcrowding. Past experiencesuggests that correcting these problems will becostly.

viii
ix
Table of Contents
Chapter Page
Executive Summary.......................................................................................................... iii
1 Introduction ...................................................................................................................... 1
What is the Condition of America’s Public Schools? ...................................... 1Financing School Facilities and the Cost to Bring Them Into GoodCondition.......................................................................................................... 2Factors Contributing to School Condition........................................................ 3
Deferred Maintenance and Renovation............................................... 3Overcrowding...................................................................................... 4
The Condition of School Facilities Matters...................................................... 4Study Methodology .......................................................................................... 6Organization of This Report............................................................................. 7
2 Condition of Public Schools ............................................................................................. 9
Presence and Overall Condition of Onsite Buildings....................................... 9Condition of Building Features ........................................................................ 13Costs to Bring Schools Into Good Overall Condition ...................................... 15Sources of Cost Estimates ................................................................................ 18
3 Environmental Conditions ................................................................................................ 21
Satisfaction with Environmental Conditions.................................................... 21Energy Efficiency and the Flexibility of Instructional Space........................... 23Air Conditioning............................................................................................... 23School Closures Due to Facilities Problems .................................................... 27
4 School Plans for Improvement ......................................................................................... 29
Written Facilities Plans .................................................................................... 29Plans for Construction ...................................................................................... 29Plans for Major Repair, Renovation, or Replacement of Building Features .... 31
5 Functional Age of Schools: Condition and Plans for Improvement ................................ 37
Determining the Age of Public Schools ........................................................... 37Functional Age and Condition of Schools........................................................ 39Functional Age and Plans for Repair, Renovation, and Replacement.............. 42
x
Table of Contents (continued)
Chapter Page
6 Overcrowding ................................................................................................................... 45
Extent of Overcrowding ................................................................................... 45Overcrowding and School Condition ............................................................... 48School Practices Used to Ease Overcrowding.................................................. 50
7 Summary and Conclusions ............................................................................................... 55
The Overall Condition of Schools and Building Features................................ 55The Cost of Bringing Schools Into Good Overall Condition ........................... 56Satisfaction with Environmental Conditions in Schools .................................. 56Plans for Construction, and for Major Repair, Renovation, orReplacement of Building Features ................................................................... 57Functional Age of Schools ............................................................................... 57Overcrowding in Schools ................................................................................. 58School Facilities and Characteristics of Schools.............................................. 58Conclusions ...................................................................................................... 60
References .................................................................................................................................. 61
List of Appendices
Appendix
A: Survey Methodology ....................................................................................................... A-1
B: Tables of Standard Errors ................................................................................................. B-1
C: Survey Questionnaire ....................................................................................................... C-1
List of Text Tables
Table
1 Percent of public schools with each type of building, and the percentagedistribution of ratings of the overall condition of the building types: 1999 ................... 10
2 Percent of public schools with each type of building, and the percent rating eachbuilding type in less than adequate condition, by school characteristics: 1999.............. 12
3 Number and percentage distributions of public schools and enrollments accordingto the condition of all onsite building types: 1999.......................................................... 13
4 Percent of public schools rating the condition of building features as less thanadequate, by school characteristics: 1999....................................................................... 14
xi
Table of Contents (continued)
List of Text Tables
Table Page
5 Percent of public schools reporting the need to spend money on repairs,renovations, and modernizations to bring the school into good overall condition,and the cost per student of the repairs, renovations, and modernizations, by schoolcharacteristics: 1999 ....................................................................................................... 17
6 Percent of public schools indicating the sources of cost estimates for all repairs,renovations, and modernizations required to bring the school’s onsite buildings intogood overall condition: 1999........................................................................................... 19
7 Percentage distribution of public schools indicating the type of source used for costestimates and the average cost per school for all repairs, renovations, andmodernizations required to bring the school’s onsite buildings into good overallcondition: 1999 ................................................................................................................ 19
8 Percent of public schools rating the condition of environmental factors asunsatisfactory, by school characteristics: 1999............................................................... 22
9 Percentage distribution of public schools according to the status of air conditioningin various areas of their school buildings: 1999 ............................................................. 24
10 Percentage distribution of public schools according to the status of air conditioningin classrooms, by school characteristics: 1999 ............................................................... 25
11 Percent of public schools with air conditioning in various areas of the school, andthe percentage distribution of those schools according to satisfaction with thecondition of air conditioning in the school areas: 1999.................................................. 26
12 Percent of public schools with a written long-range educational facilities plan forthe school, by school characteristics: 1999..................................................................... 30
13 Percent of public schools with construction projects planned for the school in thenext 2 years, by school characteristics: 1999.................................................................. 31
14 Percent of public schools with plans to make at least one major repair, renovation,or replacement to a building feature in the next 2 years, by schoolcharacteristics: 1999 ....................................................................................................... 32
15 Percentage distribution of public schools according to their plans for major repair,renovation, or replacement of each building feature in the next 2 years: 1999 .............. 34
16 Percentage distribution of public schools according to school plans for majorrepair, renovation, or replacement of each building feature in the next 2 years, bycondition of the building feature: 1999 .......................................................................... 35
xii
Table of Contents (continued)
List of Text Tables
Table Page
17 Age of public schools based upon years since construction of the main instructionalbuilding(s), years since most recent major renovation, and functional age of theschool, by school characteristics: 1999 .......................................................................... 38
18 Percentage distribution of public schools according to the functional age of theschool, by school characteristics: 1999 .......................................................................... 40
19 Percentage distribution of public schools reporting that they are underenrolled, atcapacity, or overcrowded, by school characteristics: 1999 ............................................ 47
20 Percent of public schools in each enrollment to capacity ratio category rating thecondition of building features as less than adequate: 1999 ............................................. 52
21 Percent of public schools in each enrollment to capacity ratio category rating thecondition of environmental factors as unsatisfactory: 1999 ............................................ 52
22 Percent of public schools that report using various space and scheduling practices,and the extent to which the practice is used to alleviate overcrowding: 1999................ 53
List of Figures
Figure
1 Percentage distribution of public schools with at least one building feature in lessthan adequate condition according to the number of building features that are inless than adequate condition: 1999 ................................................................................. 16
2 Percentage distribution of public schools with at least one environmental factor inunsatisfactory condition according to the number of environmental factors that arein unsatisfactory condition: 1999.................................................................................... 24
3 Percentage distribution of public schools with facilities-related closures accordingto the number of instructional days the school was closed due to inadequacies orproblems with facilities during the 1998-99 school year................................................. 27
4 Percentage distribution of public schools according to whether there are plans tomake major repairs, renovations, or replacements of any building feature in thenext 2 years, by condition of onsite buildings: 1999 ....................................................... 34
5 Percentage distribution of public schools according to the functional age of theschool: 1999.................................................................................................................... 39
xiii
Table of Contents (continued)
List of Figures
Figures Page
6 Percent of public schools with at least one type of onsite building in less thanadequate condition, at least one building feature in less than adequate condition, orat least one environmental factor in unsatisfactory condition, by functional agecategory: 1999 ................................................................................................................. 41
7 Percentage distribution of public schools in each category of functional age bywhether there are plans to make major repairs, renovations, or replacements of anybuilding feature in the next 2 years: 1999 ....................................................................... 43
8 Percentage distribution of public schools reporting that they are underenrolled, atcapacity, or overcrowded: 1999...................................................................................... 46
9 Percent of public schools with at least one type of onsite building in less thanadequate condition, at least one building feature in less than adequate condition, orat least one environmental factor in unsatisfactory condition, by enrollment tocapacity ratio category: 1999........................................................................................... 49
10 Mean number of building features in less than adequate condition and meannumber of environmental factors that are unsatisfactory, by enrollment to capacityratio category: 1999 ........................................................................................................ 51
List of Exhibits
Exhibit
1 Scale used to rate the overall condition of onsite buildings and the physicalcondition of various building features: 1999 .................................................................. 10

xiv
1
1. INTRODUCTION
The physical condition of the nation’s publicschools has been an important topic of discussionamong policymakers, educators, and parents inrecent years. Newspaper stories (e.g., Nakamura2000; Seymour 2000) and research studies (e.g.,U.S. GAO 1995a) describing broken plumbing,poor ventilation, and overcrowding have raisedconcerns about the effects of school facilities onteaching and learning. There is also apprehensionthat older schools with outdated electrical wiringwill be left behind newer schools in the effort toconnect schools to the Internet. More impor-tantly, some conditions, like sagging roofs or leadexposure, raise serious concerns about studentand teacher safety.
Over the past decade, a number of lawsuitschallenging school funding for facilities havedrawn attention to the poor conditions that manystudents encounter at school. According to theArizona Supreme Court, for example:
Some districts have schoolhouses that areunsafe, unhealthy, and in violation ofbuilding, fire, and safety codes. Somedistricts use dirt lots for playgrounds.There are schools without libraries, sciencelaboratories, computer rooms, artprograms, gymnasiums, and auditoriums.But in other districts, there are schools withindoor swimming pools, a domed stadium,science laboratories, television studios,well stocked libraries, satellite dishes, andextensive computer systems [RooseveltElementary School No. 66 v. Bishop, 877P. 2d 806 (Ariz. 1994)].
Similar descriptions can be found in a number ofreports released by the United States GeneralAccounting Office (GAO). According to a 1994GAO study (1995a), approximately 14 millionstudents attended schools that were in need ofextensive repairs in 1994. In fact, at that time amajority of the nation’s public schools (60percent) were in need of repair.
The purpose of this report is to provide nationaldata about the condition of public schools in 1999based on a survey conducted by the NationalCenter for Education Statistics (NCES) using itsFast Response Survey System (FRSS). FRSS is asurvey system designed to collect small amountsof issue-oriented data with minimal burden onrespondents and within a relatively shorttimeframe. The results presented in this reportare based on questionnaire data for 903 publicelementary and secondary schools in the UnitedStates. The questionnaire responses wereweighted to produce national estimates thatrepresent all regular public schools in the UnitedStates.
This report provides information about thecondition of school facilities and the costs tobring them into good condition; school plans forrepairs, renovations, and replacements; the age ofpublic schools; and overcrowding and practicesused to address overcrowding. Information aboutthe condition of school facilities is based onquestionnaire rating scales rather than on physicalobservation of school conditions by outsideobservers. The remainder of this chapter providesbackground information about the condition ofschool facilities.
What is the Condition of America’sPublic Schools?
Observations of school facilities have appeared inheadlines, speeches, and reports that focus on thedeteriorating environmental and physicalconditions of the nation’s schools. The EducationWriters Association (Lewis et al. 1989), forexample, reported a decade ago that the physicalcondition of one out of every four schoolbuildings in America was inadequate. Of these,over 60 percent were labeled inadequate due tolack of repair and maintenance. In 1995, GAOreleased a report on school facilities indicatingthat things had not improved and appeared to
2
have grown worse (U.S. GAO 1995a). Accordingto GAO, one-third of both elementary andsecondary schools reported having one entirebuilding in need of extensive repairs orreplacement. Approximately 60 percent ofschools reported that at least one building featureneeded extensive repair, overhaul, or replace-ment.
The features most in need of repair, according toGAO (1995a), included heating, ventilation, airconditioning, plumbing, roofs, exterior walls,electrical power, windows, and doors. Because ofthis state of disrepair, 41 percent of schoolsreported poor energy efficiency. In addition, 50percent of schools reported having at least oneunsatisfactory environmental condition, includingconditions that violate federal mandates (e.g.,exposure to lead and radon gas). In addition, thedecay and neglect described by GAO decreasedthe ability of many older school buildings to meetthe proposed technology goals. In some schools,old, outdated wiring makes the use of technologyfor both educational and administrative purposesimpossible (Hansen 1992).
Despite considerable focus on the unsuitableconditions of many of America’s schools, Kozol(1991) and others (e.g., Corcoran, Walker, andWhite 1988; Lewis et al. 1989) highlight animportant point: the condition of the nation’sschools varies widely. Some schools are in poorcondition as previously described, and someschools are in exceptional condition. Mostschools, however, fall somewhere in the middle;they are in “adequate” or “better” overallcondition (U.S. GAO 1995a). School conditions,whether poor, average, or exceptional, often varyby location (e.g., urban versus suburban) andcharacteristics of the community (e.g., impov-erished versus wealthy). For example, GAO(1996) reported that in 1994, the largestproportion of schools reporting deficient schoolconditions was in central cities serving more than50 percent minority students or 70 percent ormore poor students. However, GAO (1996) alsofound that poor conditions exist in many ruralareas; one out of every two rural schools had atleast one inadequate structural or mechanicalfeature.
Financing School Facilities and theCost to Bring Them Into GoodCondition
Financing public education in the United Statesrelies on the combined effort of state and localappropriations, as well as funds available fromthe federal government (Howell and Miller 1997).Because school facilities are funded primarily bylocal revenues, characteristics of the community,particularly the property tax base, are importantfactors contributing to the condition of schools(Lewis et al. 1989; U.S. Department of Education1995). Because community factors tend to vary,they lead to disparity in the funding available forschools from community to community(Augenblick, Myers, and Anderson 1997; U.S.GAO 1995c; U.S. Department of Education 1995;Terman and Behrman 1997).
Disparities in funding for schools in general, andschool facilities in particular, are exacerbated bythe cost for providing facilities that are in goodcondition. There are a number of studies onschool construction costs. Some of them focus onfunds spent on school facilities; others reportestimates of funds needed for school facilities.While each one offers a unique perspective,differences between funds spent and fundsneeded, and differences in the elements eachstudy includes under school construction, make itimpossible to draw direct comparisons across thestudies.
The 1994 GAO study estimated that $101 billionwas needed for repairs, renovations, andmodernizations to bring schools’ onsite buildingsinto good overall condition (U.S. GAO 1995a).The study also estimated that $11 billion dollarswould be needed in the next 3 years to complywith various federal mandates that impact schoolconstruction, such as asbestos removal andaccessibility for students with disabilities.6
6 The $101 billion and the $11 billion were collected in two separate
questions on the survey. However, GAO frequently presents anestimate of $112 billion needed, which they derive by summingthe amounts reported in these two questions. It is possible that the$112 billion includes some duplication of money needed, since the$11 billion needed to comply with federal mandates may or may
3
A more recent GAO study of actual schoolconstruction expenditures included expendituresfor acquired and constructed buildings, land, andequipment such as heating and air conditioningsystems (U.S. GAO 2000). This study found thatannual construction expenditures for publicschools in the United States grew by 39 percentfrom fiscal years 1990 through 1997, from about$17.8 billion to about $24.7 billion after adjustingfor inflation.
In another study on school construction costs,Abramson (1999) reported that public schoolscompleted construction projects totaling $15billion in 1998, with a projected expenditure of$17.2 billion for 1999. Of the projected spendingin 1999, approximately 50 percent was to be usedfor new construction, 24 percent for additions,and 26 percent for renovations. With advances intechnology, new construction is becomingincreasingly expensive. Abramson (1999)provided data concerning the facilities that wereplanned for new schools constructed in 1999.While these new schools all will have the corefeatures of cafeterias and libraries (among otherfeatures), most will have a computer lab (60percent of elementary, 91 percent of middle, and85 percent of high schools) and local areanetworks (LANs) (80 percent of elementary, 95percent of middle, and 90 percent of highschools), and many secondary schools will havetechnology labs (33 percent of middle schoolsand 44 percent of high schools).
A recently published National EducationAssociation (NEA) report looked at funds neededfor school infrastructure and educationtechnology (NEA 2000). In this report, schoolinfrastructure included new school construction,additions to existing buildings, renovation,retrofitting, deferred maintenance, and majorimprovements to grounds. In addition, educationtechnology included computers and peripherals,software, connectivity, networks, technologyinfrastructure, distance education, maintenanceand repair of technology equipment, andtechnology-related professional development andongoing support for teachers. Taking all of this
not have been included by respondents in the $101 billion neededto put schools into good overall condition.
into account, the NEA provided a cost estimate of$322 billion needed for school modernization.7
Factors Contributing to SchoolCondition
The funding of public school facilities may beimportant insofar as it affects the way schoolsaddress two important factors contributing to thedecline of school facilities: (1) deferred main-tenance and renovation, and (2) overcrowding(e.g., U.S. GAO 1995a; Hansen 1992; U.S.Department of Education 1999a).
Deferred Maintenance and Renovation
A number of reports have raised concerns aboutthe age of America’s public schools (e.g., U.S.Department of Education 1999b). Olderbuildings may fall into disrepair or lack theinfrastructure necessary for adequate electricaland telecommunications wiring (U.S. GAO1995b). However, age of the building, by itself,is somewhat less important than is its history ofmaintenance and renovation, as well as theadequacy of the original construction. Regularmaintenance is critical to keeping schools in goodcondition.
The growing demand for new schoolconstruction, as well as choices that schooldistricts must make about where to spend limitedfunds (e.g., facilities versus instructionalprograms), has forced many school districts tooverlook the maintenance and modernization ofold schools. For example, GAO (1995a) foundthat district officials attributed decliningconditions primarily to insufficient funds,resulting from decisions to defer maintenance andrepair expenditures from year to year. However,maintenance can only be deferred for a shortperiod of time before school facilities begin todeteriorate in noticeable ways. Without regular
7 While NEA describes the study as a 50-state report of school
modernization needs, the study received usable responses aboutinfrastructure from only 24 states, and about education technologyfrom only 2 states. The remaining data were derived by variousestimation techniques described in the report.
4
maintenance, equipment begins to break down,indoor air problems multiply, and buildings fallinto greater disrepair (Hansen 1992). The lack ofregular maintenance can also result in a host ofhealth and safety problems, including exposure tocarbon monoxide and risk of physical injuries.Additionally, deferred maintenance increases thecost of maintaining school facilities; it speeds upthe deterioration of buildings and the need toreplace equipment (Hansen 1992).
Overcrowding
Like deferred maintenance and renovation,overcrowding is an important topic to considerwhen examining the condition of school facilities.Overcrowding occurs when the number ofstudents enrolled in the school is larger than thenumber of students the school was designed toaccommodate. It both characterizes the conditionof school facilities (e.g., the facilities are toosmall to accommodate the students and teacherswho reside there) and contributes to the decline ofthese facilities (e.g., overcrowded facilities aretypically overused facilities that grow old beforetheir time). A number of recent reports indicatethat overcrowding is a serious problem in manyschool districts (Burnett 1995; Corcoran, Walker,and White 1988; Lewis et al. 1989; Fernandezand Timpane 1995; U.S. GAO 1995a; EdSource1998; Rivera-Batiz and Marti 1995; Lowe 1996;U.S. Department of Education 1998; U.S.Department of Education 1999a). Dramaticincreases in enrollment due to the “baby-boomecho,” immigration, and migration have led manyschools to enroll far more students than they weredesigned to accommodate.8 Compounding theseconditions are initiatives to reduce class size,resulting in the need for even more classrooms.
To deal with overcrowding, school districts andschools have adopted a number of short-termsolutions. For example, many have convertednoninstructional space into classrooms. In such
8 Migration patterns (e.g., families moving out of particular areas)
and decisions families make with regard to their children’sschooling (e.g., private school enrollment) may also lead to adecline in enrollments among some public schools. These declinesmay result in schools that are underenrolled.
schools, students are placed in spaces neverintended as classrooms, such as gymnasiums,libraries, cafeterias, and even closets (Burnett1995). Another popular solution is portableclassrooms. These temporary structures arebecoming a more permanent feature of schools;some have been in use for as long as 40 years(Lewis et al. 1989). Portables are a prominentadaptation school districts are using to meet spaceneeds; however, recent accounts suggest that theymay not be a particularly suitable alternative(U.S. GAO 1995a). Findings from a recent U.S.Department of Education report (1999a) suggestthat overcrowding will likely become moreserious in the future and that short-term solutions,such as portable classrooms, may not be sufficientto accommodate the long-term enrollment boomthat is expected over the next two decades.
The Condition of School FacilitiesMatters
There are many ways in which the condition ofschool facilities may be directly or indirectlyrelevant to students and their families. The issuesof greatest concern surrounding the topic—asreflected in the popular press, the researchliterature, and courtrooms nationwide—includeequal access to adequate school facilities andstudent safety, as well as more academic matters,such as student achievement.
As described earlier in this chapter, many stateshave been sued over the degree of disparity intheir school facilities funding systems. Forexample, variations in the quality of Ohio’spublic school facilities have been cited as keyevidence for the violation of the uniformeducation articles provided by the state’s ownconstitution (e.g., The State of Ohio v. DeRolph,677 N.E. 2d 733 [Ohio 1997]). The courts'interpretations of uniform education as it relatesto facilities have gone beyond the right to haveaccess to adequate facilities and materials; severalcourts have asserted that widely disparate schoolfunding systems—in particular, funding forfacilities—prevent students from attaining equaleducational opportunities, achievement, and jobopportunities (e.g., The State of Ohio v. DeRolph,
5
677 N.E. 2d 733 [Ohio 1997]; RooseveltElementary School No. 66 v. Bishop, 877 P. 2d806 [Ariz. 1994]).
Lack of adequate school facilities may also resultin conditions that compromise student safety.Students who attend schools in poor conditionmay be exposed to such health threats as poor airquality, hazardous materials, and sewageoverflows. In more extreme cases, students mayalso be put in more immediate physical dangerwhen parts of the building collapse or whensafety features (e.g., fire alarms, sprinklersystems) fail. In fact, witnesses in the Ohio v.DeRolph case testified that arsenic was found inthe drinking water of an elementary school andthat chunks of plaster routinely fell from theceilings of several schools. Similarly, GAO(1995a) documented numerous individualaccounts of threats to student safety: the ceilingof an Alabama elementary school collapsed lessthan an hour after students had left for the day;the glass from 70-year-old windows blew into aWashington, D.C., elementary classroom during awindstorm; and many students who suffer fromasthma were frequently put at risk by poorventilation and unhealthy air quality. Tocompound the problem, in 1994, over 14,000schools across the country had less than adequatelife safety features, such as sprinkler systems(U.S. GAO 1995a). Therefore, dangerous condi-tions that may normally be prevented orcontrolled (e.g., fires, carbon monoxide levels)were not adequately monitored.
Many studies have explored the relationshipbetween school conditions and achievement-related behavior (Burnett 1995; McGuffey 1982;Rivera-Batiz and Marti 1995; Weinstein 1979).For example, Earthman and Lemasters (1996)reviewed several recent studies of the influence ofschool conditions on academic achievement. Allof the studies found the same relationship, tovarying degrees, between school facilities andstudent achievement. That is, higher rankings ofstructural and mechanical (e.g., heating andcooling systems) or cosmetic conditions (e.g.,how recently the walls have been painted) werecorrelated with higher achievement scores. Thisrelationship was generally found to be strongerfor cosmetic than structural school conditions.
However, Earthman and Lemasters cautionreaders about the findings; they concluded thatdespite a large number of research studies, “it isdifficult to determine any definite line ofconsistent findings” (p. 3). These conclusionshave been supported by other researchers. Forexample, Ferguson (1991), in a study of schoolexpenditures, stated that “some [of these]expenditures—particularly transportation andmaintenance—have logical relationships tolearning that are at best indirect” (p. 484). Heconcluded that “few would argue that spendingmore on transportation and maintenance shouldincrease test scores, though most would agree thatsuch spending matters” (p. 484).
Much of the research on the effects of schoolfacilities on student achievement shares a numberof general limitations. For example, many of thestudies Earthman and Lemasters (1996) reviewedprovided no evidence of statistical testing (e.g.,Cash 1993; Earthman, Cash, and Van Berkum1995). Another study (Berner 1993) suffers fromdifferent methodological concerns, including asample size too small to support the analysis theauthor runs (e.g., a regression model with 41cases and 9 independent variables) and controlvariables that are 9 years older than the variablesmeasuring school condition and student achieve-ment. More importantly, however, many of theseresearch studies did not take into account anumber of meaningful differences betweenschools in poor and good conditions that mayexplain the findings they report. For example,schools in poor condition may be less likely tohave resources important for academicachievement, such as high-quality teachers,effective leadership, high levels of parentalinvolvement, and more appropriate materials(e.g., laboratory equipment, textbooks). Theseresources, rather than the condition of thephysical plant, may explain achievement differ-ences between students in schools of variousconditions.
Researchers may have had difficulty establishinga relationship between facilities and achievementbecause if school conditions do have an impact onstudent learning, their effects are likely to beindirect. Specifically, student learning isgenerally believed to be affected by factors such
6
as lost instructional time, reduced attention, anddiminished curricular options that may resultfrom facilities-related problems (e.g., schoolclosings, classroom shortages, overcrowding;Duke et al. 1998; Rivera-Batiz and Marti 1995).It is difficult to detect indirect effects in theabsence of detailed surveys of students andteachers and suitable measures to control forother differences between schools in poorcondition and schools in good condition.However, researchers who have studied schoolfacilities and the teaching and learning processhave found some interesting relationships. Forexample, a survey of overcrowded schools inNew York City found that 75 percent of teachersindicated that overcrowding affects classroomactivities, and 70 percent of teachers indicatedthat overcrowding affected their instructionaltechniques (Rivera-Batiz and Marti 1995).Corcoran, Walker, and White (1988) found thatovercrowding, as well as heavy teacherworkloads, created stressful working conditionsfor teachers and led to higher teacherabsenteeism. The survey of New York Cityschools mentioned earlier found that nearly 40percent of students indicated that they hadproblems concentrating in their classes when theywere learning something new (Rivera-Batiz andMarti 1995).
Study Methodology
The survey on the Condition of Public SchoolFacilities was conducted through NCES’ FRSSduring summer and early fall 1999. The resultspresented in this report are based on questionnairedata for 903 public elementary and secondaryschools in the United States. Information aboutthe condition of school facilities is based onquestionnaire rating scales rather than on physicalobservation of school conditions by outsideobservers. While individual schools weresampled, the questionnaires were mailed to thedistricts with which the schools were associated.The cover letter indicated that the survey wasdesigned to be completed by district-levelpersonnel who were very familiar with the schoolfacilities in the district. The letter indicated thatthe respondent might want to consult with other
district-level personnel or with school-levelpersonnel, such as the principal of the selectedschool, in answering some of the questions. Therespondent section on the front of thequestionnaire indicated that while mostquestionnaires were completed by district-levelrespondents, some were completed by school-level respondents (usually the school principal).To maintain the focus on schools, which are thesampled unit, the report refers to schoolsindicating or reporting various findings, eventhough respondents were primarily district-levelpersonnel reporting about the sampled school.
Many of the questionnaire items on the FRSSsurvey are taken from the 1994 GAO survey. Thesame questionnaire items and analysis variableswere used with the intention of providinginformation about change in the condition ofpublic school facilities between 1994, when GAOconducted its survey, and 1999, when NCESconducted its survey. However, the GAOinformation included in this report is provided ascontextual information only. Statisticalcomparisons are not provided because GAO doesnot provide standard errors for the data in theirreports, and exact point estimates are also missingfor some comparative statements from the GAOreports.
Like the 1994 GAO study, this FRSS study alsoasked for an estimate of the total costs of allrepairs, renovations, and modernizations requiredto bring the onsite buildings into good overallcondition. However, for the FRSS study, schoolsfor which the condition of any type of onsiteschool building or any building feature (e.g.,roofs, plumbing) was less than good providedinformation about the cost of needed repairs,renovations, and modernizations. Thus, eventhough the wording of the cost item on the 1994GAO and 1999 FRSS studies was the same, thetwo studies include costs for different things.9
The school characteristics used as analysisvariables in this report are school instructionallevel, school enrollment size, locale (central city,
9 See appendix A for additional information about the 1994 GAO
cost estimate, and further discussion of comparability issues for thecost estimates between the 1994 GAO and 1999 FRSS studies.
7
urban fringe/large town, rural/small town),region, percent minority enrollment, and percentof students in the school eligible for free orreduced-price school lunch (which indicates theconcentration of poverty in the school). Thesevariables are defined in appendix A.
The questionnaire responses were weighted toproduce national estimates that represent allregular public schools in the United States. Allcomparative statements in this report have beentested for statistical significance using chi-squaretests or t-tests adjusted for multiple comparisonsusing the Bonferroni adjustment and aresignificant at the 0.05 level. Throughout thisreport, differences that may appear large(particularly those by school characteristics) maynot be statistically significant. This is due in partto the relatively large standard errors surroundingthe estimates (because of the small sample size),and the use of the Bonferroni adjustment tocontrol for multiple comparisons. Appendix Aprovides a detailed discussion of the sample andsurvey methodology.
Organization of This Report
The chapters that follow present informationabout the condition of America’s public schoolsin 1999. Specifically, chapter 2 presentsinformation about the presence and overallcondition of various types of onsite buildings, andthe condition of nine different building features(e.g., roofs, plumbing). Information is alsoprovided about the cost to put school buildingsinto good overall condition, and the sources ofestimates for those costs. Chapter 3 reports aboutsatisfaction with various environmental factors(e.g., heating, ventilation) in the schools’ onsitebuildings, and provides information about thestatus and satisfaction with air conditioning invarious areas of the schools. Chapter 4 discussesschool plans for new construction and for majorrepair, renovation, or replacement of buildingfeatures in the next 2 years. Chapter 5 examinesthe issue of the age of America’s public schools,including determining the age of schools, andhow age relates to the condition of schools andplans for repair, renovation, and replacement.
Chapter 6 presents data regarding the extent ofovercrowding in public schools, the relationshipbetween overcrowding and school condition, andvarious practices that schools may use to easeovercrowding. The concluding chapter summa-rizes the findings of this study and draws someoverall conclusions about the findings. Technicalinformation, including a detailed studymethodology (appendix A) and tables of standarderrors for all data presented in this report(appendix B), are included as technicalappendices to the report. The questionnaire isincluded in appendix C.

8
9
2. CONDITION OF PUBLIC SCHOOLS
The condition of public schools has received a lotof attention from various stakeholders in theeducational process, including parents, educators,and policymakers at various levels. This chapterpresents information about the condition ofAmerica’s schools in 1999, including thepresence and overall condition of various types ofonsite buildings, and the condition of ninedifferent building features (e.g., roofs, plumbing).Information is also provided about the cost to putschool buildings into good overall condition, andthe sources of estimates for those costs.
Presence and Overall Condition ofOnsite Buildings
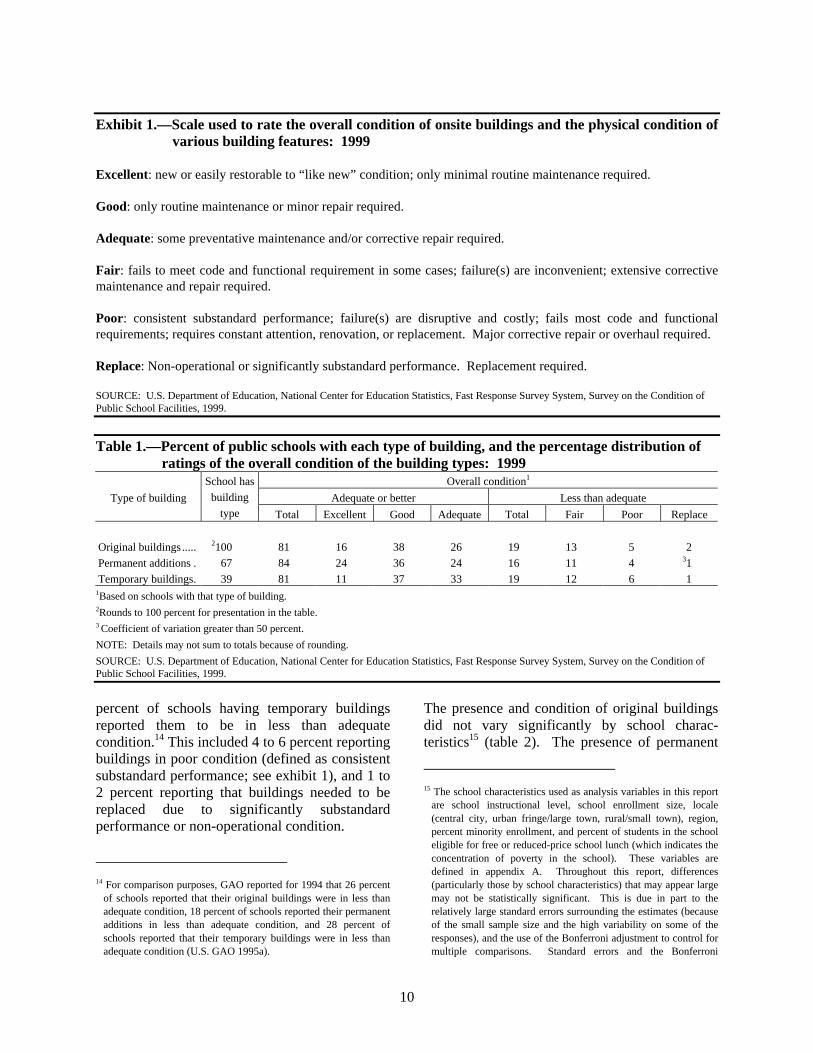
This study collected information about the overallcondition of the original buildings, the attachedand/or detached permanent additions, and thetemporary buildings10 on site at the school.Overall condition includes both physicalcondition and the ability of the building to meetthe functional requirements of instructionalprograms. The rating scale used (see exhibit 1)indicated the amount of maintenance and repairrequired for that type of building at the school,and included the following categories: excellent,good, adequate, fair, poor, and replace. 11
10 Examples of onsite temporary buildings include portables,
demountables (which are prefabricated buildings assembled on sitethat are not intended to have a long useful life), trailers, andQuonset huts. Temporary buildings are not necessarily poor-quality space. The quality of temporary buildings depends onmany of the same factors as the quality of original buildings andpermanent additions, including the age of the building, the type ofbuilding it is, ongoing maintenance of the building, and theinfrastructure to support it (e.g., adequate heating, ventilation, andair conditioning). In some cases, new temporary buildings may bepreferred by students and teachers over older permanent space (forexample, see Mathews 2000).
11 This questionnaire item was drawn from the 1994 GAO study.
Virtually all of the approximately 78,300 regularpublic schools had original buildings,12 and two-thirds of the schools had attached and/or detachedpermanent additions (table 1). Temporarybuildings were less prevalent, with 39 percent ofthe schools indicating that they had temporarybuildings. The overall condition of the varioustypes of buildings generally was perceived to bepositive, with 81 percent of schools reportingtheir original buildings to be in adequate or bettercondition, 84 percent of those having permanentadditions reporting them to be in adequate orbetter condition, and 81 percent of those havingtemporary buildings reporting them to be inadequate or better condition.13 Permanentadditions were somewhat more likely thanoriginal or temporary buildings to be in excellentcondition, and temporary buildings weresomewhat more likely than original buildings andpermanent additions to be in adequate condition.
Although a majority of schools reported theiroriginal buildings, permanent additions, andtemporary buildings to be in adequate or bettercondition, about a fifth of schools having aparticular type of building reported them to be inless than adequate condition (table 1). That is, 19percent of schools reported their originalbuildings to be in less than adequate condition, 16percent of those having permanent additionsreported them as less than adequate, and 19
12 While this question was designed by GAO with the assumption
that all schools would have original buildings, it was discoveredduring data collection on the FRSS survey that a few schools haveremoved old original buildings and left in place detachedpermanent additions that were added over the years. In addition, afew schools are composed entirely of temporary buildings. Thedata entry system on the FRSS survey was modified to allowschools to indicate that they do not have original buildings.
13 Ratings of adequate or better encompass the ratings of excellent,good, and adequate. Ratings of less than adequate encompass theratings of fair, poor, and replace. See exhibit 1 for the definitionsassociated with the rating scale.
10
Exhibit 1.—Scale used to rate the overall condition of onsite buildings and the physical condition ofvarious building features: 1999
Excellent: new or easily restorable to “like new” condition; only minimal routine maintenance required.
Good: only routine maintenance or minor repair required.
Adequate: some preventative maintenance and/or corrective repair required.
Fair: fails to meet code and functional requirement in some cases; failure(s) are inconvenient; extensive correctivemaintenance and repair required.
Poor: consistent substandard performance; failure(s) are disruptive and costly; fails most code and functionalrequirements; requires constant attention, renovation, or replacement. Major corrective repair or overhaul required.
Replace: Non-operational or significantly substandard performance. Replacement required.
SOURCE: U.S. Department of Education, National Center for Education Statistics, Fast Response Survey System, Survey on the Condition ofPublic School Facilities, 1999.
Table 1.—Percent of public schools with each type of building, and the percentage distribution ofratings of the overall condition of the building types: 1999
Overall condition1
Adequate or better Less than adequateType of building
School has
building
type Total Excellent Good Adequate Total Fair Poor Replace
Original buildings..... 2100 81 16 38 26 19 13 5 2
Permanent additions . 67 84 24 36 24 16 11 4 31
Temporary buildings. 39 81 11 37 33 19 12 6 11Based on schools with that type of building.2Rounds to 100 percent for presentation in the table.3 Coefficient of variation greater than 50 percent.
NOTE: Details may not sum to totals because of rounding.
SOURCE: U.S. Department of Education, National Center for Education Statistics, Fast Response Survey System, Survey on the Condition ofPublic School Facilities, 1999.
percent of schools having temporary buildingsreported them to be in less than adequatecondition.14 This included 4 to 6 percent reportingbuildings in poor condition (defined as consistentsubstandard performance; see exhibit 1), and 1 to2 percent reporting that buildings needed to bereplaced due to significantly substandardperformance or non-operational condition.
14 For comparison purposes, GAO reported for 1994 that 26 percent
of schools reported that their original buildings were in less thanadequate condition, 18 percent of schools reported their permanentadditions in less than adequate condition, and 28 percent ofschools reported that their temporary buildings were in less thanadequate condition (U.S. GAO 1995a).
The presence and condition of original buildingsdid not vary significantly by school charac-teristics15 (table 2). The presence of permanent
15 The school characteristics used as analysis variables in this report
are school instructional level, school enrollment size, locale(central city, urban fringe/large town, rural/small town), region,percent minority enrollment, and percent of students in the schooleligible for free or reduced-price school lunch (which indicates theconcentration of poverty in the school). These variables aredefined in appendix A. Throughout this report, differences(particularly those by school characteristics) that may appear largemay not be statistically significant. This is due in part to therelatively large standard errors surrounding the estimates (becauseof the small sample size and the high variability on some of theresponses), and the use of the Bonferroni adjustment to control formultiple comparisons. Standard errors and the Bonferroni
11
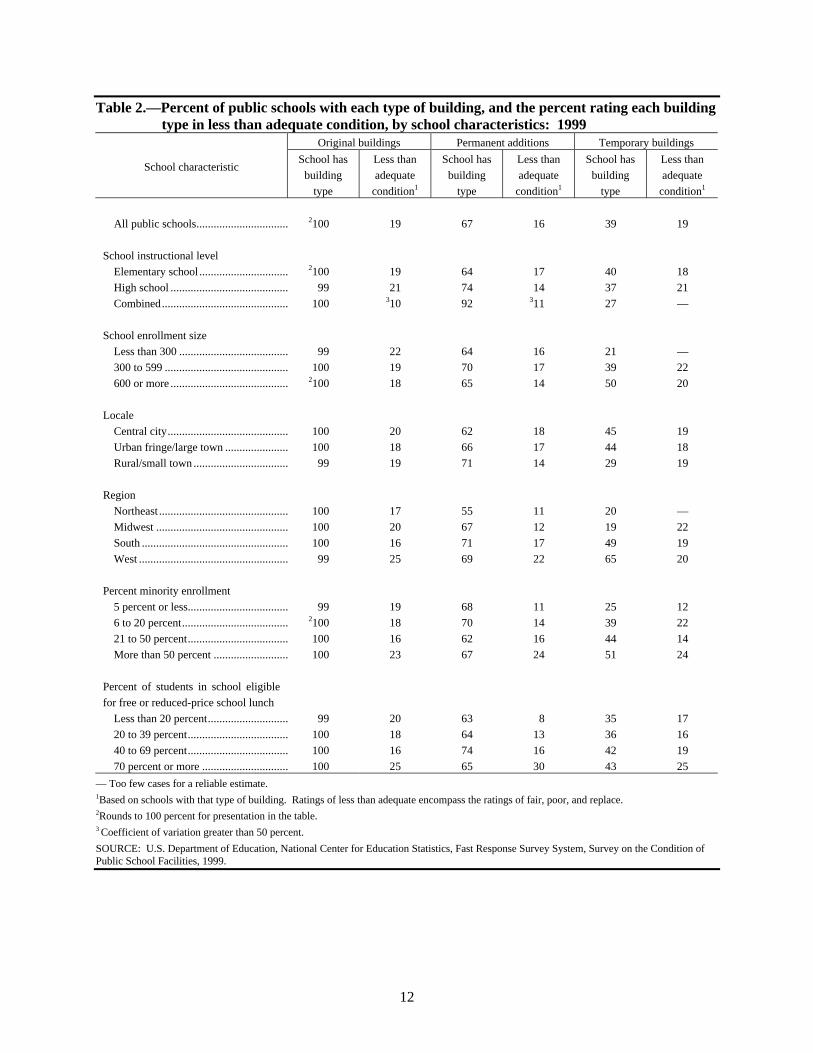
additions varied slightly by region, with schoolsin the Northeast less likely to have permanentadditions than schools in the South or the West(55 percent compared with 71 percent and 69percent, respectively). Among schools havingpermanent additions, schools with the highestconcentration of poverty (defined here as 70percent or more of the students eligible for free orreduced-price school lunch) were more likely toreport that their permanent additions were in lessthan adequate condition than were schools with20 to 39 percent or schools with less than 20percent of their students eligible for free orreduced-price school lunch (30 percent versus 13percent and 8 percent, respectively).
The presence of temporary buildings showedsomewhat more variation by school charac-teristics (table 2). Schools in central cities and inurban fringe areas and large towns were morelikely to have temporary buildings than wereschools in rural areas and small towns (45 percentand 44 percent, respectively, compared with 29percent). About a fifth of schools in theNortheast and Midwest had temporary buildings,compared with 49 percent in the South and 65percent in the West. Schools with the lowestminority enrollment were less likely to havetemporary buildings than were schools withhigher minority enrollment (25 percent comparedwith 39 to 51 percent). The condition oftemporary buildings did not vary significantly byschool characteristics.16
adjustment are discussed in the section on variances in appendixA. In addition, GAO reports more differences by schoolcharacteristics than are found in this study. This is discussed inappendix A in the section on comparisons to the GAO study.
16 It is important to keep in mind the wide range in the prevalence oftemporary buildings when examining the ratings of their overallcondition. For example, the condition ratings for temporarybuildings in schools with the lowest minority enrollment are basedon the 25 percent of low minority enrollment schools that havesuch buildings, compared with the ratings for schools with thehighest minority enrollment, which are based on the 51 percent ofhigh minority enrollment schools that have such buildings. Thesedifferences in prevalence influence the likelihood that ratings oftheir condition will be significantly different.
Differences in the presence of temporarybuildings may be related to differences in publicschool enrollment growth. According to a 1999report by the U.S. Department of Education(1999a), the West and the South led the nation inschool enrollment growth, and cities and suburbsboth experienced substantial school enrollmentgrowth in the last 10 years. Enrollment growth inthe West was particularly notable, increasing 26percent from 1989 to 1999. During this timeperiod, public school enrollment grew by 16percent in the South, 14 percent in the Northeast,and 10 percent in the Midwest.
Looking across all the types of onsite buildings,76 percent of the schools overall reported that allthe types of onsite buildings at their school werein adequate or better condition (table 3). This didnot vary significantly by school characteristics(not shown in tables). Approximately 34 millionstudents attended the estimated 59,500 schoolsthat reported all building types in adequate orbetter condition (table 3). The remaining 24percent of schools reported that at least one oftheir types of onsite buildings was in less thanadequate condition. These 18,700 schoolsenrolled approximately 11 million students.Approximately 3.5 million of these studentsattended schools where at least one type ofbuilding was in poor condition (defined asconsistent substandard performance) or needed tobe replaced because it was non-operational orshowed significantly substandard performance(not shown in tables).17
17 GAO reported for 1994 that for all types of buildings, two-thirds
of the nation’s schools were in adequate or better condition,needing at most only some preventive maintenance or correctiverepair (U.S. GAO 1995a). They estimated that approximately 14million students attended the estimated 25,000 schools in which atleast one type of building was in less than adequate condition,needing extensive repair or replacement.
12
Table 2.—Percent of public schools with each type of building, and the percent rating each buildingtype in less than adequate condition, by school characteristics: 1999
Original buildings Permanent additions Temporary buildings
School characteristicSchool has
building
type
Less than
adequate
condition1
School has
building
type
Less than
adequate
condition1
School has
building
type
Less than
adequate
condition1
All public schools................................ 2100 19 67 16 39 19
School instructional level
Elementary school ............................... 2100 19 64 17 40 18
High school ......................................... 99 21 74 14 37 21
Combined............................................ 100 310 92 311 27 —
School enrollment size
Less than 300 ...................................... 99 22 64 16 21 —
300 to 599 ........................................... 100 19 70 17 39 22
600 or more ......................................... 2100 18 65 14 50 20
Locale
Central city.......................................... 100 20 62 18 45 19
Urban fringe/large town ...................... 100 18 66 17 44 18
Rural/small town ................................. 99 19 71 14 29 19
Region
Northeast ............................................. 100 17 55 11 20 —
Midwest .............................................. 100 20 67 12 19 22
South ................................................... 100 16 71 17 49 19
West .................................................... 99 25 69 22 65 20
Percent minority enrollment
5 percent or less................................... 99 19 68 11 25 12
6 to 20 percent..................................... 2100 18 70 14 39 22
21 to 50 percent................................... 100 16 62 16 44 14
More than 50 percent .......................... 100 23 67 24 51 24
Percent of students in school eligible
for free or reduced-price school lunch
Less than 20 percent............................ 99 20 63 8 35 17
20 to 39 percent................................... 100 18 64 13 36 16
40 to 69 percent................................... 100 16 74 16 42 19
70 percent or more .............................. 100 25 65 30 43 25
— Too few cases for a reliable estimate.1Based on schools with that type of building. Ratings of less than adequate encompass the ratings of fair, poor, and replace.2Rounds to 100 percent for presentation in the table.3 Coefficient of variation greater than 50 percent.
SOURCE: U.S. Department of Education, National Center for Education Statistics, Fast Response Survey System, Survey on the Condition ofPublic School Facilities, 1999.
13
Table 3.—Number and percentage distributions of public schools and enrollments according to thecondition of all onsite building types: 1999
Schools Students
Condition of all onsite building types Percentage
distributionNumber
Percentage
distributionNumber
All public schools............................................. 100 78,300 100 45,000,000
Schools with all building types in adequate or
better condition1............................................... 76 59,500 76 34,000,000
Schools with at least one type of building in less
than adequate condition2.................................. 24 18,700 24 11,000,0001Ratings of adequate or better encompass the ratings of excellent, good, and adequate.2Ratings of less than adequate encompass the ratings of fair, poor, and replace.
NOTE: Percentages are computed within each column, and are computed on unrounded numbers. The numbers of schools have been rounded tothe nearest hundred, and the numbers of students have been rounded to the nearest million. Details may not sum to totals because of rounding.The condition of all onsite building types is computed across original buildings, permanent additions, and temporary buildings.
SOURCE: U.S. Department of Education, National Center for Education Statistics, Fast Response Survey System, Survey on the Condition ofPublic School Facilities, 1999.
Condition of Building Features
The questionnaire asked for ratings of thecondition of nine different building features (e.g.,roofs, plumbing) for the school’s onsite buildings,using the same scale used to rate building types(see exhibit 1).18 While the majority of publicschools reported that the individual buildingfeatures at their schools were in adequate or bettercondition, a sizable minority (ranging from 14percent to 29 percent) indicated that variousindividual building features were in less thanadequate condition19 (table 4). About one inseven schools reported that their framing, floors,and foundations were in less than adequatecondition, and about one in six schools reportedinterior finishes and trim, and electrical lightingto be in less than adequate condition.Approximately a fifth of schools indicated lessthan adequate conditions for life safety features,
18 This questionnaire item is drawn from the 1994 GAO study. The
previous section of this report discussed types of onsite buildings(original buildings, attached and/or detached permanent additions,and temporary buildings). This section of the report discusses ninedifferent building features (e.g., roofs, plumbing) of those onsitebuildings. While the overall condition of building types may beadequate or better, the condition of individual building featuresmay be less than adequate.
19 As in the previous section, the ratings of excellent, good, andadequate have been combined into a rating of adequate or better,and ratings of fair, poor, and replace have been combined into arating of less than adequate.
roofs, and electric power, and about a quarter ofschools reported less than adequate conditions forplumbing, and for exterior walls, finishes,windows, and doors. Heating, ventilation, and airconditioning systems were reported to be in lessthan adequate condition at 29 percent of schools.
The condition of various building featuresshowed some variation by school characteristics20
(table 4). Schools with the highest concentrationof poverty (as defined by the percentage ofstudents eligible for free or reduced-price schoollunch) were more likely than schools with thelowest concentration of poverty to report thattheir roofs were in less than adequate condition(32 percent versus 18 percent). Schools withmore than 50 percent minority enrollment weremore likely than schools with lower minorityenrollment to indicate that their electric powerwas in less than adequate condition (32 percentcompared with 18 percent and 19 percent), andwere more likely than schools with 21 to 50percent minority enrollment to report that theirexterior walls, finishes, windows, and doors werein less than adequate condition (29 percentcompared with 17 percent). Schools in the West
20 As noted previously, differences that may appear large may not be
statistically significant, due in part to the relatively large standarderrors surrounding the estimates (because of the small sample size)and the use of the Bonferroni adjustment. These are discussedfurther in appendix A.
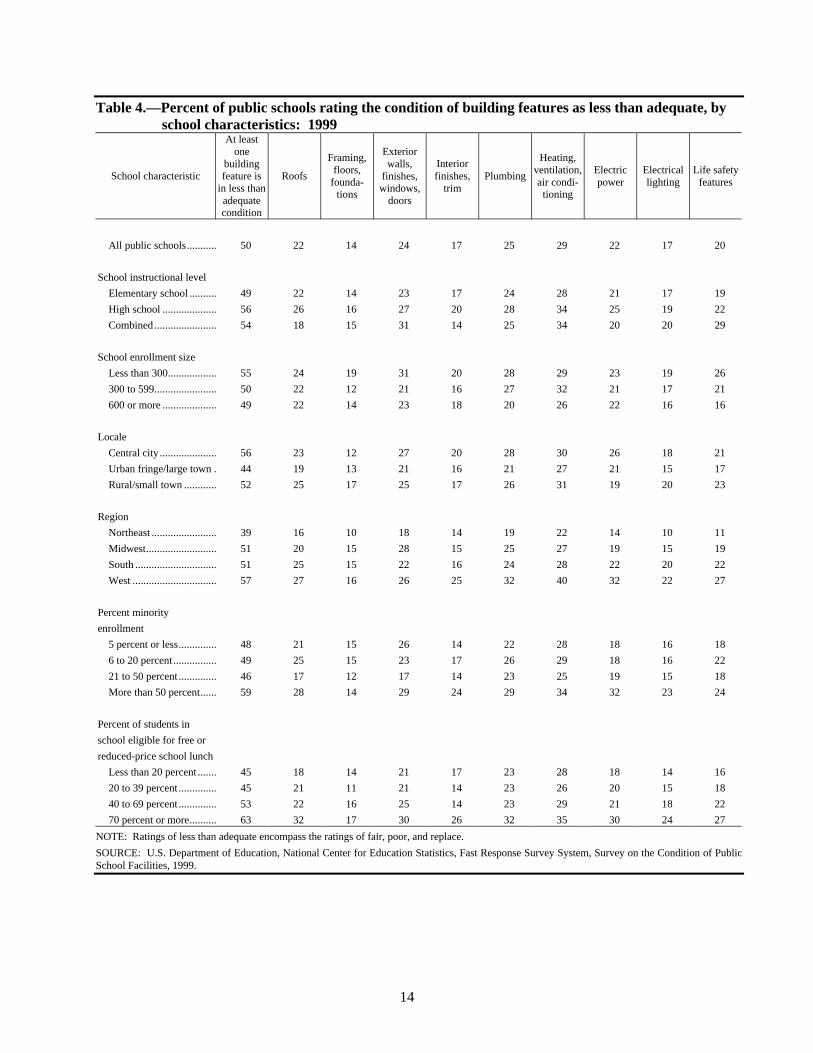
14
Table 4.—Percent of public schools rating the condition of building features as less than adequate, byschool characteristics: 1999
School characteristic
At leastone
buildingfeature is
in less thanadequatecondition
Roofs
Framing,floors,
founda-tions
Exteriorwalls,
finishes,windows,
doors
Interiorfinishes,
trimPlumbing
Heating,ventilation,air condi-
tioning
Electricpower
Electricallighting
Life safetyfeatures
All public schools........... 50 22 14 24 17 25 29 22 17 20
School instructional level
Elementary school .......... 49 22 14 23 17 24 28 21 17 19
High school .................... 56 26 16 27 20 28 34 25 19 22
Combined....................... 54 18 15 31 14 25 34 20 20 29
School enrollment size
Less than 300.................. 55 24 19 31 20 28 29 23 19 26
300 to 599....................... 50 22 12 21 16 27 32 21 17 21
600 or more .................... 49 22 14 23 18 20 26 22 16 16
Locale
Central city ..................... 56 23 12 27 20 28 30 26 18 21
Urban fringe/large town . 44 19 13 21 16 21 27 21 15 17
Rural/small town ............ 52 25 17 25 17 26 31 19 20 23
Region
Northeast ........................ 39 16 10 18 14 19 22 14 10 11
Midwest.......................... 51 20 15 28 15 25 27 19 15 19
South .............................. 51 25 15 22 16 24 28 22 20 22
West ............................... 57 27 16 26 25 32 40 32 22 27
Percent minority
enrollment
5 percent or less.............. 48 21 15 26 14 22 28 18 16 18
6 to 20 percent................ 49 25 15 23 17 26 29 18 16 22
21 to 50 percent .............. 46 17 12 17 14 23 25 19 15 18
More than 50 percent...... 59 28 14 29 24 29 34 32 23 24
Percent of students in
school eligible for free or
reduced-price school lunch
Less than 20 percent ....... 45 18 14 21 17 23 28 18 14 16
20 to 39 percent .............. 45 21 11 21 14 23 26 20 15 18
40 to 69 percent .............. 53 22 16 25 14 23 29 21 18 22
70 percent or more.......... 63 32 17 30 26 32 35 30 24 27
NOTE: Ratings of less than adequate encompass the ratings of fair, poor, and replace.
SOURCE: U.S. Department of Education, National Center for Education Statistics, Fast Response Survey System, Survey on the Condition of PublicSchool Facilities, 1999.
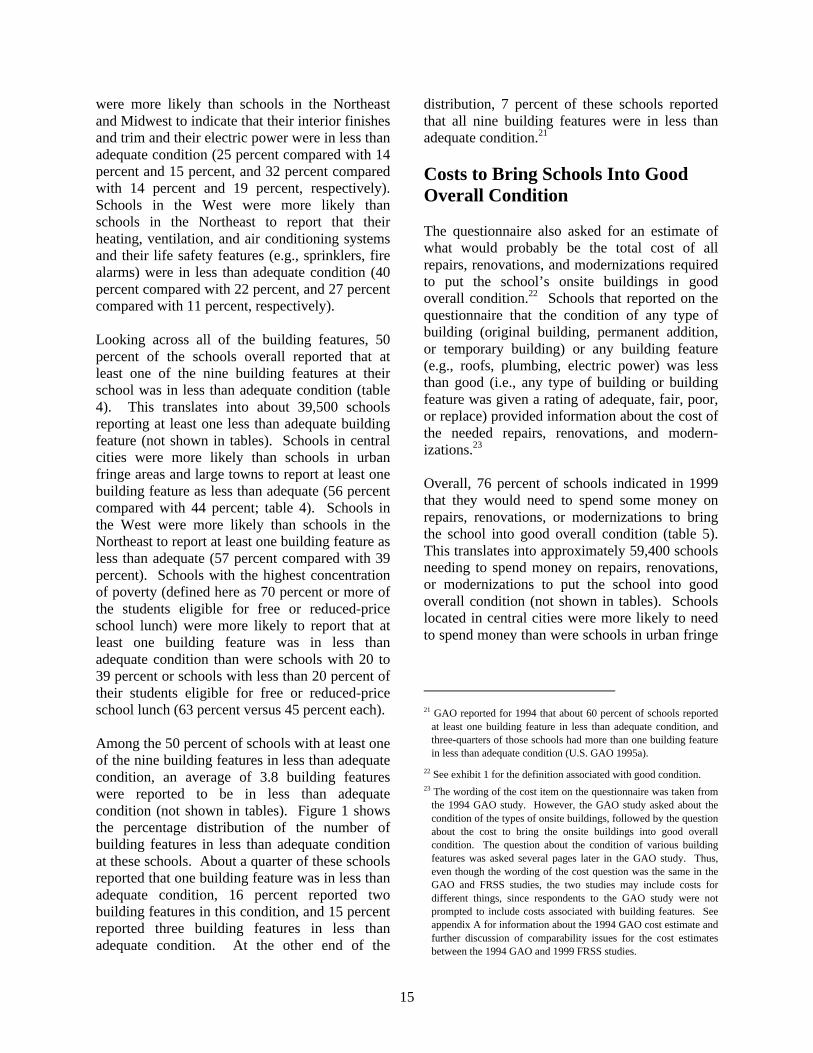
15
were more likely than schools in the Northeastand Midwest to indicate that their interior finishesand trim and their electric power were in less thanadequate condition (25 percent compared with 14percent and 15 percent, and 32 percent comparedwith 14 percent and 19 percent, respectively).Schools in the West were more likely thanschools in the Northeast to report that theirheating, ventilation, and air conditioning systemsand their life safety features (e.g., sprinklers, firealarms) were in less than adequate condition (40percent compared with 22 percent, and 27 percentcompared with 11 percent, respectively).
Looking across all of the building features, 50percent of the schools overall reported that atleast one of the nine building features at theirschool was in less than adequate condition (table4). This translates into about 39,500 schoolsreporting at least one less than adequate buildingfeature (not shown in tables). Schools in centralcities were more likely than schools in urbanfringe areas and large towns to report at least onebuilding feature as less than adequate (56 percentcompared with 44 percent; table 4). Schools inthe West were more likely than schools in theNortheast to report at least one building feature asless than adequate (57 percent compared with 39percent). Schools with the highest concentrationof poverty (defined here as 70 percent or more ofthe students eligible for free or reduced-priceschool lunch) were more likely to report that atleast one building feature was in less thanadequate condition than were schools with 20 to39 percent or schools with less than 20 percent oftheir students eligible for free or reduced-priceschool lunch (63 percent versus 45 percent each).
Among the 50 percent of schools with at least oneof the nine building features in less than adequatecondition, an average of 3.8 building featureswere reported to be in less than adequatecondition (not shown in tables). Figure 1 showsthe percentage distribution of the number ofbuilding features in less than adequate conditionat these schools. About a quarter of these schoolsreported that one building feature was in less thanadequate condition, 16 percent reported twobuilding features in this condition, and 15 percentreported three building features in less thanadequate condition. At the other end of the
distribution, 7 percent of these schools reportedthat all nine building features were in less thanadequate condition.21
Costs to Bring Schools Into GoodOverall Condition
The questionnaire also asked for an estimate ofwhat would probably be the total cost of allrepairs, renovations, and modernizations requiredto put the school’s onsite buildings in goodoverall condition.22 Schools that reported on thequestionnaire that the condition of any type ofbuilding (original building, permanent addition,or temporary building) or any building feature(e.g., roofs, plumbing, electric power) was lessthan good (i.e., any type of building or buildingfeature was given a rating of adequate, fair, poor,or replace) provided information about the cost ofthe needed repairs, renovations, and modern-izations.23
Overall, 76 percent of schools indicated in 1999that they would need to spend some money onrepairs, renovations, or modernizations to bringthe school into good overall condition (table 5).This translates into approximately 59,400 schoolsneeding to spend money on repairs, renovations,or modernizations to put the school into goodoverall condition (not shown in tables). Schoolslocated in central cities were more likely to needto spend money than were schools in urban fringe
21 GAO reported for 1994 that about 60 percent of schools reported
at least one building feature in less than adequate condition, andthree-quarters of those schools had more than one building featurein less than adequate condition (U.S. GAO 1995a).
22 See exhibit 1 for the definition associated with good condition.23 The wording of the cost item on the questionnaire was taken from
the 1994 GAO study. However, the GAO study asked about thecondition of the types of onsite buildings, followed by the questionabout the cost to bring the onsite buildings into good overallcondition. The question about the condition of various buildingfeatures was asked several pages later in the GAO study. Thus,even though the wording of the cost question was the same in theGAO and FRSS studies, the two studies may include costs fordifferent things, since respondents to the GAO study were notprompted to include costs associated with building features. Seeappendix A for information about the 1994 GAO cost estimate andfurther discussion of comparability issues for the cost estimatesbetween the 1994 GAO and 1999 FRSS studies.
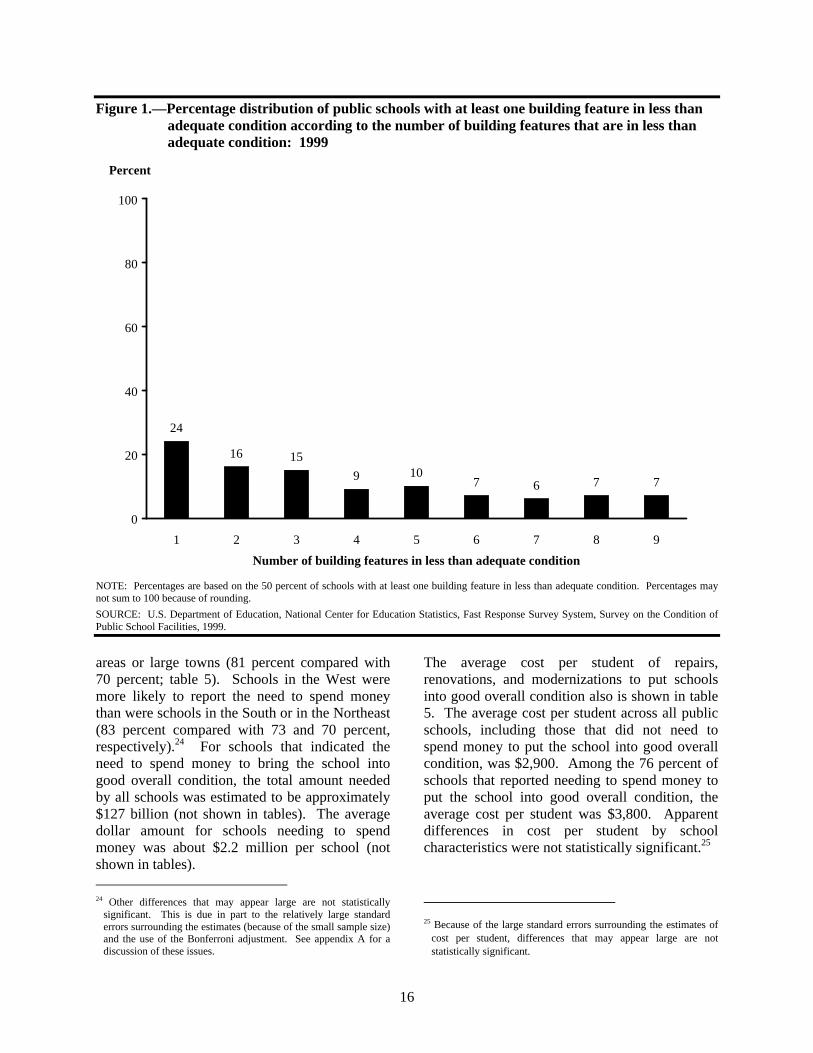
16
Figure 1.—Percentage distribution of public schools with at least one building feature in less thanadequate condition according to the number of building features that are in less thanadequate condition: 1999
24
16 15
9 107 6 7 7
0
20
40
60
80
100
1 2 3 4 5 6 7 8 9
Number of building features in less than adequate condition
Percent
NOTE: Percentages are based on the 50 percent of schools with at least one building feature in less than adequate condition. Percentages maynot sum to 100 because of rounding.
SOURCE: U.S. Department of Education, National Center for Education Statistics, Fast Response Survey System, Survey on the Condition ofPublic School Facilities, 1999.
areas or large towns (81 percent compared with70 percent; table 5). Schools in the West weremore likely to report the need to spend moneythan were schools in the South or in the Northeast(83 percent compared with 73 and 70 percent,respectively).24 For schools that indicated theneed to spend money to bring the school intogood overall condition, the total amount neededby all schools was estimated to be approximately$127 billion (not shown in tables). The averagedollar amount for schools needing to spendmoney was about $2.2 million per school (notshown in tables). 24 Other differences that may appear large are not statistically
significant. This is due in part to the relatively large standarderrors surrounding the estimates (because of the small sample size)and the use of the Bonferroni adjustment. See appendix A for adiscussion of these issues.
The average cost per student of repairs,renovations, and modernizations to put schoolsinto good overall condition also is shown in table5. The average cost per student across all publicschools, including those that did not need tospend money to put the school into good overallcondition, was $2,900. Among the 76 percent ofschools that reported needing to spend money toput the school into good overall condition, theaverage cost per student was $3,800. Apparentdifferences in cost per student by schoolcharacteristics were not statistically significant.25
25 Because of the large standard errors surrounding the estimates of
cost per student, differences that may appear large are notstatistically significant.
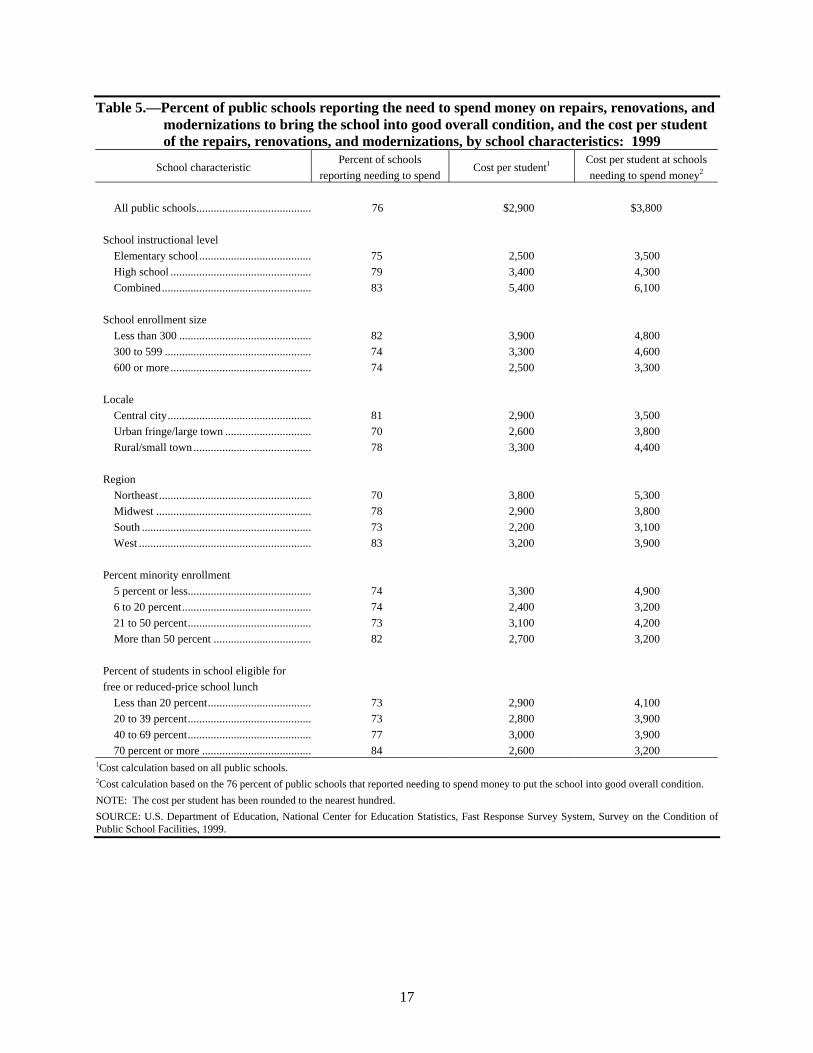
17
Table 5.—Percent of public schools reporting the need to spend money on repairs, renovations, andmodernizations to bring the school into good overall condition, and the cost per studentof the repairs, renovations, and modernizations, by school characteristics: 1999
School characteristicPercent of schools
reporting needing to spendCost per student1 Cost per student at schools
needing to spend money2
All public schools........................................ 76 $2,900 $3,800
School instructional level
Elementary school ....................................... 75 2,500 3,500
High school ................................................. 79 3,400 4,300
Combined.................................................... 83 5,400 6,100
School enrollment size
Less than 300 .............................................. 82 3,900 4,800
300 to 599 ................................................... 74 3,300 4,600
600 or more ................................................. 74 2,500 3,300
Locale
Central city.................................................. 81 2,900 3,500
Urban fringe/large town .............................. 70 2,600 3,800
Rural/small town ......................................... 78 3,300 4,400
Region
Northeast ..................................................... 70 3,800 5,300
Midwest ...................................................... 78 2,900 3,800
South ........................................................... 73 2,200 3,100
West ............................................................ 83 3,200 3,900
Percent minority enrollment
5 percent or less........................................... 74 3,300 4,900
6 to 20 percent............................................. 74 2,400 3,200
21 to 50 percent........................................... 73 3,100 4,200
More than 50 percent .................................. 82 2,700 3,200
Percent of students in school eligible for
free or reduced-price school lunch
Less than 20 percent.................................... 73 2,900 4,100
20 to 39 percent........................................... 73 2,800 3,900
40 to 69 percent........................................... 77 3,000 3,900
70 percent or more ...................................... 84 2,600 3,2001Cost calculation based on all public schools.2Cost calculation based on the 76 percent of public schools that reported needing to spend money to put the school into good overall condition.
NOTE: The cost per student has been rounded to the nearest hundred.
SOURCE: U.S. Department of Education, National Center for Education Statistics, Fast Response Survey System, Survey on the Condition ofPublic School Facilities, 1999.
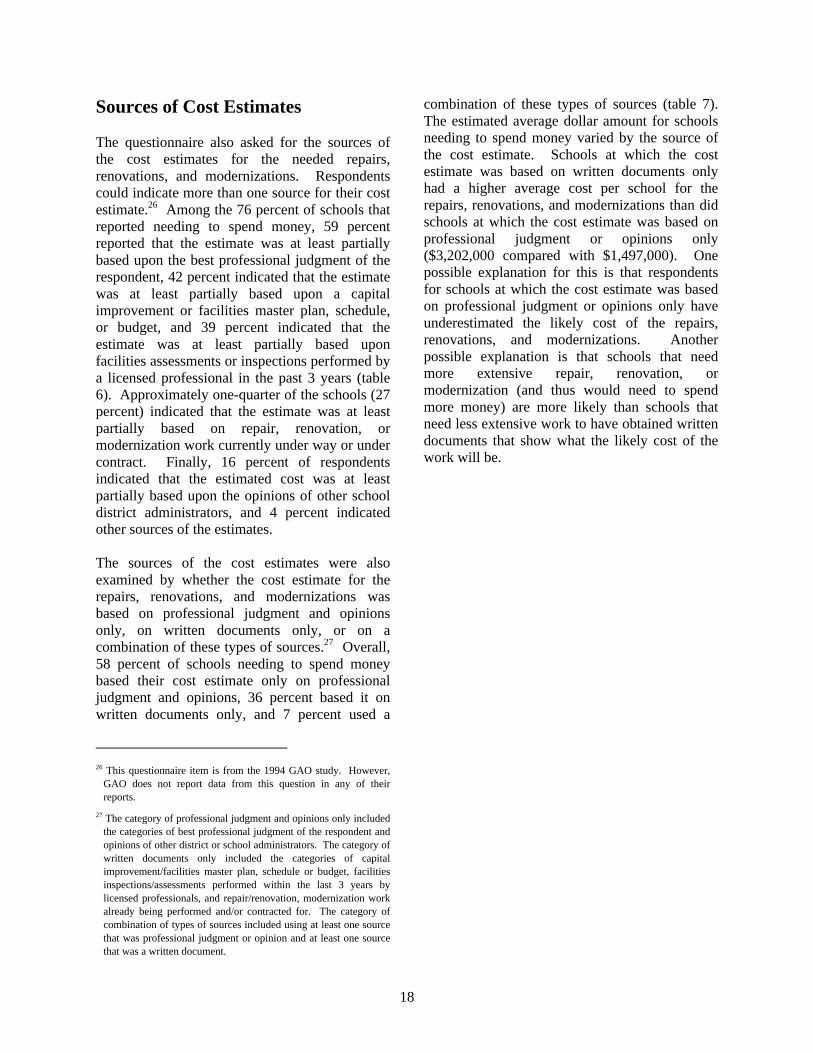
18
Sources of Cost Estimates
The questionnaire also asked for the sources ofthe cost estimates for the needed repairs,renovations, and modernizations. Respondentscould indicate more than one source for their costestimate.26 Among the 76 percent of schools thatreported needing to spend money, 59 percentreported that the estimate was at least partiallybased upon the best professional judgment of therespondent, 42 percent indicated that the estimatewas at least partially based upon a capitalimprovement or facilities master plan, schedule,or budget, and 39 percent indicated that theestimate was at least partially based uponfacilities assessments or inspections performed bya licensed professional in the past 3 years (table6). Approximately one-quarter of the schools (27percent) indicated that the estimate was at leastpartially based on repair, renovation, ormodernization work currently under way or undercontract. Finally, 16 percent of respondentsindicated that the estimated cost was at leastpartially based upon the opinions of other schooldistrict administrators, and 4 percent indicatedother sources of the estimates.
The sources of the cost estimates were alsoexamined by whether the cost estimate for therepairs, renovations, and modernizations wasbased on professional judgment and opinionsonly, on written documents only, or on acombination of these types of sources.27 Overall,58 percent of schools needing to spend moneybased their cost estimate only on professionaljudgment and opinions, 36 percent based it onwritten documents only, and 7 percent used a
26 This questionnaire item is from the 1994 GAO study. However,
GAO does not report data from this question in any of theirreports.
27 The category of professional judgment and opinions only includedthe categories of best professional judgment of the respondent andopinions of other district or school administrators. The category ofwritten documents only included the categories of capitalimprovement/facilities master plan, schedule or budget, facilitiesinspections/assessments performed within the last 3 years bylicensed professionals, and repair/renovation, modernization workalready being performed and/or contracted for. The category ofcombination of types of sources included using at least one sourcethat was professional judgment or opinion and at least one sourcethat was a written document.
combination of these types of sources (table 7).The estimated average dollar amount for schoolsneeding to spend money varied by the source ofthe cost estimate. Schools at which the costestimate was based on written documents onlyhad a higher average cost per school for therepairs, renovations, and modernizations than didschools at which the cost estimate was based onprofessional judgment or opinions only($3,202,000 compared with $1,497,000). Onepossible explanation for this is that respondentsfor schools at which the cost estimate was basedon professional judgment or opinions only haveunderestimated the likely cost of the repairs,renovations, and modernizations. Anotherpossible explanation is that schools that needmore extensive repair, renovation, ormodernization (and thus would need to spendmore money) are more likely than schools thatneed less extensive work to have obtained writtendocuments that show what the likely cost of thework will be.
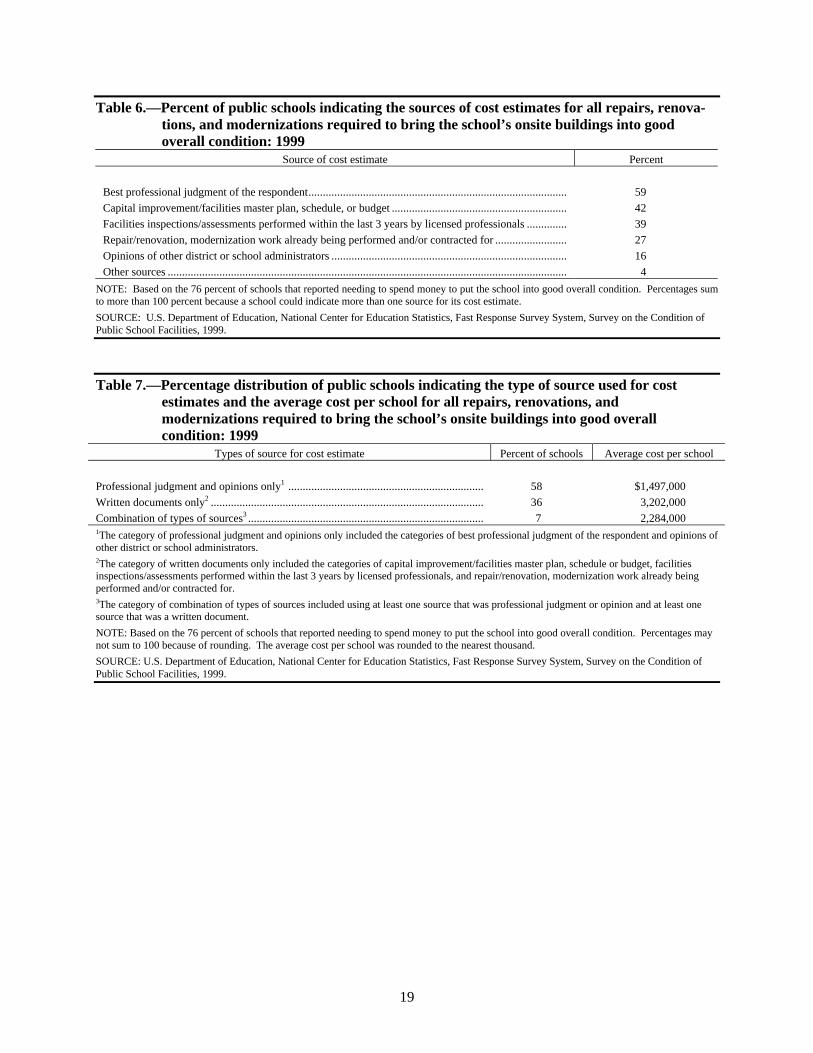
19
Table 6.—Percent of public schools indicating the sources of cost estimates for all repairs, renova-tions, and modernizations required to bring the school’s onsite buildings into goodoverall condition: 1999
Source of cost estimate Percent
Best professional judgment of the respondent.......................................................................................... 59
Capital improvement/facilities master plan, schedule, or budget ............................................................. 42
Facilities inspections/assessments performed within the last 3 years by licensed professionals .............. 39
Repair/renovation, modernization work already being performed and/or contracted for ......................... 27
Opinions of other district or school administrators .................................................................................. 16
Other sources ........................................................................................................................................... 4
NOTE: Based on the 76 percent of schools that reported needing to spend money to put the school into good overall condition. Percentages sumto more than 100 percent because a school could indicate more than one source for its cost estimate.
SOURCE: U.S. Department of Education, National Center for Education Statistics, Fast Response Survey System, Survey on the Condition ofPublic School Facilities, 1999.
Table 7.—Percentage distribution of public schools indicating the type of source used for costestimates and the average cost per school for all repairs, renovations, andmodernizations required to bring the school’s onsite buildings into good overallcondition: 1999
Types of source for cost estimate Percent of schools Average cost per school
Professional judgment and opinions only1 .................................................................... 58 $1,497,000
Written documents only2 ............................................................................................... 36 3,202,000
Combination of types of sources3 .................................................................................. 7 2,284,0001The category of professional judgment and opinions only included the categories of best professional judgment of the respondent and opinions ofother district or school administrators.2The category of written documents only included the categories of capital improvement/facilities master plan, schedule or budget, facilitiesinspections/assessments performed within the last 3 years by licensed professionals, and repair/renovation, modernization work already beingperformed and/or contracted for.3The category of combination of types of sources included using at least one source that was professional judgment or opinion and at least onesource that was a written document.
NOTE: Based on the 76 percent of schools that reported needing to spend money to put the school into good overall condition. Percentages maynot sum to 100 because of rounding. The average cost per school was rounded to the nearest thousand.
SOURCE: U.S. Department of Education, National Center for Education Statistics, Fast Response Survey System, Survey on the Condition ofPublic School Facilities, 1999.

20
21
3. ENVIRONMENTAL CONDITIONS
Environmental conditions, such as heating,ventilation, and air conditioning, are importantaspects of the day-to-day environment forstudents. This chapter provides informationabout satisfaction with various environmentalconditions in public school buildings. Theconditions rated included lighting, heating,ventilation, indoor air quality, acoustics or noisecontrol, and physical security of buildings. Alsoincluded is information about satisfaction with theflexibility of instructional space at the school andthe energy efficiency of the school. In addition,information is provided about the status andsatisfaction with air conditioning in various areasof the school, with particular focus on airconditioning in classrooms. Information is alsoprovided about school closures due to facilitiesproblems.
Satisfaction with EnvironmentalConditions
The questionnaire asked for ratings of howsatisfactory or unsatisfactory six differentenvironmental conditions were in the school’sonsite buildings.28 While the majority of publicschools reported that the individual environ-
28 This questionnaire item was drawn from the 1994 GAO study.
The FRSS questionnaire referred to these conditions asenvironmental factors, following the wording of the GAOquestionnaire. The list of environmental factors on thequestionnaire also included flexibility of instructional space andenergy efficiency. Information about these two factors ispresented separately. Some of the building features for whichschools were asked to rate the physical condition on thequestionnaire (e.g., heating, lighting; see chapter 2 of this report)are related to the environmental factors for which schools wereasked to rate their satisfaction. Both items on the FRSSquestionnaire were taken directly from the GAO questionnaire,with the intention of providing information about change in thecondition of public school facilities between 1994 and 1999.Information from the GAO study is provided as contextualinformation only, rather than as statistical comparisons. Standarderrors are not available for the GAO data, and exact pointestimates are also missing for some comparative statements fromthe GAO reports.
mental conditions in their schools weresatisfactory, a sizable minority (ranging from 12percent to 26 percent) reported that variousindividual environmental conditions wereunsatisfactory29 (table 8). Ventilation was ratedas unsatisfactory by more schools than any otherenvironmental condition (26 percent). Ratings ofother environmental conditions included 12percent of schools reporting they were unsatisfiedwith lighting conditions, and about a fifth ofschools indicating they were unsatisfied withheating, indoor air quality, acoustics or noisecontrol, and the physical security of buildings.
Satisfaction with individual environmentalconditions showed some variation by schoolcharacteristics, with three of the sixenvironmental conditions showing significantdifferences30 (table 8). For ventilation, a largerpercentage of medium than large schools wereunsatisfied (31 percent compared with 21percent), and schools in the West were morelikely to be unsatisfied than schools in the South(37 percent versus 19 percent). For acoustics ornoise control, more medium than large schoolsreported being unsatisfied (19 percent comparedwith 12 percent), and schools in rural areas andsmall towns were more unsatisfied than schoolsin urban fringe areas and large towns (21 percentversus 13 percent). Physical security of buildingswas perceived as more unsatisfactory by highschools than by elementary schools (26 percentversus 17 percent), and schools in rural areas and
29 The ratings of satisfactory and very satisfactory have been
combined into a rating of satisfactory, and the ratings ofunsatisfactory and very unsatisfactory have been combined into arating of unsatisfactory. The satisfaction ratings do not have thesame kind of explicit definitions that the ratings used for thecondition of buildings and building features have. Those ratings(excellent, good, adequate, fair, poor, replace) were defined toindicate the amount of maintenance and repair required.
30 As noted previously, differences that may appear large may not bestatistically significant, due in part to the relatively large standarderrors surrounding the estimates (because of the small sample size)and the use of the Bonferroni adjustment. These are discussedfurther in appendix A.
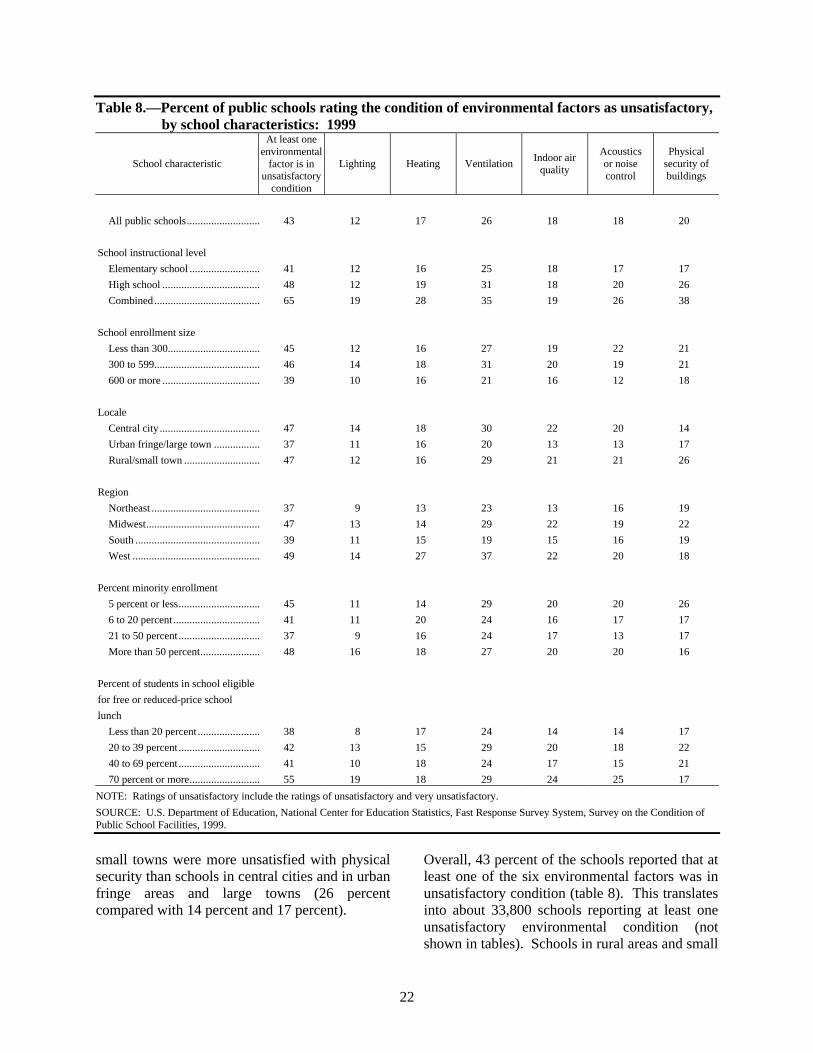
22
Table 8.—Percent of public schools rating the condition of environmental factors as unsatisfactory,by school characteristics: 1999
School characteristic
At least oneenvironmental
factor is inunsatisfactory
condition
Lighting Heating VentilationIndoor air
quality
Acousticsor noisecontrol
Physicalsecurity ofbuildings
All public schools........................... 43 12 17 26 18 18 20
School instructional level
Elementary school .......................... 41 12 16 25 18 17 17
High school .................................... 48 12 19 31 18 20 26
Combined....................................... 65 19 28 35 19 26 38
School enrollment size
Less than 300.................................. 45 12 16 27 19 22 21
300 to 599....................................... 46 14 18 31 20 19 21
600 or more .................................... 39 10 16 21 16 12 18
Locale
Central city ..................................... 47 14 18 30 22 20 14
Urban fringe/large town ................. 37 11 16 20 13 13 17
Rural/small town ............................ 47 12 16 29 21 21 26
Region
Northeast ........................................ 37 9 13 23 13 16 19
Midwest.......................................... 47 13 14 29 22 19 22
South .............................................. 39 11 15 19 15 16 19
West ............................................... 49 14 27 37 22 20 18
Percent minority enrollment
5 percent or less.............................. 45 11 14 29 20 20 26
6 to 20 percent................................ 41 11 20 24 16 17 17
21 to 50 percent .............................. 37 9 16 24 17 13 17
More than 50 percent...................... 48 16 18 27 20 20 16
Percent of students in school eligible
for free or reduced-price school
lunch
Less than 20 percent ....................... 38 8 17 24 14 14 17
20 to 39 percent .............................. 42 13 15 29 20 18 22
40 to 69 percent .............................. 41 10 18 24 17 15 21
70 percent or more.......................... 55 19 18 29 24 25 17
NOTE: Ratings of unsatisfactory include the ratings of unsatisfactory and very unsatisfactory.
SOURCE: U.S. Department of Education, National Center for Education Statistics, Fast Response Survey System, Survey on the Condition ofPublic School Facilities, 1999.
small towns were more unsatisfied with physicalsecurity than schools in central cities and in urbanfringe areas and large towns (26 percentcompared with 14 percent and 17 percent).
Overall, 43 percent of the schools reported that atleast one of the six environmental factors was inunsatisfactory condition (table 8). This translatesinto about 33,800 schools reporting at least oneunsatisfactory environmental condition (notshown in tables). Schools in rural areas and small
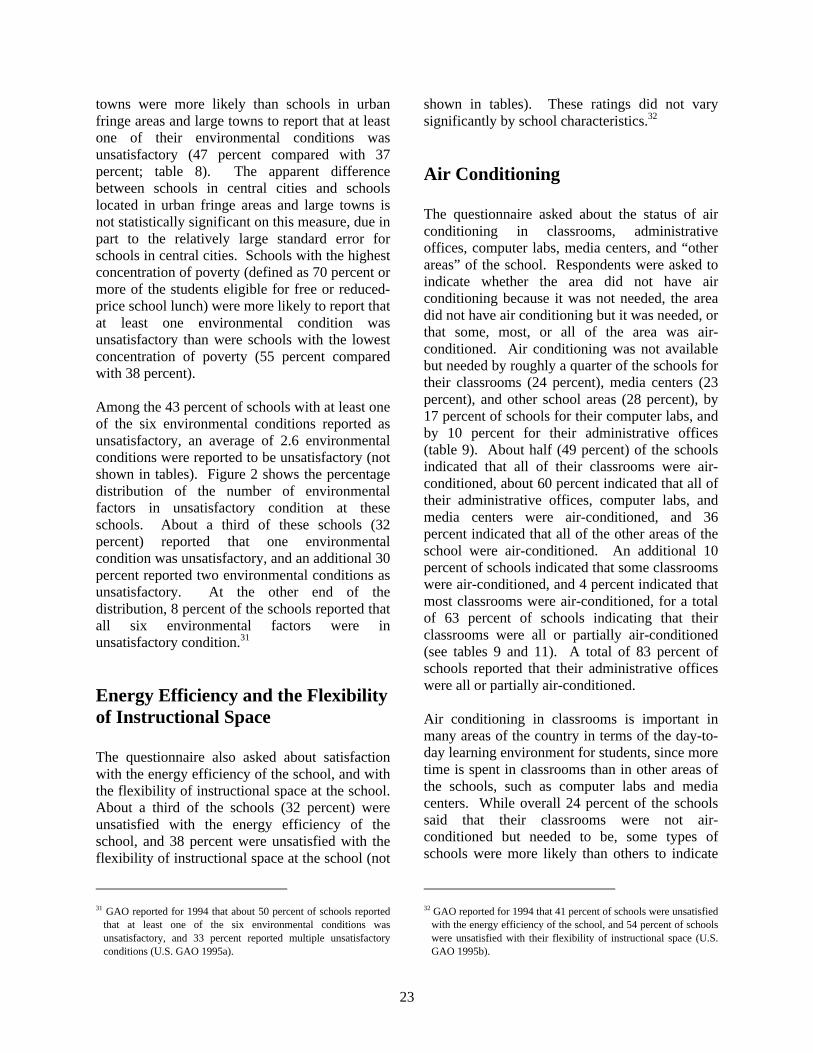
23
towns were more likely than schools in urbanfringe areas and large towns to report that at leastone of their environmental conditions wasunsatisfactory (47 percent compared with 37percent; table 8). The apparent differencebetween schools in central cities and schoolslocated in urban fringe areas and large towns isnot statistically significant on this measure, due inpart to the relatively large standard error forschools in central cities. Schools with the highestconcentration of poverty (defined as 70 percent ormore of the students eligible for free or reduced-price school lunch) were more likely to report thatat least one environmental condition wasunsatisfactory than were schools with the lowestconcentration of poverty (55 percent comparedwith 38 percent).
Among the 43 percent of schools with at least oneof the six environmental conditions reported asunsatisfactory, an average of 2.6 environmentalconditions were reported to be unsatisfactory (notshown in tables). Figure 2 shows the percentagedistribution of the number of environmentalfactors in unsatisfactory condition at theseschools. About a third of these schools (32percent) reported that one environmentalcondition was unsatisfactory, and an additional 30percent reported two environmental conditions asunsatisfactory. At the other end of thedistribution, 8 percent of the schools reported thatall six environmental factors were inunsatisfactory condition.31
Energy Efficiency and the Flexibilityof Instructional Space
The questionnaire also asked about satisfactionwith the energy efficiency of the school, and withthe flexibility of instructional space at the school.About a third of the schools (32 percent) wereunsatisfied with the energy efficiency of theschool, and 38 percent were unsatisfied with theflexibility of instructional space at the school (not
31 GAO reported for 1994 that about 50 percent of schools reported
that at least one of the six environmental conditions wasunsatisfactory, and 33 percent reported multiple unsatisfactoryconditions (U.S. GAO 1995a).
shown in tables). These ratings did not varysignificantly by school characteristics.32
Air Conditioning
The questionnaire asked about the status of airconditioning in classrooms, administrativeoffices, computer labs, media centers, and “otherareas” of the school. Respondents were asked toindicate whether the area did not have airconditioning because it was not needed, the areadid not have air conditioning but it was needed, orthat some, most, or all of the area was air-conditioned. Air conditioning was not availablebut needed by roughly a quarter of the schools fortheir classrooms (24 percent), media centers (23percent), and other school areas (28 percent), by17 percent of schools for their computer labs, andby 10 percent for their administrative offices(table 9). About half (49 percent) of the schoolsindicated that all of their classrooms were air-conditioned, about 60 percent indicated that all oftheir administrative offices, computer labs, andmedia centers were air-conditioned, and 36percent indicated that all of the other areas of theschool were air-conditioned. An additional 10percent of schools indicated that some classroomswere air-conditioned, and 4 percent indicated thatmost classrooms were air-conditioned, for a totalof 63 percent of schools indicating that theirclassrooms were all or partially air-conditioned(see tables 9 and 11). A total of 83 percent ofschools reported that their administrative officeswere all or partially air-conditioned.
Air conditioning in classrooms is important inmany areas of the country in terms of the day-to-day learning environment for students, since moretime is spent in classrooms than in other areas ofthe schools, such as computer labs and mediacenters. While overall 24 percent of the schoolssaid that their classrooms were not air-conditioned but needed to be, some types ofschools were more likely than others to indicate
32 GAO reported for 1994 that 41 percent of schools were unsatisfied
with the energy efficiency of the school, and 54 percent of schoolswere unsatisfied with their flexibility of instructional space (U.S.GAO 1995b).
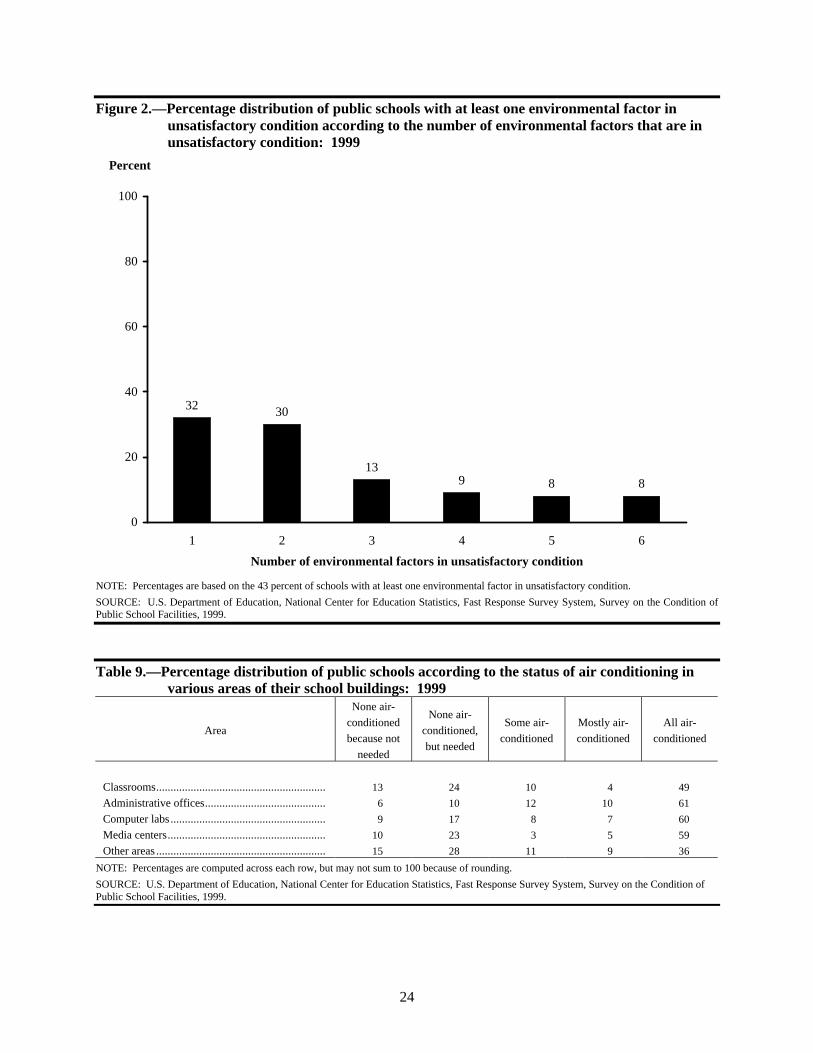
24
Figure 2.—Percentage distribution of public schools with at least one environmental factor inunsatisfactory condition according to the number of environmental factors that are inunsatisfactory condition: 1999
32 30
139 8 8
0
20
40
60
80
100
1 2 3 4 5 6
Number of environmental factors in unsatisfactory condition
Percent
NOTE: Percentages are based on the 43 percent of schools with at least one environmental factor in unsatisfactory condition.
SOURCE: U.S. Department of Education, National Center for Education Statistics, Fast Response Survey System, Survey on the Condition ofPublic School Facilities, 1999.
Table 9.—Percentage distribution of public schools according to the status of air conditioning invarious areas of their school buildings: 1999
Area
None air-
conditioned
because not
needed
None air-
conditioned,
but needed
Some air-
conditioned
Mostly air-
conditioned
All air-
conditioned
Classrooms........................................................... 13 24 10 4 49
Administrative offices.......................................... 6 10 12 10 61
Computer labs...................................................... 9 17 8 7 60
Media centers....................................................... 10 23 3 5 59
Other areas ........................................................... 15 28 11 9 36
NOTE: Percentages are computed across each row, but may not sum to 100 because of rounding.
SOURCE: U.S. Department of Education, National Center for Education Statistics, Fast Response Survey System, Survey on the Condition ofPublic School Facilities, 1999.
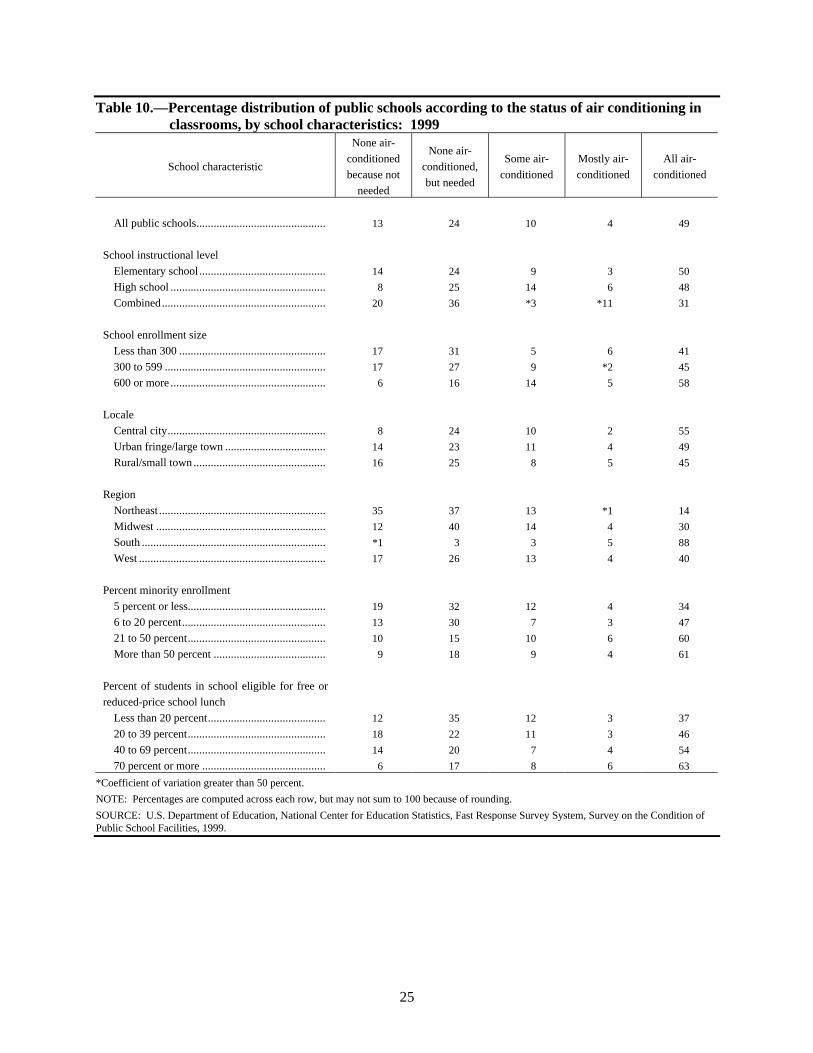
25
Table 10.—Percentage distribution of public schools according to the status of air conditioning inclassrooms, by school characteristics: 1999
School characteristic
None air-
conditioned
because not
needed
None air-
conditioned,
but needed
Some air-
conditioned
Mostly air-
conditioned
All air-
conditioned
All public schools............................................. 13 24 10 4 49
School instructional level
Elementary school ............................................ 14 24 9 3 50
High school ...................................................... 8 25 14 6 48
Combined......................................................... 20 36 *3 *11 31
School enrollment size
Less than 300 ................................................... 17 31 5 6 41
300 to 599 ........................................................ 17 27 9 *2 45
600 or more ...................................................... 6 16 14 5 58
Locale
Central city....................................................... 8 24 10 2 55
Urban fringe/large town ................................... 14 23 11 4 49
Rural/small town .............................................. 16 25 8 5 45
Region
Northeast .......................................................... 35 37 13 *1 14
Midwest ........................................................... 12 40 14 4 30
South ................................................................ *1 3 3 5 88
West ................................................................. 17 26 13 4 40
Percent minority enrollment
5 percent or less................................................ 19 32 12 4 34
6 to 20 percent.................................................. 13 30 7 3 47
21 to 50 percent................................................ 10 15 10 6 60
More than 50 percent ....................................... 9 18 9 4 61
Percent of students in school eligible for free or
reduced-price school lunch
Less than 20 percent......................................... 12 35 12 3 37
20 to 39 percent................................................ 18 22 11 3 46
40 to 69 percent................................................ 14 20 7 4 54
70 percent or more ........................................... 6 17 8 6 63
*Coefficient of variation greater than 50 percent.
NOTE: Percentages are computed across each row, but may not sum to 100 because of rounding.
SOURCE: U.S. Department of Education, National Center for Education Statistics, Fast Response Survey System, Survey on the Condition ofPublic School Facilities, 1999.
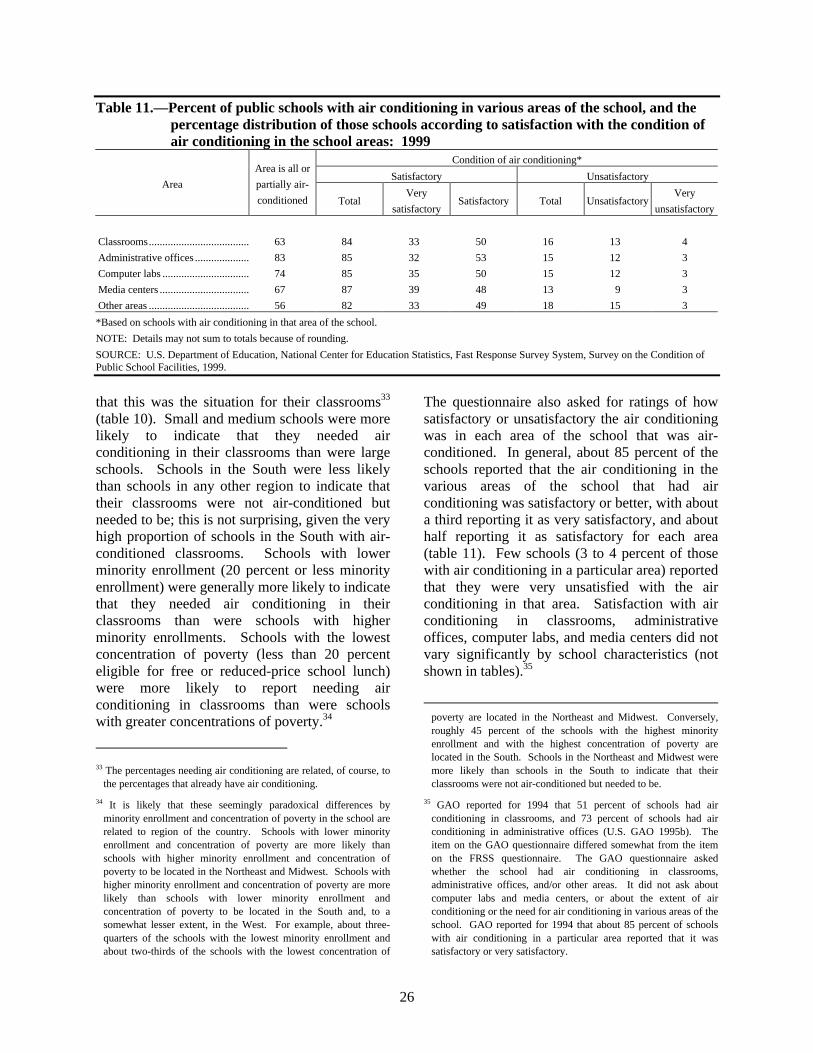
26
Table 11.—Percent of public schools with air conditioning in various areas of the school, and thepercentage distribution of those schools according to satisfaction with the condition ofair conditioning in the school areas: 1999
Condition of air conditioning*
Satisfactory UnsatisfactoryArea
Area is all or
partially air-
conditioned TotalVery
satisfactorySatisfactory Total Unsatisfactory
Very
unsatisfactory
Classrooms..................................... 63 84 33 50 16 13 4
Administrative offices .................... 83 85 32 53 15 12 3
Computer labs ................................ 74 85 35 50 15 12 3
Media centers ................................. 67 87 39 48 13 9 3
Other areas ..................................... 56 82 33 49 18 15 3
*Based on schools with air conditioning in that area of the school.
NOTE: Details may not sum to totals because of rounding.
SOURCE: U.S. Department of Education, National Center for Education Statistics, Fast Response Survey System, Survey on the Condition ofPublic School Facilities, 1999.
that this was the situation for their classrooms33
(table 10). Small and medium schools were morelikely to indicate that they needed airconditioning in their classrooms than were largeschools. Schools in the South were less likelythan schools in any other region to indicate thattheir classrooms were not air-conditioned butneeded to be; this is not surprising, given the veryhigh proportion of schools in the South with air-conditioned classrooms. Schools with lowerminority enrollment (20 percent or less minorityenrollment) were generally more likely to indicatethat they needed air conditioning in theirclassrooms than were schools with higherminority enrollments. Schools with the lowestconcentration of poverty (less than 20 percenteligible for free or reduced-price school lunch)were more likely to report needing airconditioning in classrooms than were schoolswith greater concentrations of poverty.34
33 The percentages needing air conditioning are related, of course, to
the percentages that already have air conditioning.
34 It is likely that these seemingly paradoxical differences byminority enrollment and concentration of poverty in the school arerelated to region of the country. Schools with lower minorityenrollment and concentration of poverty are more likely thanschools with higher minority enrollment and concentration ofpoverty to be located in the Northeast and Midwest. Schools withhigher minority enrollment and concentration of poverty are morelikely than schools with lower minority enrollment andconcentration of poverty to be located in the South and, to asomewhat lesser extent, in the West. For example, about three-quarters of the schools with the lowest minority enrollment andabout two-thirds of the schools with the lowest concentration of
The questionnaire also asked for ratings of howsatisfactory or unsatisfactory the air conditioningwas in each area of the school that was air-conditioned. In general, about 85 percent of theschools reported that the air conditioning in thevarious areas of the school that had airconditioning was satisfactory or better, with abouta third reporting it as very satisfactory, and abouthalf reporting it as satisfactory for each area(table 11). Few schools (3 to 4 percent of thosewith air conditioning in a particular area) reportedthat they were very unsatisfied with the airconditioning in that area. Satisfaction with airconditioning in classrooms, administrativeoffices, computer labs, and media centers did notvary significantly by school characteristics (notshown in tables).35
poverty are located in the Northeast and Midwest. Conversely,roughly 45 percent of the schools with the highest minorityenrollment and with the highest concentration of poverty arelocated in the South. Schools in the Northeast and Midwest weremore likely than schools in the South to indicate that theirclassrooms were not air-conditioned but needed to be.
35 GAO reported for 1994 that 51 percent of schools had airconditioning in classrooms, and 73 percent of schools had airconditioning in administrative offices (U.S. GAO 1995b). Theitem on the GAO questionnaire differed somewhat from the itemon the FRSS questionnaire. The GAO questionnaire askedwhether the school had air conditioning in classrooms,administrative offices, and/or other areas. It did not ask aboutcomputer labs and media centers, or about the extent of airconditioning or the need for air conditioning in various areas of theschool. GAO reported for 1994 that about 85 percent of schoolswith air conditioning in a particular area reported that it wassatisfactory or very satisfactory.
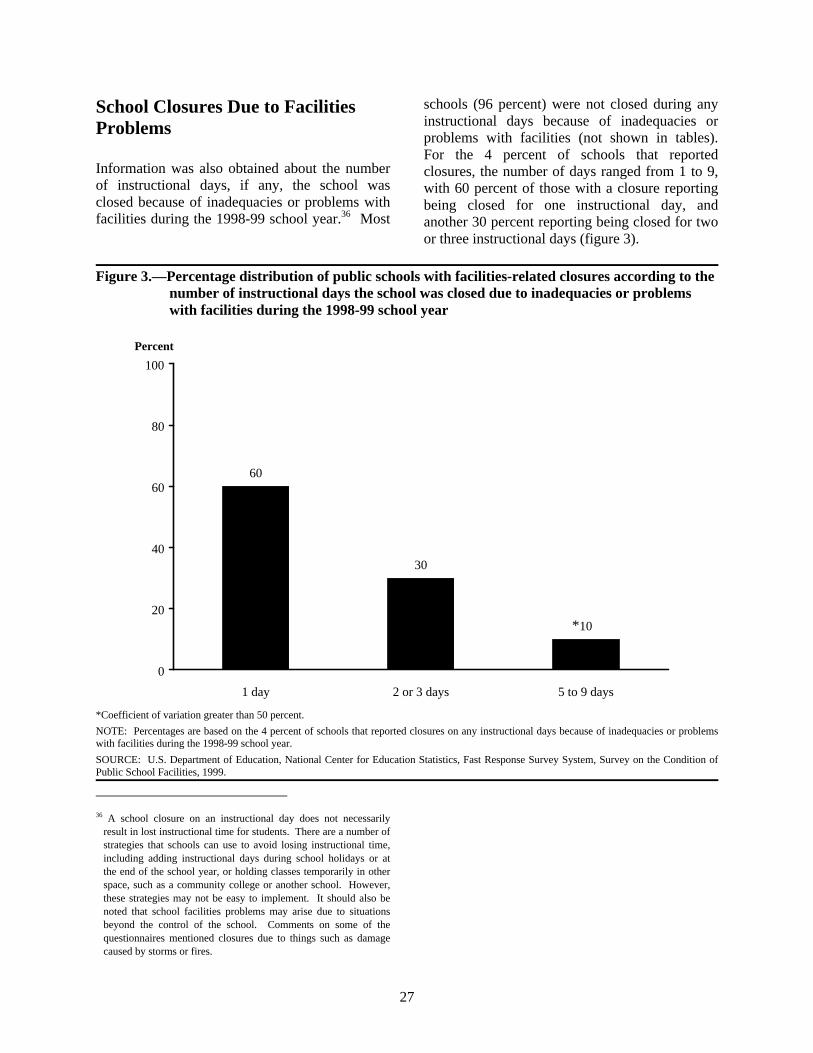
27
Percent
School Closures Due to FacilitiesProblems
Information was also obtained about the numberof instructional days, if any, the school wasclosed because of inadequacies or problems withfacilities during the 1998-99 school year.36 Most
36 A school closure on an instructional day does not necessarily
result in lost instructional time for students. There are a number ofstrategies that schools can use to avoid losing instructional time,including adding instructional days during school holidays or atthe end of the school year, or holding classes temporarily in otherspace, such as a community college or another school. However,these strategies may not be easy to implement. It should also benoted that school facilities problems may arise due to situationsbeyond the control of the school. Comments on some of thequestionnaires mentioned closures due to things such as damagecaused by storms or fires.
schools (96 percent) were not closed during anyinstructional days because of inadequacies orproblems with facilities (not shown in tables).For the 4 percent of schools that reportedclosures, the number of days ranged from 1 to 9,with 60 percent of those with a closure reportingbeing closed for one instructional day, andanother 30 percent reporting being closed for twoor three instructional days (figure 3).
Figure 3.—Percentage distribution of public schools with facilities-related closures according to thenumber of instructional days the school was closed due to inadequacies or problemswith facilities during the 1998-99 school year
*Coefficient of variation greater than 50 percent.
NOTE: Percentages are based on the 4 percent of schools that reported closures on any instructional days because of inadequacies or problemswith facilities during the 1998-99 school year.
SOURCE: U.S. Department of Education, National Center for Education Statistics, Fast Response Survey System, Survey on the Condition ofPublic School Facilities, 1999.
60
30
10
0
20
40
60
80
100
1 day 2 or 3 days 5 to 9 days
*

28
29
4. SCHOOL PLANS FORIMPROVEMENT
The previous chapters in this report portray thecondition of public schools in 1999. However,the condition of school facilities is continuouslychanging. For example, districts may build newschools or extensively renovate existing schools,as well as make repairs to existing schoolbuildings. Some of these activities occur as theyare needed, but many are scheduled in district orschool improvement plans. Conversely, main-tenance may be deferred and buildings in need ofrepair may fall further into disrepair. Examiningschool plans for construction, renovation, repair,and replacement in the next 2 years provides aglimpse of the expected condition of schoolfacilities in the near future.
Written Facilities Plans
One concrete indication of school planning forfacilities improvements is the presence of awritten long-range educational facilities plan. In1999, 65 percent of public schools had writtenlong-range facilities plans (table 12). This variedsomewhat by school enrollment size, locale, andregion. Large schools were more likely to reporthaving written facilities plans than were smallschools (71 percent versus 55 percent). Schoolsin central cities were more likely than schools inrural areas or small towns to have written long-range plans (70 percent versus 59 percent), andschools in the South were more likely thanschools in the Midwest to have such plans (68percent versus 56 percent). The apparentdifferences in the presence of a written facilitiesplan between schools in the Midwest and theNortheast and West is not statistically significant,partly due to the relatively large standard errorsfor these three estimates.
Plans for Construction
The survey asked whether schools planned tobuild new attached and/or detached permanentadditions in the next 2 years. Overall, 20 percentof schools indicated plans to build new permanentadditions in the next 2 years (table 13). Plans tobuild new permanent additions did not varysignificantly by school characteristics, except thatschools in urban fringe areas and large townswere more likely to report construction plans fornew additions than were schools located in ruralareas and small towns (25 percent compared with17 percent). Note that differences that appearlarge may not be statistically significant due torelatively large standard errors around theestimates, or because of the Bonferroniadjustment to the analyses.
The survey also asked if schools planned to installnew temporary buildings in the next 2 years.Overall, 10 percent of public schools indicatedthat they had such plans (table 13). This meansthat approximately 8,100 schools plan to installnew temporary buildings in the next 2 years (notshown in tables). School plans to install newtemporary buildings varied somewhat based uponschool size, locale, region, and minorityenrollment. Large schools were about three timesmore likely than medium or small schools toindicate plans to install new temporary buildings(18 percent versus 6 percent). Schools in urbanfringe areas and large towns were more likely toreport plans to install new temporary structuresthan were schools in rural areas and small towns(13 percent versus 7 percent). Schools located inthe South and West were more likely to reportplans to install new temporary buildings in thenext 2 years than were schools located in theNortheast and Midwest (12 percent and 21percent compared with 4 percent and 5 percent,respectively). Finally, schools with minorityenrollments of 21 to 50 percent and more
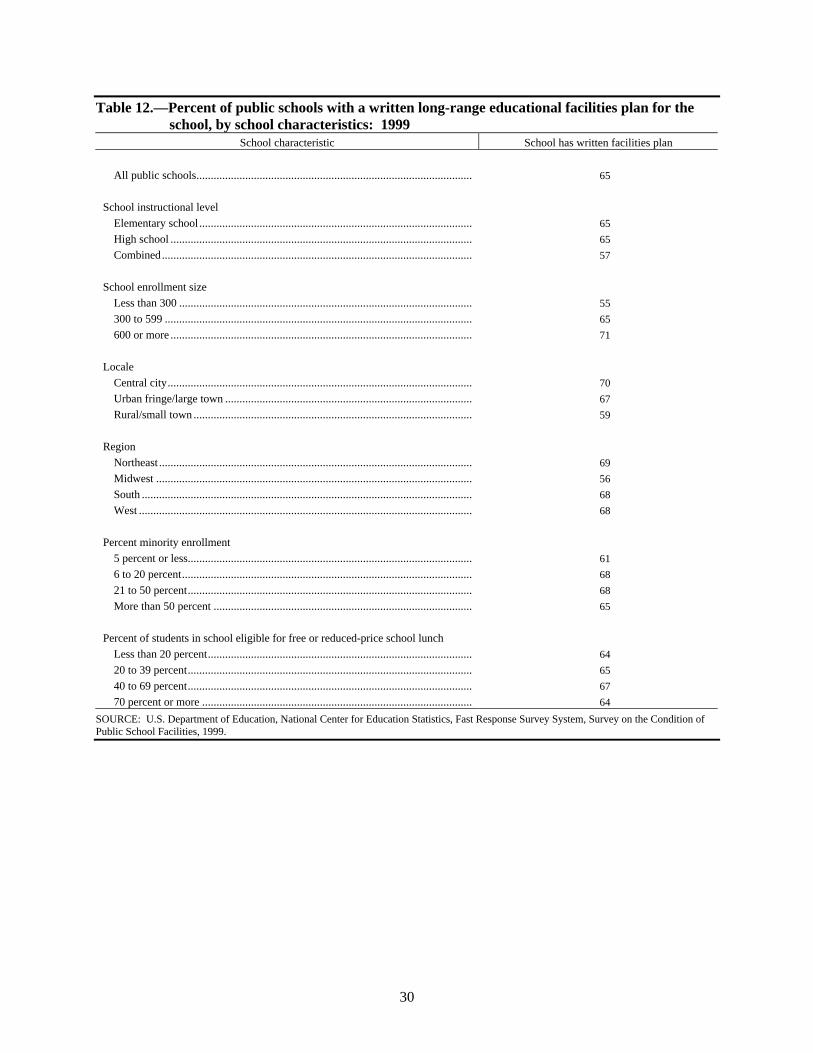
30
Table 12.—Percent of public schools with a written long-range educational facilities plan for theschool, by school characteristics: 1999
School characteristic School has written facilities plan
All public schools................................................................................................ 65
School instructional level
Elementary school ............................................................................................... 65
High school ......................................................................................................... 65
Combined............................................................................................................ 57
School enrollment size
Less than 300 ...................................................................................................... 55
300 to 599 ........................................................................................................... 65
600 or more ......................................................................................................... 71
Locale
Central city.......................................................................................................... 70
Urban fringe/large town ...................................................................................... 67
Rural/small town ................................................................................................. 59
Region
Northeast ............................................................................................................. 69
Midwest .............................................................................................................. 56
South ................................................................................................................... 68
West .................................................................................................................... 68
Percent minority enrollment
5 percent or less................................................................................................... 61
6 to 20 percent..................................................................................................... 68
21 to 50 percent................................................................................................... 68
More than 50 percent .......................................................................................... 65
Percent of students in school eligible for free or reduced-price school lunch
Less than 20 percent............................................................................................ 64
20 to 39 percent................................................................................................... 65
40 to 69 percent................................................................................................... 67
70 percent or more .............................................................................................. 64
SOURCE: U.S. Department of Education, National Center for Education Statistics, Fast Response Survey System, Survey on the Condition ofPublic School Facilities, 1999.
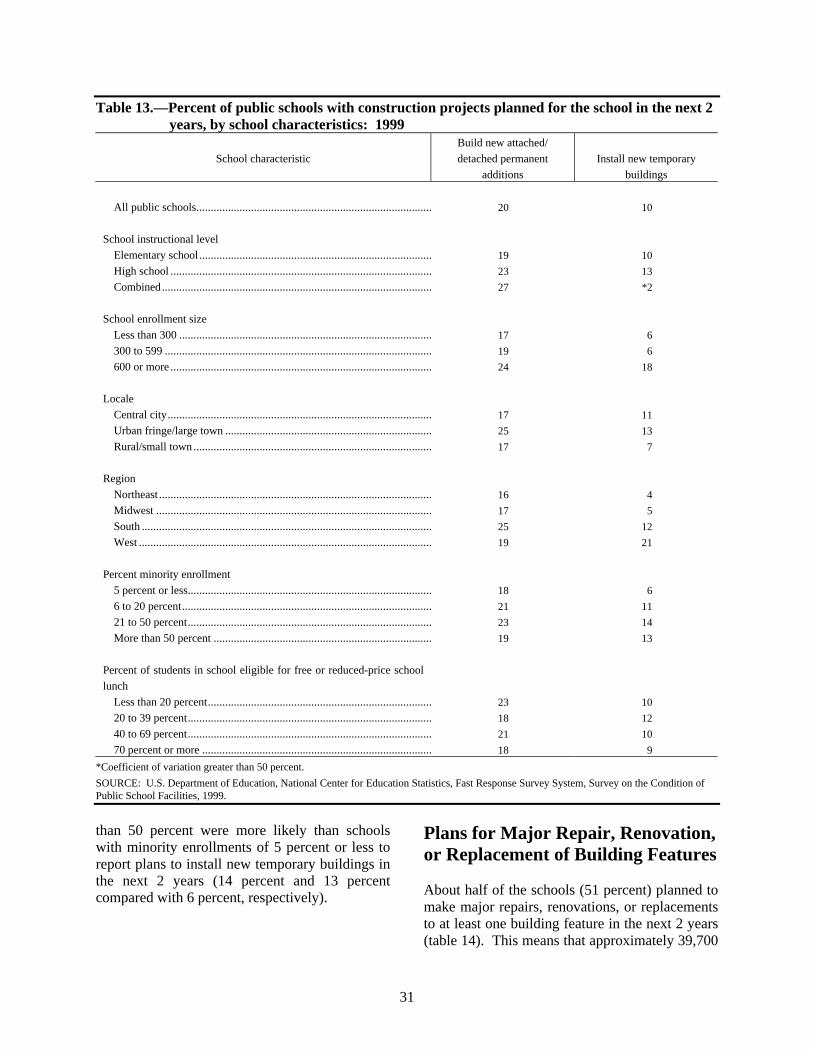
31
Table 13.—Percent of public schools with construction projects planned for the school in the next 2years, by school characteristics: 1999
School characteristic
Build new attached/
detached permanent
additions
Install new temporary
buildings
All public schools.................................................................................. 20 10
School instructional level
Elementary school ................................................................................. 19 10
High school ........................................................................................... 23 13
Combined.............................................................................................. 27 *2
School enrollment size
Less than 300 ........................................................................................ 17 6
300 to 599 ............................................................................................. 19 6
600 or more ........................................................................................... 24 18
Locale
Central city............................................................................................ 17 11
Urban fringe/large town ........................................................................ 25 13
Rural/small town ................................................................................... 17 7
Region
Northeast ............................................................................................... 16 4
Midwest ................................................................................................ 17 5
South ..................................................................................................... 25 12
West ...................................................................................................... 19 21
Percent minority enrollment
5 percent or less..................................................................................... 18 6
6 to 20 percent....................................................................................... 21 11
21 to 50 percent..................................................................................... 23 14
More than 50 percent ............................................................................ 19 13
Percent of students in school eligible for free or reduced-price school
lunch
Less than 20 percent.............................................................................. 23 10
20 to 39 percent..................................................................................... 18 12
40 to 69 percent..................................................................................... 21 10
70 percent or more ................................................................................ 18 9
*Coefficient of variation greater than 50 percent.
SOURCE: U.S. Department of Education, National Center for Education Statistics, Fast Response Survey System, Survey on the Condition ofPublic School Facilities, 1999.
than 50 percent were more likely than schoolswith minority enrollments of 5 percent or less toreport plans to install new temporary buildings inthe next 2 years (14 percent and 13 percentcompared with 6 percent, respectively).
Plans for Major Repair, Renovation,or Replacement of Building Features
About half of the schools (51 percent) planned tomake major repairs, renovations, or replacementsto at least one building feature in the next 2 years(table 14). This means that approximately 39,700
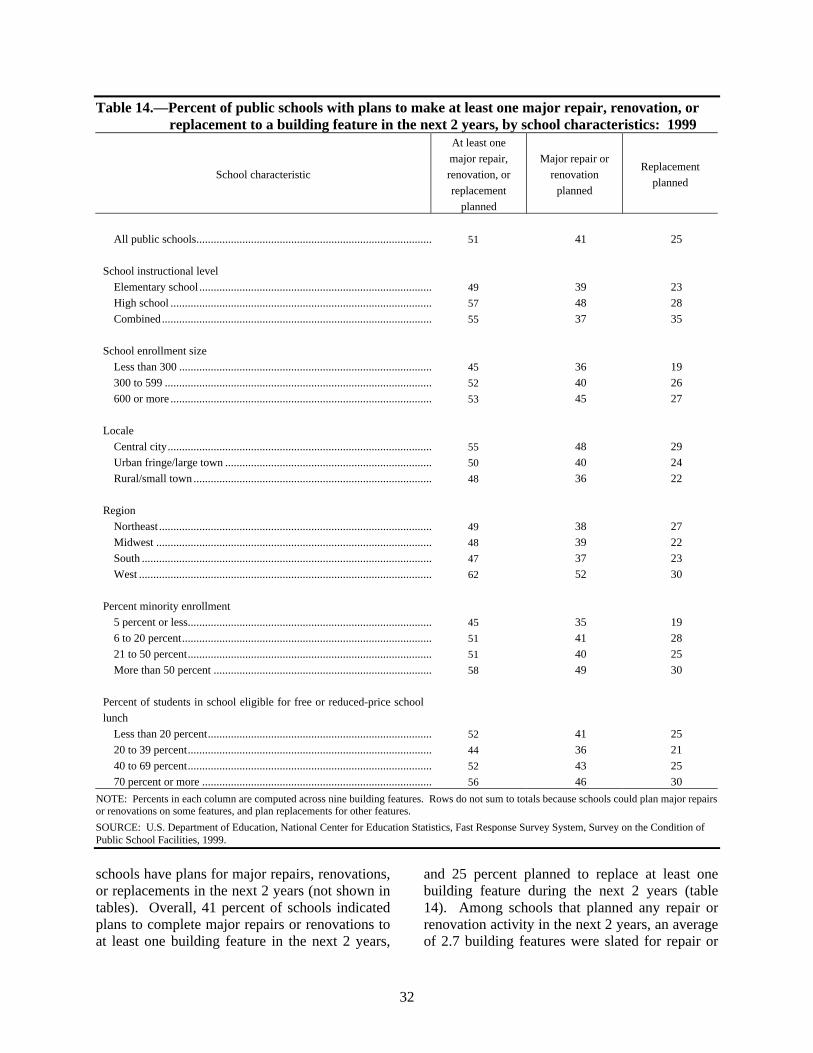
32
Table 14.—Percent of public schools with plans to make at least one major repair, renovation, orreplacement to a building feature in the next 2 years, by school characteristics: 1999
School characteristic
At least one
major repair,
renovation, or
replacement
planned
Major repair or
renovation
planned
Replacement
planned
All public schools.................................................................................. 51 41 25
School instructional level
Elementary school ................................................................................. 49 39 23
High school ........................................................................................... 57 48 28
Combined.............................................................................................. 55 37 35
School enrollment size
Less than 300 ........................................................................................ 45 36 19
300 to 599 ............................................................................................. 52 40 26
600 or more ........................................................................................... 53 45 27
Locale
Central city............................................................................................ 55 48 29
Urban fringe/large town ........................................................................ 50 40 24
Rural/small town ................................................................................... 48 36 22
Region
Northeast ............................................................................................... 49 38 27
Midwest ................................................................................................ 48 39 22
South ..................................................................................................... 47 37 23
West ...................................................................................................... 62 52 30
Percent minority enrollment
5 percent or less..................................................................................... 45 35 19
6 to 20 percent....................................................................................... 51 41 28
21 to 50 percent..................................................................................... 51 40 25
More than 50 percent ............................................................................ 58 49 30
Percent of students in school eligible for free or reduced-price school
lunch
Less than 20 percent.............................................................................. 52 41 25
20 to 39 percent..................................................................................... 44 36 21
40 to 69 percent..................................................................................... 52 43 25
70 percent or more ................................................................................ 56 46 30
NOTE: Percents in each column are computed across nine building features. Rows do not sum to totals because schools could plan major repairsor renovations on some features, and plan replacements for other features.
SOURCE: U.S. Department of Education, National Center for Education Statistics, Fast Response Survey System, Survey on the Condition ofPublic School Facilities, 1999.
schools have plans for major repairs, renovations,or replacements in the next 2 years (not shown intables). Overall, 41 percent of schools indicatedplans to complete major repairs or renovations toat least one building feature in the next 2 years,
and 25 percent planned to replace at least onebuilding feature during the next 2 years (table14). Among schools that planned any repair orrenovation activity in the next 2 years, an averageof 2.7 building features were slated for repair or
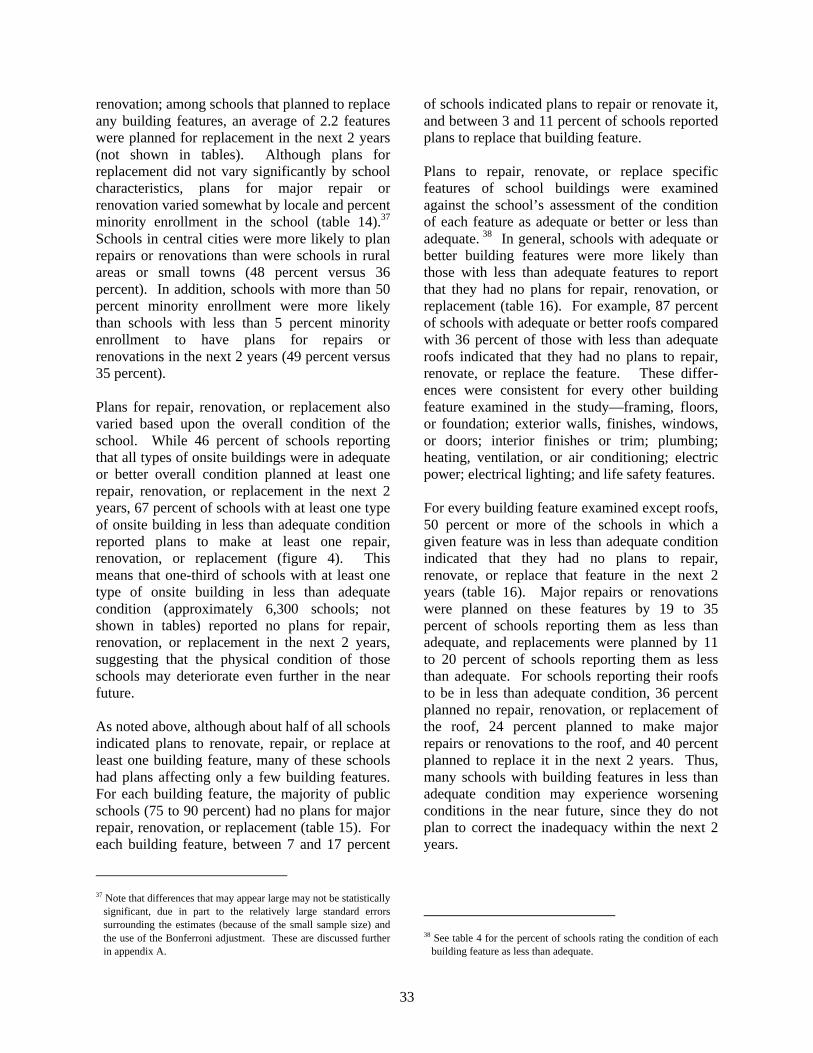
33
renovation; among schools that planned to replaceany building features, an average of 2.2 featureswere planned for replacement in the next 2 years(not shown in tables). Although plans forreplacement did not vary significantly by schoolcharacteristics, plans for major repair orrenovation varied somewhat by locale and percentminority enrollment in the school (table 14).37
Schools in central cities were more likely to planrepairs or renovations than were schools in ruralareas or small towns (48 percent versus 36percent). In addition, schools with more than 50percent minority enrollment were more likelythan schools with less than 5 percent minorityenrollment to have plans for repairs orrenovations in the next 2 years (49 percent versus35 percent).
Plans for repair, renovation, or replacement alsovaried based upon the overall condition of theschool. While 46 percent of schools reportingthat all types of onsite buildings were in adequateor better overall condition planned at least onerepair, renovation, or replacement in the next 2years, 67 percent of schools with at least one typeof onsite building in less than adequate conditionreported plans to make at least one repair,renovation, or replacement (figure 4). Thismeans that one-third of schools with at least onetype of onsite building in less than adequatecondition (approximately 6,300 schools; notshown in tables) reported no plans for repair,renovation, or replacement in the next 2 years,suggesting that the physical condition of thoseschools may deteriorate even further in the nearfuture.
As noted above, although about half of all schoolsindicated plans to renovate, repair, or replace atleast one building feature, many of these schoolshad plans affecting only a few building features.For each building feature, the majority of publicschools (75 to 90 percent) had no plans for majorrepair, renovation, or replacement (table 15). Foreach building feature, between 7 and 17 percent
37 Note that differences that may appear large may not be statistically
significant, due in part to the relatively large standard errorssurrounding the estimates (because of the small sample size) andthe use of the Bonferroni adjustment. These are discussed furtherin appendix A.
of schools indicated plans to repair or renovate it,and between 3 and 11 percent of schools reportedplans to replace that building feature.
Plans to repair, renovate, or replace specificfeatures of school buildings were examinedagainst the school’s assessment of the conditionof each feature as adequate or better or less thanadequate. 38 In general, schools with adequate orbetter building features were more likely thanthose with less than adequate features to reportthat they had no plans for repair, renovation, orreplacement (table 16). For example, 87 percentof schools with adequate or better roofs comparedwith 36 percent of those with less than adequateroofs indicated that they had no plans to repair,renovate, or replace the feature. These differ-ences were consistent for every other buildingfeature examined in the study—framing, floors,or foundation; exterior walls, finishes, windows,or doors; interior finishes or trim; plumbing;heating, ventilation, or air conditioning; electricpower; electrical lighting; and life safety features.
For every building feature examined except roofs,50 percent or more of the schools in which agiven feature was in less than adequate conditionindicated that they had no plans to repair,renovate, or replace that feature in the next 2years (table 16). Major repairs or renovationswere planned on these features by 19 to 35percent of schools reporting them as less thanadequate, and replacements were planned by 11to 20 percent of schools reporting them as lessthan adequate. For schools reporting their roofsto be in less than adequate condition, 36 percentplanned no repair, renovation, or replacement ofthe roof, 24 percent planned to make majorrepairs or renovations to the roof, and 40 percentplanned to replace it in the next 2 years. Thus,many schools with building features in less thanadequate condition may experience worseningconditions in the near future, since they do notplan to correct the inadequacy within the next 2years.
38 See table 4 for the percent of schools rating the condition of each
building feature as less than adequate.
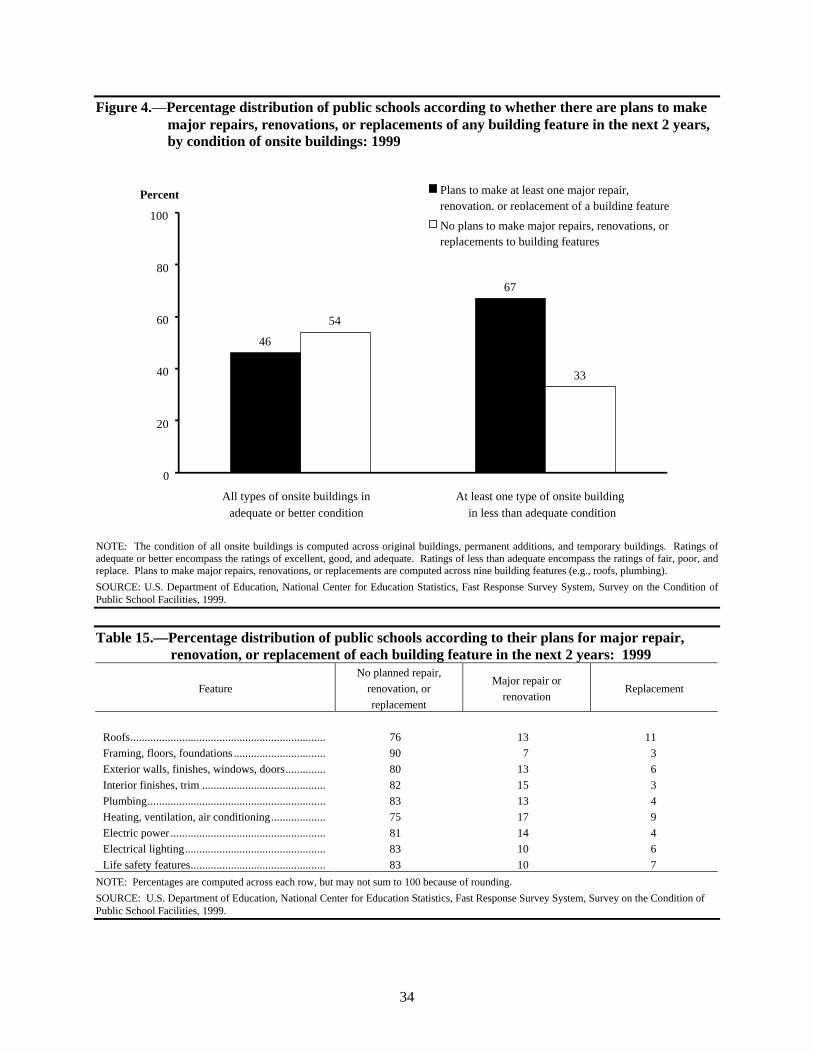
34
Figure 4.—Percentage distribution of public schools according to whether there are plans to makemajor repairs, renovations, or replacements of any building feature in the next 2 years,by condition of onsite buildings: 1999
NOTE: The condition of all onsite buildings is computed across original buildings, permanent additions, and temporary buildings. Ratings ofadequate or better encompass the ratings of excellent, good, and adequate. Ratings of less than adequate encompass the ratings of fair, poor, andreplace. Plans to make major repairs, renovations, or replacements are computed across nine building features (e.g., roofs, plumbing).
SOURCE: U.S. Department of Education, National Center for Education Statistics, Fast Response Survey System, Survey on the Condition ofPublic School Facilities, 1999.
Table 15.—Percentage distribution of public schools according to their plans for major repair,renovation, or replacement of each building feature in the next 2 years: 1999
Feature
No planned repair,
renovation, or
replacement
Major repair or
renovationReplacement
Roofs.................................................................... 76 13 11
Framing, floors, foundations ................................ 90 7 3
Exterior walls, finishes, windows, doors.............. 80 13 6
Interior finishes, trim ........................................... 82 15 3
Plumbing.............................................................. 83 13 4
Heating, ventilation, air conditioning................... 75 17 9
Electric power ...................................................... 81 14 4
Electrical lighting................................................. 83 10 6
Life safety features............................................... 83 10 7
NOTE: Percentages are computed across each row, but may not sum to 100 because of rounding.
SOURCE: U.S. Department of Education, National Center for Education Statistics, Fast Response Survey System, Survey on the Condition ofPublic School Facilities, 1999.
46
67
54
33
0
20
40
60
80
100
All types of onsite buildings inadequate or better condition
At least one type of onsite building in less than adequate condition
Percent Plans to make at least one major repair,renovation, or replacement of a building feature
No plans to make major repairs, renovations, orreplacements to building features
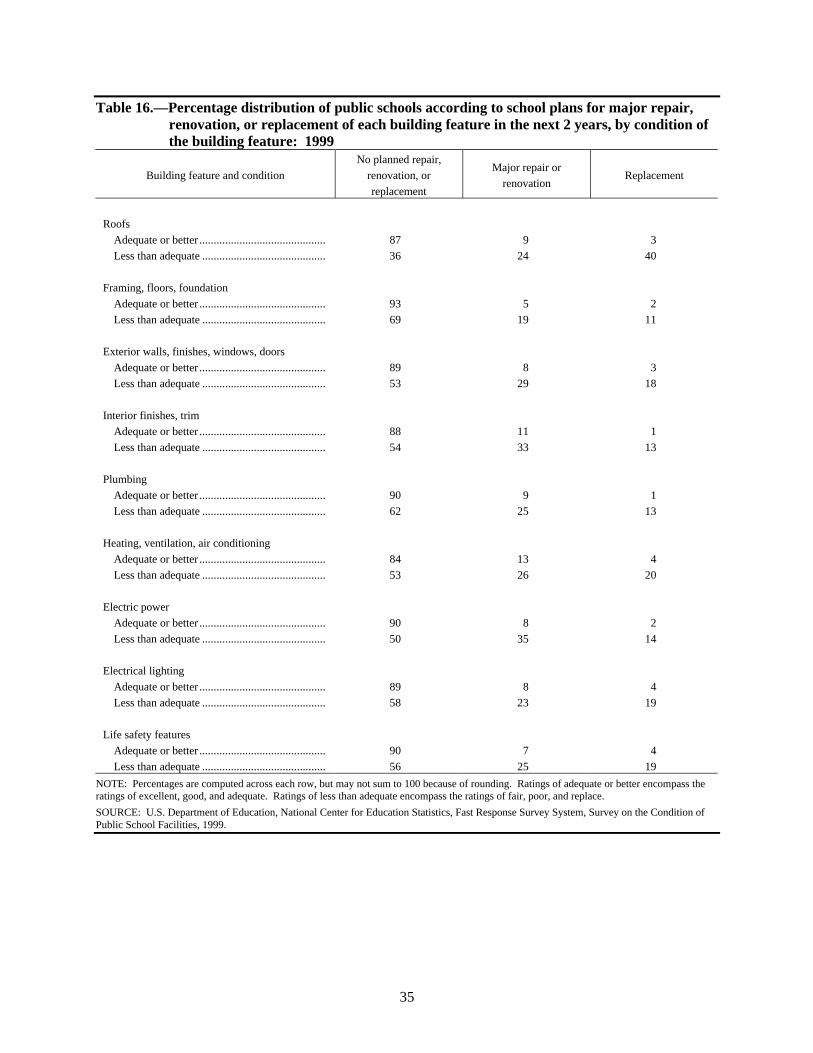
35
Table 16.—Percentage distribution of public schools according to school plans for major repair,renovation, or replacement of each building feature in the next 2 years, by condition ofthe building feature: 1999
Building feature and condition
No planned repair,
renovation, or
replacement
Major repair or
renovationReplacement
Roofs
Adequate or better ............................................ 87 9 3
Less than adequate ........................................... 36 24 40
Framing, floors, foundation
Adequate or better ............................................ 93 5 2
Less than adequate ........................................... 69 19 11
Exterior walls, finishes, windows, doors
Adequate or better ............................................ 89 8 3
Less than adequate ........................................... 53 29 18
Interior finishes, trim
Adequate or better ............................................ 88 11 1
Less than adequate ........................................... 54 33 13
Plumbing
Adequate or better ............................................ 90 9 1
Less than adequate ........................................... 62 25 13
Heating, ventilation, air conditioning
Adequate or better ............................................ 84 13 4
Less than adequate ........................................... 53 26 20
Electric power
Adequate or better ............................................ 90 8 2
Less than adequate ........................................... 50 35 14
Electrical lighting
Adequate or better ............................................ 89 8 4
Less than adequate ........................................... 58 23 19
Life safety features
Adequate or better ............................................ 90 7 4
Less than adequate ........................................... 56 25 19
NOTE: Percentages are computed across each row, but may not sum to 100 because of rounding. Ratings of adequate or better encompass theratings of excellent, good, and adequate. Ratings of less than adequate encompass the ratings of fair, poor, and replace.
SOURCE: U.S. Department of Education, National Center for Education Statistics, Fast Response Survey System, Survey on the Condition ofPublic School Facilities, 1999.

36
37
5. FUNCTIONAL AGE OF SCHOOLS:CONDITION AND PLANS FOR
IMPROVEMENT
The age of schools is frequently included indiscussions of the state of school facilities, eitheras a proxy for condition or as a partialexplanation. For example, older schools areoftentimes referred to as broken down or in needof repair, when in fact not all old schools are inthis condition. Additionally, schools that are inneed of repair are often referred to as showingtheir age, though in fact not all schools in need ofrepair are particularly old. In this chapter,information about the age of public schools ispresented. Age is then examined in the context ofschool condition and plans for repair, renovation,and replacement of building features.
Determining the Age of PublicSchools
Determining and describing the age of publicschools can be difficult. Many schools haveinstructional buildings that have been heavilyrenovated in the years since they were built. Forsuch schools, the year of their last renovation isoften a better index of the school's age than theyear of original construction. In describingschool age, therefore, consideration must be givento both the year of construction and year of mostrecent renovation for schools that have beenrenovated. GAO makes a similar point in theirdiscussion about building age, pointing out thatbuilding age, by itself, is not necessarily the mostsignificant factor in considering the condition ofschools, and that many older school buildingscontinue to have a useful life equivalent to a newbuilding if they are well maintained andperiodically renovated (U.S. GAO 1995b, 1996).
For this report, a measure of the functional age ofthe school is derived and then used to examine
the relationship between school age and thecondition of schools and plans for improvement.Functional age is based on the year of construc-tion of the main instructional building(s) forschools that have not experienced any majorrenovations since their original construction.However, for schools that have been renovatedsince their construction, the functional age isbased on the year of the most recent majorrenovation. In addition, information is presentedin this report about the age of the maininstructional buildings as measured in years sinceoriginal construction, and in years since the mostrecent renovation.
In 1999, the average age of the main instructionalbuilding(s) of public schools was 40 years, basedon years since original construction (table 17).Across all schools reporting a major renovationsince initial construction, the renovation hadoccurred on average 11 years ago. The averagefunctional age of schools, as defined above, was16 years. The average functional age of theschool varied by school enrollment, with smallschools on average older than medium or largeschools (20 years compared with 15 and 14 years,respectively).
In addition to examining the average age ofschools, schools can also be examined based uponthe distribution of schools across differentfunctional age groups (figure 5 and table 18).Overall, about one-third (32 percent) of publicschools had a functional age of less than 5 years,28 percent had a functional age of 5 to 14 years,26 percent had a functional age of 15 to 34 years,and 14 percent had a functional age of 35 years ormore. There was some variation in the functionalage distributions by school enrollment size andregion (table 18). Large schools were more likely
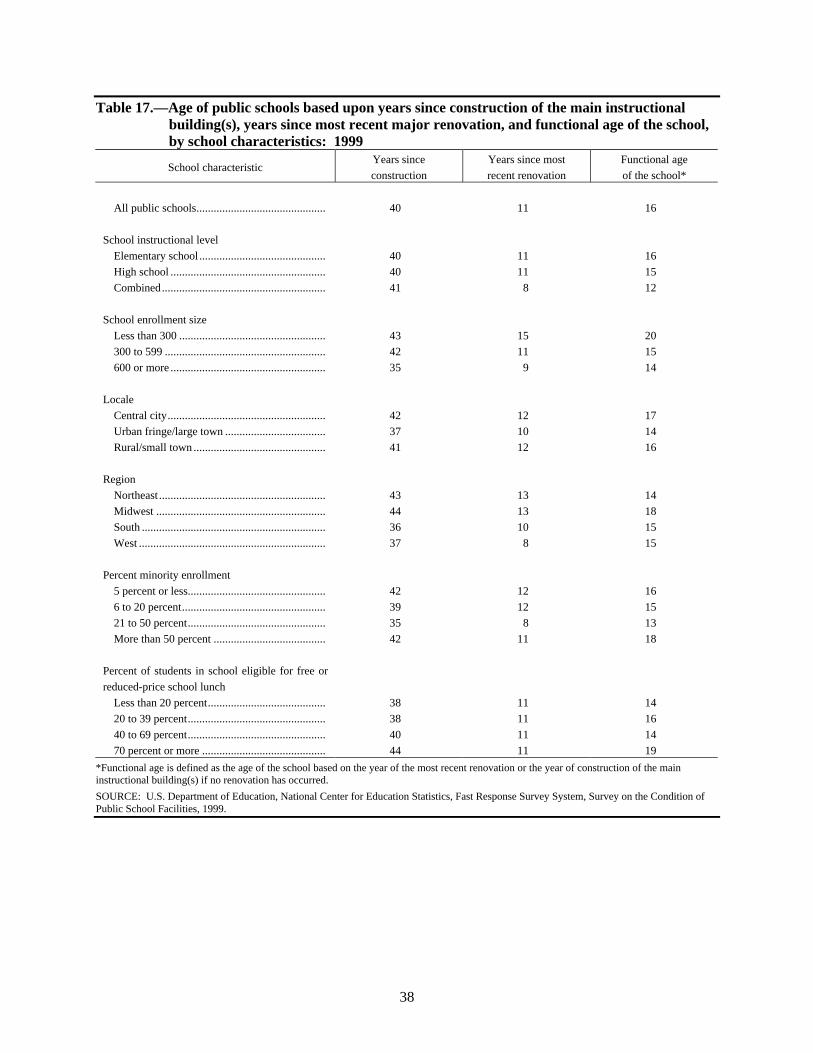
38
Table 17.—Age of public schools based upon years since construction of the main instructionalbuilding(s), years since most recent major renovation, and functional age of the school,by school characteristics: 1999
School characteristicYears since
construction
Years since most
recent renovation
Functional age
of the school*
All public schools............................................. 40 11 16
School instructional level
Elementary school ............................................ 40 11 16
High school ...................................................... 40 11 15
Combined......................................................... 41 8 12
School enrollment size
Less than 300 ................................................... 43 15 20
300 to 599 ........................................................ 42 11 15
600 or more ...................................................... 35 9 14
Locale
Central city....................................................... 42 12 17
Urban fringe/large town ................................... 37 10 14
Rural/small town .............................................. 41 12 16
Region
Northeast .......................................................... 43 13 14
Midwest ........................................................... 44 13 18
South ................................................................ 36 10 15
West ................................................................. 37 8 15
Percent minority enrollment
5 percent or less................................................ 42 12 16
6 to 20 percent.................................................. 39 12 15
21 to 50 percent................................................ 35 8 13
More than 50 percent ....................................... 42 11 18
Percent of students in school eligible for free or
reduced-price school lunch
Less than 20 percent......................................... 38 11 14
20 to 39 percent................................................ 38 11 16
40 to 69 percent................................................ 40 11 14
70 percent or more ........................................... 44 11 19
*Functional age is defined as the age of the school based on the year of the most recent renovation or the year of construction of the maininstructional building(s) if no renovation has occurred.
SOURCE: U.S. Department of Education, National Center for Education Statistics, Fast Response Survey System, Survey on the Condition ofPublic School Facilities, 1999.
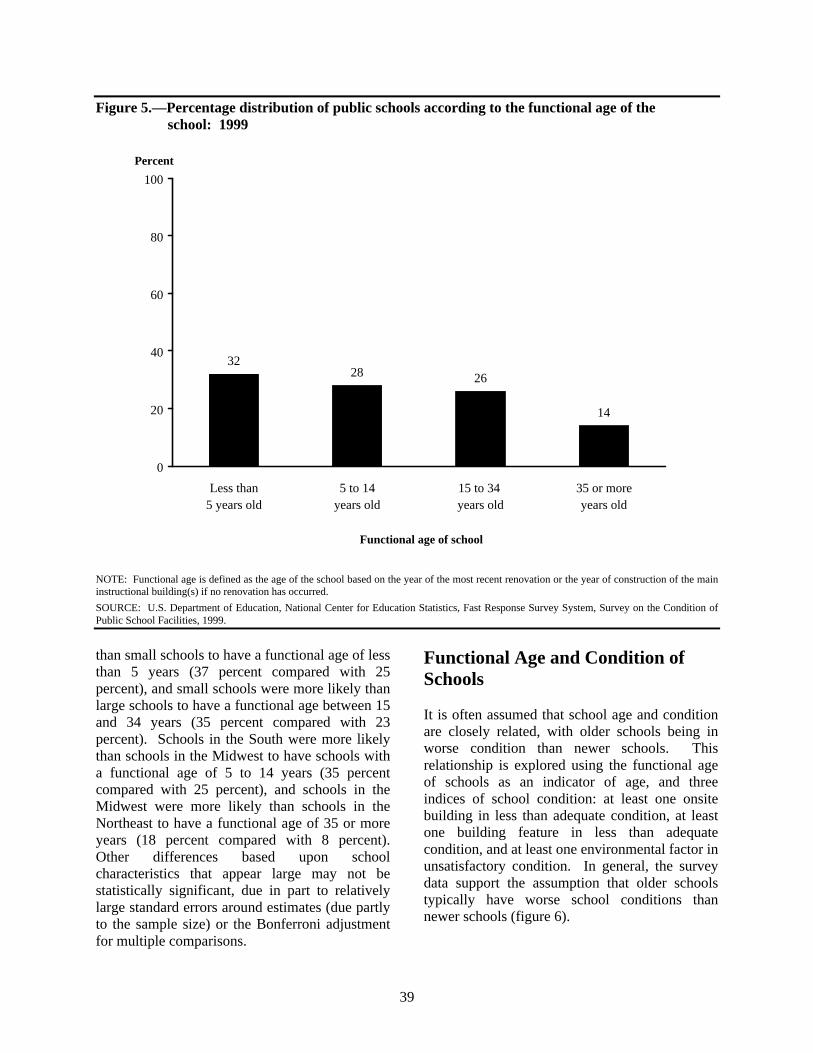
39
Percent
Figure 5.—Percentage distribution of public schools according to the functional age of theschool: 1999
NOTE: Functional age is defined as the age of the school based on the year of the most recent renovation or the year of construction of the maininstructional building(s) if no renovation has occurred.
SOURCE: U.S. Department of Education, National Center for Education Statistics, Fast Response Survey System, Survey on the Condition ofPublic School Facilities, 1999.
than small schools to have a functional age of lessthan 5 years (37 percent compared with 25percent), and small schools were more likely thanlarge schools to have a functional age between 15and 34 years (35 percent compared with 23percent). Schools in the South were more likelythan schools in the Midwest to have schools witha functional age of 5 to 14 years (35 percentcompared with 25 percent), and schools in theMidwest were more likely than schools in theNortheast to have a functional age of 35 or moreyears (18 percent compared with 8 percent).Other differences based upon schoolcharacteristics that appear large may not bestatistically significant, due in part to relativelylarge standard errors around estimates (due partlyto the sample size) or the Bonferroni adjustmentfor multiple comparisons.
Functional Age and Condition ofSchools
It is often assumed that school age and conditionare closely related, with older schools being inworse condition than newer schools. Thisrelationship is explored using the functional ageof schools as an indicator of age, and threeindices of school condition: at least one onsitebuilding in less than adequate condition, at leastone building feature in less than adequatecondition, and at least one environmental factor inunsatisfactory condition. In general, the surveydata support the assumption that older schoolstypically have worse school conditions thannewer schools (figure 6).
Functional age of school
3228 26
14
0
20
40
60
80
100
Less than5 years old
5 to 14years old
15 to 34 years old
35 or moreyears old
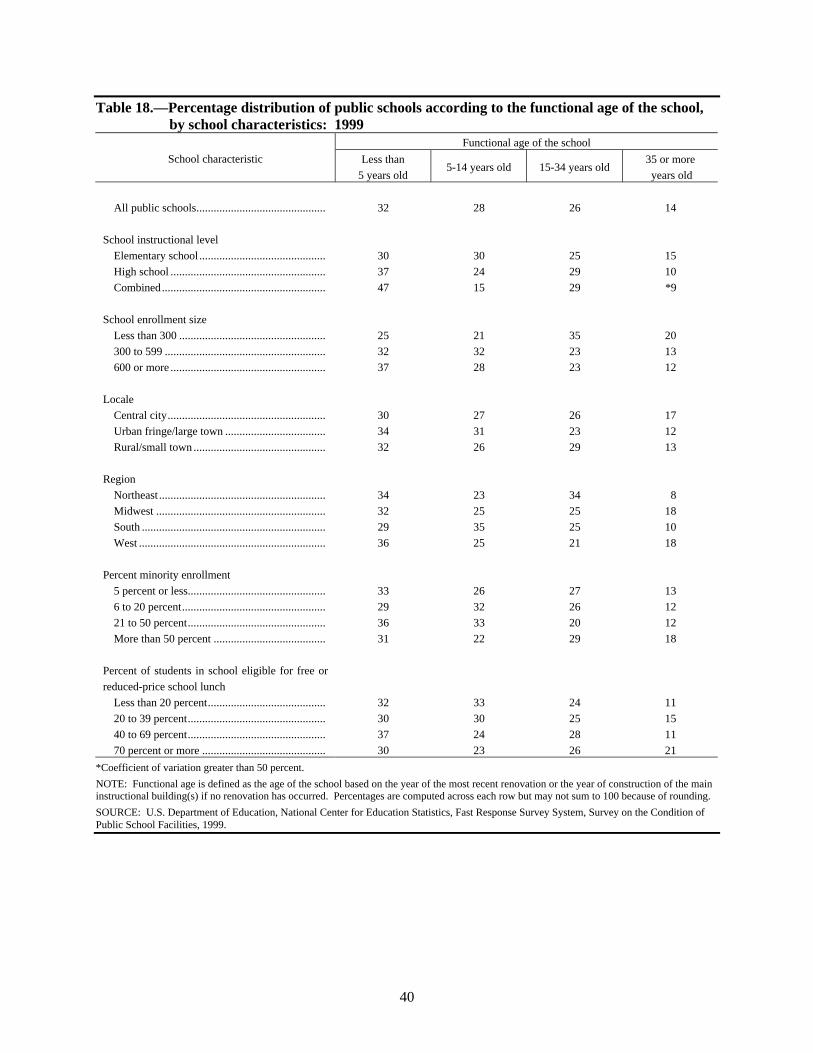
40
Table 18.—Percentage distribution of public schools according to the functional age of the school,by school characteristics: 1999
Functional age of the school
School characteristic Less than
5 years old5-14 years old 15-34 years old
35 or more
years old
All public schools............................................. 32 28 26 14
School instructional level
Elementary school ............................................ 30 30 25 15
High school ...................................................... 37 24 29 10
Combined......................................................... 47 15 29 *9
School enrollment size
Less than 300 ................................................... 25 21 35 20
300 to 599 ........................................................ 32 32 23 13
600 or more ...................................................... 37 28 23 12
Locale
Central city....................................................... 30 27 26 17
Urban fringe/large town ................................... 34 31 23 12
Rural/small town .............................................. 32 26 29 13
Region
Northeast .......................................................... 34 23 34 8
Midwest ........................................................... 32 25 25 18
South ................................................................ 29 35 25 10
West ................................................................. 36 25 21 18
Percent minority enrollment
5 percent or less................................................ 33 26 27 13
6 to 20 percent.................................................. 29 32 26 12
21 to 50 percent................................................ 36 33 20 12
More than 50 percent ....................................... 31 22 29 18
Percent of students in school eligible for free or
reduced-price school lunch
Less than 20 percent......................................... 32 33 24 11
20 to 39 percent................................................ 30 30 25 15
40 to 69 percent................................................ 37 24 28 11
70 percent or more ........................................... 30 23 26 21
*Coefficient of variation greater than 50 percent.
NOTE: Functional age is defined as the age of the school based on the year of the most recent renovation or the year of construction of the maininstructional building(s) if no renovation has occurred. Percentages are computed across each row but may not sum to 100 because of rounding.
SOURCE: U.S. Department of Education, National Center for Education Statistics, Fast Response Survey System, Survey on the Condition ofPublic School Facilities, 1999.
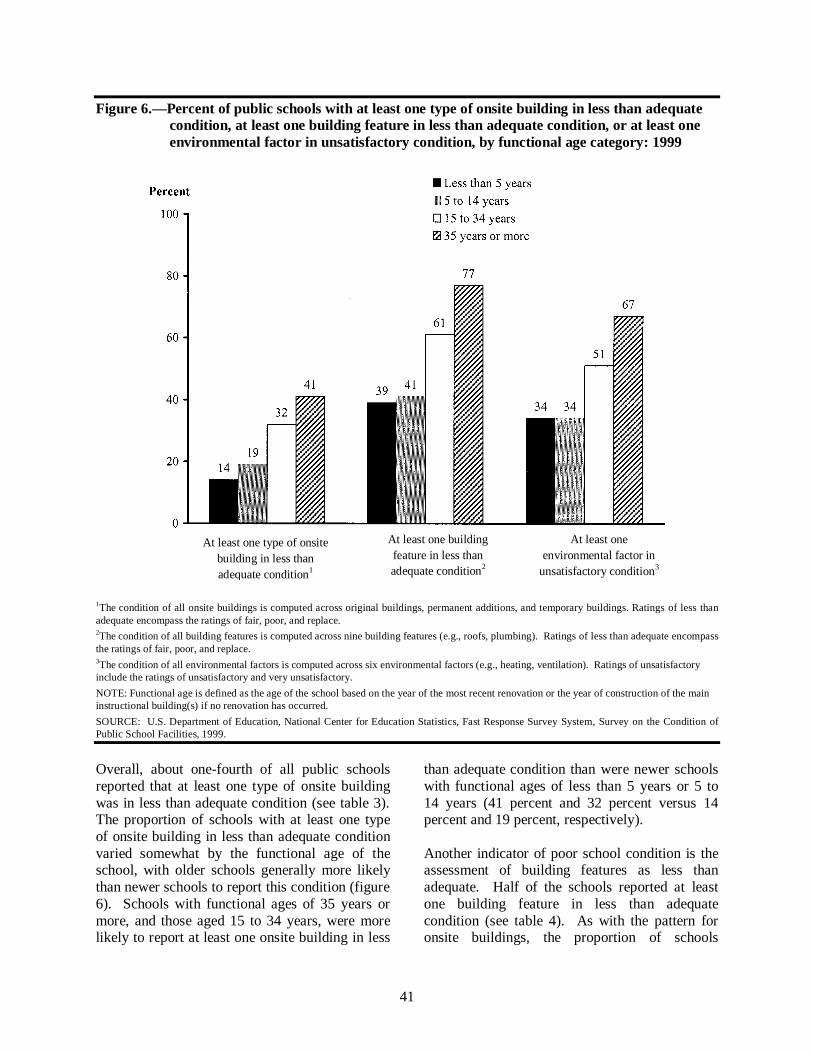
41
At least one buildingfeature in less thanadequate condition2
At least one type of onsitebuilding in less thanadequate condition1
At least oneenvironmental factor in
unsatisfactory condition3
Figure 6.—Percent of public schools with at least one type of onsite building in less than adequatecondition, at least one building feature in less than adequate condition, or at least oneenvironmental factor in unsatisfactory condition, by functional age category: 1999
1The condition of all onsite buildings is computed across original buildings, permanent additions, and temporary buildings. Ratings of less thanadequate encompass the ratings of fair, poor, and replace.2The condition of all building features is computed across nine building features (e.g., roofs, plumbing). Ratings of less than adequate encompassthe ratings of fair, poor, and replace.3The condition of all environmental factors is computed across six environmental factors (e.g., heating, ventilation). Ratings of unsatisfactoryinclude the ratings of unsatisfactory and very unsatisfactory.
NOTE: Functional age is defined as the age of the school based on the year of the most recent renovation or the year of construction of the maininstructional building(s) if no renovation has occurred.
SOURCE: U.S. Department of Education, National Center for Education Statistics, Fast Response Survey System, Survey on the Condition ofPublic School Facilities, 1999.
Overall, about one-fourth of all public schoolsreported that at least one type of onsite buildingwas in less than adequate condition (see table 3).The proportion of schools with at least one typeof onsite building in less than adequate conditionvaried somewhat by the functional age of theschool, with older schools generally more likelythan newer schools to report this condition (figure6). Schools with functional ages of 35 years ormore, and those aged 15 to 34 years, were morelikely to report at least one onsite building in less
than adequate condition than were newer schoolswith functional ages of less than 5 years or 5 to14 years (41 percent and 32 percent versus 14percent and 19 percent, respectively).
Another indicator of poor school condition is theassessment of building features as less thanadequate. Half of the schools reported at leastone building feature in less than adequatecondition (see table 4). As with the pattern foronsite buildings, the proportion of schools
42
indicating less than adequate condition for at leastone building feature varied somewhat by thefunctional age of the school, with older schoolsgenerally more likely than newer schools toreport this condition (figure 6). About three-fourths (77 percent) of schools with functionalages of 35 years or more, and 61 percent ofschools aged 15 to 34 years, indicated less thanadequate condition for at least one buildingfeature, compared with 41 percent for schoolswith functional ages of 5 to 14 years and 39percent for those aged less than 5 years.
The final indicator of school condition used inthis report is satisfaction with the condition of sixenvironmental factors. Forty-three percent of theschools reported that at least one environmentalfactor was unsatisfactory (see table 8).39 Theproportion of schools reporting at least oneunsatisfactory environmental factor differedsomewhat by the school’s functional age, witholder schools generally more likely to report thiscondition than newer schools (figure 6). Abouttwo-thirds of the schools aged 35 years or more,and about half of the schools aged 15 to 34 years,reported at least one unsatisfactory environmentalfactor, compared with 34 percent each for schoolswith functional ages of less than 5 years or from 5to 14 years.
Functional Age and Plans forRepair, Renovation, andReplacement
As schools age, they often require repairs orrenovations. Overall, about half (51 percent) ofall public schools planned at least one majorrepair, renovation, or replacement of a buildingfeature in the next 2 years (see table 14). Inaddition, as schools age, more effort may beinvested in maintaining them (of course, somedistricts may opt to replace rather than maintainan aging school). Thus, the functional age ofschools might be expected to make a difference towhether schools have plans for a major repair,
39 While condition of buildings and building features are reported as
less than adequate, the environmental factors are reported asunsatisfactory.
renovation, or replacement of building features inthe near future. This idea is partially supportedby the survey data (figure 7). Schools with afunctional age of 15 to 34 years were more likelyto report that they had plans for at least one majorrepair, renovation, or replacement of a buildingfeature than were newer schools with functionalages of less than 5 years or 5 to 14 years (61percent versus 49 percent and 40 percent,respectively). However, the oldest schools (witha functional age of 35 years or more) did notdiffer statistically from schools with functionalages of less than 5 years or 15 to 34 years inreporting plans for at least one major repair,renovation, or replacement of a building feature.
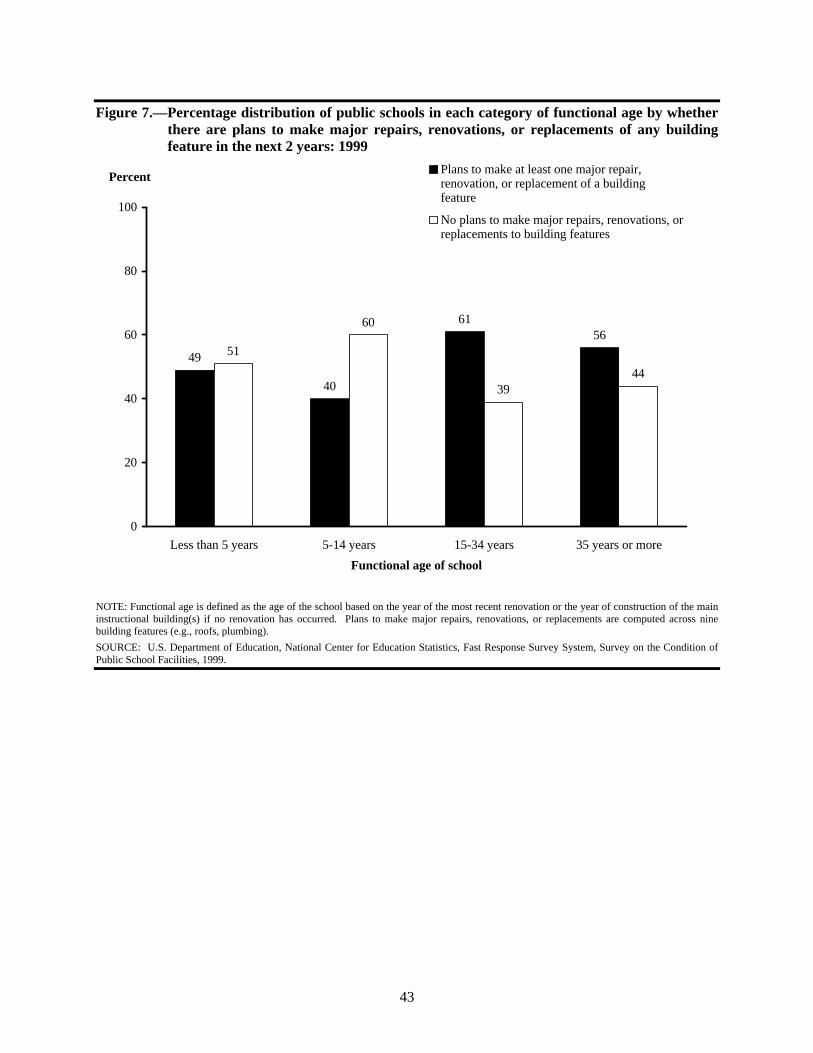
43
Figure 7.—Percentage distribution of public schools in each category of functional age by whetherthere are plans to make major repairs, renovations, or replacements of any buildingfeature in the next 2 years: 1999
49
40
6156
51
60
3944
0
20
40
60
80
100
Less than 5 years 5-14 years 15-34 years 35 years or more
Functional age of school
PercentPlans to make at least one major repair,renovation, or replacement of a buildingfeature
No plans to make major repairs, renovations, orreplacements to building features
NOTE: Functional age is defined as the age of the school based on the year of the most recent renovation or the year of construction of the maininstructional building(s) if no renovation has occurred. Plans to make major repairs, renovations, or replacements are computed across ninebuilding features (e.g., roofs, plumbing).
SOURCE: U.S. Department of Education, National Center for Education Statistics, Fast Response Survey System, Survey on the Condition ofPublic School Facilities, 1999.

44
45
6. OVERCROWDING
Overcrowding occurs when the number ofstudents enrolled in the school is larger than thenumber of students the school is designed toaccommodate. When overcrowding occurs, itmay contribute to the wear and tear on schools.This chapter provides information about theextent of overcrowding in public schools and therelationship between overcrowding and schoolcondition. Information is also provided aboutschools' uses of various scheduling and spacepractices that are sometimes used to reduceovercrowding within the school.
Extent of Overcrowding
One estimate of overcrowding is the degree towhich school enrollments exceed the number ofstudents the school is designed to accommodate.40
The survey asked for the number of studentsenrolled in the school and the number of studentsthe school was designed to serve, excluding spaceprovided by portables and other temporaryinstructional space.41 Using these two numbers, aproportion was calculated indicating the degree towhich enrollment exceeds the capacity of the 40 Although overcrowding in schools is a frequent topic of
discussion, particularly in the popular press, there have been nosystematic and universally accepted measures of overcrowding. Inthe 1994 study, GAO attempted to measure overcrowding bycollecting information about the number and total square feet ofspace in original buildings, permanent additions, and temporarybuildings. GAO did not consider this attempt successful, and thedata from these measures were not included in any of their reports.In a search of the overcrowding literature, we found that mostmeasures consisted of subjective, self-report questions, such as “Isthis school overcrowded?” For this study, we developed ameasure based on the ratio of actual enrollment to buildingcapacity.
41 The measure excluded capacity provided by temporary buildingsand other temporary instructional space because these are oftenused to provide additional capacity for the school whenovercrowding occurs. Including temporary buildings andinstructional space would have obscured overcrowding at schoolsthat use these to provide additional capacity for the school whenthe school enrollment exceeds the capacity of the permanentbuildings and space. This decision was made during the surveydevelopment process in consultation with GAO staff who hadworked on the 1994 study.
permanent buildings and instructional space usingthe following formula:
X= [(total student enrollment) – (capacityof permanent instructional buildingsand space)] / (capacity of permanentinstructional buildings and space).
Using this formula, schools with enrollmentswithin 5 percent of the capacity of the permanentinstructional buildings and space were consideredneither underenrolled nor overcrowded.42 Whenthe value of the proportion was greater than 5percent and negative, student enrollment wasconsidered less than the building's capacity, andthe school was considered underenrolled. Whenthe value of the proportion was over 5 percentand positive, the enrollment exceeded thebuilding's capacity, and the school wasconsidered overcrowded (or overenrolled). Thedegree of underenrollment or overcrowding wasindicated by the magnitude of the absolute valueof the ratio.
Overall, about one-quarter (26 percent) of publicschools had enrollments within 5 percent of thecapacity of their permanent instructionalbuildings and space (figure 8 and table 19). One-third (33 percent) of schools had enrollments thatwere 6 to 25 percent below their capacity, and 19percent of schools had enrollments that weremore than 25 percent below their capacity. At theother end of the spectrum, approximately 14percent of schools had enrollments that were 6 to25 percent greater than the capacity of theirpermanent instructional buildings and space, and8 percent had enrollments that exceeded theirpermanent capacity by more than 25 percent.Thus, approximately half of schools wereunderenrolled, about a quarter were near their
42 An interval was used rather than an exact point estimate match to
indicate whether a school was underenrolled or overcrowded, sinceenrollment always fluctuates slightly at schools, and a smallproportion of students above the building's capacity would beunlikely to severely strain the capacity of the school.
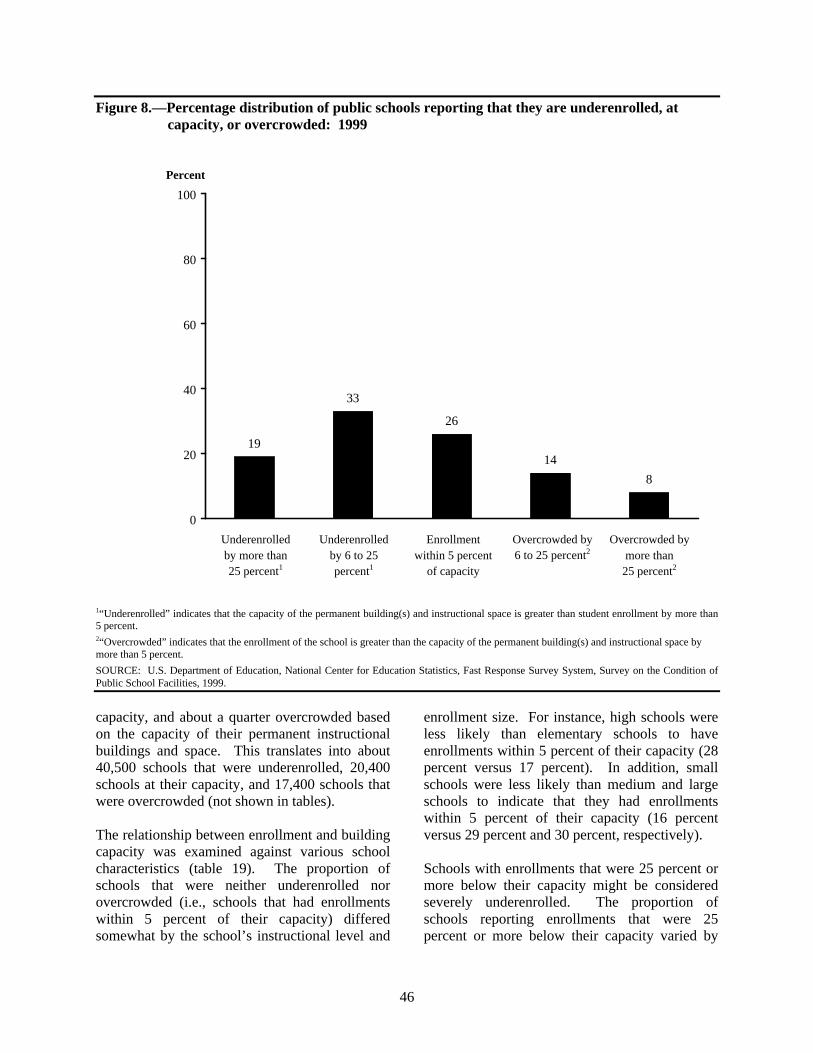
46
Figure 8.—Percentage distribution of public schools reporting that they are underenrolled, atcapacity, or overcrowded: 1999
1“Underenrolled” indicates that the capacity of the permanent building(s) and instructional space is greater than student enrollment by more than5 percent.2“Overcrowded” indicates that the enrollment of the school is greater than the capacity of the permanent building(s) and instructional space bymore than 5 percent.
SOURCE: U.S. Department of Education, National Center for Education Statistics, Fast Response Survey System, Survey on the Condition ofPublic School Facilities, 1999.
capacity, and about a quarter overcrowded basedon the capacity of their permanent instructionalbuildings and space. This translates into about40,500 schools that were underenrolled, 20,400schools at their capacity, and 17,400 schools thatwere overcrowded (not shown in tables).
The relationship between enrollment and buildingcapacity was examined against various schoolcharacteristics (table 19). The proportion ofschools that were neither underenrolled norovercrowded (i.e., schools that had enrollmentswithin 5 percent of their capacity) differedsomewhat by the school’s instructional level and
enrollment size. For instance, high schools wereless likely than elementary schools to haveenrollments within 5 percent of their capacity (28percent versus 17 percent). In addition, smallschools were less likely than medium and largeschools to indicate that they had enrollmentswithin 5 percent of their capacity (16 percentversus 29 percent and 30 percent, respectively).
Schools with enrollments that were 25 percent ormore below their capacity might be consideredseverely underenrolled. The proportion ofschools reporting enrollments that were 25percent or more below their capacity varied by
Percent
Underenrolledby more than25 percent1
Underenrolledby 6 to 25percent1
Enrollmentwithin 5 percent
of capacity
Overcrowded by6 to 25 percent2
Overcrowded bymore than
25 percent2
19
33
26
14
8
0
20
40
60
80
100
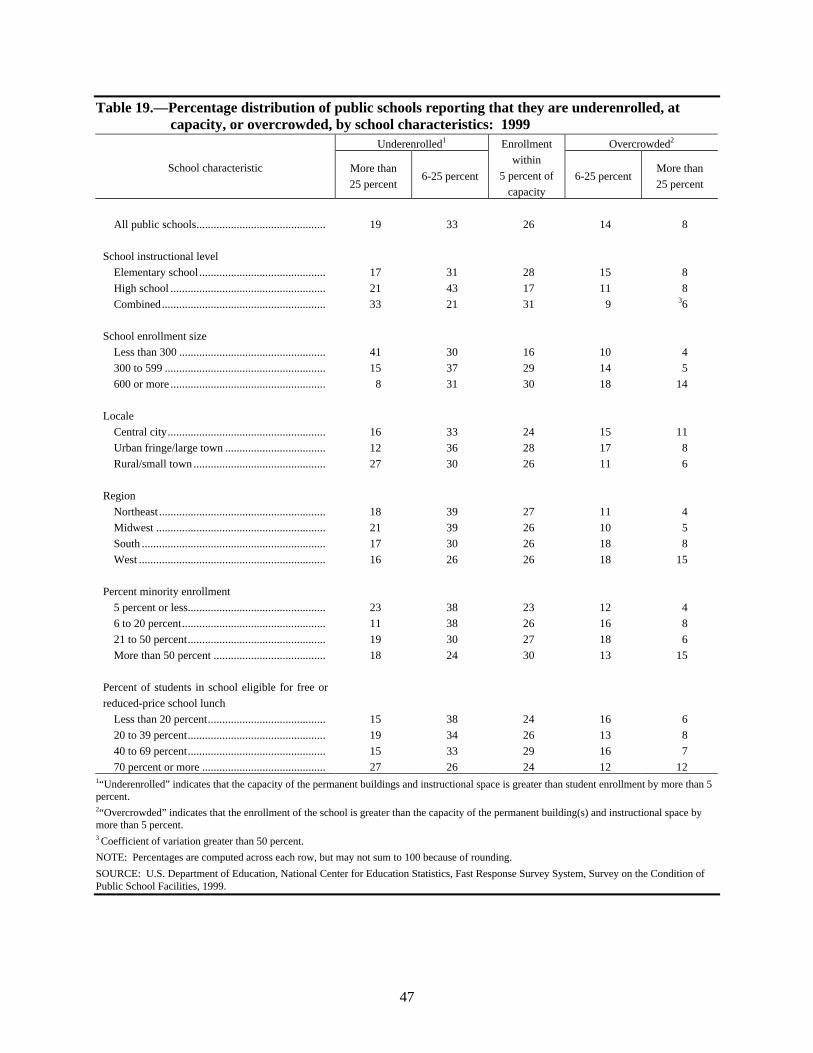
47
Table 19.—Percentage distribution of public schools reporting that they are underenrolled, atcapacity, or overcrowded, by school characteristics: 1999
Underenrolled1 Overcrowded2
School characteristic More than
25 percent6-25 percent
Enrollment
within
5 percent of
capacity6-25 percent
More than
25 percent
All public schools............................................. 19 33 26 14 8
School instructional level
Elementary school ............................................ 17 31 28 15 8
High school ...................................................... 21 43 17 11 8
Combined......................................................... 33 21 31 9 36
School enrollment size
Less than 300 ................................................... 41 30 16 10 4
300 to 599 ........................................................ 15 37 29 14 5
600 or more ...................................................... 8 31 30 18 14
Locale
Central city....................................................... 16 33 24 15 11
Urban fringe/large town ................................... 12 36 28 17 8
Rural/small town .............................................. 27 30 26 11 6
Region
Northeast .......................................................... 18 39 27 11 4
Midwest ........................................................... 21 39 26 10 5
South ................................................................ 17 30 26 18 8
West ................................................................. 16 26 26 18 15
Percent minority enrollment
5 percent or less................................................ 23 38 23 12 4
6 to 20 percent.................................................. 11 38 26 16 8
21 to 50 percent................................................ 19 30 27 18 6
More than 50 percent ....................................... 18 24 30 13 15
Percent of students in school eligible for free or
reduced-price school lunch
Less than 20 percent......................................... 15 38 24 16 6
20 to 39 percent................................................ 19 34 26 13 8
40 to 69 percent................................................ 15 33 29 16 7
70 percent or more ........................................... 27 26 24 12 121“Underenrolled” indicates that the capacity of the permanent buildings and instructional space is greater than student enrollment by more than 5percent.2“Overcrowded” indicates that the enrollment of the school is greater than the capacity of the permanent building(s) and instructional space bymore than 5 percent.3 Coefficient of variation greater than 50 percent.
NOTE: Percentages are computed across each row, but may not sum to 100 because of rounding.
SOURCE: U.S. Department of Education, National Center for Education Statistics, Fast Response Survey System, Survey on the Condition ofPublic School Facilities, 1999.
48
enrollment size, with the likelihood of beingseverely underenrolled decreasing with theschool’s enrollment size (table 19). In addition,schools located in rural areas or small towns weremore likely than those in central cities and urbanfringe areas or large towns to be underenrolled bymore than 25 percent of their capacity (27 percentversus 16 percent and 12 percent, respectively). 43
The proportion of schools experiencing severeovercrowding (i.e., where enrollments exceededcapacity by more than 25 percent) differedsomewhat by enrollment size, geographic region,and percent minority enrollment in the school(table 19).44 Large schools were more likely thansmall and medium schools to be overcrowded bymore than 25 percent of their capacity (14 percentversus 4 percent and 5 percent, respectively).Similarly, schools in the West were more likelythan those in the Northeast or Midwest to beseverely overcrowded (15 percent versus 4percent and 5 percent, respectively). In addition,schools with more than 50 percent minorityenrollment were more likely to report beingseverely overcrowded than were schools with 21to 50 percent minority enrollment and those with5 percent or less minority enrollment (15 percentversus 6 percent and 4 percent, respectively).
Together these data suggest that the majority ofschools are either underenrolled or within 5percent of their permanent capacity. Schoolovercrowding, when it occurs, is present acrossall school characteristics, but more severeovercrowding (i.e., enrollments exceeding capa-city by more than 25 percent) is more evidentamong schools with particular characteristics (seeabove). While potential reasons for thisovercrowding were not explored in the survey,changes in public school enrollment growth maycontribute to overcrowding. According to a 1999
43 Note that differences that may appear large may not be statistically
significant, due in part to the relatively large standard errorssurrounding the estimates (because of the small sample size) andthe use of the Bonferroni adjustment. These are discussed furtherin appendix A.
44 Some of the differences that may appear large may not bestatistically significant due to the relatively large standard errorssurrounding the estimates (in part because of the small samplesize) and the use of the Bonferroni adjustment. See appendix Afor a more detailed discussion.
report by the U.S. Department of Education(1999a), the West and the South led the nation inschool enrollment growth, and cities and suburbsboth experienced substantial school enrollmentgrowth in the last 10 years. Enrollment growth inthe West was particularly notable, increasing 26percent from 1989 to 1999. During this timeperiod, public school enrollment grew by 16percent in the South, 14 percent in the Northeast,and 10 percent in the Midwest.
Overcrowding and School Condition
The work of Kozol (1991) and others suggeststhat in some public schools, overcrowding andcrumbling buildings go hand in hand. Accordingto this view, schools overburdened by too manystudents are likely to experience more wear andtear to their facilities. To examine therelationship between overcrowding and schoolcondition, schools in this study were classified asbeing underenrolled, within 5 percent of theircapacity, or overcrowded.
As noted earlier, 24 percent of all public schoolsreported at least one type of onsite building to bein less than adequate condition (see table 3). Thispercentage varied based upon the relationshipbetween enrollment and capacity within theschool (figure 9). Schools that were overcrowdedwere about twice as likely as schools that wereunderenrolled or within 5 percent of theircapacity to indicate that they have at least onetype of onsite building in less than adequatecondition (43 percent versus 18 percent and 19percent, respectively). Similarly, while 50percent of all schools reported that at least onebuilding feature was in less than adequatecondition (see table 4), this percentage variedbased upon the relationship between enrollmentand capacity within each school (figure 9).Schools that were overcrowded were more likelythan schools that were either underenrolled orwithin 5 percent of their capacity to have at leastone building feature in less than adequatecondition (61 percent versus 47 percent and 48percent, respectively). Finally, while 43 percentof all schools indicated that they had at least oneenvironmental factor that was unsatisfactory (see
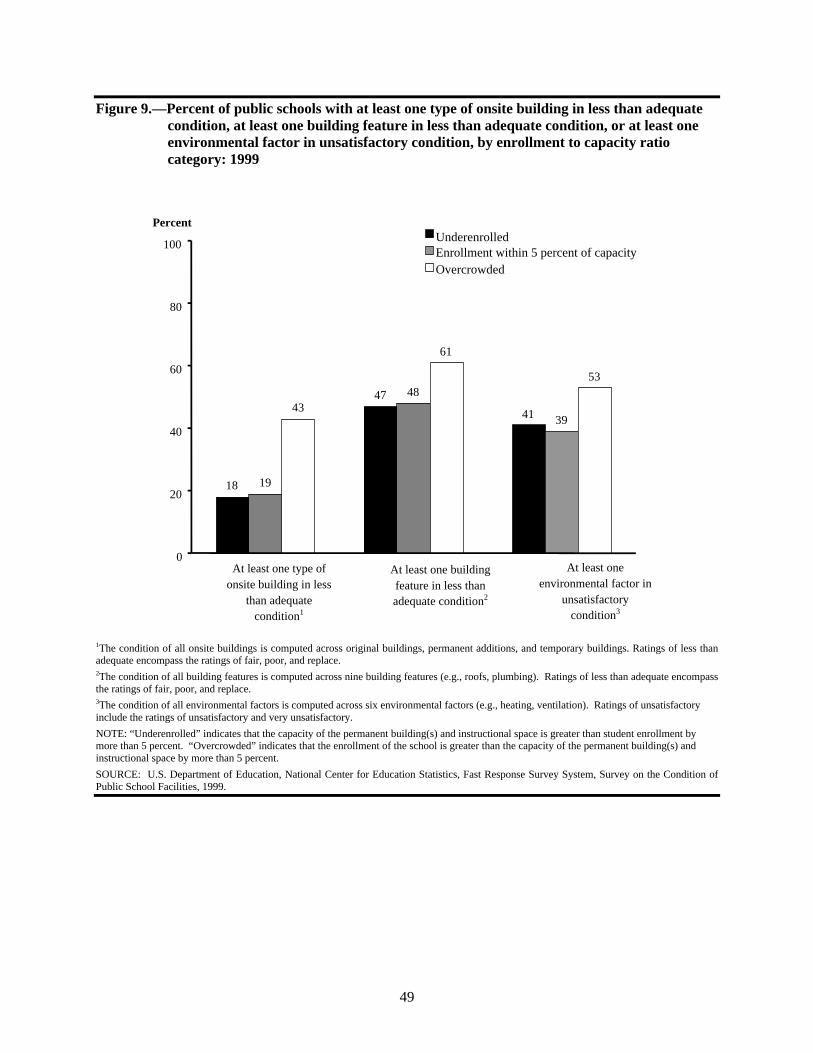
49
Figure 9.—Percent of public schools with at least one type of onsite building in less than adequatecondition, at least one building feature in less than adequate condition, or at least oneenvironmental factor in unsatisfactory condition, by enrollment to capacity ratiocategory: 1999
1The condition of all onsite buildings is computed across original buildings, permanent additions, and temporary buildings. Ratings of less thanadequate encompass the ratings of fair, poor, and replace.2The condition of all building features is computed across nine building features (e.g., roofs, plumbing). Ratings of less than adequate encompassthe ratings of fair, poor, and replace.3The condition of all environmental factors is computed across six environmental factors (e.g., heating, ventilation). Ratings of unsatisfactoryinclude the ratings of unsatisfactory and very unsatisfactory.
NOTE: “Underenrolled” indicates that the capacity of the permanent building(s) and instructional space is greater than student enrollment bymore than 5 percent. “Overcrowded” indicates that the enrollment of the school is greater than the capacity of the permanent building(s) andinstructional space by more than 5 percent.
SOURCE: U.S. Department of Education, National Center for Education Statistics, Fast Response Survey System, Survey on the Condition ofPublic School Facilities, 1999.
At least one type ofonsite building in less
than adequatecondition1
At least one buildingfeature in less thanadequate condition2
At least oneenvironmental factor in
unsatisfactorycondition3
18
47
41
19
48
3943
61
53
0
20
40
60
80
100UnderenrolledEnrollment within 5 percent of capacityOvercrowded
Percent
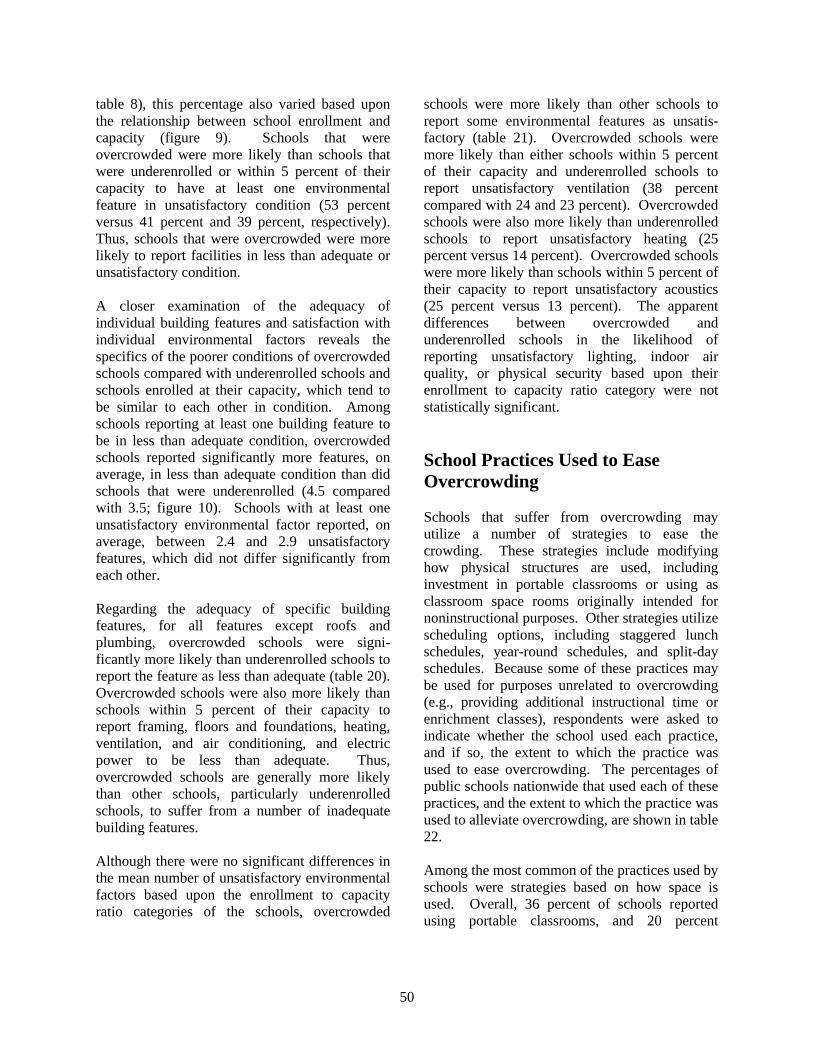
50
table 8), this percentage also varied based uponthe relationship between school enrollment andcapacity (figure 9). Schools that wereovercrowded were more likely than schools thatwere underenrolled or within 5 percent of theircapacity to have at least one environmentalfeature in unsatisfactory condition (53 percentversus 41 percent and 39 percent, respectively).Thus, schools that were overcrowded were morelikely to report facilities in less than adequate orunsatisfactory condition.
A closer examination of the adequacy ofindividual building features and satisfaction withindividual environmental factors reveals thespecifics of the poorer conditions of overcrowdedschools compared with underenrolled schools andschools enrolled at their capacity, which tend tobe similar to each other in condition. Amongschools reporting at least one building feature tobe in less than adequate condition, overcrowdedschools reported significantly more features, onaverage, in less than adequate condition than didschools that were underenrolled (4.5 comparedwith 3.5; figure 10). Schools with at least oneunsatisfactory environmental factor reported, onaverage, between 2.4 and 2.9 unsatisfactoryfeatures, which did not differ significantly fromeach other.
Regarding the adequacy of specific buildingfeatures, for all features except roofs andplumbing, overcrowded schools were signi-ficantly more likely than underenrolled schools toreport the feature as less than adequate (table 20).Overcrowded schools were also more likely thanschools within 5 percent of their capacity toreport framing, floors and foundations, heating,ventilation, and air conditioning, and electricpower to be less than adequate. Thus,overcrowded schools are generally more likelythan other schools, particularly underenrolledschools, to suffer from a number of inadequatebuilding features.
Although there were no significant differences inthe mean number of unsatisfactory environmentalfactors based upon the enrollment to capacityratio categories of the schools, overcrowded
schools were more likely than other schools toreport some environmental features as unsatis-factory (table 21). Overcrowded schools weremore likely than either schools within 5 percentof their capacity and underenrolled schools toreport unsatisfactory ventilation (38 percentcompared with 24 and 23 percent). Overcrowdedschools were also more likely than underenrolledschools to report unsatisfactory heating (25percent versus 14 percent). Overcrowded schoolswere more likely than schools within 5 percent oftheir capacity to report unsatisfactory acoustics(25 percent versus 13 percent). The apparentdifferences between overcrowded andunderenrolled schools in the likelihood ofreporting unsatisfactory lighting, indoor airquality, or physical security based upon theirenrollment to capacity ratio category were notstatistically significant.
School Practices Used to EaseOvercrowding
Schools that suffer from overcrowding mayutilize a number of strategies to ease thecrowding. These strategies include modifyinghow physical structures are used, includinginvestment in portable classrooms or using asclassroom space rooms originally intended fornoninstructional purposes. Other strategies utilizescheduling options, including staggered lunchschedules, year-round schedules, and split-dayschedules. Because some of these practices maybe used for purposes unrelated to overcrowding(e.g., providing additional instructional time orenrichment classes), respondents were asked toindicate whether the school used each practice,and if so, the extent to which the practice wasused to ease overcrowding. The percentages ofpublic schools nationwide that used each of thesepractices, and the extent to which the practice wasused to alleviate overcrowding, are shown in table22.
Among the most common of the practices used byschools were strategies based on how space isused. Overall, 36 percent of schools reportedusing portable classrooms, and 20 percent
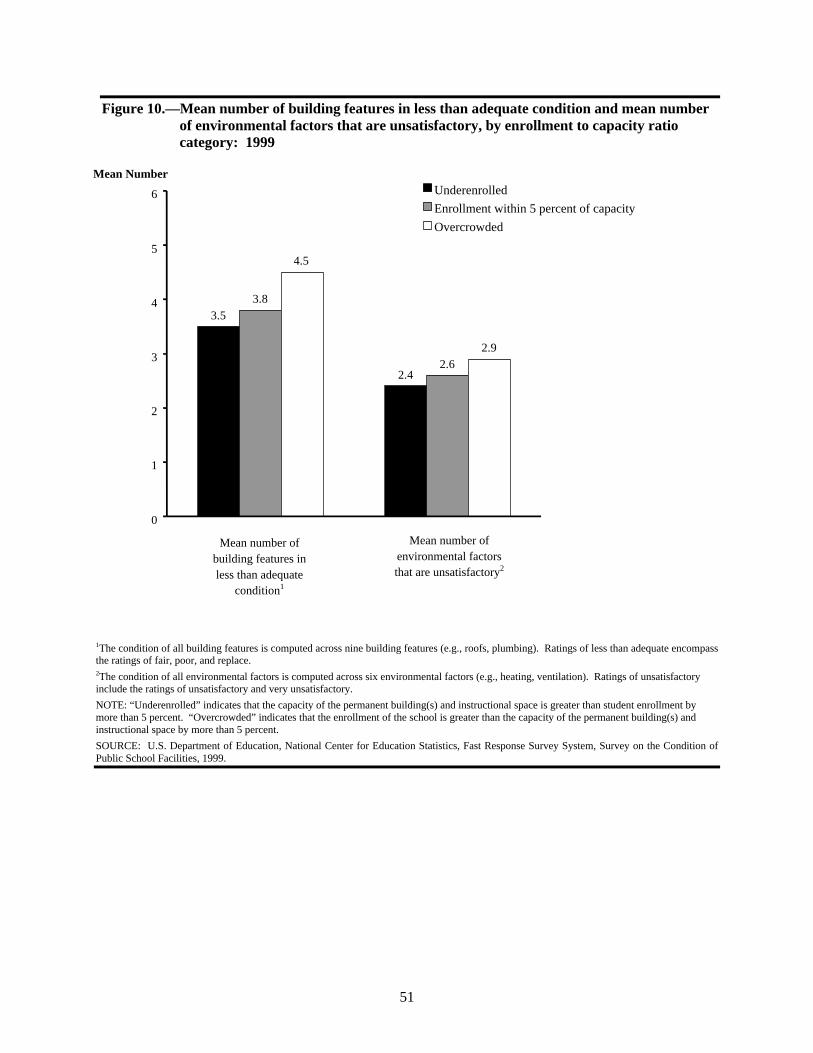
51
Figure 10.—Mean number of building features in less than adequate condition and mean numberof environmental factors that are unsatisfactory, by enrollment to capacity ratiocategory: 1999
1The condition of all building features is computed across nine building features (e.g., roofs, plumbing). Ratings of less than adequate encompassthe ratings of fair, poor, and replace.2The condition of all environmental factors is computed across six environmental factors (e.g., heating, ventilation). Ratings of unsatisfactoryinclude the ratings of unsatisfactory and very unsatisfactory.
NOTE: “Underenrolled” indicates that the capacity of the permanent building(s) and instructional space is greater than student enrollment bymore than 5 percent. “Overcrowded” indicates that the enrollment of the school is greater than the capacity of the permanent building(s) andinstructional space by more than 5 percent.
SOURCE: U.S. Department of Education, National Center for Education Statistics, Fast Response Survey System, Survey on the Condition ofPublic School Facilities, 1999.
Mean Number
Mean number ofbuilding features inless than adequate
condition1
Mean number ofenvironmental factorsthat are unsatisfactory2
3.5
2.4
3.8
2.6
4.5
2.9
0
1
2
3
4
5
6 Underenrolled
Enrollment within 5 percent of capacity
Overcrowded
52
Table 20. —Percent of public schools in each enrollment to capacity ratio category rating thecondition of building features as less than adequate: 1999
Building feature Underenrolled1
Enrollment within
5 percent of
capacity
Overcrowded2
Roofs ................................................................................................................ 20 22 29
Framing, floors, foundations ............................................................................ 12 12 22
Exterior walls, finishes, windows, doors .......................................................... 20 23 33
Interior finishes, trim........................................................................................ 13 18 26
Plumbing .......................................................................................................... 22 25 32
Heating, ventilation, air conditioning ............................................................... 26 28 38
Electric power .................................................................................................. 18 19 32
Electrical lighting ............................................................................................. 14 16 28
Life safety features ........................................................................................... 18 18 281 “Underenrolled” indicates that the capacity of the permanent building(s) and instructional space is greater than student enrollment by more than5 percent.2 “Overcrowded” indicates that the enrollment of the school is greater than the capacity of the permanent building(s) and instructional space bymore than 5 percent.
NOTE: Ratings of less than adequate encompass the ratings of fair, poor, and replace.
SOURCE: U.S. Department of Education, National Center for Education Statistics, Fast Response Survey System, Survey on the Condition ofPublic School Facilities, 1999.
Table 21. —Percent of public schools in each enrollment to capacity ratio category rating thecondition of environmental factors as unsatisfactory: 1999
Environmental factor Underenrolled1
Enrollment within
5 percent of
capacity
Overcrowded2
Lighting............................................................................................................ 11 12 15
Heating............................................................................................................. 14 15 25
Ventilation........................................................................................................ 23 24 38
Indoor air quality .............................................................................................. 16 18 24
Acoustics or noise control ................................................................................ 17 13 25
Physical security of buildings........................................................................... 17 20 251 “Underenrolled” indicates that the capacity of the permanent building(s) and instructional space is greater than student enrollment by more than5 percent.2 “Overcrowded” indicates that the enrollment of the school is greater than the capacity of the permanent building(s) and instructional space bymore than 5 percent.
NOTE: Ratings of unsatisfactory include the ratings of unsatisfactory and very unsatisfactory.
SOURCE: U.S. Department of Education, National Center for Education Statistics, Fast Response Survey System, Survey on the Condition ofPublic School Facilities, 1999.
reported the creation of temporary instructionalspace (table 22).45 This translates into about28,600 schools using temporary classrooms, and15,700 creating temporary instructional space(not shown in tables). For schools reporting the
45 Nationally, about 6 percent of instructional rooms were in
temporary structures, and about 3 percent of instructional roomswere originally designed to serve noninstructional purposes (notshown in tables).
use of portable classrooms, about half (46percent) reported doing so to a great extent inorder to reduce overcrowding (table 22). Amongschools reporting that they created temporaryinstructional space, one-quarter (26 percent)reported doing so to a great extent in order toreduce crowding, while 34 percent did so to amoderate extent to ease overcrowding, and 38percent did so to a minor extent. Few schoolsused off-site instructional facilities (8 percent) or
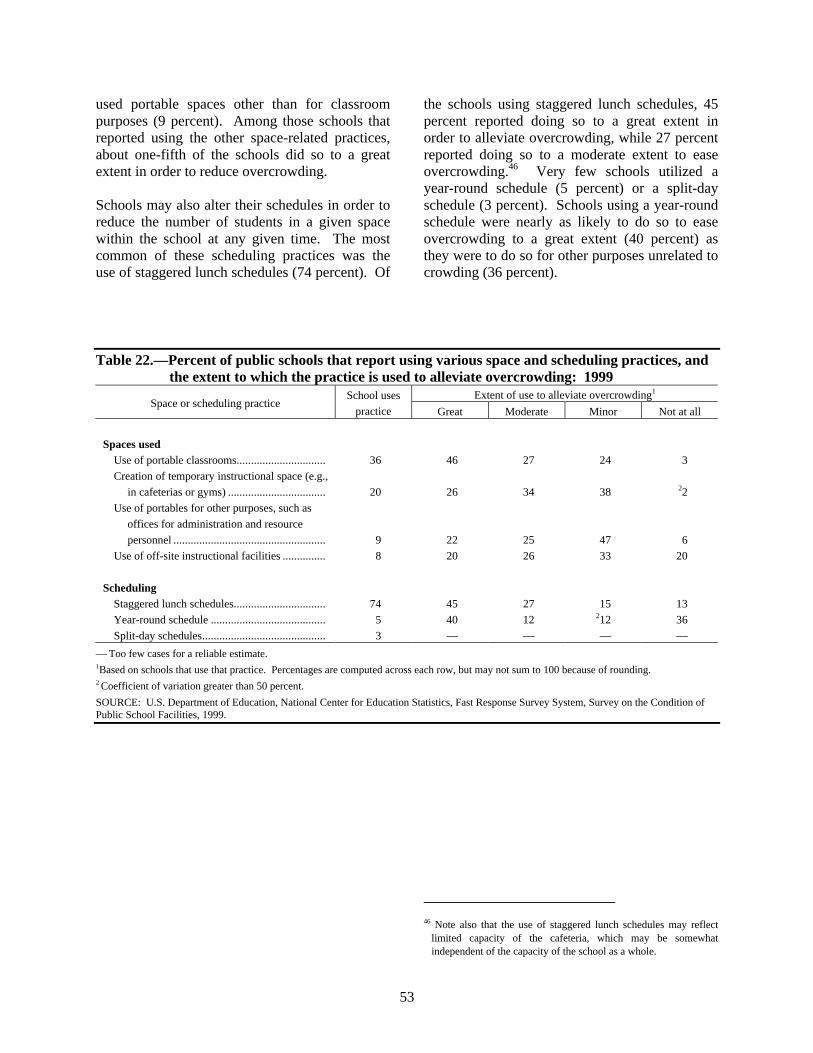
53
used portable spaces other than for classroompurposes (9 percent). Among those schools thatreported using the other space-related practices,about one-fifth of the schools did so to a greatextent in order to reduce overcrowding.
Schools may also alter their schedules in order toreduce the number of students in a given spacewithin the school at any given time. The mostcommon of these scheduling practices was theuse of staggered lunch schedules (74 percent). Of
the schools using staggered lunch schedules, 45percent reported doing so to a great extent inorder to alleviate overcrowding, while 27 percentreported doing so to a moderate extent to easeovercrowding.46 Very few schools utilized ayear-round schedule (5 percent) or a split-dayschedule (3 percent). Schools using a year-roundschedule were nearly as likely to do so to easeovercrowding to a great extent (40 percent) asthey were to do so for other purposes unrelated tocrowding (36 percent).
46 Note also that the use of staggered lunch schedules may reflect
limited capacity of the cafeteria, which may be somewhatindependent of the capacity of the school as a whole.
Table 22.—Percent of public schools that report using various space and scheduling practices, andthe extent to which the practice is used to alleviate overcrowding: 1999
Extent of use to alleviate overcrowding1
Space or scheduling practiceSchool uses
practice Great Moderate Minor Not at all
Spaces usedUse of portable classrooms............................... 36 46 27 24 3
Creation of temporary instructional space (e.g.,
in cafeterias or gyms) .................................. 20 26 34 38 22
Use of portables for other purposes, such as
offices for administration and resource
personnel ..................................................... 9 22 25 47 6
Use of off-site instructional facilities ............... 8 20 26 33 20
SchedulingStaggered lunch schedules................................ 74 45 27 15 13
Year-round schedule ........................................ 5 40 12 212 36
Split-day schedules........................................... 3 — — — —
— Too few cases for a reliable estimate.1Based on schools that use that practice. Percentages are computed across each row, but may not sum to 100 because of rounding.2 Coefficient of variation greater than 50 percent.
SOURCE: U.S. Department of Education, National Center for Education Statistics, Fast Response Survey System, Survey on the Condition ofPublic School Facilities, 1999.

54
55
7. SUMMARY AND CONCLUSIONS
The physical condition of schools has beenreceiving a great deal of attention as press reportsindicate crumbling buildings and other signs ofdeterioration, and concerns mount that the baby-boom echo is causing schools to be overcrowded(e.g., Kozol 1991; U.S. Department of Education1998). Beyond the general condition of schoolsare concerns about the adequacy of manyenvironmental factors, including air conditioningand ventilation, noise control, and flexibility ofinstructional space (e.g., Hansen 1992). Despitethe widespread interest in the state of publicschool facilities, recent nationally representativedata regarding the physical condition of schoolsare scarce. The need for current national data isunderscored by observations that the condition ofschools varies widely. Some districts haveschools deteriorating with age and lack ofmaintenance, while other districts invest millionsof dollars in new, state-of-the-art buildings; thecondition of schools within districts may alsovary widely. The presence of such extremeshighlights the importance of describing the rangeof physical conditions in America's public schoolfacilities.
This report provides data regarding a broad rangeof issues concerning school condition. Theresults presented in this report are based onquestionnaire data for 903 public elementary andsecondary schools in the United States. Thequestionnaire responses were weighted toproduce national estimates that represent allregular public schools in the United States.Information about the condition of schoolfacilities is based on questionnaire rating scalesrather than on physical observation of schoolconditions by outside observers. Data werecollected regarding the adequacy of permanentand temporary school facilities, adequacy ofbuilding features that make up schools, andsatisfaction with environmental factors, includingspecific attention to air conditioning. Data werealso collected to provide estimates of the totalinvestment in repairs, renovations, and
modernizations that would be necessary to bringall public schools into good overall condition.The survey also gathered data pertaining to futureplans for construction, repair/renovation, andreplacement. Information was also collectedabout the age of public schools, and aboutovercrowding at public schools. All comparativestatements in this report have been tested forstatistical significance and adjusted for multiplecomparisons using the Bonferroni adjustment andare significant at the 0.05 level. Throughout thisreport, differences that may appear large(particularly those by school characteristics) maynot be statistically significant. This is due in partto the relatively large standard errors surroundingthe estimates (because of the small sample size)and the use of the Bonferroni adjustment. Thischapter provides a summary of the findings fromthis survey, as well as some overall conclusions.
The Overall Condition of Schoolsand Building Features
Overall, about three-quarters of schools, servingapproximately 34 million students, reported thatall the types of onsite buildings at their schoolwere in adequate or better condition. However,about one-quarter of schools, enrollingapproximately 11 million students, reported atleast one of their types of onsite buildings to be inless than adequate condition. Approximately 3.5million of these students attended schools whereat least one type of building was in poor conditionor needed to be replaced. The variability inoverall condition of schools was not stronglyrelated to characteristics of the school.
While the majority of schools reported beingadequate or better overall, it is possible that thecondition of important individual buildingfeatures, such as roofs or electrical systems, maybe less than adequate, regardless of the generalcondition of the school. Overall, 50 percent ofschools reported that at least one of nine building
56
features at their school was in less than adequatecondition. Schools reporting any less thanadequate feature reported an average of 3.8building features to be in less than adequatecondition. The percent of schools with at leastone less than adequate building feature varied bylocale, region, and the concentration of poverty inthe school (defined as the percent of studentseligible for free or reduced-price school lunch).Schools located in central cities were more likelythan those in urban fringe areas or large towns toreport at least one building feature as less thanadequate, as were schools in the West comparedwith those in the Northeast. Schools with thehighest concentration of poverty were more likelythan were schools with the two lowestconcentrations of poverty to report that at leastone building features was less than adequate.When considering individual building features,ratings of less than adequate ranged from 14percent of schools for framing, floors, andfoundations to 29 percent of schools for heating,ventilation, and air conditioning. The conditionof specific building features varied somewhat byschool characteristics, although the onlyconsistent pattern was for schools in the West tobe more likely than schools in the Northeast toreport less than adequate conditions on four of thenine building features.
The Cost of Bringing Schools IntoGood Overall Condition
Schools that reported on the questionnaire that thecondition of any type of building or any buildingfeature was in less than good condition (i.e., wasgiven a rating of adequate, fair, poor, or replace)provided information about the expected cost ofthe needed repairs, renovations, and modern-izations to put the school's onsite buildings intogood overall condition. About three-quarters ofschools, representing a total of about 59,400schools, indicated that they needed to spend somemoney on repairs, renovations, and modern-izations to put the school into good overallcondition. The total amount needed by schoolswas estimated to be approximately $127 billion,with an average dollar amount per school of about$2.2 million for schools needing to spend. The
average cost per student across all public schoolswas $2,900 (including schools that reported noneed to spend money), and $3,800 among the 76percent of schools that reported needing to spendmoney to put the school into good overallcondition. Cost per student did not vary byschool characteristics.
Satisfaction with EnvironmentalConditions in Schools
While assessing the overall condition of schoolbuildings and their features provides insight intothe physical condition of schools in terms ofbricks and mortar, environmental conditions tendto be associated with comfort within the spaceprovided by the physical features. While amajority of public schools reported that each ofsix environmental conditions within the schoolwere satisfactory, a sizable minority reported thatthese environmental conditions were unsatis-factory. About a quarter of schools reportedventilation as unsatisfactory, about a fifth ofschools reported they were unsatisfied withheating, indoor air quality, acoustics or noisecontrol, and the physical security of buildings,and 12 percent of schools were unsatisfied withlighting conditions. In addition to these sixenvironmental conditions, about a third of schoolswere unsatisfied with the energy efficiency of theschool, and 38 percent were unsatisfied with theirflexibility of instructional space. There were noconsistent patterns of variation by schoolcharacteristics in satisfaction with individualenvironmental conditions.
Overall, the 43 percent of the schools indicatingthat at least one of the six environmental factorswas in unsatisfactory condition reported anaverage of 2.6 environmental conditions to beunsatisfactory. The percent of schools reportingat least one unsatisfactory environmentalcondition varied by locale and concentration ofpoverty. Schools in rural areas and small townswere more likely than those in urban fringe areasand large towns to report at least oneunsatisfactory environmental condition. Schoolswith the highest concentration of poverty weremore likely than those with the lowest concen-
57
tration of poverty to report at least one unsatis-factory environmental condition.
One environmental factor, air conditioning, is ofparticular concern, especially in classrooms.While about half of schools indicated that all oftheir classrooms were air-conditioned, about aquarter of schools reported that none of theirclassrooms were air-conditioned, but they neededto be. About 60 percent of schools reported thatall of their administrative offices, computer labs,and media centers were air-conditioned. About85 percent of the schools reported that airconditioning, in areas of the school that had it,was satisfactory or very satisfactory.
Plans for Construction, and forMajor Repair, Renovation, orReplacement of Building Features
The physical condition of schools is constantlychanging: age and use wear them down,maintenance (repair and renovation) andreplacement build them back. The majority ofschools (about two-thirds) plan for thisinevitability with written long-range facilitiesplans. Regardless of whether the activity waspart of a written plan, one-fifth of schoolsreported plans to build new attached and/ordetached permanent additions, and 1 in 10reported plans to install new temporary buildingswithin the next 2 years.
About half of the schools planned to make majorrepairs, renovations, or replacements to at leastone building feature in the next 2 years. Overall,41 percent of schools indicated plans to makemajor repairs or renovations to at least onebuilding feature, and one-quarter planned toreplace at least one building feature in the next 2years. While plans for repair or renovation in thenext 2 years varied by locale and percent minorityenrollment, plans for replacing building featuresdid not vary by school characteristics. The moresalient factor than school characteristics for futurerepair, renovation, and replacement was theoverall condition of the school buildings orbuilding feature. About half (46 percent) of the
schools in adequate or better overall conditionreported plans for repair, renovation, orreplacement of building features in the next 2years, compared with two-thirds of schools in lessthan adequate overall condition. The remainingone-third of schools in less than adequatecondition, about 6,300 schools, had no plans forimprovements to the features of their buildings.This group of schools may continue to graduallydeteriorate over time due to deferredmaintenance.
Functional Age of Schools
The physical condition of schools is linked inmany people's minds with the age of the school.Concerns that older schools are in more disrepair,lack the necessary infrastructure for advancedtelecommunications systems, have inefficientmechanical systems, and may lack modern safetyfeatures have raised concern about the age ofAmerica's schools. In 1999, public schools inAmerica were built, on average, 40 years ago.Among schools that had been renovated sinceconstruction, on average the renovation occurred11 years ago. The years since construction andsince the most recent major renovation werecombined to form a measure of the functional ageof the school. The functional age was calculatedas the years since construction for schools with nomajor renovations, or the years since the mostrecent major renovation for school that hadcompleted such projects. The average functionalage of schools was 16 years. Overall, about one-third of public schools had a functional age ofless than 5 years, 28 percent had a functional ageof 5 to 14 years, 26 percent had a functional ageof 15 to 34 years, and 14 percent had a functionalage of 35 years or more. Thus, about 6 out of 10schools had a functional age of less than 15 years.
The data suggest that school functional age isrelated to condition in several ways, with theoldest schools more likely to be in poor condition.Older schools (those with functional ages of 15years or more) were more likely than youngerschools (those with functional ages less than 15years) to report that at least one type of onsitebuilding was in less than adequate condition, toreport at least one building feature to be less than
58
adequate, and to report at least one unsatisfactoryenvironmental condition.
School plans for making major repairs,renovations, or replacements in the next 2 yearsvaried by the functional age of the school.Schools with functional ages between 15 to 34years were more likely to report plans for at leastone major repair, renovation, or replacement thanwere schools with younger functional ages.Schools with the oldest functional age (35 yearsor greater) were as likely to have plans for repair,renovation, or replacement as were the schoolswith younger functional ages. Thus, even manyof the functionally youngest schools were slatedfor such maintenance work. Many older schoolsare slated for what are likely necessaryimprovements, but many are not slated for workthat may be overdue. It is possible that this lattergroup may fall into a category of schools thathave been relinquished to the inevitable effects ofaging, possibly with the intent of completelyreplacing the school in the future.
Overcrowding in Schools
As the public school system copes with the baby-boom echo, there is growing concern about thedegree of overcrowding existing in at least someschools. This concern is compounded by researchon the effects of overcrowding on teacher andstudent behaviors (e.g., Rivera-Batiz and Marti1995). Overcrowding occurs when the number ofstudents enrolled in the school is larger than thenumber of students the school is designed toaccommodate. Overall, about half of publicschools were underenrolled (approximately40,500 schools nationwide), about one-quarterwere within 5 percent of their capacity(approximately 20,400 schools), and about aquarter were overcrowded (about 17,400schools), based on the capacity of the permanentinstructional buildings and space. The extent ofovercrowding varied based upon schoolinstructional level, school size, region, locale, andpercent minority enrollment, but did not varysignificantly based upon concentration of povertyin the school. Schools in rural areas or smalltowns were more likely than schools in other
areas to be severely underenrolled (underenrolledby more than 25 percent). In addition, thelikelihood of being severely underenrolleddecreased with the school's enrollment size.Severe overcrowding (enrollments greater thancapacity by more than 25 percent) was generallymost prevalent among large schools, schools inthe West, and schools with more than 50 percentminority enrollment. Overcrowded schools weremore likely than other schools to report that atleast one type of onsite building was in less thanadequate condition, to have at least one buildingfeature in less than adequate condition, and tohave at least one environmental factor inunsatisfactory condition.
Schools have a number of strategies to help copewith overcrowding. About a third (36 percent) ofschools indicated that they used portableclassrooms, and one out of five indicated the useof temporary instructional space, with mostreporting using these strategies to a moderate orgreat extent to alleviate overcrowding. Aboutthree-quarters of schools reported using staggeredlunch schedules, with 45 percent of themreporting doing so to ease overcrowding to a greatextent. However, this may reflect the need forcafeteria space, rather than instructional space, toaccommodate student enrollments.
School Facilities and Characteristicsof Schools
Several school characteristics of interest forpolicy development did appear to be related tosome of the elements of condition. Specifically,school locale (central city, urban fringe/largetown, or rural/small town), concentration ofpoverty in the school (measured by the percent ofstudents eligible for free or reduced-price lunch),percent minority enrollment, and school size eachappear to be related to school conditions in someway, although strong and consistent patterns ofvariation across many school conditions did notemerge in this study. Additionally, geographicregion was related to some aspects of schoolcondition. These are discussed more fully below.
59
When differences between schools' conditionemerged based upon school locale, theysometimes supported the popular perception thatschools located in central cities are in worsecondition than are schools elsewhere (e.g.,Corcoran, Walker, and White 1988). However,when these differences between central cityschools and other schools appeared, they tendedto be between schools in central cities and thosein urban fringe areas and large towns, and notbetween central city and rural and small townschools. Schools in central cities were morelikely than those in urban fringe areas and largetowns to report at least one building feature inless than adequate condition and more likely toreport the need to spend money to bring theschool into good overall condition. Additionally,the data revealed several ways in which thecondition of rural and small town schools isdifferent from that of other schools. For example,schools in rural areas and small towns were morelikely than schools in urban fringe and large townareas to indicate that at least one environmentalfactor was unsatisfactory. Schools in rural areasand small towns were more likely than schools inurban fringe areas or large towns to reportunsatisfactory acoustics, and were more likelythan schools in both urban fringe areas and largetowns and schools in central cities to report beingunsatisfied with the physical security ofbuildings. Finally, schools in rural areas andsmall towns were more likely than schools inother areas to be severely underenrolled.
Schools located in impoverished communities aregenerally believed to be at greater risk for beingin poorer condition. Schools with 70 percent ormore of their students eligible for free or reduced-price lunch were more likely than schools withless than 40 percent of their students eligible forfree or reduced-price lunch to report at least onebuilding feature to be in less than adequatecondition, and more likely to report thatpermanent additions were in less than adequatecondition. Schools with 70 percent or more oftheir students eligible for free or reduced-pricelunch were more likely than schools with lessthan 20 percent of their students eligible for freeor reduced-price lunch to report roofs to be in lessthan adequate condition. Schools with the highestconcentration of poverty were also more likely
than schools with the lowest concentration ofpoverty to report at least one environmental factorto be unsatisfactory.
Schools with high concentrations of minoritystudents are also typically depicted as being inworse condition than schools with lowerproportions of minority students (e.g., Lowe1996). When considering specific buildingfeatures and environmental factors, twodifferences emerged, both showing a higherpercentage of schools with more than 50 percentminority enrollment indicating the feature to be inless than adequate condition. Specifically,schools with more than 50 percent minorityenrollment were more likely than schools with 21to 50 percent minority enrollment to reportinadequate exterior walls, finishes, windows, ordoors, and schools with greater than 50 percentminority enrollment were more likely than allother schools to report inadequate electric power.Moreover, schools with more than 50 percentminority enrollment were generally more likelythan schools with lower concentrations ofminority students to be severely overcrowded.
School size, as indicated by current schoolenrollment, was also related to severaldimensions of school condition (specificenvironmental factors, school functional age, andovercrowding). Medium schools were morelikely than large schools to report unsatisfactoryventilation and acoustics, and small and mediumschools were more likely than large schools toreport that their classrooms needed airconditioning. School size was also related to thefunctional age of the school. On average, smallschools had older functional ages than medium orlarge schools. Additionally, large schools weremore likely than small schools to have afunctional age of less than 5 years, and smallschools were more likely than large schools tohave a functional age between 15 and 34 years.Finally, current school size was related to thedegree to which the school was underenrolled orovercrowded. Small schools were more likelythan medium schools, which in turn were morelikely than large schools, to be underenrolled bymore than 25 percent. Medium and large schoolswere more likely than small schools to be within5 percent of their capacity, and large schools were
60
more likely than medium and small schools to beovercrowded by more than 25 percent.
A number of differences between schools basedupon their geographic region emerged, allindicating that the condition of schools in theWest may be worse than elsewhere in thecountry. Although the overall condition of onsitebuildings did not vary based upon region, schoolsin the West were more likely than schools in theNortheast to report that at least one buildingfeature was in less than adequate condition.Schools in the West were also more likely thanschools in the Northeast to indicate four of ninebuilding features to be in less than adequatecondition. In addition, schools in the West weremore likely than schools in the South or Northeastto indicate the need to spend money to bring theschool into good overall condition. Schools inthe West were also more likely to be severelyovercrowded than schools in other regions, andwere also more likely than schools elsewhere tohave temporary buildings as part of the school.Finally, schools in the West were also more likelyto indicate plans to install new temporarystructures in the next 2 years.
Conclusions
Data from this survey suggest that although themajority of America's public schools are inadequate or better condition, a sizable minorityare not. Approximately one-quarter of theschools reported at least one type of onsitebuilding in less than adequate condition, halfreported that their schools had building featuresin need of repair, and 4 out of 10 reportedunsatisfactory environmental conditions. Dataregarding the functional age of schools and theircondition suggest that the oldest schools are themost in need of attention, but many of theseschools do not have plans for improvement. Thedata also suggest that while three-quarters ofschools do not have a problem withovercrowding, the remaining schools areovercrowded and close to 10 percent haveenrollments that are more than 25 percent overthe capacity of the school’s permanent buildings.These data, then, provide a complex portrait of
the current physical condition and crowding ofAmerica's public schools. Although the majorityof schools are in adequate condition, functionallyyoung, and not overcrowded, a substantialnumber of schools are in poor condition, andsome of them suffer from age and overcrowding.Past experience suggests that it will be costly tocorrect these problems.
61
References
Abramson, P. (1999). Construction report. Dayton, OH: School Planning and Management.
Augenblick, J.G., Myers, J.L., and Anderson, A.B. (1997). Equity and adequacy in school funding. TheFuture of Children 7(3): 63-78.
Berner, M. M. (1993). Building conditions, parental involvement, and student achievement in the Districtof Columbia Public School System. Urban Education 28: 6-29.
Burnett, G. (1995). Overcrowding in urban schools. ERIC Clearinghouse on Urban Education,(ERIC/CUE Digest Number 107).
Cash, C. (1993). A study of the relationship between school building condition and student achievementand behavior. Unpublished doctoral dissertation. Blacksburg, VA: Virginia Polytechnic Instituteand State University.
Corcoran, T.B., Walker, L.J., and White, J.L. (1988). Working in urban schools. Washington, DC:Institute for Educational Leadership.
Duke, D.L., Griesdorn, J., Gillespie, M., and Tuttle, J.B. (1998). Where our children learn matters: Areport on the Virginia school facilities impact study. Charlottesville, VA: The Thomas JeffersonCenter for Educational Design.
Earthman, G.I., Cash, C.S., and Van Berkum, D. (1995). A statewide study of student achievement andbehavior and school building condition. Council of Educational Facility Planners, International(CEFPI) Annual Meeting, Dallas, TX.
Earthman, G.I., and Lemasters, L. (1996). Review of research on the relationship between schoolbuildings, student achievement, and student behavior. Council of Educational Facility Planners,International (CEFPI) Annual Meeting, Tarpon Springs, FL.
EdSource, Inc. (1998). What has created California's school facilities predicament? EdFact. Palo Alto,CA: S.H. Cowell Foundation.
Ferguson, R.F. (1991). Paying for public education: New evidence on how and why money matters.Harvard Journal on Legislation 28, 464-498.
Fernandez, R.R., and Timpane, P.M. (1995). Bursting at the seams: Report of the Citizens' Commissionon Planning for Enrollment Growth. Brooklyn, NY: New York City Board of Education.
Hansen, S.J. (1992). Schoolhouse in the red: A guidebook for cutting our losses. Powerfulrecommendations for improving America's school facilities. Arlington, VA: American Associationof School Administrators.
Howell, P.L., and Miller, B.B. (1997). Sources for funding for schools. The Future of Children 7(3): 39-50.
Kozol, J. (1991). Savage inequalities: Children in America's schools. New York, NY: HarperCollinsPublishers.
62
Lewis, A., Bednarek, D., Chion-Kenney, L., Harrison, C., Kolodzy, J., McCormick, K., Smith, J., Speich,D., and Walker, L. (1989). Wolves at the schoolhouse door: An investigation of the condition ofpublic school buildings. Washington, DC: Education Writers Association.
Lowe, D.D. (1996). School facilities equity in California: An empirical study. Los Angeles, CA:University of Southern California.
Mathews, J. (2000). Trailer classrooms surprisingly popular. Washington Post, 15 February, A9.
McGuffey, C.W. (1982). Facilities. In Improving educational standards and productivity, edited by H.J.Walberg. Berkeley, CA: McCutchan Publishing Corporation.
Nakamura, D. (2000). Parents demand repairs at aging schools; decaying Pr. George’s buildings needmore money, critics say. Washington Post, 23 January, C1.
National Education Association. (2000). Modernizing our schools: What will it cost? Washington, DC:NEA.
Rivera-Batiz, F.L., and Marti, L. (1995). A school system at risk: A study of the consequences ofovercrowding in New York City public schools. New York, NY: Institute for Urban and MinorityEducation.
Seymour, L. (2000). Baby boom’s colossal echo. Washington Post, 9 April, C1.
Terman, D.L., and Behrman, R.E. (1997). Financing schools: Analysis and recommendations. TheFuture of Children 7 (3): 4-23.
U.S. Department of Education, National Center for Education Statistics. (1995). Disparities in publicschool district spending 1989-90. NCES 95-300. Washington, DC: Office of Educational Researchand Improvement.
U.S. Department of Education. (1998). A back to school report on the baby boom echo: America’sschools are overcrowded and wearing out. Washington, DC: U.S. Government Printing Office.
U.S. Department of Education. (1999a). A back to school report on the baby boom echo: No end in sight.Washington, DC: U.S. Government Printing Office.
U.S. Department of Education. National Center for Education Statistics. (1999b). How old are America'spublic schools. NCES 1999-048. Washington, DC: Office of Educational Research andImprovement.
U.S. General Accounting Office. (1995a). School facilities: Conditions of America's schools.GAO/HEHS-95-61. Washington, DC: GAO.
U.S. General Accounting Office (1995b). School facilities: American’s schools not designed or equippedfor 21st century. GAO/HEHS-95-95. Washington, DC: GAO.
U.S. General Accounting Office. (1995c). School facilities: States' financial and technical support varies.GAO/HEHS-96-27. Washington, DC: GAO.
U.S. General Accounting Office. (1996). School facilities: America's schools report differing conditions.GAO/HEHS-96-103. Washington, DC: GAO.
63
U.S. General Accounting Office. (2000). School facilities: Construction expenditures have grownsignificantly in recent years. GAO/HEHS-00-41. Washington, DC: GAO.
Weinstein, C.S. (1979). The physical environment of the school: A review of the research. Review ofEducational Research 49(4): 577-610.

64
A-1
Appendix A
Survey Methodology

A-2
A-3
Table of Contents
Chapter Page
Fast Response Survey System .......................................................................................... A-5Sample Selection .............................................................................................................. A-5Respondent and Response Rates ...................................................................................... A-5Sampling and Nonsampling Errors................................................................................... A-6Variances .......................................................................................................................... A-6Definitions of Analysis Variables..................................................................................... A-8Comparisons to the 1994 U.S. General Accounting Office Study ................................... A-9Comparisons to the 2000 National Education Association Study .................................... A-11Background Information................................................................................................... A-12Photo Credits .................................................................................................................... A-13
List of Appendix Tables
Table
A-1 Number and percentage distribution of public schools in the study, and the estimatednumber and percentage distribution in the nation, by school characteristics: 1999 ......... A-7

A-4
A-5
Fast Response Survey System
The Fast Response Survey System (FRSS) wasestablished in 1975 by the National Center forEducation Statistics (NCES), U.S. Department ofEducation. FRSS is designed to collect smallamounts of issue-oriented data with minimalburden on respondents and within a relativelyshort timeframe. Surveys are generally limited tothree pages of questions, with a response burdenof about 30 minutes per respondent. Sample sizesare relatively small (usually about 1,000 to 1,500respondents per survey) so that data collectioncan be completed quickly. Data are weighted toproduce national estimates of the samplededucation sector. The sample size permits limitedbreakouts by classification variables. However,as the number of categories within theclassification variables increases, the sample sizewithin categories decreases, which results inlarger sampling errors for the breakouts byclassification variables. FRSS collects data fromstate education agencies, local educationagencies, public and private elementary andsecondary schools, public school teachers, andpublic libraries.
Sample Selection
The sample for the FRSS survey on the conditionof public school facilities consisted of 1,004regular public elementary, middle, and highschools in the 50 states and the District ofColumbia. The sample was selected from the1996-97 NCES Common Core of Data (CCD)School Universe File. The sampling frameconstructed consisted of 80,238 regular publicschools. Excluded from the sampling frame werespecial education, vocational, and alterna-tive/other schools, schools in the territories, andschools with a high grade lower than one orungraded. The frame contained 49,266 regularelementary schools, 14,808 regular middleschools, and 16,164 regular high/combinedschools. A school was defined as an elementaryschool if the lowest grade was less than or equalto grade 3 and the highest grade was less than orequal to grade 8. A middle school was defined ashaving a lowest grade greater than or equal to
grade 4 and a highest grade less than or equal tograde 9. A school was considered a high schoolif its lowest grade was less than or equal to grade9 and the highest grade was greater than or equalto grade 10. Combined schools were defined ashaving a lowest grade less than or equal to grade3 and a highest grade greater than or equal tograde 9 or the lowest grade is in grades 4 through8 and the highest grade is in grades 10 through12. High schools and combined schools werecombined into one category for sampling.
The public school sampling frame was stratifiedby instructional level (elementary, middle, andhigh school/combined), locale (city, urban fringe,town, rural), and school size (less than 300, 300to 499, 500 to 999, and 1,500 or more). Withinthe primary strata, schools were also sorted bygeographic region and percent minorityenrollment in the school to produce additionalimplicit stratification. Within each primarystratum, the specified sample size was thenallocated to size classes in rough proportion to theaggregate square root of the enrollment of theschools in the class. After the stratum samplesizes were determined, a sample of 1,004 schoolswas then selected systematically from the sortedfile using independent random starts. The samplecontained 401 elementary schools, 301 middleschools, and 302 high/combined schools. The1,004 schools were located in 838 schooldistricts.
Respondent and Response Rates
Questionnaires and cover letters were mailed inearly July 1999. While individual elementary,middle, and high schools were sampled, thequestionnaires were mailed to the districts withwhich the schools were associated. A separatequestionnaire was enclosed for each sampledschool. This is the same approach used by theU.S. General Accounting Office (GAO) toconduct their study of school facilities in 1994.The cover letter indicated that the survey wasdesigned to be completed by district-levelpersonnel who were very familiar with the schoolfacilities in the district. Often this was a district
A-6
facilities coordinator (although the title of theposition varied). The letter indicated that therespondent might want to consult with otherdistrict-level personnel or with school-levelpersonnel, such as the principal of the selectedschool, in answering some of the questions. Therespondent section on the front of thequestionnaire indicated that while mostquestionnaires were completed by district-levelrespondents, some were completed by school-level respondents (usually the school principal).To maintain the focus on schools, which are thesampled unit, the report refers to schoolsindicating or reporting various findings, eventhough respondents were primarily district-levelpersonnel reporting about the sampled school.
Telephone followup was conducted from late Julythrough September 1999 with districts that didnot respond to the initial questionnaire mailing.Of the 1,004 schools selected for the sample, 14were found to be out of the scope of the survey,usually because the school was no longer inexistence. This left a total of 990 eligible schoolsin the sample. Completed questionnaires werereceived for 903 schools, or 91 percent of theeligible schools. The weighted response rate wasalso 91 percent. Weighted item nonresponse ratesfor individual questionnaire items ranged from 0percent to 0.7 percent. Because the itemnonresponse rate was so low, imputation for itemnonresponse was not implemented.
Sampling and Nonsampling Errors
The responses were weighted to produce nationalestimates (see table A-1). The weights weredesigned to adjust for the variable probabilities ofselection and differential nonresponse. Thefindings in this report are estimates based on thesample selected and, consequently, are subject tosampling variability.
The survey estimates are also subject tononsampling errors that can arise because ofnonobservation (nonresponse or noncoverage)errors, errors of reporting, and errors made in datacollection. These errors can sometimes bias thedata. Nonsampling errors may include such
problems as misrecording of responses; incorrectediting, coding, and data entry; differences relatedto the particular time the survey was conducted;or errors in data preparation. While generalsampling theory can be used in part to determinehow to estimate the sampling variability of astatistic, nonsampling errors are not easy tomeasure and, for measurement purposes, usuallyrequire that an experiment be conducted as part ofthe data collection procedures or that dataexternal to the study be used.
To minimize the potential for nonsampling errors,the questionnaire was pretested with respondentslike those who completed the survey. During thedesign of the survey and the survey pretest, aneffort was made to check for consistency ofinterpretation of questions and to eliminateambiguous items. The questionnaire andinstructions were extensively reviewed by theNational Center for Education Statistics and theOffice of the Under Secretary, U.S. Departmentof Education. Manual and machine editing of thequestionnaire responses were conducted to checkthe data for accuracy and consistency. Cases withmissing or inconsistent items were recontacted bytelephone. Data were keyed with 100 percentverification.
Variances
The standard error is a measure of the variabilityof estimates due to sampling. It indicates thevariability of a sample estimate that would beobtained from all possible samples of a givendesign and size. Standard errors are used as ameasure of the precision expected from aparticular sample. If all possible samples weresurveyed under similar conditions, intervals of1.96 standard errors below to 1.96 standard errorsabove a particular statistic would include the truepopulation parameter being estimated in about 95percent of the samples. This is a 95 percentconfidence interval. For example, the estimatedpercentage of schools with all building types inadequate or better condition is 76.1 percent, andthe estimated standard error is 1.8 percent. The95 percent confidence interval for the statisticextends from [76.1 – (1.8 times 1.96)] to [76.1 +
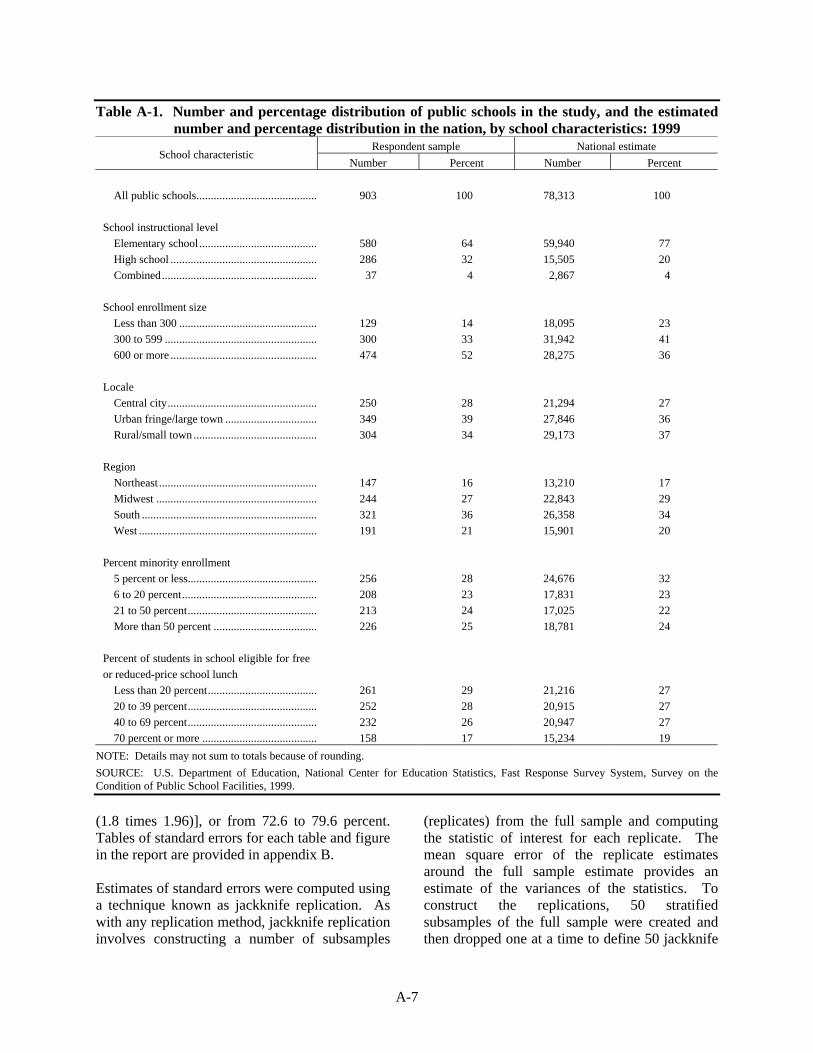
A-7
Table A-1. Number and percentage distribution of public schools in the study, and the estimatednumber and percentage distribution in the nation, by school characteristics: 1999
Respondent sample National estimateSchool characteristic
Number Percent Number Percent
All public schools.......................................... 903 100 78,313 100
School instructional level
Elementary school ......................................... 580 64 59,940 77
High school ................................................... 286 32 15,505 20
Combined...................................................... 37 4 2,867 4
School enrollment size
Less than 300 ................................................ 129 14 18,095 23
300 to 599 ..................................................... 300 33 31,942 41
600 or more ................................................... 474 52 28,275 36
Locale
Central city.................................................... 250 28 21,294 27
Urban fringe/large town ................................ 349 39 27,846 36
Rural/small town ........................................... 304 34 29,173 37
Region
Northeast ....................................................... 147 16 13,210 17
Midwest ........................................................ 244 27 22,843 29
South ............................................................. 321 36 26,358 34
West .............................................................. 191 21 15,901 20
Percent minority enrollment
5 percent or less............................................. 256 28 24,676 32
6 to 20 percent............................................... 208 23 17,831 23
21 to 50 percent............................................. 213 24 17,025 22
More than 50 percent .................................... 226 25 18,781 24
Percent of students in school eligible for free
or reduced-price school lunch
Less than 20 percent...................................... 261 29 21,216 27
20 to 39 percent............................................. 252 28 20,915 27
40 to 69 percent............................................. 232 26 20,947 27
70 percent or more ........................................ 158 17 15,234 19
NOTE: Details may not sum to totals because of rounding.
SOURCE: U.S. Department of Education, National Center for Education Statistics, Fast Response Survey System, Survey on theCondition of Public School Facilities, 1999.
(1.8 times 1.96)], or from 72.6 to 79.6 percent.Tables of standard errors for each table and figurein the report are provided in appendix B.
Estimates of standard errors were computed usinga technique known as jackknife replication. Aswith any replication method, jackknife replicationinvolves constructing a number of subsamples
(replicates) from the full sample and computingthe statistic of interest for each replicate. Themean square error of the replicate estimatesaround the full sample estimate provides anestimate of the variances of the statistics. Toconstruct the replications, 50 stratifiedsubsamples of the full sample were created andthen dropped one at a time to define 50 jackknife
A-8
replicates. A computer program (WesVarPC)was used to calculate the estimates of standarderrors. WesVarPC is a stand-alone Windowsapplication that computes sampling errors for awide variety of statistics (totals, percents, ratios,log-odds ratios, general functions of estimates intables, linear regression parameters, and logisticregression parameters).
The test statistics used in the analysis werecalculated using the jackknife variances and thusappropriately reflected the complex nature of thesample design. In particular, an adjusted chi-square test using Satterthwaite’s approximation tothe design effect was used in the analysis of thetwo-way tables. Finally, Bonferroni adjustmentswere made to control for multiple comparisonswhere appropriate. For example, for an“experiment-wise” comparison involving gpairwise comparisons, each difference was testedat the 0.05/g significance level to control for thefact that g differences were simultaneously tested.The Bonferroni adjustment results in a moreconservative critical value being used whenjudging statistical significance. This means thatcomparisons that would have been significantwith a critical value of 1.96 may not besignificant with the more conservative criticalvalue. For example, the critical value forcomparisons between any two of the fourcategories of poverty concentration is 2.64, ratherthan 1.96. This means that there must be a largerdifference between the estimates being comparedfor there to be a statistically significantdifference.
Definitions of Analysis Variables
Categories of the analysis variables are those usedby GAO for their 1994 study.
School instructional level – Schools wereclassified according to their grade span in the1996-97 Common Core of Data (CCD) SchoolUniverse File.
Elementary school – had grade 6 orlower and no grade higher than grade 8.
Secondary school – had no grade lowerthan grade 7 and had grade 7 or higher.
Combined school – had grades higherthan grade 8 and lower than grade 7.
School enrollment size – total number ofstudents enrolled on October 1, 1998, based onresponses to question 17 on the surveyquestionnaire.
Less than 300 students
300 to 599 students
600 or more students
Locale – as defined in the 1996-97 CommonCore of Data (CCD).
Central city – a large or mid-sizecentral city of a Metropolitan StatisticalArea (MSA).
Urban fringe/large town – urban fringeis a place within an MSA of a centralcity, but not primarily its central city;large town is an incorporated place notwithin an MSA, with a populationgreater than or equal to 25,000.
Small town/rural – small town is anincorporated place not within an MSA,with a population less than 25,000 andgreater than or equal to 2,500; rural is aplace with a population less than 2,500and/or a population density of less than1,000 per square mile, and defined asrural by the U.S. Bureau of the Census.
Geographic region –
Northeast - Maine, New Hampshire,Vermont, Massachusetts, Rhode Island,Connecticut, New York, New Jersey,Pennsylvania
Midwest - Ohio, Indiana, Illinois,Michigan, Wisconsin, Minnesota, Iowa,Missouri, North Dakota, South Dakota,Nebraska, Kansas
South - Delaware, Maryland, District ofColumbia, Virginia, West Virginia,North Carolina, South Carolina,
A-9
Georgia, Florida, Kentucky, Tennessee,Alabama, Mississippi, Arkansas,Louisiana, Oklahoma, Texas
West - Montana, Idaho, Wyoming,Colorado, New Mexico, Arizona, Utah,Nevada, Washington, Oregon,California, Alaska, Hawaii
Percent minority enrollment in the school –The percent of students enrolled in the schoolwhose race or ethnicity is classified as one of thefollowing: American Indian or Alaskan Native,Asian or Pacific Islander, black, or Hispanic,based on data in the 1996-97 CCD file.
5 percent or less
6 to 20 percent
21 to 50 percent
More than 50 percent
Percent of students at the school eligible forfree or reduced-price lunch – This was based onresponses to question 20 on the surveyquestionnaire; if it was missing from thequestionnaire, it was obtained from the 1996-97CCD file. This item served as the measurementof the concentration of poverty at the school.
Less than 20 percent
20 to 39 percent
40 to 69 percent
70 percent or more
It is important to note that many of the schoolcharacteristics used for independent analyses mayalso be related to each other. For example,enrollment size and instructional level of schoolsare related, with secondary schools typicallybeing larger than elementary schools. Similarly,poverty concentration and minority enrollmentare related, with schools with a high minorityenrollment also more likely to have a highconcentration of poverty. Other relationshipsbetween analysis variables may exist. Because ofthe relatively small sample size used in this study,it is difficult to separate the independent effects ofthese variables. Their existence, however, should
be considered in the interpretation of the datapresented in this report.
Comparisons to the 1994 U.S.General Accounting Office Study
The U.S. General Accounting Office (GAO)conducted a study in 1994 on the condition ofpublic school facilities. The sample for the GAOsurvey was the public school sample from theNCES 1993-94 Schools and Staffing Survey(SASS). In May 1994, GAO mailedquestionnaires for 9,956 sampled schools to the5,459 districts in which these schools werelocated. While individual schools were sampled,the questionnaires were mailed to the districtswith which the schools were associated. Aseparate questionnaire was enclosed for eachsampled school. Completed questionnaires wereaccepted through early January 1995. Of the9,956 schools in the sample, 393 were found to beineligible, resulting in an adjusted sample of9,563 schools. There were 7,478 completed,usable questionnaires returned to GAO, for aschool response rate of 78 percent. The responseswere weighted to adjust for nonresponse andproduce national estimates.
Many of the items on the FRSS questionnairewere taken directly from the questionnaire usedby GAO in 1994. The same questionnaire itemsand analysis variables were used with theintention of providing information about changein the condition of public school facilitiesbetween 1994 when GAO conducted its surveyand 1999 when NCES conducted its survey.However, the GAO information included in thisreport is provided as contextual information only.Statistical comparisons are not provided becauseGAO does not provide standard errors for the datain their reports, and exact point estimates are alsomissing for some comparative statements fromthe GAO reports.
In addition, in some cases the data are notcompletely comparable between the two studies.In particular, the way in which the cost estimateswere obtained differed in the two studies. Bothstudies used the same wording for the cost
A-10
question, which asked what would probably bethe total cost of all repairs, renovations, andmodernizations required to put the school’s onsitebuildings into good overall condition. In theFRSS study, schools that reported in the firstquestion on the survey that the condition of anytype of onsite building (original building,permanent addition, or temporary building) orany building feature (e.g., roofs, plumbing,electric power) was less than good (i.e., wasgiven a rating of adequate, fair, poor, or replace)provided information about the cost of the neededrepairs, renovations, and modernizations. TheGAO study, however, asked about the conditionof the types of onsite buildings, followed by thequestion about the cost to bring the onsitebuildings into good overall condition. Thequestion about the condition of various buildingfeatures was asked several pages later in the GAOstudy. Thus, even though the wording of the costquestion was the same in the FRSS and GAOstudies, the two studies may include costs fordifferent things, since respondents to the GAOstudy were not explicitly prompted to includecosts associated with building features. However,since building features (e.g., roofs and plumbing)are important aspects of the condition ofbuildings, respondents to the GAO study mayhave included costs associated with these featuresin their cost estimates. Because of themethodological differences between the twostudies, the cost estimates from them should notbe directly compared.
When the FRSS data are reanalyzed to includeonly those schools that reported on thequestionnaire that the condition of any type ofonsite building was less than good, the percentageof schools that reported needing to spend moneyto bring the onsite buildings into good overallcondition drops from 76 percent to 52 percent.The total amount needed for the repairs,renovations, and modernizations for this group ofschools was estimated to be approximately $111billion, down from the approximately $127billion needed by the schools with any type ofbuilding or any building feature in less than good
condition.47 However, the data are still notcompletely comparable to the GAO study due tothe different ordering of the questions.
GAO also presented two cost estimates based ondata from their 1994 study: $112 billion and$101 billion (U.S. GAO 1995a). GAO derivedthe estimate of $112 billion by summing theamount reported for the cost of all repairs,renovations, and modernizations to put schoolsinto good overall condition (estimated at $101billion), and the amounts reported that wouldneed to be spent in the next 3 years to complywith various federal mandates, such as asbestosremoval and accessibility for students withdisabilities (estimated at $11 billion). The $101billion and the $11 billion were collected in twoseparate questions at different points in thesurvey. It is possible that the $112 billionincludes some duplication of money needed,since the $11 billion needed to comply withfederal mandates may or may not have beenincluded by respondents in the $101 billionneeded to put schools into good overall condition.The FRSS survey did not collect informationabout spending on federal mandates.
When the 1994 GAO estimate of $101 billionneeded for repairs, renovations, andmodernizations is adjusted for inflation to 1999dollars, the inflation-adjusted estimate is $112billion needed for repairs, renovations, andmodernizations.48 However, since GAO does notprovide either a confidence interval or a standarderror for the estimate of $101 billion dollars, it isnot possible to do a statistical test of differencesbetween the FRSS and GAO estimates.
Other cost estimates provided in the GAO reportsinclude a combined dollar estimate for both theamount needed for repairs, renovations, andmodernizations, and the amount needed to
47 The standard error for the 52 percent of schools that needed to
spend money is 1.7. The standard error for the $111 billion is 7.1billion.
48 This inflation-adjusted estimate of $112 billion should not beconfused with the estimate of $112 billion that GAO derived in1994 by combining the estimate of $101 billion needed for repairs,renovations, and modernizations with the estimate of $11 billionneeded to comply with federal mandates.
A-11
comply with federal mandates. For example,GAO reports that 84 percent of schools needed tospend money, and of those schools needing tospend money, the average amount needed perschool was $1.7 million (U.S. GAO 1996).However, the percentage of schools needing tospend money and the estimate of $1.7 millionincludes money needed to comply with federalmandates. GAO does not report the percentage ofschools needing to spend money or an averageamount needed per school for just repairs,renovations, and modernizations, which is what isreported for the FRSS survey.
GAO also reports more differences by schoolcharacteristics than are found in the FRSS study.For example, according to GAO, “…on everymeasure—proportion of schools reportinginadequate buildings, inadequate buildingfeatures, and unsatisfactory environmentalconditions; proportion of schools reportingneeding to spend above the national average; andnumber of students attending these schools—thesame subgroups consistently emerged as thosewith the most problems. These subgroupsincluded central cities, the western region of thecountry, large schools, secondary schools, schoolsreporting student populations of at least 50.5percent minority students, and schools reportingstudent populations of 70 percent or more poorstudents. The differences between subgroups,however, were often relatively small.” (U.S. GAO1996, p. 2). However, GAO provides noinformation about whether statistical testing wasdone, and if so, what critical values were used toindicate statistically significant differences. Inaddition, the sample size in the GAO study wasmuch larger than in the FRSS study (7,478 versus903 respondents). Estimates from larger samplestypically have smaller standard errors thanestimates from smaller samples; consequently,smaller differences tend to be statisticallysignificant in surveys with larger samplescompared to the same differences in surveys withsmaller samples. Thus, the “relatively small”differences that GAO refers to would be morelikely to be significantly different in the GAOstudy than in the FRSS study in any statisticaltesting that was done. That is, FRSS may haveidentified fewer differences as significant whilethe GAO study may have identified more
differences as significant only as a function ofdifferences in sample size.
Comparisons to the 2000 NationalEducation Association Study
The National Education Association (NEA)recently published a report that provided a costestimate of $322 billion needed for schoolmodernization (NEA 2000). The study on whichthis report is based differs in many ways from theFRSS study. The major difference is what isincluded in this estimate. The NEA estimate hastwo components: funds for school infrastructureneeds (estimated at $268 billion), and funds foreducation technology needs (estimated at $54billion). School infrastructure needs consisted ofnew school construction (including the buildings,grounds [purchase, landscaping, and paving], andthe fixtures, major equipment, and furniturenecessary to furnish it); additions to existingfacilities (including the fixtures, majorequipment, and furniture necessary to furnish it);renovation of an existing facility; retrofitting ofan existing facility (including for technologyreadiness, such as phone lines and fiber opticcable); deferred maintenance (maintenancenecessary to bring a school facility up to goodcondition, or to replace a facility if it is in suchpoor condition that it cannot be brought up togood condition); and major improvements togrounds, such as landscaping and paving.Education technology needs consisted ofcomputers and peripherals; software; connectivity(including Internet access); networks; technologyinfrastructure (including electrical upgrades, andwiring and cables to, within, and betweenschools); distance education; maintenance andrepair of technology equipment; and technology-related professional development and support forteachers. In contrast, the FRSS study asked foran estimate of the total cost of all repairs,renovations, and modernizations required to putthe school’s onsite buildings into good overallcondition. Thus, the cost estimate from the FRSSstudy encompasses only a small part of what isincluded in the cost estimate from the NEA study.
A-12
In addition, the two studies obtained informationin very different ways. The FRSS study wasdesigned to be completed about sampled schoolsby district-level personnel who were very familiarwith the school facilities in the district, inconsultation with school-level personnel ifnecessary. These data were then weighted toproduce national estimates that represent allregular public schools in the United States. Incontrast, the NEA report obtained state-level datafrom numerous sources to come up with their costestimate. These sources included policy andresearch literature, policy and research databases,the NEA annual Survey of State School FinanceLegislation, and the NEA Modernization NeedsAssessment Questionnaire, conducted in 1999. Itshould also be noted that while NEA describestheir study as a 50-state report of schoolmodernization needs, the study received usableresponses about school infrastructure from only24 states, and about education technology fromonly 2 states. The remaining data were derivedby various estimation techniques. The FRSSstudy, on the other hand, had a 91 percentresponse rate, and used a weighting processdesigned to adjust for variable probabilities ofselection and differential nonresponse.
Background Information
The survey was performed under contract withWestat, using the Fast Response Survey System(FRSS). Westat’s Project Director was ElizabethFarris, and the Survey Managers were LaurieLewis and Kyle Snow. Bernie Greene was theNCES Project Officer. The data were requestedby the Office of the Under Secretary, U.S.Department of Education. Within the Office ofthe Under Secretary, input was provided byThomas Corwin, James Houser, and StephanieStullich.
This report was reviewed by the followingindividuals:
Outside NCES
• William Brenner, National Clearinghouse forEducational Facilities
• Richard DiCola, Office of Vocational andAdult Education, U.S. Department ofEducation
• Mary Filardo, 21st Century School Fund• Kimberly Jenkins, Office of the General
Counsel, U.S. Department of Education• Judy Marks, National Clearinghouse for
Educational Facilities• Eileen O’Brien, Office of Educational
Research and Improvement, U.S. Departmentof Education
• Mary Schifferli, Office for Civil Rights, U.S.Department of Education
Inside NCES
• Ellen Bradburn, Early Childhood,International, and Crosscutting StudiesDivision
• Kerry Gruber, Elementary/Secondary andLibraries Studies Division
• Lee Hoffman, Elementary/Secondary andLibraries Studies Division
• Marilyn McMillen, Chief Statistician• Valena Plisko, Associate Commissioner,
Early Childhood, International, andCrosscutting Studies Division
• John Ralph, Early Childhood, International,and Crosscutting Studies Division
For more information about the Fast ResponseSurvey System (FRSS) or the survey on thecondition of public school facilities, contactBernie Greene, Early Childhood, International,and Crosscutting Studies Division, NationalCenter for Education Statistics, Office ofEducational Research and Improvement, U.S.Department of Education, 1990 K Street, NW,Washington, DC 20006, e-mail:[email protected], telephone (202) 502-7348.
A-13
Photo Credits
All photographs on the cover are from Photodisc,Inc., except the photograph in the third row,middle position is from Contact Press Images, ©Alon Reininger, and the photograph in the bottomrow, left position is from Stock, Boston, ©Richard Pasley.

A-14
B-1
Appendix B
Tables of Standard Errors

B-2
B-3
Table of Contents
Standard Error Tables for Text Tables and Figures
Table Page
1a Standard errors of the percent of public schools with each type of building, and thepercentage distribution of ratings of the overall condition of the building types: 1999 .. B-5
2a Standard errors of the percent of public schools with each type of building, and thepercent rating each building type in less than adequate condition, by schoolcharacteristics: 1999 ........................................................................................................ B-6
3a Standard errors of the number and percentage distributions of public schools andenrollments according to the condition of all onsite building types: 1999 ...................... B-7
4a Standard errors of the percent of public schools rating the condition of buildingfeatures as less than adequate, by school characteristics: 1999....................................... B-8
5a Standard errors of the percent of public schools reporting needing to spend money onrepairs, renovations, and modernizations to bring the school into good overall condition,and the cost per student of the repairs, renovations, and modernizations, by schoolcharacteristics: 1999 ........................................................................................................ B-9
6a Standard errors of the percent of public schools indicating the sources of cost estimatesfor all repairs, renovations, and modernizations required to bring the school’s onsitebuildings into good overall condition: 1999..................................................................... B-10
7a Standard errors of the percentage distribution of public schools indicating the typeof source used for cost estimates and the average cost per school for all repairs,renovations, and modernizations required to bring the school’s onsite buildings intogood overall condition: 1999........................................................................................... B-11
8a Standard errors of the percent of public schools rating the condition of environmentalfactors as unsatisfactory, by school characteristics: 1999 ............................................... B-12
9a Standard errors of the percentage distribution of public schools according to the statusof air conditioning in various areas of their school buildings: 1999................................ B-13
10a Standard errors of the percentage distribution of public schools according to thestatus of air conditioning in classrooms, by school characteristics: 1999 ....................... B-14
11a Standard errors of the percent of public schools with air conditioning in various areasof the school, and the percentage distribution of those schools according to satisfactionwith the condition of air conditioning in the school areas: 1999..................................... B-15
12a Standard errors of the percent of public schools with a written long-range educationalfacilities plan for the school, by school characteristics: 1999 ......................................... B-16
B-4
13a Standard errors of the percent of public schools with construction projects planned forthe school in the next 2 years, by school characteristics: 1999 ....................................... B-17
14a Standard errors of the percent of public schools with plans to make at least one majorrepair, renovation, or replacement to a building feature in the next 2 years, by schoolcharacteristics: 1999 ........................................................................................................ B-18
15a Standard errors of the percentage distribution of public schools according to theirplans for major repair, renovation, or replacement of each building feature in thenext 2 years: 1999............................................................................................................ B-19
16a Standard errors of the percentage distribution of public schools according to schoolplans for major repair, renovation, or replacement of each building feature in the next2 years, by condition of the building feature: 1999 ......................................................... B-20
17a Standard errors of the age of public schools based upon years since construction ofthe main instructional building(s), years since most recent major renovation, andfunctional age of the school, by school characteristics: 1999.......................................... B-21
18a Standard errors of the percentage distribution of public schools according to thefunctional age of the school, by school characteristics: 1999.......................................... B-22
19a Standard errors of the percentage distribution of public schools reporting that they areunderenrolled, at capacity, or overcrowded, by school characteristics: 1999 ................. B-23
20a Standard errors of the percent of public schools in each enrollment to capacity ratiocategory rating the condition of building features as less than adequate: 1999................ B-24
21a Standard errors of the percent of public schools in each enrollment to capacity ratiocategory rating the condition of environmental factors as unsatisfactory: 1999 .............. B-25
22a Standard errors of the percent of public schools that report using various space andscheduling practices, and the extent to which the practice is used to alleviateovercrowding: 1999......................................................................................................... B-26
23 Standard errors for the figures and for data not shown in tables: 1999 ........................... B-27
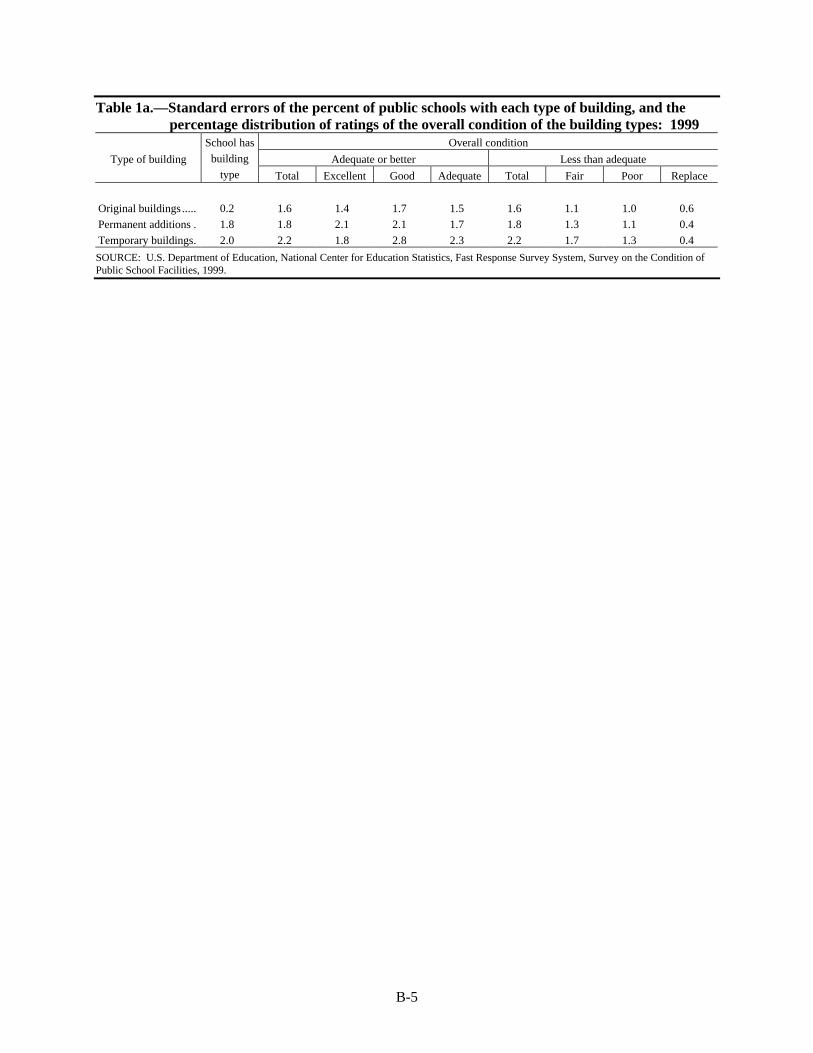
B-5
Table 1a.—Standard errors of the percent of public schools with each type of building, and thepercentage distribution of ratings of the overall condition of the building types: 1999
Overall condition
Adequate or better Less than adequateType of building
School has
building
type Total Excellent Good Adequate Total Fair Poor Replace
Original buildings..... 0.2 1.6 1.4 1.7 1.5 1.6 1.1 1.0 0.6
Permanent additions . 1.8 1.8 2.1 2.1 1.7 1.8 1.3 1.1 0.4
Temporary buildings. 2.0 2.2 1.8 2.8 2.3 2.2 1.7 1.3 0.4
SOURCE: U.S. Department of Education, National Center for Education Statistics, Fast Response Survey System, Survey on the Condition ofPublic School Facilities, 1999.
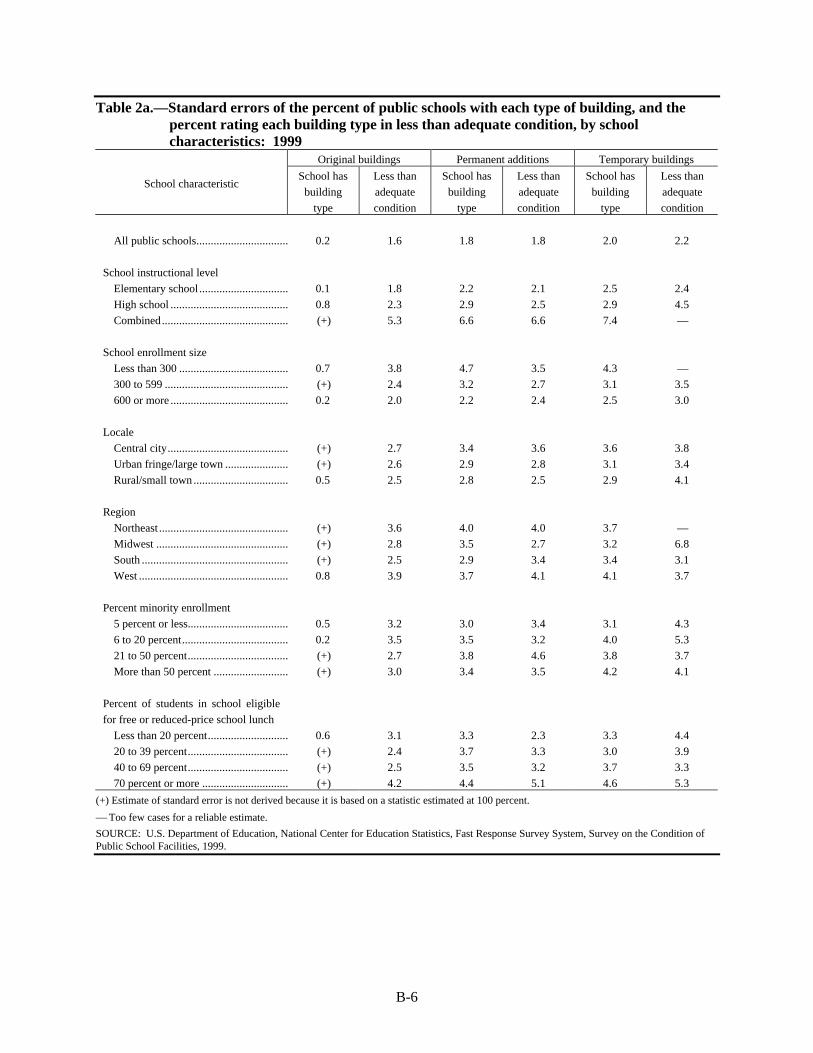
B-6
Table 2a.—Standard errors of the percent of public schools with each type of building, and thepercent rating each building type in less than adequate condition, by schoolcharacteristics: 1999
Original buildings Permanent additions Temporary buildings
School characteristicSchool has
building
type
Less than
adequate
condition
School has
building
type
Less than
adequate
condition
School has
building
type
Less than
adequate
condition
All public schools................................ 0.2 1.6 1.8 1.8 2.0 2.2
School instructional level
Elementary school ............................... 0.1 1.8 2.2 2.1 2.5 2.4
High school ......................................... 0.8 2.3 2.9 2.5 2.9 4.5
Combined............................................ (+) 5.3 6.6 6.6 7.4 —
School enrollment size
Less than 300 ...................................... 0.7 3.8 4.7 3.5 4.3 —
300 to 599 ........................................... (+) 2.4 3.2 2.7 3.1 3.5
600 or more ......................................... 0.2 2.0 2.2 2.4 2.5 3.0
Locale
Central city.......................................... (+) 2.7 3.4 3.6 3.6 3.8
Urban fringe/large town ...................... (+) 2.6 2.9 2.8 3.1 3.4
Rural/small town ................................. 0.5 2.5 2.8 2.5 2.9 4.1
Region
Northeast ............................................. (+) 3.6 4.0 4.0 3.7 —
Midwest .............................................. (+) 2.8 3.5 2.7 3.2 6.8
South ................................................... (+) 2.5 2.9 3.4 3.4 3.1
West .................................................... 0.8 3.9 3.7 4.1 4.1 3.7
Percent minority enrollment
5 percent or less................................... 0.5 3.2 3.0 3.4 3.1 4.3
6 to 20 percent..................................... 0.2 3.5 3.5 3.2 4.0 5.3
21 to 50 percent................................... (+) 2.7 3.8 4.6 3.8 3.7
More than 50 percent .......................... (+) 3.0 3.4 3.5 4.2 4.1
Percent of students in school eligible
for free or reduced-price school lunch
Less than 20 percent............................ 0.6 3.1 3.3 2.3 3.3 4.4
20 to 39 percent................................... (+) 2.4 3.7 3.3 3.0 3.9
40 to 69 percent................................... (+) 2.5 3.5 3.2 3.7 3.3
70 percent or more .............................. (+) 4.2 4.4 5.1 4.6 5.3
(+) Estimate of standard error is not derived because it is based on a statistic estimated at 100 percent.
— Too few cases for a reliable estimate.
SOURCE: U.S. Department of Education, National Center for Education Statistics, Fast Response Survey System, Survey on the Condition ofPublic School Facilities, 1999.
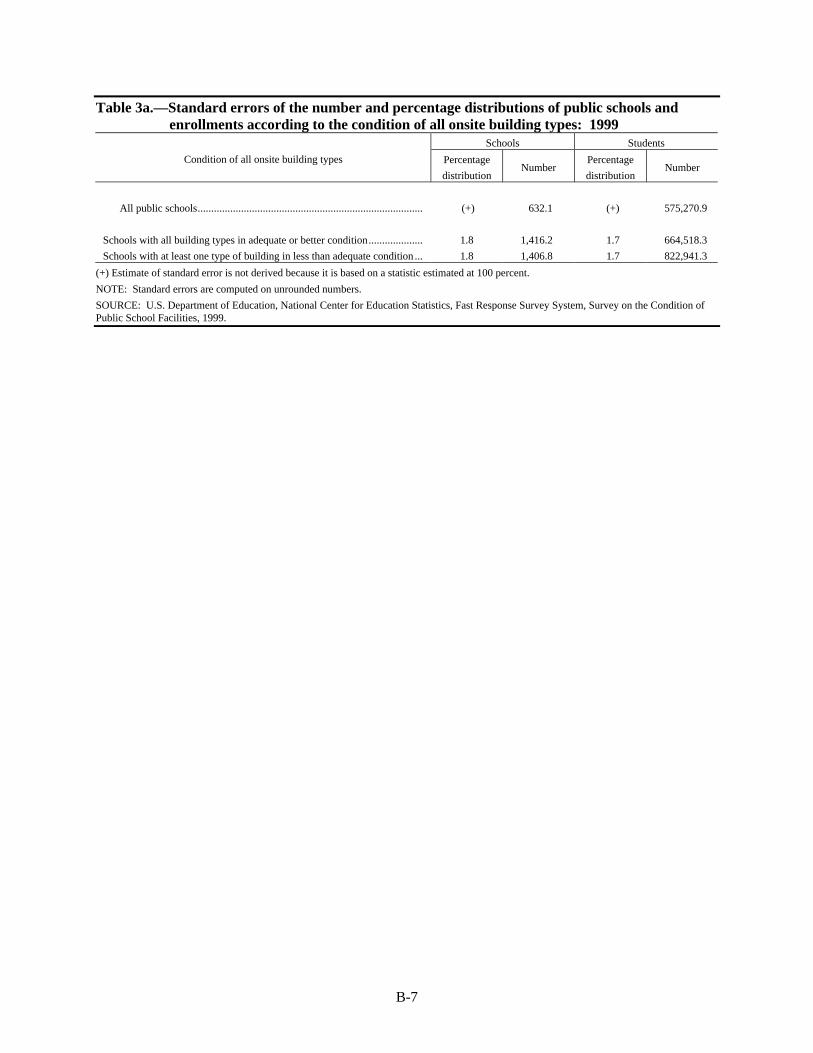
B-7
Table 3a.—Standard errors of the number and percentage distributions of public schools andenrollments according to the condition of all onsite building types: 1999
Schools Students
Condition of all onsite building types Percentage
distributionNumber
Percentage
distributionNumber
All public schools................................................................................... (+) 632.1 (+) 575,270.9
Schools with all building types in adequate or better condition.................... 1.8 1,416.2 1.7 664,518.3
Schools with at least one type of building in less than adequate condition ... 1.8 1,406.8 1.7 822,941.3
(+) Estimate of standard error is not derived because it is based on a statistic estimated at 100 percent.
NOTE: Standard errors are computed on unrounded numbers.
SOURCE: U.S. Department of Education, National Center for Education Statistics, Fast Response Survey System, Survey on the Condition ofPublic School Facilities, 1999.
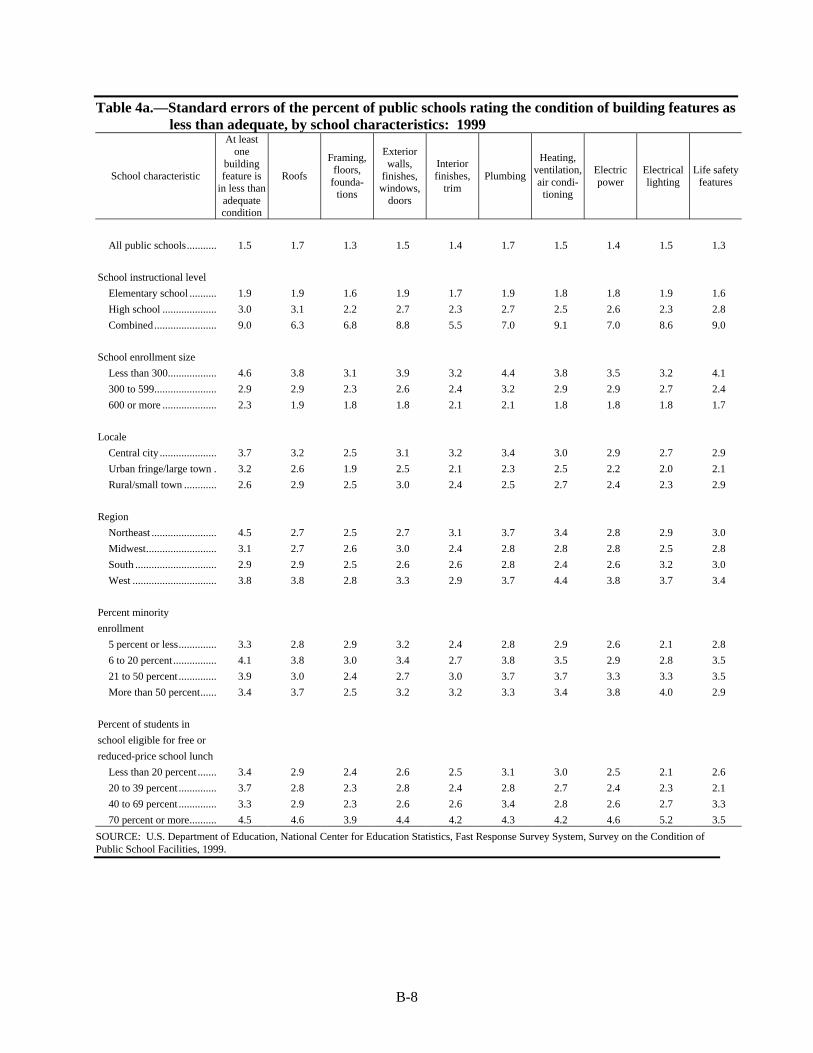
B-8
Table 4a.—Standard errors of the percent of public schools rating the condition of building features asless than adequate, by school characteristics: 1999
School characteristic
At leastone
buildingfeature is
in less thanadequatecondition
Roofs
Framing,floors,
founda-tions
Exteriorwalls,
finishes,windows,
doors
Interiorfinishes,
trimPlumbing
Heating,ventilation,air condi-
tioning
Electricpower
Electricallighting
Life safetyfeatures
All public schools........... 1.5 1.7 1.3 1.5 1.4 1.7 1.5 1.4 1.5 1.3
School instructional level
Elementary school .......... 1.9 1.9 1.6 1.9 1.7 1.9 1.8 1.8 1.9 1.6
High school .................... 3.0 3.1 2.2 2.7 2.3 2.7 2.5 2.6 2.3 2.8
Combined....................... 9.0 6.3 6.8 8.8 5.5 7.0 9.1 7.0 8.6 9.0
School enrollment size
Less than 300.................. 4.6 3.8 3.1 3.9 3.2 4.4 3.8 3.5 3.2 4.1
300 to 599....................... 2.9 2.9 2.3 2.6 2.4 3.2 2.9 2.9 2.7 2.4
600 or more .................... 2.3 1.9 1.8 1.8 2.1 2.1 1.8 1.8 1.8 1.7
Locale
Central city ..................... 3.7 3.2 2.5 3.1 3.2 3.4 3.0 2.9 2.7 2.9
Urban fringe/large town . 3.2 2.6 1.9 2.5 2.1 2.3 2.5 2.2 2.0 2.1
Rural/small town ............ 2.6 2.9 2.5 3.0 2.4 2.5 2.7 2.4 2.3 2.9
Region
Northeast ........................ 4.5 2.7 2.5 2.7 3.1 3.7 3.4 2.8 2.9 3.0
Midwest.......................... 3.1 2.7 2.6 3.0 2.4 2.8 2.8 2.8 2.5 2.8
South .............................. 2.9 2.9 2.5 2.6 2.6 2.8 2.4 2.6 3.2 3.0
West ............................... 3.8 3.8 2.8 3.3 2.9 3.7 4.4 3.8 3.7 3.4
Percent minority
enrollment
5 percent or less.............. 3.3 2.8 2.9 3.2 2.4 2.8 2.9 2.6 2.1 2.8
6 to 20 percent................ 4.1 3.8 3.0 3.4 2.7 3.8 3.5 2.9 2.8 3.5
21 to 50 percent .............. 3.9 3.0 2.4 2.7 3.0 3.7 3.7 3.3 3.3 3.5
More than 50 percent...... 3.4 3.7 2.5 3.2 3.2 3.3 3.4 3.8 4.0 2.9
Percent of students in
school eligible for free or
reduced-price school lunch
Less than 20 percent ....... 3.4 2.9 2.4 2.6 2.5 3.1 3.0 2.5 2.1 2.6
20 to 39 percent .............. 3.7 2.8 2.3 2.8 2.4 2.8 2.7 2.4 2.3 2.1
40 to 69 percent .............. 3.3 2.9 2.3 2.6 2.6 3.4 2.8 2.6 2.7 3.3
70 percent or more.......... 4.5 4.6 3.9 4.4 4.2 4.3 4.2 4.6 5.2 3.5
SOURCE: U.S. Department of Education, National Center for Education Statistics, Fast Response Survey System, Survey on the Condition ofPublic School Facilities, 1999.
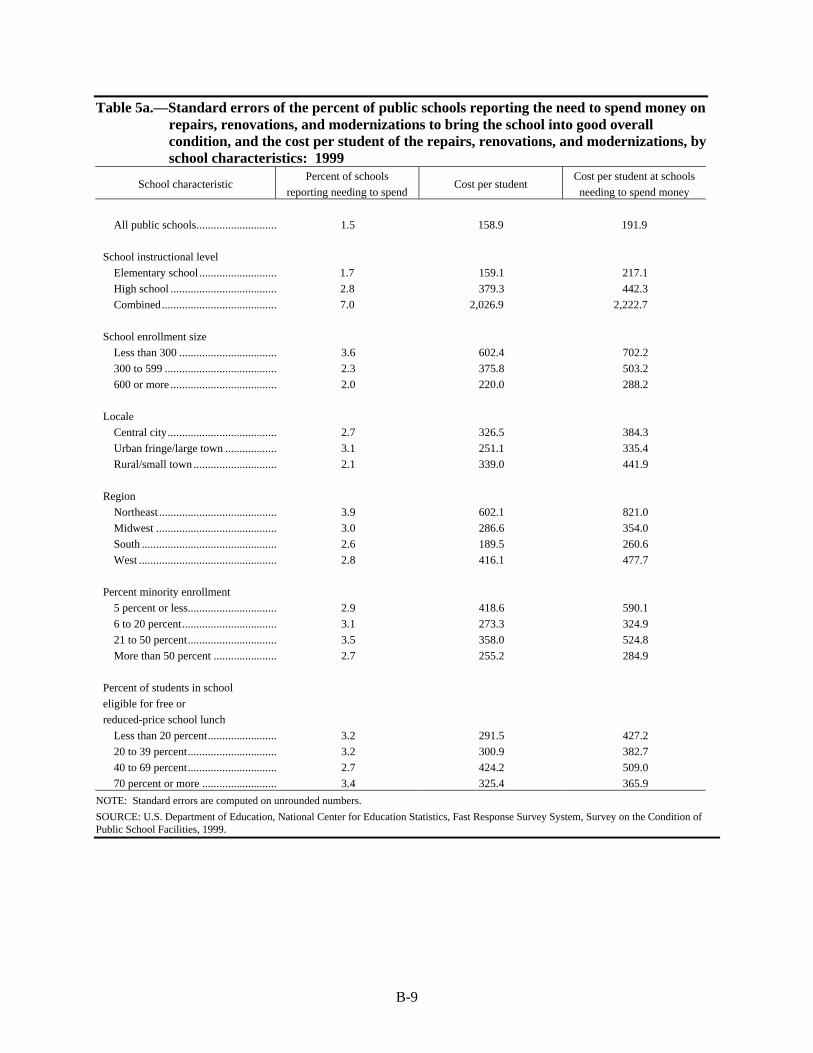
B-9
Table 5a.—Standard errors of the percent of public schools reporting the need to spend money onrepairs, renovations, and modernizations to bring the school into good overallcondition, and the cost per student of the repairs, renovations, and modernizations, byschool characteristics: 1999
School characteristicPercent of schools
reporting needing to spendCost per student
Cost per student at schools
needing to spend money
All public schools............................ 1.5 158.9 191.9
School instructional level
Elementary school ........................... 1.7 159.1 217.1
High school ..................................... 2.8 379.3 442.3
Combined........................................ 7.0 2,026.9 2,222.7
School enrollment size
Less than 300 .................................. 3.6 602.4 702.2
300 to 599 ....................................... 2.3 375.8 503.2
600 or more ..................................... 2.0 220.0 288.2
Locale
Central city...................................... 2.7 326.5 384.3
Urban fringe/large town .................. 3.1 251.1 335.4
Rural/small town ............................. 2.1 339.0 441.9
Region
Northeast ......................................... 3.9 602.1 821.0
Midwest .......................................... 3.0 286.6 354.0
South ............................................... 2.6 189.5 260.6
West ................................................ 2.8 416.1 477.7
Percent minority enrollment
5 percent or less............................... 2.9 418.6 590.1
6 to 20 percent................................. 3.1 273.3 324.9
21 to 50 percent............................... 3.5 358.0 524.8
More than 50 percent ...................... 2.7 255.2 284.9
Percent of students in school
eligible for free or
reduced-price school lunch
Less than 20 percent........................ 3.2 291.5 427.2
20 to 39 percent............................... 3.2 300.9 382.7
40 to 69 percent............................... 2.7 424.2 509.0
70 percent or more .......................... 3.4 325.4 365.9
NOTE: Standard errors are computed on unrounded numbers.
SOURCE: U.S. Department of Education, National Center for Education Statistics, Fast Response Survey System, Survey on the Condition ofPublic School Facilities, 1999.
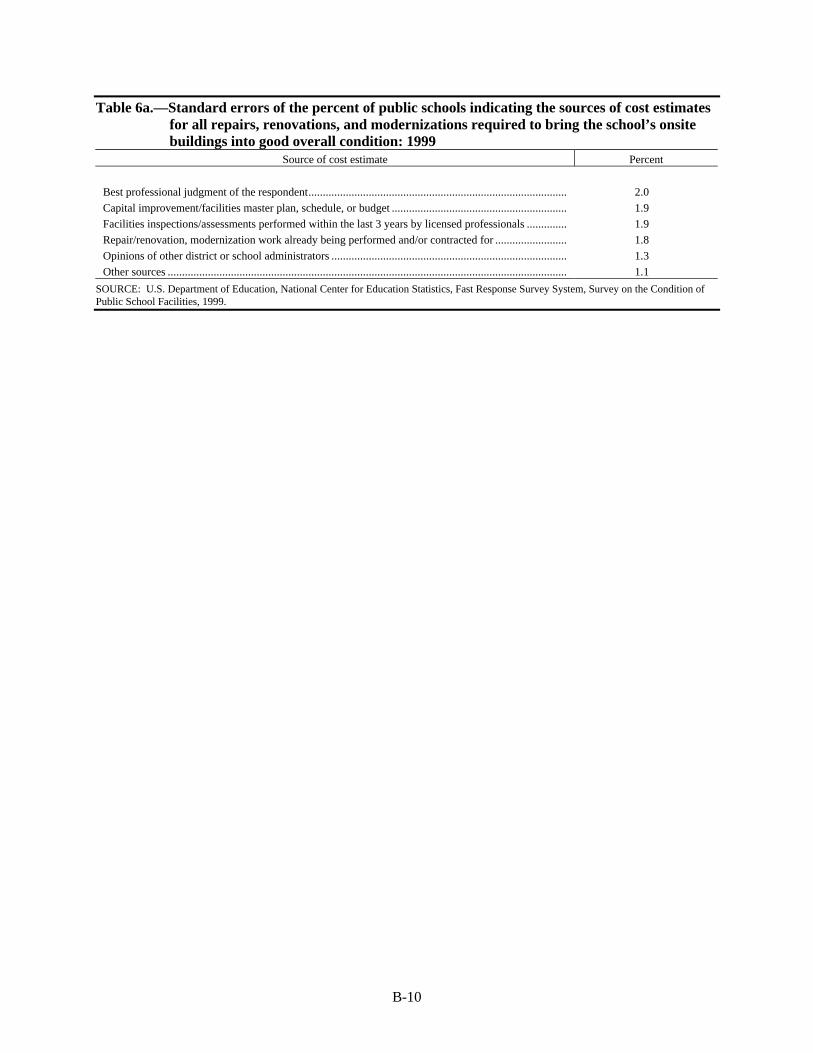
B-10
Table 6a.—Standard errors of the percent of public schools indicating the sources of cost estimatesfor all repairs, renovations, and modernizations required to bring the school’s onsitebuildings into good overall condition: 1999
Source of cost estimate Percent
Best professional judgment of the respondent.......................................................................................... 2.0
Capital improvement/facilities master plan, schedule, or budget ............................................................. 1.9
Facilities inspections/assessments performed within the last 3 years by licensed professionals .............. 1.9
Repair/renovation, modernization work already being performed and/or contracted for ......................... 1.8
Opinions of other district or school administrators .................................................................................. 1.3
Other sources ........................................................................................................................................... 1.1
SOURCE: U.S. Department of Education, National Center for Education Statistics, Fast Response Survey System, Survey on the Condition ofPublic School Facilities, 1999.
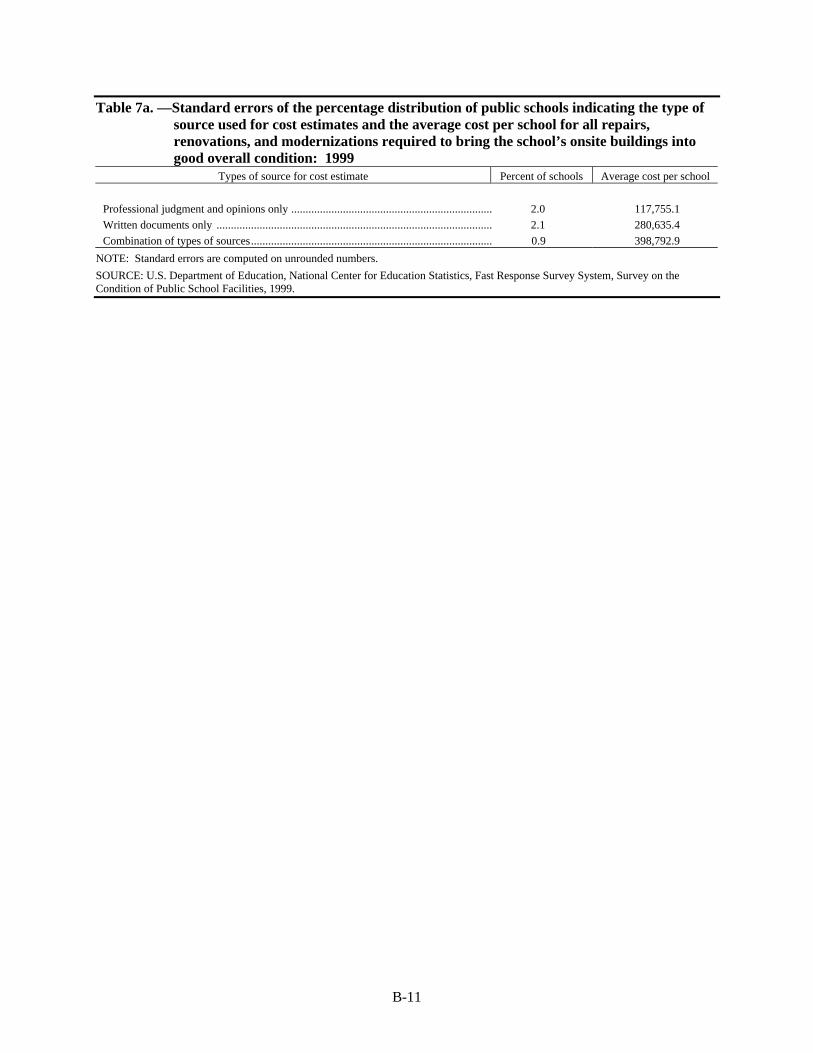
B-11
Table 7a. —Standard errors of the percentage distribution of public schools indicating the type ofsource used for cost estimates and the average cost per school for all repairs,renovations, and modernizations required to bring the school’s onsite buildings intogood overall condition: 1999
Types of source for cost estimate Percent of schools Average cost per school
Professional judgment and opinions only ...................................................................... 2.0 117,755.1
Written documents only ................................................................................................ 2.1 280,635.4
Combination of types of sources.................................................................................... 0.9 398,792.9
NOTE: Standard errors are computed on unrounded numbers.
SOURCE: U.S. Department of Education, National Center for Education Statistics, Fast Response Survey System, Survey on theCondition of Public School Facilities, 1999.
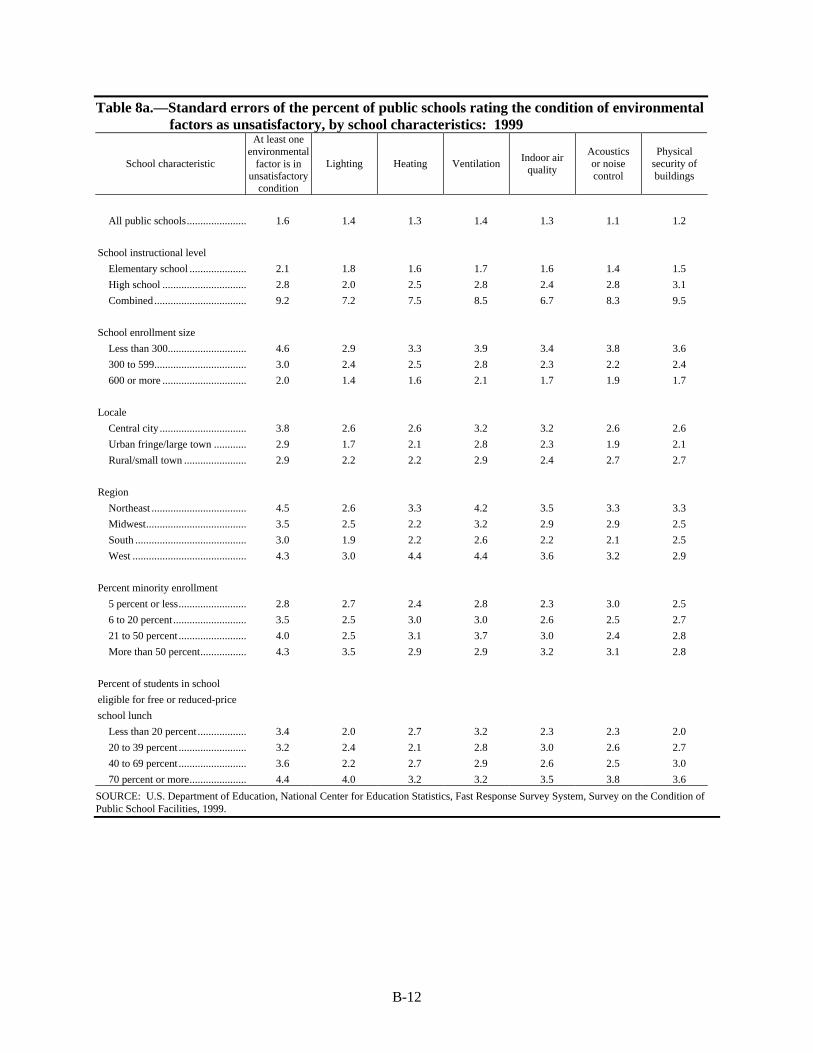
B-12
Table 8a.—Standard errors of the percent of public schools rating the condition of environmentalfactors as unsatisfactory, by school characteristics: 1999
School characteristic
At least oneenvironmental
factor is inunsatisfactory
condition
Lighting Heating VentilationIndoor air
quality
Acousticsor noisecontrol
Physicalsecurity ofbuildings
All public schools...................... 1.6 1.4 1.3 1.4 1.3 1.1 1.2
School instructional level
Elementary school ..................... 2.1 1.8 1.6 1.7 1.6 1.4 1.5
High school ............................... 2.8 2.0 2.5 2.8 2.4 2.8 3.1
Combined.................................. 9.2 7.2 7.5 8.5 6.7 8.3 9.5
School enrollment size
Less than 300............................. 4.6 2.9 3.3 3.9 3.4 3.8 3.6
300 to 599.................................. 3.0 2.4 2.5 2.8 2.3 2.2 2.4
600 or more ............................... 2.0 1.4 1.6 2.1 1.7 1.9 1.7
Locale
Central city ................................ 3.8 2.6 2.6 3.2 3.2 2.6 2.6
Urban fringe/large town ............ 2.9 1.7 2.1 2.8 2.3 1.9 2.1
Rural/small town ....................... 2.9 2.2 2.2 2.9 2.4 2.7 2.7
Region
Northeast ................................... 4.5 2.6 3.3 4.2 3.5 3.3 3.3
Midwest..................................... 3.5 2.5 2.2 3.2 2.9 2.9 2.5
South ......................................... 3.0 1.9 2.2 2.6 2.2 2.1 2.5
West .......................................... 4.3 3.0 4.4 4.4 3.6 3.2 2.9
Percent minority enrollment
5 percent or less......................... 2.8 2.7 2.4 2.8 2.3 3.0 2.5
6 to 20 percent........................... 3.5 2.5 3.0 3.0 2.6 2.5 2.7
21 to 50 percent ......................... 4.0 2.5 3.1 3.7 3.0 2.4 2.8
More than 50 percent................. 4.3 3.5 2.9 2.9 3.2 3.1 2.8
Percent of students in school
eligible for free or reduced-price
school lunch
Less than 20 percent .................. 3.4 2.0 2.7 3.2 2.3 2.3 2.0
20 to 39 percent ......................... 3.2 2.4 2.1 2.8 3.0 2.6 2.7
40 to 69 percent ......................... 3.6 2.2 2.7 2.9 2.6 2.5 3.0
70 percent or more..................... 4.4 4.0 3.2 3.2 3.5 3.8 3.6
SOURCE: U.S. Department of Education, National Center for Education Statistics, Fast Response Survey System, Survey on the Condition ofPublic School Facilities, 1999.
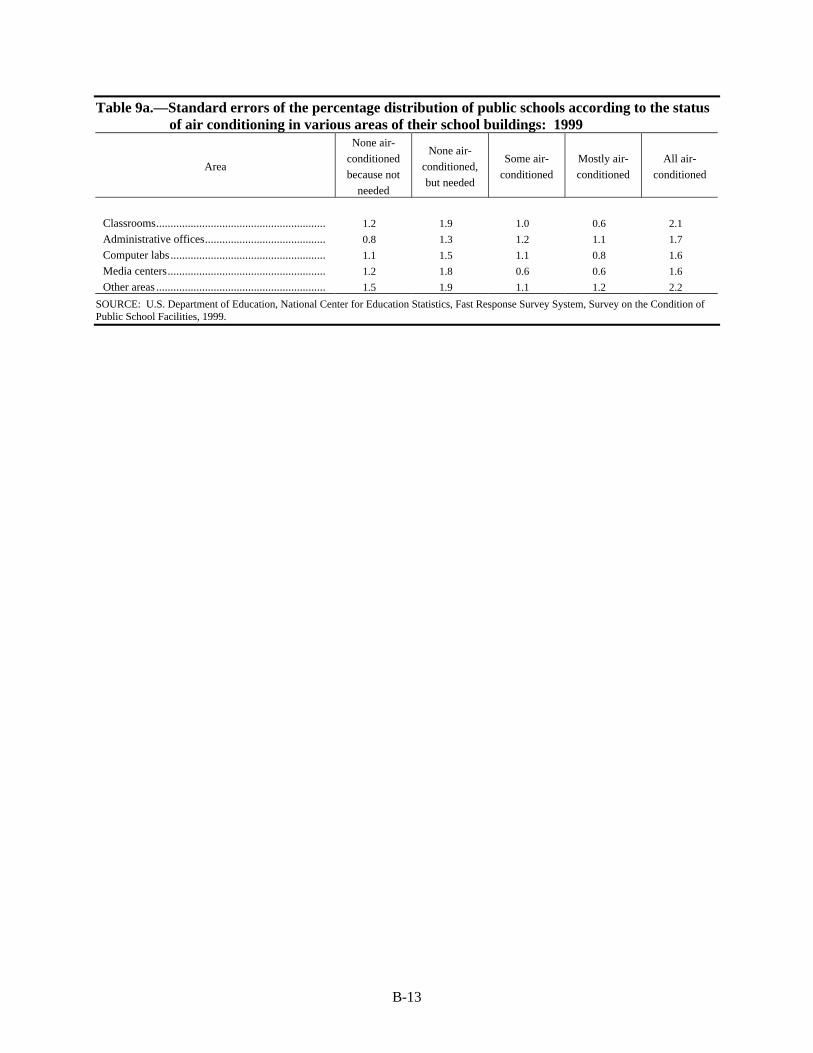
B-13
Table 9a.—Standard errors of the percentage distribution of public schools according to the statusof air conditioning in various areas of their school buildings: 1999
Area
None air-
conditioned
because not
needed
None air-
conditioned,
but needed
Some air-
conditioned
Mostly air-
conditioned
All air-
conditioned
Classrooms........................................................... 1.2 1.9 1.0 0.6 2.1
Administrative offices.......................................... 0.8 1.3 1.2 1.1 1.7
Computer labs...................................................... 1.1 1.5 1.1 0.8 1.6
Media centers....................................................... 1.2 1.8 0.6 0.6 1.6
Other areas ........................................................... 1.5 1.9 1.1 1.2 2.2
SOURCE: U.S. Department of Education, National Center for Education Statistics, Fast Response Survey System, Survey on the Condition ofPublic School Facilities, 1999.
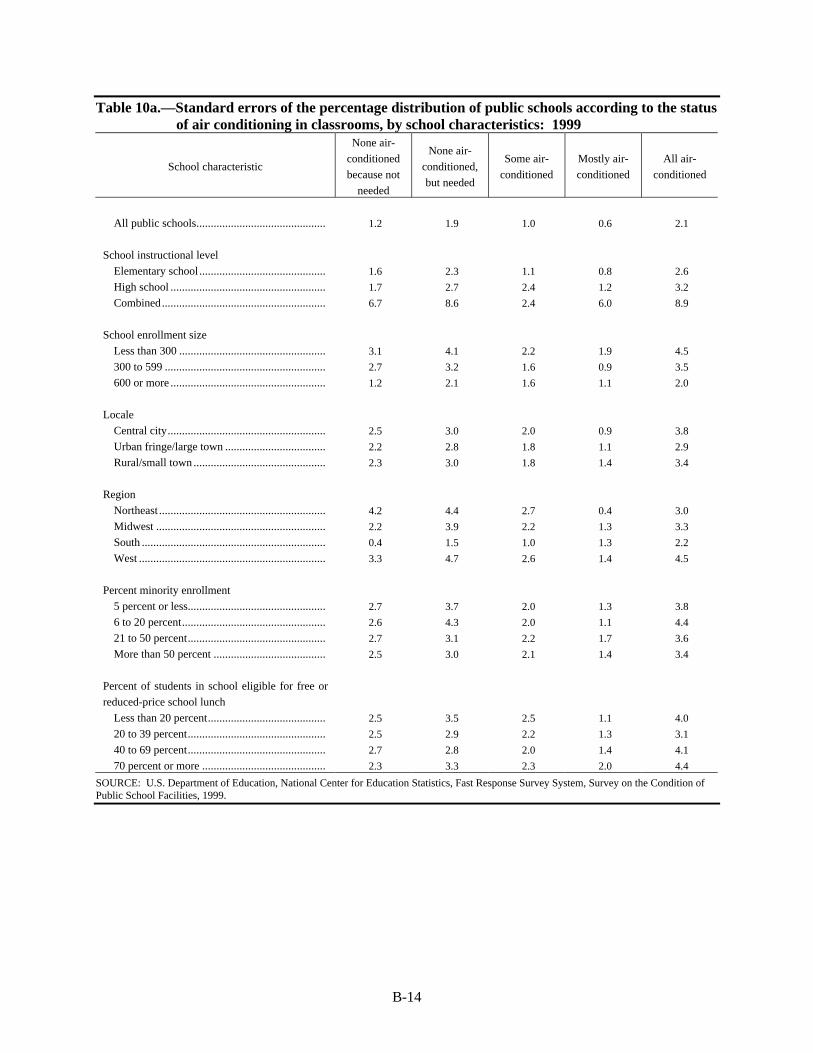
B-14
Table 10a.—Standard errors of the percentage distribution of public schools according to the statusof air conditioning in classrooms, by school characteristics: 1999
School characteristic
None air-
conditioned
because not
needed
None air-
conditioned,
but needed
Some air-
conditioned
Mostly air-
conditioned
All air-
conditioned
All public schools............................................. 1.2 1.9 1.0 0.6 2.1
School instructional level
Elementary school ............................................ 1.6 2.3 1.1 0.8 2.6
High school ...................................................... 1.7 2.7 2.4 1.2 3.2
Combined......................................................... 6.7 8.6 2.4 6.0 8.9
School enrollment size
Less than 300 ................................................... 3.1 4.1 2.2 1.9 4.5
300 to 599 ........................................................ 2.7 3.2 1.6 0.9 3.5
600 or more ...................................................... 1.2 2.1 1.6 1.1 2.0
Locale
Central city....................................................... 2.5 3.0 2.0 0.9 3.8
Urban fringe/large town ................................... 2.2 2.8 1.8 1.1 2.9
Rural/small town .............................................. 2.3 3.0 1.8 1.4 3.4
Region
Northeast .......................................................... 4.2 4.4 2.7 0.4 3.0
Midwest ........................................................... 2.2 3.9 2.2 1.3 3.3
South ................................................................ 0.4 1.5 1.0 1.3 2.2
West ................................................................. 3.3 4.7 2.6 1.4 4.5
Percent minority enrollment
5 percent or less................................................ 2.7 3.7 2.0 1.3 3.8
6 to 20 percent.................................................. 2.6 4.3 2.0 1.1 4.4
21 to 50 percent................................................ 2.7 3.1 2.2 1.7 3.6
More than 50 percent ....................................... 2.5 3.0 2.1 1.4 3.4
Percent of students in school eligible for free or
reduced-price school lunch
Less than 20 percent......................................... 2.5 3.5 2.5 1.1 4.0
20 to 39 percent................................................ 2.5 2.9 2.2 1.3 3.1
40 to 69 percent................................................ 2.7 2.8 2.0 1.4 4.1
70 percent or more ........................................... 2.3 3.3 2.3 2.0 4.4
SOURCE: U.S. Department of Education, National Center for Education Statistics, Fast Response Survey System, Survey on the Condition ofPublic School Facilities, 1999.
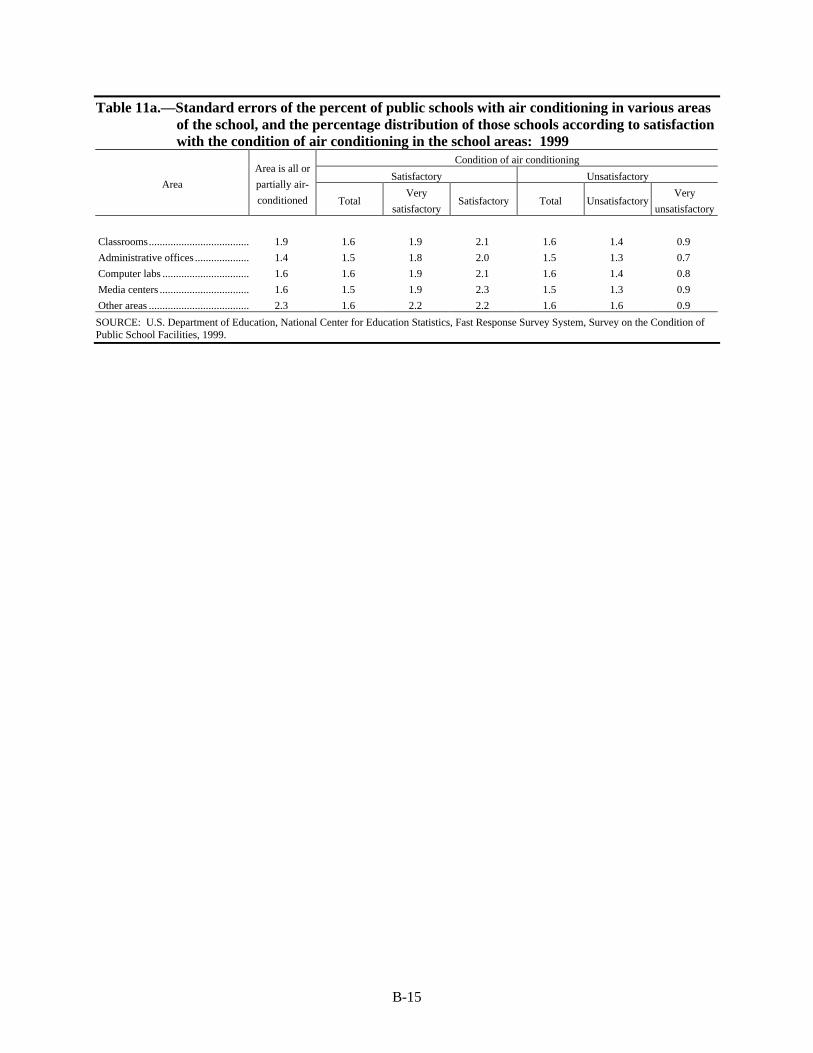
B-15
Table 11a.—Standard errors of the percent of public schools with air conditioning in various areasof the school, and the percentage distribution of those schools according to satisfactionwith the condition of air conditioning in the school areas: 1999
Condition of air conditioning
Satisfactory UnsatisfactoryArea
Area is all or
partially air-
conditioned TotalVery
satisfactorySatisfactory Total Unsatisfactory
Very
unsatisfactory
Classrooms..................................... 1.9 1.6 1.9 2.1 1.6 1.4 0.9
Administrative offices .................... 1.4 1.5 1.8 2.0 1.5 1.3 0.7
Computer labs ................................ 1.6 1.6 1.9 2.1 1.6 1.4 0.8
Media centers ................................. 1.6 1.5 1.9 2.3 1.5 1.3 0.9
Other areas ..................................... 2.3 1.6 2.2 2.2 1.6 1.6 0.9
SOURCE: U.S. Department of Education, National Center for Education Statistics, Fast Response Survey System, Survey on the Condition ofPublic School Facilities, 1999.
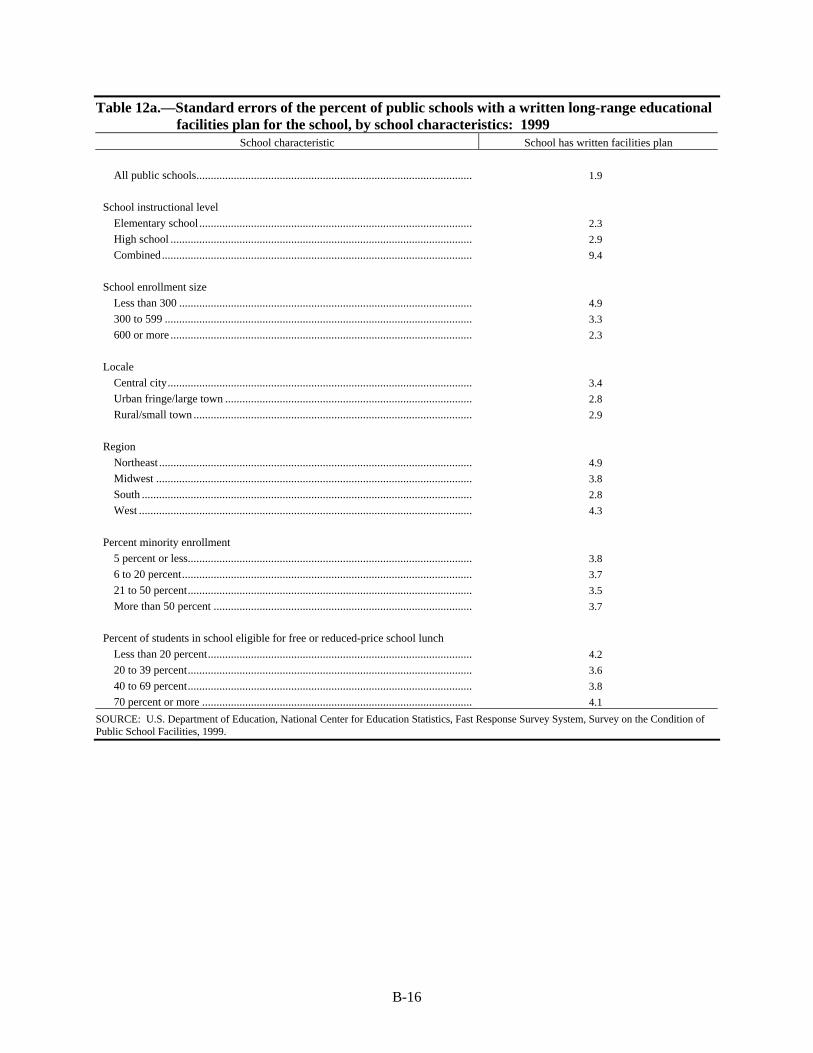
B-16
Table 12a.—Standard errors of the percent of public schools with a written long-range educationalfacilities plan for the school, by school characteristics: 1999
School characteristic School has written facilities plan
All public schools................................................................................................ 1.9
School instructional level
Elementary school ............................................................................................... 2.3
High school ......................................................................................................... 2.9
Combined............................................................................................................ 9.4
School enrollment size
Less than 300 ...................................................................................................... 4.9
300 to 599 ........................................................................................................... 3.3
600 or more ......................................................................................................... 2.3
Locale
Central city.......................................................................................................... 3.4
Urban fringe/large town ...................................................................................... 2.8
Rural/small town ................................................................................................. 2.9
Region
Northeast ............................................................................................................. 4.9
Midwest .............................................................................................................. 3.8
South ................................................................................................................... 2.8
West .................................................................................................................... 4.3
Percent minority enrollment
5 percent or less................................................................................................... 3.8
6 to 20 percent..................................................................................................... 3.7
21 to 50 percent................................................................................................... 3.5
More than 50 percent .......................................................................................... 3.7
Percent of students in school eligible for free or reduced-price school lunch
Less than 20 percent............................................................................................ 4.2
20 to 39 percent................................................................................................... 3.6
40 to 69 percent................................................................................................... 3.8
70 percent or more .............................................................................................. 4.1
SOURCE: U.S. Department of Education, National Center for Education Statistics, Fast Response Survey System, Survey on the Condition ofPublic School Facilities, 1999.
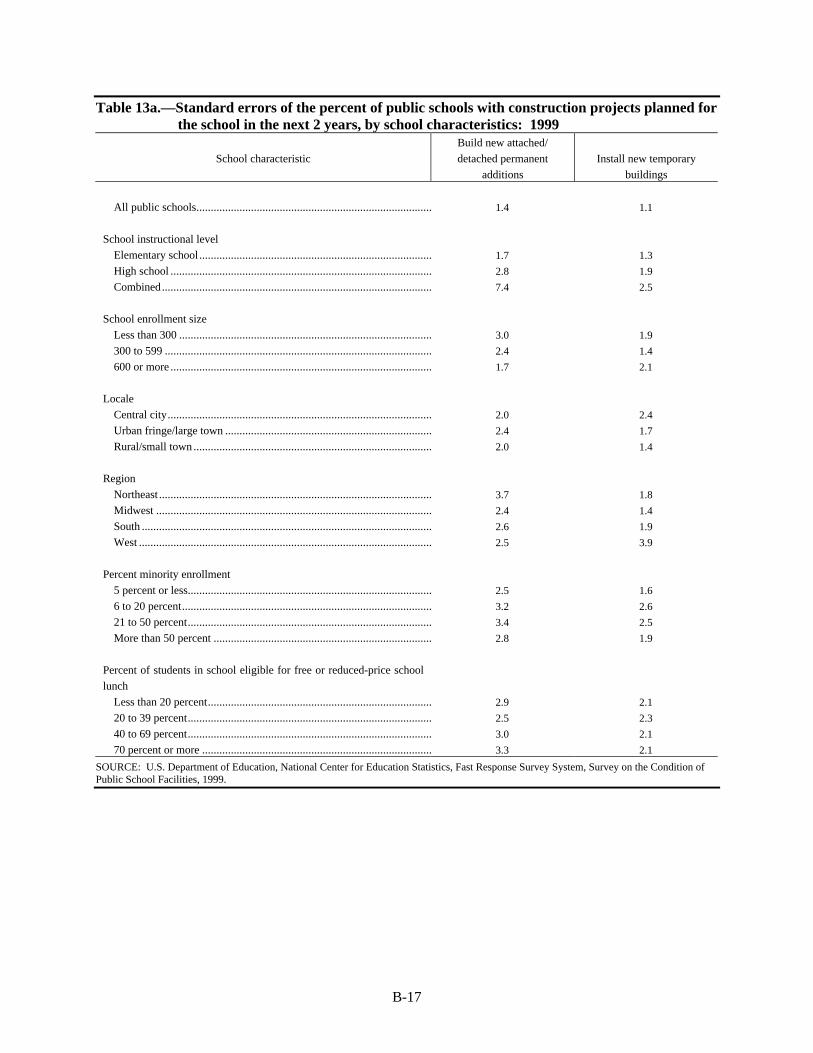
B-17
Table 13a.—Standard errors of the percent of public schools with construction projects planned forthe school in the next 2 years, by school characteristics: 1999
School characteristic
Build new attached/
detached permanent
additions
Install new temporary
buildings
All public schools.................................................................................. 1.4 1.1
School instructional level
Elementary school ................................................................................. 1.7 1.3
High school ........................................................................................... 2.8 1.9
Combined.............................................................................................. 7.4 2.5
School enrollment size
Less than 300 ........................................................................................ 3.0 1.9
300 to 599 ............................................................................................. 2.4 1.4
600 or more ........................................................................................... 1.7 2.1
Locale
Central city............................................................................................ 2.0 2.4
Urban fringe/large town ........................................................................ 2.4 1.7
Rural/small town ................................................................................... 2.0 1.4
Region
Northeast ............................................................................................... 3.7 1.8
Midwest ................................................................................................ 2.4 1.4
South ..................................................................................................... 2.6 1.9
West ...................................................................................................... 2.5 3.9
Percent minority enrollment
5 percent or less..................................................................................... 2.5 1.6
6 to 20 percent....................................................................................... 3.2 2.6
21 to 50 percent..................................................................................... 3.4 2.5
More than 50 percent ............................................................................ 2.8 1.9
Percent of students in school eligible for free or reduced-price school
lunch
Less than 20 percent.............................................................................. 2.9 2.1
20 to 39 percent..................................................................................... 2.5 2.3
40 to 69 percent..................................................................................... 3.0 2.1
70 percent or more ................................................................................ 3.3 2.1
SOURCE: U.S. Department of Education, National Center for Education Statistics, Fast Response Survey System, Survey on the Condition ofPublic School Facilities, 1999.
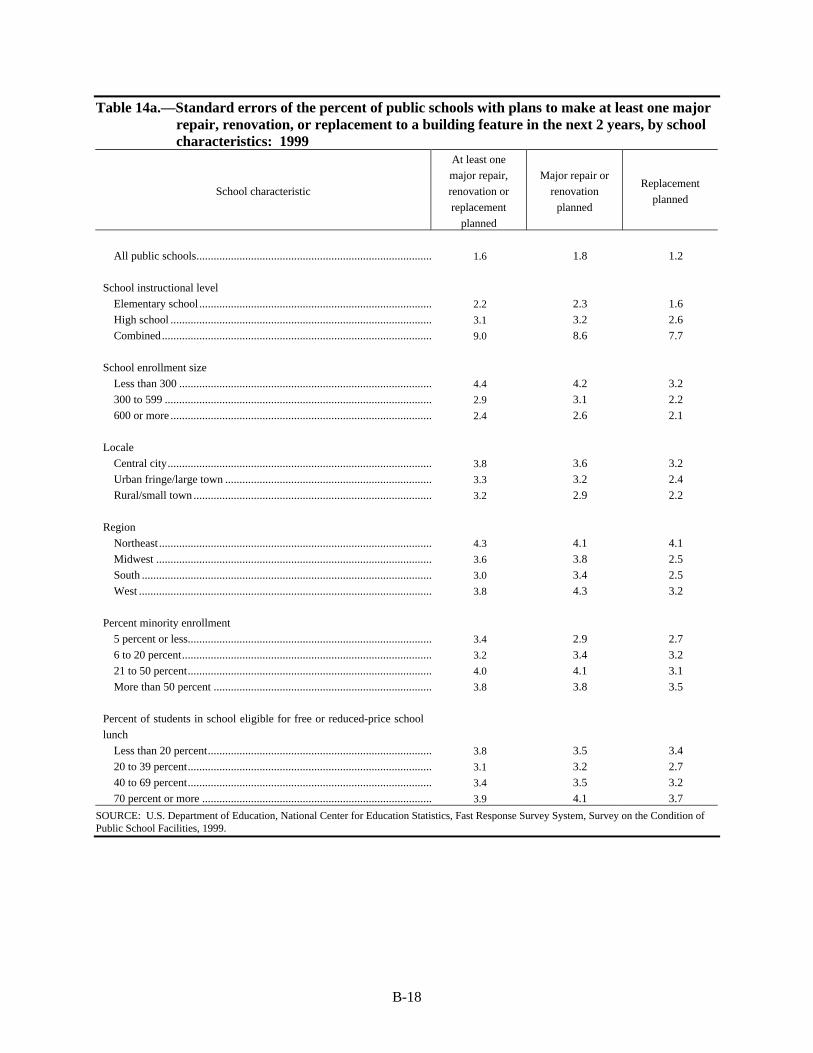
B-18
Table 14a.—Standard errors of the percent of public schools with plans to make at least one majorrepair, renovation, or replacement to a building feature in the next 2 years, by schoolcharacteristics: 1999
School characteristic
At least one
major repair,
renovation or
replacement
planned
Major repair or
renovation
planned
Replacement
planned
All public schools.................................................................................. 1.6 1.8 1.2
School instructional level
Elementary school ................................................................................. 2.2 2.3 1.6
High school ........................................................................................... 3.1 3.2 2.6
Combined.............................................................................................. 9.0 8.6 7.7
School enrollment size
Less than 300 ........................................................................................ 4.4 4.2 3.2
300 to 599 ............................................................................................. 2.9 3.1 2.2
600 or more ........................................................................................... 2.4 2.6 2.1
Locale
Central city............................................................................................ 3.8 3.6 3.2
Urban fringe/large town ........................................................................ 3.3 3.2 2.4
Rural/small town ................................................................................... 3.2 2.9 2.2
Region
Northeast ............................................................................................... 4.3 4.1 4.1
Midwest ................................................................................................ 3.6 3.8 2.5
South ..................................................................................................... 3.0 3.4 2.5
West ...................................................................................................... 3.8 4.3 3.2
Percent minority enrollment
5 percent or less..................................................................................... 3.4 2.9 2.7
6 to 20 percent....................................................................................... 3.2 3.4 3.2
21 to 50 percent..................................................................................... 4.0 4.1 3.1
More than 50 percent ............................................................................ 3.8 3.8 3.5
Percent of students in school eligible for free or reduced-price school
lunch
Less than 20 percent.............................................................................. 3.8 3.5 3.4
20 to 39 percent..................................................................................... 3.1 3.2 2.7
40 to 69 percent..................................................................................... 3.4 3.5 3.2
70 percent or more ................................................................................ 3.9 4.1 3.7
SOURCE: U.S. Department of Education, National Center for Education Statistics, Fast Response Survey System, Survey on the Condition ofPublic School Facilities, 1999.
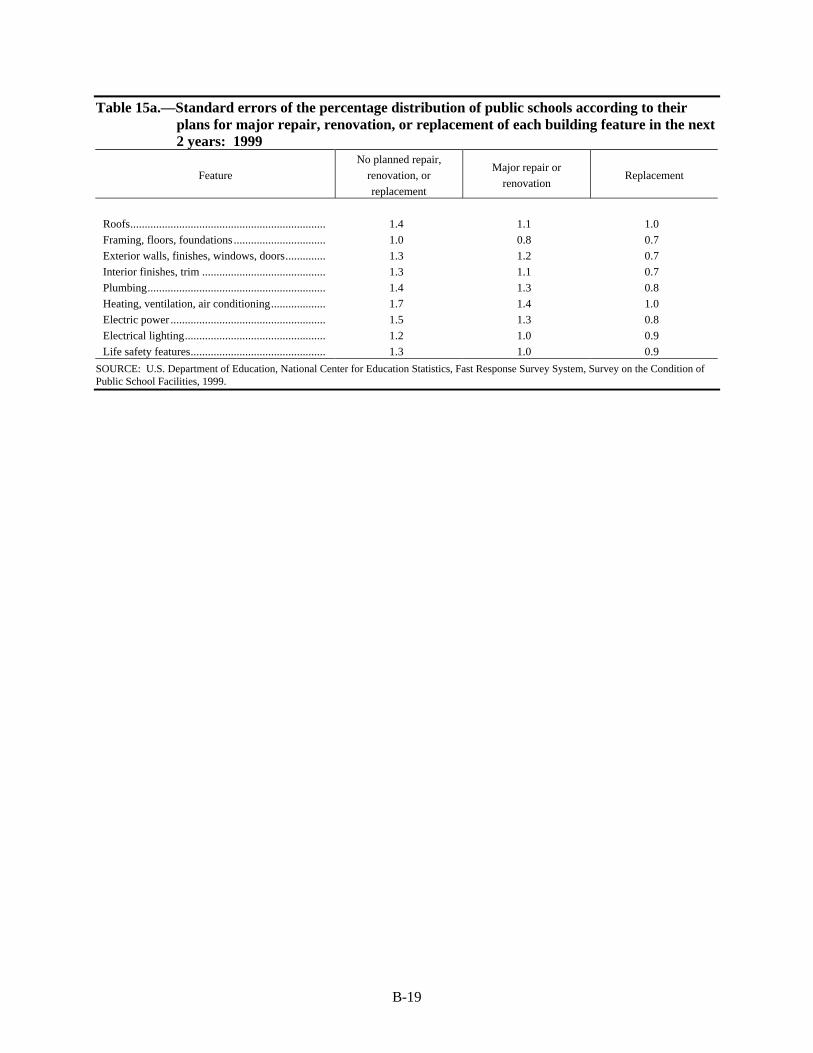
B-19
Table 15a.—Standard errors of the percentage distribution of public schools according to theirplans for major repair, renovation, or replacement of each building feature in the next2 years: 1999
Feature
No planned repair,
renovation, or
replacement
Major repair or
renovationReplacement
Roofs.................................................................... 1.4 1.1 1.0
Framing, floors, foundations ................................ 1.0 0.8 0.7
Exterior walls, finishes, windows, doors.............. 1.3 1.2 0.7
Interior finishes, trim ........................................... 1.3 1.1 0.7
Plumbing.............................................................. 1.4 1.3 0.8
Heating, ventilation, air conditioning................... 1.7 1.4 1.0
Electric power ...................................................... 1.5 1.3 0.8
Electrical lighting................................................. 1.2 1.0 0.9
Life safety features............................................... 1.3 1.0 0.9
SOURCE: U.S. Department of Education, National Center for Education Statistics, Fast Response Survey System, Survey on the Condition ofPublic School Facilities, 1999.
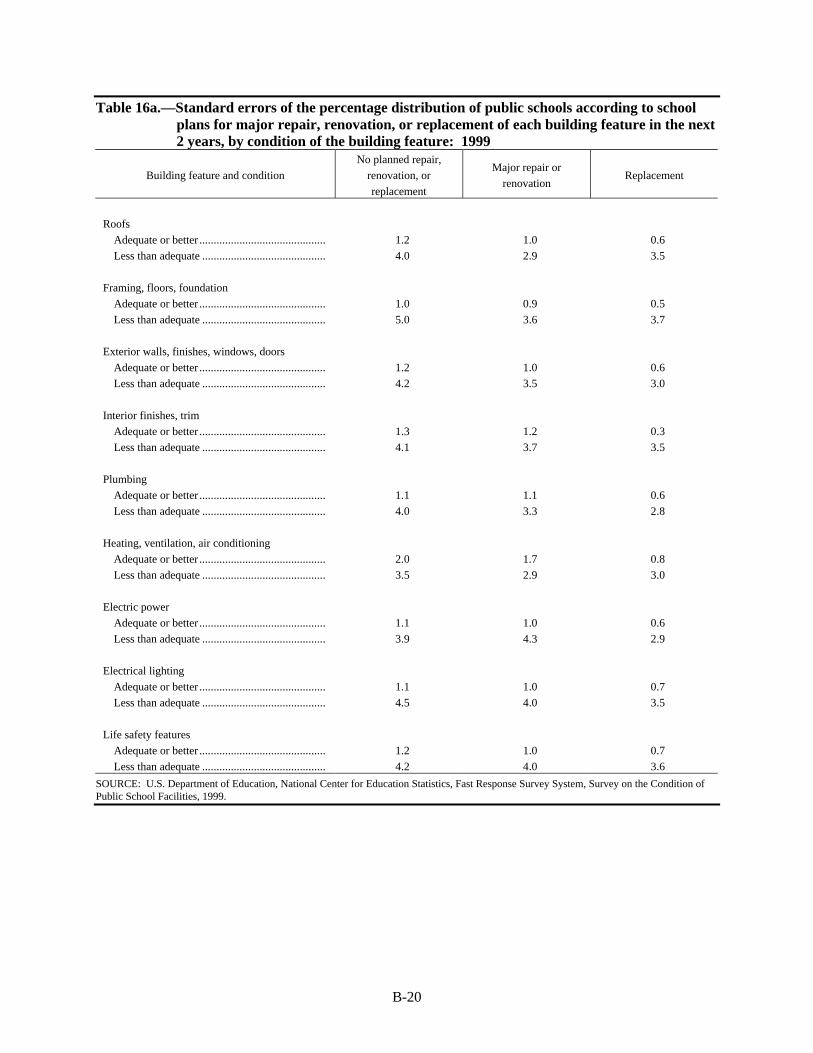
B-20
Table 16a.—Standard errors of the percentage distribution of public schools according to schoolplans for major repair, renovation, or replacement of each building feature in the next2 years, by condition of the building feature: 1999
Building feature and condition
No planned repair,
renovation, or
replacement
Major repair or
renovationReplacement
Roofs
Adequate or better ............................................ 1.2 1.0 0.6
Less than adequate ........................................... 4.0 2.9 3.5
Framing, floors, foundation
Adequate or better ............................................ 1.0 0.9 0.5
Less than adequate ........................................... 5.0 3.6 3.7
Exterior walls, finishes, windows, doors
Adequate or better ............................................ 1.2 1.0 0.6
Less than adequate ........................................... 4.2 3.5 3.0
Interior finishes, trim
Adequate or better ............................................ 1.3 1.2 0.3
Less than adequate ........................................... 4.1 3.7 3.5
Plumbing
Adequate or better ............................................ 1.1 1.1 0.6
Less than adequate ........................................... 4.0 3.3 2.8
Heating, ventilation, air conditioning
Adequate or better ............................................ 2.0 1.7 0.8
Less than adequate ........................................... 3.5 2.9 3.0
Electric power
Adequate or better ............................................ 1.1 1.0 0.6
Less than adequate ........................................... 3.9 4.3 2.9
Electrical lighting
Adequate or better ............................................ 1.1 1.0 0.7
Less than adequate ........................................... 4.5 4.0 3.5
Life safety features
Adequate or better ............................................ 1.2 1.0 0.7
Less than adequate ........................................... 4.2 4.0 3.6
SOURCE: U.S. Department of Education, National Center for Education Statistics, Fast Response Survey System, Survey on the Condition ofPublic School Facilities, 1999.
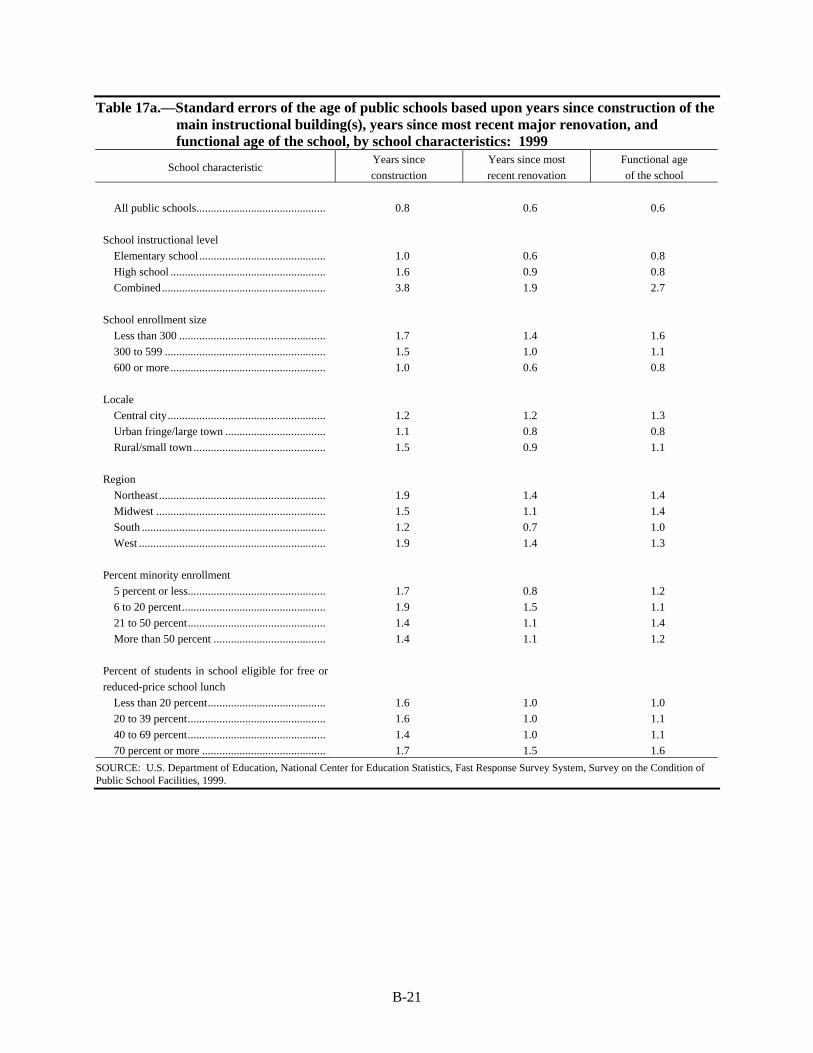
B-21
Table 17a.—Standard errors of the age of public schools based upon years since construction of themain instructional building(s), years since most recent major renovation, andfunctional age of the school, by school characteristics: 1999
School characteristicYears since
construction
Years since most
recent renovation
Functional age
of the school
All public schools............................................. 0.8 0.6 0.6
School instructional level
Elementary school ............................................ 1.0 0.6 0.8
High school ...................................................... 1.6 0.9 0.8
Combined......................................................... 3.8 1.9 2.7
School enrollment size
Less than 300 ................................................... 1.7 1.4 1.6
300 to 599 ........................................................ 1.5 1.0 1.1
600 or more ...................................................... 1.0 0.6 0.8
Locale
Central city....................................................... 1.2 1.2 1.3
Urban fringe/large town ................................... 1.1 0.8 0.8
Rural/small town .............................................. 1.5 0.9 1.1
Region
Northeast .......................................................... 1.9 1.4 1.4
Midwest ........................................................... 1.5 1.1 1.4
South ................................................................ 1.2 0.7 1.0
West ................................................................. 1.9 1.4 1.3
Percent minority enrollment
5 percent or less................................................ 1.7 0.8 1.2
6 to 20 percent.................................................. 1.9 1.5 1.1
21 to 50 percent................................................ 1.4 1.1 1.4
More than 50 percent ....................................... 1.4 1.1 1.2
Percent of students in school eligible for free or
reduced-price school lunch
Less than 20 percent......................................... 1.6 1.0 1.0
20 to 39 percent................................................ 1.6 1.0 1.1
40 to 69 percent................................................ 1.4 1.0 1.1
70 percent or more ........................................... 1.7 1.5 1.6
SOURCE: U.S. Department of Education, National Center for Education Statistics, Fast Response Survey System, Survey on the Condition ofPublic School Facilities, 1999.
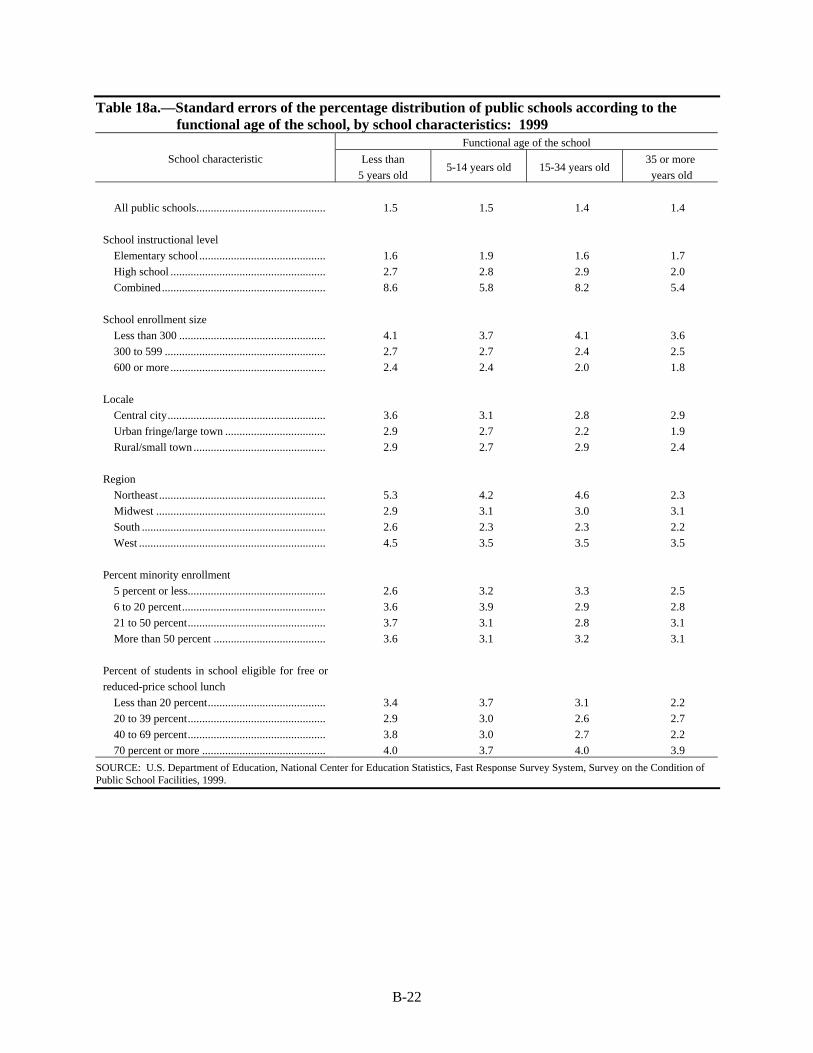
B-22
Table 18a.—Standard errors of the percentage distribution of public schools according to thefunctional age of the school, by school characteristics: 1999
Functional age of the school
School characteristic Less than
5 years old5-14 years old 15-34 years old
35 or more
years old
All public schools............................................. 1.5 1.5 1.4 1.4
School instructional level
Elementary school ............................................ 1.6 1.9 1.6 1.7
High school ...................................................... 2.7 2.8 2.9 2.0
Combined......................................................... 8.6 5.8 8.2 5.4
School enrollment size
Less than 300 ................................................... 4.1 3.7 4.1 3.6
300 to 599 ........................................................ 2.7 2.7 2.4 2.5
600 or more ...................................................... 2.4 2.4 2.0 1.8
Locale
Central city....................................................... 3.6 3.1 2.8 2.9
Urban fringe/large town ................................... 2.9 2.7 2.2 1.9
Rural/small town .............................................. 2.9 2.7 2.9 2.4
Region
Northeast .......................................................... 5.3 4.2 4.6 2.3
Midwest ........................................................... 2.9 3.1 3.0 3.1
South ................................................................ 2.6 2.3 2.3 2.2
West ................................................................. 4.5 3.5 3.5 3.5
Percent minority enrollment
5 percent or less................................................ 2.6 3.2 3.3 2.5
6 to 20 percent.................................................. 3.6 3.9 2.9 2.8
21 to 50 percent................................................ 3.7 3.1 2.8 3.1
More than 50 percent ....................................... 3.6 3.1 3.2 3.1
Percent of students in school eligible for free or
reduced-price school lunch
Less than 20 percent......................................... 3.4 3.7 3.1 2.2
20 to 39 percent................................................ 2.9 3.0 2.6 2.7
40 to 69 percent................................................ 3.8 3.0 2.7 2.2
70 percent or more ........................................... 4.0 3.7 4.0 3.9
SOURCE: U.S. Department of Education, National Center for Education Statistics, Fast Response Survey System, Survey on the Condition ofPublic School Facilities, 1999.
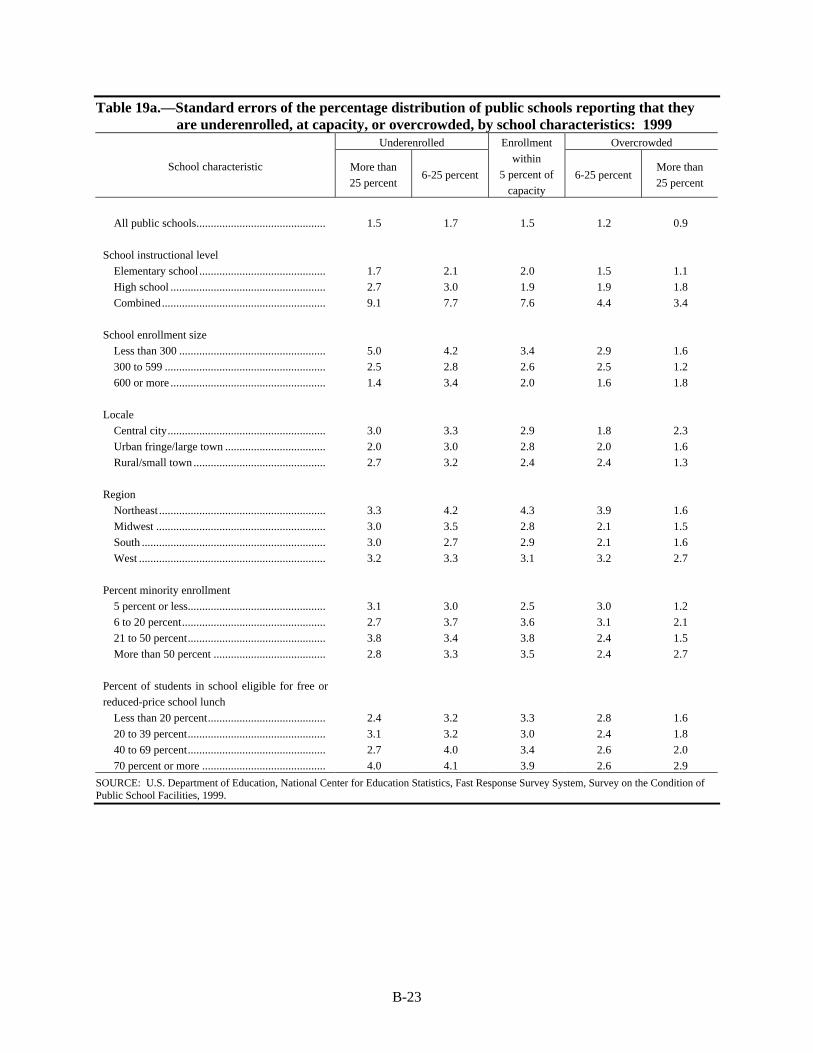
B-23
Table 19a.—Standard errors of the percentage distribution of public schools reporting that theyare underenrolled, at capacity, or overcrowded, by school characteristics: 1999
Underenrolled Overcrowded
School characteristic More than
25 percent6-25 percent
Enrollment
within
5 percent of
capacity6-25 percent
More than
25 percent
All public schools............................................. 1.5 1.7 1.5 1.2 0.9
School instructional level
Elementary school ............................................ 1.7 2.1 2.0 1.5 1.1
High school ...................................................... 2.7 3.0 1.9 1.9 1.8
Combined......................................................... 9.1 7.7 7.6 4.4 3.4
School enrollment size
Less than 300 ................................................... 5.0 4.2 3.4 2.9 1.6
300 to 599 ........................................................ 2.5 2.8 2.6 2.5 1.2
600 or more ...................................................... 1.4 3.4 2.0 1.6 1.8
Locale
Central city....................................................... 3.0 3.3 2.9 1.8 2.3
Urban fringe/large town ................................... 2.0 3.0 2.8 2.0 1.6
Rural/small town .............................................. 2.7 3.2 2.4 2.4 1.3
Region
Northeast .......................................................... 3.3 4.2 4.3 3.9 1.6
Midwest ........................................................... 3.0 3.5 2.8 2.1 1.5
South ................................................................ 3.0 2.7 2.9 2.1 1.6
West ................................................................. 3.2 3.3 3.1 3.2 2.7
Percent minority enrollment
5 percent or less................................................ 3.1 3.0 2.5 3.0 1.2
6 to 20 percent.................................................. 2.7 3.7 3.6 3.1 2.1
21 to 50 percent................................................ 3.8 3.4 3.8 2.4 1.5
More than 50 percent ....................................... 2.8 3.3 3.5 2.4 2.7
Percent of students in school eligible for free or
reduced-price school lunch
Less than 20 percent......................................... 2.4 3.2 3.3 2.8 1.6
20 to 39 percent................................................ 3.1 3.2 3.0 2.4 1.8
40 to 69 percent................................................ 2.7 4.0 3.4 2.6 2.0
70 percent or more ........................................... 4.0 4.1 3.9 2.6 2.9
SOURCE: U.S. Department of Education, National Center for Education Statistics, Fast Response Survey System, Survey on the Condition ofPublic School Facilities, 1999.
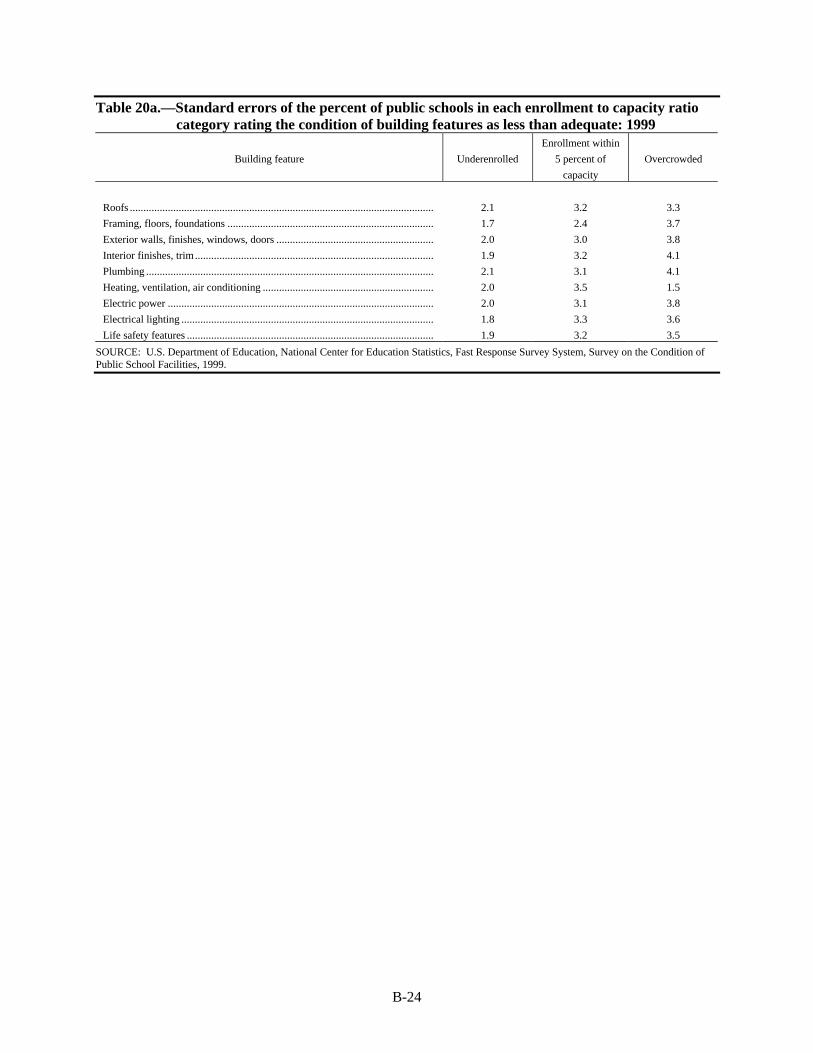
B-24
Table 20a.—Standard errors of the percent of public schools in each enrollment to capacity ratiocategory rating the condition of building features as less than adequate: 1999
Building feature Underenrolled
Enrollment within
5 percent of
capacity
Overcrowded
Roofs ................................................................................................................ 2.1 3.2 3.3
Framing, floors, foundations ............................................................................ 1.7 2.4 3.7
Exterior walls, finishes, windows, doors .......................................................... 2.0 3.0 3.8
Interior finishes, trim........................................................................................ 1.9 3.2 4.1
Plumbing .......................................................................................................... 2.1 3.1 4.1
Heating, ventilation, air conditioning ............................................................... 2.0 3.5 1.5
Electric power .................................................................................................. 2.0 3.1 3.8
Electrical lighting ............................................................................................. 1.8 3.3 3.6
Life safety features ........................................................................................... 1.9 3.2 3.5
SOURCE: U.S. Department of Education, National Center for Education Statistics, Fast Response Survey System, Survey on the Condition ofPublic School Facilities, 1999.
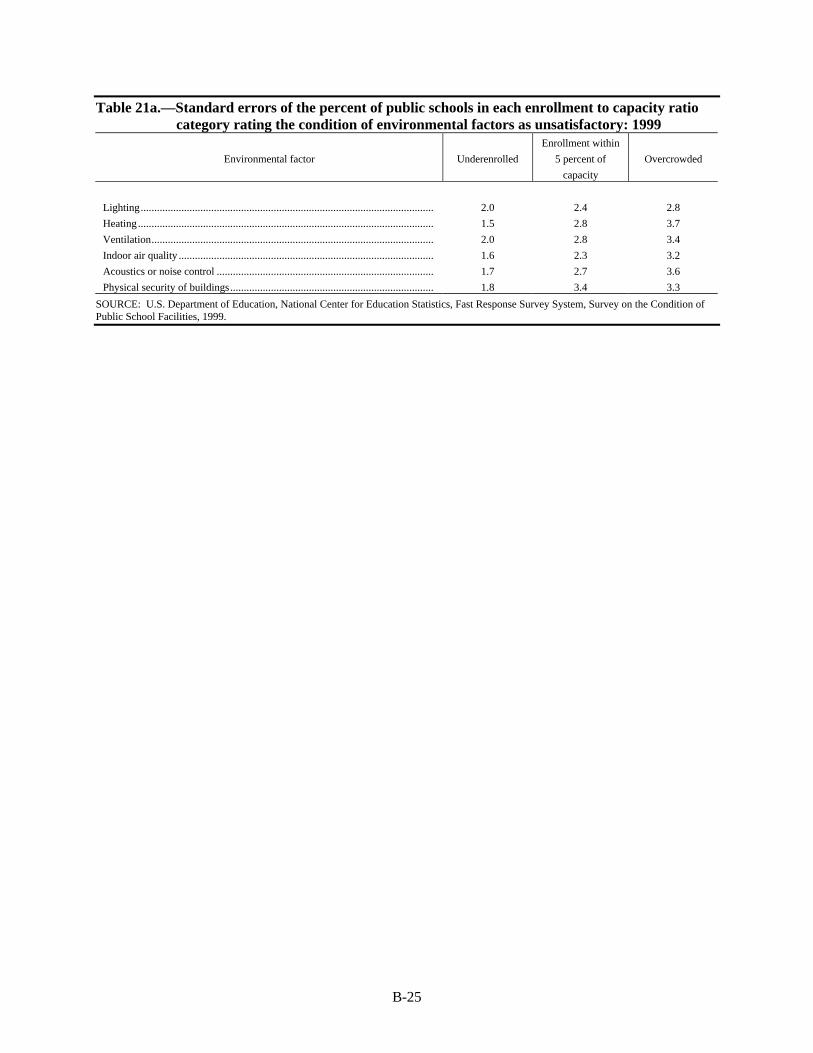
B-25
Table 21a.—Standard errors of the percent of public schools in each enrollment to capacity ratiocategory rating the condition of environmental factors as unsatisfactory: 1999
Environmental factor Underenrolled
Enrollment within
5 percent of
capacity
Overcrowded
Lighting............................................................................................................ 2.0 2.4 2.8
Heating............................................................................................................. 1.5 2.8 3.7
Ventilation........................................................................................................ 2.0 2.8 3.4
Indoor air quality .............................................................................................. 1.6 2.3 3.2
Acoustics or noise control ................................................................................ 1.7 2.7 3.6
Physical security of buildings........................................................................... 1.8 3.4 3.3
SOURCE: U.S. Department of Education, National Center for Education Statistics, Fast Response Survey System, Survey on the Condition ofPublic School Facilities, 1999.
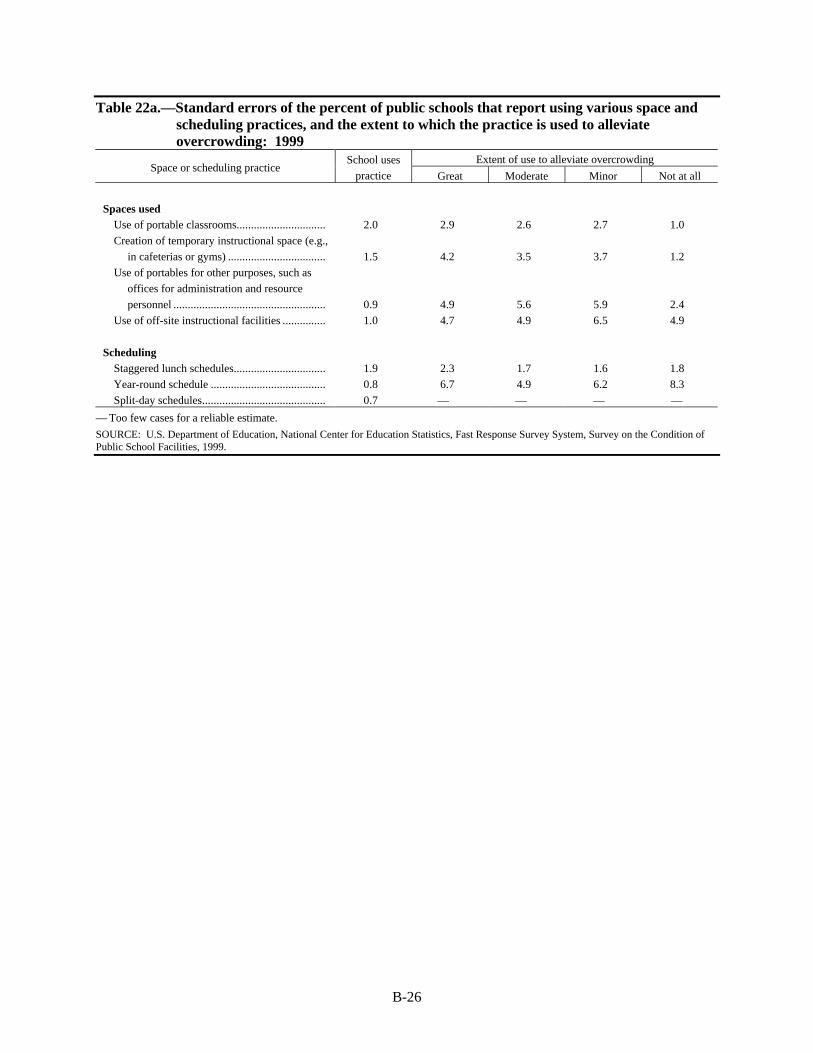
B-26
Table 22a.—Standard errors of the percent of public schools that report using various space andscheduling practices, and the extent to which the practice is used to alleviateovercrowding: 1999
Extent of use to alleviate overcrowdingSpace or scheduling practice
School uses
practice Great Moderate Minor Not at all
Spaces usedUse of portable classrooms............................... 2.0 2.9 2.6 2.7 1.0
Creation of temporary instructional space (e.g.,
in cafeterias or gyms) .................................. 1.5 4.2 3.5 3.7 1.2
Use of portables for other purposes, such as
offices for administration and resource
personnel ..................................................... 0.9 4.9 5.6 5.9 2.4
Use of off-site instructional facilities ............... 1.0 4.7 4.9 6.5 4.9
SchedulingStaggered lunch schedules................................ 1.9 2.3 1.7 1.6 1.8
Year-round schedule ........................................ 0.8 6.7 4.9 6.2 8.3
Split-day schedules........................................... 0.7 — — — —
— Too few cases for a reliable estimate.
SOURCE: U.S. Department of Education, National Center for Education Statistics, Fast Response Survey System, Survey on the Condition ofPublic School Facilities, 1999.
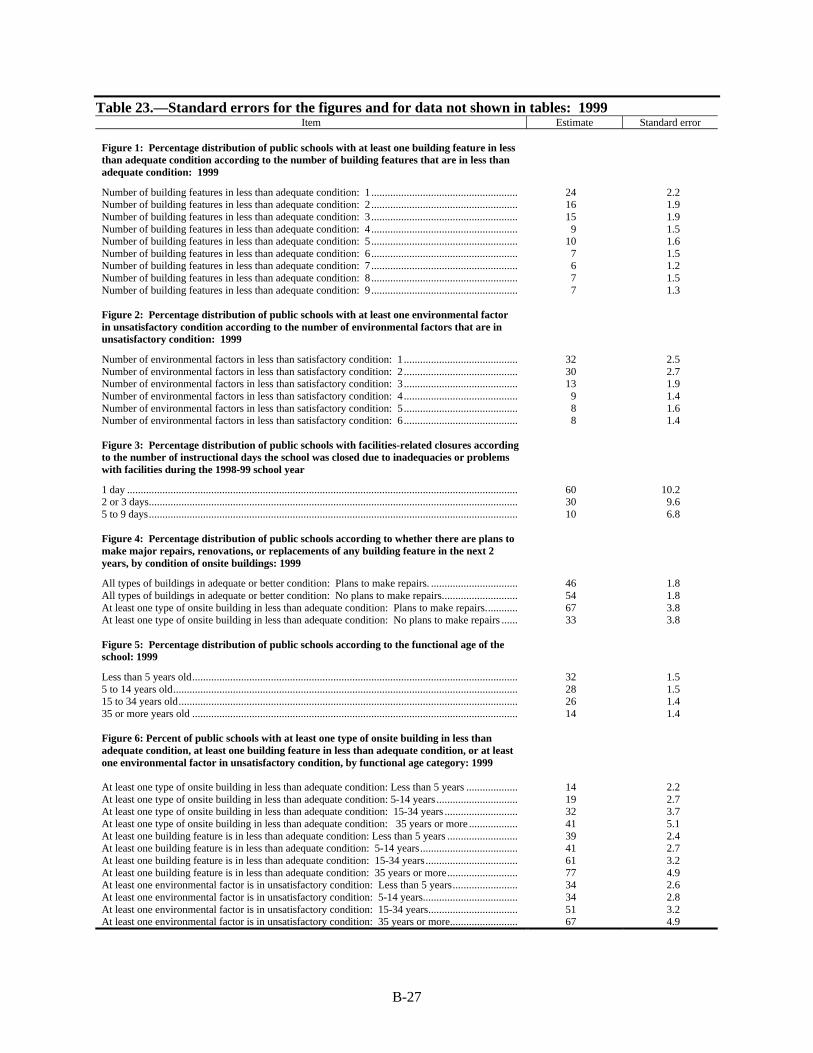
B-27
Table 23.—Standard errors for the figures and for data not shown in tables: 1999Item Estimate Standard error
Figure 1: Percentage distribution of public schools with at least one building feature in lessthan adequate condition according to the number of building features that are in less thanadequate condition: 1999
Number of building features in less than adequate condition: 1 ...................................................... 24 2.2Number of building features in less than adequate condition: 2 ...................................................... 16 1.9Number of building features in less than adequate condition: 3 ...................................................... 15 1.9Number of building features in less than adequate condition: 4 ...................................................... 9 1.5Number of building features in less than adequate condition: 5 ...................................................... 10 1.6Number of building features in less than adequate condition: 6 ...................................................... 7 1.5Number of building features in less than adequate condition: 7 ...................................................... 6 1.2Number of building features in less than adequate condition: 8 ...................................................... 7 1.5Number of building features in less than adequate condition: 9 ...................................................... 7 1.3
Figure 2: Percentage distribution of public schools with at least one environmental factorin unsatisfactory condition according to the number of environmental factors that are inunsatisfactory condition: 1999
Number of environmental factors in less than satisfactory condition: 1 .......................................... 32 2.5Number of environmental factors in less than satisfactory condition: 2 .......................................... 30 2.7Number of environmental factors in less than satisfactory condition: 3 .......................................... 13 1.9Number of environmental factors in less than satisfactory condition: 4 .......................................... 9 1.4Number of environmental factors in less than satisfactory condition: 5 .......................................... 8 1.6Number of environmental factors in less than satisfactory condition: 6 .......................................... 8 1.4
Figure 3: Percentage distribution of public schools with facilities-related closures accordingto the number of instructional days the school was closed due to inadequacies or problemswith facilities during the 1998-99 school year
1 day ................................................................................................................................................ 60 10.22 or 3 days........................................................................................................................................ 30 9.65 to 9 days........................................................................................................................................ 10 6.8
Figure 4: Percentage distribution of public schools according to whether there are plans tomake major repairs, renovations, or replacements of any building feature in the next 2years, by condition of onsite buildings: 1999
All types of buildings in adequate or better condition: Plans to make repairs. ................................ 46 1.8All types of buildings in adequate or better condition: No plans to make repairs............................ 54 1.8At least one type of onsite building in less than adequate condition: Plans to make repairs............ 67 3.8At least one type of onsite building in less than adequate condition: No plans to make repairs ...... 33 3.8
Figure 5: Percentage distribution of public schools according to the functional age of theschool: 1999
Less than 5 years old........................................................................................................................ 32 1.55 to 14 years old............................................................................................................................... 28 1.515 to 34 years old............................................................................................................................. 26 1.435 or more years old ........................................................................................................................ 14 1.4
Figure 6: Percent of public schools with at least one type of onsite building in less thanadequate condition, at least one building feature in less than adequate condition, or at leastone environmental factor in unsatisfactory condition, by functional age category: 1999
At least one type of onsite building in less than adequate condition: Less than 5 years ................... 14 2.2At least one type of onsite building in less than adequate condition: 5-14 years .............................. 19 2.7At least one type of onsite building in less than adequate condition: 15-34 years ........................... 32 3.7At least one type of onsite building in less than adequate condition: 35 years or more .................. 41 5.1At least one building feature is in less than adequate condition: Less than 5 years .......................... 39 2.4At least one building feature is in less than adequate condition: 5-14 years.................................... 41 2.7At least one building feature is in less than adequate condition: 15-34 years.................................. 61 3.2At least one building feature is in less than adequate condition: 35 years or more.......................... 77 4.9At least one environmental factor is in unsatisfactory condition: Less than 5 years........................ 34 2.6At least one environmental factor is in unsatisfactory condition: 5-14 years................................... 34 2.8At least one environmental factor is in unsatisfactory condition: 15-34 years................................. 51 3.2At least one environmental factor is in unsatisfactory condition: 35 years or more......................... 67 4.9
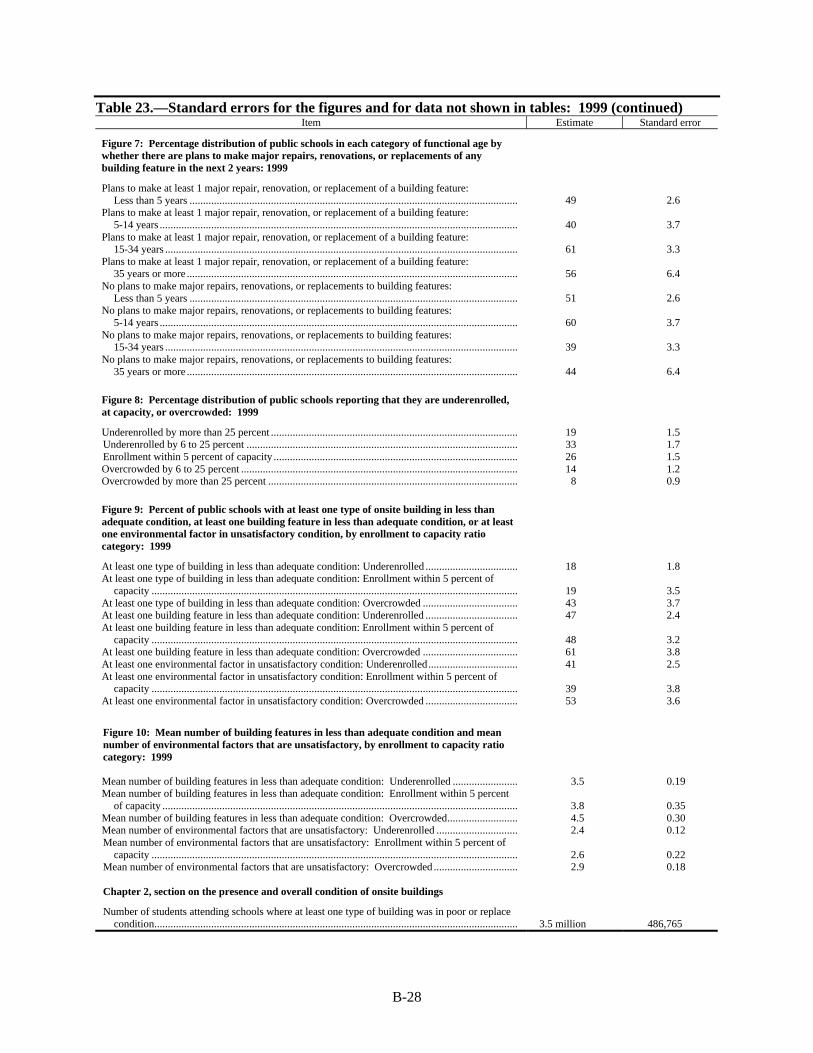
B-28
Table 23.—Standard errors for the figures and for data not shown in tables: 1999 (continued)Item Estimate Standard error
Figure 7: Percentage distribution of public schools in each category of functional age bywhether there are plans to make major repairs, renovations, or replacements of anybuilding feature in the next 2 years: 1999
Plans to make at least 1 major repair, renovation, or replacement of a building feature:Less than 5 years ......................................................................................................................... 49 2.6
Plans to make at least 1 major repair, renovation, or replacement of a building feature:5-14 years .................................................................................................................................... 40 3.7
Plans to make at least 1 major repair, renovation, or replacement of a building feature:15-34 years .................................................................................................................................. 61 3.3
Plans to make at least 1 major repair, renovation, or replacement of a building feature:35 years or more .......................................................................................................................... 56 6.4
No plans to make major repairs, renovations, or replacements to building features:Less than 5 years ......................................................................................................................... 51 2.6
No plans to make major repairs, renovations, or replacements to building features:5-14 years .................................................................................................................................... 60 3.7
No plans to make major repairs, renovations, or replacements to building features:15-34 years .................................................................................................................................. 39 3.3
No plans to make major repairs, renovations, or replacements to building features:35 years or more .......................................................................................................................... 44 6.4
Figure 8: Percentage distribution of public schools reporting that they are underenrolled,at capacity, or overcrowded: 1999
Underenrolled by more than 25 percent ........................................................................................... 19 1.5Underenrolled by 6 to 25 percent .................................................................................................... 33 1.7Enrollment within 5 percent of capacity .......................................................................................... 26 1.5Overcrowded by 6 to 25 percent ...................................................................................................... 14 1.2Overcrowded by more than 25 percent ............................................................................................ 8 0.9
Figure 9: Percent of public schools with at least one type of onsite building in less thanadequate condition, at least one building feature in less than adequate condition, or at leastone environmental factor in unsatisfactory condition, by enrollment to capacity ratiocategory: 1999
At least one type of building in less than adequate condition: Underenrolled .................................. 18 1.8At least one type of building in less than adequate condition: Enrollment within 5 percent of
capacity ....................................................................................................................................... 19 3.5At least one type of building in less than adequate condition: Overcrowded ................................... 43 3.7At least one building feature in less than adequate condition: Underenrolled .................................. 47 2.4At least one building feature in less than adequate condition: Enrollment within 5 percent of
capacity ....................................................................................................................................... 48 3.2At least one building feature in less than adequate condition: Overcrowded ................................... 61 3.8At least one environmental factor in unsatisfactory condition: Underenrolled................................. 41 2.5At least one environmental factor in unsatisfactory condition: Enrollment within 5 percent of
capacity ....................................................................................................................................... 39 3.8At least one environmental factor in unsatisfactory condition: Overcrowded .................................. 53 3.6
Figure 10: Mean number of building features in less than adequate condition and meannumber of environmental factors that are unsatisfactory, by enrollment to capacity ratiocategory: 1999
Mean number of building features in less than adequate condition: Underenrolled ........................ 3.5 0.19Mean number of building features in less than adequate condition: Enrollment within 5 percent
of capacity ................................................................................................................................... 3.8 0.35Mean number of building features in less than adequate condition: Overcrowded.......................... 4.5 0.30Mean number of environmental factors that are unsatisfactory: Underenrolled .............................. 2.4 0.12Mean number of environmental factors that are unsatisfactory: Enrollment within 5 percent of
capacity ....................................................................................................................................... 2.6 0.22Mean number of environmental factors that are unsatisfactory: Overcrowded ............................... 2.9 0.18
Chapter 2, section on the presence and overall condition of onsite buildings
Number of students attending schools where at least one type of building was in poor or replacecondition...................................................................................................................................... 3.5 million 486,765
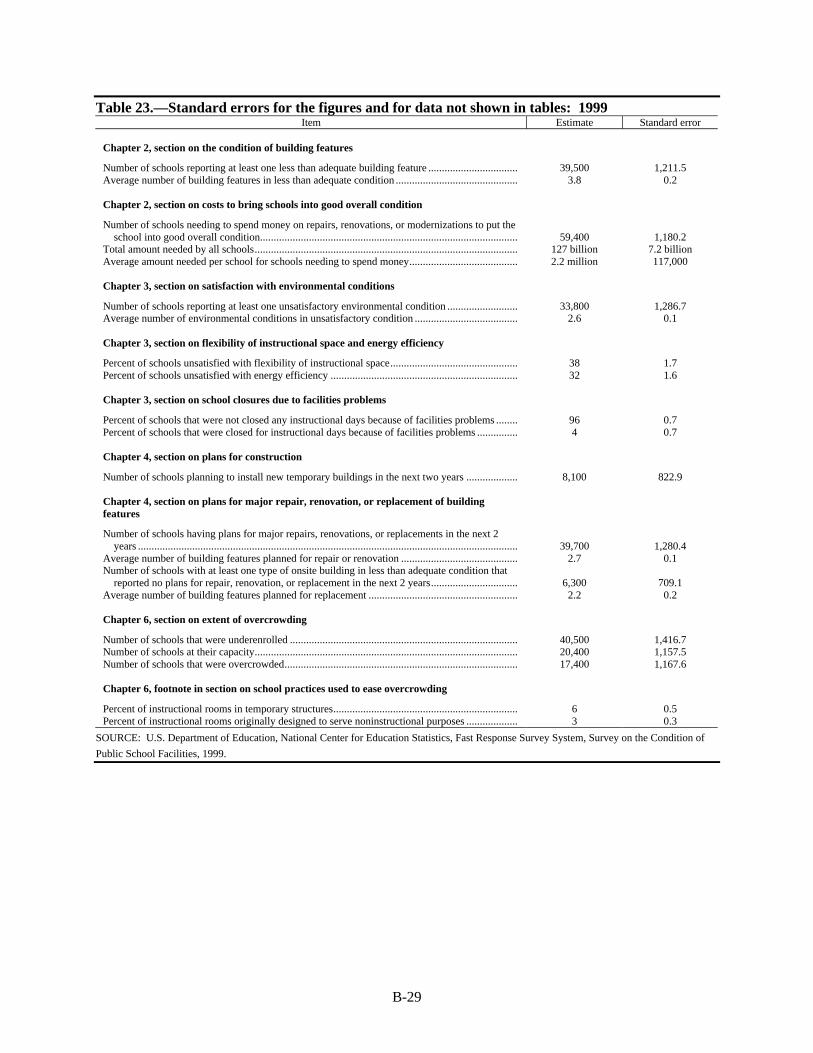
B-29
Table 23.—Standard errors for the figures and for data not shown in tables: 1999Item Estimate Standard error
Chapter 2, section on the condition of building features
Number of schools reporting at least one less than adequate building feature ................................. 39,500 1,211.5Average number of building features in less than adequate condition ............................................. 3.8 0.2
Chapter 2, section on costs to bring schools into good overall condition
Number of schools needing to spend money on repairs, renovations, or modernizations to put theschool into good overall condition............................................................................................... 59,400 1,180.2
Total amount needed by all schools................................................................................................. 127 billion 7.2 billionAverage amount needed per school for schools needing to spend money........................................ 2.2 million 117,000
Chapter 3, section on satisfaction with environmental conditions
Number of schools reporting at least one unsatisfactory environmental condition .......................... 33,800 1,286.7Average number of environmental conditions in unsatisfactory condition ...................................... 2.6 0.1
Chapter 3, section on flexibility of instructional space and energy efficiency
Percent of schools unsatisfied with flexibility of instructional space............................................... 38 1.7Percent of schools unsatisfied with energy efficiency ..................................................................... 32 1.6
Chapter 3, section on school closures due to facilities problems
Percent of schools that were not closed any instructional days because of facilities problems ........ 96 0.7Percent of schools that were closed for instructional days because of facilities problems ............... 4 0.7
Chapter 4, section on plans for construction
Number of schools planning to install new temporary buildings in the next two years ................... 8,100 822.9
Chapter 4, section on plans for major repair, renovation, or replacement of buildingfeatures
Number of schools having plans for major repairs, renovations, or replacements in the next 2years ............................................................................................................................................ 39,700 1,280.4
Average number of building features planned for repair or renovation ........................................... 2.7 0.1Number of schools with at least one type of onsite building in less than adequate condition that
reported no plans for repair, renovation, or replacement in the next 2 years................................ 6,300 709.1Average number of building features planned for replacement ....................................................... 2.2 0.2
Chapter 6, section on extent of overcrowding
Number of schools that were underenrolled .................................................................................... 40,500 1,416.7Number of schools at their capacity................................................................................................. 20,400 1,157.5Number of schools that were overcrowded...................................................................................... 17,400 1,167.6
Chapter 6, footnote in section on school practices used to ease overcrowding
Percent of instructional rooms in temporary structures.................................................................... 6 0.5Percent of instructional rooms originally designed to serve noninstructional purposes ................... 3 0.3
SOURCE: U.S. Department of Education, National Center for Education Statistics, Fast Response Survey System, Survey on the Condition of
Public School Facilities, 1999.

B-30
C-1
Appendix C
Survey Questionnaire

C-2
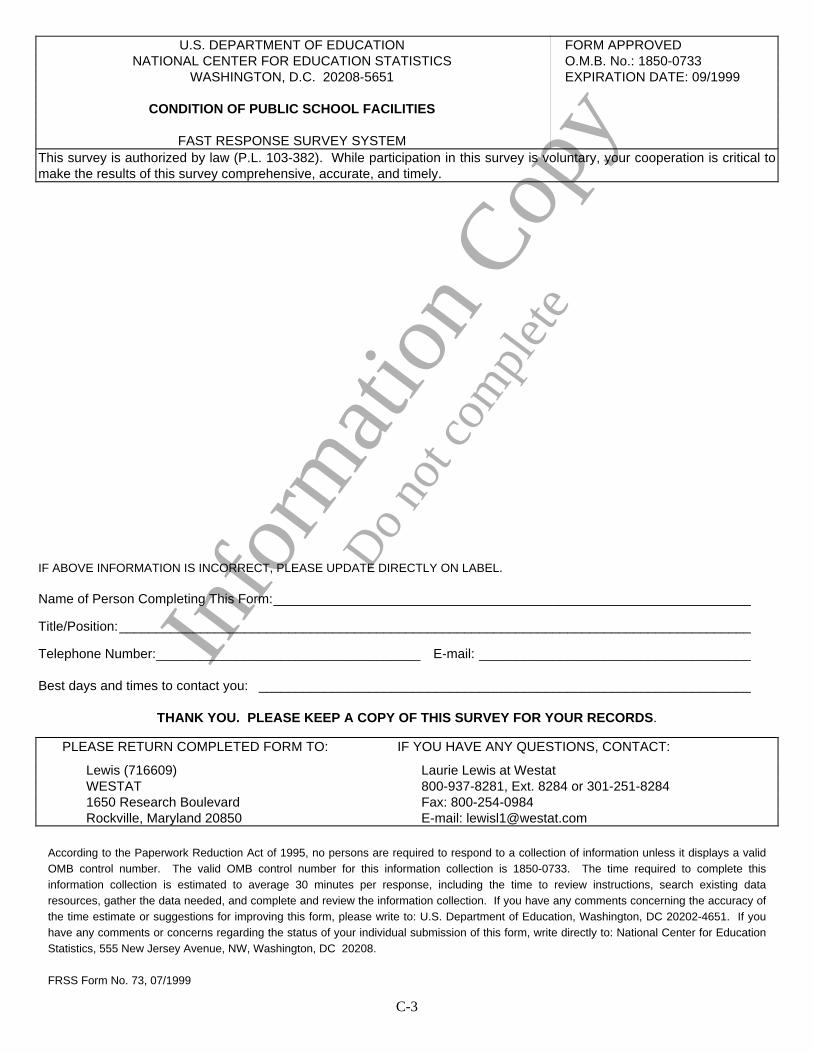
C-3
Info
rmat
ion
Copy
Do
not c
ompl
ete
U.S. DEPARTMENT OF EDUCATION FORM APPROVEDNATIONAL CENTER FOR EDUCATION STATISTICS O.M.B. No.: 1850-0733
WASHINGTON, D.C. 20208-5651 EXPIRATION DATE: 09/1999
CONDITION OF PUBLIC SCHOOL FACILITIES
FAST RESPONSE SURVEY SYSTEMThis survey is authorized by law (P.L. 103-382). While participation in this survey is voluntary, your cooperation is critical tomake the results of this survey comprehensive, accurate, and timely.
IF ABOVE INFORMATION IS INCORRECT, PLEASE UPDATE DIRECTLY ON LABEL.
Name of Person Completing This Form:_________________________________________________________________
Title/Position:______________________________________________________________________________________
Telephone Number:____________________________________ E-mail: _____________________________________
Best days and times to contact you: ___________________________________________________________________
THANK YOU. PLEASE KEEP A COPY OF THIS SURVEY FOR YOUR RECORDS.
PLEASE RETURN COMPLETED FORM TO: IF YOU HAVE ANY QUESTIONS, CONTACT:
Lewis (716609) Laurie Lewis at WestatWESTAT 800-937-8281, Ext. 8284 or 301-251-82841650 Research Boulevard Fax: 800-254-0984Rockville, Maryland 20850 E-mail: [email protected]
According to the Paperwork Reduction Act of 1995, no persons are required to respond to a collection of information unless it displays a validOMB control number. The valid OMB control number for this information collection is 1850-0733. The time required to complete thisinformation collection is estimated to average 30 minutes per response, including the time to review instructions, search existing dataresources, gather the data needed, and complete and review the information collection. If you have any comments concerning the accuracy ofthe time estimate or suggestions for improving this form, please write to: U.S. Department of Education, Washington, DC 20202-4651. If youhave any comments or concerns regarding the status of your individual submission of this form, write directly to: National Center for EducationStatistics, 555 New Jersey Avenue, NW, Washington, DC 20208.
FRSS Form No. 73, 07/1999
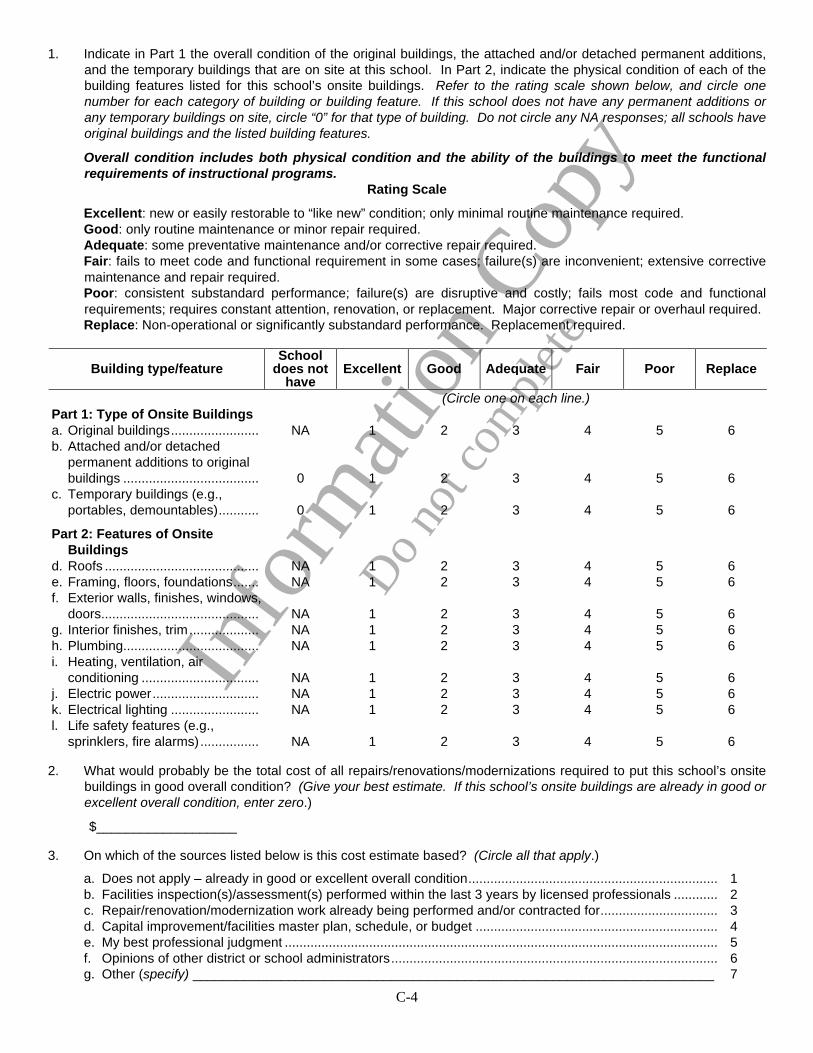
C-4
Info
rmat
ion
Copy
Do
not c
ompl
ete
1. Indicate in Part 1 the overall condition of the original buildings, the attached and/or detached permanent additions,and the temporary buildings that are on site at this school. In Part 2, indicate the physical condition of each of thebuilding features listed for this school’s onsite buildings. Refer to the rating scale shown below, and circle onenumber for each category of building or building feature. If this school does not have any permanent additions orany temporary buildings on site, circle “0” for that type of building. Do not circle any NA responses; all schools haveoriginal buildings and the listed building features.
Overall condition includes both physical condition and the ability of the buildings to meet the functionalrequirements of instructional programs.
Rating Scale
Excellent: new or easily restorable to “like new” condition; only minimal routine maintenance required.Good: only routine maintenance or minor repair required.Adequate: some preventative maintenance and/or corrective repair required.Fair: fails to meet code and functional requirement in some cases; failure(s) are inconvenient; extensive correctivemaintenance and repair required.Poor: consistent substandard performance; failure(s) are disruptive and costly; fails most code and functionalrequirements; requires constant attention, renovation, or replacement. Major corrective repair or overhaul required.Replace: Non-operational or significantly substandard performance. Replacement required.
Building type/featureSchool
does nothave
Excellent Good Adequate Fair Poor Replace
(Circle one on each line.)Part 1: Type of Onsite Buildingsa. Original buildings........................ NA 1 2 3 4 5 6b. Attached and/or detached
permanent additions to originalbuildings ..................................... 0 1 2 3 4 5 6
c. Temporary buildings (e.g.,portables, demountables)........... 0 1 2 3 4 5 6
Part 2: Features of OnsiteBuildings
d. Roofs .......................................... NA 1 2 3 4 5 6e. Framing, floors, foundations....... NA 1 2 3 4 5 6f. Exterior walls, finishes, windows,
doors........................................... NA 1 2 3 4 5 6g. Interior finishes, trim................... NA 1 2 3 4 5 6h. Plumbing..................................... NA 1 2 3 4 5 6i. Heating, ventilation, air
conditioning ................................ NA 1 2 3 4 5 6j. Electric power............................. NA 1 2 3 4 5 6k. Electrical lighting ........................ NA 1 2 3 4 5 6l. Life safety features (e.g.,
sprinklers, fire alarms)................ NA 1 2 3 4 5 6
2. What would probably be the total cost of all repairs/renovations/modernizations required to put this school’s onsitebuildings in good overall condition? (Give your best estimate. If this school’s onsite buildings are already in good orexcellent overall condition, enter zero.)
$___________________
3. On which of the sources listed below is this cost estimate based? (Circle all that apply.)
a. Does not apply – already in good or excellent overall condition.................................................................... 1b. Facilities inspection(s)/assessment(s) performed within the last 3 years by licensed professionals ............ 2c. Repair/renovation/modernization work already being performed and/or contracted for................................ 3d. Capital improvement/facilities master plan, schedule, or budget .................................................................. 4e. My best professional judgment ...................................................................................................................... 5f. Opinions of other district or school administrators......................................................................................... 6g. Other (specify) _______________________________________________________________________ 7
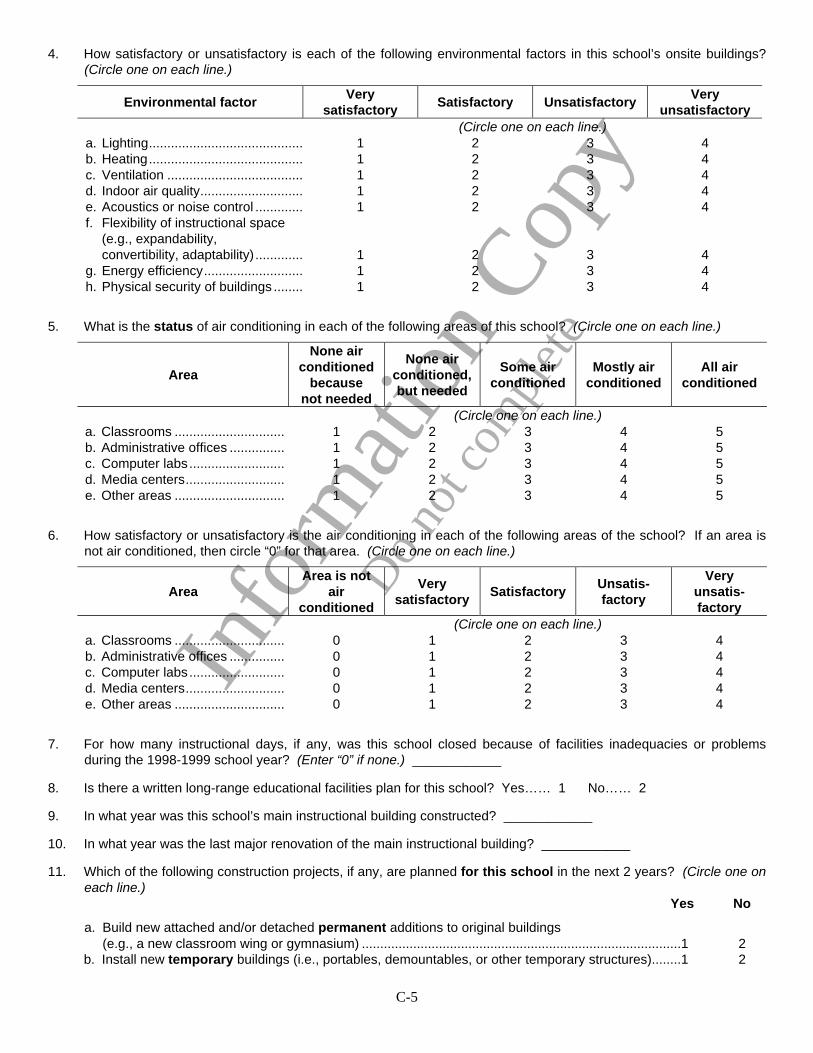
C-5
Info
rmat
ion
Copy
Do
not c
ompl
ete
4. How satisfactory or unsatisfactory is each of the following environmental factors in this school’s onsite buildings?(Circle one on each line.)
Environmental factorVery
satisfactorySatisfactory Unsatisfactory
Veryunsatisfactory
(Circle one on each line.)a. Lighting.......................................... 1 2 3 4b. Heating.......................................... 1 2 3 4c. Ventilation ..................................... 1 2 3 4d. Indoor air quality............................ 1 2 3 4e. Acoustics or noise control ............. 1 2 3 4f. Flexibility of instructional space
(e.g., expandability,convertibility, adaptability) ............. 1 2 3 4
g. Energy efficiency........................... 1 2 3 4h. Physical security of buildings ........ 1 2 3 4
5. What is the status of air conditioning in each of the following areas of this school? (Circle one on each line.)
Area
None airconditioned
becausenot needed
None airconditioned,but needed
Some airconditioned
Mostly airconditioned
All airconditioned
(Circle one on each line.)a. Classrooms .............................. 1 2 3 4 5b. Administrative offices ............... 1 2 3 4 5c. Computer labs.......................... 1 2 3 4 5d. Media centers........................... 1 2 3 4 5e. Other areas .............................. 1 2 3 4 5
6. How satisfactory or unsatisfactory is the air conditioning in each of the following areas of the school? If an area isnot air conditioned, then circle “0” for that area. (Circle one on each line.)
AreaArea is not
airconditioned
Verysatisfactory
SatisfactoryUnsatis-factory
Veryunsatis-factory
(Circle one on each line.)a. Classrooms .............................. 0 1 2 3 4b. Administrative offices ............... 0 1 2 3 4c. Computer labs.......................... 0 1 2 3 4d. Media centers........................... 0 1 2 3 4e. Other areas .............................. 0 1 2 3 4
7. For how many instructional days, if any, was this school closed because of facilities inadequacies or problemsduring the 1998-1999 school year? (Enter “0” if none.) ____________
8. Is there a written long-range educational facilities plan for this school? Yes…… 1 No…… 2
9. In what year was this school’s main instructional building constructed? ____________
10. In what year was the last major renovation of the main instructional building? ____________
11. Which of the following construction projects, if any, are planned for this school in the next 2 years? (Circle one oneach line.)
Yes No
a. Build new attached and/or detached permanent additions to original buildings(e.g., a new classroom wing or gymnasium) .......................................................................................1 2
b. Install new temporary buildings (i.e., portables, demountables, or other temporary structures)........1 2
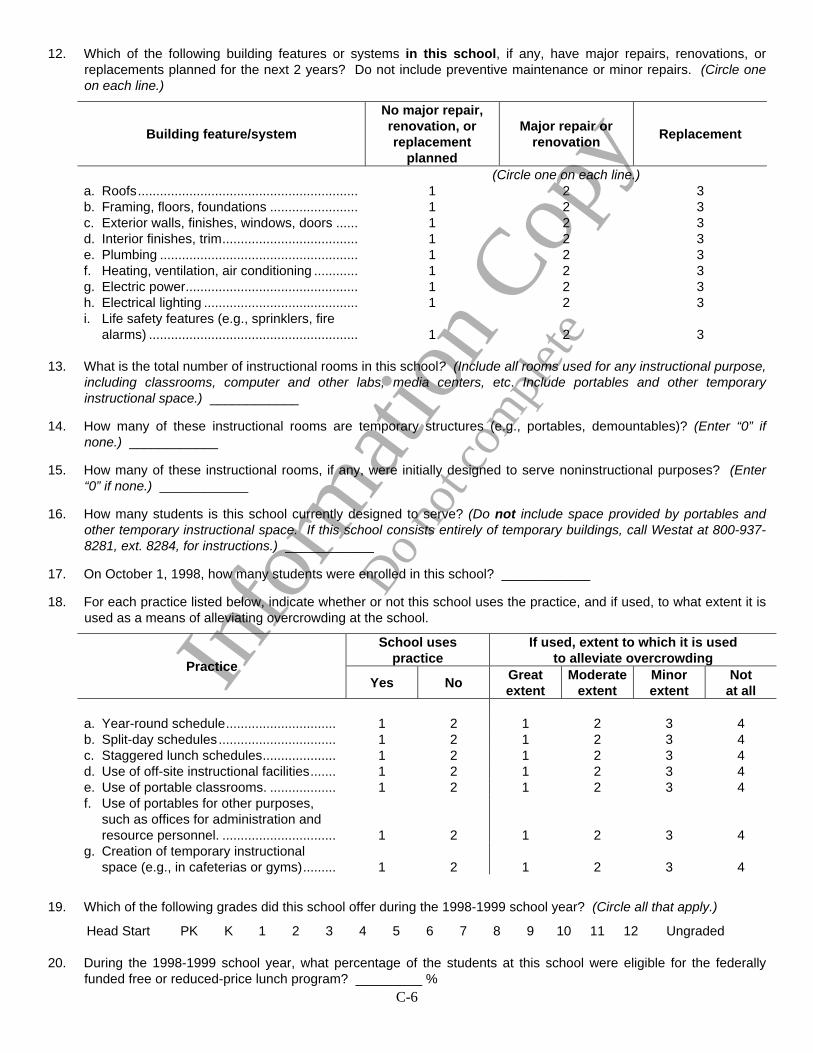
C-6
Info
rmat
ion
Copy
Do
not c
ompl
ete
12. Which of the following building features or systems in this school, if any, have major repairs, renovations, orreplacements planned for the next 2 years? Do not include preventive maintenance or minor repairs. (Circle oneon each line.)
Building feature/system
No major repair,renovation, orreplacement
planned
Major repair orrenovation
Replacement
(Circle one on each line.)a. Roofs............................................................ 1 2 3b. Framing, floors, foundations ........................ 1 2 3c. Exterior walls, finishes, windows, doors ...... 1 2 3d. Interior finishes, trim..................................... 1 2 3e. Plumbing ...................................................... 1 2 3f. Heating, ventilation, air conditioning ............ 1 2 3g. Electric power............................................... 1 2 3h. Electrical lighting .......................................... 1 2 3i. Life safety features (e.g., sprinklers, fire
alarms) ......................................................... 1 2 3
13. What is the total number of instructional rooms in this school? (Include all rooms used for any instructional purpose,including classrooms, computer and other labs, media centers, etc. Include portables and other temporaryinstructional space.) ____________
14. How many of these instructional rooms are temporary structures (e.g., portables, demountables)? (Enter “0” ifnone.) ____________
15. How many of these instructional rooms, if any, were initially designed to serve noninstructional purposes? (Enter“0” if none.) ____________
16. How many students is this school currently designed to serve? (Do not include space provided by portables andother temporary instructional space. If this school consists entirely of temporary buildings, call Westat at 800-937-8281, ext. 8284, for instructions.) ____________
17. On October 1, 1998, how many students were enrolled in this school? ____________
18. For each practice listed below, indicate whether or not this school uses the practice, and if used, to what extent it isused as a means of alleviating overcrowding at the school.
School usespractice
If used, extent to which it is usedto alleviate overcrowding
PracticeYes No
Greatextent
Moderateextent
Minorextent
Notat all
a. Year-round schedule.............................. 1 2 1 2 3 4b. Split-day schedules................................ 1 2 1 2 3 4c. Staggered lunch schedules.................... 1 2 1 2 3 4d. Use of off-site instructional facilities....... 1 2 1 2 3 4e. Use of portable classrooms. .................. 1 2 1 2 3 4f. Use of portables for other purposes,
such as offices for administration andresource personnel. ............................... 1 2 1 2 3 4
g. Creation of temporary instructionalspace (e.g., in cafeterias or gyms)......... 1 2 1 2 3 4
19. Which of the following grades did this school offer during the 1998-1999 school year? (Circle all that apply.)
Head Start PK K 1 2 3 4 5 6 7 8 9 10 11 12 Ungraded
20. During the 1998-1999 school year, what percentage of the students at this school were eligible for the federallyfunded free or reduced-price lunch program? _________ %