Embed Size (px)
Citation preview
This document has been prepared for Inner West Council only. © 2018 SPM Assets Pty Ltd
INNER WEST COUNCIL
Condition Assessment Report
August 2018
Condition Assessment Report Inner West Council
© 2018 SPM Assets Pty Ltd, August 2018 Final Inner West Council, 7441 i
GLOSSARY
Asset Management Plan An AMP is a report that summarises the end outcomes of the asset planning process. It documents the current and projected asset status and considers options to achieve strategic objectives through using asset solutions.
Asset Register A record of asset information including some or all of; inventory, historical, service, financial, condition, construction, technical and financial information about each asset.
Base Life The physical life of a building component expected considering its local environment. The life is measured from time of installation to time of its anticipated replacement, renewal or disposal.
Capital Expenditure (Capex)
Expenditure used to create new assets (through addition or renewal) or to increase the capacity of existing assets beyond their original design capacity or potential. Capex increases the value of asset stock.
Component The specific asset at the lowest level of detail, i.e. solid door, aluminium window, etc.
Component Group High level categorisation of a component, i.e. roof, floor coverings, etc.
Component Type Mid-level categorisation of components that fit under Component Group, i.e. roof drainage, lights, extinguishers, etc.
Component Criticality This is the measure of the relative importance of a building component by identifying which components are more critical to the building. Criticality factors include; Likelihood of failure, risk to service delivery, appearance, health and safety impacts.
Condition The state of an asset or component at a particular time.
Condition Assessment Periodic inspection, measurement and interpretation of the resultant data of a specific component so as to determine the need for some preventative or remedial action. Condition is graded from condition grades of 1 (excellent) to 6 (end of life).
Condition Grade Index (CGI)
An overall condition rating of an asset that take into account each individual components assessed condition against its identified Gross Replacement Cost (GRC). A CGI figure that is close to 1.0 represents an asset to be in a very good condition overall whilst a CGI of 2.3 means that some of the components have been assessed to be in a poor to very poor condition.
Critical Assets Assets for which the financial, business or service level consequences of failure are sufficiently severe to justify proactive inspection and rehabilitation. Critical assets have a lower threshold for action than non-critical assets.
Capital Replacement Value (CRV)
The cost to replace the structure, which is a combination of the Gross Replacement Cost and the Residual Structural Value. Cost is expressed in today’s (2018) dollar value.
Depreciated Replacement The replacement cost of an existing asset less an allowance for wear

Condition Assessment Report Inner West Council
© 2018 SPM Assets Pty Ltd, August 2018 Final Inner West Council, 7441 ii
Cost (DRC) or consumption having regard for the economic life of the existing asset. Cost is expressed in today’s (2018) dollar value.
Economic Life The total useful life of a building component based on its Level of Service. The life is measured from time of installation to time of its expected replacement, renewal or disposal.
Facility Condition Index (FCI)
Facility Condition Index (FCI) is a percentage figure, used as a building condition standard, that identifies the works required for an asset based upon the component currently in a poorer condition and any component that have a remaining life of less than 5 years.
Gross Replacement Cost (GRC)
The identified cost of the assessed assets and components that are to be replaced within the lifespan of the building structure. Cost value does not include the Residual Structural Value (RSV). Cost is expressed in today’s (2018) dollar value.
Key Performance Indicators (KPI)
A qualitative or quantitative measure of a service or activity used to compare actual performance against a standard or other target. Performance indicators commonly relate to statutory limits, safety, responsiveness, cost, comfort, asset performance, reliability, efficiency, environmental protection and customer satisfaction.
Level of Service The defined service quality for a particular activity or service area against which service performance may be measured. Service levels usually relate to quality, quantity, reliability, responsiveness, environmental acceptability and cost.
Lifecycle The cycle of activities that an asset (or facility) goes through while it retains an identity as a particular asset i.e. from planning and design to decommissioning or disposal.
Lifecycle Cost The total cost of an asset throughout its life including planning, design, construction, acquisition, operation, maintenance, rehabilitation, and disposal costs. Cost is expressed in today’s (2018) dollar value.
Lifecycle Cost Analysis Any technique which allows assessment of a given solution, or choice from among alternative solutions, on the basis of all relevant economic consequences over the service life of the asset. Cost is expressed in today’s (2018) dollar value.
Maintenance All actions necessary for retaining an asset as near as practicable to its original condition, but excluding rehabilitation or renewal.
Operation The active process of using an asset or service that consumes resources such as manpower, energy, chemicals and materials.
Operational Expenditure Operational expenditure refers to day-to-day operational costs associated with the site itself to deliver the general services. This specifically refers to the; gas, water, sewerage, and electricity services.
Planned Maintenance Planned maintenance activities fall into three categories: i) Periodic – necessary to ensure the reliability or to sustain the design life of an asset. ii) Predictive – condition monitoring activities used to predict failure. iii) Preventative – maintenance that can be initiated
Condition Assessment Report Inner West Council
© 2018 SPM Assets Pty Ltd, August 2018 Final Inner West Council, 7441 iii
without routine or continuous checking and is not condition based.
Planned Scheduled Maintenance
Scheduled maintenance tasks are established to prolong the useful life of their associated assets. These related tasks can be daily, weekly, and monthly in occurrence to keep assets operational and at the required standard.
Property Quality Standard (PQS)
A desired level of performance, measured by pre-defined factors, relating to an overall characteristic of a property portfolio.
Reactive Maintenance Reactive maintenance tasks focus solely on the unknown maintenance that is required for the building and related infrastructure assets which are generally due to unforeseen breakages, damage, and vandalism.
Remaining Life (Assessed)
The remaining life (measured in number of years) of a building component as assessed by a property surveyor, e.g. carpet has an assessed remaining life of 10 years.
Remaining Life (Calculated)
The remaining life (measured in number of years) of a building component as calculated by an analysis considering deterioration, functionality and utilisation.
Renewal Works to upgrade, refurbish or replace existing assets with assets of equivalent capacity or performance capability using Capex.
Repairs & Maintenance Budget
The repairs and maintenance budget refers to the allocated expenditure that has been set aside for the unexpected/unforeseen maintenance and renewal works that may arise.
Replacement The complete replacement of an asset that has reached the end of its life.
Residual Structural Value (RSV)
The difference between the CRC and the replacement cost sum of the assessed components (GRC). Refers to components that are not able to be replaced through lifespan of asset, i.e. concrete foundation slab, concrete support columns, etc. Cost is expressed in today’s (2018) dollar value.
Risk Management The application of a formal process to the range of possible values relating to key factors associated with a risk in order to determine the resultant ranges of outcomes and their probability of occurrence.
Useful Life Either:
(a) the period over which an asset is expected to be available for use by an entity, or
(b) the number of production or similar units expected to be obtained from the asset by the entity.
It is estimated or expected time between placing the asset into service and removing it from service, or the estimated period of time over which the future economic benefits embodied in a depreciable asset, are expected to be consumed by the council. It is the same as the economic life.
Condition Assessment Report Inner West Council
© 2018 SPM Assets Pty Ltd, August 2018 Final Inner West Council, 7441 iv
Table of Contents
GLOSSARY .................................................................................................................. i
1 OVERVIEW ................................................................................................................. 5
1.1 Purpose ............................................................................................................... 5
1.2 Background .......................................................................................................... 5
1.3 Requirements ....................................................................................................... 5
1.4 Assessment Methodology ....................................................................................... 6
2 ASSET REGISTER........................................................................................................ 6
2.1 Overview ............................................................................................................. 6
2.2 Description of Visually-Assessed Components ........................................................... 6
2.3 Asset Register ...................................................................................................... 7
2.4 Condition Forecast .............................................................................................. 10
3 FUNCTIONALITY & PERFORMANCE ASSESSMENTS ........................................................ 12
3.1 Overview ........................................................................................................... 12
3.2 PQS Assessment Process ...................................................................................... 12
3.3 PQS Shortfalls .................................................................................................... 12
4 STANDARDS & SHORTFALLS ...................................................................................... 14
4.1 Property Quality Standards ................................................................................... 14
5 RENEWAL FORECASTS .............................................................................................. 15
5.1 Determining Backlog ........................................................................................... 15
5.2 10 Years Works Program ...................................................................................... 19
6 RISK MANAGEMENT .................................................................................................. 21
6.1 Principles ........................................................................................................... 21
6.2 Risk Identification ............................................................................................... 21
6.3 Associated Risk – Property Quality Standards ......................................................... 24
6.4 Project Prioritisation Based on Risk ........................................................................ 25
Condition Assessment Report Inner West Council
© 2018 SPM Assets Pty Ltd, August 2018 Final Inner West Council, 7441 Page 5
1 OVERVIEW
1.1 Purpose
The purpose of this report is to provide Council with an overview of the recently conducted building condition & generalist compliance assessments, Hazardous Materials Inspections, and Valuations which were undertaken across 298 preselected building assets within Council’s portfolio, and the resulting analysis & reporting outputs that have been produced.
This report will focus on a wide range of Council’s building assets that includes; offices, operational buildings, depots, town halls, community halls, sporting grounds facilities, toilet blocks, aquatic facilities, nursery and childcare centres, and libraries.
1.2 Background
Inner West Council (Council) put out a tender in November 2017 seeking professional services for buildings condition assessments, hazardous materials investigations, and property valuations of building assets to contribute to planning for asset renewal, upgrade, and strategy. SPM Assets Pty Ltd (SPM Assets) responded to Council’s tender and was notified in last December 2017 of the successful bid.
SPM Assets commenced the ‘Building Condition Survey, Maintenance Programs and Valuations’ project in January 2018, in which SPM Assets’ sub-contracted Prensa Pty Ltd (Prensa) and Scott Fullaton Valuations (SFV) to undertake the hazardous materials investigations and property valuations respectively. SPM Assets would undertake the building condition and generalist compliance assessments.
1.3 Requirements
For the building condition and generalist compliance assessments, Council requires an approach that is aligned with industry best practice & standards but will also support their internal requirements. These internal requirements are focused on the manner in which future maintenance or capital works are to be conducted, whilst ensuring that the asset information collected will support the any future decision making based upon building condition, functionality, and performance. The approach proposed will utilise the SPM Assets software application’s analysis and reporting capabilities to ensure that the appropriate information is gathered with the established level of details and accuracy.
Through the initial brief of the project the following requirements have been established:
Asset component condition assessments on a pre-selected 298 building assets Further improve general site & building information Undertake generalist compliance assessments to identify where further compliance
inspections/works may be required Defect investigations & recommendations Align asset information Produce a risk analysis of Council’s building portfolio Produce a 10-year works programme that includes costings for the portfolio as a whole &
down to an individual building asset

Condition Assessment Report Inner West Council
© 2018 SPM Assets Pty Ltd, August 2018 Final Inner West Council, 7441 Page 6
1.4 Assessment Methodology
The onsite assessments were completed using the Mobile capability of the SPM Assets application on a tablet device. The implemented assessment approach, and the SPM Assets software itself is directly aligned with ISO 55000, IIMM, NAMS Property Manual, and IPWEA/NAMS Practice Note #3.
The collected asset data from the onsite condition assessment have been uploaded into the SPM Assets application, from which it has been analysed and reported upon. The results gained are reflected within this report.
2 ASSET REGISTER
2.1 Overview
The Asset Register was compiled through the SPM Assets software application in parallel to the building asset condition & generalist compliance assessments being undertaken. These onsite assessments took place between January 2018 & April 2018, in which a total of 298 building assets were assessed.
The overall results from the assessment process can be seen summarised within Table 2-1 below.
Table 2-1 Property Information
No. of Sites 115
No. of Building Assets 298
Building Floor Area (m2) 107,122
Gross Replacement Cost (GRC) $ 107,909,753
Capital Replacement Value (CRV) $ 369,792,000
Further elaborating on the overall asset information within Table 2-1 above, Council’s overall portfolio was seen to be in good condition overall, however there was a variation across the portfolio. The assessed condition grading has been based upon the assessed building components that were captured within the assessment process, however the following points (outlined in further detail within this report) need to be recognised when considering the overall condition of the portfolio.
7.1% (by value - $26,236,377) of the building Capital Replacement Value (CRV) was identified to be in a poorer condition.
923 identified building-related defects/issues were captured.
2.2 Description of Visually-Assessed Components
Through the completed onsite building asset condition assessments, a total of 41,310 identified “renewable”, “replaceable”, and “maintainable” components have been captured. The Gross Replacement Cost (GRC) of the assessed components (the value of components that will be proactively renewed/replaced over the optimal lifespan of the asset) has been identified to be $107,532,063. The GRC differs from the CRV value as the GRC does not include the Residual Structure & other

Condition Assessment Report Inner West Council
© 2018 SPM Assets Pty Ltd, August 2018 Final Inner West Council, 7441 Page 7
components that were not assessed or could not be visually assessed, whereas the CRV includes all these elements.
Within Table 2-2 the GRC & CRV values against the building function.
Table 2-2 Building Function – Component Condition
Building Function No. of
Buildings Floor Area
(m2) No. of
Components GRC ($)
CRV ($)
Administration 4 14,668 5,308 17,767,563 69,043,000
Aquatic Centre 15 9,887 2,555 10,817,723 45,361,000
Café / Restaurant 7 772 553 1,138,521 3,396,000
Car Park 2 15,170 214 2,363,700 14,868,000
Caretaker 5 751 726 1,067,301 2,367,000
Childcare - Council Operated 18 7,193 5,364 11,279,883 18,079,000
Childcare - Leased Out 13 3,392 2,738 5,285,614 18,372,000
Community / Creative Space 6 950 800 1,228,899 4,696,000
Community Centre - Council Operated
17 5,750 3,246 6,662,385 29,063,000
Community Centre - Leased Out 40 16,542 7,269 18,822,580 54,922,000
Depot / Administration 6 5,716 1,606 5,079,009 17,934,000
Depot / Amenities 3 780 330 942,116 2,747,000
Depot / Operational 22 5,441 733 3,107,724 6,644,000
Libraries 7 8,029 2,582 6,646,221 34,131,000
Park / Amenities 34 4,592 3,160 5,985,789 16,385,000
Park / Grandstand 8 3,462 1,730 5,315,398 18,425,000
Park / Toilet 23 674 908 1,231,244 2,635,000
Park / Utilities 42 2,502 725 1,880,693 4,509,000
Public Amenities 3 58 133 114,605 476,000
Residential 4 333 419 460,559 3,910,000
Reuse 3 460 211 412,163 1,356,000
Total 298 107,122 41,310 $ 107,609,689 $ 369,319,000
2.3 Asset Register
The Asset Register has been compiled in parallel to the building asset condition assessments and valuations of the preselected 298 building assets. The Property Surveyors will “identify”, “quantify”, and “assess” each visually-identified component at each building asset using the Mobile module of the SPM Assets application. The collected information is then overlaid with the valuation information to identify a breakdown in the condition for the predetermined five (5) component types. Note: The visually-assessed condition of components is solely based upon the structural integrity
Condition Assessment Report Inner West Council
© 2018 SPM Assets Pty Ltd, August 2018 Final Inner West Council, 7441 Page 8
of the component and does not take into account its aesthetics. This meaning that a component assessed to be in very good condition will not have its condition downgraded if it is seen to be ‘out-of-style’.
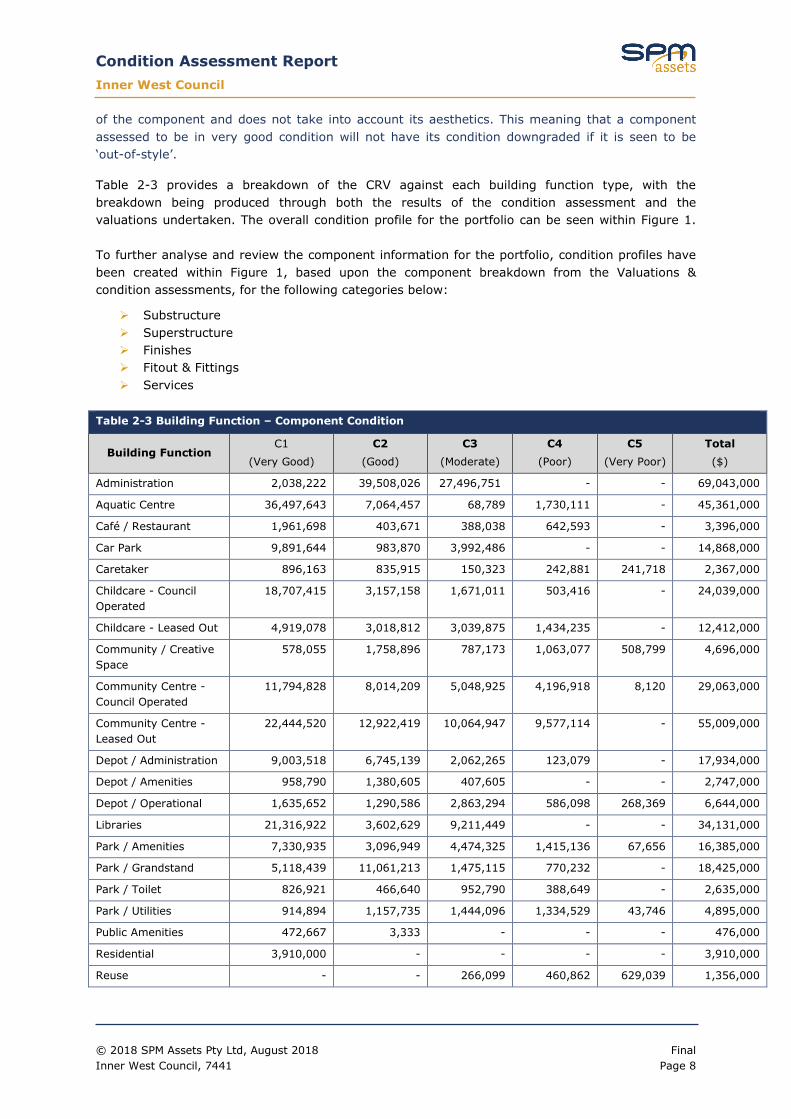
Table 2-3 provides a breakdown of the CRV against each building function type, with the breakdown being produced through both the results of the condition assessment and the valuations undertaken. The overall condition profile for the portfolio can be seen within Figure 1. To further analyse and review the component information for the portfolio, condition profiles have been created within Figure 1, based upon the component breakdown from the Valuations & condition assessments, for the following categories below:
Substructure Superstructure Finishes Fitout & Fittings Services
Table 2-3 Building Function – Component Condition
Building Function C1
(Very Good) C2
(Good) C3
(Moderate) C4
(Poor) C5
(Very Poor) Total ($)
Administration 2,038,222 39,508,026 27,496,751 - - 69,043,000
Aquatic Centre 36,497,643 7,064,457 68,789 1,730,111 - 45,361,000
Café / Restaurant 1,961,698 403,671 388,038 642,593 - 3,396,000
Car Park 9,891,644 983,870 3,992,486 - - 14,868,000
Caretaker 896,163 835,915 150,323 242,881 241,718 2,367,000
Childcare - Council Operated
18,707,415 3,157,158 1,671,011 503,416 - 24,039,000
Childcare - Leased Out 4,919,078 3,018,812 3,039,875 1,434,235 - 12,412,000
Community / Creative Space
578,055 1,758,896 787,173 1,063,077 508,799 4,696,000
Community Centre - Council Operated
11,794,828 8,014,209 5,048,925 4,196,918 8,120 29,063,000
Community Centre - Leased Out
22,444,520 12,922,419 10,064,947 9,577,114 - 55,009,000
Depot / Administration 9,003,518 6,745,139 2,062,265 123,079 - 17,934,000
Depot / Amenities 958,790 1,380,605 407,605 - - 2,747,000
Depot / Operational 1,635,652 1,290,586 2,863,294 586,098 268,369 6,644,000
Libraries 21,316,922 3,602,629 9,211,449 - - 34,131,000
Park / Amenities 7,330,935 3,096,949 4,474,325 1,415,136 67,656 16,385,000
Park / Grandstand 5,118,439 11,061,213 1,475,115 770,232 - 18,425,000
Park / Toilet 826,921 466,640 952,790 388,649 - 2,635,000
Park / Utilities 914,894 1,157,735 1,444,096 1,334,529 43,746 4,895,000
Public Amenities 472,667 3,333 - - - 476,000
Residential 3,910,000 - - - - 3,910,000
Reuse - - 266,099 460,862 629,039 1,356,000

Condition Assessment Report Inner West Council
© 2018 SPM Assets Pty Ltd, August 2018 Final Inner West Council, 7441 Page 9
Table 2-3 Building Function – Component Condition
Building Function C1
(Very Good) C2
(Good) C3
(Moderate) C4
(Poor) C5
(Very Poor) Total ($)
Total 161,218,005 106,472,261 75,865,357 24,468,930 1,767,447 369,792,000
Table 2-4 Component Grouping – Condition
Component Group C1
(Very Good) C2
(Good) C3
(Moderate) C4
(Poor) C5
(Very Poor) Total ($)
Substructure 11,197,782 6,418,989 368,023 241,269 105,221 18,331,284
Superstructure 54,548,468 28,238,286 55,683,804 18,254,784 1,146,295 157,871,637
Finishes 15,527,074 14,827,467 6,843,070 2,829,764 272,337 40,299,712
Fitout & Fittings 12,323,463 6,995,671 1,473,481 1,208,563 34,153 22,035,331
Services 67,621,217 49,991,847 11,496,978 1,934,550 209,441 131,254,033
Total 161,218,004 106,472,260 75,865,356 24,468,930 1,767,447 369,791,997
Overall Condition Grading Substructure
Superstructure Finishes
Fitout & Fittings Services
Condition Assessment Report Inner West Council
© 2018 SPM Assets Pty Ltd, August 2018 Final Inner West Council, 7441 Page 10
Figure 1: Overall Condition Profile & Profile by Component Category
2.4 Condition Forecast
2.4.1 Condition Grade Index (CGI)
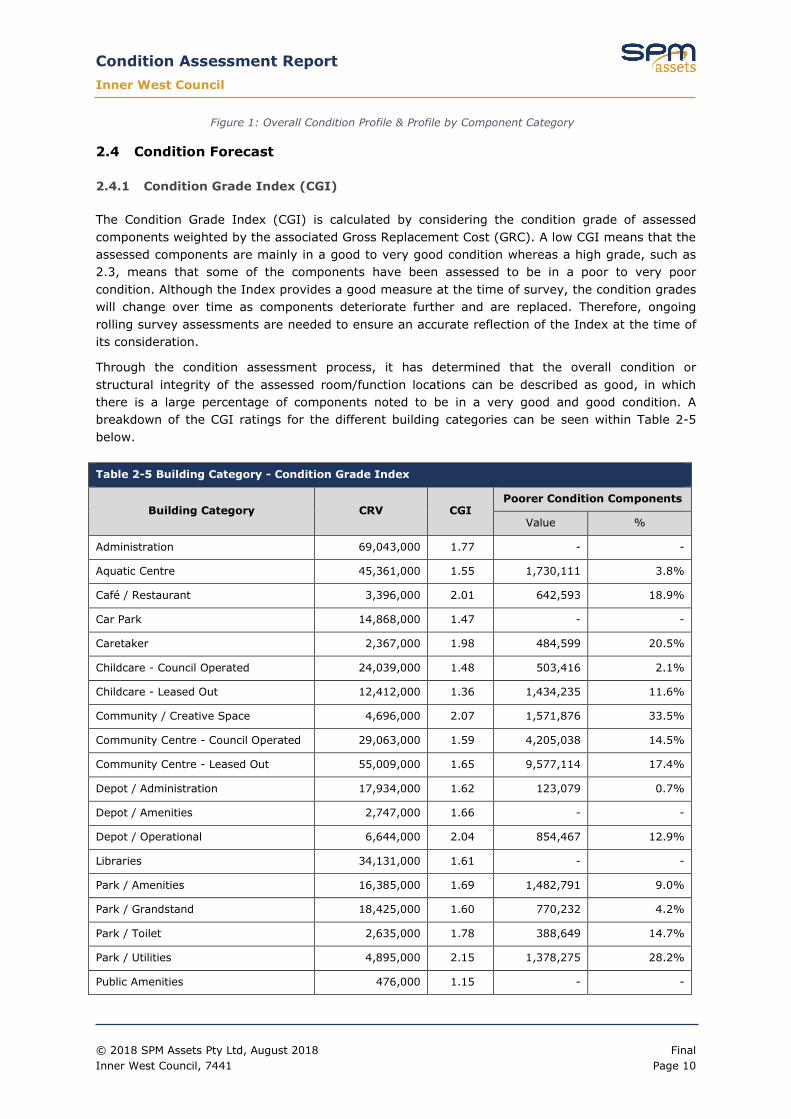
The Condition Grade Index (CGI) is calculated by considering the condition grade of assessed components weighted by the associated Gross Replacement Cost (GRC). A low CGI means that the assessed components are mainly in a good to very good condition whereas a high grade, such as 2.3, means that some of the components have been assessed to be in a poor to very poor condition. Although the Index provides a good measure at the time of survey, the condition grades will change over time as components deteriorate further and are replaced. Therefore, ongoing rolling survey assessments are needed to ensure an accurate reflection of the Index at the time of its consideration.
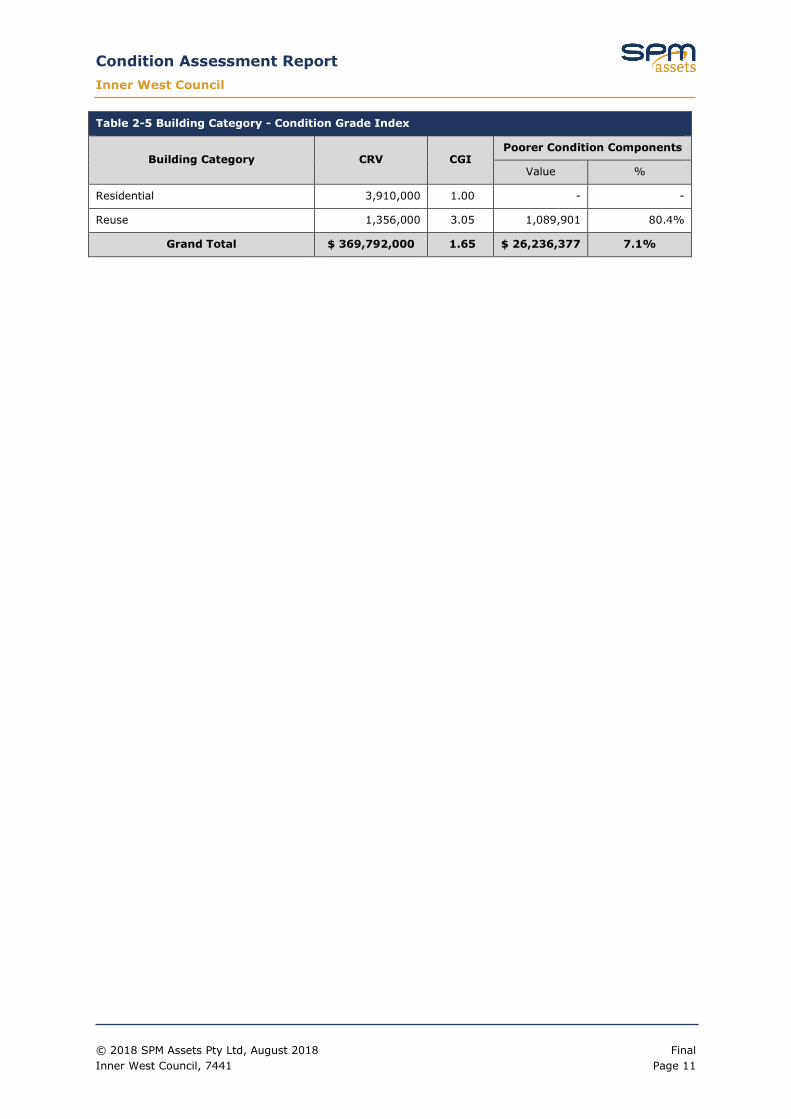
Through the condition assessment process, it has determined that the overall condition or structural integrity of the assessed room/function locations can be described as good, in which there is a large percentage of components noted to be in a very good and good condition. A breakdown of the CGI ratings for the different building categories can be seen within Table 2-5 below.
Table 2-5 Building Category - Condition Grade Index
Building Category CRV CGI Poorer Condition Components
Value %
Administration 69,043,000 1.77 - -
Aquatic Centre 45,361,000 1.55 1,730,111 3.8%
Café / Restaurant 3,396,000 2.01 642,593 18.9%
Car Park 14,868,000 1.47 - -
Caretaker 2,367,000 1.98 484,599 20.5%
Childcare - Council Operated 24,039,000 1.48 503,416 2.1%
Childcare - Leased Out 12,412,000 1.36 1,434,235 11.6%
Community / Creative Space 4,696,000 2.07 1,571,876 33.5%
Community Centre - Council Operated 29,063,000 1.59 4,205,038 14.5%
Community Centre - Leased Out 55,009,000 1.65 9,577,114 17.4%
Depot / Administration 17,934,000 1.62 123,079 0.7%
Depot / Amenities 2,747,000 1.66 - -
Depot / Operational 6,644,000 2.04 854,467 12.9%
Libraries 34,131,000 1.61 - -
Park / Amenities 16,385,000 1.69 1,482,791 9.0%
Park / Grandstand 18,425,000 1.60 770,232 4.2%
Park / Toilet 2,635,000 1.78 388,649 14.7%
Park / Utilities 4,895,000 2.15 1,378,275 28.2%
Public Amenities 476,000 1.15 - -
Condition Assessment Report Inner West Council
© 2018 SPM Assets Pty Ltd, August 2018 Final Inner West Council, 7441 Page 11
Table 2-5 Building Category - Condition Grade Index
Building Category CRV CGI Poorer Condition Components
Value %
Residential 3,910,000 1.00 - -
Reuse 1,356,000 3.05 1,089,901 80.4%
Grand Total $ 369,792,000 1.65 $ 26,236,377 7.1%
Condition Assessment Report Inner West Council
© 2018 SPM Assets Pty Ltd, August 2018 Final Inner West Council, 7441 Page 12
3 FUNCTIONALITY & PERFORMANCE ASSESSMENTS
3.1 Overview
The Property Quality Standard (PQS) process, described in IPWEA/NAMS Practice Note 3 has been used for assessing the level of service and quality of buildings. Adopting the PQS mechanism enables the measurement of ‘level of service’ statements and identification of backlogs. Future scoped projects would address these backlogs and as such, the PQS mechanism will provide a way to prioritise works. Each PQS question has an ‘answer definition’ that allows the surveyor to determine the level of service, which will in turn produce a cost if the question fails the standard. This means that the Council can vary the standards so that the cost to achieve a desired standard can easily be modelled.
This section focus the result of the building groups that are classified as medium high to high importance based on its function. Further review of the individual building function and its important factors will be conduct through a workshop session relevant Council staff for accurate assignment of the building important rating.
3.2 PQS Assessment Process
The Property Quality Standard (PQS) assessment process consists of numerous questions, answered in the field by the building assessors, which are aimed at identifying the current Level of Service (LoS) that a building asset provides. These PQS statements were tailored for each of the various building categories, acknowledging that each category has different characteristics, in which the overall results of the PQS assessment process can be viewed within the produced report, ‘Summary of PQS Assessment Report’.
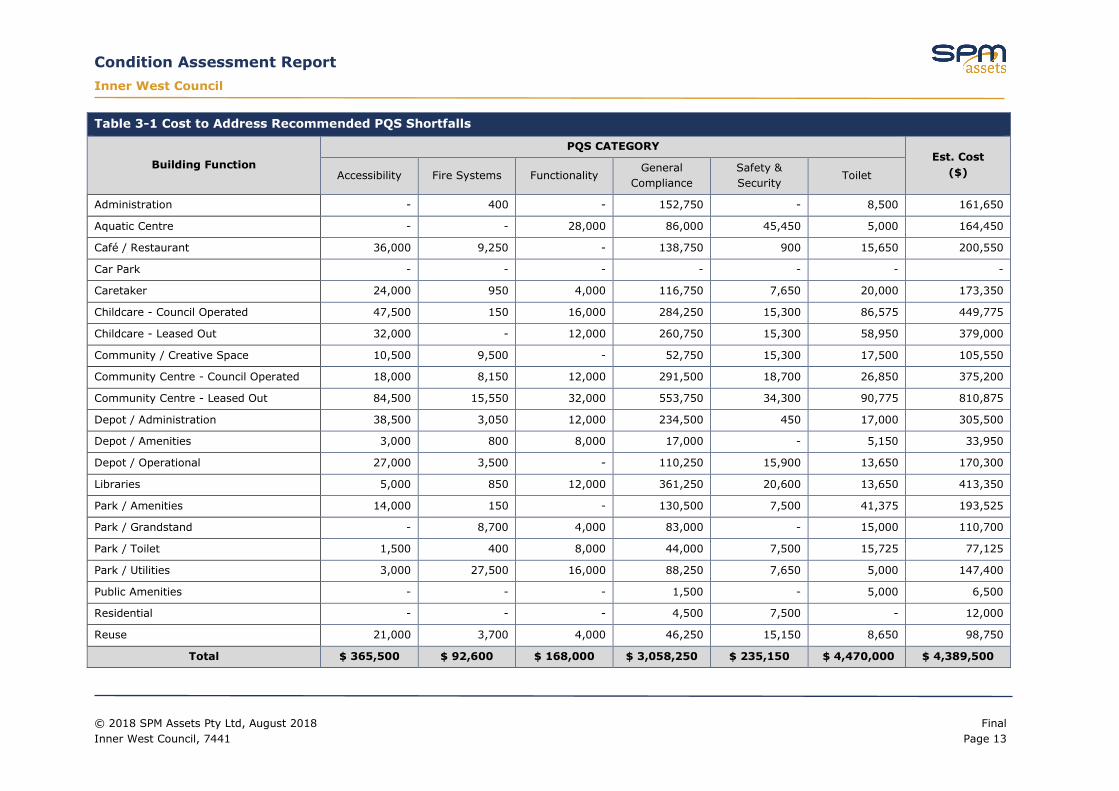
3.3 PQS Shortfalls
All 282 building assets that were assessed as part of this project underwent PQS assessment. Statements that were seen to not meet their expected levels, based upon the statement criteria itself, are classified as PQS shortfalls. PQS shortfalls identify potential deficiencies of the building asset in relation to its expected standard, from which the PQS shortfalls can be transformed into a works program of upgrades to the building assets to ensure that they are aligned with Council’s expectations and are ‘fit for the future’.
Table 3-1 provides a breakdown of the recommended works and associated estimated costs for addressing the PQS shortfalls associated with the different building assets and categories.
Note: The estimated costs associated with the PQS shortfalls have been determined based upon a generalist assessment. These generalist assessments do not constitute for specialist assessments, from which Council should engage a specialist BCA/DDA assessor.
Condition Assessment Report Inner West Council
© 2018 SPM Assets Pty Ltd, August 2018 Final Inner West Council, 7441 Page 13
Table 3-1 Cost to Address Recommended PQS Shortfalls
Building Function
PQS CATEGORY Est. Cost
($) Accessibility Fire Systems Functionality General
Compliance Safety & Security
Toilet
Administration - 400 - 152,750 - 8,500 161,650
Aquatic Centre - - 28,000 86,000 45,450 5,000 164,450
Café / Restaurant 36,000 9,250 - 138,750 900 15,650 200,550
Car Park - - - - - - -
Caretaker 24,000 950 4,000 116,750 7,650 20,000 173,350
Childcare - Council Operated 47,500 150 16,000 284,250 15,300 86,575 449,775
Childcare - Leased Out 32,000 - 12,000 260,750 15,300 58,950 379,000
Community / Creative Space 10,500 9,500 - 52,750 15,300 17,500 105,550
Community Centre - Council Operated 18,000 8,150 12,000 291,500 18,700 26,850 375,200
Community Centre - Leased Out 84,500 15,550 32,000 553,750 34,300 90,775 810,875
Depot / Administration 38,500 3,050 12,000 234,500 450 17,000 305,500
Depot / Amenities 3,000 800 8,000 17,000 - 5,150 33,950
Depot / Operational 27,000 3,500 - 110,250 15,900 13,650 170,300
Libraries 5,000 850 12,000 361,250 20,600 13,650 413,350
Park / Amenities 14,000 150 - 130,500 7,500 41,375 193,525
Park / Grandstand - 8,700 4,000 83,000 - 15,000 110,700
Park / Toilet 1,500 400 8,000 44,000 7,500 15,725 77,125
Park / Utilities 3,000 27,500 16,000 88,250 7,650 5,000 147,400
Public Amenities - - - 1,500 - 5,000 6,500
Residential - - - 4,500 7,500 - 12,000
Reuse 21,000 3,700 4,000 46,250 15,150 8,650 98,750
Total $ 365,500 $ 92,600 $ 168,000 $ 3,058,250 $ 235,150 $ 4,470,000 $ 4,389,500
Condition Assessment Report Inner West Council
© 2018 SPM Assets Pty Ltd, August 2018 Inner West Council, 7441
4 STANDARDS & SHORTFALLS
4.1 Property Quality Standards
As part of determining the overall requirements of the Council’s building portfolio moving forward, a structured review of the condition & generalist compliance assessment results against the established Quality Standard will help determine the priority and criticality of works that are to take place into the future.
At this point in time, Council has applied an initial importance ranking to each of their building assets within the portfolio. This ranking has provided an initial works prioritisation level moving forward for Council and the portfolio. In terms of an asset Quality Standard, Council has adopted a stance that no component should be in a poorer condition (C4/C5 condition) at any point in time. This meaning that components will be proactively “renewed”, “replaced”, “maintained” to ensure that they are never in or reach a poorer condition state.
As an improvement activity, Council should review the collected information and further establish Quality Standards for each building asset within the portfolio that aligns with both Council’s and the community’s expectation, but also with Council’s budgets.
4.1.1 Setting a Quality Standard
When reviewing an individual building asset, or Council’s portfolio as a whole, it would be ideal moving forward that a Quality Standard is applied to each building asset within the portfolio.
Listed within the two sections below, it states the current applied Quality Standard for Council’s building assets against a further potential Quality Standard.
Building-Level Quality Standard. As an overarching Quality Standard against all building assets, the following items have been identified as part of the building-level Quality Standard.
No components are to ever be in a poorer condition (C4 or C5 condition grade). Any OHS issue is to be addressed/rectified as soon as possible. All defects are to undergo review and subsequently addressed as prioritised.
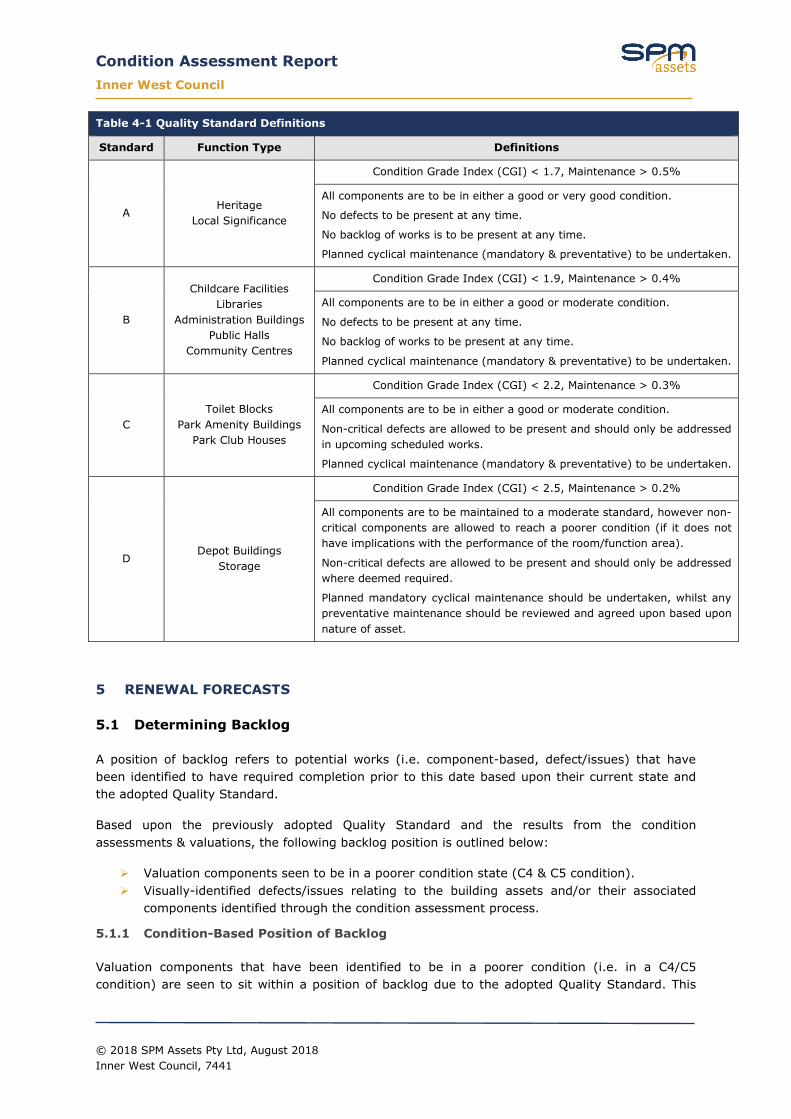
Further Potential Building-Level Quality Standard. Taking the current building-level Quality Standard a step further would be an improvement activity for Council when refining their Asset management strategies and policies. This step further would involve building categorisation of each building asset and setting a defined condition/performance standard for each of these categorisations. This would ultimately ensure that each asset category would have a standard applicable to its operations whilst the standard would also ensure that each asset within a category was performing to the correct level required.
Within the table below is a proposed or potential standardisation of the Quality Standard for different categories of assets. Council would need to review this categorisation and then further enhance it to be aligned with their view and expectations.
Table 4-1 Quality Standard Definitions
Standard Function Type Definitions
Condition Assessment Report Inner West Council
© 2018 SPM Assets Pty Ltd, August 2018 Inner West Council, 7441
Table 4-1 Quality Standard Definitions
Standard Function Type Definitions
A Heritage
Local Significance
Condition Grade Index (CGI) < 1.7, Maintenance > 0.5%
All components are to be in either a good or very good condition.
No defects to be present at any time.
No backlog of works is to be present at any time.
Planned cyclical maintenance (mandatory & preventative) to be undertaken.
B
Childcare Facilities Libraries
Administration Buildings Public Halls
Community Centres
Condition Grade Index (CGI) < 1.9, Maintenance > 0.4%
All components are to be in either a good or moderate condition.
No defects to be present at any time.
No backlog of works to be present at any time.
Planned cyclical maintenance (mandatory & preventative) to be undertaken.
C Toilet Blocks
Park Amenity Buildings Park Club Houses
Condition Grade Index (CGI) < 2.2, Maintenance > 0.3%
All components are to be in either a good or moderate condition.
Non-critical defects are allowed to be present and should only be addressed in upcoming scheduled works.
Planned cyclical maintenance (mandatory & preventative) to be undertaken.
D Depot Buildings
Storage
Condition Grade Index (CGI) < 2.5, Maintenance > 0.2%
All components are to be maintained to a moderate standard, however non-critical components are allowed to reach a poorer condition (if it does not have implications with the performance of the room/function area).
Non-critical defects are allowed to be present and should only be addressed where deemed required.
Planned mandatory cyclical maintenance should be undertaken, whilst any preventative maintenance should be reviewed and agreed upon based upon nature of asset.
5 RENEWAL FORECASTS
5.1 Determining Backlog
A position of backlog refers to potential works (i.e. component-based, defect/issues) that have been identified to have required completion prior to this date based upon their current state and the adopted Quality Standard.
Based upon the previously adopted Quality Standard and the results from the condition assessments & valuations, the following backlog position is outlined below:
Valuation components seen to be in a poorer condition state (C4 & C5 condition). Visually-identified defects/issues relating to the building assets and/or their associated
components identified through the condition assessment process.
5.1.1 Condition-Based Position of Backlog
Valuation components that have been identified to be in a poorer condition (i.e. in a C4/C5 condition) are seen to sit within a position of backlog due to the adopted Quality Standard. This
Condition Assessment Report Inner West Council
© 2018 SPM Assets Pty Ltd, August 2018 Inner West Council, 7441
Quality Standard adopted by Council is aligned with Special Schedule #7 reporting, whilst also is a risk-based approach as components in a poorer condition will typically have an increased probability of failure.
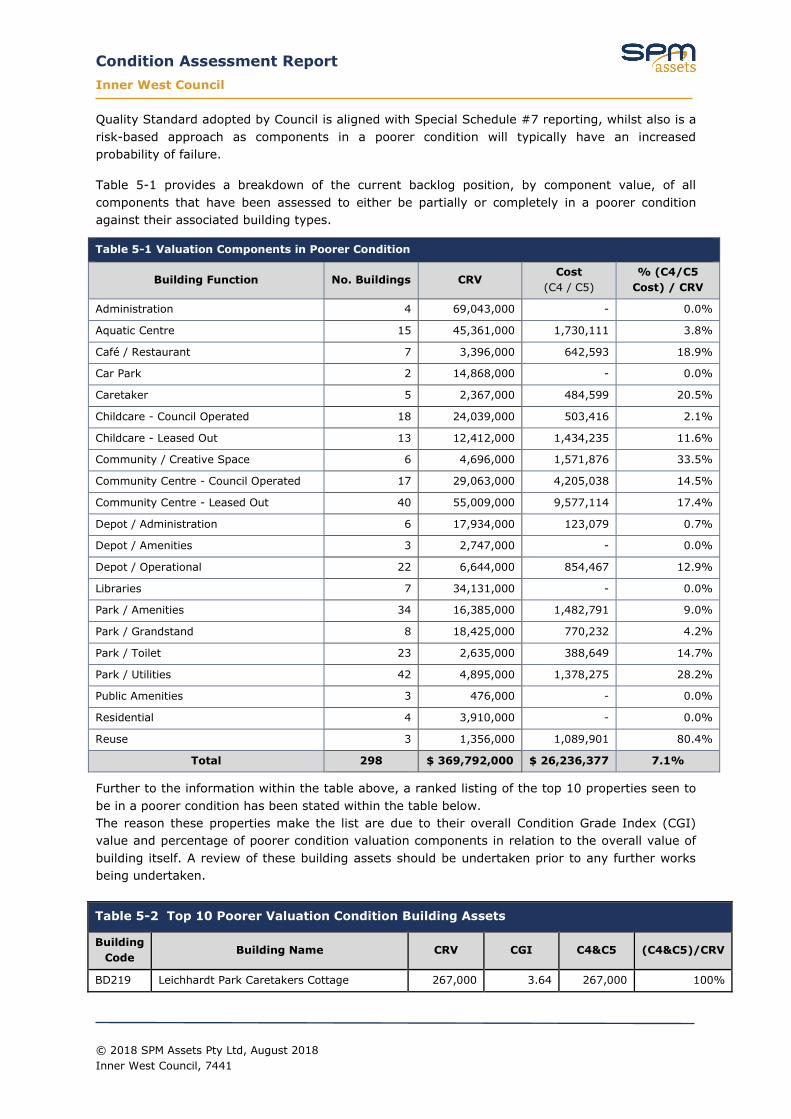
Table 5-1 provides a breakdown of the current backlog position, by component value, of all components that have been assessed to either be partially or completely in a poorer condition against their associated building types.
Table 5-1 Valuation Components in Poorer Condition
Building Function No. Buildings CRV Cost
(C4 / C5) % (C4/C5
Cost) / CRV
Administration 4 69,043,000 - 0.0%
Aquatic Centre 15 45,361,000 1,730,111 3.8%
Café / Restaurant 7 3,396,000 642,593 18.9%
Car Park 2 14,868,000 - 0.0%
Caretaker 5 2,367,000 484,599 20.5%
Childcare - Council Operated 18 24,039,000 503,416 2.1%
Childcare - Leased Out 13 12,412,000 1,434,235 11.6%
Community / Creative Space 6 4,696,000 1,571,876 33.5%
Community Centre - Council Operated 17 29,063,000 4,205,038 14.5%
Community Centre - Leased Out 40 55,009,000 9,577,114 17.4%
Depot / Administration 6 17,934,000 123,079 0.7%
Depot / Amenities 3 2,747,000 - 0.0%
Depot / Operational 22 6,644,000 854,467 12.9%
Libraries 7 34,131,000 - 0.0%
Park / Amenities 34 16,385,000 1,482,791 9.0%
Park / Grandstand 8 18,425,000 770,232 4.2%
Park / Toilet 23 2,635,000 388,649 14.7%
Park / Utilities 42 4,895,000 1,378,275 28.2%
Public Amenities 3 476,000 - 0.0%
Residential 4 3,910,000 - 0.0%
Reuse 3 1,356,000 1,089,901 80.4%
Total 298 $ 369,792,000 $ 26,236,377 7.1%
Further to the information within the table above, a ranked listing of the top 10 properties seen to be in a poorer condition has been stated within the table below. The reason these properties make the list are due to their overall Condition Grade Index (CGI) value and percentage of poorer condition valuation components in relation to the overall value of building itself. A review of these building assets should be undertaken prior to any further works being undertaken.
Table 5-2 Top 10 Poorer Valuation Condition Building Assets
Building Code
Building Name CRV CGI C4&C5 (C4&C5)/CRV
BD219 Leichhardt Park Caretakers Cottage 267,000 3.64 267,000 100%

Condition Assessment Report Inner West Council
© 2018 SPM Assets Pty Ltd, August 2018 Inner West Council, 7441
Table 5-2 Top 10 Poorer Valuation Condition Building Assets
Building Code
Building Name CRV CGI C4&C5 (C4&C5)/CRV
BD002 Residential 290-292 Illawarra RdMarrickville 453,000 3.44 453,000 100%
BD907 Birchgrove Park Pavilion/Referees Room 82,000 3.61 82,000 100%
BD903 Dawn Fraser Baths - Southern Pavilion 906,000 3.14 906,000 100%
BD176 Hoskins Park Toilets 106,000 2.74 106,000 100%
BD061 Balmain West Wharf Kiosk 629,000 3.43 629,000 100%
BD171 Toilet on Hill Male 63,000 2.45 59,843 95%
BD151 Gladstone Park Toilet Block 90,000 2.32 82,762 92%
BD327 Richard Murden Reserve Canteen 47,000 2.62 43,173 92%
BD229 LPAC Staff room 720,000 2.65 655,158 91%
5.1.2 Identified Defects/Issues
As part of the onsite building condition and generalist compliance assessment process, the building surveyors captured the visually-identified defects/issues associated with each building asset. The defects/issues are separately identified from the condition of a component due to rectification works being able to be completed rather than a complete renewal work for the associated component.
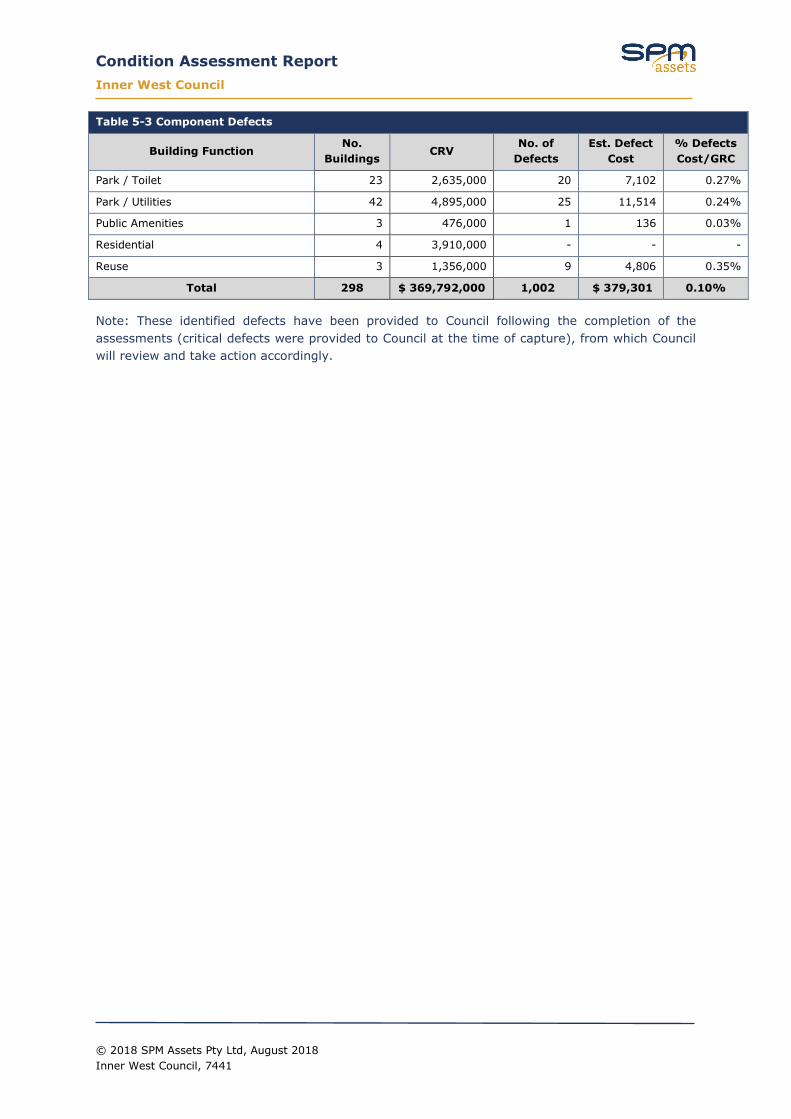
Table 5-3 below provides a breakdown of the visually-identified defects/issues against the associated building type and the component costs for the building assets.
Table 5-3 Component Defects
Building Function No.
Buildings CRV
No. of Defects
Est. Defect Cost
% Defects Cost/GRC
Administration 4 69,043,000 63 23,893 0.03%
Aquatic Centre 15 45,361,000 124 55,930 0.12%
Café / Restaurant 7 3,396,000 4 1,279 0.04%
Car Park 2 14,868,000 10 9,796 0.07%
Caretaker 5 2,367,000 24 4,666 0.20%
Childcare - Council Operated 18 24,039,000 68 24,171 0.10%
Childcare - Leased Out 13 12,412,000 73 32,878 0.26%
Community / Creative Space 6 4,696,000 11 7,578 0.16%
Community Centre - Council Operated 17 29,063,000 54 10,141 0.03%
Community Centre - Leased Out 40 55,009,000 161 56,660 0.10%
Depot / Administration 6 17,934,000 55 17,920 0.10%
Depot / Amenities 3 2,747,000 24 12,611 0.46%
Depot / Operational 22 6,644,000 14 6,529 0.10%
Libraries 7 34,131,000 148 60,235 0.18%
Park / Amenities 34 16,385,000 84 23,554 0.14%
Park / Grandstand 8 18,425,000 30 7,902 0.04%
Condition Assessment Report Inner West Council
© 2018 SPM Assets Pty Ltd, August 2018 Inner West Council, 7441
Table 5-3 Component Defects
Building Function No.
Buildings CRV
No. of Defects
Est. Defect Cost
% Defects Cost/GRC
Park / Toilet 23 2,635,000 20 7,102 0.27%
Park / Utilities 42 4,895,000 25 11,514 0.24%
Public Amenities 3 476,000 1 136 0.03%
Residential 4 3,910,000 - - -
Reuse 3 1,356,000 9 4,806 0.35%
Total 298 $ 369,792,000 1,002 $ 379,301 0.10%
Note: These identified defects have been provided to Council following the completion of the assessments (critical defects were provided to Council at the time of capture), from which Council will review and take action accordingly.

Condition Assessment Report Inner West Council
© 2018 SPM Assets Pty Ltd, August 2018 Final Inner West Council, 7441 Page 19
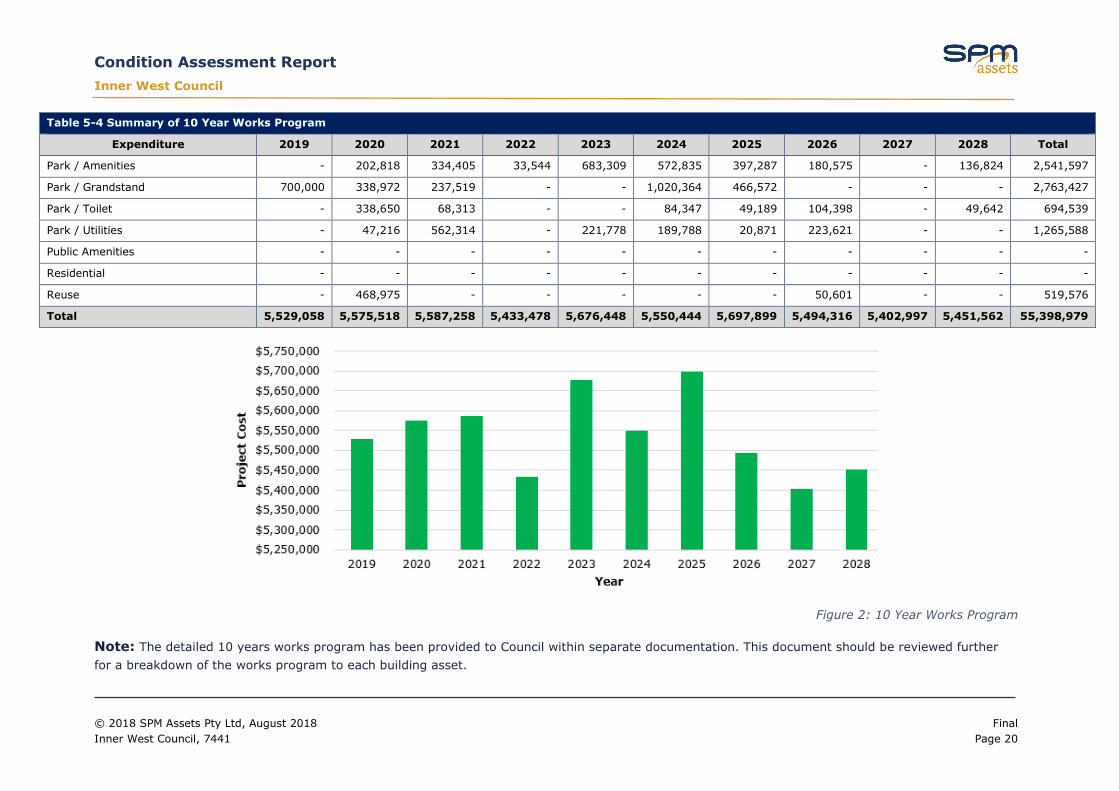
5.2 10 Years Works Program
The 10 Years Works Program has been constructed based around the works required at each building asset based upon the building asset condition assessment process and maintaining the established Quality Standard. Each project within the program involves the grouping of works into a project of work that will be completed at one point in time for each building asset.
Note: Program includes projects already scoped by Council Project management (15%) and contingency (10%) costs has been added to each project Projects include component renewals and addressing PQS shortfalls Defects/issues are not included within project costs
Table 5-4 Summary of 10 Year Works Program
Expenditure 2019 2020 2021 2022 2023 2024 2025 2026 2027 2028 Total
Administration - 59,000 355,000 3,120,782 - 1,862,673 - - 228,461 - 5,625,916
Aquatic Centre - 61,615 - 85,000 - - - 185,563 - 3,171,614 3,503,793
Café / Restaurant - 245,162 199,128 - 88,710 - - - 74,151 - 607,151
Car Park - - - - - - 316,004 - - - 316,004
Caretaker 125,000 68,000 400,000 - - 206,829 - - - 241,469 1,041,299
Childcare - Council Operated 679,043 - 15,592 765,938 796,384 396,252 347,080 422,057 - 1,123,520 4,545,866
Childcare - Leased Out - 61,319 913,423 330,880 389,548 280,422 - 516,930 45,822 172,058 2,710,401
Community / Creative Space 180,000 100,000 55,000 - - 231,669 102,272 - - - 668,941
Community Centre -Council Operated 1,685,015 303,350 200,000 - - 188,451 160,965 - - 91,843 2,629,624
Community Centre - Leased Out 565,000 652,441 260,915 480,430 3,496,719 516,814 2,308,862 1,673,189 1,249,197 400,310 11,603,876
Depot / Administration - - - 570,000 - - 380,865 965,890 1,805,772 - 3,722,527
Depot / Amenities - - - - - - 318,269 228,398 - - 546,668
Depot / Operational - - 325,649 46,905 - - 829,664 943,095 127,011 - 2,272,323
Libraries 1,595,000 2,628,000 1,660,000 - - - - - 1,872,584 64,282 7,819,865
Condition Assessment Report Inner West Council
© 2018 SPM Assets Pty Ltd, August 2018 Final Inner West Council, 7441 Page 20
Table 5-4 Summary of 10 Year Works Program
Expenditure 2019 2020 2021 2022 2023 2024 2025 2026 2027 2028 Total
Park / Amenities - 202,818 334,405 33,544 683,309 572,835 397,287 180,575 - 136,824 2,541,597
Park / Grandstand 700,000 338,972 237,519 - - 1,020,364 466,572 - - - 2,763,427
Park / Toilet - 338,650 68,313 - - 84,347 49,189 104,398 - 49,642 694,539
Park / Utilities - 47,216 562,314 - 221,778 189,788 20,871 223,621 - - 1,265,588
Public Amenities - - - - - - - - - - -
Residential - - - - - - - - - - -
Reuse - 468,975 - - - - - 50,601 - - 519,576
Total 5,529,058 5,575,518 5,587,258 5,433,478 5,676,448 5,550,444 5,697,899 5,494,316 5,402,997 5,451,562 55,398,979
Figure 2: 10 Year Works Program
Note: The detailed 10 years works program has been provided to Council within separate documentation. This document should be reviewed further for a breakdown of the works program to each building asset.

Condition Assessment Report Inner West Council
© 2018 SPM Assets Pty Ltd, August 2018 Inner West Council, 7441
6 RISK MANAGEMENT
The following section on Risk Management solely considers the individual ‘renewable’, ‘replaceable’, and ‘maintainable’ components that were collected through the building asset condition assessments undertaken by SPM Assets. No allowance within this section considers the condition breakdown of the Valuations, as per previous sections of this report.
6.1 Principles
The Standard AS/NZS ISO 31000: 2009 has been referred to in establishing a Risk Matrix as a way to determine risk associated with the building portfolio. Risks can include financial, environmental, social, operational and health and safety considerations. Typical risks relevant to Council’s buildings are:
Asset Management
Environmental Hazards
Financial, Funding Fraud
Customer Services
Contracting Performance
Governance
Human Resources
Information Management
Legislative Compliance
Planning, Strategy, Growth
Project / Programme Management
Public Health & Safety
The following options are available for mitigating risks to reduce the cause, probability or impact of failure:
1. Do nothing – Accept the risk.
2. Management Strategies – Implement enhanced strategies for demand management, contingency planning, quality processes, staff training, data analysis & reporting, reduce the desired Levels of Service, etc.
3. Operational Strategies – Actions to reduce peak demand or stresses on the asset, operator training, documentation of operational procedures, etc.
4. Maintenance Strategies – Modify the maintenance regime to make the asset more reliable or to extend its life.
5. Asset Renewal Strategies – Rehabilitation or replace assets to maintain service levels.
6. Development Strategies – Investment to create a new asset or augment an existing asset.
7. Asset Disposal / Rationalisation – Divestment of assets surplus to needs due to a service being determined as a non-core activity or assets can be reconfigured to better meet needs.
6.2 Risk Identification
Through undertaking the building asset condition and generalist compliance assessments of the 298 pre-selected Council building assets, a number of potential issues have been raised that directly relate to the risks involved around the condition & functionality of the building assets themselves.
Condition Assessment Report Inner West Council
© 2018 SPM Assets Pty Ltd, August 2018 Inner West Council, 7441
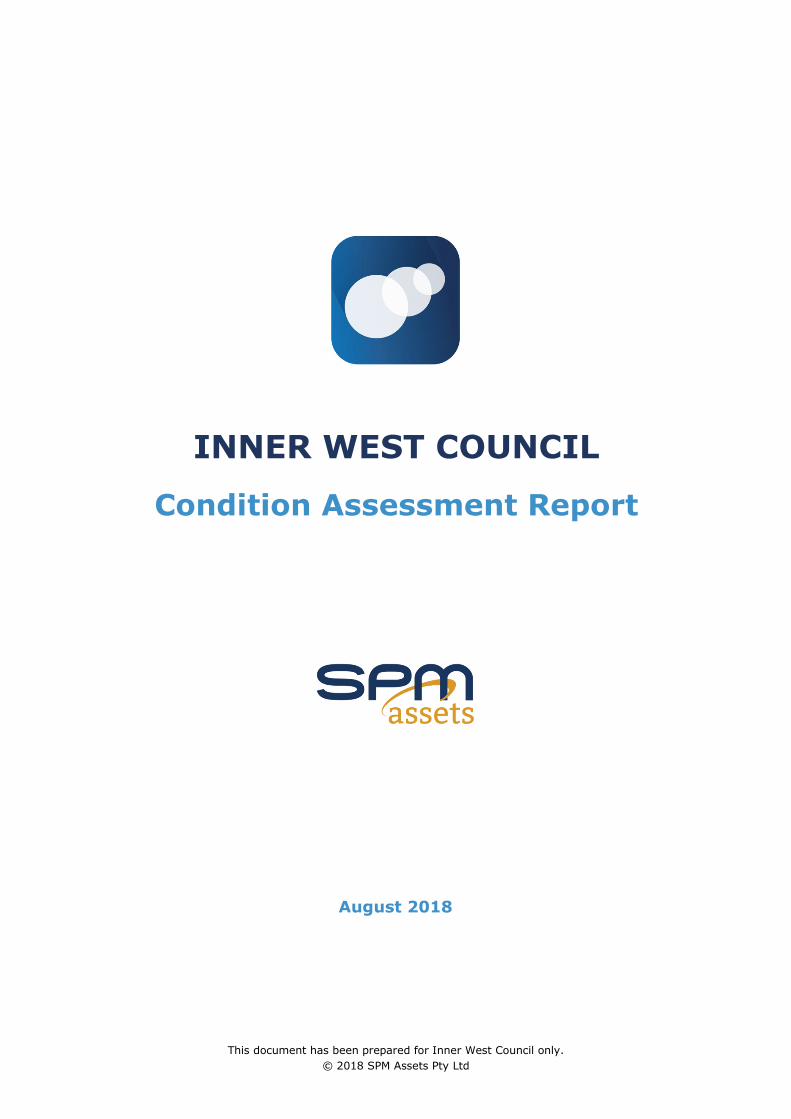
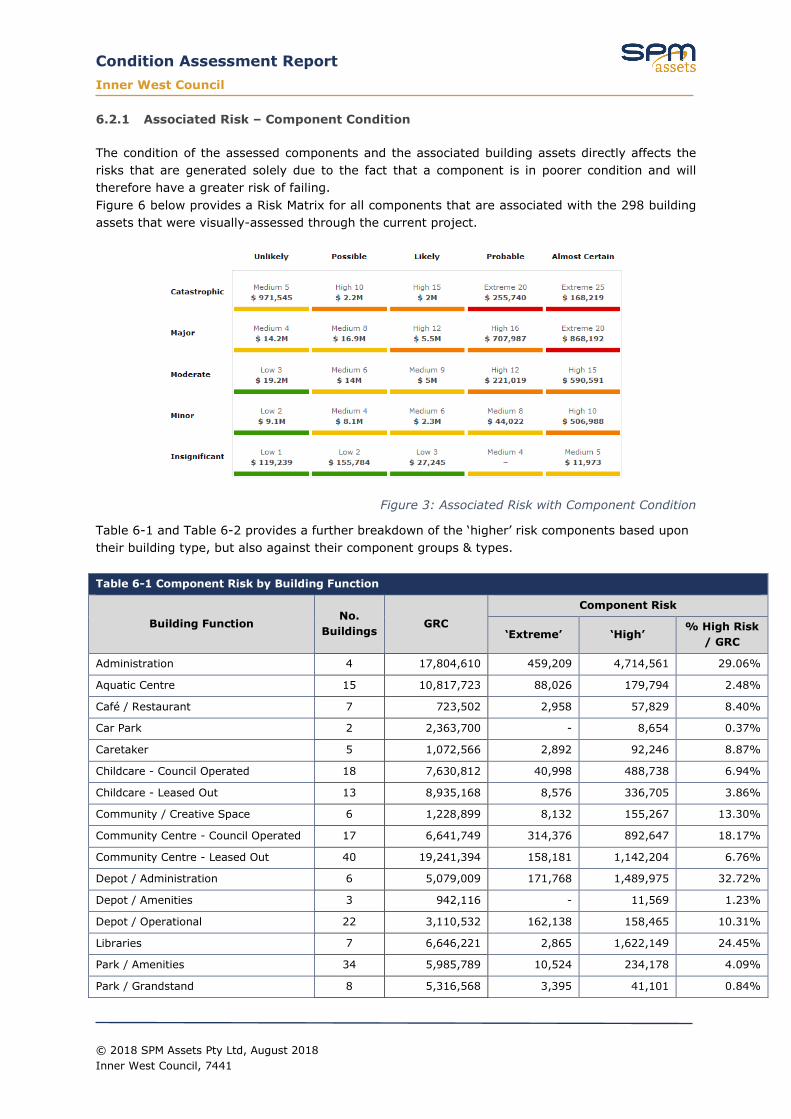
6.2.1 Associated Risk – Component Condition
The condition of the assessed components and the associated building assets directly affects the risks that are generated solely due to the fact that a component is in poorer condition and will therefore have a greater risk of failing. Figure 6 below provides a Risk Matrix for all components that are associated with the 298 building assets that were visually-assessed through the current project.
Figure 3: Associated Risk with Component Condition
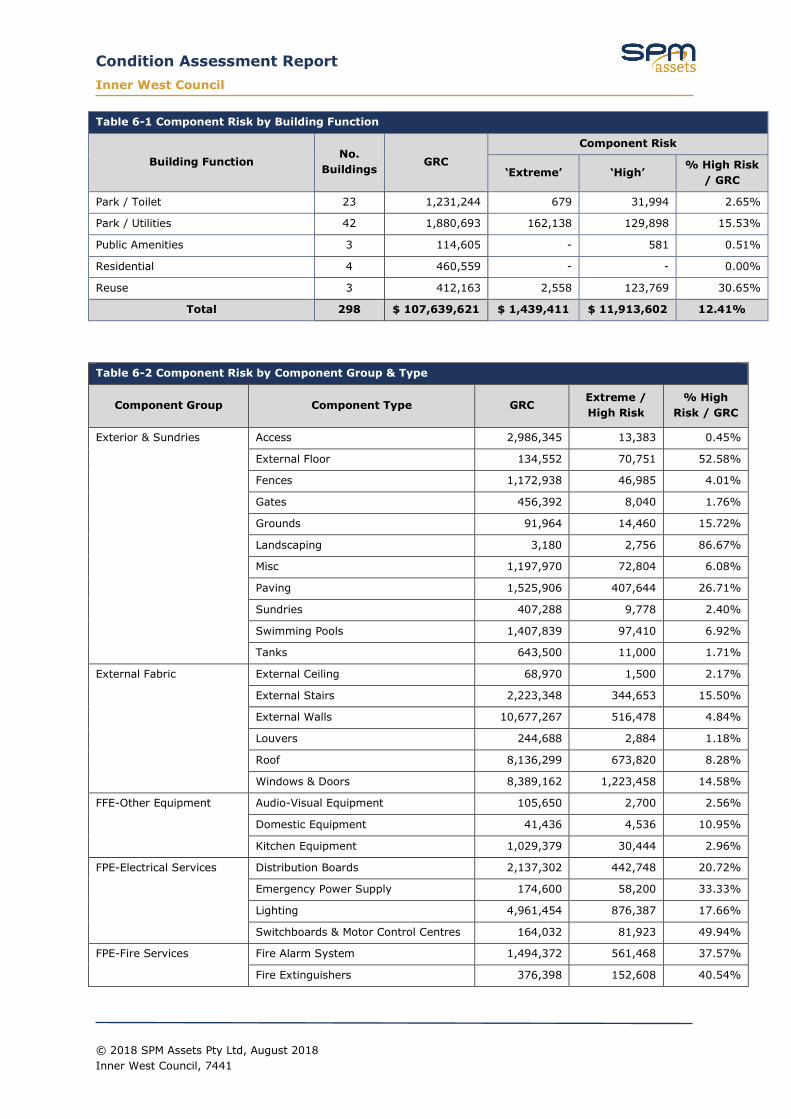
Table 6-1 and Table 6-2 provides a further breakdown of the ‘higher’ risk components based upon their building type, but also against their component groups & types.
Table 6-1 Component Risk by Building Function
Building Function No.
Buildings GRC
Component Risk
‘Extreme’ ‘High’ % High Risk
/ GRC
Administration 4 17,804,610 459,209 4,714,561 29.06%
Aquatic Centre 15 10,817,723 88,026 179,794 2.48%
Café / Restaurant 7 723,502 2,958 57,829 8.40%
Car Park 2 2,363,700 - 8,654 0.37%
Caretaker 5 1,072,566 2,892 92,246 8.87%
Childcare - Council Operated 18 7,630,812 40,998 488,738 6.94%
Childcare - Leased Out 13 8,935,168 8,576 336,705 3.86%
Community / Creative Space 6 1,228,899 8,132 155,267 13.30%
Community Centre - Council Operated 17 6,641,749 314,376 892,647 18.17%
Community Centre - Leased Out 40 19,241,394 158,181 1,142,204 6.76%
Depot / Administration 6 5,079,009 171,768 1,489,975 32.72%
Depot / Amenities 3 942,116 - 11,569 1.23%
Depot / Operational 22 3,110,532 162,138 158,465 10.31%
Libraries 7 6,646,221 2,865 1,622,149 24.45%
Park / Amenities 34 5,985,789 10,524 234,178 4.09%
Park / Grandstand 8 5,316,568 3,395 41,101 0.84%
Condition Assessment Report Inner West Council
© 2018 SPM Assets Pty Ltd, August 2018 Inner West Council, 7441
Table 6-1 Component Risk by Building Function
Building Function No.
Buildings GRC
Component Risk
‘Extreme’ ‘High’ % High Risk
/ GRC
Park / Toilet 23 1,231,244 679 31,994 2.65%
Park / Utilities 42 1,880,693 162,138 129,898 15.53%
Public Amenities 3 114,605 - 581 0.51%
Residential 4 460,559 - - 0.00%
Reuse 3 412,163 2,558 123,769 30.65%
Total 298 $ 107,639,621 $ 1,439,411 $ 11,913,602 12.41%
Table 6-2 Component Risk by Component Group & Type
Component Group Component Type GRC Extreme / High Risk
% High Risk / GRC
Exterior & Sundries Access 2,986,345 13,383 0.45%
External Floor 134,552 70,751 52.58%
Fences 1,172,938 46,985 4.01%
Gates 456,392 8,040 1.76%
Grounds 91,964 14,460 15.72%
Landscaping 3,180 2,756 86.67%
Misc 1,197,970 72,804 6.08%
Paving 1,525,906 407,644 26.71%
Sundries 407,288 9,778 2.40%
Swimming Pools 1,407,839 97,410 6.92%
Tanks 643,500 11,000 1.71%
External Fabric External Ceiling 68,970 1,500 2.17%
External Stairs 2,223,348 344,653 15.50%
External Walls 10,677,267 516,478 4.84%
Louvers 244,688 2,884 1.18%
Roof 8,136,299 673,820 8.28%
Windows & Doors 8,389,162 1,223,458 14.58%
FFE-Other Equipment Audio-Visual Equipment 105,650 2,700 2.56%
Domestic Equipment 41,436 4,536 10.95%
Kitchen Equipment 1,029,379 30,444 2.96%
FPE-Electrical Services Distribution Boards 2,137,302 442,748 20.72%
Emergency Power Supply 174,600 58,200 33.33%
Lighting 4,961,454 876,387 17.66%
Switchboards & Motor Control Centres 164,032 81,923 49.94%
FPE-Fire Services Fire Alarm System 1,494,372 561,468 37.57%
Fire Extinguishers 376,398 152,608 40.54%

Condition Assessment Report Inner West Council
© 2018 SPM Assets Pty Ltd, August 2018 Inner West Council, 7441
Table 6-2 Component Risk by Component Group & Type
Component Group Component Type GRC Extreme / High Risk
% High Risk / GRC
Fire Sprinkler System 74,235 26,817 36.12%
Hydrant System 247,382 41,980 16.97%
FPE-Gas Services Gas Distribution 33,515 2,880 8.59%
FPE-Lift/Hoist Lifts 4,387,872 2,516,681 57.36%
FPE-Mechanical Services Air Conditioning 2,284,920 446,026 19.52%
Air Conditioning Equipment 7,579 1,378 18.18%
Air Distribution 458,463 65,862 14.37%
Air Handling Units 315,641 101,789 32.25%
Building Management System 61,160 31,200 51.01%
Chilled Water System 191,000 96,000 50.26%
Compressed Air/Pneumatics 36,593 20,683 56.52%
Condenser Water System 108,150 62,400 57.70%
Fan Coil Units 64,800 64,800 100.00%
Fans 318,957 75,239 23.59%
Heating System 697,839 245,310 35.15%
Pumps 179,422 31,464 17.54%
Refrigeration 136,800 45,600 33.33%
Ventilation and Exhaust 148,425 16,800 11.32%
FPE-Security Services Security 950,812 98,624 10.37%
FPE-Water Services Sanitary Plumbing 3,778,121 75,905 2.01%
Interior Finishes Ceiling Finishes 5,408,401 473,621 8.76%
Fixtures & Fittings 6,879,459 353,749 5.14%
Floor Finishes 6,963,494 1,393,140 20.01%
Interior Doors 3,337,541 209,231 6.27%
Interior Walls 2,092,789 386,776 18.48%
Internal Stairs 208,322 54,848 26.33%
Wall Finishes 8,698,043 575,059 6.61%
Reserves Park Furniture 272,565 52,920 19.42%
Park Infrastructure 9,800 1,120 11.43%
Play Equipment 149,344 48,542 32.50%
Structures 96,750 7,750 8.01%
Grand Total $ 98,850,425 $ 13,353,012 13.51%
6.3 Associated Risk – Property Quality Standards
The Property Quality Standards (PQS) assessments that were undertaken across the 282 building assets have been used to highlight potential deficiencies/shortfalls that are associated with each building asset. The PQS statements have also been used as a means to identify areas in which the Level of Service (LoS) of an asset is limited, from which improve works can be scoped.
Condition Assessment Report Inner West Council
© 2018 SPM Assets Pty Ltd, August 2018 Inner West Council, 7441
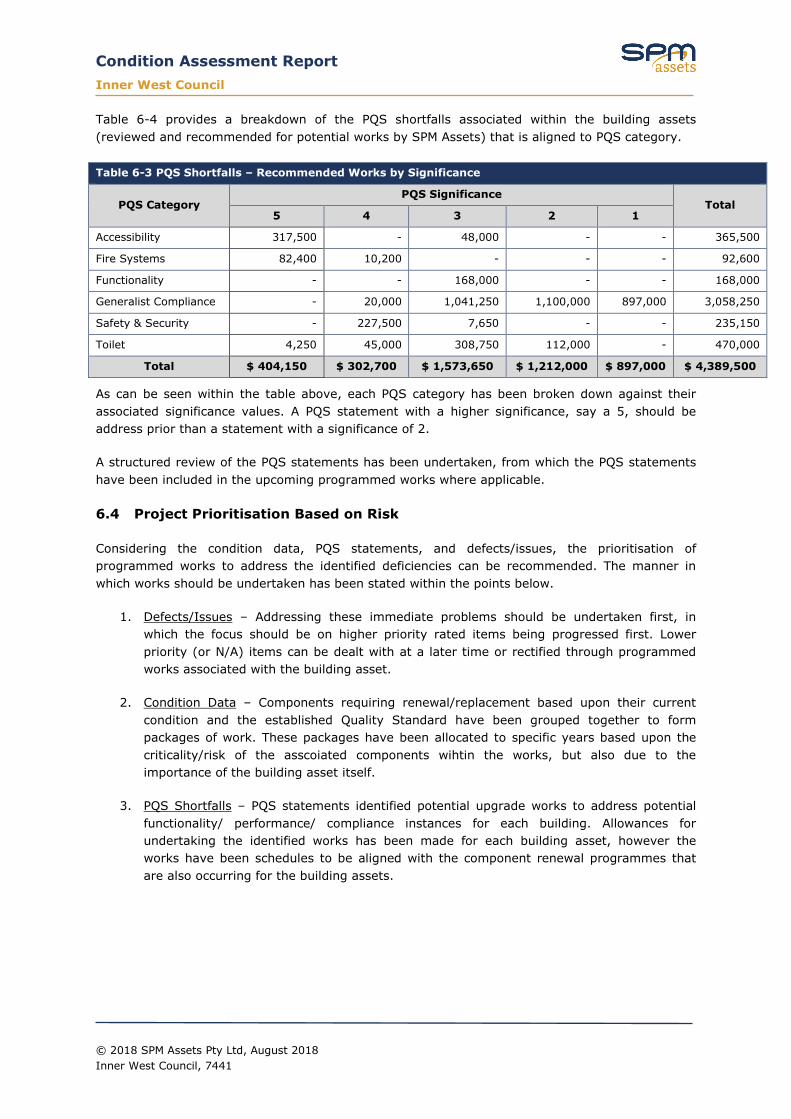
Table 6-4 provides a breakdown of the PQS shortfalls associated within the building assets (reviewed and recommended for potential works by SPM Assets) that is aligned to PQS category.
Table 6-3 PQS Shortfalls – Recommended Works by Significance
PQS Category PQS Significance
Total 5 4 3 2 1
Accessibility 317,500 - 48,000 - - 365,500
Fire Systems 82,400 10,200 - - - 92,600
Functionality - - 168,000 - - 168,000
Generalist Compliance - 20,000 1,041,250 1,100,000 897,000 3,058,250
Safety & Security - 227,500 7,650 - - 235,150
Toilet 4,250 45,000 308,750 112,000 - 470,000
Total $ 404,150 $ 302,700 $ 1,573,650 $ 1,212,000 $ 897,000 $ 4,389,500
As can be seen within the table above, each PQS category has been broken down against their associated significance values. A PQS statement with a higher significance, say a 5, should be address prior than a statement with a significance of 2.
A structured review of the PQS statements has been undertaken, from which the PQS statements have been included in the upcoming programmed works where applicable.
6.4 Project Prioritisation Based on Risk
Considering the condition data, PQS statements, and defects/issues, the prioritisation of programmed works to address the identified deficiencies can be recommended. The manner in which works should be undertaken has been stated within the points below.
1. Defects/Issues – Addressing these immediate problems should be undertaken first, in which the focus should be on higher priority rated items being progressed first. Lower priority (or N/A) items can be dealt with at a later time or rectified through programmed works associated with the building asset.
2. Condition Data – Components requiring renewal/replacement based upon their current condition and the established Quality Standard have been grouped together to form packages of work. These packages have been allocated to specific years based upon the criticality/risk of the asscoiated components wihtin the works, but also due to the importance of the building asset itself.
3. PQS Shortfalls – PQS statements identified potential upgrade works to address potential functionality/ performance/ compliance instances for each building. Allowances for undertaking the identified works has been made for each building asset, however the works have been schedules to be aligned with the component renewal programmes that are also occurring for the building assets.
Condition Assessment Report Inner West Council
© 2018 SPM Assets Pty Ltd, August 2018 Inner West Council, 7441
Report Prepared by
Marcus Xavier SPM Assets
Report Reviewed by
Sri Gullapalli SPM Assets
Details
Revision Revision Date Details Authorised
Name Position