Embed Size (px)
Citation preview
1
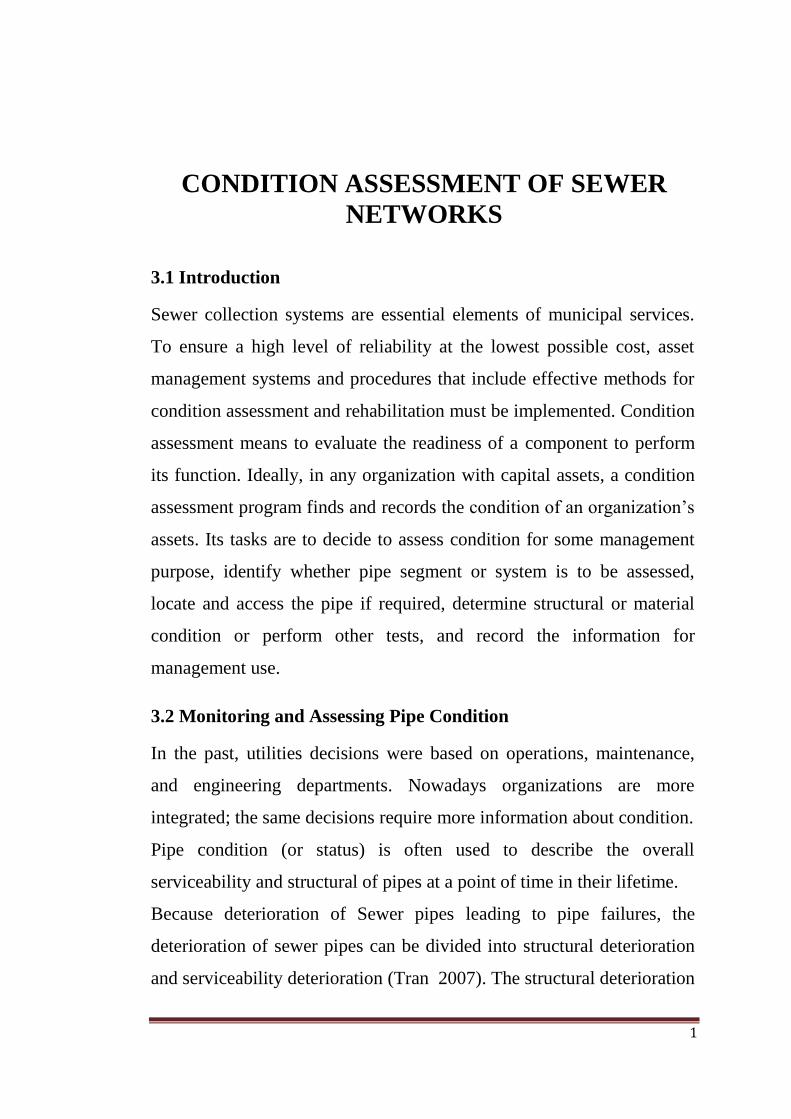
CONDITION ASSESSMENT OF SEWER
NETWORKS
3.1 Introduction
Sewer collection systems are essential elements of municipal services.
To ensure a high level of reliability at the lowest possible cost, asset
management systems and procedures that include effective methods for
condition assessment and rehabilitation must be implemented. Condition
assessment means to evaluate the readiness of a component to perform
its function. Ideally, in any organization with capital assets, a condition
assessment program finds and records the condition of an organization’s
assets. Its tasks are to decide to assess condition for some management
purpose, identify whether pipe segment or system is to be assessed,
locate and access the pipe if required, determine structural or material
condition or perform other tests, and record the information for
management use.
3.2 Monitoring and Assessing Pipe Condition
In the past, utilities decisions were based on operations, maintenance,
and engineering departments. Nowadays organizations are more
integrated; the same decisions require more information about condition.
Pipe condition (or status) is often used to describe the overall
serviceability and structural of pipes at a point of time in their lifetime.
Because deterioration of Sewer pipes leading to pipe failures, the
deterioration of sewer pipes can be divided into structural deterioration
and serviceability deterioration (Tran 2007). The structural deterioration
2
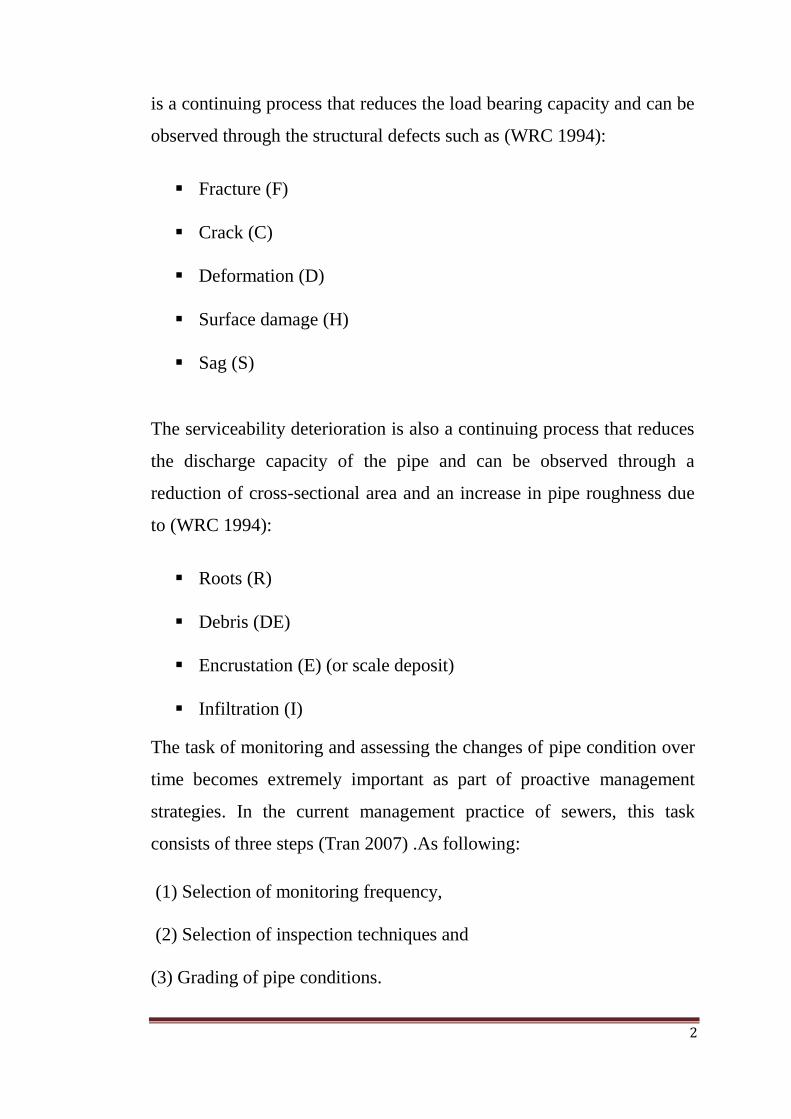
is a continuing process that reduces the load bearing capacity and can be
observed through the structural defects such as (WRC 1994):
Fracture (F)
Crack (C)
Deformation (D)
Surface damage (H)
Sag (S)
The serviceability deterioration is also a continuing process that reduces
the discharge capacity of the pipe and can be observed through a
reduction of cross-sectional area and an increase in pipe roughness due
to (WRC 1994):
Roots (R)
Debris (DE)
Encrustation (E) (or scale deposit)
Infiltration (I)
The task of monitoring and assessing the changes of pipe condition over
time becomes extremely important as part of proactive management
strategies. In the current management practice of sewers, this task
consists of three steps (Tran 2007) .As following:
(1) Selection of monitoring frequency,
(2) Selection of inspection techniques and
(3) Grading of pipe conditions.
3
3.2.1 Monitoring frequency: regular versus snapshot
Bridges and pavements are subjected to a regular (or repeated)
inspection program to identify structural defects during their lifetime. In
particular, every bridge is legally required to be inspected once every
two years (Madanat et al. 1995).Unfortunately, sewers pipes were not
subjected to such regular inspection programs. Instead, their inspection
programs were of snapshot type, that is, a sample of pipes was inspected
for only once (Kathula 2001).
3.2.2 Inspection Techniques: CCTV versus others
Inspection techniques can be grouped into three levels of assessment
according to the capability of the inspection techniques and the required
information by asset managers (Ratliff 2003). The three levels are:
Field reconnaissance (level 1),
Internal inspection (level 2) and
External inspection (level 3).
Field reconnaissance (level 1) aims to collect data of manholes, pits
and pipelines and assesses the structure of manholes for accessibility of
inspection equipment and even inspectors (Tran 2007). Some of
available inspection techniques for this level are:
• Manhole survey
• Global positioning system (GPS)
This basic step often associates with reviewing as-built drawings and
existing information in order to form the backbone of any management
database. This task continues throughout service lifetime of the pipe
systems whenever new information such as pipe replacement or repair
occurs.
4
Internal inspection (level 2) focuses on assessing the internal condition
of pipes so that appropriate action can be taken for pipes in poor
condition before the pipe collapse or occurrence of complete blockage of
pipe (Tran 2007). Some of available inspection techniques for this level
are:
• Man-walk through
• Close circuit television (CCTV)
• Sonar (or ultrasonic)
• Focused electrode leak location (FELL)
• Sewer scanner and evaluation technology (SSET)
• Laser-based scanning system
• Multi-sensor pipeline inspection system
External inspection (level 3) concerns with the soil structure that
supports pipes. Any voids or loss of soil support is potentially leading to
pipe collapse (Ratliff 2003).Some of available inspection techniques for
this level are:
• Infrared thermographs
• Ground penetrating radar
• Micro deflection
• Impact echo wave impedance probe (WIP)
Although as described above, there are several inspection techniques
available for each level of assessment, there are no guidelines for
5
selecting these techniques for a particular application. In order to reduce
time and effort in selecting the appropriate inspection technique, a
number of researchers have provided comprehensive reviews of
inspection techniques that were applied in many infrastructure facilities.
Examples can be found in Wirahadikusumah et al. (1998), Morrison and
Thomson (2003).
In current management practice of sewers pipes, the GPS locator and the
CCTV inspection were still the most used techniques for locating
pipelines (i.e. level 1) and assessing internal condition of pipes (i.e. level
2) (Wirahadikusumah et al. 2001; Morrison and Thomson 2003; Baik et
al. 2006). With hundreds of kilometers of pipelines, inspection costs
become a critical factor for asset managers’ decisions, not to mention
productivity.
3.2.3 Grading of pipe condition
The Water Research Center (WRC) in UK devised the world first
condition grading scheme that provided protocols and guidelines for
assessing current condition of individual pipes using the CCTV
inspection technique (WRC 1983). Based on the original scheme of
WRC (1983), several condition grading schemes were later developed in
Canada (McDonald and Zhao 2001) and Australia (WSAA 2002).
Although the structural and serviceability deterioration of pipes are a
continuous process (as explained in Section 3.2), ordinal grading
systems were used in these schemes for mapping the pipe deterioration
into pipe conditions at the time of inspection. For example: The Sewer
Inspection Reporting Code (SIRC) by the Water Service Association of
Australia (WSAA 2002) was developed for assessing conditions of rigid
6
sewers (concrete and vitrified clay pipes) using CCTV inspection data as
shown in Table 3.1.
Table 3.1: Description of condition states used in WSAA (2006)
Condition
Grading
Structural condition Serviceability Condition
1 Insignificant deterioration
of the sewer has occurred.
Appears to be in good
condition
No or insignificant loss of
hydraulic performance has
occurred. Appears to be in
good condition
2 Minor deterioration of the
sewer has occurred.
Minor defects are present
causing minor loss of
hydraulic performance
3 Moderate deterioration has
occurred but defects do not
affect short term structural
integrity
Developed defects are
present causing moderate
loss of hydraulic
performance
4 Serious deterioration of the
sewer has occurred and
affected structural integrity
Significant defects are
present causing serious loss
of hydraulic performance
5 Failure of the sewer has
occurred or is imminent
Failure of the sewer has
occurred or is imminent
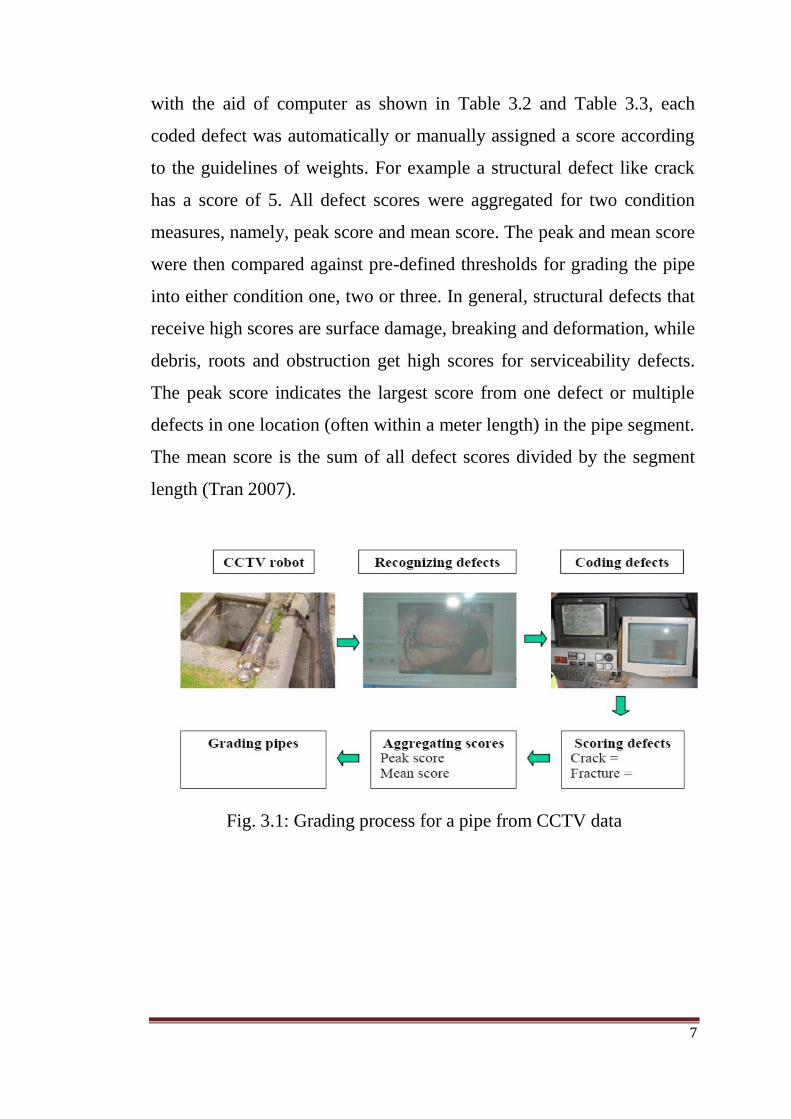
Figure 3.1 shows the grading process based on the SIRC for a pipe
segment from CCTV data. A pipe segment is defined between two
manholes or pits. As shown in this figure, the CCTV robot was sent to
the pipe of interest. During its movement along the pipe, the CCTV-
recoded images were sent to a monitor where the operator can recognize
any structural or serviceability defects. He or she then coded the defects
7
with the aid of computer as shown in Table 3.2 and Table 3.3, each
coded defect was automatically or manually assigned a score according
to the guidelines of weights. For example a structural defect like crack
has a score of 5. All defect scores were aggregated for two condition
measures, namely, peak score and mean score. The peak and mean score
were then compared against pre-defined thresholds for grading the pipe
into either condition one, two or three. In general, structural defects that
receive high scores are surface damage, breaking and deformation, while
debris, roots and obstruction get high scores for serviceability defects.
The peak score indicates the largest score from one defect or multiple
defects in one location (often within a meter length) in the pipe segment.
The mean score is the sum of all defect scores divided by the segment
length (Tran 2007).
Fig. 3.1: Grading process for a pipe from CCTV data
8
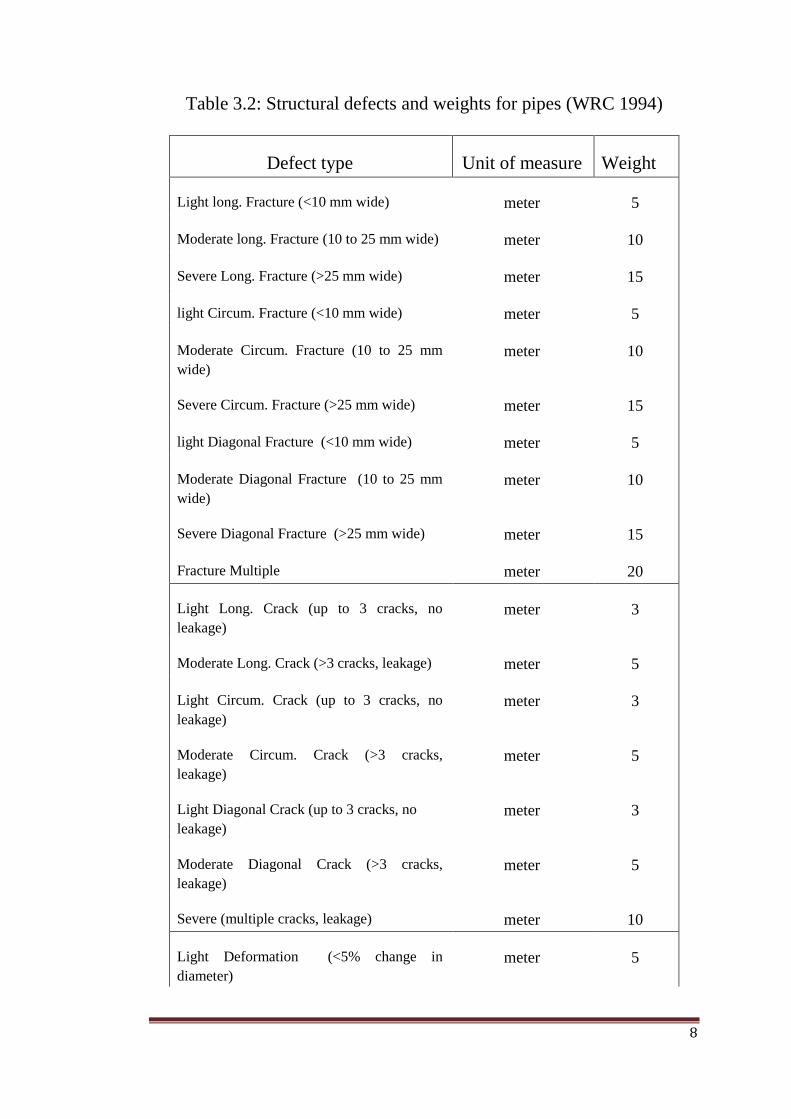
Table 3.2: Structural defects and weights for pipes (WRC 1994)
Defect type Unit of measure Weight
Light long. Fracture (<10 mm wide) meter 5
Moderate long. Fracture (10 to 25 mm wide) meter 10
Severe Long. Fracture (>25 mm wide) meter 15
light Circum. Fracture (<10 mm wide) meter 5
Moderate Circum. Fracture (10 to 25 mm
wide)
meter 10
Severe Circum. Fracture (>25 mm wide) meter 15
light Diagonal Fracture (<10 mm wide) meter 5
Moderate Diagonal Fracture (10 to 25 mm
wide)
meter 10
Severe Diagonal Fracture (>25 mm wide) meter 15
Fracture Multiple meter 20
Light Long. Crack (up to 3 cracks, no
leakage)
meter 3
Moderate Long. Crack (>3 cracks, leakage) meter 5
Light Circum. Crack (up to 3 cracks, no
leakage)
meter 3
Moderate Circum. Crack (>3 cracks,
leakage)
meter 5
Light Diagonal Crack (up to 3 cracks, no
leakage)
meter 3
Moderate Diagonal Crack (>3 cracks,
leakage)
meter 5
Severe (multiple cracks, leakage) meter 10
Light Deformation (<5% change in
diameter)
meter 5
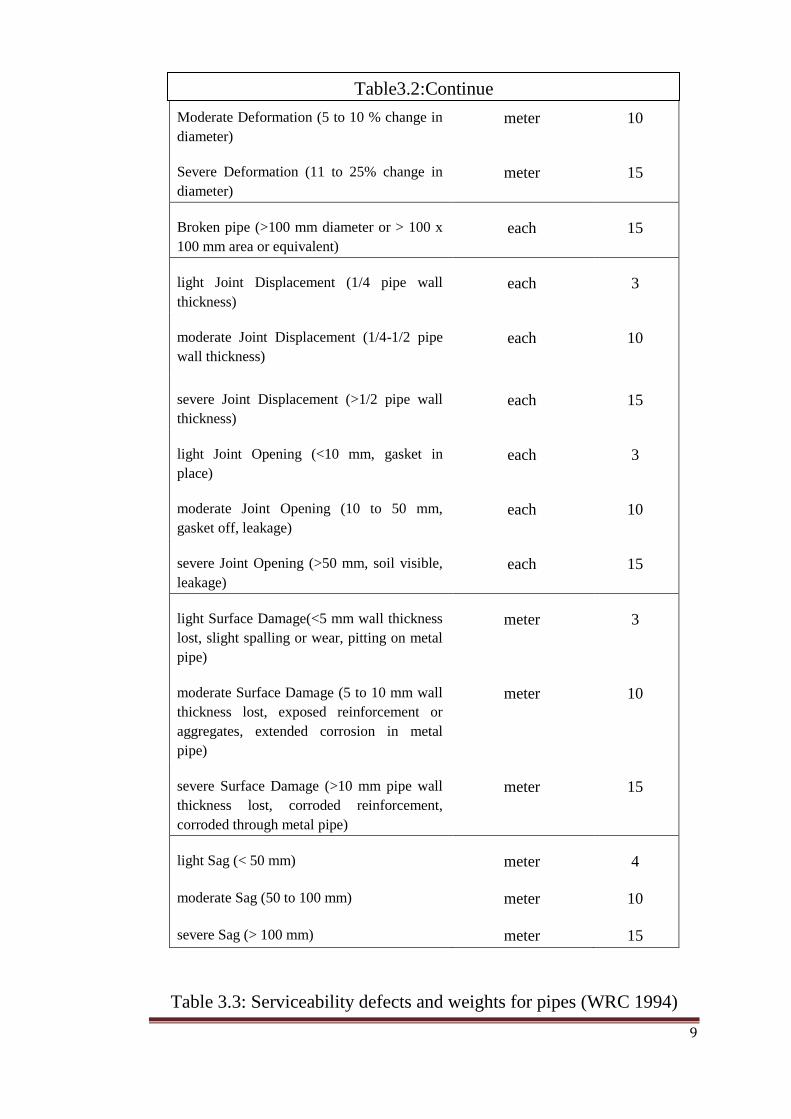
9
Moderate Deformation (5 to 10 % change in
diameter)
meter 10
Severe Deformation (11 to 25% change in
diameter)
meter 15
Broken pipe (>100 mm diameter or > 100 x
100 mm area or equivalent)
each 15
light Joint Displacement (1/4 pipe wall
thickness)
each 3
moderate Joint Displacement (1/4-1/2 pipe
wall thickness)
each 10
severe Joint Displacement (>1/2 pipe wall
thickness)
each 15
light Joint Opening (<10 mm, gasket in
place)
each 3
moderate Joint Opening (10 to 50 mm,
gasket off, leakage)
each 10
severe Joint Opening (>50 mm, soil visible,
leakage)
each 15
light Surface Damage(<5 mm wall thickness
lost, slight spalling or wear, pitting on metal
pipe)
meter 3
moderate Surface Damage (5 to 10 mm wall
thickness lost, exposed reinforcement or
aggregates, extended corrosion in metal
pipe)
meter 10
severe Surface Damage (>10 mm pipe wall
thickness lost, corroded reinforcement,
corroded through metal pipe)
meter 15
light Sag (< 50 mm) meter 4
moderate Sag (50 to 100 mm) meter 10
severe Sag (> 100 mm) meter 15
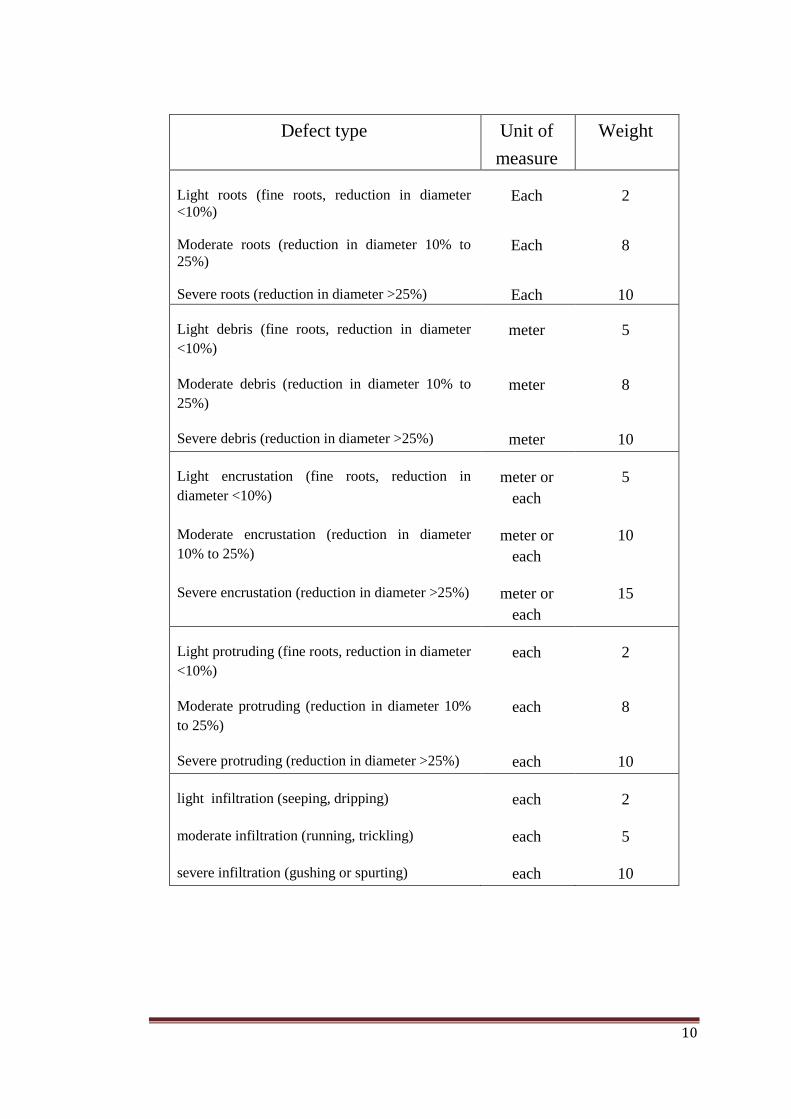
Table 3.3: Serviceability defects and weights for pipes (WRC 1994)
Table3.2:Continue
10
Defect type Unit of
measure
Weight
Light roots (fine roots, reduction in diameter
<10%) Each 2
Moderate roots (reduction in diameter 10% to
25%) Each 8
Severe roots (reduction in diameter >25%) Each 10
Light debris (fine roots, reduction in diameter
<10%)
meter 5
Moderate debris (reduction in diameter 10% to
25%)
meter 8
Severe debris (reduction in diameter >25%) meter 10
Light encrustation (fine roots, reduction in
diameter <10%)
meter or
each
5
Moderate encrustation (reduction in diameter
10% to 25%)
meter or
each
10
Severe encrustation (reduction in diameter >25%) meter or
each
15
Light protruding (fine roots, reduction in diameter
<10%)
each 2
Moderate protruding (reduction in diameter 10%
to 25%)
each 8
Severe protruding (reduction in diameter >25%) each 10
light infiltration (seeping, dripping) each 2
moderate infiltration (running, trickling) each 5
severe infiltration (gushing or spurting) each 10
11
We notes that values recorded in Table 3.2 and Table 3.3 are suitable for
WRC. However an extensive research is necessary to adjust these values
for sewer utilities in Egypt.
3.2.4Physical Condition of sewer pipe
While inspection is a process of information gathering, condition
assessment can be regarded as a process of data analysis and decision-
making based on the information gathered. The physical condition is
first step in worldwide sewer rehabilitation industry as shown in Table
3.5. It depends on structural and serviceability rates by peak scores as
shown in Tables 3.4 and 3.5 based on the worst defect (ASCE 1994).
Table 3.4: Physical Condition and recommended action (WRC 1994)
Physical condition Implication Rehabilitation priority
5 Failed or failure
imminent
Immediate
4 poor condition
Immediate
3 Good condition
Medium
2 Very Good condition Low
1-0 Excellent condition Not required
Table 3.5: Structural condition rating for sewer pipes (assessment length
= 1 m) (ASCE 1994)
Peak score range Structural condition rating, Rstr
0 0
1-4 1
5-9 2
10-14 3
15-19 4
20 5
12
Table 3.6: Serviceability condition rating for sewer pipes (assessment
length = 1 m) (ASCE 1994)
Peak score range Serviceability condition rating. Rser
0 0
1-2 1
3-4 2
5-6 3
7-8 4
9-10 5
(Chughtai and Zayed 2008) expressed the physical grade of the sewer
pipeline by combining the effects of structural and serviceability rates as
shown:
Pipe Condition Grade (Physical Condition) =
0.541+0.273 (Structural Condition Rate)2 +0.37(Operational Condition
Rate)2
(3.1)
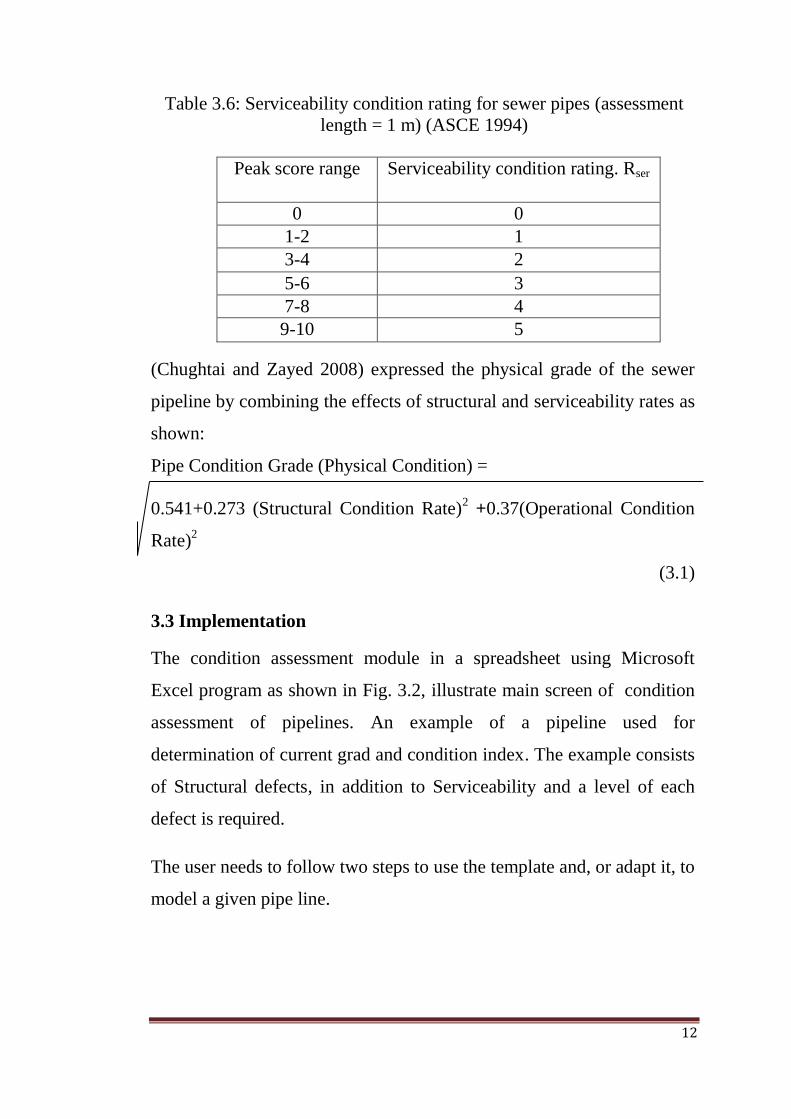
3.3 Implementation
The condition assessment module in a spreadsheet using Microsoft
Excel program as shown in Fig. 3.2, illustrate main screen of condition
assessment of pipelines. An example of a pipeline used for
determination of current grad and condition index. The example consists
of Structural defects, in addition to Serviceability and a level of each
defect is required.
The user needs to follow two steps to use the template and, or adapt it, to
model a given pipe line.
13
Fig. 3.2: Main screen of condition assessment of sewer pipelines
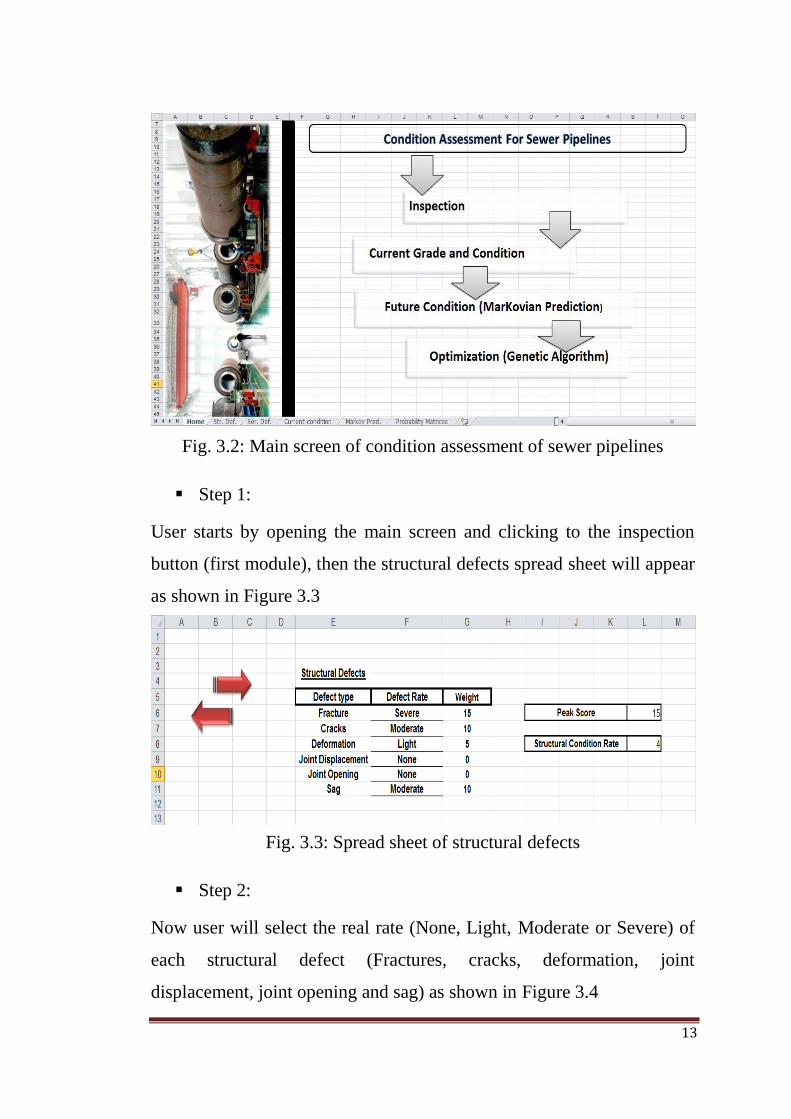
Step 1:
User starts by opening the main screen and clicking to the inspection
button (first module), then the structural defects spread sheet will appear
as shown in Figure 3.3
Fig. 3.3: Spread sheet of structural defects
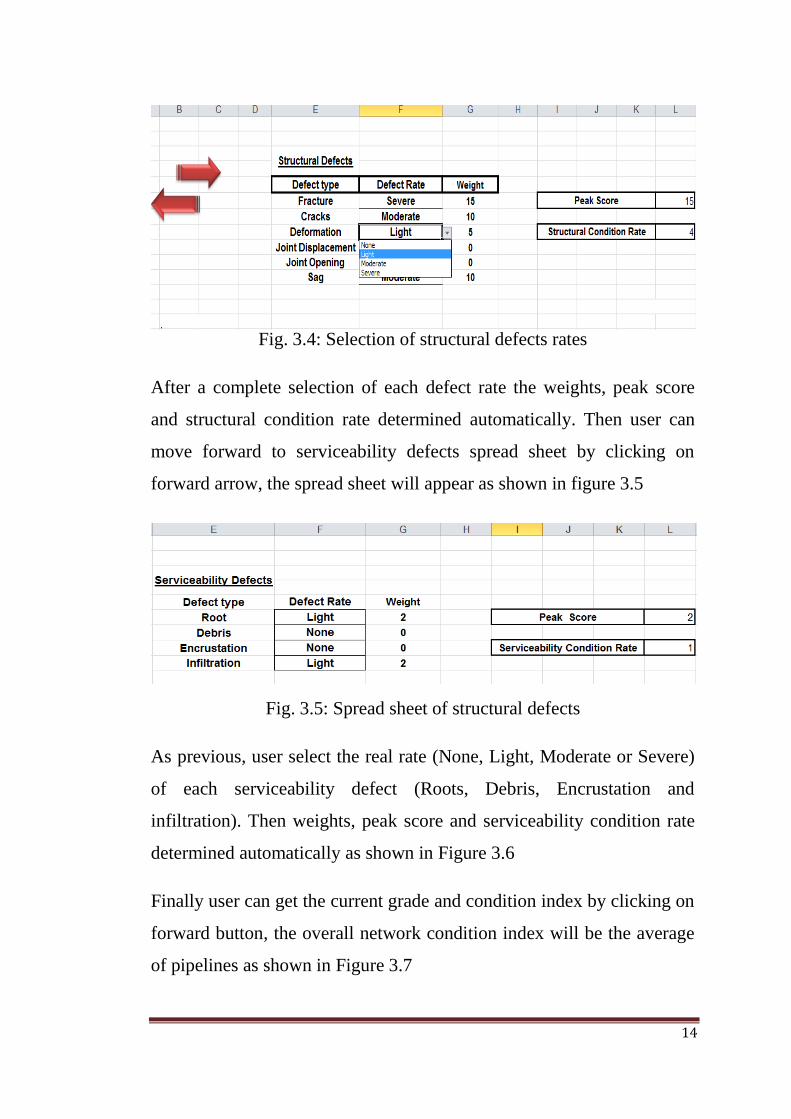
Step 2:
Now user will select the real rate (None, Light, Moderate or Severe) of
each structural defect (Fractures, cracks, deformation, joint
displacement, joint opening and sag) as shown in Figure 3.4
14
Fig. 3.4: Selection of structural defects rates
After a complete selection of each defect rate the weights, peak score
and structural condition rate determined automatically. Then user can
move forward to serviceability defects spread sheet by clicking on
forward arrow, the spread sheet will appear as shown in figure 3.5
Fig. 3.5: Spread sheet of structural defects
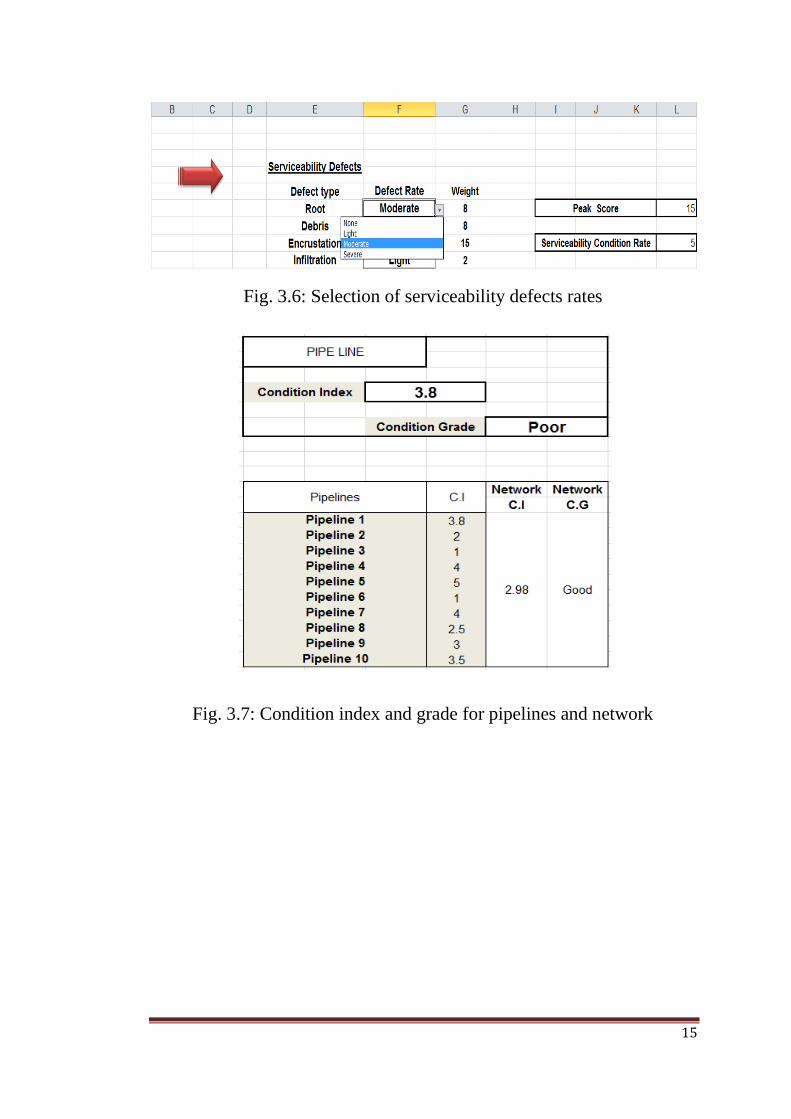
As previous, user select the real rate (None, Light, Moderate or Severe)
of each serviceability defect (Roots, Debris, Encrustation and
infiltration). Then weights, peak score and serviceability condition rate
determined automatically as shown in Figure 3.6
Finally user can get the current grade and condition index by clicking on
forward button, the overall network condition index will be the average
of pipelines as shown in Figure 3.7
15
Fig. 3.6: Selection of serviceability defects rates
Fig. 3.7: Condition index and grade for pipelines and network
REFRENCES
1. ASCE, (1994), Existing Sewer Evaluation and Rehabilitation,
ASCE Manuals and Reports on Engineering Practice No. 62.
American Society of Civil Engineers.
2. Baik, H. S., Jeong, H. S. & Abraham, D. M., (2006), "Estimating
Transition Probabilities in Markov Chain-Based Deterioration
Models for Management of Wastewater Systems", Journal of
Water Resources Planning and Management, ASCE, Vol. 132,
No. 1, pp. 15-24.
3. Chughtai, F., and Zayed, T. (2008). “Infrastructure condition
prediction models for sustainable sewer pipelines.”Journal of
Performance of Constructed Facilities, Vol. 17, No. 3, pp.130-135.
4. Kathula, V. S., (2001), Structural Distress Condition Modeling for
Sanitary Sewers, PhD Thesis, Civil of Engineering, Louisiana
Tech University, pp.293.
5. McDonald, S. E. & Zhao, J. Q., (2001), "Condition Assessment
and Rehabilitation of Large Sewers", International Conference on
Undreground Infrastructure Research, Waterloo, Canada, pp.361-
369.
6. Morrison, R. S. & Thomson, J. C., (2003), "Innovative Inspection
Methodologies for Wastewater Systems", Pipelines 2003, ASCE,
pp.176-182.
7. Ratliff, A., (2003), "An Overview of Current and Developing
Technologies for Pipe Condition Assessment", Pipelines 2003,
ASCE, pp.16-22.
8. Tran, D., H., (2007), "Investigation of Deterioration Models for
Sewer Pipe systems", PhD. Thesis, Victoria University.
9. Wirahadikusumah, R., Abraham, D., and Iseley, T. (2001).
“Challenging issues in modeling deterioration of combined
sewers.” Journal of Infrastructure Systems, Vol. 7, No. 2, pp. 77-
84.
10. Wirahadikusumah, R., Abraham, M. D., Iseley, T. &Prasanth, R.
K., (1998), "Assessment Technologies for Sewer System
Rehabilitation", Automation in Construction, Vol. 7, pp. 259-270.
11. WRC, (1983), Sewerage Rehabilitation Manual, Water Research
Center, UK, London.
12. WRC. (1994) Sewerage Rehabilitation Manual, Second Edition,
Water Research Centre, U.K.
13. WSAA, (2002), Sewer Inspection Reporting Code of Australia,
Water Service Association of Australia (WSAA), Melbourne.
14. WSAA, (2006), Conduit Inspection Reporting Code of Australia,
Water Service Association of Australia (WSAA), Melbourne.