Embed Size (px)
Citation preview

21‐22 April 2015Hotel Okura, Amsterdam© 2015 Crain Communications Inc. All rights reserved.
Concurrent Session: Leadership and ExecutionBuilding the SOW Business Case Facilitator: Kirsten Hastings, Associate Editor,
Staffing Industry Analysts Speaker: Tom Mason, SVP EMEA, Pontoon
WEDNESDAY 13:30‐14:30 OTTER/ESPERANCE
Sponsored by:
21‐22 April 2015Hotel Okura, Amsterdam© 2015 Crain Communications Inc. All rights reserved.
Rate this session by accessing the evaluation from your Conference Mobile Community OR tap the iPad screen as you exit.
DIGITAL SURVEYS
Don’t forget to provide feedback
Building the SOW Business Case

April 2015Statement of Work Solutions

• | SOW

• | SOWCapabilities and Experience
SOW PROGRAM COVERAGE |
• Current Run Rate: $1.8B Spend
• Annual Volumes: 50K SOWs
• 106K Workers

• | SOWDefined
Financial rewards or penalties tied to milestone, project success and Service Level Agreements
Deliverables governed by SOW contract with billing tied to performance completion,
often fixed or event based invoicing –Time and Material (T&M) can also be used
but more difficult to hold to deliverables based work
SOW Supplier provides project/resource direction and owns delivery risk
Purchasing a delivered service by engaging project based talent (consultants or services) from a third-party supplier
(AKA SOW Supplier) through a Statement of Work (SOW) contract

• | SOWGlobal Market Trends
• SOW managed by MSP’s increased worldwide• Up 61% Globally• Up 74% in the US
• Largest MSP Programs overall dominated by SOW scope
• SOW programs are likely to grow ~100% as contractor spend management will evolve to include reviews of outcome based contracts, as the market matures
13%
61%
10%
74%
0% 20% 40% 60% 80%
Temp/Contract
SOW
GROWTH (2012 TO 2013) IN MSP SPEND BY WORK
ARRANGEMENT
United States Global
Staffing Industry Analysts CWS Council 2014 VMS and MSP Supplier Competitive Landscape

• |
• Companies reliant on MSP for SOW program development, routines, and VMS design
• Traditional % of spend / Supplier funded models common in SOW VMS / MSP fees…interest in activity pricing with large $ spend programs
7.3
11.7
5.6
9.7
0 5 10 15
2012
2013
MSP SOW SPEND IN $ BILLION (2012 TO 2013)
United States Global
SOWGlobal Market Trends
Staffing Industry Analysts CWS Council 2014 VMS and MSP Supplier Competitive Landscape

• | SOWMarketplace Drivers
Compliance Assurance
Spend Optimization
Service Quality
Spend Visibility

• | SOWSpend Visibility
Lacking holistic, dedicated view to SOW procurement
Existing ERP/PO systems limited in active project oversight and controls around budgeted spend/ scope expansion
“60% of companies profess SOW projects received the most organizational attention but only 14% have high visibility into their SOW spend.” (Aberdeen)

• | SOWCompliance Assurance
Lacking visibility of SOW Supplier workers assigned to projects; transient staff leading to poor controls on facility/systems access and company asset return
“Visibility and compliance into worker tracking is often the first interest area (in SOW mgmt.)… the client’s exposure to risk often accelerates their adoption speed” (Spend Matters)
“The majority of contingent programs suffer from classification non-compliance, both due to confusion and managers purposely going against policy” (Staffing Industry Analysts)
Loose qualification of SOW vs. Staff Augmentation; open environment for tenure policy violators
Limited pre-engagement vetting of SOW Suppliers for insurances, active contract status, etc.

• | SOWSpend Optimization
Disparate/ non-existent competitive bid environment
“It is common to see about 20% of misclassification of SOW consultants, with bill rate inflation typically in the 20% -70% range” (Staffing Industry Analysts)
“Companies deploying a service procurement program can achieve positive ROI in <1 year and reduce cost by 5-10%...” (Forrester Research)
“The majority of contingent programs suffer from classification non-compliance, both due to confusion and managers purposely going against policy” (Staffing Industry Analysts)
Overpriced Staff Augmentation buried within non-vetted SOW’s
Weak project budget controls; out of scope/ cross charging on mismanaged purchase orders
Lost volume/ early pay discount opportunities

• | SOWService Quality
Relationships driving Supplier selection; not quality or price
Limited ability for oversight of SOW Supplier performance and milestone delivery throughout engagement lifecycle
Executives cannot rely on vendor provided reports to gauge performance & effectiveness… rather internal benchmarking data to gauge the quality of the vendor's work” (Spend Matters)

• | SOWIn the Driver’s Seat of SOW Management
YOUR BOTTOM LINE SUFFERS WHEN YOUR SOW PROGRAM LACKS
SEASONED PROGRAM MANAGEMENT TEAM
VISIBILITY AND CONTROL
CONTRACTUALRISK AND MISCLASSIFICATION PREVENTION
REPORTING AND ANALYTICS
• | SOW Program

• | SOW ProgramBusiness Case Drivers PAIN POINTS
• Service Procurement/Statement of Work (SOW) spend $ annually
• # of SOW engagements created annually
• # of SOW Suppliers engaged on projects annually
• # of SOW Supplier workers engaged annually (with access to systems/facilities)
VISIBILITY VISIBILITY
COMPLIANCECOMPLIANCE
SPEND OPTIMIZATION & COST SAVINGS
SPEND OPTIMIZATION & COST SAVINGS
SERVICE QUALITYSERVICE QUALITY
OPPORTUNITY ASSESSMENT AREAS |

• |
FUNCTION/FEATURE PROGRAM BENEFITS
RFX• Sourcing Effectiveness, RFx Bid Cycle Time and Attained
Savings
SOW• SOW Scope, Clauses, Deliverables, Budget/Timeline
Performance, Negotiated/Rate Card Savings, Negotiation Cycle Time
SUPPLIERS• Program Spend, Service Competency, Performance,
Budget Adherence, Savings
WORKERS • Worker Roles, Rates, Location and Tenure
Program BenefitsSOW Program
VISIBILITY

• | SOW ProgramBusiness Case Drivers
• Strength of SOW Suppliers pre-qualification coverage prior to project engagement
• Strength of controls to ensure SOW agreement conformity, risk prevention & assess misclassification
• Timeliness of your SOW approval process & SOW Supplier Onboarding process
• Strength of onboarding screening process of SOW Supplier workers
PAIN POINTS
VISIBILITY VISIBILITY
COMPLIANCECOMPLIANCE
SPEND OPTIMIZATION & COST SAVINGS
SPEND OPTIMIZATION & COST SAVINGS
SERVICE QUALITYSERVICE QUALITY
OPPORTUNITY ASSESSMENT AREAS |

• |Program Benefits
SOW Program
FUNCTION/FEATURE PROGRAM BENEFITS
WORKERS• On/Offboard Admin Oversight• Worker Tenure Linked to Billing Activity (T&M)
SOW AGREEMENT
• Controlled SOW Template, Enforced Clauses and Proactive Staff Aug Vetting
• Enforcement of Contract Rate Cards and Remittance Tied to Delivery/Budget Approvals
• Committed Spend Visibility for Finance/Accounting Accruals
SUPPLIERS• Enrollment Vetting and Qualification Controls/Process• Remittance Linkage to Program Enrollment, SOW
Agreement and Manager Approval
COMPLIANCE

• | SOW ProgramBusiness Case Drivers
• Strength of competitive evaluation process (bidding) of SOW Suppliers on new engagements
• Strength of volume pricing leverage with higher tier SOW Suppliers
• Strength of process to capture negotiated and delivery spend savings per project
• Strength of process to secure spend approvals (engagement budget, scope changes, invoicing, etc.)
PAIN POINTS
COMPLIANCECOMPLIANCE
SPEND OPTIMIZATION & COST SAVINGS
SPEND OPTIMIZATION & COST SAVINGS
SERVICE QUALITYSERVICE QUALITY
OPPORTUNITY ASSESSMENT AREAS |

• |
FUNCTION/FEATURE PROGRAM BENEFITS
COMPETITIVE BID & RATE CARD MGMT.
• Controlled RFx Bid Forum & Promotion (Preferred Strategic Advancement/Service Competency Linkage)
• Ability for Enforced Contract Resource Rate Cards
STAFF AUG REDIRECT• Pre-executed SOW Vetting for Broader Savings
Attainment
SUPPLIERCONSOLIDATION
• Consolidated Spend and SOW Terms Reporting
SPEND/BUDGET ENFORCEMENT
• E-approval of Budget, Deliverables, Invoicing and SOW Amendments w/in VMS
Program BenefitsSOW Program
SAVINGS

• | SOW ProgramBusiness Case Drivers
• Strength of project managers (buyers) ability to actively manage SOW Supplier performance
• Ability to use past SOW Supplier performance to influence future selection
• Accuracy and timeliness of SOW Supplier invoicing
PAIN POINTS
VISIBILITY VISIBILITY
COMPLIANCECOMPLIANCE
SPEND OPTIMIZATION & COST SAVINGS
SPEND OPTIMIZATION & COST SAVINGS
SERVICE QUALITYSERVICE QUALITY
OPPORTUNITY ASSESSMENT AREAS |

• |
FUNCTION/FEATURE PROGRAM BENEFITS
SOW CONTRACTING & INVOICING
• Standard Bid/SOW Templates, Workflows; Expediting Build, Negotiation and Approvals
• Accelerated Invoice Initiation and E-approvals
SUPPLIER PERFORMANCE MGMT.
• RFx Bid Competitiveness and Responsiveness• SOW Contract Rate Competitiveness, Cycle Times and
Qualitative Performance Capture • Budget and Timeline Performance Monitoring
Program BenefitsSOW Program
EFFICIENCY AND QUALITY

• |Lifecycle
SOW Program
VMS PROJECT CREATION
WORKER ONBOARDING & PROVISIONING
SERVICE DELIVERY &
INVOICING
PROJECT CLOSE & WORKER OFF-BOARDING
PROJECT SCOPING & SUPPLIER SELECTION
SUPPLIER QUALIFICATION & ENROLLMENT
MSA & SOW CONTRACT ADMINISTRATION
SUPPLIER MANAGEMENT

• |Common Adoption Hurdles
SOW Program
AREA STAKEHOLDER CONCERN POV MESSAGING/MITIGATION APPROACH
Adoption& Program Escapes
SOW Suppliers• Push back on
MSP/VMS fees (added cost to serve)
• Fee/rate compressionwith visibility
• VMS admin burden
• Preferred Supplier tiering increases spend share; pulling from one-off/non-program vendors
• Bidding environment increases market share opportunities on prior “sole-sourced” procurement
• Faster reimbursement cycles with automated invoicing and approvals within VMS
Business Continuity Disruption
Engagement Managers
• Added cycle time delays through MSP/VMS
• Preferred SOW Supplier de-enrollment
• Utilize MSP high touch to ease VMS and process controls navigation ~ Buyer focus on Supplier capability and project oversight
• Graduated deployment approach enabling short term continuity
• MSP supplier management to gauge longer term capability/viable alternative options
• |
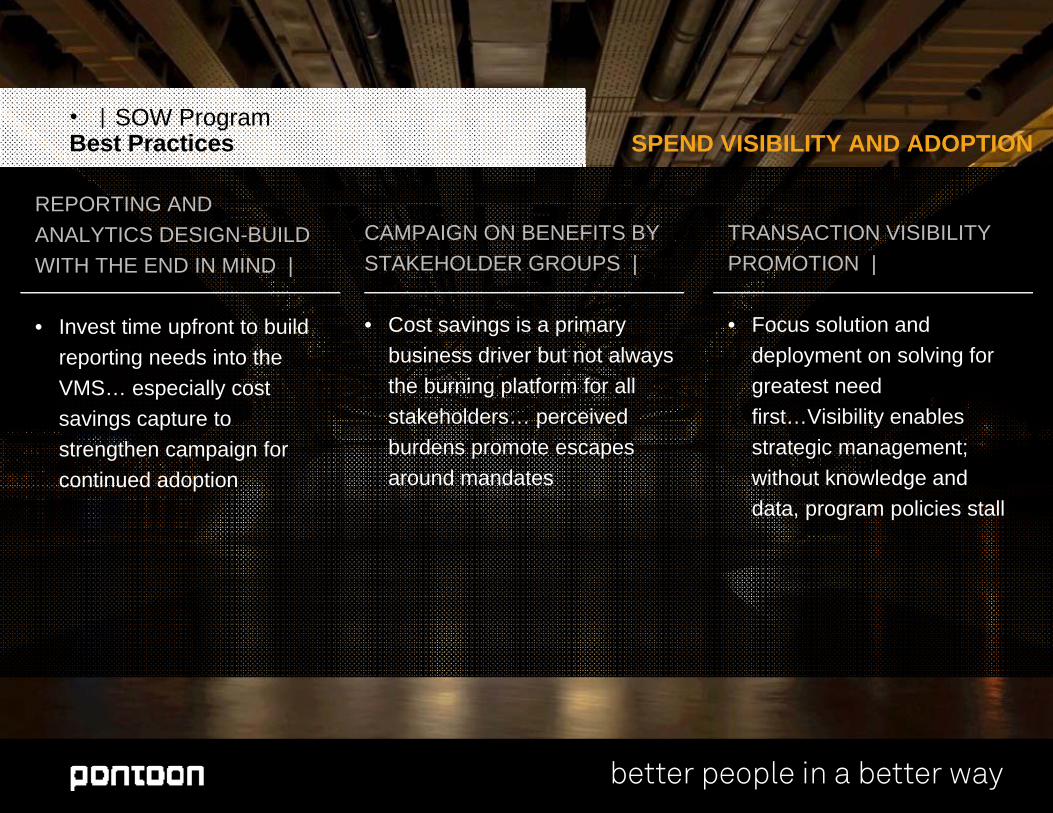
TRANSACTION VISIBILITY PROMOTION |
• Focus solution and deployment on solving for greatest need first…Visibility enables strategic management; without knowledge and data, program policies stall
REPORTING AND ANALYTICS DESIGN-BUILD WITH THE END IN MIND |
• Invest time upfront to build reporting needs into the VMS… especially cost savings capture to strengthen campaign for continued adoption
CAMPAIGN ON BENEFITS BY STAKEHOLDER GROUPS |
• Cost savings is a primary business driver but not always the burning platform for all stakeholders… perceived burdens promote escapes around mandates
Best PracticesSOW Program
SPEND VISIBILITY AND ADOPTION

• |Best Practices
SOW Program
REDIRECT STAFF AUGMENTATION WITHIN SOWs |
• Often largest savings missed due to non-qualification procedures
• Establish expectations via communications and enable VMS/ Program controls
• Build mechanisms to quantify savings… (i.e. resource categories/ rates crossing SOW and Staff Augmentation)
DRIVE COMPETITIVE COST PRESSURE |
• Require resource schedules on fee based projects; promotes price pressure and enables comparative cost analysis
• Use transaction history to create “expected” rate cards for competitive guides
• Promote RFx bidding whenever possible, leverage RFQ’s to gain insight
RATIONALIZE SUPPLIER BASE |
• Leverage program data to consolidate spend with strategic vendors, to achieve volume pricing and reduce risk… configure VMS to push buyers towards preferred
COST SAVINGS

• | COMPLIANCE ASSURANCEAND EFFICIENCY
CONTRACTUAL RISK AND MISCLASSIFICATION PREVENTION |
• Utilize SOW template capability within VMS; enforces scope build into deliverables based format with fixed/un-editable provisions
• Leverage VMS “Resource Guides” to steer buyers to proper channel and MSP counsel for eligibility verification
• 1099/Freelancers are vendors; require SOW’s to affirm relationship separation beyond initial entity qualification
SOW WORKER COMPLIANCE –BEYOND T&M |
• Leverage tracking and onboarding compliance for all engaged workers; offsite/fee based resources may still access systems and intellectual property
PROACTIVE SOW SUPPLIER MANAGEMENT |
• Establish expectations, standards and rogue policy up front with strategic suppliers… they influence project buyers more than anticipated
Common Adoption HurdlesSOW Program

• | Full Cycle SOW Procurement ServicesSOW MSP/VMS Program Capabilities
PRE-ENGAGEMENT SUPPORT
ENGAGEMENT TRANSACTION SUPPORT
SUPPLIER MGMT.,
VETTING & OPTIMIZATION
VMS PROJECT FRAMEWORK
CREATION
WORKER ONBOARD & PROVISION
PROJECT DELIVERY, INVOICE &
REMITTANCE
PROJECT CLOSE & WORKER
DEPROVISION
PROJECT SCOPING & SUPPLIER SELECT
(RFX)
MSA & SOW CONTRACT
ADMIN
Spend Visibility | Compliance Assurance | Spend Optimization | Service Quality

• | Deployment Considerations
POPULATION DEPLOYMENT
PILOTPros-lower risk deployment, smaller change mgmt. effortCons-slower savings realization, differing concurrent processes for users, size can restrict proof of concept establishment
PHASED ROLLOUTPros-quicker adoption/cost save gains vs. pilot, with tollgate points for “go/no go ” continuationCons-more change management effort and integration coordination than pilot
BIG BANGPros-consistent policy adoption and accelerated transparency/cost save gainsCons-significant change mgmt. effort, potential issue resolution on a grand scale with large exposure
PROJECT TRANSITION
IN-FLIGHT ENGAGEMENT CONVERSIONPros-accelerates adoption and transparency/cost save gainsCons-data conversion load complexity and cut off timing coordination
NEW ENGAGEMENT STARTUPPros-eases users into new program/ process, no data conversion complexitiesCons-slow adoption progress; requires users to jockey between legacy and new process for existing and new engagements
Affirm primary program goals (Cost Save, Visibility, Ease of Use, etc.)
Analyze current user/spend populations: Largest spend/saving opportunity, process strength, system usage and proficiency
Identify/rank gains and risk of approach methods (Business disruption, change mgmt. effort, integration complexity, savings)
OVERALL STRATEGY

Thank you
Statement of Work SolutionsApril 2015

21‐22 April 2015Hotel Okura, Amsterdam© 2015 Crain Communications Inc. All rights reserved.
Rate this session by accessing the evaluation from your Conference Mobile Community OR tap the iPad screen as you exit.
DIGITAL SURVEYS
Don’t forget to provide feedback
Building the SOW Business Case