Embed Size (px)
Citation preview
Revised Edition: 2006-05-01
CONCRETE COMPOSITE CROSS-SECTION RESPONSE FOR
PUSHOVER ANALYSIS
ANWAR A.(1)
(1) Asian Center for Engineering Computations and Software (ACECOMS), Asian Institute of
Technology (AIT), Thailand
Abstract ID Number (given by the scientific editors/organizers): …………..
Author contacts
Authors E-Mail Fax Postal address
N. Anwar [email protected] (662)-524-6059
ACECOMS, SET, AIT
P.O. Box 4, KlongLuang
Pathumthani 12120, Thailand
Contact person for the paper: N. Anwar
Presenter of the paper during the Conference: N. Anwar
Total number of pages of the paper (this page and the license to publish excluded): 9
Page 1
CONCRETE COMPOSITE CROSS-SECTION RESPONSE FOR
PUSHOVER ANALYSIS
N. ANWAR (1)
(1) Associate Director, Asian Center for Engineering Computations and Software
(ACECOMS), Asian Institute of Technology (AIT), Thailand
Abstract
Nonlinear pushover analysis has gained significance popularity and acceptance for
evaluating the performance of structures, especially buildings, both for seismic and non-
seismic loads. The pushover analysis relies on the non-linear cross-section response
parameter as the basic input for determining the load-deformation and performance curves.
Many software that carryout the pushover analysis, have the capability to generate such
parameter for simple section and material models. However for complex cross-sections,
material models and behavior, computing these parameters often needs to be done separately
and then provided as an input to the analysis programs.
This paper presents a unified approach to determine the cross-sectional parameters needed
for carrying out pushover analysis. A general, composite cross-section model is considered
that includes the effects of pre-stress, differential creep, shrinkage, confinement, staged
construction, strain hardening, tension stiffening, relaxation and bond slippage etc.
Methodology is proposed to handle all of these effects is a single consistent computational
procedure. The response that can be obtained from these computations is the capacity at
specified failure criteria, the moment-curvature curves, moment rotation curves, stiffness
properties, ductility ratio etc. The proposed model can be used for beams, columns and shear
walls for new construction as well as for strengthened and retrofitted members.
1. INTRODUCTION
Pushover analysis is a static, nonlinear procedure in which the magnitude of the structural
loading is incrementally increased in accordance with a certain predefined pattern [1]. With
the increase in the magnitude of the loading, weak links and failure modes of the structure are
found. The procedure also helps to identify ductility requirements for various members. The
loading is monotonic with the effects of the cyclic behavior and load reversals being
estimated by using a modified monotonic force-deformation criteria and with damping
approximations. Static pushover analysis is an attempt by the structural engineering
profession to evaluate the real strength of the structure and it promises to be a useful and
effective tool for performance based design. Pushover analysis is most suitable for
determining the performance, especially for lateral loads such as earthquake or even wind.
Since the structures do not respond as linearly elastic systems during strong ground shaking,
Page 2
the linear analysis can not give true picture of structural system behavior. Non-linear
Pushover analysis gives improve understanding of building behavior and provides more
accurate prediction of global displacement, more realistic prediction of earthquake demand on
individual components and elements and more reliable identification of “bad actors”.
Pushover analysis is most advanced state of the practice because in Pushover analysis design
is based on Expected Performance rather than on Ultimate Strength. The basic Ultimate
Strength does not tell us what will be performance of the structure at Ultimate Capacity.
1.1 Performance Based Design
Performance is generally of concern for lateral loads such as earthquake and wind. The
main factor that affects performance is the ductility of the members on the critical load path.
In frame structures, the design of the joints between columns and beams is critical. The
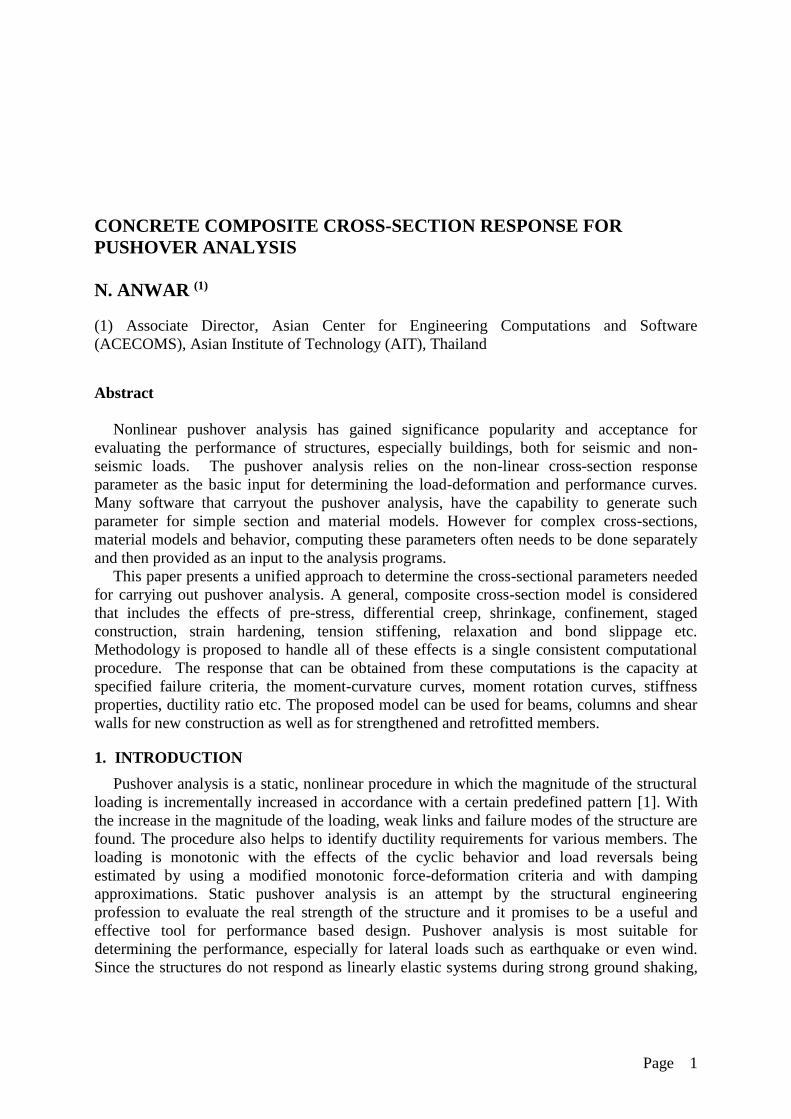
performance of shear walls is also of great importance for lateral load demands. The overall
relationship of various response curves relevant to the performance based design or evaluation
of structures using the Pushover analysis is shown in Figure 1. This figure shows how the
material stress-strain curves contribute to the Moment-Curvature curve, which in turn affects
the moment rotation behavior of plastic hinges, that in turn affect the structure performance
curve and finally relates to the seismic demand curve defined in Accelerate Displacement
Response Spectra (ADRS) format [1]. It can be seen that the Moment-Curvature curve is the
basic cross-section response that must be determined to carry on this type of analysis. The
Moment-Curvature curve and the corresponding moment rotation curve are generated after
basic cross-section design is completed.
Figure 1: Moment-curvature curve as one of the key inputs in performance based design using
Pushover analysis
Page 3
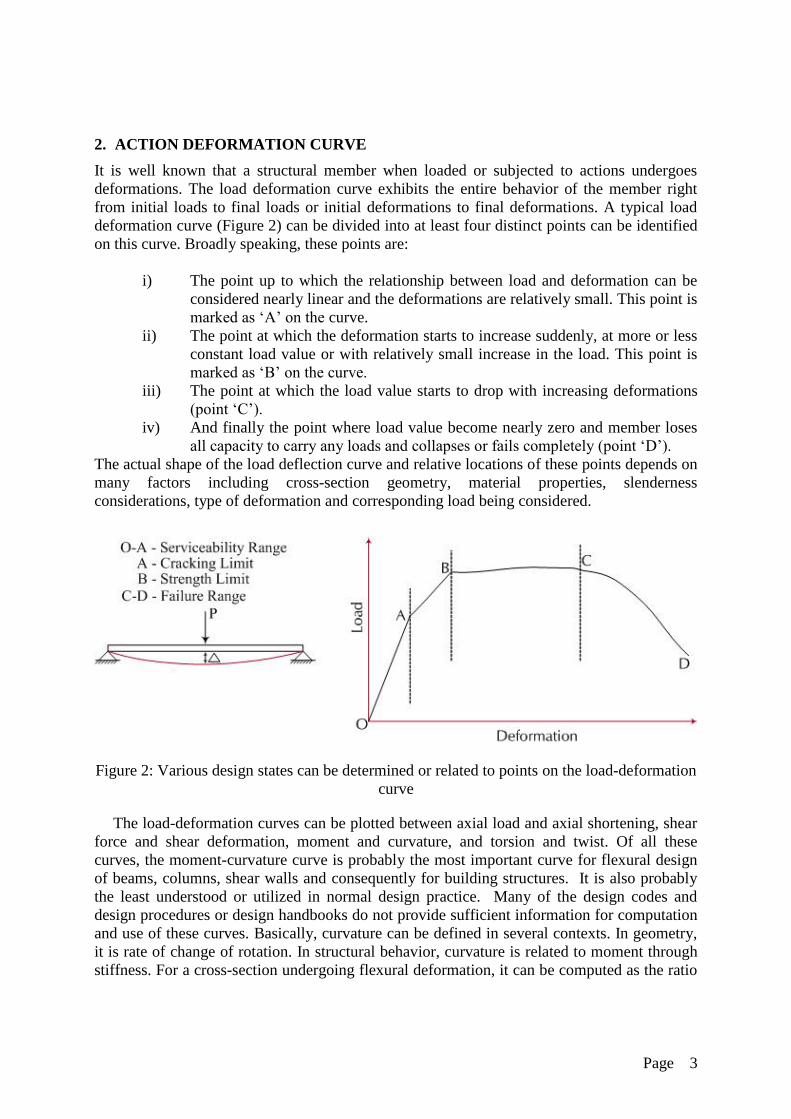
2. ACTION DEFORMATION CURVE
It is well known that a structural member when loaded or subjected to actions undergoes
deformations. The load deformation curve exhibits the entire behavior of the member right
from initial loads to final loads or initial deformations to final deformations. A typical load
deformation curve (Figure 2) can be divided into at least four distinct points can be identified
on this curve. Broadly speaking, these points are:
i) The point up to which the relationship between load and deformation can be
considered nearly linear and the deformations are relatively small. This point is
marked as ‘A’ on the curve.
ii) The point at which the deformation starts to increase suddenly, at more or less
constant load value or with relatively small increase in the load. This point is
marked as ‘B’ on the curve.
iii) The point at which the load value starts to drop with increasing deformations
(point ‘C’).
iv) And finally the point where load value become nearly zero and member loses
all capacity to carry any loads and collapses or fails completely (point ‘D’).
The actual shape of the load deflection curve and relative locations of these points depends on
many factors including cross-section geometry, material properties, slenderness
considerations, type of deformation and corresponding load being considered.
Figure 2: Various design states can be determined or related to points on the load-deformation
curve
The load-deformation curves can be plotted between axial load and axial shortening, shear
force and shear deformation, moment and curvature, and torsion and twist. Of all these
curves, the moment-curvature curve is probably the most important curve for flexural design
of beams, columns, shear walls and consequently for building structures. It is also probably
the least understood or utilized in normal design practice. Many of the design codes and
design procedures or design handbooks do not provide sufficient information for computation
and use of these curves. Basically, curvature can be defined in several contexts. In geometry,
it is rate of change of rotation. In structural behavior, curvature is related to moment through
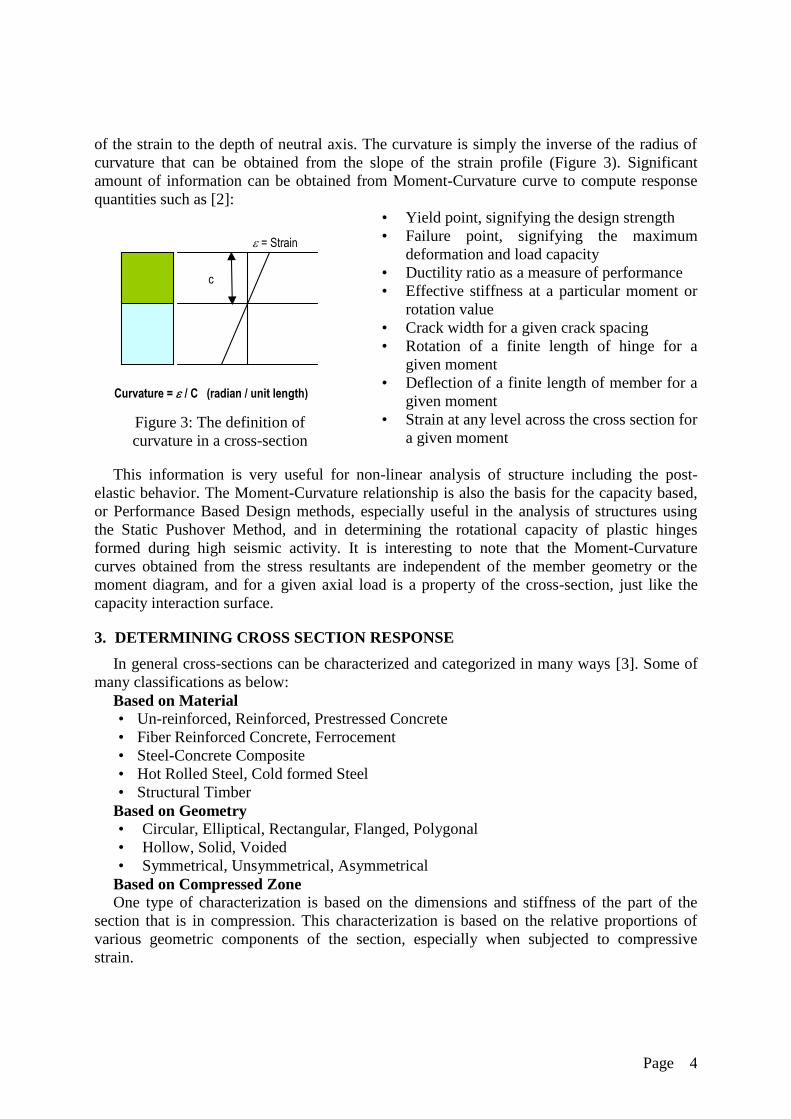
stiffness. For a cross-section undergoing flexural deformation, it can be computed as the ratio
Page 4
of the strain to the depth of neutral axis. The curvature is simply the inverse of the radius of
curvature that can be obtained from the slope of the strain profile (Figure 3). Significant
amount of information can be obtained from Moment-Curvature curve to compute response
quantities such as [2]:
• Yield point, signifying the design strength
• Failure point, signifying the maximum
deformation and load capacity
• Ductility ratio as a measure of performance
• Effective stiffness at a particular moment or
rotation value
• Crack width for a given crack spacing
• Rotation of a finite length of hinge for a
given moment
• Deflection of a finite length of member for a
given moment
• Strain at any level across the cross section for
a given moment
This information is very useful for non-linear analysis of structure including the post-
elastic behavior. The Moment-Curvature relationship is also the basis for the capacity based,
or Performance Based Design methods, especially useful in the analysis of structures using
the Static Pushover Method, and in determining the rotational capacity of plastic hinges
formed during high seismic activity. It is interesting to note that the Moment-Curvature
curves obtained from the stress resultants are independent of the member geometry or the
moment diagram, and for a given axial load is a property of the cross-section, just like the
capacity interaction surface.
3. DETERMINING CROSS SECTION RESPONSE
In general cross-sections can be characterized and categorized in many ways [3]. Some of
many classifications as below:
Based on Material
• Un-reinforced, Reinforced, Prestressed Concrete
• Fiber Reinforced Concrete, Ferrocement
• Steel-Concrete Composite
• Hot Rolled Steel, Cold formed Steel
• Structural Timber
Based on Geometry
• Circular, Elliptical, Rectangular, Flanged, Polygonal
• Hollow, Solid, Voided
• Symmetrical, Unsymmetrical, Asymmetrical
Based on Compressed Zone
One type of characterization is based on the dimensions and stiffness of the part of the
section that is in compression. This characterization is based on the relative proportions of
various geometric components of the section, especially when subjected to compressive
strain.
c
= Strain
Curvature = / C (radian / unit length)
Figure 3: The definition of
curvature in a cross-section
Page 5
This classification is generally applicable to steel section and includes:
• Slender Sections/Thin Walled Sections
• Compact Sections
• Plastic Sections
The cross-section of a member is the basic design component. In fact the one of the main
purpose of the design process is to proportion the cross-sections effectively and economically.
Any attempt to integrate the design approaches must begin at the cross-section level.
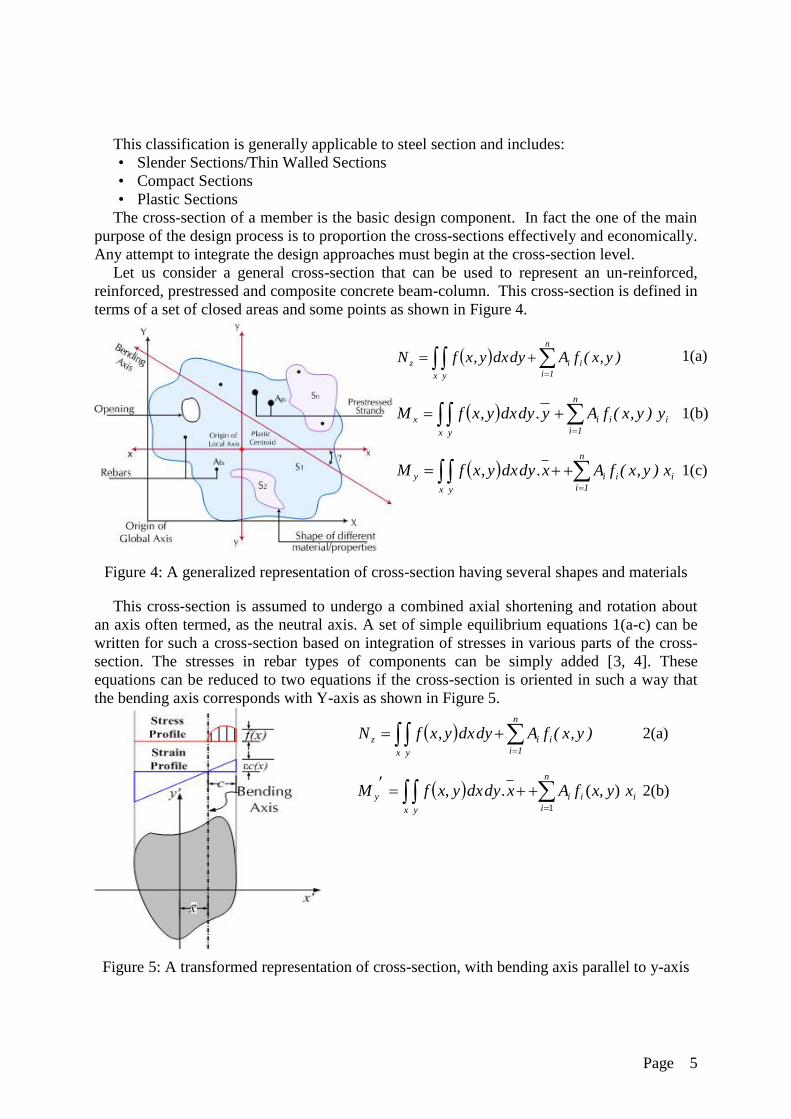
Let us consider a general cross-section that can be used to represent an un-reinforced,
reinforced, prestressed and composite concrete beam-column. This cross-section is defined in
terms of a set of closed areas and some points as shown in Figure 4.
Figure 4: A generalized representation of cross-section having several shapes and materials
This cross-section is assumed to undergo a combined axial shortening and rotation about
an axis often termed, as the neutral axis. A set of simple equilibrium equations 1(a-c) can be
written for such a cross-section based on integration of stresses in various parts of the cross-
section. The stresses in rebar types of components can be simply added [3, 4]. These
equations can be reduced to two equations if the cross-section is oriented in such a way that
the bending axis corresponds with Y-axis as shown in Figure 5.
Figure 5: A transformed representation of cross-section, with bending axis parallel to y-axis
x y
n
1i
iiz )y,x(fAdydxy,xfN 1(a)
i
n
1i
ii
x y
x y)y,x(fAy.dydxy,xfM
1(b)
i
n
1i
ii
x y
y x)y,x(fAx.dydxy,xfM
1(c)
x y
n
1i
iiz )y,x(fAdydxy,xfN 2(a)
i
n
i
ii
x y
y xyxfAxdydxyxfM
1
),(., 2(b)
Page 6
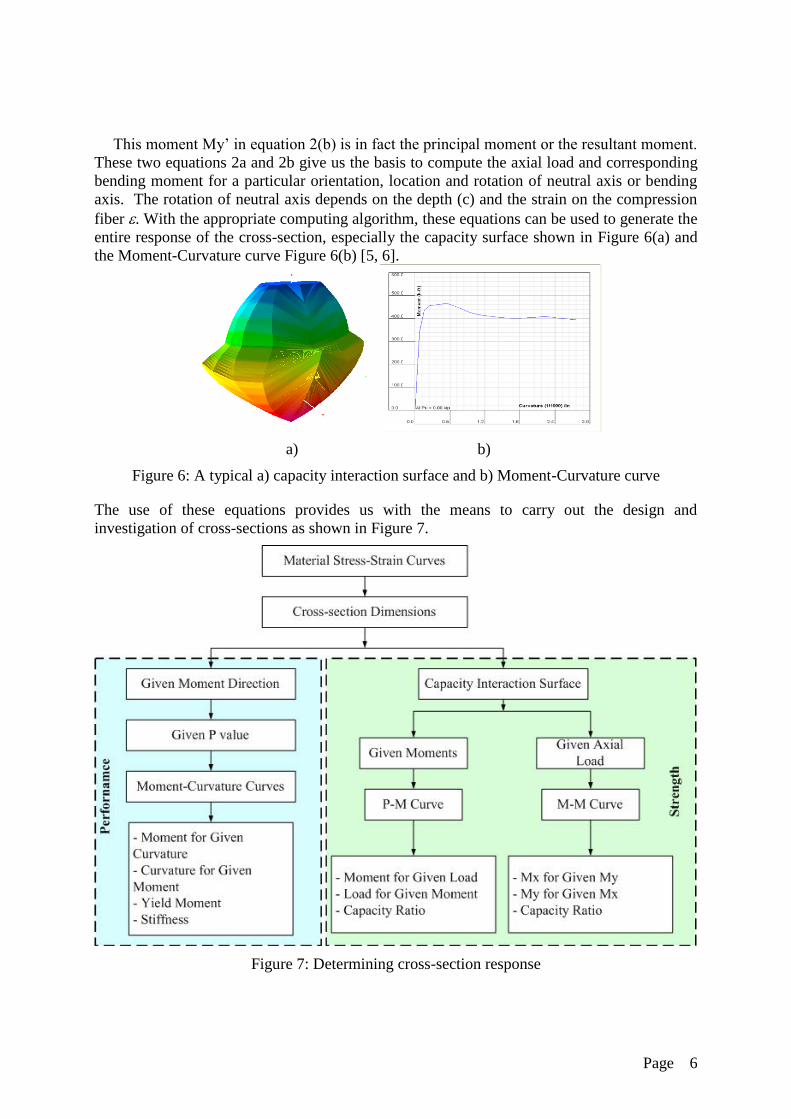
This moment My’ in equation 2(b) is in fact the principal moment or the resultant moment.
These two equations 2a and 2b give us the basis to compute the axial load and corresponding
bending moment for a particular orientation, location and rotation of neutral axis or bending
axis. The rotation of neutral axis depends on the depth (c) and the strain on the compression
fiber . With the appropriate computing algorithm, these equations can be used to generate the
entire response of the cross-section, especially the capacity surface shown in Figure 6(a) and
the Moment-Curvature curve Figure 6(b) [5, 6].
a) b)
Figure 6: A typical a) capacity interaction surface and b) Moment-Curvature curve
The use of these equations provides us with the means to carry out the design and
investigation of cross-sections as shown in Figure 7.
Figure 7: Determining cross-section response
Page 7
3.1 Generation of Moment-Curvature Curves
The main idea behind generation of the Moment-Curvature curve is to obtain the neutral
axis depth and the corresponding strain at the compression extreme for a given set of axial
load and moment. There is no direct solution possible and an iterative approach needs to be
used. It is often easier to fix the strain first and iterate on the depth of neutral axis, compute
moment and axial force using Equation 2, until equilibrium with the axial load is achieved.
The corresponding moment capacity at that depth of neutral axis and strain level is then used,
along with the curvature at that point. As defined earlier, the curvature is simply the ratio
between the strain and the depth of neutral axis. This curvature is measured in the units of
radians/length units used to define the neutral axis depth. Once one moment-curvature set is
obtained, the extreme fiber strain is changed and another solution is attempted to obtain yet
another pair of moment and curvature. Several points are computed, using a small strain
increment to plot a smooth curve. The generation of Moment-Curvature curve can be
terminated based on any number of specific conditions such as, the maximum specified strain
is reached, the first rebar reaches yield stress or any other strain level, the concrete reaches a
certain strain level.
Also, during the generation of the Moment-Curvature curve the failure or key response
points can be recorded and displayed on the curve. The axial load-shortening curve can be
generated in a manner similar to that described for the generation of Moment-Curvature
curve. However, in this case the iteration to determine the depth of neutral axis is not needed,
as the neutral axis is assumed to be horizontal, in the absence at any moment. The strain is
incremented and at each increment of strain, the corresponding axial load is determined using
the appropriate material models
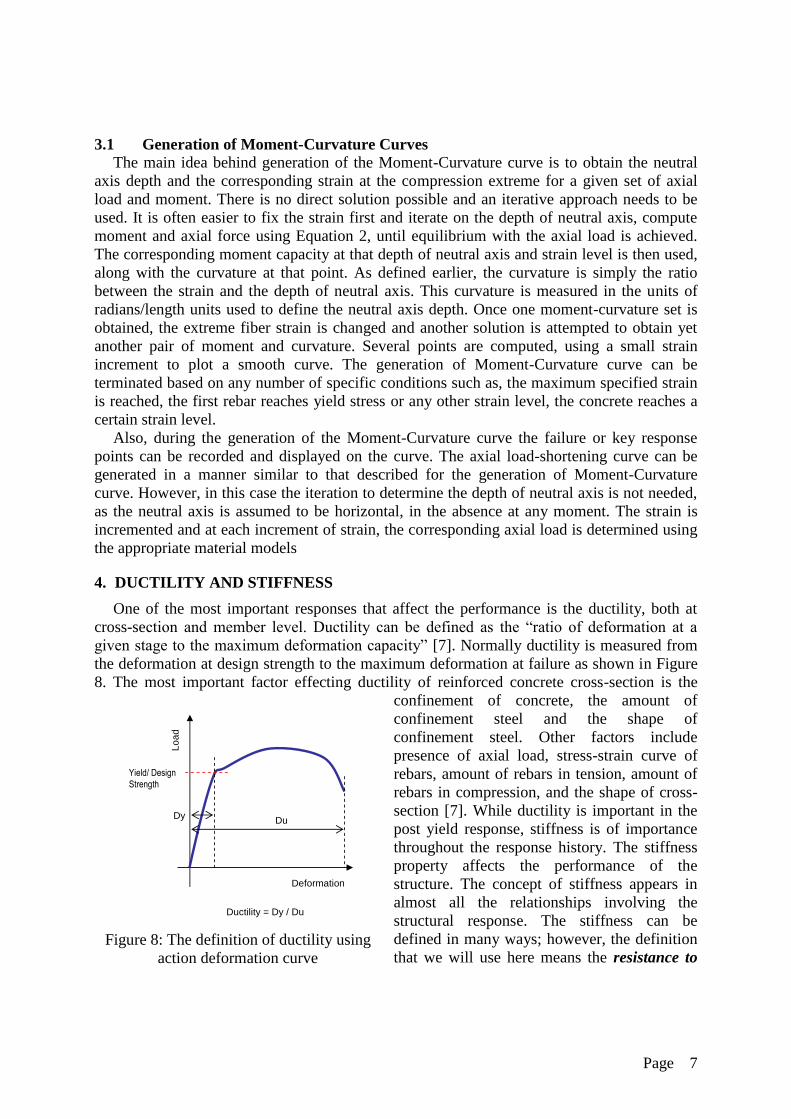
4. DUCTILITY AND STIFFNESS
One of the most important responses that affect the performance is the ductility, both at
cross-section and member level. Ductility can be defined as the “ratio of deformation at a
given stage to the maximum deformation capacity” [7]. Normally ductility is measured from
the deformation at design strength to the maximum deformation at failure as shown in Figure
8. The most important factor effecting ductility of reinforced concrete cross-section is the
confinement of concrete, the amount of
confinement steel and the shape of
confinement steel. Other factors include
presence of axial load, stress-strain curve of
rebars, amount of rebars in tension, amount of
rebars in compression, and the shape of cross-
section [7]. While ductility is important in the
post yield response, stiffness is of importance
throughout the response history. The stiffness
property affects the performance of the
structure. The concept of stiffness appears in
almost all the relationships involving the
structural response. The stiffness can be
defined in many ways; however, the definition
that we will use here means the resistance to
Yield/ Design
Strength
Lo
ad
Deformation
DyDu
Ductility = Dy / Du
Figure 8: The definition of ductility using
action deformation curve
Page 8
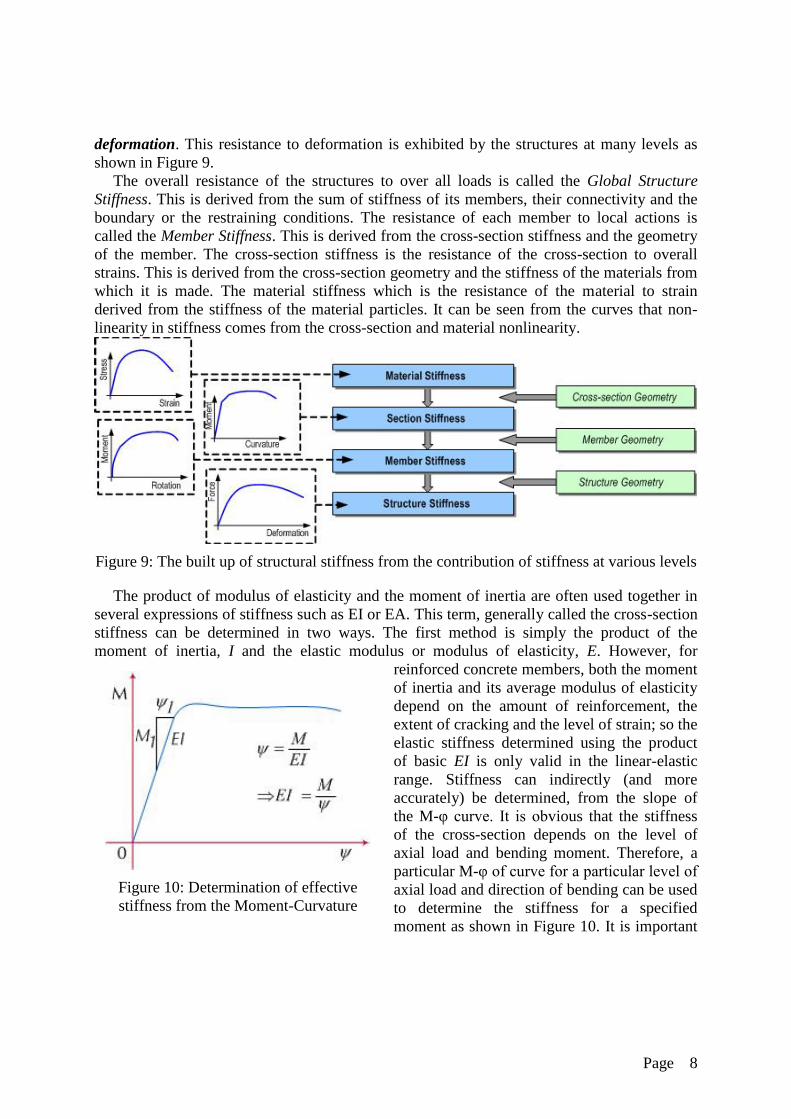
deformation. This resistance to deformation is exhibited by the structures at many levels as
shown in Figure 9.
The overall resistance of the structures to over all loads is called the Global Structure
Stiffness. This is derived from the sum of stiffness of its members, their connectivity and the
boundary or the restraining conditions. The resistance of each member to local actions is
called the Member Stiffness. This is derived from the cross-section stiffness and the geometry
of the member. The cross-section stiffness is the resistance of the cross-section to overall
strains. This is derived from the cross-section geometry and the stiffness of the materials from
which it is made. The material stiffness which is the resistance of the material to strain
derived from the stiffness of the material particles. It can be seen from the curves that non-
linearity in stiffness comes from the cross-section and material nonlinearity.
Figure 9: The built up of structural stiffness from the contribution of stiffness at various levels
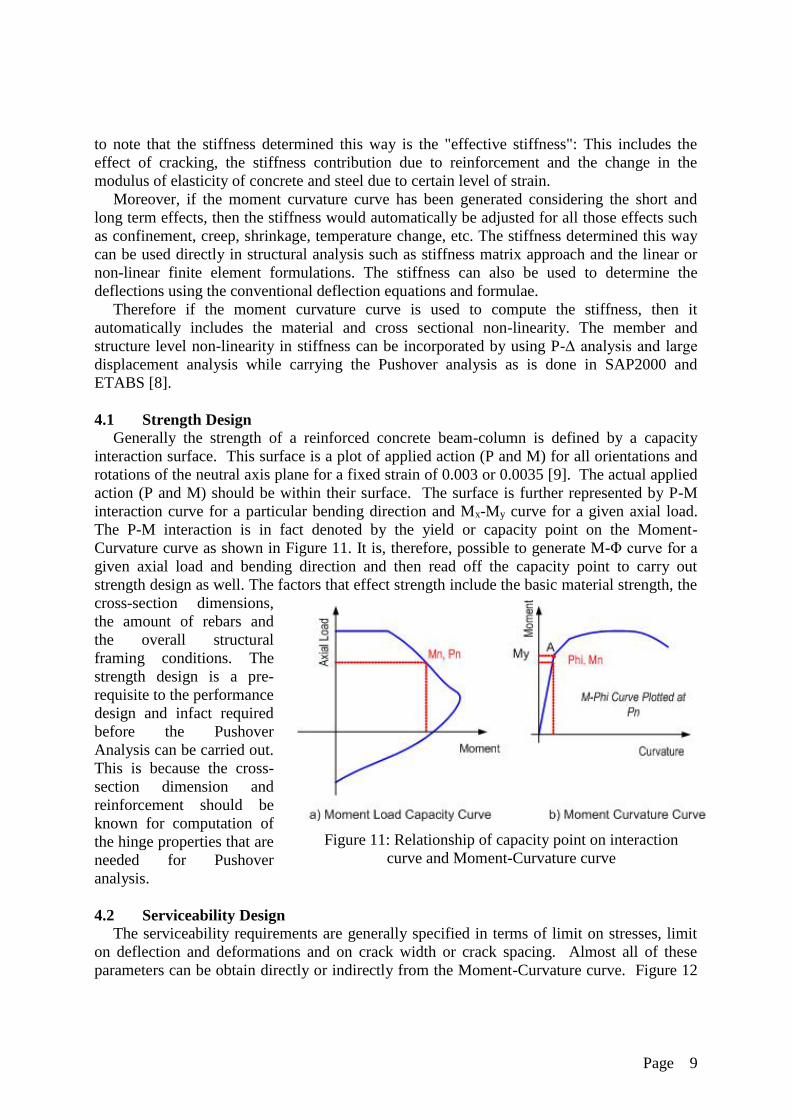
The product of modulus of elasticity and the moment of inertia are often used together in
several expressions of stiffness such as EI or EA. This term, generally called the cross-section
stiffness can be determined in two ways. The first method is simply the product of the
moment of inertia, I and the elastic modulus or modulus of elasticity, E. However, for
reinforced concrete members, both the moment
of inertia and its average modulus of elasticity
depend on the amount of reinforcement, the
extent of cracking and the level of strain; so the
elastic stiffness determined using the product
of basic EI is only valid in the linear-elastic
range. Stiffness can indirectly (and more
accurately) be determined, from the slope of
the M-φ curve. It is obvious that the stiffness
of the cross-section depends on the level of
axial load and bending moment. Therefore, a
particular M-φ of curve for a particular level of
axial load and direction of bending can be used
to determine the stiffness for a specified
moment as shown in Figure 10. It is important
Figure 10: Determination of effective
stiffness from the Moment-Curvature
curve
Page 9
to note that the stiffness determined this way is the "effective stiffness": This includes the
effect of cracking, the stiffness contribution due to reinforcement and the change in the
modulus of elasticity of concrete and steel due to certain level of strain.
Moreover, if the moment curvature curve has been generated considering the short and
long term effects, then the stiffness would automatically be adjusted for all those effects such
as confinement, creep, shrinkage, temperature change, etc. The stiffness determined this way
can be used directly in structural analysis such as stiffness matrix approach and the linear or
non-linear finite element formulations. The stiffness can also be used to determine the
deflections using the conventional deflection equations and formulae.
Therefore if the moment curvature curve is used to compute the stiffness, then it
automatically includes the material and cross sectional non-linearity. The member and
structure level non-linearity in stiffness can be incorporated by using P-∆ analysis and large
displacement analysis while carrying the Pushover analysis as is done in SAP2000 and
ETABS [8].
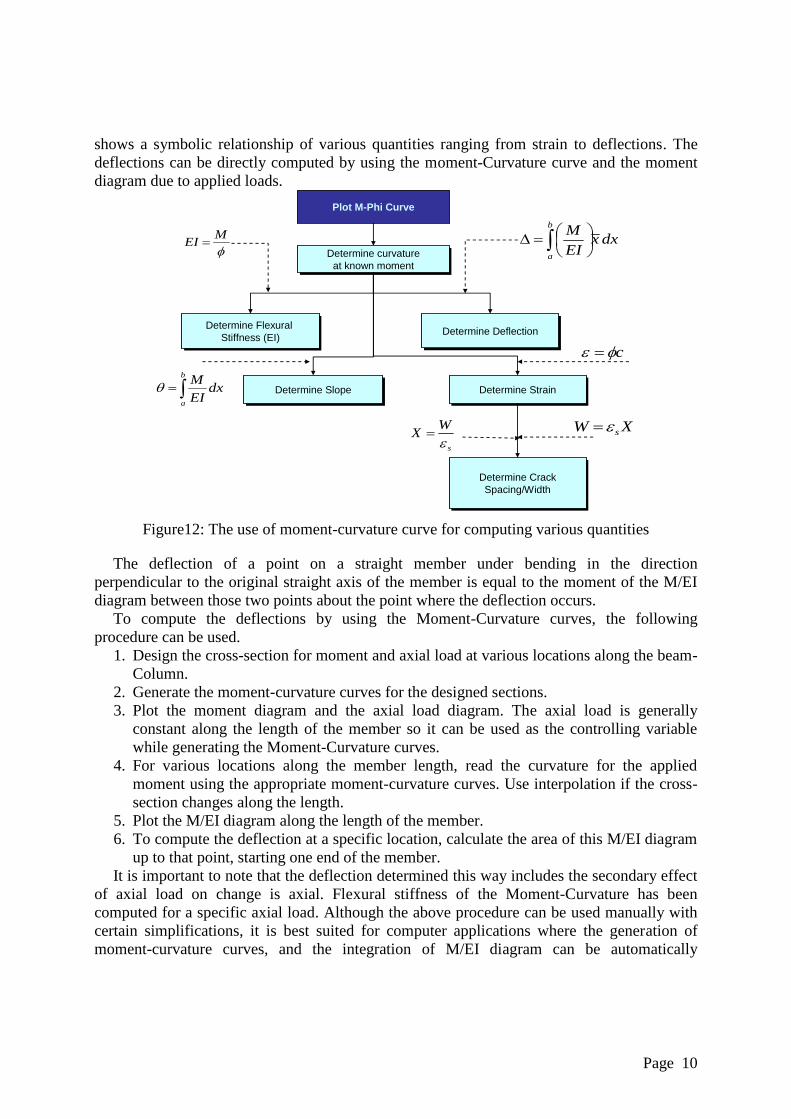
4.1 Strength Design
Generally the strength of a reinforced concrete beam-column is defined by a capacity
interaction surface. This surface is a plot of applied action (P and M) for all orientations and
rotations of the neutral axis plane for a fixed strain of 0.003 or 0.0035 [9]. The actual applied
action (P and M) should be within their surface. The surface is further represented by P-M
interaction curve for a particular bending direction and Mx-My curve for a given axial load.
The P-M interaction is in fact denoted by the yield or capacity point on the Moment-
Curvature curve as shown in Figure 11. It is, therefore, possible to generate M-Φ curve for a
given axial load and bending direction and then read off the capacity point to carry out
strength design as well. The factors that effect strength include the basic material strength, the
cross-section dimensions,
the amount of rebars and
the overall structural
framing conditions. The
strength design is a pre-
requisite to the performance
design and infact required
before the Pushover
Analysis can be carried out.
This is because the cross-
section dimension and
reinforcement should be
known for computation of
the hinge properties that are
needed for Pushover
analysis.
4.2 Serviceability Design
The serviceability requirements are generally specified in terms of limit on stresses, limit
on deflection and deformations and on crack width or crack spacing. Almost all of these
parameters can be obtain directly or indirectly from the Moment-Curvature curve. Figure 12
Figure 11: Relationship of capacity point on interaction
curve and Moment-Curvature curve
Page 10
shows a symbolic relationship of various quantities ranging from strain to deflections. The
deflections can be directly computed by using the moment-Curvature curve and the moment
diagram due to applied loads.
Plot M-Phi Curve
Determine curvature
at known moment
Determine curvature
at known moment
Determine Flexural
Stiffness (EI)
Determine Flexural
Stiffness (EI)
Determine SlopeDetermine Slope
Determine DeflectionDetermine Deflection
Determine StrainDetermine Strain
Determine Crack
Spacing/Width
Determine Crack
Spacing/Width
MEI
dxEI
Mb
a
dxxEI
Mb
a
c
XW s
s
WX
Figure12: The use of moment-curvature curve for computing various quantities
The deflection of a point on a straight member under bending in the direction
perpendicular to the original straight axis of the member is equal to the moment of the M/EI
diagram between those two points about the point where the deflection occurs.
To compute the deflections by using the Moment-Curvature curves, the following
procedure can be used.
1. Design the cross-section for moment and axial load at various locations along the beam-
Column.
2. Generate the moment-curvature curves for the designed sections.
3. Plot the moment diagram and the axial load diagram. The axial load is generally
constant along the length of the member so it can be used as the controlling variable
while generating the Moment-Curvature curves.
4. For various locations along the member length, read the curvature for the applied
moment using the appropriate moment-curvature curves. Use interpolation if the cross-
section changes along the length.
5. Plot the M/EI diagram along the length of the member.
6. To compute the deflection at a specific location, calculate the area of this M/EI diagram
up to that point, starting one end of the member.
It is important to note that the deflection determined this way includes the secondary effect
of axial load on change is axial. Flexural stiffness of the Moment-Curvature has been
computed for a specific axial load. Although the above procedure can be used manually with
certain simplifications, it is best suited for computer applications where the generation of
moment-curvature curves, and the integration of M/EI diagram can be automatically
Page 11
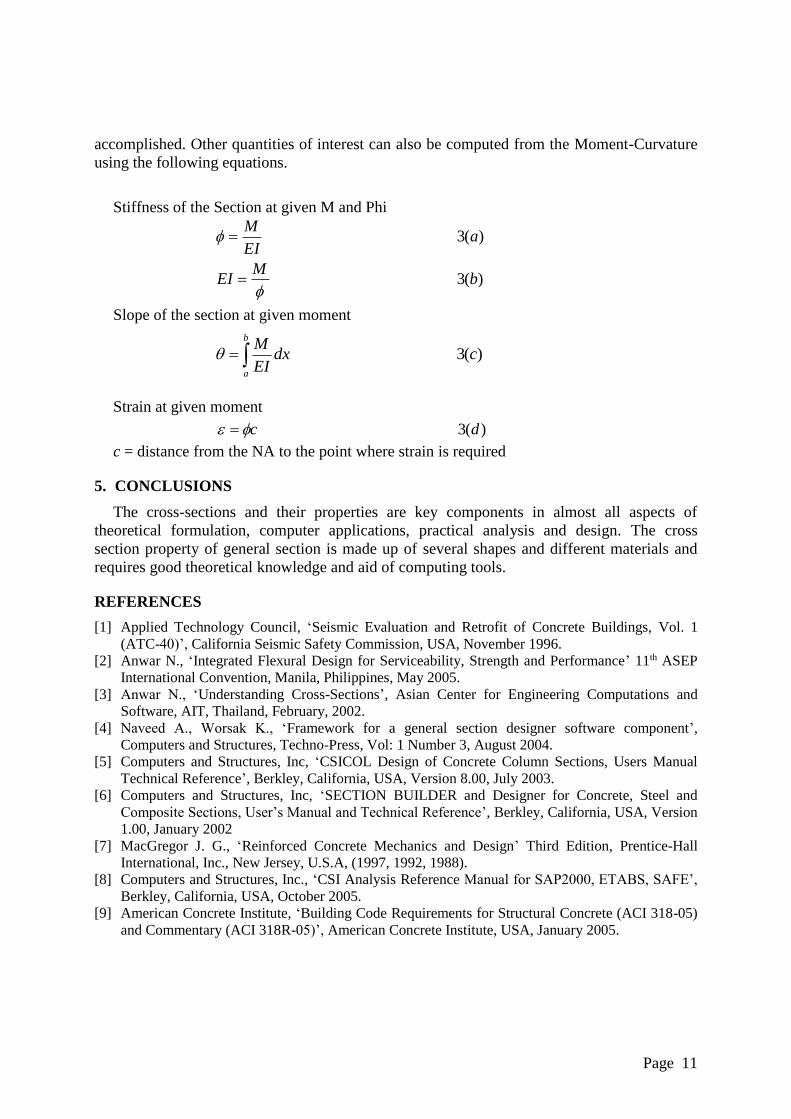
accomplished. Other quantities of interest can also be computed from the Moment-Curvature
using the following equations.
Stiffness of the Section at given M and Phi
Slope of the section at given moment
Strain at given moment
c = distance from the NA to the point where strain is required
5. CONCLUSIONS
The cross-sections and their properties are key components in almost all aspects of
theoretical formulation, computer applications, practical analysis and design. The cross
section property of general section is made up of several shapes and different materials and
requires good theoretical knowledge and aid of computing tools.
REFERENCES
[1] Applied Technology Council, ‘Seismic Evaluation and Retrofit of Concrete Buildings, Vol. 1
(ATC-40)’, California Seismic Safety Commission, USA, November 1996.
[2] Anwar N., ‘Integrated Flexural Design for Serviceability, Strength and Performance’ 11th ASEP
International Convention, Manila, Philippines, May 2005.
[3] Anwar N., ‘Understanding Cross-Sections’, Asian Center for Engineering Computations and
Software, AIT, Thailand, February, 2002.
[4] Naveed A., Worsak K., ‘Framework for a general section designer software component’,
Computers and Structures, Techno-Press, Vol: 1 Number 3, August 2004.
[5] Computers and Structures, Inc, ‘CSICOL Design of Concrete Column Sections, Users Manual
Technical Reference’, Berkley, California, USA, Version 8.00, July 2003.
[6] Computers and Structures, Inc, ‘SECTION BUILDER and Designer for Concrete, Steel and
Composite Sections, User’s Manual and Technical Reference’, Berkley, California, USA, Version
1.00, January 2002
[7] MacGregor J. G., ‘Reinforced Concrete Mechanics and Design’ Third Edition, Prentice-Hall
International, Inc., New Jersey, U.S.A, (1997, 1992, 1988).
[8] Computers and Structures, Inc., ‘CSI Analysis Reference Manual for SAP2000, ETABS, SAFE’,
Berkley, California, USA, October 2005.
[9] American Concrete Institute, ‘Building Code Requirements for Structural Concrete (ACI 318-05)
and Commentary (ACI 318R-05)’, American Concrete Institute, USA, January 2005.
)(3
)(3
bM
EI
aEI
M
)(3 cdxEI
Mb
a
)(3 dc