Embed Size (px)
Citation preview
University of Rhode Island University of Rhode Island
DigitalCommons@URI DigitalCommons@URI
Open Access Master's Theses
2017
Concomitant Use of Central Nervous System Stimulants and Concomitant Use of Central Nervous System Stimulants and
Depressants Prescribed in Rhode Island Depressants Prescribed in Rhode Island
Aram Babcock University of Rhode Island, [email protected]
Follow this and additional works at: https://digitalcommons.uri.edu/theses
Recommended Citation Recommended Citation Babcock, Aram, "Concomitant Use of Central Nervous System Stimulants and Depressants Prescribed in Rhode Island" (2017). Open Access Master's Theses. Paper 1054. https://digitalcommons.uri.edu/theses/1054
This Thesis is brought to you for free and open access by DigitalCommons@URI. It has been accepted for inclusion in Open Access Master's Theses by an authorized administrator of DigitalCommons@URI. For more information, please contact [email protected].
CONCOMITANT USE OF CENTRAL NERVOUS SYSTEM STIMULANTS
AND DEPRESSANTS PRESCRIBED IN RHODE ISLAND
BY
ARAM BABCOCK
A THESIS SUBMITTED IN PARTIAL FULFILLMENT OF THE
REQUIREMENTS FOR THE DEGREE OF
MASTER OF SCIENCE
IN
PHARMACEUTICAL SCIENCES
UNIVERSITY OF RHODE ISLAND
2017
MASTER OF SCIENCE THESIS
OF
ARAM BABCOCK
APPROVED:
THESIS COMMITTEE:
MAJOR PROFESSOR: Xuerong Wen
Stephen Kogut
Natallia Katenka
Nasser Zawia
DEAN OF THE GRADUATE SCHOOL
UNIVERSITY OF RHODE ISLAND
2017
ABSTRACT
Background: Risks of morbidity and mortality may arise when prescription
stimulants are used in combination with prescription central nervous system
(CNS) depressants. The RI Prescription Drug Monitoring Program (PDMP)
captures all prescriptions for schedule II to IV, as well as information on certain
schedule V medications.
Objective: This study examines the pattern of using a combination of controlled
substance prescription CNS stimulants with CNS depressants in RI. We also seek
the predictors of concomitant use of these two drugs classes in patients.
Methods: This was a cross-sectional study using de-identified data from the RI
PDMP in 2015. We included all patients who filled a prescription for stimulants
or CNS depressants. Medications that are not in these two study drug classes were
excluded. The outcome of interest was concomitant use of stimulants and CNS
depressants, which was defined as patients who filled any stimulants and any
depressants with at least 60 days of combined fill and less than 15 days’ gap in
filling. Demographic characteristics of patients were used in the statistical
analyses to identify the predictors of concomitant use of stimulants and
depressants.
Results: In the complete RI PDMP data set, there was a total 409,740 patients
who filled 2,516,314 prescriptions of schedule II to V medications. The patients
using both stimulants and CNS depressants tended to be younger females, which
used private pay (cash) more frequently than their male counterparts. Patients
in the stimulants and CNS depressants cohort were older women who used
commercial pay type at a higher percentage than their counterparts in the stimulants only
cohort. A difference existed in the percent of patients that filled an average days’ supply
of less than or equal to 30 days compared with greater than 30 days, between those who
take both prescription controlled substance stimulants and depressants chronically
compared with those who fill only stimulants. In hypothesis 3, patients in the Attention
Deficit Hyperactivity Disorder cohort were younger with a lower percentage average
daily dose (less than or equal to 25 milligrams) of stimulant, more likely to be of male
sex, and use commercial insurance as the primary pay type compared to the usage of
stimulants in the stimulants and CNS depressants cohort.
Conclusion: The prevalence of chronic concomitant therapy of stimulants with
CNS depressants was associated with prescribing longer days of supply and higher
dose of stimulants. The most prevalent pay type of all cohorts was commercial
insurance.
iv
ACKNOWLEDGMENTS
First and foremost, I would like to thank my major professor, Dr. Xuerong
Wen, for her devotion to helping me craft my skills on what has been my first
graduate-level study. I would also like to thank my other committee members, Dr.
Stephen Kogut and Dr. Natallia Katenka, for devoting their time to helping me
conduct a study in a subject which is both topical and of personal/professional
interest to me.
I would also like to thank my brother, Zack Babcock, for his countless hours
of educating me on SAS programming. Great thanks are also due for my fellow
graduate students, as well as departmental faculty, all of whom have helped me
become a better researcher.
v
TABLE OF CONTENTS
ABSTRACT…………………………………………………………….…………...ii
ACKNOWLEDGMENTS…………………………………….……………………iv
TABLE OF CONTENTS………………………….………………………………..v
LIST OF TABLES……………………………………………………....................vii
LIST OF FIGURES………………………………………………………….……viii
CHAPTER 1………………………………………………………………….……...1
INTRODUCTION……………………………………………….………….1
CHAPTER 2…………………………………………………………………….…...4
REVIEW OF THE LITERATURE…………………………….………….4
CHAPTER 3…………………………………………….…………………………...6
METHODOLOGY…………………………….……………………………6
CHAPTER 4……………………………………………………….……………….11
RESULTS………………………………………….……………………….11
CHAPTER 5………………………………………………………….…………….20
DISCUSSION………………………………………………….………...…20
APPENDIX 1: TABLES…………………………………………………….……..28
APPENDIX 2: FIGURES…………………………………………………………38
vi
BIBLIOGRAPHY……………………………………….…………………………43
vii
LIST OF TABLES
TABLE PAGE
Table 1: Comparison of baseline characteristics for Overlap vs. No Overlap cohort...28
Table 2: Comparison of baseline characteristics for Stimulants and depressants vs.
Stimulants only cohorts .……........................................................................................28
Table 3: Models for days of supply for Stimulants and depressants vs. Stimulants only
cohorts………………………………………................................................................29
Table 4: Comparison of baseline characteristics for ADHD-stimulants only vs. ADHD-
stimulants with depressants……………………………………………………………30
Table 5: Models for average daily dose. for ADHD-stimulants only vs. ADHD-stimulants
with depressants……………………………………………………………...…….......31
Table 6: List of medications filled, with frequency (count) and percent, by those who
chronically fill stimulants and/or depressants……………….………………................33
viii
LIST OF FIGURES
FIGURE PAGE
Figure 1: Flow chart design for Overlap Yes vs. Overlap no cohorts...………………..38
Figure 2: Flow chart design for comparison between stimulants and depressants cohort
and stimulants only cohort …………..............................................................................38
Figure 3: Percent of patients who filled for an average of ≤ 30 days or > 30 days…….39
Figure 4: Flow chart design comparison between ADHD stimulants only cohort and
ADHD stimulants with depressants cohort…………………...………………………..40
Figure 5: Seven most commonly prescribed ADHD stimulant medications (by base) in
Rhode Island in 2015…………………………………………………………………..41
Figure 6: Comparison of percent of patients filling for an average daily dose less than or
equal to 25 mg or more than 25 mg……………….……………….…………………..42
1
CHAPTER 1
INTRODUCTION
The most commonly prescribed medications for Attention-
Deficit/Hyperactivity Disorder (ADHD) in adults in the United States are the
controlled substance stimulant class of medications, including amphetamine salt
and methylphenidate.1 Common adverse effects associated with these medications
include irritability, anxiety, and difficulty falling asleep or staying asleep.2 To
combat the aforementioned adverse effects, patients may be prescribed central
nervous system depressants which can slow down the central nervous system and
reduce the stimulant adverse effects.3,4 Included in these medication classes are
tranquilizers, barbiturates/sedatives, muscle relaxants and other prescription
sedatives such as zolpidem, eszopiclone and zaleplon. Their desirable side effects
or undesirable adverse effects often include: drowsiness, dizziness, tiredness, or in
more severe cases respiratory depression leading to coma and death.3,4 The
combination of stimulants and depressants, however, can cause mixed signals
within the brain, and can lead to adverse events including coma and death.4
A 2015 National Survey of Drug Use and Health (NSDUH) surveyed the
use and misuse of individual medications in the four groups separately, but not in
concomitant use with medications from the other groups.1 We analyzed potential
signs of misuse by way of comparing overutilization of controlled substances in
combination according to the definitions from the Center for Medicare and
Medicaid Services (CMS)5 and the Center for Disease Control.6 Overutilization has
also been termed polypharmacy, or use of more than one pharmacy to fill a
2
prescription, or an inappropriate medication regimen. Adverse outcomes from
unnecessary over-prescribing of medications, particularly in the elderly, may occur
from this practice.7-9 In addition, there is concern for patients of all ages who have
taken prescribed stimulants with non-prescribed controlled substances.10-16 By
creating awareness of the prevalence and potential risk factors of this type of
antagonistic medication usage, prescribers may be able to target at-risk populations
more readily to avoid potential adverse outcomes.
To-date there has been no published study conducted with information from
the Rhode Island State Prescription Drug Monitoring Program (PDMP) which
describes chronic concomitant therapy of prescription stimulants with prescription
depressants. This study sought to discover if there are significant risk factors
associated with patients using a combination of prescription central nervous system
(CNS) stimulants with prescription CNS depressants based on the demographic
characteristics provided by the data source, including age, sex, and payment type.
To better understand the relationship among different subpopulations
represented by claims in the RI PDMP and how their baseline demographics and
fill history affect the combined use of CNS stimulants and depressants, three
hypotheses were developed:
1. There is no difference in baseline characteristics among patients of combination use
of stimulants and CNS depressants in consideration of days of concomitant use.
2. There is no difference in the percentage of patients’ average days of supply of
either less than and equal to 30 days or more than 30 days for those who
3
chronically fill only a prescription stimulant compared with those who fill
prescriptions stimulant(s) with a depressant(s).
3. For those who chronically fill the two most commonly prescribed medication bases
for ADHD, there is no difference in the percentage of average daily dose of either
less than or equal to 25 milligrams or more than 25 milligrams for patients taking
only the ADHD medication base compared with those taking both ADHD
medication base stimulants and depressants.
4
CHAPTER 2
REVIEW OF THE LITERATURE
A paucity of data exists for legally prescribed use of combinations of
central nervous system stimulant and depressant medications in the primary care
setting, while information is more readily available from small patient clinical trials
of patients with a history of drug abuse.17-21 More information exists in the
literature about non-medical users of these CNS medications than of those taking
them as prescribed.10-16 However, adverse outcomes such as emergency department
visits, hallucinations, coma, death, may still occur for both populations. In addition,
there is a concern for when one controlled substance is used to treat adverse effects
of another controlled substance, as proposed by the Drug Enforcement Agency’s
2015 resource guide.4 Stimulants such as modafinil and methylphenidate can
reduce sedative effects caused by opioids and other CNS depressants.22 When used
appropriately, this practice can be clinically useful for patients utilizing opioids
who feel overly sedated and in the hospice or palliative care setting, but data are
lacking to support this practice for adolescents or older patients in the primary care
setting.22-24 Additionally, clinical guidelines from the American Pain Society make
no recommendation for the use of any stimulant or other medication for the
treatment of opioid-induced sedation.25 Sedatives/hypnotics and tranquilizers may
be used to reduce the stimulant effects of nervousness, restlessness, and difficulty
falling asleep or staying asleep.4 Risk of morbidity and mortality may arise when
stimulants are used in combination with central nervous system depressants
because this combination can lead to adverse outcomes including hospitalizations,
5
coma, and death, even at properly prescribed doses.4 Properly prescribed doses
refers to a physician prescribing in the usual course of his/her practice, while
staying within FDA-approved maximum daily dosages.
6
CHAPTER 3
METHODOLOGY
Research design:
A cross-sectional study was conducted using de-identified data from the RI
Prescription Drug Monitoring Program (PDMP) for 2015. This study evaluated
patterns of combined use CNS stimulant and depressant controlled substance
medications in the State of Rhode Island in schedules II, III, IV, and some data on
schedule V, as defined by the Controlled Substances Act Code of Federal
Regulations Title 21.26 The PDMP data includes all Schedule II to IV prescription
medications, some schedule V medications, and some non-controlled
medications, dispensed by RI pharmacies. All pharmacies with a RI controlled
substance registration (CSR) number are required by regulation to file a report on
all controlled substances filled within 72 hours of the prescription being dispensed
to the patient. The data provided by the Rhode Island Department of Public
Health for this project included the following information: patient de-identified
number, patient age (years), patient’s gender, prescriber de-identified number,
dispensing pharmacy de-identified number, date dispensed, National Drug Code
(NDC) for the drug, drug name, drug strength, formulation, therapeutic class
code, days of supply, metric quantity dispensed, and method of payment.
General Characteristics of the study population:
Inclusion criteria:
7
All study participants who filled a prescription at a Rhode Island pharmacy in the
calendar year of 2015 for at least one controlled substance stimulant as well as at
least one controlled substance depressant in the 2015 calendar year were included.
Medications included in the study were grouped into one of ten categories. These
categories were defined by a variable provided within the data set which indicates
the therapeutic class code, which is used to differentiate medications based on
their primary therapeutic use. The medications were then placed into broader
groups based upon the primary effect of the base component(s) of the
medications. Stimulants consisted of medications that could generally be
considered of use for weight-loss therapy, narcolepsy, or Attention Deficit
Hyperactivity Disorder. Examples including, but not limited to were:
phentermine, modafinil, and mixed amphetamine salts. CNS depressants
consisted of medications that could generally be considered of use for pain
mitigation (opioids), cough, sleep disturbance (sedative/hypnotic/tranquilizer),
migraines or sedation (barbiturates), neuropathic pain, or skeletal muscle
spasms/pain. Examples including, but not limited to, were: oxycodone,
hydrocodone, codeine, benzodiazepines (lorazepam, alprazolam, others),
zolpidem, carisoprodol, pregabalin, and butalbital. If the medication contained
both stimulant and depressant effects, grouping preference was given to
whichever component had characteristics which corresponded to a lower schedule
(as defined by the Controlled Substances Act). Analysis was based on de-
identified PDMP data collected in 2015 in the State of Rhode Island.
Exclusion criteria:
8
Claims for medications that are not controlled substances were excluded from
analyses. Claims for medications that were for hormonal replacement were
excluded. Hypothesis 2 further reduced the population by three patients based
upon outliers. Hypothesis 3 further reduced the population by removal of all but
two stimulant bases, and any non-oral ADHD stimulant (methylphenidate patch).
Index date:
The index date was defined as the first day of overlapping prescription fill date
based on a claim beginning January 1, 2015 and ending December 31, 2015.
Dependent Variables (outcomes):
In hypothesis 1, the dependent variable was chronic concomitant therapy, which
was deemed “overlap”. Overlap was defined as filling one or more stimulants
with one or more depressants with 60 or more consecutive days of supply with no
gaps >15 days. This definition was chosen based on a previous study that
suggested a minimum of 61 days, where by most instances of cross-titration were
not misidentified as polypharmacy.27 As indicated in this study’s definition, the
one extra day was included (60 vs. 61). In hypothesis 2, the dependent variable
was average days of supply, which was binarized to either less than or equal to 30
days or more than 30 days. Thirty days was chosen based upon mean values for
the cohorts, as well as a clinically significant length for days supply. Many
prescriptions written for patients on chronic therapy of many diseases have their
prescriptions written, and filled for, thirty-day periods. This variable was
formulated by totaling each patients’ days of supply for each claim and dividing it
9
by 365 days. In hypothesis 3, the dependent variable was average total daily dose
of the ADHD stimulant medication, which was binarized to either less than or
equal to 25 milligrams or more than 25 milligrams. Twenty-five milligrams was
chosen as a cut-off based upon a median value from the cohorts. This variable
was derived by multiplying the per unit dosage strength of each medication by the
number of dosage units, and then dividing by the days supply. Dichotomous
variables were created because the sample sizes were large enough to do so, while
also being able to create relevant cutoffs for better interpretation with odds ratios
rather than β-coefficients.
Independent variables (exposures):
Independent variables included patient’s age, gender, and payment type. Age is
given in whole year increments, with the first age at occurrence of claim was
used. Gender is given as male or female, with the first gender at occurrence of
claim was used. Payment type, using the first occurrence of the claim, included
three categories: government/other, private pay, and commercial insurance.
Government/other pay type was comprised of several payers including Medicaid,
Medicare, Military Institution or Veterans’ Administration, Workers’
Compensation, Indian Nations, and ‘other’, as given by the data set.
Descriptive Analysis:
An analysis for individuals in the age groups of (1) younger than 12, (2) 12-17,
(3) 18-25, (4) 26-64, and (5) 65 or older, which is similar to how the NSDUH
survey differentiated age groups (12-17, 18-26, 26+).1 This study also examined
10
the effects of gender on concomitant drug use. The patient’s first gender entered
into the PDMP data file was used. The patient’s first age in the PDMP was used.
A comparison of the different payment types (cash, private, or government/other)
was also be conducted. The first payment type for each patient was used.
Statistical analysis:
Statistical analyses included chi-square test or Fisher’s Exact test to compare the
differences between two categorical variables and multivariate logistic regression
to discover any significant predictors for overlapping or concomitant therapy, as
defined in the Methodology section. The age comparison for hypothesis 1 was
performed using simple averaging of ages of all unique patients, using the age at
first claim given in the PDMP, in the overlap compared with no overlap cohort.
The student t-test was used to compare the two independent cohorts, with age as a
continuous variable. A frequency procedure was used to determine overall
percentages for gender and pay type, using the first gender given in the PDMP for
each unique patient, within the stimulants and depressants and stimulants-only
patients. A 30-day cut-off period was used to dichotomize the population based
on the median value of all the average days of supply for hypothesis 2. This
analysis was conducted using a test in the difference of means of two independent
samples using a t-test, with days’ supply as a continuous variable. Similarly,
hypothesis 3 was dichotomized based on median of the average daily dose of
ADHD stimulants of 25 mg. Due to the unbalanced sample size in two
comparison groups, we examined the variance equity for student t test. We chose
11
chi square test to compare the categorical variables since the sample size is large.
Analysis was conducted using SAS Version 9.4 (SAS Institute, Inc., Cary, NC).
12
CHAPTER 4
RESULTS
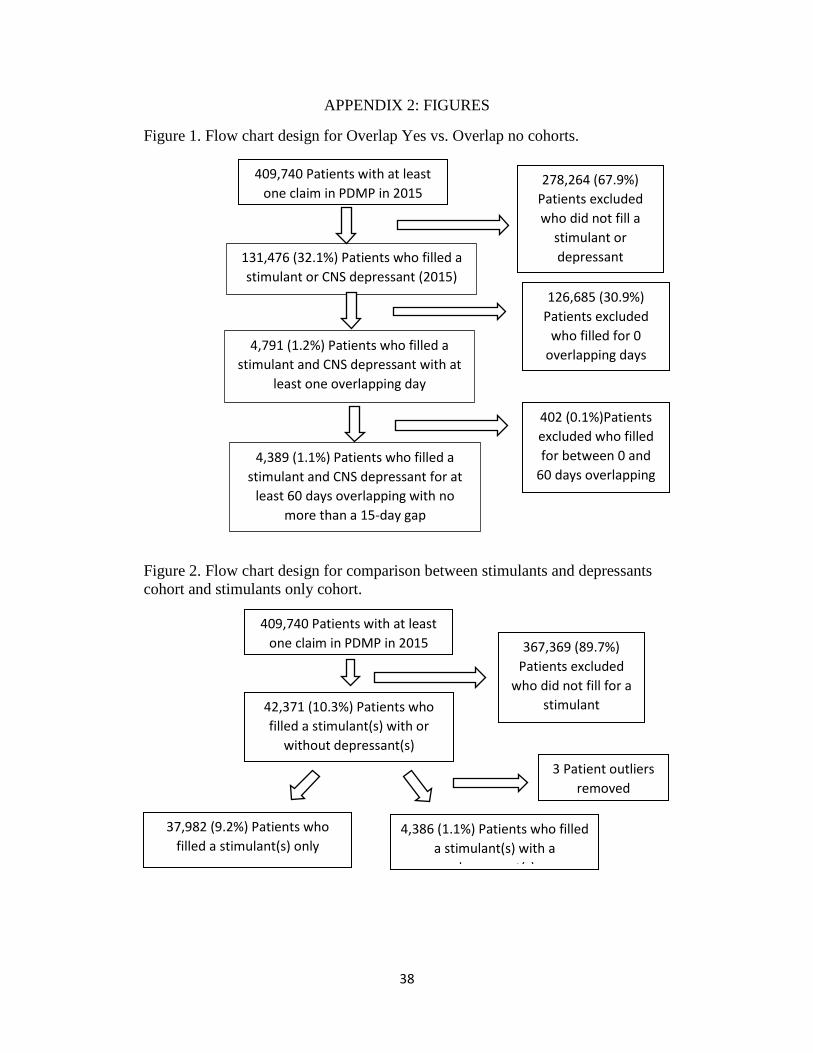
The first hypothesis includes the population of patients within the RI
PDMP which had claims for both a stimulant and depressant (Figure 1,
N=131,476) at any point during the 2015 calendar year. This population was
further narrowed to those patients with claims for both a stimulant and
depressant(s) for at least one day (N=4,791). Further, the population was then
defined as having concomitant stimulant and depressant use if their days of
overlap was 60 days or more, with no more than a 15-day gap in claims
(N=4,389), indicating a 1.1% prevalence among unique patients captured by the
PDMP. The two populations ultimately compared were those with the 60 days’
overlap (<15-day gap, N=4,389, Overlap Yes) to those with overlap of zero to 59
days’ supply (N=127,087, Overlap No). The two cohorts’ baseline characteristics
are listed and compared in Table 1.
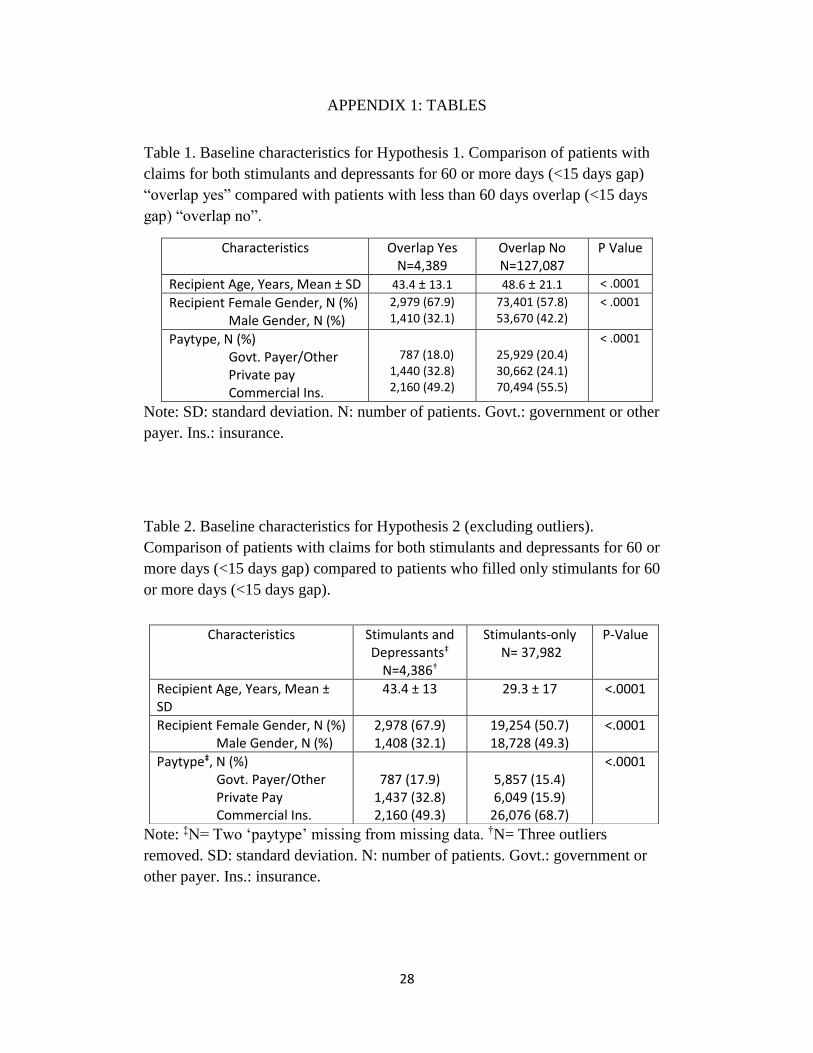
The Overlap Yes cohort had a mean age of 43.3 years with a standard
deviation of 13.1 years. The Overlap No cohort had a mean age of 48.6 years
with a standard deviation of 21.2 years. When compared, this resulted in a two-
sided p-value of < .0001, representing a statistically significant difference
between the two cohorts. The results show that patients within the Overlap Yes
group tended to be younger in age from the Overlap No cohort by about five
years, with a smaller standard deviation from this mean age.
Within the Overlap Yes cohort of patients, females accounted for 67.9%
(N=2,979) of the patients, while men accounted for 32.1% (N=1,410). In the
13
Overlap No cohort, females accounted for 57.8% (N=73,401), while the men
accounted for 42.2% (N=53,670). When compared using the Chi Square Test, the
two-sided p-value was < .0001, representing a significant difference between
females’ and males’ percentages between Overlap Yes and Overlap No cohorts.
Females were more likely to fill both a stimulant and a depressant throughout the
year, regardless whether overlap occurred.
The final variable examined in the baseline characteristics was pay type.
Data entry for the pay types from the RI PDMP originally contained eight
different pay codes. This study simplified the eight pay codes into three pay
types: private pay (cash purchase), government payer/Other (Medicaid, Medicare,
Military institution or Veterans Affairs, Indian Nations, Workers’ Compensation,
or Other), and Commercial insurance. The first occurrence was taken for each
unique patient given by the PDMP. The Overlap Yes cohort had a higher
percentage of private pay than did Overlap No. The Overlap No cohort had
higher percentages of Government payer/other payer and Commercial insurance.
In both cohorts, Commercial Insurance had the highest percentage of pay type
used for payment of claims, followed by private pay, then government/other pay
type. These differences were significant for this discrete variable, as indicated by
a p-value of < .0001.
In summary, the patients in the Overlap Yes cohort tended to be younger
females, which used private pay (cash) more frequently than their Overlap No
counterparts, while the most frequent pay type for both cohorts was commercial
insurance.
14
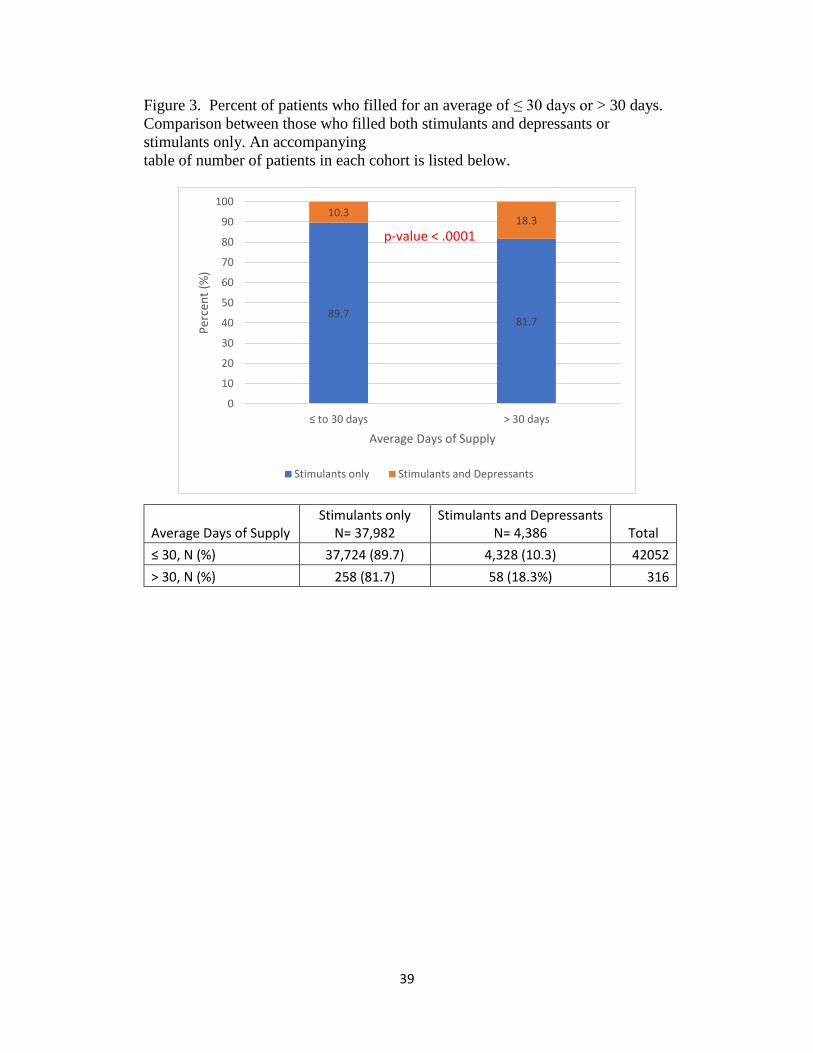
The second hypothesis was aimed at whether the percent of
patients who filled for less than or equal to 30 days compared with more
than 30 days differed between the stimulants and depressants cohort and
that of those who only filled stimulants. In other words, are those who fill
both types of medications more likely to take medication for a longer
period than those who fill only stimulants? Figure 2 displays a flow chart
for the cohorts. The original stimulants and depressants cohort contained
4,389 patients, as noted in hypothesis 1. However, while performing a
baseline test for normality, three patients were considered outliers,
identified as their average days’ supply exceeded 100 days. These outliers
consisted of three patients which had an average days’ supply of 110, 120,
or 400. Removal of the outliers reduced the population of the cohort to
4,386. The outliers more than doubled the standard deviation (outliers=
6.76 vs. no outliers= 3.3) in the average days of supply. No patients within
the stimulants-only cohort were considered outliers based on the average
100 days’ supply definition. The stimulants only cohort consisted of
37,982 unique patients. Table 2 shows the characteristics of the cohort
with the removal of the three outliers, which was the cohort used for
analysis.
Mean age in the stimulants and depressants cohort was 43.4 years
with a standard deviation of 13 years. The mean age of the stimulants
only cohort was 29.3 years with a standard deviation of 17 years. As
compared by the t-test, the p-value for this difference between the two
15
cohorts was < .0001, showing a statistical significance. The patients in the
stimulants only group tended to be about 14 years younger with a larger
standard deviation.
The stimulants and depressants cohort contained about a 2:1 ratio
of female to male patients, with females making up 67.9% of this
population, reflecting the hypothesis 1 baseline characteristic. The
stimulants only cohort contained almost a 1:1 ratio, with females making
up a slightly higher percentage than the males. The difference between
these two cohorts was tested using the Chi Square Test for Homogeneity,
with a resulting p-value of < .0001, indicating a significant difference
between the stimulants and depressants and stimulants only cohorts
regarding gender, where women constituted a higher percentage than men
in the stimulants and depressants cohort. Pay types were also
significantly different between the two cohorts with a p-value of < .0001
based on the Chi Square Test for Homogeneity. Although they were not
similar with their individual percentages of which pay type, the two
cohorts were similar in their most commonly used pay types. The most
commonly used form of payment in order of most used to least used was:
commercial, private (cash), and then government/other payer. These
results indicate once again, that commercial insurance is the primary payer
for these two cohorts based on chronic use. In addition, two patients did
not have information on pay type. Due to this loss of pay type data for two
patients, there are slight differences in pay type percentages as compared
16
to the cohort in hypothesis 1. In comparison, the stimulants only cohort
had a higher percentage of commercial payers compared with the other
cohort, while also exhibiting lower percentages of government/other payer
and private (cash) payers.
Determining difference in day of supply between the stimulants
and depressants and stimulants only cohorts was the primary objective of
this hypothesis. Figure 3 shows post-removal of outlier data including
breakdown of the population. The stimulants and depressants cohort had a
mean days of supply of 29.7 days and a standard deviation of 3.3 days of
supply. Similarly, the stimulants only cohort had a mean days of supply of
29.6 days and a standard deviation of 3.8 days. Because both cohorts had
an average days of supply of about 30 days and 30 days is a common days
supply for patients filling a chronic medication on a monthly basis, this
timeframe was chosen to later dichotomize the cohorts and compare using
a chi-square test. The difference by percentage in average days of supply
was significant, as showcased by the p-value of <.0001 shown in Figure 3.
We reject the null hypothesis because the p-value (<.0001) is ≤ α (0.05),
indicating that the population variances are significantly different.
Because the variances are unequal, the Satterthwaite t-value (0.2099) is
used. Therefore, there is a difference in days of supply between those who
take both stimulants and depressants chronically compared with those who
fill only stimulants by percentage.
17
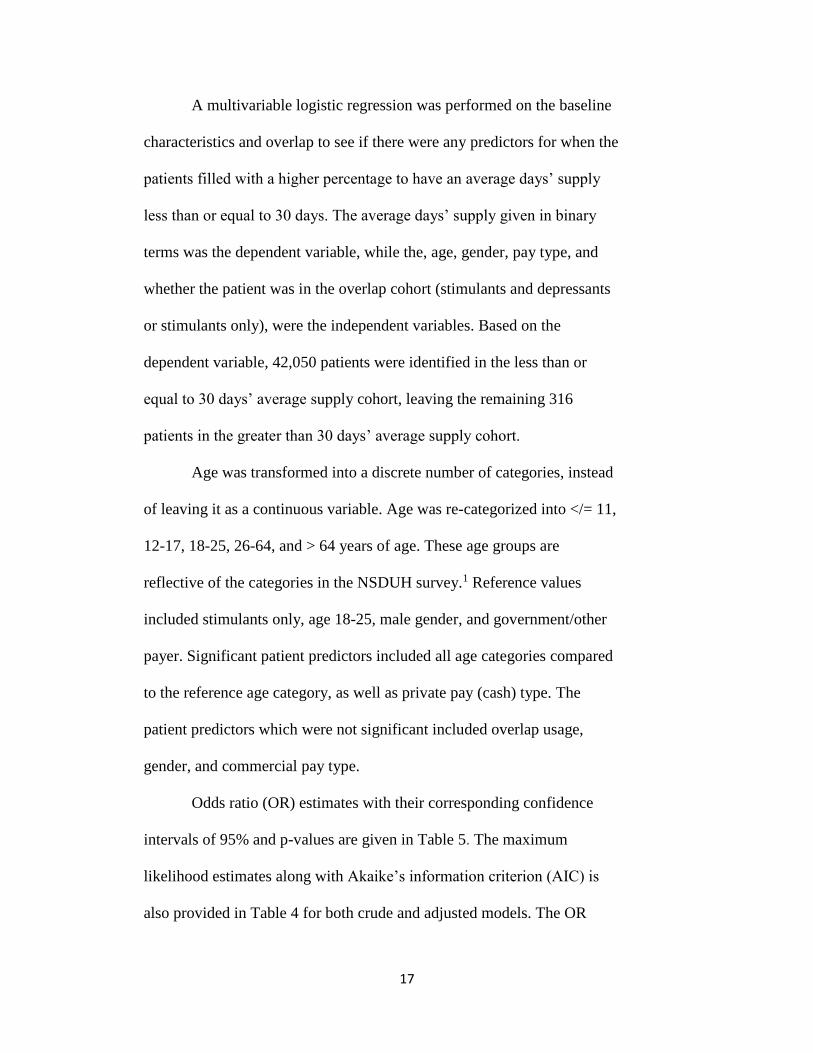
A multivariable logistic regression was performed on the baseline
characteristics and overlap to see if there were any predictors for when the
patients filled with a higher percentage to have an average days’ supply
less than or equal to 30 days. The average days’ supply given in binary
terms was the dependent variable, while the, age, gender, pay type, and
whether the patient was in the overlap cohort (stimulants and depressants
or stimulants only), were the independent variables. Based on the
dependent variable, 42,050 patients were identified in the less than or
equal to 30 days’ average supply cohort, leaving the remaining 316
patients in the greater than 30 days’ average supply cohort.
Age was transformed into a discrete number of categories, instead
of leaving it as a continuous variable. Age was re-categorized into </= 11,
12-17, 18-25, 26-64, and > 64 years of age. These age groups are
reflective of the categories in the NSDUH survey.1 Reference values
included stimulants only, age 18-25, male gender, and government/other
payer. Significant patient predictors included all age categories compared
to the reference age category, as well as private pay (cash) type. The
patient predictors which were not significant included overlap usage,
gender, and commercial pay type.
Odds ratio (OR) estimates with their corresponding confidence
intervals of 95% and p-values are given in Table 5. The maximum
likelihood estimates along with Akaike’s information criterion (AIC) is
also provided in Table 4 for both crude and adjusted models. The OR
18
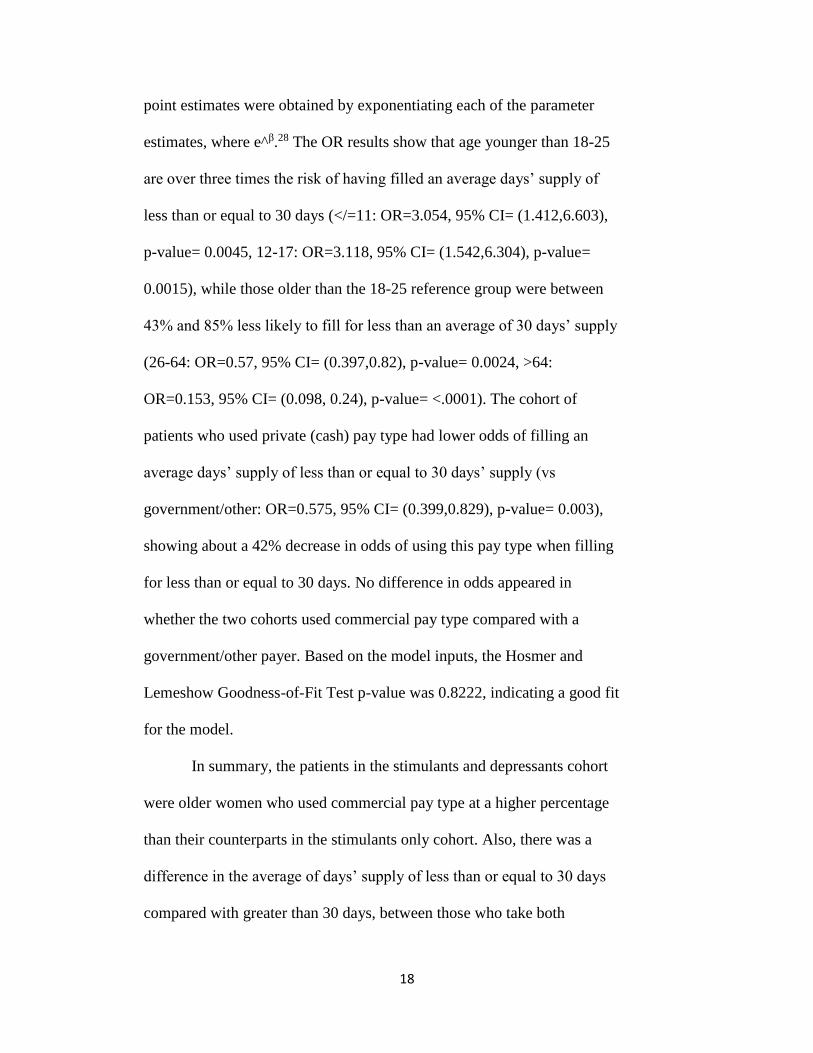
point estimates were obtained by exponentiating each of the parameter
estimates, where e^β.28 The OR results show that age younger than 18-25
are over three times the risk of having filled an average days’ supply of
less than or equal to 30 days (</=11: OR=3.054, 95% CI= (1.412,6.603),
p-value= 0.0045, 12-17: OR=3.118, 95% CI= (1.542,6.304), p-value=
0.0015), while those older than the 18-25 reference group were between
43% and 85% less likely to fill for less than an average of 30 days’ supply
(26-64: OR=0.57, 95% CI= (0.397,0.82), p-value= 0.0024, >64:
OR=0.153, 95% CI= (0.098, 0.24), p-value= <.0001). The cohort of
patients who used private (cash) pay type had lower odds of filling an
average days’ supply of less than or equal to 30 days’ supply (vs
government/other: OR=0.575, 95% CI= (0.399,0.829), p-value= 0.003),
showing about a 42% decrease in odds of using this pay type when filling
for less than or equal to 30 days. No difference in odds appeared in
whether the two cohorts used commercial pay type compared with a
government/other payer. Based on the model inputs, the Hosmer and
Lemeshow Goodness-of-Fit Test p-value was 0.8222, indicating a good fit
for the model.
In summary, the patients in the stimulants and depressants cohort
were older women who used commercial pay type at a higher percentage
than their counterparts in the stimulants only cohort. Also, there was a
difference in the average of days’ supply of less than or equal to 30 days
compared with greater than 30 days, between those who take both
19
stimulants and depressants chronically compared with those who fill only
stimulants. The binary logit model appears to indicate an acceptable level
of fit.
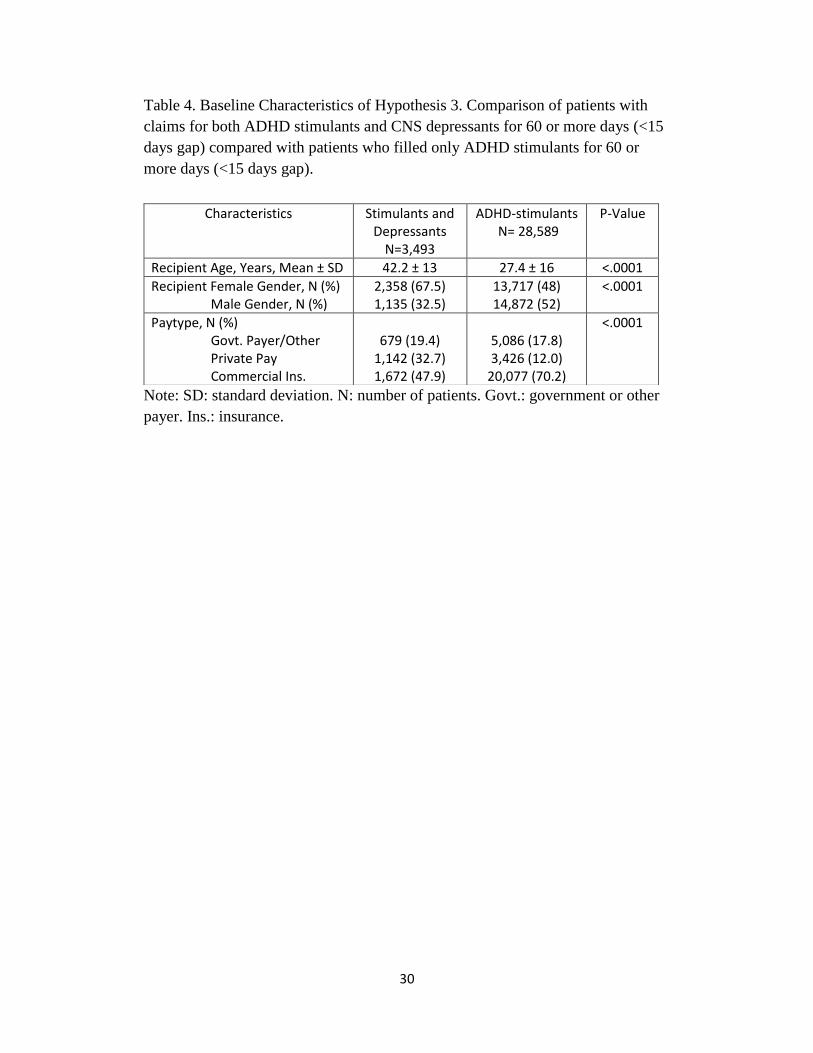
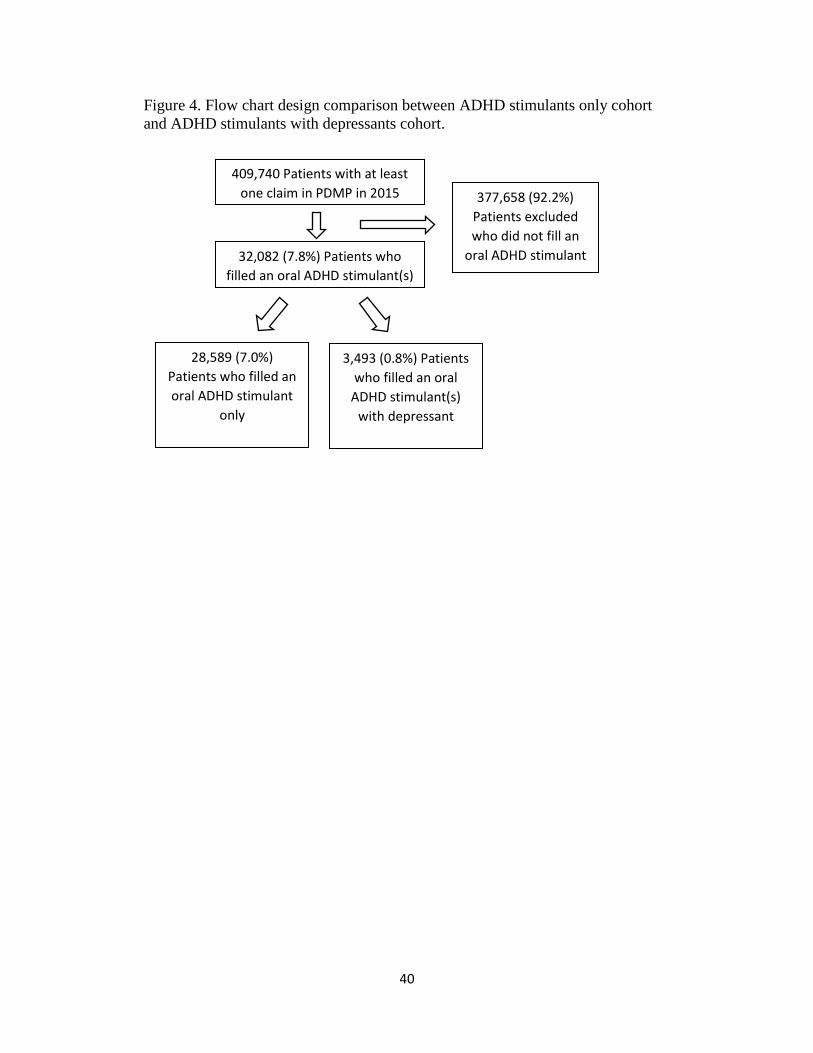
The study population within hypothesis 3 was a smaller cohort derived
from the stimulants only cohort in hypothesis 2, as indicated in Figure 4. The
baseline characteristics are given in Table 4. The mean age for the ADHD-stims
cohort was 27 with a standard deviation of 16 years, while the mean age and
standard deviation for stimulants and depressants was 42 and 13, respectively.
The ADHD stimulants cohort consisted of a significantly higher percent of males
(52%) compared with the stimulants and depressants cohort (32.5%), as measured
by chi square p-value of < .0001. Pay types were also significantly different
between the two cohorts. Commercial insurance was used 70% of the time in the
ADHD-stimulants cohort compared to 48% with the stimulants and depressants
cohort, also measured by p-value <.0001.
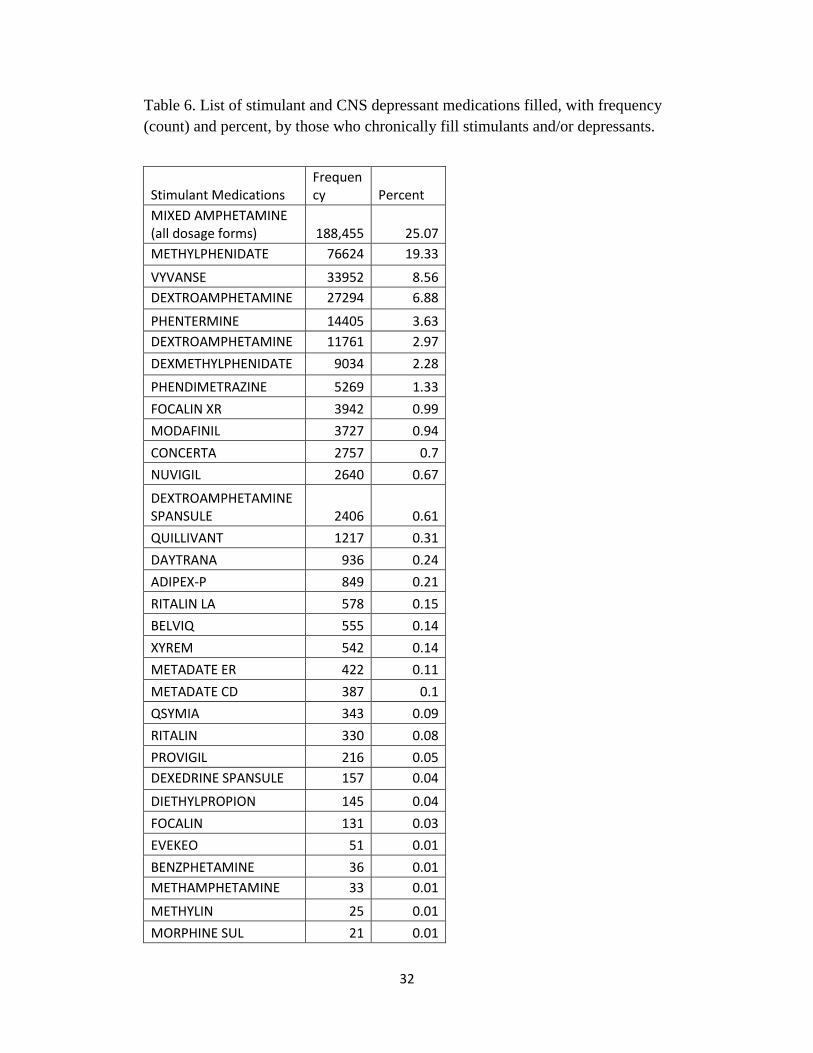
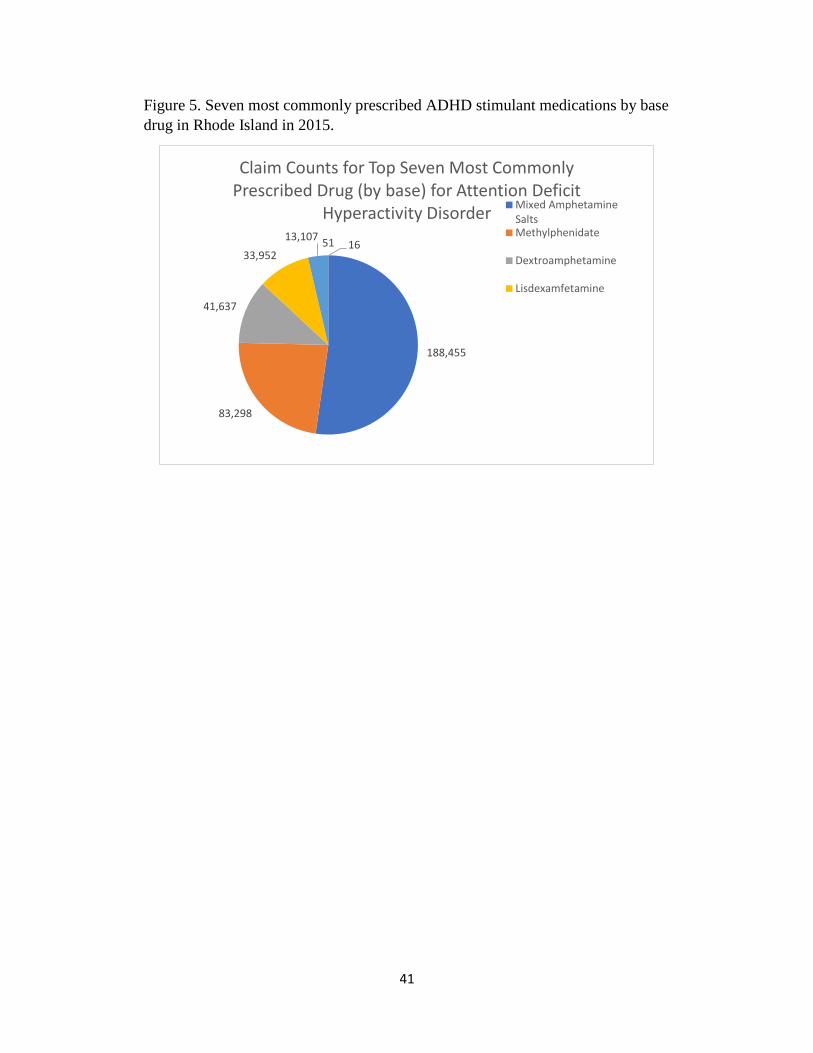
The seven most commonly prescribed ADHD stimulants based on total
claims from the RI PDMP in 2015 are shown in Figure 5. The two main
medication groups studied were stimulants and CNS depressants (Table 6).
However, only mixed amphetamine salts-based and methylphenidate-based
medications were included in this hypothesis as a subpopulation of interest,
deemed ADHD-stimulants. These medication bases were chosen because the
2015 NSDUH stated that they were the two most commonly prescribed stimulant
bases for ADHD in 20151. Bases refers to the underlying active ingredient,
disregarding any corresponding brand names. The population breakdown and
20
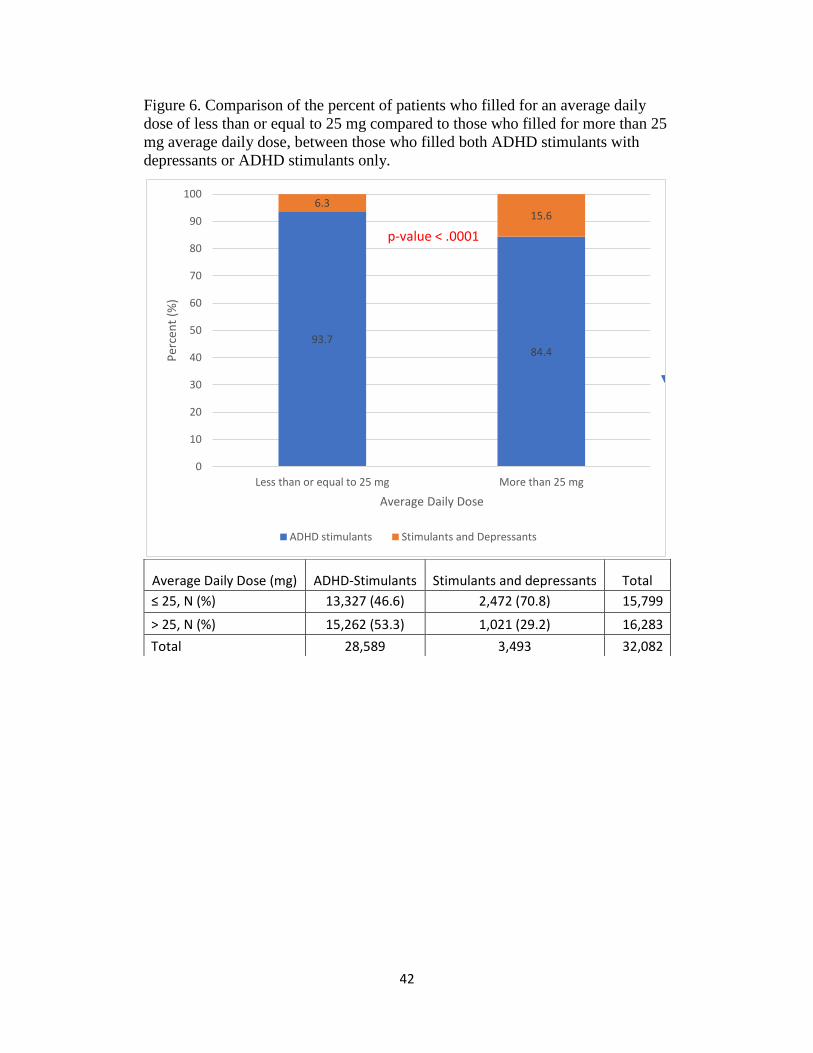
average daily dose in milligrams(mg) is given in Figure 6, comparing the ADHD-
stims cohort with the stimulants and depressants cohort. The ADHD-stimulants
cohort had an average daily dose of 29 mg, while the cohort averaged 39 mg.
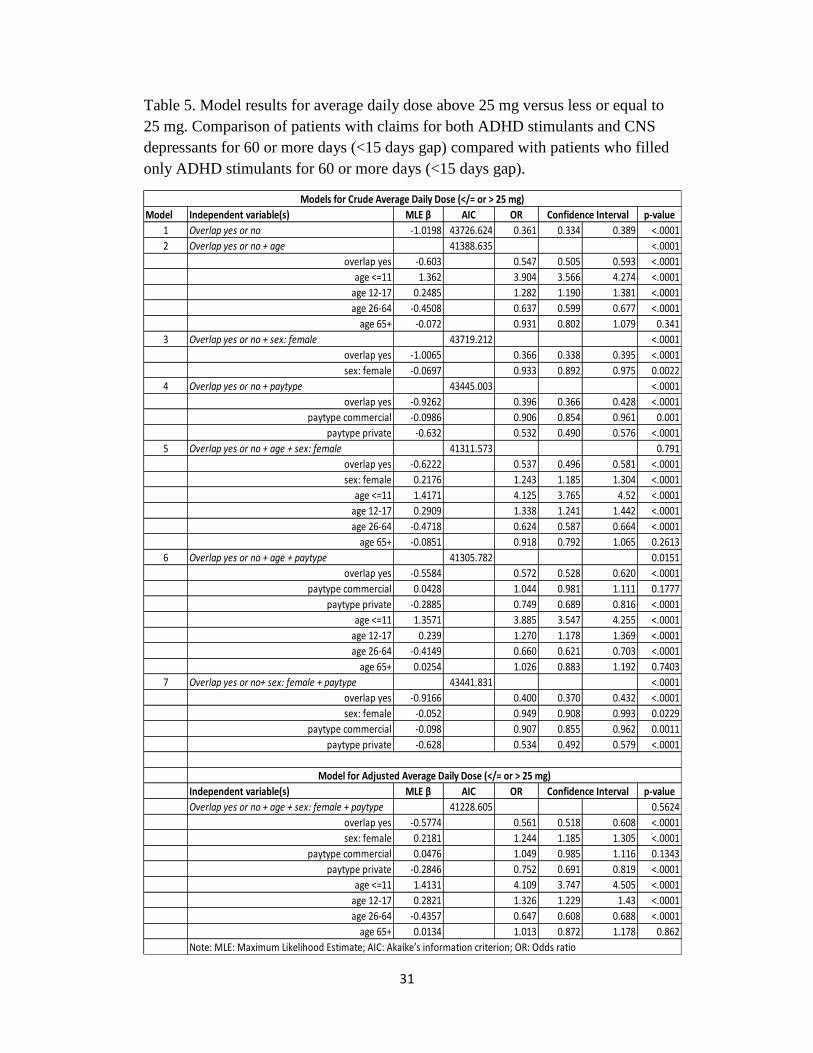
The multivariate logistic regression compared the ADHD-
stimulants cohort to that of stimulants and depressants cohort in a similar
manner as in hypothesis 2. As such, odds ratios (OR) were measured upon
the same variables of sex, age by group, and pay type. However, because
this hypothesis was based on average daily dose, the dependent variable
was dichotomized based on an average daily dose; less than or equal to 25
mg or greater than 25 mg. This dichotomization reflected the median
average daily dose for the ADHD-stims cohort (24.5 mg). Reference
values included ADHD-stims, age 18-25, male gender, and
government/other payer. Significant patient predictors cohort, sex, ages
less than 18 or age 26 to 64, and private pay type. The patient predictors
which were not significant included age greater than 64 and commercial
pay type.
Odds ratio estimates with their corresponding confidence intervals
of 95% and p-values are given in Table 6. The maximum likelihood
estimates along with Akaike’s information criterion (AIC) is also provided
in Table 6 for both crude and adjusted models. The OR results show that
females had a 24% increase in odds (vs. males: OR= 1.244, 95% CI=
(1.185,1.305), p-value= <.0001). Patients aged </=11 compared with age
18-25 had four times greater odds or three times increased risk
21
(OR=4.109, 95% CI= (3.747,4.505, p-value= <.0001), and those aged 12-
17 compared with 18-15 had a 32% increase in odds (OR=1.326, 95% CI=
(1.229,1.43), p-value= <.0001) of filling less than 25 mg average daily
dose of stimulants. The OR results show that the S&D cohort had 44%
decreased odds of filling less than 25 mg for their average daily dose (vs.
ADHD-stims: OR=0.561, 05% CI= (0.518,0.608), p-value= <.0001).
Private (cash) payers compared with government/other payers had 25%
decreased odds (OR=0.752, 95% CI= (0.691,0.819), p-value= <.0001) of
filling 25 mg average daily dose. Patients aged 26-64 compared with 18-
25-year-old patients had a 35% decrease in odds (OR=0.647, 95% CI=
(0.608,0.688), p-value= <.0001) of filling for 25 mg average daily dose.
The Hosmer and Lemeshow Goodness-of-Fit Test p-value was 0.0111,
indicating a less than acceptable level of fit for the model.
In summary, the ADHD-stimulants cohort was younger, had a
lower average daily dose of stimulant, more likely to be of male sex, and
use commercial insurance as the primary pay type compared to the
stimulants and depressants cohort. However, the Goodness-of-Fit Test
showed a less than acceptable level of fit for the model.
22
CHAPTER 5
DISCUSSION
Over 400,000 patients filled more than 2.5 million prescriptions, captured
by the RI PDMP for calendar year 2015. In all hypotheses, the number of patients
falling under the overlap definition was far fewer than the comparative cohorts.
The patients in the overlap cohort in hypothesis 1 tended to be younger women,
who used commercial insurance more frequently than their counterparts. Patients
in hypothesis 2 in the stimulants and depressants cohort were mostly older women
(mean age 43.4 years old +/- 13 years) who used commercial pay type at a higher
percentage than their counterparts in the stimulants-only cohort. A difference
existed in the percent of patients who filled for an average of days’ supply of less
than or equal to 30 days compared with greater than 30 days between those who
filled both stimulants and depressants chronically compared with those who filled
only stimulants. The stimulants only cohort was younger, on average, possibly
because ADHD stimulants are primarily prescribed to younger patients. The
average age at onset of ADHD is seven years old, while ADHD symptoms often
improve for many people with increasing age.29 However, this hypothesis also
contained stimulants for diagnoses other than ADHD, including weight loss and
narcolepsy.
Hypothesis 3 was based on a subpopulation of hypothesis 2. The ADHD-
stimulants cohort was younger with a lower average daily dose of stimulant, more
likely to be males, and use commercial insurance as the primary pay type
compared to the usage of stimulants in the S&D cohort. Research supports the
23
finding that the ADHD stimulants cohort should be comprised of mostly younger
males as reported by Merikangas et al.30 This study reported that males 13-18
years of age have a lifetime prevalence of 12.9% compared with females 13-18
years of age of 4.9%, with children 13-18 having an overall lifetime prevalence
higher than adults.31 In the State of Rhode Island, children aged 4-17 having ever
been diagnosed with ADHD rose steadily from year 2003 to 2007 to 2011, with
corresponding percentages of 9.8, 11.1 and 13.4%, respectively.31 Children in
Rhode Island in a similar age group (4-17 years old) which were reported by a
parent as currently diagnosed with ADHD, also revealed that these children had a
higher than average current diagnosis percentage (2011: RI 11.1% vs. U.S. 8.8%)
and a higher percentage of children taking ADHD medication (2011: RI 6.3% vs.
U.S. 6.1%) as compared to the average of all children in the United States.32
By focusing on the two most commonly prescribed stimulants, which were
also estimated to be the two most prescribed medications for ADHD1 in 2015, we
sought whether patients using these two medications differed from those filling a
combination of ADHD stimulants and depressants. The results showed that those
in the stimulants only cohort had a lower percent for their average daily dose
below 25 mg. This could have been for several reasons. One reason may be that
younger patients may not require as high a dose as older patients based on
severity of disorder or disease. Research indicates ADHD symptoms only persist
in about half of patients into adulthood.33,34 This 50% could be the more severe
cases of patients, who then may require higher doses of the ADHD stimulants
later in life. In addition, a study by Merikangas et al reported that children 13-18
24
years old have a 1.8% lifetime prevalence of severe ADHD, while Kessler et al
reported that adults have a 1.7% lifetime prevalence of severe ADHD.30,35
Another possibility is that older patients may develop greater tolerance over the
course of their lifetime or therapy and require higher doses over time. Tolerance is
defined by the National Institute on Drug Abuse as “when the person no longer
responds to the drug in the way that person initially responded”.36 Another reason
may be that those patients filling depressants may need higher doses of stimulants
to counteract the sedating effects of the depressants, hypothesized once again, due
to tolerance. In this situation, a concern can be raised that as patients require
higher doses of CNS depressants, they may also treat the worsening of adverse
effects with stimulants. For example, a patient may become tolerant to their
opioid and begin to escalate their dose to cover their increase in pain. As the
patient does this, they may also experience more sedating effects from the opioid.
To counter those effects the patient may begin taking more of a (prescribed)
stimulant, which helps keep them awake, alert, and/or capable of performing their
usual daily tasks. Unfortunately, the patient may reach a tipping point where the
self-medicating titration of the combination exposes the patient to a toxic level of
one, either, or both medications. In the case of an opioid, this may result in
respiratory depression, coma, or death, as referenced above.3,4
A limitation of this study is lack of certain patient health information,
primarily diagnosis codes. Initial diagnosis(es) of patients’ health conditions were
not recorded, nor were pertinent other medications which may lead to a better
understanding of severity of the patients’ disorders. A difference in percent of
25
average daily dose could simply be due to severity of mental illness or learning
disability. A differential diagnosis should rule out major depression, bipolar
disorder, generalized anxiety, substance abuse or dependence, or personality
disorders.37 For example, a patient with a more debilitating form of ADHD may
require higher doses of their stimulant to reduce the symptoms of their disease.
Additionally, data within the PDMP did not differentiate human from animal
claims data. As such, it is believed that a small portion of the claims may have
included animal patients, which may have influenced the number of private pay
claims.
By choosing the first claim for each patient to specify age, gender, and
paytype, there is a possibility of misrepresenting the patients’ true demographics.
For instance, if a pharmacy placed a claim for a female as male for the first claim,
but later corrected it for the other fills, the corrected gender would not be
represented. By choosing the patients’ first age, there may have also been a
tendency to have an overall younger population. Following gender and age,
paytype may have also been biased towards one payment type over the others and
may account for the large percentage of cash payers. One explanation for this is if
the claims tended to be earlier in the year when patients did not have insurance
coverage, they may have paid the cash price for their medication(s). Another
possibility regarding pay type is that patients may be in and out of the work force
throughout the year, gaining and losing insurance coverage for a certain period.
This may have also increased the percentage of cash payers in the population.
26
Another limitation involves lack of distinction of different CNS
depressants classes. This study first started by creating depressant groups based
on therapeutic class code, but did not differentiate by class or by the drug itself.
Conducting a study based upon individual drugs was beyond the scope of this
research, but could be considered for future investigation.
This study has several strengths, primarily that it was the first study based
on the RI PDMP which sought to discover relationships between chronic
concomitant therapy of controlled substance CNS stimulants with CNS
depressants and underlying demographics. One relationship was the average days’
supply, comparing the overlap cohort with that of those who only take stimulants.
The other relationship was whether there was a difference in average daily dose
for patients who had claims for both stimulants and depressants compared with
those who had claims only for ADHD stimulants. By researching these two
relationships, forward-looking hypotheses of interest can be developed.
One potential hypothesis would question the importance of time to
diagnosis for a health condition regarding another health condition. The patient
could be followed in time to see if doses increase (or decrease) on average over
time. For example, if a patient begins taking a CNS depressant, such as an opioid
for a pain syndrome, do they also begin taking a stimulant? How long after
initiation does this concomitant therapy begin? If so, was this due to (1) excessive
sedation from the opioid or (2) was this for an entirely separate and new
diagnosis, for example, ADHD? Conversely, if a patient begins with a diagnosis
of ADHD, and then develops insomnia, are the two health conditions related?
27
Was the added therapy part of treatment for an underlying sleep disorder, or was
it to alter the effects of the ADHD stimulant? These relationships can add insight
into whether patients are being treated for underlying diseases or to “medicate a
medication”.
This study was designed to help describe a subset of the RI population
which chronically fills both stimulants and CNS depressants. The value of this
study comes from its ability to lay groundwork for future research into combined
utilization of stimulants and depressants. Future work could include researching
specific medication combinations, i.e., methylphenidate with oxycodone, or
zolpidem with mixed amphetamine salts. Future work may also include a data set
which is more robust, and includes other patient demographics such as
socioeconomic status, race/ethnicity, and comorbid conditions.
28
APPENDIX 1: TABLES
Table 1. Baseline characteristics for Hypothesis 1. Comparison of patients with
claims for both stimulants and depressants for 60 or more days (<15 days gap)
“overlap yes” compared with patients with less than 60 days overlap (<15 days
gap) “overlap no”.
Characteristics Overlap Yes N=4,389
Overlap No N=127,087
P Value
Recipient Age, Years, Mean ± SD 43.4 ± 13.1 48.6 ± 21.1 < .0001
Recipient Female Gender, N (%) Male Gender, N (%)
2,979 (67.9) 1,410 (32.1)
73,401 (57.8) 53,670 (42.2)
< .0001
Paytype, N (%) Govt. Payer/Other Private pay Commercial Ins.
787 (18.0) 1,440 (32.8) 2,160 (49.2)
25,929 (20.4) 30,662 (24.1) 70,494 (55.5)
< .0001
Note: SD: standard deviation. N: number of patients. Govt.: government or other
payer. Ins.: insurance.
Table 2. Baseline characteristics for Hypothesis 2 (excluding outliers).
Comparison of patients with claims for both stimulants and depressants for 60 or
more days (<15 days gap) compared to patients who filled only stimulants for 60
or more days (<15 days gap).
Note: ‡N= Two ‘paytype’ missing from missing data. †N= Three outliers
removed. SD: standard deviation. N: number of patients. Govt.: government or
other payer. Ins.: insurance.
Characteristics Stimulants and Depressants‡
N=4,386†
Stimulants-only N= 37,982
P-Value
Recipient Age, Years, Mean ± SD
43.4 ± 13 29.3 ± 17 <.0001
Recipient Female Gender, N (%) Male Gender, N (%)
2,978 (67.9) 1,408 (32.1)
19,254 (50.7) 18,728 (49.3)
<.0001
Paytype‡, N (%) Govt. Payer/Other Private Pay Commercial Ins.
787 (17.9)
1,437 (32.8) 2,160 (49.3)
5,857 (15.4) 6,049 (15.9)
26,076 (68.7)
<.0001

29
Table 3. Model results for average days of supply more than 30 days versus less
than and equal to 30 days. Comparison of patients with claims for both stimulants
and depressants for 60 or more days (<15 days gap) compared with patients who
filled only stimulants for 60 or more days (<15 days gap).
Model Independent variables(s) MLE β AIC OR p-value
1 Overlap yes or no -0.6728 3711.082 0.510 0.383 0.680 <.0001
2 Overlap yes or no + age 3543.408 <.0001
overlap yes -0.2405 0.786 0.587 1.052 0.1061
age <=11 1.1541 3.171 1.473 6.829 0.0032
age 12-17 1.1751 3.238 1.606 6.532 0.001
age 26-64 -0.6695 0.512 0.358 0.732 0.0002
age 65+ -2.0584 0.128 0.083 0.197 <.0001
3 Overlap yes or no + sex: female 3704.254 <.0001
overlap yes -0.616 0.540 0.405 0.721 <.0001
sex: female -0.3447 0.708 0.563 0.892 0.0033
4 Overlap yes or no + paytype 3658.767 <.0001
overlap yes -0.4815 0.618 0.461 0.827 0.0012
paytype commercial 0.0365 1.037 0.732 1.469 0.8369
paytype private -0.914 0.401 0.279 0.576 <.0001
5 Overlap yes or no + age + sex: female 3545.284 <.0001
overlap yes -0.2388 0.788 0.588 1.055 0.1088
sex: female -0.0419 0.959 0.760 1.210 0.7244
age <=11 1.1439 3.139 1.455 6.774 0.0036
age 12-17 1.1668 3.212 1.590 6.488 0.0011
age 26-64 -0.6641 0.515 0.360 0.737 0.0003
age 65+ -2.0542 0.128 0.083 0.198 <.0001
6 Overlap yes or no + age + paytype 3527.796 <.0001
overlap yes -0.1939 0.824 0.614 1.104 0.1949
paytype commercial -0.00135 0.999 0.701 1.423 0.994
paytype private -0.5539 0.575 0.399 0.829 0.003
age <=11 1.1187 3.061 1.419 6.605 0.0044
age 12-17 1.1392 3.124 1.548 6.307 0.0015
age 26-64 -0.5625 0.570 0.397 0.818 0.0023
age 65+ -1.876 0.153 0.098 0.240 <.0001
7 Overlap yes or no + sex: female + paytype 3656.187 <.0001
overlap yes -0.4536 0.635 0.474 0.851 0.0024
sex: female -0.2507 0.778 0.617 0.981 0.0338
paytype commercial 0.0402 1.041 0.735 1.474 0.8211
paytype private -0.8772 0.416 0.289 0.598 <.0001
Independent variables(s) MLE β AIC OR p-value
Overlap yes or no + age + sex: female + paytype 3529.789 <.0001
overlap yes -0.1937 0.824 0.614 1.105 0.1956
sex: female -0.00959 0.990 0.784 1.251 0.9358
paytype commercial -0.00154 0.998 0.701 1.423 0.9932
paytype private -0.5534 0.575 0.399 0.829 0.0030
age <=11 1.1164 3.054 1.412 6.603 0.0045
age 12-17 1.1373 3.118 1.542 6.304 0.0015
age 26-64 -0.5614 0.570 0.397 0.820 0.0024
age 65+ -1.8751 0.153 0.098 0.240 <.0001
Note: MLE: Maximum Likelihood Estimate; AIC: Akaike’s information criterion; OR: Odds ratio
Confidence Interval
Models for Crude Average Days of Supply (</= or > 30 days)
Model for Adjusted Average Days of Supply (</= or > 30 days)
Confidence Interval
30
Table 4. Baseline Characteristics of Hypothesis 3. Comparison of patients with
claims for both ADHD stimulants and CNS depressants for 60 or more days (<15
days gap) compared with patients who filled only ADHD stimulants for 60 or
more days (<15 days gap).
Note: SD: standard deviation. N: number of patients. Govt.: government or other
payer. Ins.: insurance.
Characteristics Stimulants and Depressants
N=3,493
ADHD-stimulants N= 28,589
P-Value
Recipient Age, Years, Mean ± SD 42.2 ± 13 27.4 ± 16 <.0001
Recipient Female Gender, N (%) Male Gender, N (%)
2,358 (67.5) 1,135 (32.5)
13,717 (48) 14,872 (52)
<.0001
Paytype, N (%) Govt. Payer/Other Private Pay Commercial Ins.
679 (19.4)
1,142 (32.7) 1,672 (47.9)
5,086 (17.8) 3,426 (12.0)
20,077 (70.2)
<.0001
31
Table 5. Model results for average daily dose above 25 mg versus less or equal to
25 mg. Comparison of patients with claims for both ADHD stimulants and CNS
depressants for 60 or more days (<15 days gap) compared with patients who filled
only ADHD stimulants for 60 or more days (<15 days gap).
Model Independent variable(s) MLE β AIC OR p-value
1 Overlap yes or no -1.0198 43726.624 0.361 0.334 0.389 <.0001
2 Overlap yes or no + age 41388.635 <.0001
overlap yes -0.603 0.547 0.505 0.593 <.0001
age <=11 1.362 3.904 3.566 4.274 <.0001
age 12-17 0.2485 1.282 1.190 1.381 <.0001
age 26-64 -0.4508 0.637 0.599 0.677 <.0001
age 65+ -0.072 0.931 0.802 1.079 0.341
3 Overlap yes or no + sex: female 43719.212 <.0001
overlap yes -1.0065 0.366 0.338 0.395 <.0001
sex: female -0.0697 0.933 0.892 0.975 0.0022
4 Overlap yes or no + paytype 43445.003 <.0001
overlap yes -0.9262 0.396 0.366 0.428 <.0001
paytype commercial -0.0986 0.906 0.854 0.961 0.001
paytype private -0.632 0.532 0.490 0.576 <.0001
5 Overlap yes or no + age + sex: female 41311.573 0.791
overlap yes -0.6222 0.537 0.496 0.581 <.0001
sex: female 0.2176 1.243 1.185 1.304 <.0001
age <=11 1.4171 4.125 3.765 4.52 <.0001
age 12-17 0.2909 1.338 1.241 1.442 <.0001
age 26-64 -0.4718 0.624 0.587 0.664 <.0001
age 65+ -0.0851 0.918 0.792 1.065 0.2613
6 Overlap yes or no + age + paytype 41305.782 0.0151
overlap yes -0.5584 0.572 0.528 0.620 <.0001
paytype commercial 0.0428 1.044 0.981 1.111 0.1777
paytype private -0.2885 0.749 0.689 0.816 <.0001
age <=11 1.3571 3.885 3.547 4.255 <.0001
age 12-17 0.239 1.270 1.178 1.369 <.0001
age 26-64 -0.4149 0.660 0.621 0.703 <.0001
age 65+ 0.0254 1.026 0.883 1.192 0.7403
7 Overlap yes or no+ sex: female + paytype 43441.831 <.0001
overlap yes -0.9166 0.400 0.370 0.432 <.0001
sex: female -0.052 0.949 0.908 0.993 0.0229
paytype commercial -0.098 0.907 0.855 0.962 0.0011
paytype private -0.628 0.534 0.492 0.579 <.0001
Independent variable(s) MLE β AIC OR p-value
Overlap yes or no + age + sex: female + paytype 41228.605 0.5624
overlap yes -0.5774 0.561 0.518 0.608 <.0001
sex: female 0.2181 1.244 1.185 1.305 <.0001
paytype commercial 0.0476 1.049 0.985 1.116 0.1343
paytype private -0.2846 0.752 0.691 0.819 <.0001
age <=11 1.4131 4.109 3.747 4.505 <.0001
age 12-17 0.2821 1.326 1.229 1.43 <.0001
age 26-64 -0.4357 0.647 0.608 0.688 <.0001
age 65+ 0.0134 1.013 0.872 1.178 0.862
Note: MLE: Maximum Likelihood Estimate; AIC: Akaike’s information criterion; OR: Odds ratio
Confidence Interval
Models for Crude Average Daily Dose (</= or > 25 mg)
Model for Adjusted Average Daily Dose (</= or > 25 mg)
Confidence Interval
32
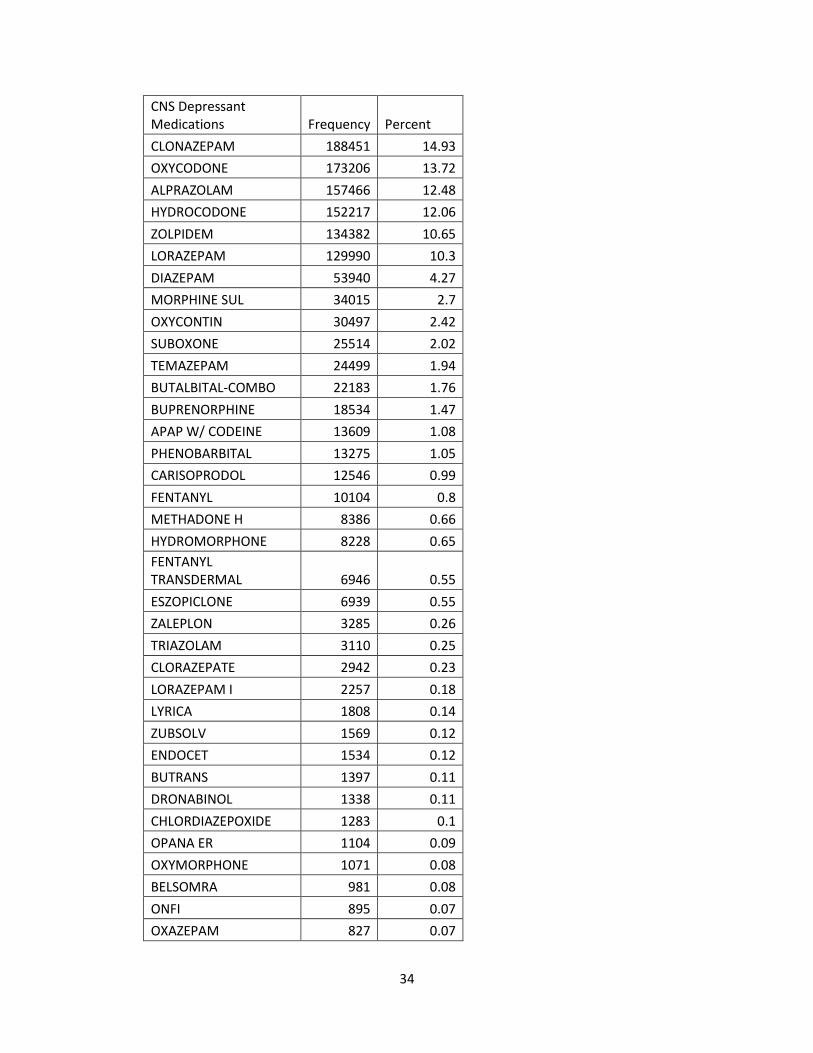
Table 6. List of stimulant and CNS depressant medications filled, with frequency
(count) and percent, by those who chronically fill stimulants and/or depressants.
Stimulant Medications Frequency Percent
MIXED AMPHETAMINE (all dosage forms) 188,455 25.07
METHYLPHENIDATE 76624 19.33
VYVANSE 33952 8.56
DEXTROAMPHETAMINE 27294 6.88
PHENTERMINE 14405 3.63
DEXTROAMPHETAMINE 11761 2.97
DEXMETHYLPHENIDATE 9034 2.28
PHENDIMETRAZINE 5269 1.33
FOCALIN XR 3942 0.99
MODAFINIL 3727 0.94
CONCERTA 2757 0.7
NUVIGIL 2640 0.67
DEXTROAMPHETAMINE SPANSULE 2406 0.61
QUILLIVANT 1217 0.31
DAYTRANA 936 0.24
ADIPEX-P 849 0.21
RITALIN LA 578 0.15
BELVIQ 555 0.14
XYREM 542 0.14
METADATE ER 422 0.11
METADATE CD 387 0.1
QSYMIA 343 0.09
RITALIN 330 0.08
PROVIGIL 216 0.05
DEXEDRINE SPANSULE 157 0.04
DIETHYLPROPION 145 0.04
FOCALIN 131 0.03
EVEKEO 51 0.01
BENZPHETAMINE 36 0.01
METHAMPHETAMINE 33 0.01
METHYLIN 25 0.01
MORPHINE SUL 21 0.01
33
DESOXYN 16 0
ZENZEDI 14 0
APTENSIO XR 9 0
RITALIN-SR 8 0
BONTRIL PDM 6 0
METHYLIN ER 5 0
PROCENTRA 5 0
SUPRENZA 3 0
34
CNS Depressant Medications Frequency Percent
CLONAZEPAM 188451 14.93
OXYCODONE 173206 13.72
ALPRAZOLAM 157466 12.48
HYDROCODONE 152217 12.06
ZOLPIDEM 134382 10.65
LORAZEPAM 129990 10.3
DIAZEPAM 53940 4.27
MORPHINE SUL 34015 2.7
OXYCONTIN 30497 2.42
SUBOXONE 25514 2.02
TEMAZEPAM 24499 1.94
BUTALBITAL-COMBO 22183 1.76
BUPRENORPHINE 18534 1.47
APAP W/ CODEINE 13609 1.08
PHENOBARBITAL 13275 1.05
CARISOPRODOL 12546 0.99
FENTANYL 10104 0.8
METHADONE H 8386 0.66
HYDROMORPHONE 8228 0.65
FENTANYL TRANSDERMAL 6946 0.55
ESZOPICLONE 6939 0.55
ZALEPLON 3285 0.26
TRIAZOLAM 3110 0.25
CLORAZEPATE 2942 0.23
LORAZEPAM I 2257 0.18
LYRICA 1808 0.14
ZUBSOLV 1569 0.12
ENDOCET 1534 0.12
BUTRANS 1397 0.11
DRONABINOL 1338 0.11
CHLORDIAZEPOXIDE 1283 0.1
OPANA ER 1104 0.09
OXYMORPHONE 1071 0.08
BELSOMRA 981 0.08
ONFI 895 0.07
OXAZEPAM 827 0.07
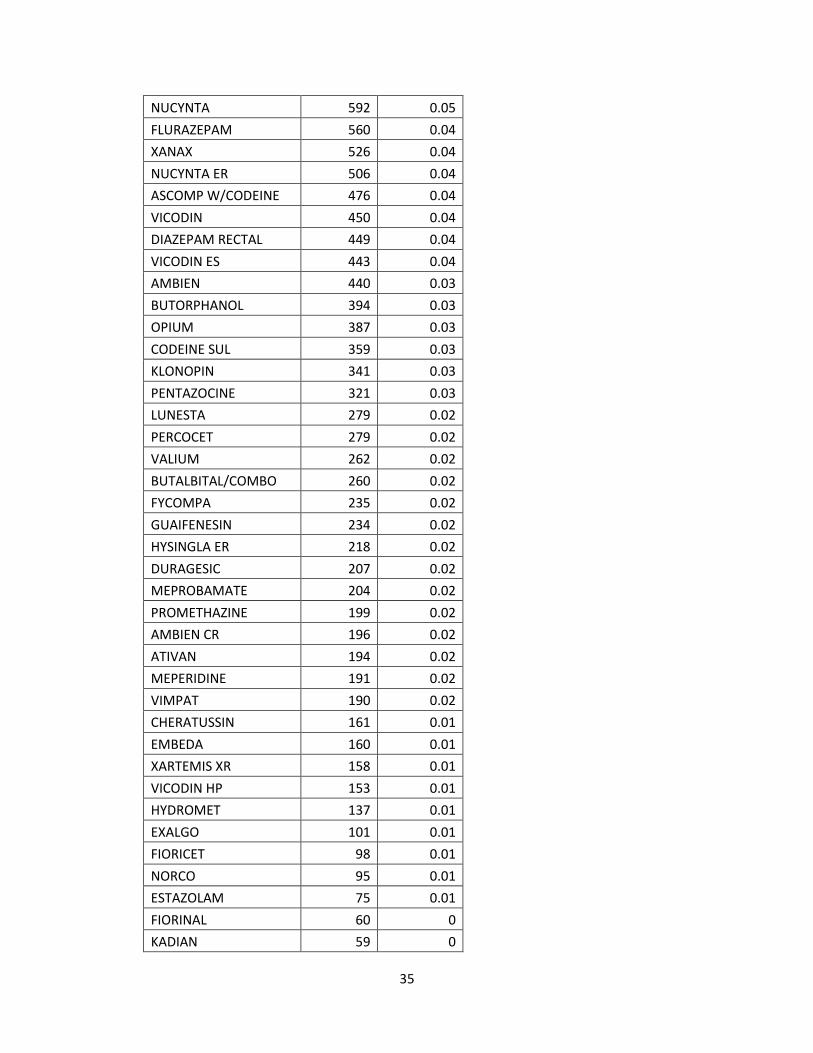
35
NUCYNTA 592 0.05
FLURAZEPAM 560 0.04
XANAX 526 0.04
NUCYNTA ER 506 0.04
ASCOMP W/CODEINE 476 0.04
VICODIN 450 0.04
DIAZEPAM RECTAL 449 0.04
VICODIN ES 443 0.04
AMBIEN 440 0.03
BUTORPHANOL 394 0.03
OPIUM 387 0.03
CODEINE SUL 359 0.03
KLONOPIN 341 0.03
PENTAZOCINE 321 0.03
LUNESTA 279 0.02
PERCOCET 279 0.02
VALIUM 262 0.02
BUTALBITAL/COMBO 260 0.02
FYCOMPA 235 0.02
GUAIFENESIN 234 0.02
HYSINGLA ER 218 0.02
DURAGESIC 207 0.02
MEPROBAMATE 204 0.02
PROMETHAZINE 199 0.02
AMBIEN CR 196 0.02
ATIVAN 194 0.02
MEPERIDINE 191 0.02
VIMPAT 190 0.02
CHERATUSSIN 161 0.01
EMBEDA 160 0.01
XARTEMIS XR 158 0.01
VICODIN HP 153 0.01
HYDROMET 137 0.01
EXALGO 101 0.01
FIORICET 98 0.01
NORCO 95 0.01
ESTAZOLAM 75 0.01
FIORINAL 60 0
KADIAN 59 0
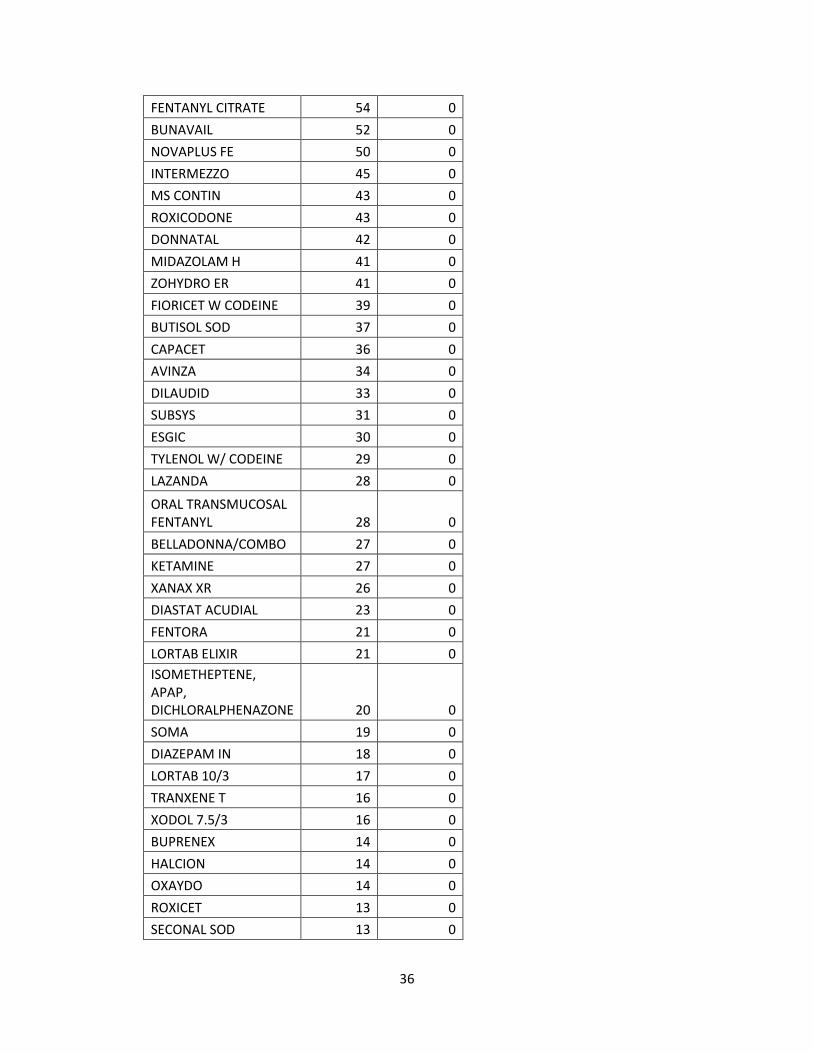
36
FENTANYL CITRATE 54 0
BUNAVAIL 52 0
NOVAPLUS FE 50 0
INTERMEZZO 45 0
MS CONTIN 43 0
ROXICODONE 43 0
DONNATAL 42 0
MIDAZOLAM H 41 0
ZOHYDRO ER 41 0
FIORICET W CODEINE 39 0
BUTISOL SOD 37 0
CAPACET 36 0
AVINZA 34 0
DILAUDID 33 0
SUBSYS 31 0
ESGIC 30 0
TYLENOL W/ CODEINE 29 0
LAZANDA 28 0
ORAL TRANSMUCOSAL FENTANYL 28 0
BELLADONNA/COMBO 27 0
KETAMINE 27 0
XANAX XR 26 0
DIASTAT ACUDIAL 23 0
FENTORA 21 0
LORTAB ELIXIR 21 0
ISOMETHEPTENE, APAP, DICHLORALPHENAZONE 20 0
SOMA 19 0
DIAZEPAM IN 18 0
LORTAB 10/3 17 0
TRANXENE T 16 0
XODOL 7.5/3 16 0
BUPRENEX 14 0
HALCION 14 0
OXAYDO 14 0
ROXICET 13 0
SECONAL SOD 13 0
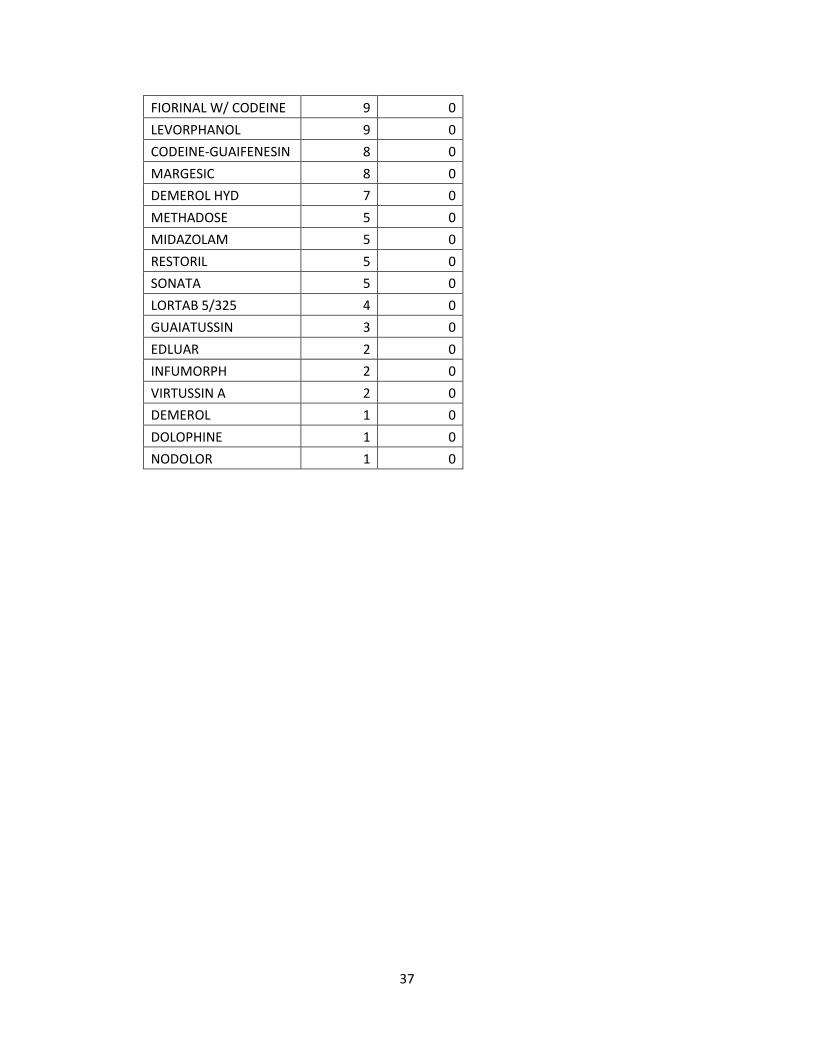
37
FIORINAL W/ CODEINE 9 0
LEVORPHANOL 9 0
CODEINE-GUAIFENESIN 8 0
MARGESIC 8 0
DEMEROL HYD 7 0
METHADOSE 5 0
MIDAZOLAM 5 0
RESTORIL 5 0
SONATA 5 0
LORTAB 5/325 4 0
GUAIATUSSIN 3 0
EDLUAR 2 0
INFUMORPH 2 0
VIRTUSSIN A 2 0
DEMEROL 1 0
DOLOPHINE 1 0
NODOLOR 1 0
38
APPENDIX 2: FIGURES
Figure 1. Flow chart design for Overlap Yes vs. Overlap no cohorts.
Figure 2. Flow chart design for comparison between stimulants and depressants
cohort and stimulants only cohort.
409,740 Patients with at least
one claim in PDMP in 2015
131,476 (32.1%) Patients who filled a
stimulant or CNS depressant (2015)
4,791 (1.2%) Patients who filled a
stimulant and CNS depressant with at
least one overlapping day
4,389 (1.1%) Patients who filled a
stimulant and CNS depressant for at
least 60 days overlapping with no
more than a 15-day gap
409,740 Patients with at least
one claim in PDMP in 2015
42,371 (10.3%) Patients who
filled a stimulant(s) with or
without depressant(s)
37,982 (9.2%) Patients who
filled a stimulant(s) only 4,386 (1.1%) Patients who filled
a stimulant(s) with a
depressant(s)
278,264 (67.9%)
Patients excluded
who did not fill a
stimulant or
depressant
126,685 (30.9%)
Patients excluded
who filled for 0
overlapping days
402 (0.1%)Patients
excluded who filled
for between 0 and
60 days overlapping
367,369 (89.7%)
Patients excluded
who did not fill for a
stimulant
3 Patient outliers
removed
39
Figure 3. Percent of patients who filled for an average of ≤ 30 days or > 30 days.
Comparison between those who filled both stimulants and depressants or
stimulants only. An accompanying
table of number of patients in each cohort is listed below.
89.781.7
10.318.3
0
10
20
30
40
50
60
70
80
90
100
≤ to 30 days > 30 days
Per
cen
t (%
)
Average Days of Supply
Stimulants only Stimulants and Depressants
p-value < .0001
Average Days of Supply Stimulants only
N= 37,982 Stimulants and Depressants
N= 4,386 Total
≤ 30, N (%) 37,724 (89.7) 4,328 (10.3) 42052
> 30, N (%) 258 (81.7) 58 (18.3%) 316
40
Figure 4. Flow chart design comparison between ADHD stimulants only cohort
and ADHD stimulants with depressants cohort.
409,740 Patients with at least
one claim in PDMP in 2015
32,082 (7.8%) Patients who
filled an oral ADHD stimulant(s)
28,589 (7.0%)
Patients who filled an
oral ADHD stimulant
only
3,493 (0.8%) Patients
who filled an oral
ADHD stimulant(s)
with depressant
377,658 (92.2%)
Patients excluded
who did not fill an
oral ADHD stimulant
41
Figure 5. Seven most commonly prescribed ADHD stimulant medications by base
drug in Rhode Island in 2015.
188,455
83,298
41,637
33,952
13,10751 16
Claim Counts for Top Seven Most Commonly Prescribed Drug (by base) for Attention Deficit
Hyperactivity DisorderMixed AmphetamineSaltsMethylphenidate
Dextroamphetamine
Lisdexamfetamine
42
Figure 6. Comparison of the percent of patients who filled for an average daily
dose of less than or equal to 25 mg compared to those who filled for more than 25
mg average daily dose, between those who filled both ADHD stimulants with
depressants or ADHD stimulants only.
93.784.4
6.315.6
0
10
20
30
40
50
60
70
80
90
100
Less than or equal to 25 mg More than 25 mg
Per
cen
t (%
)
Average Daily Dose
ADHD stimulants Stimulants and Depressants
p-value < .0001
Average Daily Dose (mg) ADHD-Stimulants Stimulants and depressants Total
≤ 25, N (%) 13,327 (46.6) 2,472 (70.8) 15,799
> 25, N (%) 15,262 (53.3) 1,021 (29.2) 16,283
Total 28,589 3,493 32,082
43
BIBLIOGRAPHY
1. Hughes, A., Williams, M. R., Lipari, R. N., Bose, J., Copello, E. A. P., & Kroutil,
L. A. (2016, September). Prescription drug use and misuse in the United States:
Results from the 2015 National Survey on Drug Use and Health. NSDUH Data
Review. Retrieved from https://www.samhsa.gov/data/sites/default/files/NSDUH-
FFR2-2015/NSDUH-FFR2-2015.htm#topofpage [accessed Oct 22, 2016]
2. Stein MA, Waldman ID, Charney E, Aryal S, Sable C, Gruber R, Newcorn JH.
Dose effects and comparative effectiveness of extended release
dexmethylphenidate and mixed amphetamine salts. J Child Adolesc
Psychopharmacol. 2011 Dec;21(6):581-8. PubMed PMID: 22136094
3. Spiller HA, Hays HL, Aleguas Jr., A. Overdose of drugs for attention-deficit
hyperactivity disorder: clinical presentation mechanisms of toxicity, and
management. CNS Drugs 2013 Jul;27(7):531-543. PubMed PMID: 23757186
4. Drugs of Abuse 2015 Edition: A DEA resource guide. Drug Enforcement
Administration. U.S. Department of Justice. pp1-88. www.dea.gov [accessed Oct
27, 2016]
5. Overutilization further guidance 2013 [PDF]. Center for Medicare and Medicare
Services. Jul 5, 2013. CMS.gov. Retrieved from
https://www.cms.gov/Medicare/Prescription-Drug-
Coverage/PrescriptionDrugCovContra/Downloads/HPMS-memo-Medicare-Part-
D-Overutilization-Monitoring-System-07-05-13-.pdf [accessed Oct 22, 2016]
6. Paulozzi LJ, Strickler GK, Kreiner PW, Koris CM. Controlled Substance
Prescribing Patterns — Prescription Behavior Surveillance System, Eight States,
44
2013. Surveillance Summaries. Oct 16, 2015;64(SS09);1-14. Retrieved from
http://www.cdc.gov/mmwr/preview/mmwrhtml/ss6409a1.htm [accessed Oct 22,
2016]
7. Mher RL, Hanlon J, Hajjar ER. Clinical consequences of polypharmacy in
elderly. Expert Ipin Drug Saf. 2014 Jan;13(1):57-65. PubMed PMID: 24073682.
8. Tjia J, Velten SJ, Parsons C, et al. Studies to reduce unnecessary medication use
in frail older adults: a systematic review. Drugs Aging 2013;30:285–307. PubMed
PMID: 23475597
9. Rambhade S, Chakarboty A, Shrivastava A, Patil U, Rambahde A. A survey on
polypharmacy and use of inappropriate medications. Toxicol Int. 2012 19(1):68-
73. PubMed PMID: 3339249
10. Brandt S, Taverna E, Hallock R. A survey of nonmedical use of tranquilizers,
stimulants, and pain relievers among college students: patterns of use among users
and factors related to abstinence in non-users. Drug Alcohol Dependence
2014;143:272-276
11. Chen L, Curm R, Martins S, Kaufmann C, Strain E, Mojtabal. Patterns of
concurrent substance use among nonmedical ADHD stimulant users: results from
a national survey on drug use and health. Drug Alcohol Depend 2014;0:86-90
12. McCabe S, West B. Medical and nonmedical use of prescription stimulants:
results from a national multicohort study. J Am Acad Child Adolesc Psychiatry
2013;52(12):1272-1280
45
13. Cassidy T, Varughese S, Russo L, Budman S, Eaton T, Butler S. Nonmedical use
and diversion of ADHD stimulants among U.S. adults ages 18-49: a national
internet survey. J Attention Disorders 2015;19(7):630-640
14. Whiteside L, Cunningham R, Bonar E, Blow F, Ehrlich P, Walton M. Nonmedical
prescription stimulant use among youth in the emergency department: prevalence,
severity, and correlates. J Subst Abuse Treat 2015 48(1):21-27
15. Kaloyanides K, McCabe S, Cranford J, Teter C. Prevalence of illicit use and
abuse of prescription stimulants, alcohol, and other drugs among college students:
relationship with age at initiation of prescription stimulants. Pharmacotherapy
2007;27(5):666-674
16. Kroutil LA, Van Brunt DL, Herman-Stahl MA, Heller DC, Bray RM, Penne MA.
Non-medical use of prescription stimulants in the United States. Drug Alcohol
Depend 2006;84(2):135-43
17. Marks KR, Lile JA, Stoops WW, Rush CR. Separate and combined impact of
acute naltrexone and alprazolam on subjective and physiological effects of oral d-
amphetamine in stimulant users. Psychopharmacology (Berl). 2014
Jul;231(14):2741-50. PubMed PMID 24464531.
18. Rush CR, Stoops WW, Wagner FP, Hays LR, Glaser PE. Alprazolam attenuates
the behavioral effects of d-amphetamine in humans. J Clin Psychopharmacol.
2004 Aug;24(4):410-20. PubMed PMID 15232333.
19. Lile JA, Stoops WW, Glaser PE, Hays LR, Rush CR. Physiological and
subjective effects of acute intranasal methamphetamine during extended-release
46
alprazolam maintenance. Drug Alcohol Depend. 2011 Dec 15;119(3):187-93.
PubMed PMID 21737214.
20. Lile JA, Stoops WW, Wagner FP, Glaser PE, Rush CR. Oxazepam does not
modulate the behavioral effects of d-amphetamine in humans. Pharmacol
Biochem Behav. 2005 Oct;82(2):270-9. PubMed PMID 16182353.
21. Mintzer MZ, Griffiths RR. Triazolam-amphetamine interaction: dissociation of
effects on memory versus arousal. J Psychopharmacol. 2003 Mar;17(1):17-29.
PubMed PMID 12680736.
22. Rogers E, Metha S, Shengalia R, Reid MC. Four strategies for managing opioid-
induced side effects in older adults. Clin Geriartr. 2013 April;21(4). PubMed
PMID: 25949094
23. Stone P, Minton O. European Palliative Care Research collaborative pain
guidelines. Central side-effects management: what is the evidence to support best
practice in the management of sedation, cognitive impairment and myoclonus?
Palliat Med. 2011;25(5):431-441. PubMed PMID: 20870687.
24. Yee JD, Berde CB. Dextroamphetmine or methylphenidate as adjuvants to opioid
analgesia for adolescents with cancer. J Pain Symptom Manage 1994;9:122-5.
25. Chou R, Fanciullo GJ, Fine PG, Adler JA, Ballantyne JC, Davies P, Donovan MI,
Fishbain DA, Foley KM, Fudin J, Gilson AM, Kelter A, Mauskop A, O’Connor
PG, Passik SD, Pasternak GW, Portenoy RK, Rich BA, Roberts RG, Todd KH,
Miaskowski C; American Pain Society-American Academy of Pain Medicine
Opioids Guidelines Panel.Clinical guidelines for the use of chronic opioid therapy
47
in chronic noncancer pain. J Pain. 2009 Feb;10(2):113-30. PubMed PMID
19187889.
26. Code of Federal Regulations Title 21. Sec. 1308.12-1308.15. Revised Apr 1,
2016.
27. Constantine RJ, Boaz TB, Tandon R. Antipsychotic polypharmacy in the
treatment of children and adolescents in the fee-for-service component of a large
state Medicaid program. Clin Ther. 2010;32:949-959.
28. Kleinbaum DG, Klein M. (2010). Logistic Regression: Statistics for Biology and
Health. Spinger.
29. NIDA. Stimulant ADHD Medications: Methylphenidate and Amphetamines.
National Institute on Drug Abuse website.
https://www.drugabuse.gov/publications/drugfacts/stimulant-adhd-medications-
methylphenidate-amphetamines. January 21, 2014. Accessed June 11, 2017.
30. Merikangas KR, He J, Burstein M, Swanson SA, Avenevoli S, Cui L, Benjet C,
Georgiades K, Swendsen J. Lifetime prevalence of mental disorders in U.S.
adolescents: Results from the National Comorbidity Study Adolescent
Supplement (NCS-A). J Am Acad Child Adolesc Psychiatry. 2010
Oct;49(10):980-989.
31. Centers for Disease Control. State Profiles- Diagnosis and Medication Treatment
Among Children Ages 4-17 (Survey Data).
https://www.cdc.gov/ncbddd/adhd/stateprofiles/index.html. Accessed June 11,
2017.
48
32. Centers for Disease Control. Parent-Reported Diagnosis of ADHD by a Health
Care Provider and Medication Treatment Among Children 4-17 Years: National
Survey of Children’s Health* – 2003 to 2011. State Profile: Rhode Island.
https://www.cdc.gov/ncbddd/adhd/stateprofiles/stateprofile_rhodeisland.pdf.
Accessed June 11, 2017.
33. Vollmer S. AD/HD: it's not just in children. Family Pract Recertif. 1998;20:45–6.
34. Wender PH. Attention-deficit hyperactivity disorder in adults. New York: Oxford
University Press, 1995
35. Kessler RC, Berglund PA, Demler O, Jin R, Walters EE. Lifetime prevalence and
age-of-onset distributions of DSM-IV disorders in the National Comorbidity
Survey Replication (NCS-R). Archives of General Psychiatry. 2005
Jun;62(6):593-602.
36. NIDA. The Neurobiology of Drug Addiction. National Institute on Drug
Addiction website. https://www.drugabuse.gov/publications/teaching-
packets/neurobiology-drug-addiction/. January 2, 2007. Accessed June 11, 2007.
37. Searight HR, Burke JM, Rottnek R. Adult ADHD: evaluation and treatment in
family medicine. Am Fam Physician. 2000 Nov 1;62(9):2077-86, 2091-2. PMID
11087189. http://www.aafp.org/afp/2000/1101/p2077.html#ref-list-1. Accessed
June 11, 2017.