Embed Size (px)
Citation preview
Discussion Paper No. 6
Buffer Stocking Policy in the wake of NFSB: Concepts, Empirics, and Policy Implications
Ashok Gulati Surbhi Jain
COMMISSION FOR AGRICULTURAL COSTS AND PRICES
Department of Agriculture & Cooperation
Ministry of Agriculture
Government of India
New Delhi
May 2013
Contact address: [email protected]/[email protected]
Ashok Gulati is Chairman and Surbhi Jain is Joint Director in the Commission for Agricultural Costs and
Prices, Ministry of Agriculture, Government of India.
BufferStockingPolicyinthewakeofNFSB
2 Disclaimer
This discussion paper series by CACP is an attempt to encourage unbiased discussion on critical
issues affecting agricultural sector and food security. The views expressed through these papers
belong purely to author(s) and do not necessarily reflect the views of the organizations they
belong to.
BufferStockingPolicyinthewakeofNFSB
3Table of Contents
List of Acronyms .............................................................................................................................. 4
List of Tables ................................................................................................................................... 5
List of Figures .................................................................................................................................. 5
Summary ......................................................................................................................................... 6
I. Backdrop .............................................................................................................................. 8
II. Concepts and empirical mapping of Buffer Stocks .............................................................. 9
II.A Requirement of Operational Stocks under NFSB, 2011 ....................................................... 10
II.B Methodology for Empirically Mapping Quarterly Operational Stocks Requirement 14
II.C Strategic Reserves .............................................................................................................. 18
III. Central Pool Stocks: Current Status ................................................................................... 20
IV. The Way Forward ............................................................................................................... 22
References .................................................................................................................................... 25
BufferStockingPolicyinthewakeofNFSB
4List of Acronyms
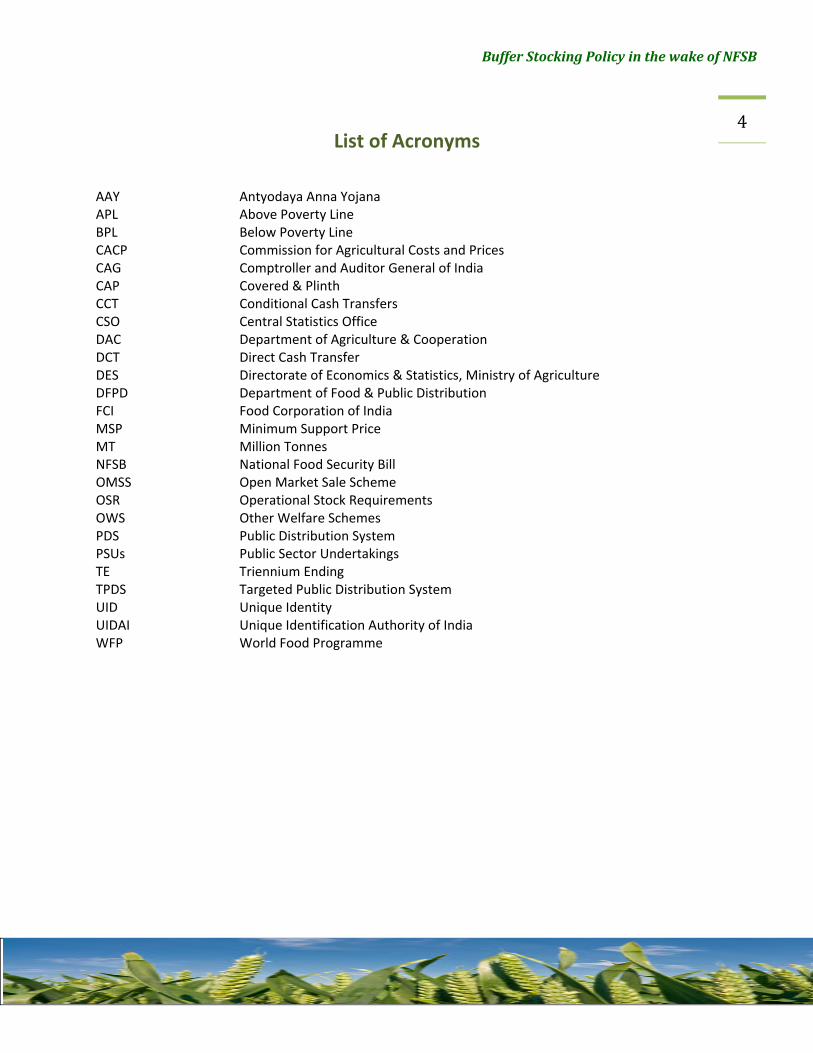
AAY Antyodaya Anna Yojana APL Above Poverty Line BPL Below Poverty Line CACP Commission for Agricultural Costs and Prices CAG Comptroller and Auditor General of India CAP Covered & Plinth CCT Conditional Cash Transfers CSO Central Statistics Office DAC Department of Agriculture & Cooperation DCT Direct Cash Transfer DES Directorate of Economics & Statistics, Ministry of Agriculture DFPD Department of Food & Public Distribution FCI Food Corporation of India MSP Minimum Support Price MT Million Tonnes NFSB National Food Security Bill OMSS Open Market Sale Scheme OSR Operational Stock Requirements OWS Other Welfare Schemes PDS Public Distribution System PSUs Public Sector Undertakings TE Triennium Ending TPDS Targeted Public Distribution System UID Unique Identity UIDAI Unique Identification Authority of India WFP World Food Programme
BufferStockingPolicyinthewakeofNFSB
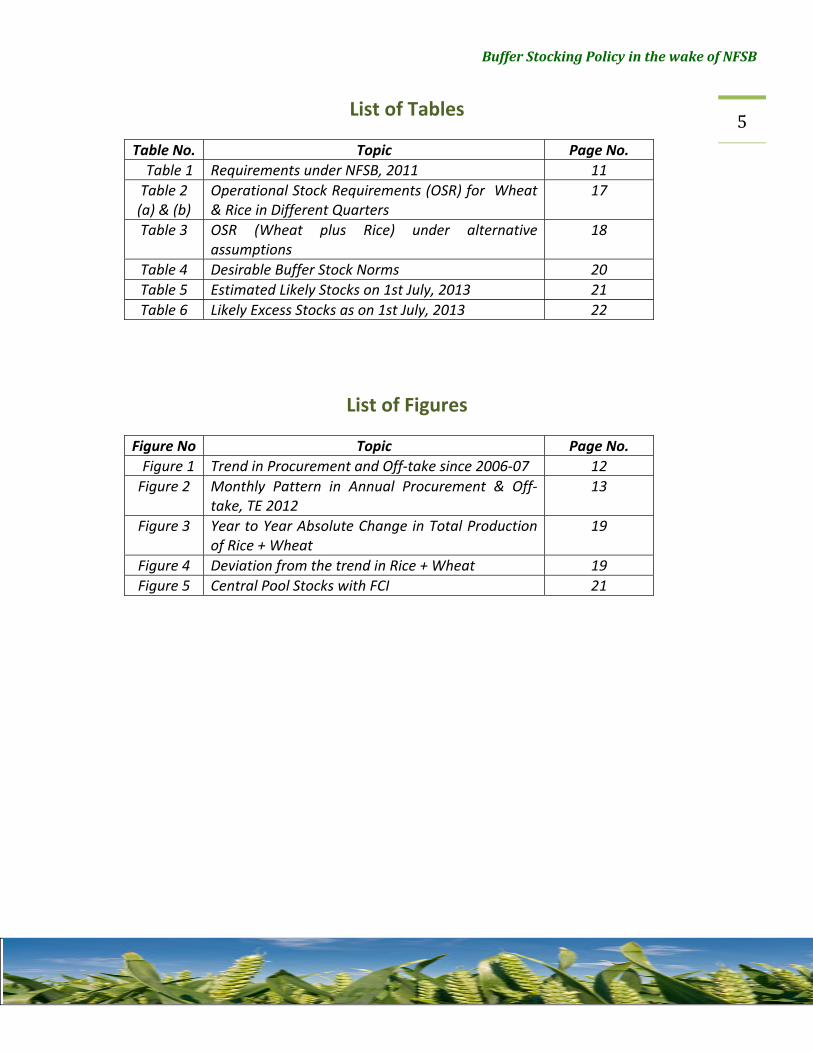
5List of Tables
Table No. Topic Page No.
Table 1 Requirements under NFSB, 2011 11
Table 2 (a) & (b)
Operational Stock Requirements (OSR) for Wheat & Rice in Different Quarters
17
Table 3 OSR (Wheat plus Rice) under alternative assumptions
18
Table 4 Desirable Buffer Stock Norms 20
Table 5 Estimated Likely Stocks on 1st July, 2013 21
Table 6 Likely Excess Stocks as on 1st July, 2013 22
List of Figures
Figure No Topic Page No.
Figure 1 Trend in Procurement and Off‐take since 2006‐07 12
Figure 2 Monthly Pattern in Annual Procurement & Off‐take, TE 2012
13
Figure 3 Year to Year Absolute Change in Total Production of Rice + Wheat
19
Figure 4 Deviation from the trend in Rice + Wheat 19
Figure 5 Central Pool Stocks with FCI 21
BufferStockingPolicyinthewakeofNFSB
6Summary The National Food Security Bill (NFSB) envisages distribution of about 61.2 mt of cereals,
primarily rice and wheat, through the existing public distribution system (PDS). To fulfill the underlying legal commitment, it is important to ensure adequate availability of grain with the public authorities. This necessitates a relook at the buffer stocking norms devised for every quarter. The quantum of operational stocks to be held at the beginning of every quarter will be decided by synchronizing the commitments that government is making to people each month and the inflow of grains in government godowns through its procurement mechanism each month. This paper attempts to empirically map what the desirable stocking requirements could be in the wake of the NFSB under alternative assumptions about risk coverage and with/without limited reliance on imports.
Accordingly, under the most likely scenario of autarky (i.e., not even limited reliance on
imports), the desirable buffer stock norm, as on 1st of July, is estimated at 46.7 mt of rice and wheat. This would cover the operational needs under NFSB as well as insure against 95 percent risk regarding drop in production of wheat and rice, based on past 20 years of production pattern. If one allows for at least 5 mt of possible imports whenever need arises, then the level of desirable stocks would be 41.7 mt as on July 1st. This means that current buffer stocking norm of 31.9 mt as on July 1st, needs a major revision in the wake of NFSB.
Despite a significant increase in the level of desirable buffer stocks needed in light of NFSB, the likely stocks with FCI on 1st July, 2013 are going to be around 82 mt, based on the expected procurement of wheat at 32 mt in the ongoing Rabi Marketing Season. If the actual procurement turns out to be less than 32 mt, the likely stocks will be accordingly somewhat lower than 82 mt as on July 1st, 2013. Still, these will be far in excess of the desirable buffer stocks, the “excess” is likely to be around 30‐40 mt. The value locked in these “excess stocks”, evaluated at their economic cost, ranges from Rs 70,000 crore to Rs 92,000 crore. This infusion of “excess” money into the economy without corresponding flow of goods is evident in the paradox of rising prices of rice & wheat amidst overflowing stocks in government godowns. It is creditable that India is currently in a state of ‘plenty’ but holding excessive stocks in godowns, which serve no worthwhile purpose, begs the question of economic efficiency in public expenditure. It will be much rational policy choice to liquidate these “excessive” stocks. The money, i.e., around Rs 80,000 crore under the most likely scenario, would certainly come in handy in the current times of high fiscal deficit and the increased availability of wheat and rice in the markets would rein in high food inflation, especially cereal inflation.
One way to reduce these bulging “excessive stocks” is to give the option to states and its
beneficiaries under PDS, where PDS systems have been integrated with ‘Aadhaar’ and the probability of leakages is reduced significantly, to lift 3‐6 months of their off‐take requirements at a discounted price, where the discount would be equal to the cost of carrying by the FCI. Another option could be OMSS at the last year’s MSP plus a maximum of 5 percent towards
BufferStockingPolicyinthewakeofNFSB
7taxes/cesses etc., i.e., wheat at Rs 13500 per tonne and rice price at Rs 19000 per tonne, ex‐Punjab. The losses incurred would be administrative expenses in procurement and statutory levies (which are in the nature of centre‐state fund transfers), but this would still save the large costs of carrying excess stocks as well as the capital that is locked in these stocks. Yet another option would be to let the PSUs and private sector export another 10‐12 mt of wheat and rice from government stocks at the same price. This would help tide over the current account deficit and earn valuable foreign exchange. The current price, being offered for wheat export ex‐Punjab of Rs 14840/tonne (MSP plus statutory levies etc that FCI has paid during the procurement process) is not attracting much private sector participation, and the PSUs themselves cannot export either, as the global wheat prices are showing a declining trend. So the offer price will have to take cognizance of market realities. The availability of these surplus stocks also opens up an opportunity for India to contribute 2‐3 mt for a South Asian foodgrain reserve and extend humanitarian aid to Afghanistan and some other African countries through the World Food Programme (WFP) or through bilateral cooperation.
Once the current problem of excess buffer stocks is solved, the provisions of physical entitlements under NFSB itself need to be revisited. In recent years, the government has procured more than one‐thirds of the total production and more than half of the marketed surplus of rice & wheat. Such large scale public procurement has strangulated the private trade (as has been the case in Punjab, Haryana and now Madhya Pradesh & Chhattisgarh). Of the total market arrivals of wheat and rice in these states, more than 80‐90 percent is bought by the government, indicating a de‐facto state take‐over of grain trade. This reminds one of the failed experiment of wheat trade take‐over in 1973‐74. Bringing back the private sector into grain trade should be high on government agenda, and not driving them out of markets. It may be worth noting that the cost of a simple departmental labour (loader) of FCI is 7 to 8 times the cost of contract labour doing the same job. With government monopsony, these costs are going to escalate and so would be the statutory levies being imposed by various state governments, making the entire operation of NFSB a very high cost phenomenon. It may be noted here that internationally, conditional cash transfers (CCTs), rather than physical distribution of subsidized food, have been found to be much more efficient in achieving food and nutritional security. Therefore, the foodgrains policy needs to have a door that allows switching from physical handling and distribution of foodgrains to cash transfers/food coupons/smart cards and cover food subsidy under the ‘Direct Benefit Transfer’ (DBT) scheme. In the first phase, surplus states (in terms of production and consumption of cereals) and cities with a population of 1 million or more (currently 33 as per 2011 census) could move straightaway to cash transfers. If one moves towards this direction, the desirable level of buffer stocks could be just 10‐15 mt, which basically takes care of the exigencies. This can save and release large amount of government expenditure, which in turn can be used to augment the level of welfare schemes. There is a need to innovate in our food management and welfare policies so that same expenditure brings much higher returns in terms of tackling hunger and malnutrition of this country.
BufferStockingPolicyinthewakeofNFSB
8Buffer Stocking Policy in the wake of NFSB:
Concepts, Empirics, and Policy Implications
I. Backdrop
1. The National Food Security Bill (NFSB) is knocking at the doors of Indian Parliament. If
passed, it is going to be the biggest ever experiment in the world for distributing highly
subsidized food by any government through a ‘rights based’ approach. The NFSB envisages
distribution of about 61.2 mt of cereals, primarily rice and wheat, through the existing public
distribution system (PDS) and other welfare schemes (OWS), which, as per government’s
estimates, will cost the exchequer roughly Rs 1,25,000 crore as food subsidy for the full one
year roll out.
2. In an earlier discussion paper, we have spelt out various challenges of this Bill, ranging
from its fiscal requirements to need for stabilizing farm production, to ensure proper storage of
the procured grains, and to transport them through railways, to the challenge of plugging
leakages in PDS1. We have also suggested various options to gradually move towards
conditional cash transfers (CCTs), starting with 33 cities with each having a population of more
than one million, and then to food surplus areas, especially farmers, and then finally to food
deficit areas. This suggested scheme has the potential to save the government around Rs
40,000 crore each year without sacrificing its equity objectives.
3. But that’s not the purpose of this paper. Here we concentrate on another important
issue: what would be the buffer stocking requirements if the NFSB is passed in its current form?
The current prevailing buffer stocking norms of the Government of India are 31.9 mt as on July
1st each year. Would this amount suffice in the wake of NFSB requirements? If not, what should
be the new norm, and how it is to be calculated? This is critical to know in today’s scenario, as
the country is currently loaded with large stocks. On July 1st, 2012, e.g., it had 80.2 mt, and is
likely to have similar or even higher amount this year, despite emerging as the largest exporter
of rice (around 10 mt in calendar year 2012) and exporting about 5.6 mt of wheat in FY 2012‐
13. Thus, there seems to be a major deviation between actual stocks the state agencies are
holding and what is (or perhaps what would be) the buffer stocking requirements. Since it has
1 CACP Discussion Paper 2 on “National Food Security Bill: Challenges and Options” by Ashok Gulati, Jyoti Gujral, T.Nandakumar with Surbhi Jain, Sourabh Anand, Siddharth Rath, and Piyush Joshi (December, 2012) points out that the real cost of this Bill will be more than Rs 6,00,000 over three year period. This will be necessitated by the need to invest in agriculture to stabilize production, invest in storage and railways facilities, as also to create a more effective organizational structure for food management.
BufferStockingPolicyinthewakeofNFSB
9huge implications in terms of costs and risks, it is of utmost importance that we spell out the
new buffer stocking norms well before the implementation of the Bill starts. This would help
the policy makers as well as the country to know the risks and true costs involved in
implementing the NFSB.
4. Accordingly, in this paper, we first delineate the concepts of various types of stocks and
then try to empirically map what the stocking requirements would be in the wake of this NFSB,
and under alternative assumptions about the degree of risk coverage, reliance on imports, etc.
(section II). In section III, we compare the current level of stocks that the country is likely to
have as on July 1st 2013, and what to do of the “excessive stocks”. We also estimate cost of
inaction on that front, which the country will have to bear without serving any worthwhile
purpose. In section IV, we suggest the way forward to improve economic efficiency of public
expenditure by liquidating “excess stocks”, rein in cereal inflation, reduce fiscal and current
account deficits. If heeded, this advice can pay rich dividends as it involves around Rs 80,000
crore which are locked up in “excessive stocks” without serving any worthwhile purpose.
II. Concepts and empirical mapping of Buffer Stocks
5. The literature on stocking policies2 suggests that stocks can be conceptualized at least
along three lines, each one targeting a different function inherent in buffer stocking policies.
These are:
(i) Operational stocks: to be used to feed various safety net and welfare schemes such as the
PDS and OWS delineated in NFSB. The quantum of this stock depends on the obligation of
the government is making to people under these schemes. Under the current NFSB, this
obligation is about 61.2 mt of cereals3.
(ii) Strategic reserves for stabilization: to be used mainly as a buffer against any drought or any
other unforeseen shocks, when production drops or normal movement of grains is
obstructed. Under such circumstances, open market prices generally shoot up and these
strategic reserves can be utilized to stabilize the cereal prices. Under the current envisaged
NFSB, which would provide highly subsidized grain (at one‐eighth to one‐tenth of the
economic cost) to almost two‐third of the population, the purpose of stabilizing the prices
for the remaining markets takes a back seat.
(iii) Base level stocks or “dead stocks”: a certain minimum stock which is generally not available
at a short notice of 2‐3 months. This concept is akin to “dead storage” in any reservoir. 2 Khusro (1973); Raj Krishna & Ajay Chibber (1983), Technical Groups on Buffer Stock norms (1975, 1981, 1988, 1997 & 2003) 3 http://pib.nic.in/newsite/PrintRelease.aspx?relid=95441
BufferStockingPolicyinthewakeofNFSB
10Generally, these are in transit or in far flung areas, and cannot be put to use within 2‐3
months’ notice. With technological advancements in storage and movement of grains and
increased accessibility, these stocks have become redundant.
6. Although conceptually these are different stocks, in practical terms, these stocks are
fungible and can be used for alternative purposes delineated above. The minimum buffer‐stock
levels to be maintained during different periods of the year are fixed by the Government. A
Technical Group on Buffer Stocking Policy, created in 1995, periodically reviews buffer stocking
policy and suggests minimum and maximum levels to be maintained and the grain mix for
consideration of the Government. The Technical Group is chaired by the Secretary of the
Ministry of Food, and members include representatives from Ministry of Agriculture, FCI, and
the Planning Commission. In light of the NFSB, what one needs to estimate is the total amount
of grain stocks that would be needed to ensure that the government can effectively perform its
three functions, i.e., distributing subsidized grain to 67 percent of population, to minimize risks
emerging from droughts or floods etc, and to ensure a fair degree of price stabilization of basic
staples like rice and wheat. We discuss each one in some detail below.
II.A Requirement of Operational Stocks under NFSB, 2011
7. The quantum of operational stock needed will be first decided by the commitments that
government is making to people each month, the inflow of grains in government godowns
through its procurement mechanism each month, and then working out what would be needed
for say each month or each quarter. Under NFSB, upto 67% of the population would be
provided a uniform entitlement of 5 kg per person per month at highly subsidized prices of Rs 3,
Rs 2, Rs 1 per kg for rice, wheat, coarse grains respectively. The entitlement of Antyodaya Anna
Yojana (AAY) households, which constitute poorest of the poor will, however, be protected at
35 kg per household per month (i.e., 7 kg per person per month assuming 5 persons per
household). It has also been proposed that the existing allocation of foodgrains to the
States/UTs would be protected, subject to it being restricted to average annual offtake during
last three years (2009‐10 to 2011‐12). Accordingly, the requirement for average monthly PDS
offtake is calculated as 2.3 mt for wheat (27.6 mt annually) and 2.8 mt for rice (33.6 mt
annually) as detailed in Table 1.
BufferStockingPolicyinthewakeofNFSB
11
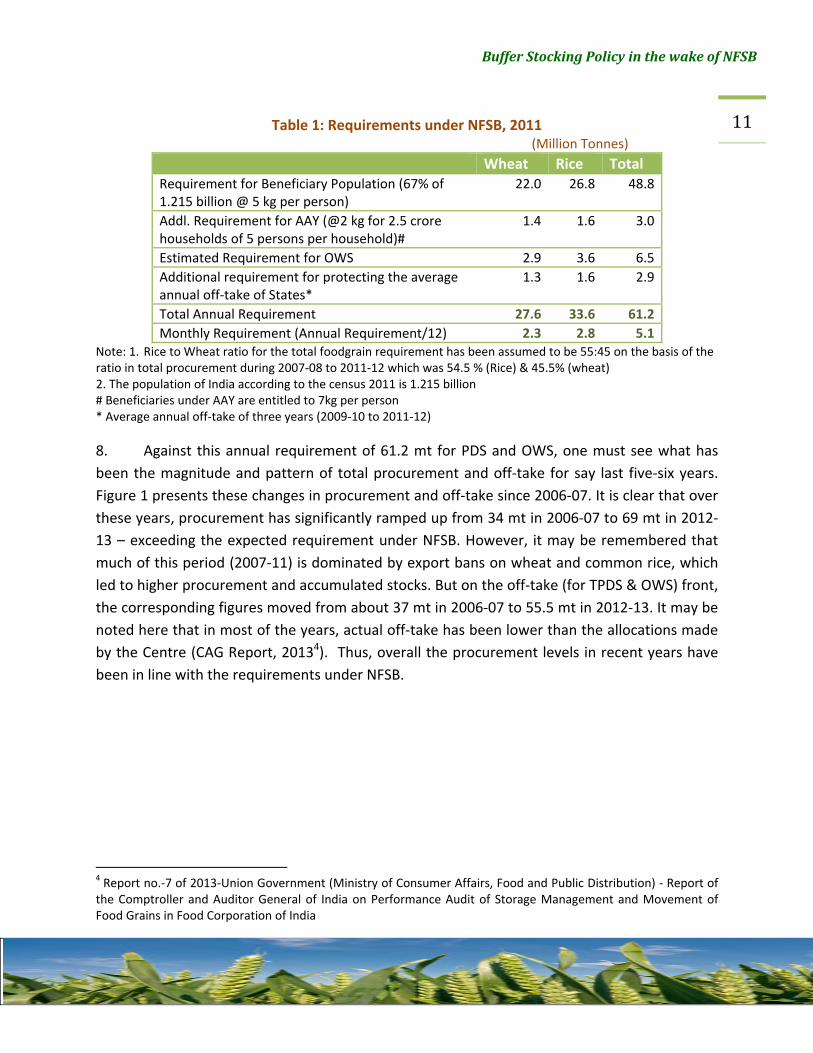
Table 1: Requirements under NFSB, 2011 (Million Tonnes)
Wheat Rice Total Requirement for Beneficiary Population (67% of 1.215 billion @ 5 kg per person)
22.0 26.8 48.8
Addl. Requirement for AAY (@2 kg for 2.5 crore households of 5 persons per household)#
1.4 1.6 3.0
Estimated Requirement for OWS 2.9 3.6 6.5
Additional requirement for protecting the average annual off‐take of States*
1.3 1.6 2.9
Total Annual Requirement 27.6 33.6 61.2
Monthly Requirement (Annual Requirement/12) 2.3 2.8 5.1Note: 1. Rice to Wheat ratio for the total foodgrain requirement has been assumed to be 55:45 on the basis of the ratio in total procurement during 2007‐08 to 2011‐12 which was 54.5 % (Rice) & 45.5% (wheat) 2. The population of India according to the census 2011 is 1.215 billion # Beneficiaries under AAY are entitled to 7kg per person * Average annual off‐take of three years (2009‐10 to 2011‐12)
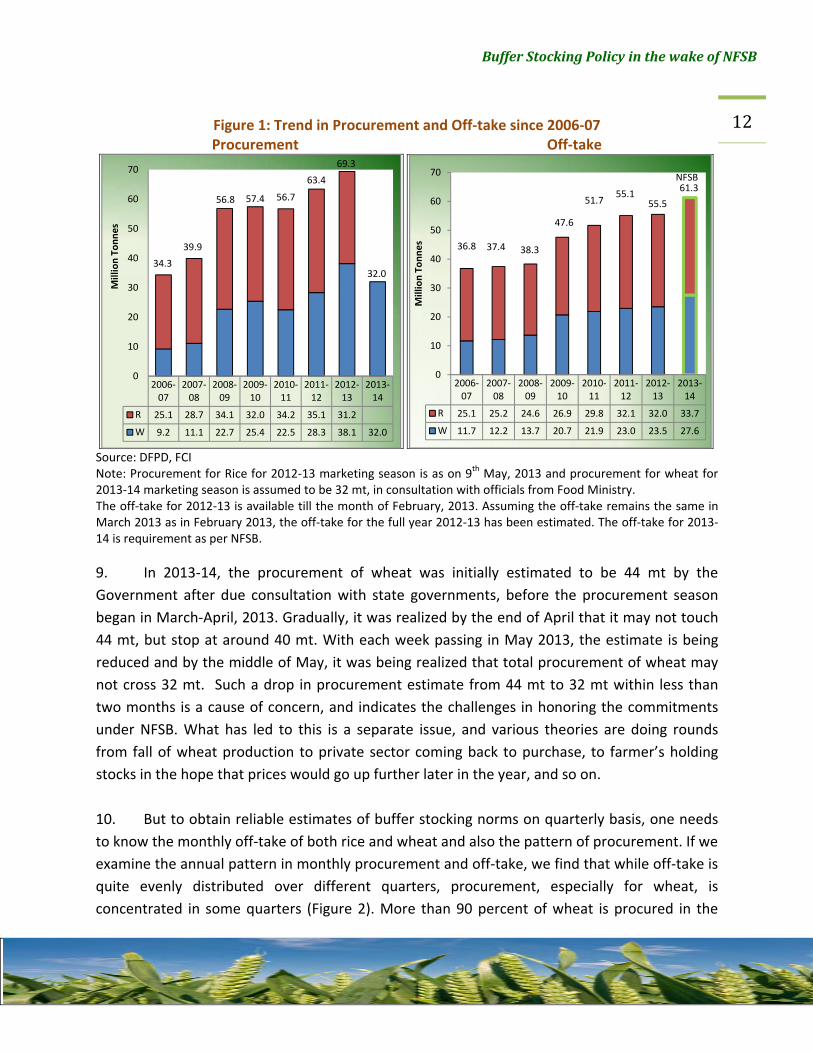
8. Against this annual requirement of 61.2 mt for PDS and OWS, one must see what has
been the magnitude and pattern of total procurement and off‐take for say last five‐six years.
Figure 1 presents these changes in procurement and off‐take since 2006‐07. It is clear that over
these years, procurement has significantly ramped up from 34 mt in 2006‐07 to 69 mt in 2012‐
13 – exceeding the expected requirement under NFSB. However, it may be remembered that
much of this period (2007‐11) is dominated by export bans on wheat and common rice, which
led to higher procurement and accumulated stocks. But on the off‐take (for TPDS & OWS) front,
the corresponding figures moved from about 37 mt in 2006‐07 to 55.5 mt in 2012‐13. It may be
noted here that in most of the years, actual off‐take has been lower than the allocations made
by the Centre (CAG Report, 20134). Thus, overall the procurement levels in recent years have
been in line with the requirements under NFSB.
4 Report no.‐7 of 2013‐Union Government (Ministry of Consumer Affairs, Food and Public Distribution) ‐ Report of the Comptroller and Auditor General of India on Performance Audit of Storage Management and Movement of Food Grains in Food Corporation of India
BufferStockingPolicyinthewakeofNFSB
12
Figure 1: Trend in Procurement and Off‐take since 2006‐07 Procurement Off‐take
Source: DFPD, FCI Note: Procurement for Rice for 2012‐13 marketing season is as on 9th May, 2013 and procurement for wheat for 2013‐14 marketing season is assumed to be 32 mt, in consultation with officials from Food Ministry. The off‐take for 2012‐13 is available till the month of February, 2013. Assuming the off‐take remains the same in March 2013 as in February 2013, the off‐take for the full year 2012‐13 has been estimated. The off‐take for 2013‐14 is requirement as per NFSB.
9. In 2013‐14, the procurement of wheat was initially estimated to be 44 mt by the
Government after due consultation with state governments, before the procurement season
began in March‐April, 2013. Gradually, it was realized by the end of April that it may not touch
44 mt, but stop at around 40 mt. With each week passing in May 2013, the estimate is being
reduced and by the middle of May, it was being realized that total procurement of wheat may
not cross 32 mt. Such a drop in procurement estimate from 44 mt to 32 mt within less than
two months is a cause of concern, and indicates the challenges in honoring the commitments
under NFSB. What has led to this is a separate issue, and various theories are doing rounds
from fall of wheat production to private sector coming back to purchase, to farmer’s holding
stocks in the hope that prices would go up further later in the year, and so on.
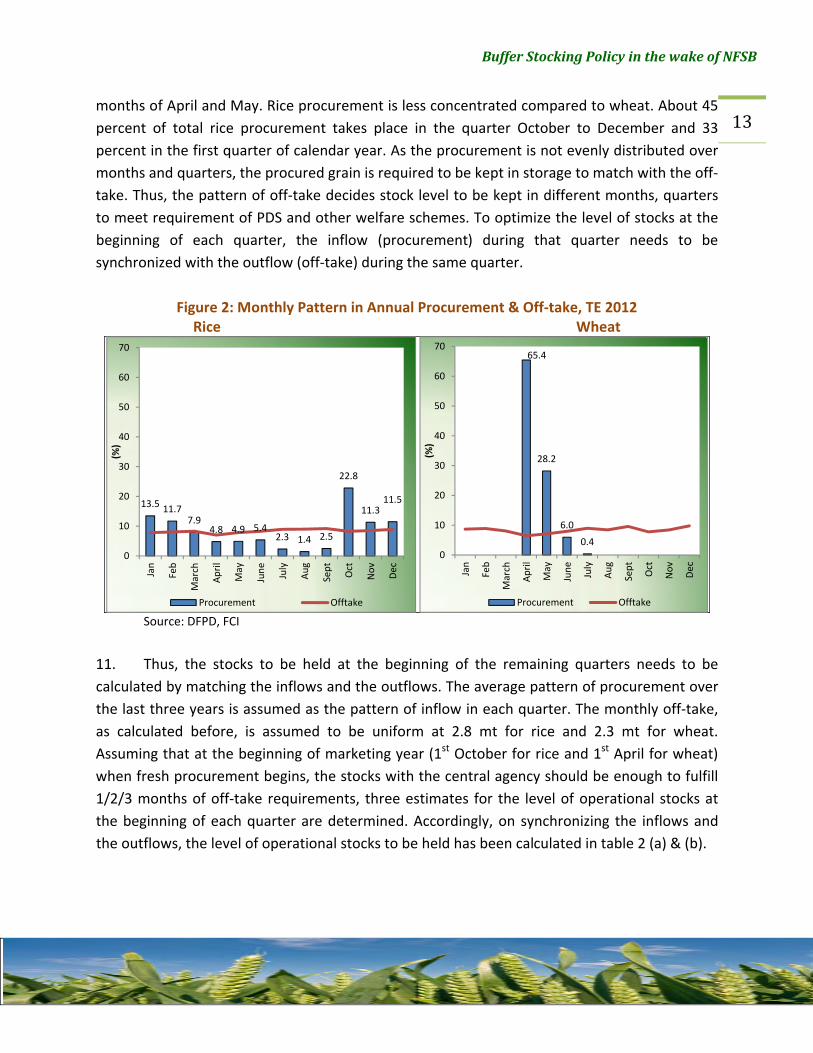
10. But to obtain reliable estimates of buffer stocking norms on quarterly basis, one needs
to know the monthly off‐take of both rice and wheat and also the pattern of procurement. If we
examine the annual pattern in monthly procurement and off‐take, we find that while off‐take is
quite evenly distributed over different quarters, procurement, especially for wheat, is
concentrated in some quarters (Figure 2). More than 90 percent of wheat is procured in the
2006‐07
2007‐08
2008‐09
2009‐10
2010‐11
2011‐12
2012‐13
2013‐14
R 25.1 28.7 34.1 32.0 34.2 35.1 31.2
W 9.2 11.1 22.7 25.4 22.5 28.3 38.1 32.0
32.034.3
39.9
56.8 57.4 56.7
63.4
69.3
0
10
20
30
40
50
60
70
Million Tonnes
2006‐07
2007‐08
2008‐09
2009‐10
2010‐11
2011‐12
2012‐13
2013‐14
R 25.1 25.2 24.6 26.9 29.8 32.1 32.0 33.7
W 11.7 12.2 13.7 20.7 21.9 23.0 23.5 27.6
36.8 37.4 38.3
47.6
51.755.1
55.5
61.3
0
10
20
30
40
50
60
70
Million Tonnes
NFSB
BufferStockingPolicyinthewakeofNFSB
13months of April and May. Rice procurement is less concentrated compared to wheat. About 45
percent of total rice procurement takes place in the quarter October to December and 33
percent in the first quarter of calendar year. As the procurement is not evenly distributed over
months and quarters, the procured grain is required to be kept in storage to match with the off‐
take. Thus, the pattern of off‐take decides stock level to be kept in different months, quarters
to meet requirement of PDS and other welfare schemes. To optimize the level of stocks at the
beginning of each quarter, the inflow (procurement) during that quarter needs to be
synchronized with the outflow (off‐take) during the same quarter.
Figure 2: Monthly Pattern in Annual Procurement & Off‐take, TE 2012 Rice Wheat
Source: DFPD, FCI
11. Thus, the stocks to be held at the beginning of the remaining quarters needs to be
calculated by matching the inflows and the outflows. The average pattern of procurement over
the last three years is assumed as the pattern of inflow in each quarter. The monthly off‐take,
as calculated before, is assumed to be uniform at 2.8 mt for rice and 2.3 mt for wheat.
Assuming that at the beginning of marketing year (1st October for rice and 1st April for wheat)
when fresh procurement begins, the stocks with the central agency should be enough to fulfill
1/2/3 months of off‐take requirements, three estimates for the level of operational stocks at
the beginning of each quarter are determined. Accordingly, on synchronizing the inflows and
the outflows, the level of operational stocks to be held has been calculated in table 2 (a) & (b).
13.5 11.77.9
4.8 4.9 5.42.3 1.4 2.5
22.8
11.311.5
0
10
20
30
40
50
60
70
Jan
Feb
March
April
May
June
July
Aug
Sept
Oct
Nov
Dec
(%)
Procurement Offtake
65.4
28.2
6.0
0.40
10
20
30
40
50
60
70
Jan
Feb
March
April
May
June
July
Aug
Sept
Oct
Nov
Dec
(%)
Procurement Offtake
BufferStockingPolicyinthewakeofNFSB
14II.B Methodology for Empirically Mapping Quarterly Operational stocks
Requirement (OSR)
12. In order to work out the desirable stock requirements at the beginning of each quarter,
essentially three steps have been followed sequentially, separately for rice and wheat.
Step 1: Firstly, the level of stock, that would be required at the beginning of the procurement
season, needs to be defined say Rt. This level would be based on the estimates of the
operational authorities (such as FCI and Deptt of Food) of the number of months required to
turnaround the current procured grain into the distribution network. A well‐oiled and efficient
machinery can perhaps turn it around within one month; a reasonably comfortable time could
be two months and extra luxury would be three months. Our discussions with officials reveal
that two months stocks at the beginning of the procurement season would be pretty
comfortable to get the operations in place with regard to turning around the procured grains
into the distribution network. Therefore, 2 months requirement is taken as the most likely
scenario (Scenario II) but simulations for 1 month requirement (Scenario I) are also undertaken
under the presumption that the operational machinery will become efficient over time. But,
unfortunately, if the current machinery is saddled with more inefficiency with time, then stocks
for even 3 months requirements may be required (Scenario III).
Step 2: The level of procurement desired for the whole year (DPt) is estimated based on the
assumption of desirable stocks (Rt) at the beginning of procurement season. This would equal
the annual requirement under PDS & OWS (Ot) plus the desirable stocks (Rt). As has been
estimated in table 1, the monthly requirement for wheat and rice under NFSB would be 2.3 mt
and 2.8 mt respectively. The annual requirement (Ot) can be calculated from these monthly
estimates.
i.e., DPt = Rt + Ot
Step 3: This is a critical step as in this the flow of procurement in each quarter is worked out
based on the average of the quarterly share of annual procurement (pi where i refers to the
quarters) during the last three years. These shares give us the quarterly pattern of procurement
during the year i.e, the inflows (Ii =pi*DPt). This procurement in each quarter, then, is adjusted
by deducting the offtake for PDS and OWS (Oi). It may be noted that while the pattern of
procurement varies in each quarter and so would the inflows, but the outflow of off‐take is
likely to be constant or uniform. So at the end of each quarter, there would be a carryover stock
from the previous quarter gap between inflows and outflows (=Ii‐Oi). This carryover stock of
one quarter is further adjusted by the difference between inflows and outflows of the next
BufferStockingPolicyinthewakeofNFSB
15quarter which gives us the carryover stock for the next quarter and so on. These would give us
the desirable operational stocks to be held at the beginning of each quarter.
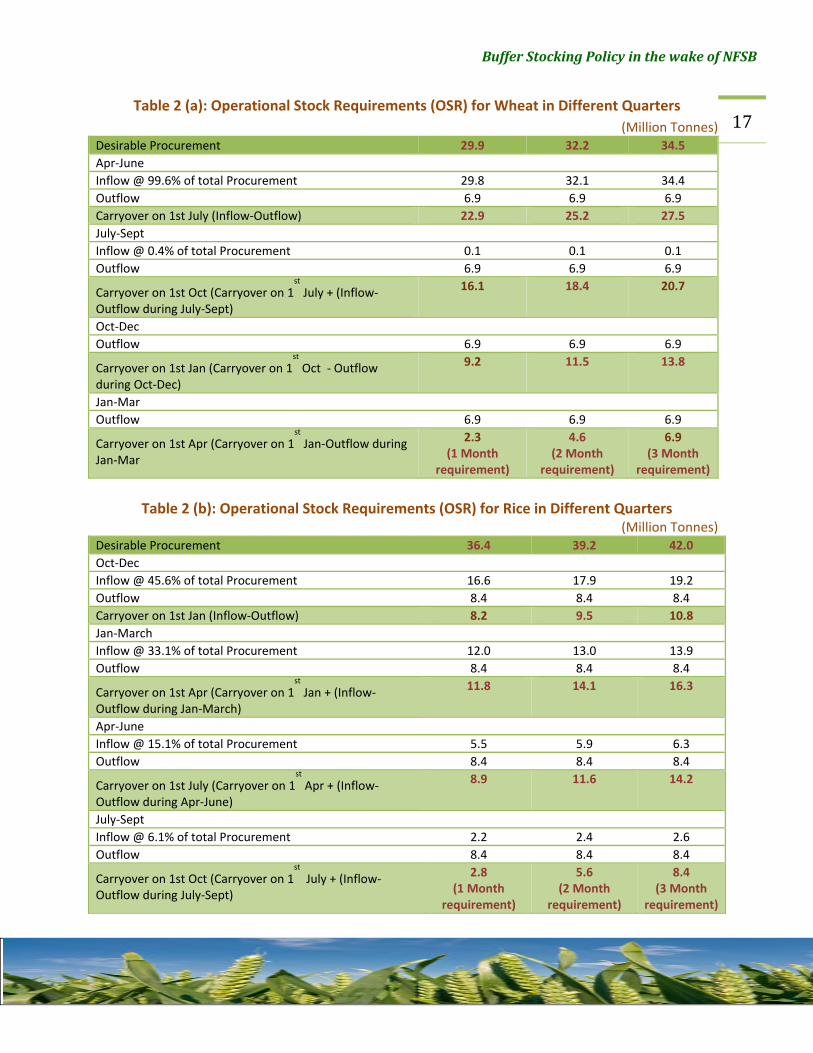
13. The steps are illustrated separately for wheat & rice in table 2(a) & 2(b) with the
assumption that scenario II (2 months requirement) is the most likely scenario. In case of
wheat, the desirable stocking requirements at the beginning of procurement season would be
equal to the off‐take in two months i.e., 4.6 mt5 (Rt). This means that as on 1st April when the
procurement season starts, country should already have 4.6 mt of wheat relating to 2 months
off‐take during April‐May. In the meantime, fresh procurement will come during the April‐June
quarter, which can then be put into distribution from June onwards. With this assumption that
Rt= 4.6mt stocks, the corresponding desired level of procurement (DPt) for the whole year
would be Rt + Ot = 4.6 + (2.3*12) = 32.2mt. But during the first quarter, 99.6 percent (p1) of the
desirable procurement (DPt) will be procured i.e. I1= p1*DPt = 0.996* 32.2 = 32.1 mt. But the
offtake (O1) during quarter 1 (q1) will be only 6.9 mt. So at the beginning of the second quarter,
there will be a carryover stock of 25.2 mt (I1‐O1= 32.1‐6.9). During the second quarter, only 0.4
percent (p2) of the desirable procurement would flow in i.e inflow (I2) would be 0.1 mt
(I2=p2*DPt=0.004* 32.2), while the outflow (O2) would be again 6.9 mt. This will leave a
carryover stock of 18.4 mt (I1‐O1 + I2‐O2= 25.2–6.8) at the beginning of quarter 3. Then, in
quarter 3 & 4, there are no inflows of procurement (I3 & I4 =0) and outflows of 6.9 mt are there
(O3 & O4 = 6.9 each). So at the end of quarter 3 and beginning of quarter 4, the carryover stocks
are 11.5 mt (I1‐O1 + I2‐O2+ I3‐O3 = 25.2‐6.8‐6.9). Now, at the end of quarter 4 and the beginning
of the next procurement season, we would be left with a carryover stock of 4.6mt (I1‐O1 + I2‐O2+
I3‐O3+ I4‐O4 = 25.2‐6.8‐6.9‐6.9). So the desirable operational stock at the beginning of each
quarter for wheat would be 25.2 mt (as on 1st July), 18.4 mt (as on 1st October), 11.5 mt (as on
1st January) and 4.6 mt (as on 1st April). This is also explained in table 2 (a) which illustrates the
other two scenarios also.
14. The case of rice is a little more complicated, as the pattern of procurement is widely
spread out while the off‐take is 8.4 mt per quarter6. Following the same logic, we concentrate
on scenario 2, i.e., we want 5.6 mt (Rt) at the beginning of procurement season. This means
that as on 1st October when the procurement season starts, country should already have 5.6 mt
of rice relating to 2 months off‐take during October‐November. In the meantime, fresh
procurement will come during the Oct‐Dec quarter, which can then be put into distribution
from December onwards. With this assumption that Rt= 5.6mt stocks, the corresponding
5 The monthly off‐take for wheat is 2.3 mt under NFSB (table 1). 6 The monthly off‐take for rice is 2.8 mt under NFSB (table 1).
BufferStockingPolicyinthewakeofNFSB
16desired level of procurement (DPt) for the whole year would be Rt + Ot = 5.6 + (2.8*12) = 39.2
mt. During the first quarter, 45.6 percent (p1) of the desirable procurement (DPt) will be
procured i.e. I1= p1*DPt = 0.456* 39.2 = 17.9 mt. But the offtake (O1) during quarter 1 (q1) will
be only 8.4 mt. So at the beginning of the second quarter (q2), there will be a carryover stock of
9.5 mt (I1‐O1= 17.9‐8.4). During the second quarter, 33.1 percent (p2) of the desirable
procurement would flow in i.e inflow (I2) would be 13.0 mt (I2 = p2*DPt = 0.331* 39.2), while the
outflow (O2) would be again 8.4 mt. This will leave a carryover stock of 14.1 mt (I1‐O1 + I2‐O2=
9.5+13.0‐8.4) at the beginning of quarter 3. Then, in quarter 3, 15.1 percent (p3) of the
procurement comes in i.e I3= p3*DPt = 5.9 mt with offtake at 8.4 mt, the carryover stocks, at the
end of quarter 3 and beginning of quarter 4, are 11.6 mt (I1‐O1 + I2‐O2+ I3‐O3 = 14.1‐2.5). Now, at
the end of quarter 4 and the beginning of the next procurement season, with an inflow of 6.1
percent i.e 2.4 mt, we would be left with a carryover stock of 5.6 mt (I1‐O1 + I2‐O2+ I3‐O3+ I4‐O4 =
11.6+2.4‐8.4). So the desirable operational stock at the beginning of each quarter for rice would
be 9.5 mt (as on 1st January), 14.1 mt (as on 1st April), 11.6 mt (as on 1st July) and 5.6 mt (as on
1st October). This is also explained in table 2 (b) which illustrates the other two scenarios also.
15. Given that the 4 quarters are based on the procurement year (i.e., Apr‐March for wheat
& Oct‐Sept for rice), a formula based on inflow and outflow patterns can be devised. The level
of stock, that would be required at the beginning of the procurement season i.e., at the
beginning of the first quarter (q1), would be based on the estimate of the number of months
required to turnaround the current procured grain into the distribution network. The
requirement for this number of months would be the level of operational stocks required at the
beginning of the first quarter (q1).
S(q1)= Rt,
For the other quarters, the formula could be devised as follows: 3
S(qi)= Ʃj (Ii‐j‐Oi‐j), where i=2,3,4 j=1
where S= operational stocks required at the beginning of the quarter
Rt= Desirable Requirement for number of months at the start of the procurement season
Oi: Off‐take in a quarter
Ii= Inflow during a quarter = pi*DPt
pi= Triennium average of share of procurement in annual procurement during the quarter
DPt: Desirable Procurement during the year = Annual Off‐take (ƩOi) +Rt
BufferStockingPolicyinthewakeofNFSB
17Table 2 (a): Operational Stock Requirements (OSR) for Wheat in Different Quarters
(Million Tonnes) Desirable Procurement 29.9 32.2 34.5
Apr‐June
Inflow @ 99.6% of total Procurement 29.8 32.1 34.4
Outflow 6.9 6.9 6.9
Carryover on 1st July (Inflow‐Outflow) 22.9 25.2 27.5
July‐Sept
Inflow @ 0.4% of total Procurement 0.1 0.1 0.1
Outflow 6.9 6.9 6.9
Carryover on 1st Oct (Carryover on 1st
July + (Inflow‐Outflow during July‐Sept)
16.1 18.4 20.7
Oct‐Dec
Outflow 6.9 6.9 6.9
Carryover on 1st Jan (Carryover on 1st
Oct ‐ Outflow during Oct‐Dec)
9.2 11.5 13.8
Jan‐Mar
Outflow 6.9 6.9 6.9
Carryover on 1st Apr (Carryover on 1st
Jan‐Outflow during Jan‐Mar
2.3(1 Month
requirement)
4.6 (2 Month
requirement)
6.9(3 Month
requirement)
Table 2 (b): Operational Stock Requirements (OSR) for Rice in Different Quarters
(Million Tonnes) Desirable Procurement 36.4 39.2 42.0
Oct‐Dec
Inflow @ 45.6% of total Procurement 16.6 17.9 19.2
Outflow 8.4 8.4 8.4
Carryover on 1st Jan (Inflow‐Outflow) 8.2 9.5 10.8
Jan‐March
Inflow @ 33.1% of total Procurement 12.0 13.0 13.9
Outflow 8.4 8.4 8.4
Carryover on 1st Apr (Carryover on 1st
Jan + (Inflow‐Outflow during Jan‐March)
11.8 14.1 16.3
Apr‐June
Inflow @ 15.1% of total Procurement 5.5 5.9 6.3
Outflow 8.4 8.4 8.4
Carryover on 1st July (Carryover on 1st
Apr + (Inflow‐Outflow during Apr‐June)
8.9 11.6 14.2
July‐Sept
Inflow @ 6.1% of total Procurement 2.2 2.4 2.6
Outflow 8.4 8.4 8.4
Carryover on 1st Oct (Carryover on 1st
July + (Inflow‐Outflow during July‐Sept)
2.8(1 Month
requirement)
5.6 (2 Month
requirement)
8.4(3 Month
requirement)
BufferStockingPolicyinthewakeofNFSB
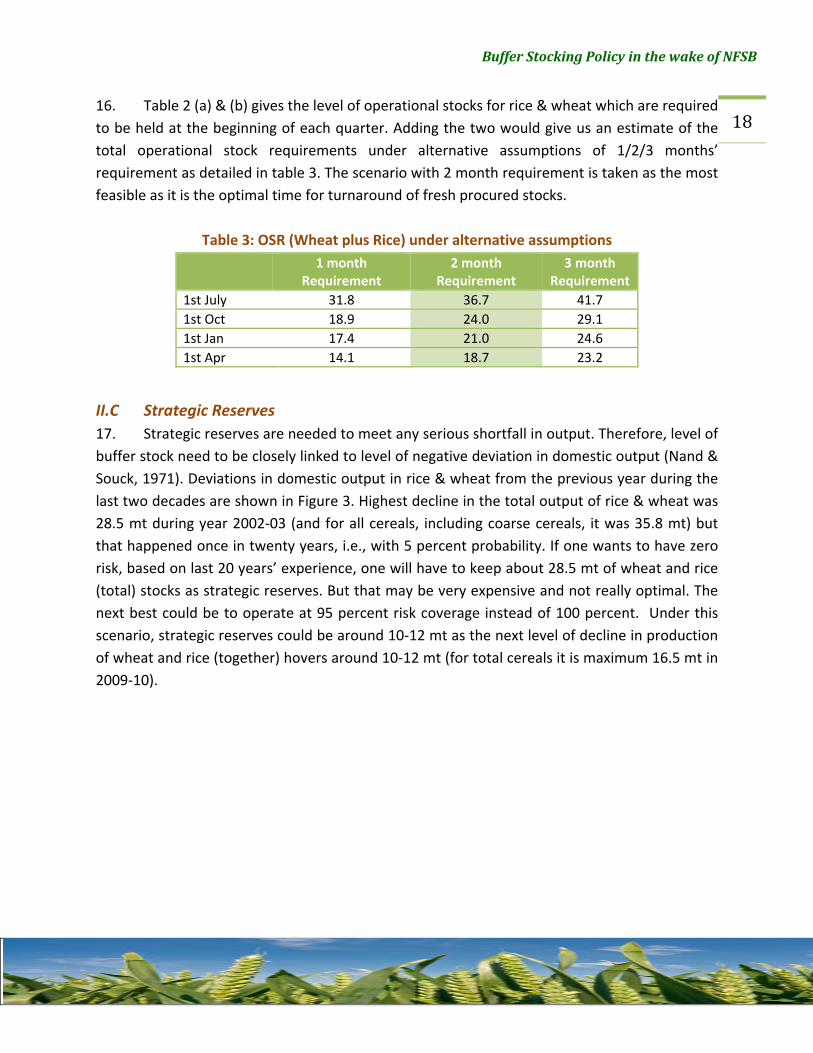
1816. Table 2 (a) & (b) gives the level of operational stocks for rice & wheat which are required
to be held at the beginning of each quarter. Adding the two would give us an estimate of the
total operational stock requirements under alternative assumptions of 1/2/3 months’
requirement as detailed in table 3. The scenario with 2 month requirement is taken as the most
feasible as it is the optimal time for turnaround of fresh procured stocks.
Table 3: OSR (Wheat plus Rice) under alternative assumptions
1 month Requirement
2 month Requirement
3 month Requirement
1st July 31.8 36.7 41.7
1st Oct 18.9 24.0 29.1
1st Jan 17.4 21.0 24.6
1st Apr 14.1 18.7 23.2
II.C Strategic Reserves
17. Strategic reserves are needed to meet any serious shortfall in output. Therefore, level of
buffer stock need to be closely linked to level of negative deviation in domestic output (Nand &
Souck, 1971). Deviations in domestic output in rice & wheat from the previous year during the
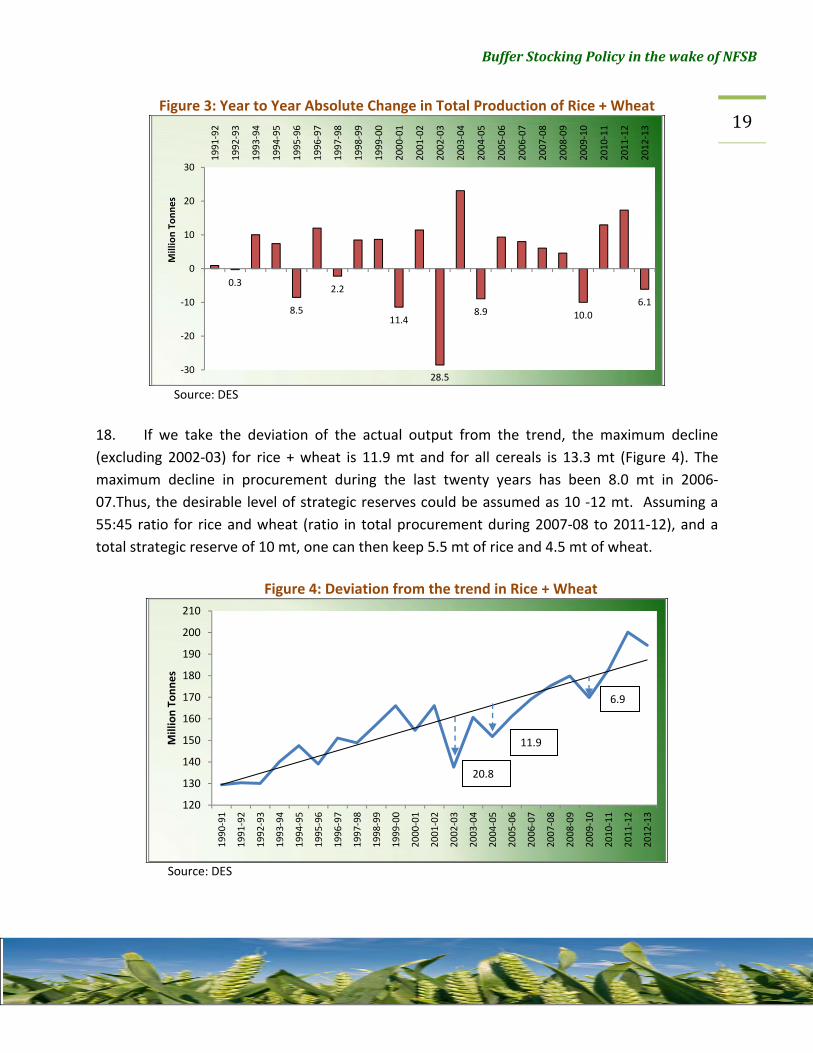
last two decades are shown in Figure 3. Highest decline in the total output of rice & wheat was
28.5 mt during year 2002‐03 (and for all cereals, including coarse cereals, it was 35.8 mt) but
that happened once in twenty years, i.e., with 5 percent probability. If one wants to have zero
risk, based on last 20 years’ experience, one will have to keep about 28.5 mt of wheat and rice
(total) stocks as strategic reserves. But that may be very expensive and not really optimal. The
next best could be to operate at 95 percent risk coverage instead of 100 percent. Under this
scenario, strategic reserves could be around 10‐12 mt as the next level of decline in production
of wheat and rice (together) hovers around 10‐12 mt (for total cereals it is maximum 16.5 mt in
2009‐10).
BufferStockingPolicyinthewakeofNFSB
19Figure 3: Year to Year Absolute Change in Total Production of Rice + Wheat
Source: DES
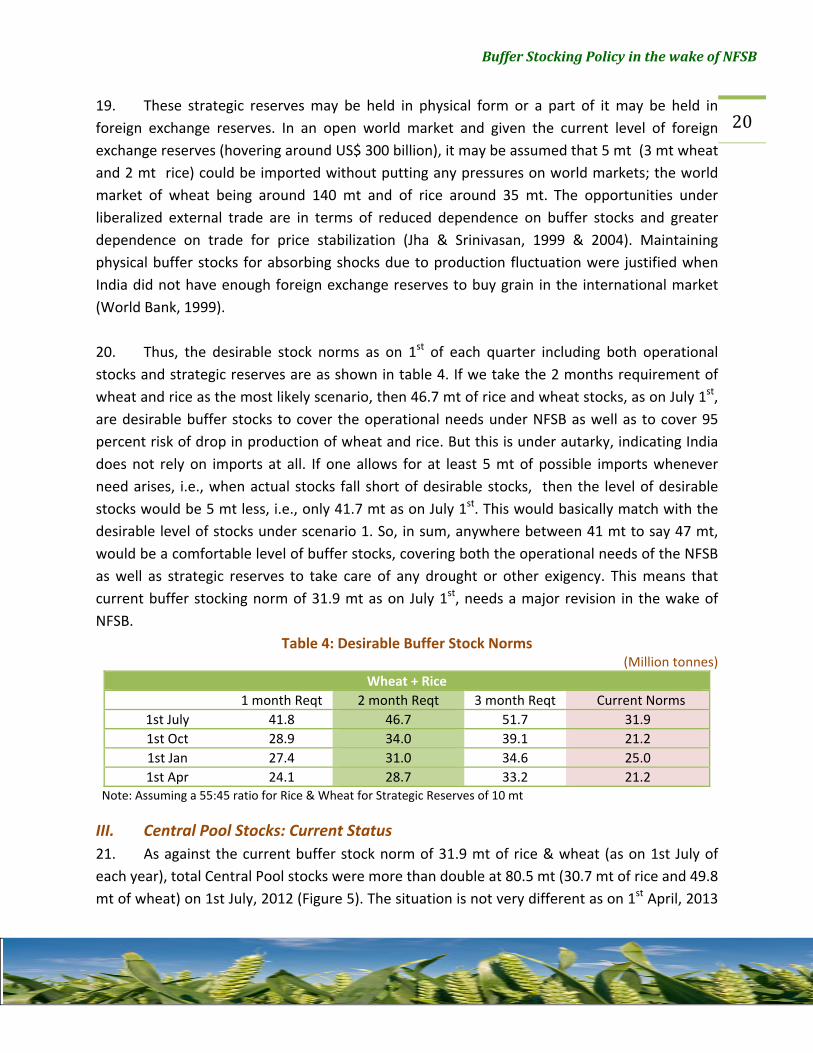
18. If we take the deviation of the actual output from the trend, the maximum decline
(excluding 2002‐03) for rice + wheat is 11.9 mt and for all cereals is 13.3 mt (Figure 4). The
maximum decline in procurement during the last twenty years has been 8.0 mt in 2006‐
07.Thus, the desirable level of strategic reserves could be assumed as 10 ‐12 mt. Assuming a
55:45 ratio for rice and wheat (ratio in total procurement during 2007‐08 to 2011‐12), and a
total strategic reserve of 10 mt, one can then keep 5.5 mt of rice and 4.5 mt of wheat.
Figure 4: Deviation from the trend in Rice + Wheat
Source: DES
0.3
8.5
2.2
11.4
28.5
8.9 10.06.1
‐30
‐20
‐10
0
10
20
30
1991‐92
1992‐93
1993‐94
1994‐95
1995‐96
1996‐97
1997‐98
1998‐99
1999‐00
2000‐01
2001‐02
2002‐03
2003‐04
2004‐05
2005‐06
2006‐07
2007‐08
2008‐09
2009‐10
2010‐11
2011‐12
2012‐13
Million Tonnes
120
130
140
150
160
170
180
190
200
210
1990‐91
1991‐92
1992‐93
1993‐94
1994‐95
1995‐96
1996‐97
1997‐98
1998‐99
1999‐00
2000‐01
2001‐02
2002‐03
2003‐04
2004‐05
2005‐06
2006‐07
2007‐08
2008‐09
2009‐10
2010‐11
2011‐12
2012‐13
Million Tonnes
20.8
11.9
6.9
BufferStockingPolicyinthewakeofNFSB
2019. These strategic reserves may be held in physical form or a part of it may be held in
foreign exchange reserves. In an open world market and given the current level of foreign
exchange reserves (hovering around US$ 300 billion), it may be assumed that 5 mt (3 mt wheat
and 2 mt rice) could be imported without putting any pressures on world markets; the world
market of wheat being around 140 mt and of rice around 35 mt. The opportunities under
liberalized external trade are in terms of reduced dependence on buffer stocks and greater
dependence on trade for price stabilization (Jha & Srinivasan, 1999 & 2004). Maintaining
physical buffer stocks for absorbing shocks due to production fluctuation were justified when
India did not have enough foreign exchange reserves to buy grain in the international market
(World Bank, 1999).
20. Thus, the desirable stock norms as on 1st of each quarter including both operational
stocks and strategic reserves are as shown in table 4. If we take the 2 months requirement of
wheat and rice as the most likely scenario, then 46.7 mt of rice and wheat stocks, as on July 1st,
are desirable buffer stocks to cover the operational needs under NFSB as well as to cover 95
percent risk of drop in production of wheat and rice. But this is under autarky, indicating India
does not rely on imports at all. If one allows for at least 5 mt of possible imports whenever
need arises, i.e., when actual stocks fall short of desirable stocks, then the level of desirable
stocks would be 5 mt less, i.e., only 41.7 mt as on July 1st. This would basically match with the
desirable level of stocks under scenario 1. So, in sum, anywhere between 41 mt to say 47 mt,
would be a comfortable level of buffer stocks, covering both the operational needs of the NFSB
as well as strategic reserves to take care of any drought or other exigency. This means that
current buffer stocking norm of 31.9 mt as on July 1st, needs a major revision in the wake of
NFSB.
Table 4: Desirable Buffer Stock Norms (Million tonnes)
Wheat + Rice
1 month Reqt 2 month Reqt 3 month Reqt Current Norms
1st July 41.8 46.7 51.7 31.9
1st Oct 28.9 34.0 39.1 21.2
1st Jan 27.4 31.0 34.6 25.0
1st Apr 24.1 28.7 33.2 21.2 Note: Assuming a 55:45 ratio for Rice & Wheat for Strategic Reserves of 10 mt
III. Central Pool Stocks: Current Status
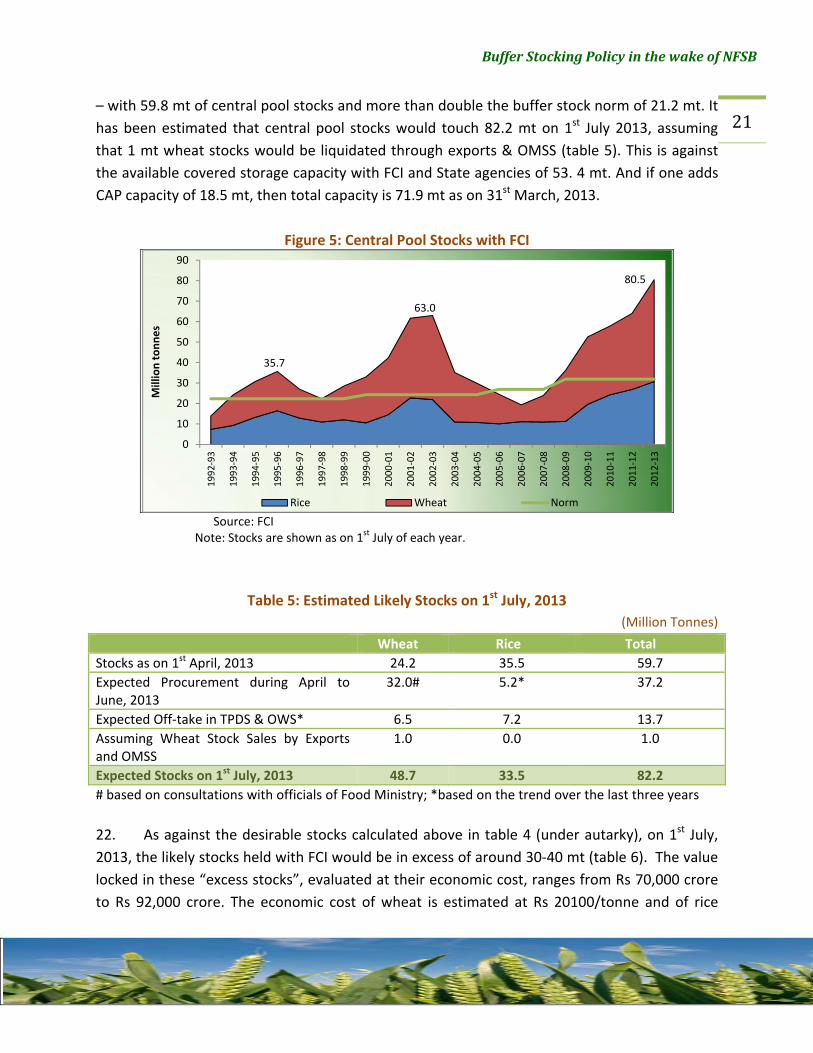
21. As against the current buffer stock norm of 31.9 mt of rice & wheat (as on 1st July of
each year), total Central Pool stocks were more than double at 80.5 mt (30.7 mt of rice and 49.8
mt of wheat) on 1st July, 2012 (Figure 5). The situation is not very different as on 1st April, 2013
BufferStockingPolicyinthewakeofNFSB
21– with 59.8 mt of central pool stocks and more than double the buffer stock norm of 21.2 mt. It
has been estimated that central pool stocks would touch 82.2 mt on 1st July 2013, assuming
that 1 mt wheat stocks would be liquidated through exports & OMSS (table 5). This is against
the available covered storage capacity with FCI and State agencies of 53. 4 mt. And if one adds
CAP capacity of 18.5 mt, then total capacity is 71.9 mt as on 31st March, 2013.
Figure 5: Central Pool Stocks with FCI
Source: FCI Note: Stocks are shown as on 1st July of each year.
Table 5: Estimated Likely Stocks on 1st July, 2013
(Million Tonnes)
Wheat Rice Total
Stocks as on 1st April, 2013 24.2 35.5 59.7
Expected Procurement during April to June, 2013
32.0# 5.2* 37.2
Expected Off‐take in TPDS & OWS* 6.5 7.2 13.7
Assuming Wheat Stock Sales by Exports and OMSS
1.0 0.0 1.0
Expected Stocks on 1st July, 2013 48.7 33.5 82.2
# based on consultations with officials of Food Ministry; *based on the trend over the last three years
22. As against the desirable stocks calculated above in table 4 (under autarky), on 1st July,
2013, the likely stocks held with FCI would be in excess of around 30‐40 mt (table 6). The value
locked in these “excess stocks”, evaluated at their economic cost, ranges from Rs 70,000 crore
to Rs 92,000 crore. The economic cost of wheat is estimated at Rs 20100/tonne and of rice
35.7
63.0
80.5
0
10
20
30
40
50
60
70
80
90
1992‐93
1993‐94
1994‐95
1995‐96
1996‐97
1997‐98
1998‐99
1999‐00
2000‐01
2001‐02
2002‐03
2003‐04
2004‐05
2005‐06
2006‐07
2007‐08
2008‐09
2009‐10
2010‐11
2011‐12
2012‐13
Million tonnes
Rice Wheat Norm
BufferStockingPolicyinthewakeofNFSB
22around Rs 26,430/tonne for FY 2013‐14. This infusion of “excess” money into the economy
without corresponding flow of goods is evident in the paradox of rising prices of rice & wheat
amidst overflowing stocks in government godowns.
Table 6: Likely Excess Stocks as on 1st July, 2013
Scenario (as on 1st July) Likely Excess Stocks (Million Tonnes)
Value of Excess Stocks at Economic Cost (Rs crore)
I:1 month Requirement 40.4 (19.1R + 21.3W)
93,294
II: 2 month Requirement 35.4 (16.4R + 19.0W)
81,535
III: 3 month Requirement 30.5 (13.8R + 16.7W)
70,040
Note: Economic cost for 2013‐14 for wheat is Rs 2010/qtl and Rs 2643/qtl for rice.
IV. The Way Forward
23. The analysis in above sections clearly indicates that currently, there are ‘excessive’
stocks with the central agencies. This is despite the increased desirable buffer stocks needed to
be held in light of NFSB. It is creditable that India is currently in a state of ‘plenty’ but holding
excessive stocks in godowns, which serve no worthwhile purpose, begs the question of
economic efficiency in public expenditure. It is a simple question of putting, say, Rs 80,000
crore to some useful purpose. And here are our suggestions to the government with a view to
make food management meaningful and efficient, even with NFSB in its current form. And our
suggestions basically ask for liquidating these “excessive” stocks in various forms as delineated
below.
24. Firstly, the states where PDS systems have been integrated with ‘Aadhaar’ and the
probability of leakages in the distribution system reduced significantly may be allowed to lift 3‐
6 months of their off‐take requirements at a discounted price, where the discount would be
equal to the cost of carrying by the FCI. These states in turn can ask the consumers to lift their
3‐6 months quota at a time with a discount on the PDS price. The benefit is that the consumers
under existing PDS can get larger quantities at the beginning itself, releasing some storage
space for FCI. The danger is that if the PDS is leaky, the off‐takes can come back to the
procurement centre as the MSP would be much higher than the PDS price, and this can lead to
another food scam.
25. Another option could be OMSS at the last year’s MSP plus a maximum of 5 percent
towards taxes/cesses etc. At these rates wheat price will be Rs 13500 per tonne and rice price
BufferStockingPolicyinthewakeofNFSB
23will be Rs 19000 per tonne, say ex‐Punjab. The losses incurred would be administrative
expenses in procurement and statutory levies (which are in the nature of centre‐state fund
transfers), but this would still save the large costs of carrying excess stocks as well as the
capital that is locked in these stocks. If these stocks are liquidated, then the value encashed can
help in bridging the fiscal deficit and also improve the flow of rice & wheat in the economy
where cereal inflation is still hovering in double digits. Unloading about 8‐10 mt of wheat and
rice in the domestic market (OMSS) can surely tame and bring down cereal inflation.
26. The third option would be to allow the PSUs and private sector to export another 10‐12
mt or so at an ex‐Punjab price of Rs 13500/tonne for wheat and Rs 19,000/tonne for rice. This
would help tide over the current account deficit as well as the deficit financing at home. The
current price being offered for wheat export ex‐Punjab is Rs 14840/tonne, which includes
statutory levies etc that FCI has paid during the procurement process. But this is not attracting
much private sector participation, and the PSUs themselves cannot export either, as the global
wheat prices are showing a declining trend. If early action is not taken, and we feel India is
already late in this by at least 4‐5 months, then the chances are that India will have to carry this
“excess” level of stocks for the next two years, unnecessarily costing the economy heavily
without any purpose and that too at a time when CAD and fiscal deficit are already very
stretched.
27. Fourthly, the availability of these surplus stocks also opens up an opportunity for India
to be generous to regional and global needs. India could contribute 2‐3 mt for a South Asian
foodgrain reserve, an idea which was floated after the 2007‐08 food price crisis. There could
also be a window to use these surplus stocks for extending humanitarian aid to Afghanistan and
some other African countries through the World Food Programme (WFP) or through bilateral
cooperation. This can bring rich dividends to help the poor of the world, and also political
goodwill for India, which is aspiring to be a global player.
28. Once the current problem of excess buffer stocks is solved, the provisions of physical
entitlements under NFSB itself need to be reviewed. In recent years, the government has
procured more than one‐thirds of the total production and more than half of the marketed
surplus of rice & wheat. Such large scale public procurement has strangulated the private trade
(as has been the case in Punjab, Haryana and now Madhya Pradesh & Chhattisgarh). Of the
total market arrivals of wheat and rice in these states, more than 80‐90 percent is bought by
the government, indicating a de‐facto state take‐over of grain trade. This reminds one of the
failed experiment of wheat trade take‐over in 1973‐74. We need to learn lessons from our
failures without hesitation. Bringing back the private sector into grain trade should be high on
BufferStockingPolicyinthewakeofNFSB
24government agenda, and not driving them out of markets. Monopsony of any one player, be it
the government or the private sector, is counter to the spirit of competition, and the nations
who have tried to destroy competition in markets have suffered badly. India needs to avoid
that path, and work towards “getting the markets right”. One should remember that the cost
of a simple departmental labour (loader) of FCI is 7 to 8 times the cost of contract labour doing
the same job. With government monopsony, these costs are going to escalate and so would be
the statutory levies being imposed by various state governments, making the entire operation
of NFSB a very high cost phenomenon.
29. It may also be noted here that internationally, conditional cash transfers (CCTs), rather
than physical distribution of subsidized food, have been found to be much more efficient in
achieving food and nutritional security. The case of Brazil with the largest CCT scheme, which
has been instrumental in replacing poorly targeted subsidies, improving the quality of delivery
of services and achieving desired improvements in social welfare, is worth emulating here.
Therefore, there is an exigency to reframe the foodgrains policy with movement from physical
handling and distribution of foodgrains to cash transfers/food coupons/smart cards and cover
food subsidy under the ‘Direct Benefit Transfer’ (DBT) scheme.
30. In the first phase, surplus states (in terms of production and consumption of cereals)
and cities with a population of 1 million or more (currently 33 as per 2011 census) could move
straightaway to cash transfers7. States which are deficit in production may continue with the
physical handling of foodgrains. One size may not fit all the states and there is need to innovate
in our food management and welfare policies so that same expenditure brings much higher
returns in terms of tackling hunger and malnutrition of this country. There are no two opinions
about the fact that growth will not have much meaning if we are not able to drastically cut
down hunger and malnutrition. The issue is how best it can be done with limited resources and
more efficiently.
31. If one moves to the best international practices towards conditional cash transfers, the
desirable level of buffer stocks could be just 10‐15 mt, which basically takes care of the
exigencies. This can save and release large amount of government expenditure, which in turn
can be used to augment the level of welfare schemes. Our estimates, given in an earlier
discussion paper of CACP, reveal a potential savings of Rs 40,000 crore per year, with a switch
from physically handling grains under NFSB to conditional cash transfers. And that is surely not
a small sum!
7 CACP Discussion paper No. 4
BufferStockingPolicyinthewakeofNFSB
25References
1. Nand, S. & James P. Houck (1971), “Buffer Stocks of Foodgrains in India‐The economics
of their operation and potential size”, Working Paper, University of Minnesota.
2. World Bank (1999), “India: Foodgrain marketing policies: reforming to meet food
security needs”, Rural Development Unit, South Asia Region, Working Paper, Report No.
18329.
3. Jha, Shikha and P.V. Srinivasan (1999), “Grain price stabilization in India: Evaluation of
policy alternatives,” Agricultural Economics 21, 93‐108.
4. Schiff, M (1993), "India's Food Procurement and Distribution Policy, Impact on Prices and
Welfare,” Journal of Development Economics, Vol. 42, pp 387‐397.
5. Bigman, David, Shlomo Reutlinger (1979), “Food Price and Supply Stabilization: National
Buffer Stocks and Trade Policies,” American Journal of Agricultural Economics 61, 657‐
667.
6. Jha, S. and P.V. Srinivasan (2004), “Achieving food security in a cost effective way:
Implications of domestic deregulation and reform under liberalized trade,” MTID
discussion paper no. 67, IFPRI
7. Government of India (2002a). Report of High Level Committee on Long‐Term Grain
Policy, Department of Food and Public Distribution. Ministry of Consumer Affairs, Food
and Public Distribution.
8. Chand, R. (2002), “Government intervention in food grain markets in the new context”,
(Study Report Prepared for Ministry of Consumer Affairs, Food and Public Distribution),
National Centre for Agricultural Economics and Policy Research.
9. Chand, R. & Pratap Birthal (2011), “Foodgrain stock requirement during twelfth five‐year
plan”, NCAP Working Paper 9
10. Chand Ramesh (2005). Whither India’s Food Policy: From Food Security to Food
Deprivation, Economic and Political Weekly, V.40 (12): 1055– 1061, March 12, 2005.