Embed Size (px)
Citation preview

sensors
Technical Note
Concept and Realization of a Novel Test Method Using aDynamic Test Stand for Detecting Persons by Sensor Systemson Autonomous Agricultural Robotics
Christian Meltebrink 1,2,3,* , Tom Ströer 1 , Benjamin Wegmann 3 and Cornelia Weltzien 2,4
and Arno Ruckelshausen 1
�����������������
Citation: Meltebrink, C.; Ströer, T.;
Wegmann, B.; Weltzien, C.;
Ruckelshausen, A. Concept and
Realization of a Novel Test Method
Using a Dynamic Test Stand for
Detecting Persons by Sensor Systems
on Autonomous Agricultural
Robotics. Sensors 2021, 21, 2315.
https://doi.org/10.3390/s21072315
Academic Editor: Giovanni Agati
Received: 1 March 2021
Accepted: 23 March 2021
Published: 26 March 2021
Publisher’s Note: MDPI stays neutral
with regard to jurisdictional claims in
published maps and institutional affil-
iations.
Copyright: © 2021 by the authors.
Licensee MDPI, Basel, Switzerland.
This article is an open access article
distributed under the terms and
conditions of the Creative Commons
Attribution (CC BY) license (https://
creativecommons.org/licenses/by/
4.0/).
1 Faculty of Engineering and Computer Science, University of Applied Sciences Osnabrück,49076 Osnabrück, Germany; [email protected] (T.S.); [email protected] (A.R.)
2 Agromechatronic, Technische Universität Berlin, 10623 Berlin, Germany; [email protected] B. Strautmann & Söhne GmbH u. Co. KG, 49196 Bad Laer, Germany; [email protected] Leibniz Institute for Agricultural Engineering and Bioeconomy (ATB), 14469 Potsdam, Germany* Correspondence: [email protected]
Abstract: As an essential part for the development of autonomous agricultural robotics, the functionalsafety of autonomous agricultural machines is largely based on the functionality and robustness ofnon-contact sensor systems for human protection. This article presents a new step in the developmentof autonomous agricultural machine with a concept and the realization of a novel test method usinga dynamic test stand on an agricultural farm in outdoor areas. With this test method, commerciallyavailable sensor systems are tested in a long-term test around the clock for 365 days a year and 24 ha day on a dynamic test stand in continuous outdoor use. A test over a longer period of time isneeded to test as much as possible all occurring environmental conditions. This test is determinedby the naturally occurring environmental conditions. This fact corresponds to the reality of unpre-dictable/determinable environmental conditions in the field and makes the test method and teststand so unique. The focus of the developed test methods is on creating own real environmentdetection areas (REDAs) for each sensor system, which can be used to compare and evaluate theautonomous human detection of the sensor systems for the functional safety of autonomous agricul-tural robots with a humanoid test target. Sensor manufacturers from industry and the automotivesector provide their sensor systems to have their sensors tested in cooperation with the TÜV.
Keywords: image-based sensor systems; object detection systems; safety of autonomous agriculturemachines; test stand; humanoid test target
1. Introduction
Work on the development of autonomous machines has been going on for years.In the agricultural sector, technical solutions for autonomous machines have already beendeveloped. These solutions range from autonomous feeding mixer [1], to autonomousfield robots [2], to already 20-year-old autonomous tractors [3]. In addition to the tech-nical realization of autonomous functions, a key technology is the functional safety ofautonomous agricultural machinery. It depends largely on the functionality and robustnessof non-contact sensor systems for human protection. Solutions that have already estab-lished themselves in the industrial environment meet new challenges in the agriculturalsector and demand a new approach.
In a final thesis, first approaches for test scenarios for the validation of autonomousfield robots with non-contact sensor systems were developed in 2015 [4]. Tiusanen et al. [5]give an overview of the current state of safety requirements for autonomous machines andshow three different approaches for a safety concept. Basu et al. [6] shed light directly onthe legal situation for the operation of small agricultural robots and Ingibergsson [7] devel-oped a rule-based language to force safety requirements on cameras and computer vision.
Sensors 2021, 21, 2315. https://doi.org/10.3390/s21072315 https://www.mdpi.com/journal/sensors

Sensors 2021, 21, 2315 2 of 18
International expert groups, e.g., European Agricultural Machinery Association (CEMA),are working on specifications for agricultural machinery manufacturers for the selection ofnon-contact sensor technology for human protection and the validation of autonomousagricultural machinery. Despite these activities, the demand of non-contact sensor technol-ogy, which is approved for outdoor human protection, increases. The IEC 62998-1:2019 [8]defines specifications for the development and evaluation of safety-relevant sensors forthe protection of persons in outdoor areas. It defines an assistance to evaluate and de-velop sensor systems individually for the planned field of application. Jakobs et al. [9]proposes a concrete procedure based on the standard and the integration into the overalldevelopment process.
For the required proof of the detection capability of non-contact sensor systems inoutdoor areas, a concept and the realization of a novel test method is presented in this articleand implemented by a test stand for sensor systems. With this test method, commerciallyavailable sensor systems are tested in a long-term test around the clock for 365 days ayear and 24 h a day on a dynamic test stand in continuous outdoor use. A test over alonger period of time is needed to test as much as possible all occurring environmentalconditions. This leads to the fact that it is a test that is determined by the naturally occurringenvironmental conditions and therefore cannot be planned. This corresponds to the realityof unpredictable/determinable environmental conditions in the field and makes the testmethod and test stand so unique. The focus of the developed test methods is on testing theautonomous human detection of the sensor systems for the functional safety of autonomousagricultural robots with a humaniod test target.
Since the verification of safe human detection for the functional safety of autonomousagricultural machinery is not universally possible due to the variety of application areasand environmental conditions, the first test stand has been implemented for a specific ap-plication example. Here, the autonomous feeding mixer [1] of the company B. Strautmannund Söhne GmbH & Co. KG is used, as it is one of the agricultural robots that is furthestalong the road to market, has defined operating limits and operates at low speeds (max.2 m/s). In Figure 1, the feeding mixer is shown in autonomous operation. The technicalrealization is largely completed and a new safety concept is developed in cooperation withthe TÜV. In order to achieve the set safety goals, a non-contact sensor system is required,which reliably detects humans outside at an early stage, that the autonomous machinereaches a safe state.
Figure 1. An unmanned feeding mixer is already working with autonomous driving and workingfunctionality. In the developed safety concept, a non-contact sensor system is still missing for thehuman protection at the autonomous feeding mixer, which may be used both for indoor and outdooron an agricultural environment.
For this reason, an individual test stand is developed for the autonomous feed mixerusing the new test methods at the University of Applied Sciences Osnabrück in cooperation

Sensors 2021, 21, 2315 3 of 18
with the company B. Strautmann und Söhne GmbH & Co. KG, the TÜV and the TechnischeUniversität Berlin in the research project “Agro-Safety”, funded by the BMBF and B.Strautmann und Söhne GmbH & Co. KG. With this dynamic test stand, commerciallyavailable sensor systems are tested in a long-term test around the clock for 356 days ayear and 24 h a day in continuous outdoor use and a system will be selected that meetsthe individual requirements from the specific environmental conditions and machineparameters. If one sensor system alone does not meet the requirements, a combinationof several sensor systems is possible. This combination can be realized on the basis ofdifferent fusion options.
2. Concept of a Test Stand
As an impact of research into industry, a dynamic test stand has been developed andrealized on an agricultural farm for the very first time. Commercially available sensor sys-tems are tested in a long-term test around the clock for 365 days a year and 24 h a day on adynamic test stand in continuous outdoor use. A test over a longer period of time is neededto test as much as possible all occurring environmental conditions. This leads to the factthat it is a test that is determined by the naturally occurring environmental conditions andtherefore cannot be planned. This corresponds to the reality of unpredictable/determinableenvironmental conditions in the field and makes the test method and test stand so unique.Due to the wide variety of environmental conditions, a sensor system will always needto be tested individually for the specific location of its autonomous robot. For this reason,the test stand is located between a silo installation and a cultivated agricultural area. Thus,the sensor systems are exposed to the general environmental conditions in the outdoorarea, the environmental conditions in a silo plant and a cultivated field. In the silo, variousparticles of different sizes can be present in the air during silaging or feed intake, which candisturb the sensor systems. Dust formation during the summer months is, among otherthings, an interesting factor for sensor systems on a cultivated, agricultural field.
2.1. The Sensors
Eight different sensor manufacturers from industry and the automotive sector providea total of 15 sensor systems with six different measurement principles for the test stand.
In this article, a sensor system is understood as the combination of a measurementunit, the pure sensor, and the measurement data interpretation. The sensor can be realizedby different measurement principles (e.g., LiDAR, radar, etc.) and generates measurementprinciple dependent raw data. In the measurement data interpretation, the raw data areinterpreted and a decision is created, if an object is detected or not. For this reason, theterm “object detection system (ODS)” is introduced at this point of the article and usedinstead of “sensor system”. In the following, an ODS is understood as a sensor with anevaluation unit.
The 15 ODSs are composed of the following measurement principles:
• Three single-line LiDAR sensors with outdoor or safety features.• One multi-line LiDAR sensor.• One ToF camera.• One stereo camera.• Three radar sensors with 24 GHz or 77 GHz.• Six ultrasonic sensors, two from each manufacturer with different detection ranges.
Thus, six different sensor types are tested simultaneously on the test stand and arecompared with each other under different environmental conditions. It is important thatthree groups are formed and are not tested simultaneously but one after the other. Eachgroup is assigned only to ODS with measuring principles that cannot influence each other.Due to the same measuring principles, the ODS can interfere with each other or with oneanother. The ODSs are optimally adjusted to the expected environmental conditions onsite at the test stand by the respective manufacturers. Thus, a manufacturer independent
Sensors 2021, 21, 2315 4 of 18
test of the ODS can be guaranteed, without setting errors due to ignorance can influencethe test result.
2.2. The Test Target
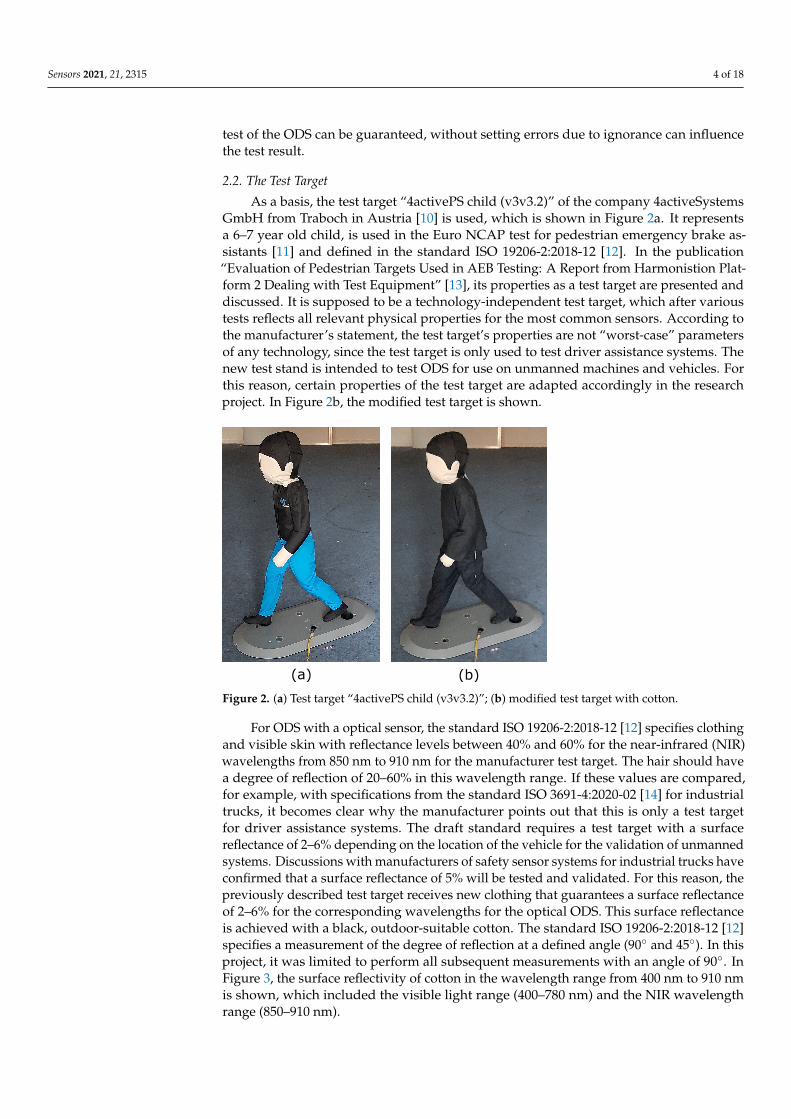
As a basis, the test target “4activePS child (v3v3.2)” of the company 4activeSystemsGmbH from Traboch in Austria [10] is used, which is shown in Figure 2a. It representsa 6–7 year old child, is used in the Euro NCAP test for pedestrian emergency brake as-sistants [11] and defined in the standard ISO 19206-2:2018-12 [12]. In the publication“Evaluation of Pedestrian Targets Used in AEB Testing: A Report from Harmonistion Plat-form 2 Dealing with Test Equipment” [13], its properties as a test target are presented anddiscussed. It is supposed to be a technology-independent test target, which after varioustests reflects all relevant physical properties for the most common sensors. According tothe manufacturer’s statement, the test target’s properties are not “worst-case” parametersof any technology, since the test target is only used to test driver assistance systems. Thenew test stand is intended to test ODS for use on unmanned machines and vehicles. Forthis reason, certain properties of the test target are adapted accordingly in the researchproject. In Figure 2b, the modified test target is shown.
(a) (b)
Figure 2. (a) Test target “4activePS child (v3v3.2)”; (b) modified test target with cotton.
For ODS with a optical sensor, the standard ISO 19206-2:2018-12 [12] specifies clothingand visible skin with reflectance levels between 40% and 60% for the near-infrared (NIR)wavelengths from 850 nm to 910 nm for the manufacturer test target. The hair should havea degree of reflection of 20–60% in this wavelength range. If these values are compared,for example, with specifications from the standard ISO 3691-4:2020-02 [14] for industrialtrucks, it becomes clear why the manufacturer points out that this is only a test targetfor driver assistance systems. The draft standard requires a test target with a surfacereflectance of 2–6% depending on the location of the vehicle for the validation of unmannedsystems. Discussions with manufacturers of safety sensor systems for industrial trucks haveconfirmed that a surface reflectance of 5% will be tested and validated. For this reason, thepreviously described test target receives new clothing that guarantees a surface reflectanceof 2–6% for the corresponding wavelengths for the optical ODS. This surface reflectanceis achieved with a black, outdoor-suitable cotton. The standard ISO 19206-2:2018-12 [12]specifies a measurement of the degree of reflection at a defined angle (90◦ and 45◦). In thisproject, it was limited to perform all subsequent measurements with an angle of 90◦. InFigure 3, the surface reflectivity of cotton in the wavelength range from 400 nm to 910 nmis shown, which included the visible light range (400–780 nm) and the NIR wavelengthrange (850–910 nm).

Sensors 2021, 21, 2315 5 of 18
0.5
0.7
0.9
1.1
1.3
1.5
1.7
1.9
400 450 500 550 600 650 700 750 800 850 900
Reflectivity [%]
Wavelength [nm]
Figure 3. Surface reflectivity of the new cotton dress in the wavelength range from 400 nm to 910 nm.
It can be seen in Figure 3 that the new cotton has a reflectivity between 1.29% and1.85% in the wavelength range from 850 nm to 910 nm and falls below the normative rangeof 2–6%. Since a deterioration of the reflectivity is expected during permanent outdooruse, the low reflectivity is considered suitable. For systems, e.g., cameras, which do notonly work in the NIR wavelength range, the wavelength range between about 400 nm and780 nm in the visible light range is also presented in Figure 3. For this wavelength range,the new cotton has a reflectivity between 0.89% and 1.46%. The aging of the materialsduring outdoor use is checked and taken into account by spectral measurements.
In a project of the University of Applied Sciences Osnabrück [15], the radar reflectivityof a 24 GHz sensor war measured and verified with the data of the test target manufacturer.Comparative measurements with real people were also carried out. It was shown thatthe reflectivity of the test target is lower than that of an average 28-year-old male person.By comparing further reflection measurements with the manufacturer’s data, the studyconcludes that the reflection properties of an average person can be reproduced. The bodyheight of the test target is significantly smaller compared to the male test person and inthis ratio a lower reflection was also measured. For this reason, it is assumed that smallerpersons such as children have a similar reflection to the test target. In addition, the projectwork [15] investigated the effect of clothing on the radar reflectivity of the test target. Asdescribed in the publication [13], it was confirmed that clothing has a negligible effect onthe reflective properties of a person or test target. Thus, it could be demonstrated that thenew cotton clothing has no significant effect on the reflective properties of the test target.
The ultrasonic reflective properties of the test target are considered realistic and areleft unchanged by the clothing and round shapes of the test target to simulate people.
2.3. Speed Definition
All ODSs are moved simultaneously within a defined movement space. The ODSand the target are accelerated with 8 m
s2 . The ODS is moved at a speed of 2 ms . This speed
corresponds to the maximum speed of the autonomous feeding mixer.In the Euro NCAP test for testing pedestrian emergency brake assistants, the maximum
tested speed of pedestrians is 8 kmh (approximately 2.22 m
s ). This speed simulates a runningadult pedestrian [11]. A child pedestrian running onto the street is simulated with 5 km
h(approx. 1.38 m
s ) [11]. The standard ISO 19237:2017-12 [16] for intelligent transport systemsdefine as well a pedestrian speed of 5 km
h (approximately 1.38 ms ). If speed values from
other sources are compared with these values, it can be assumed that these values areaverage speeds. Bartels et al. [17] have compared different sources with pedestrian speedsin their publication. According to Bartels et al. [17] their sources all define similar values.

Sensors 2021, 21, 2315 6 of 18
According to the source they cited, Kramer et al. [18], men at the age of 35 move fastest at6.78 m
s . This speed should correspond to a race without an acceleration phase. Childrenat the age of 5 years run without an acceleration phase according to Kramer et al. [18] amaximum of 3.51 m
s (male) and 3.49 ms (female).
A test target velocity of 2.3 ms is used in this project. This value corresponds approx-
imately to the value of 2.22 ms which is defined in the Euro NCAP tests [11] which is
mentioned above. As described, this speed corresponds to the maximum tested speed andis used for jogging, adult persons. The test target simulates a running child aged 6–7 yearsaccording to the ISO 19206-2:2018-12 standard [12]. This child is simulated with approxi-mately 1.38 m
s for the Euro NCAP test [11]. Summarizing the defined speed of 2.3 ms does
not reach the maximum speed of 3.51 ms from Kramer et al. [18], but still corresponds to
over 80% of pedestrian speeds [19] according to a graph of a study by the Japanese Societyof Automotive Engineers (JSAE). Additionally, the target speed corresponds approximatelyto the maximum tested speed of the Euro NCAP tests [11]. Even higher speeds from othersources were not considered because faster objects would have to be detected further aheadin order to be able to react to them early. This early detection of objects is not simulated andwill be tested on this test stand. An overview of pedestrian speeds and the classification ofthe applied test target speed are shown in Table 1.
Table 1. Overview of pedestrian speeds and the classification of the applied test target speed.
Speed Source Speed Value
male children aged 5 years (Kramer et al.) [18]: 3.51 ms
running adult (Euro NCAP) [11]: 2.22 ms
child aged 6–7 years (Euro NCAP) [11]: 1.38 ms
adult (BS ISO 19237:2017-12-15) [16]: 1.38 ms
child aged 6–7 years (project “Agro-Safety”): 2.3 ms
2.4. Technical Setup
For a better understanding of the following test methods, this section describes thebasic technical concept of a test stand that can be used to implement the test methodsfor a specific application example. The described dimensions and technical parametersof the concept below can be varied and adapted depending on the application example.In the following, the basic technical concept is adapted for our application example, theautonomous feeding mixer.
The test stand consists of a movement space for the ODS and a movement space fora test target, which must be recognized by the ODS. This movement space is realized bymeans of two two-axis gantries, each with an area of 4 m length and 4 m width on a concretebase of 10 m length and 6 m width in total. With the consideration of safety distances,a field of 3 m length and 3 m width remains for the ODS. Taking acceleration and brakingdistances into account, a travel distance with constant speed of 2 m
s of 2.75 m length and2.75 m width remains. The ODSs are attached to a sensor holder that is positioned verticallyupwards. On this sensor holder, there is the possibility to mount the ODS at four differentheights. In this way, different mounting positions can be realized on a mobile machine. Forbetter comparability of identical measuring principles, care is taken to ensure that this ODSare at the same height. Figure 4 shows a schematic drawing of the test stand. The drawnlength ratios are not shown in reality.
As shown in Figure 4, with the second two-axis gantry, a field of 3.25 m length and3.25 m width is realized for the test target, taking into account safety clearances, as a rangeof motion. Taking acceleration and braking distances into account, a travel distance withconstant speed of 2.3 m
s of 3 m length and 3 m width remains.With the previously shown values, a specified detection area (SDA) of up to 5.75 m
length and 5.5 m width could be tested with such a test stand. The SDA is a region ofinterest which can be defined for the ODS. The object detection systems can focused on theobject detection on this area. The length of 5.75 m results from the addition of the travel

Sensors 2021, 21, 2315 7 of 18
distances of the ODS of 2.75 m and the test target of 3 m when the ODS is aligned in thedirection of the test target. For ODS with a wide detection range, the test stand can test theleft and right side of the specified detection field of the ODS separately. For this reason, thetotal width of 5.5 m results from the double travel of the ODS of 2.75 m.
At the upper left corner of the concrete base in Figure 4, a weather station and avisibility measuring device is placed. The test stand control with the data recording islocated at the lower left edge of the concrete base.
10000 mm
6000 m
m
4000 mm 4000 mm
4000 m
m
2750 m
m
2750 mm 3000 mm
3000 m
m
approx.200 mm
approx.500 mm
approx.700 mm
approx.1000 mm
sensor holder
servo motor
servo motor
servo motor
servo motor
servo motor
servo motor
linear drive
ODS moving distance with 2 m/s target moving distance with 2.3 m/s
linear drive length
platform for test target
slide of the linear drive
weather station
Test stand control and data recording
concrete base
Figure 4. Top view in a schematic drawing of the test stand is shown and gives an overview of the dimensions of the teststand and the traverses of the object detection system (ODS) and target. The structure of the sensor holder is also shown.
2.5. The Test Method
The core of the test stand is a novel test method with different test scenarios. This testmethod creates real environment detection areas (REDAs), which can be used to compare dif-ferent ODSs with different measurement principles in different environmental conditions.
To record the REDA in the detection range of the ODS, the test target is moved throughthe specified detection area (SDA) from different directions on the basis of different testscenarios. The test stand can evaluate at which points the test target is detected by the ODSunder the current environmental conditions. The SDAs are defined by the manufacturersbefore the test will be started.
In the following section, the individual test scenarios of the test method are presented.Then, in Section 2.5.2,the formation of REDA is explained on the basis of the test scenarios.Section 2.5.3 describes the creation of REDAMs based on the REDAs and the considerationof the different environmental conditions. In Section 2.5.4, the evaluation of the REDAsand REDAMs is explained.

Sensors 2021, 21, 2315 8 of 18
2.5.1. Test Scenarios
The test method consists of different test scenarios to create the REDAs. The testscenarios represent different states of the ODS and the test target to determine the cor-responding REDAs under the different environmental conditions. A distinction is madebetween the states “static” and “dynamic”. The “static” state describes a stationary posi-tion, whereas the “dynamic” state represents a movement. This results in four differentcategories of test scenarios:
1. Category 1, static ODS, static test target: In this category, the ODS and the test targetare in a fixed position. This category represents, for example, the scenario where anautonomous agricultural machine is in park position and a person is standing directlyin front of the machine. It can be checked whether the ODS detects the person in thissituation at an early stage and thus no dangerous situation arises, for example, whenthe machine is started up.
2. Category 2, static ODS, dynamic test target: The second category describes a stationaryODS and a dynamic test target. This category is used to systematically cover the SDAof an ODS in the idle state. As a real situation, a person could run in front of theagricultural machine shortly before starting up. The ODS must detect the person andprevent the machine from starting up.
3. Category 3, dynamic ODS, static test target: In the third category, the ODS is movedand the test target is stationary. This category describes a standing person in front of amoving autonomous agricultural machine.
4. Category 4, dynamic ODS, dynamic test target: The fourth category describes amoving ODS and a moving test target. It simulates a moving autonomous agriculturalmachine and a person running into the roadway.
On the test stand, the ODSs are to be tested in the two states, “static” and “dynamic”,under different environmental conditions and the corresponding REDAs are to be deter-mined. Thus, the following 5 questions arose, which have to be answered on the basis ofthe tests:
1. Can the ODS detect the test target under the current environmental conditions?2. How large is the REDA of the ODS in static state under the current environmental
conditions?3. Are there gaps and detection faults in the REDA of the ODS in the static state under
the current environmental conditions?4. How large is the REDA of the ODS in dynamic state under the current environmental
conditions?5. Are there gaps and detection faults in the REDA of the ODS in the dynamic state
under the current environmental conditions?
The questions listed are intended to provide a quantitative evaluation of the test standand its test methods. The answers are given in Section 3.
The test categories will be realized by one or more test scenarios. Each test scenariowill be performed one after the other. Test scenario category 3 describes a real state at theautonomous agricultural machine. Due to the higher relative speeds between the ODSand the test target in test category 4, test category 3 is not used in the tests. It is also abalance between all possible test scenarios and the changing environmental conditions.If the tests take too long, the risk of not testing all scenarios under the same environmentalconditions increases. As a first approach, this test method is limited to the categories 1, 2and 4 described above. In a later validation on the autonomous feeding mixer, further testcategories have to be considered and proven. In the following figures, red arrows indicatethe movements during a test recording is performed. Black arrows indicate movementswithout test recording.
Test category 1 is represented by the first test scenario. The test target is moved in frontof the ODS into their specified detection area (SDA) (Figure 5). As soon as the ODS andthe test target are in a static state, the ODSs are activated and a measurement is performed.

Sensors 2021, 21, 2315 9 of 18
The detection capability is tested both directly before the ODS and also at the edges ofthe SDA.
ODS Target
specified detection area
TargetTarget
Target Target
Figure 5. In the first test scenario, the ODS and test target are in a static state. The test target is infront of the ODS in their specified detection area (SDA).
The REDA of the second test category can be realized by the test scenario 2. The ODSsare in the static state and the test target is in the dynamic state. The test target is movedinto the SDA from the left and right in a “zig-zag” movement from the ODS point of view(Figure 6a) and is then moved from front to back in a “zig-zag” movement into the SDAof the ODS from the point of view of the ODS (Figure 6b). This ensures that the SDA ispassed from left and right, but also from front to back.
ODS
Target
specified detection area
(a)
ODS
Target
specified detection area
(b)
Agenda figure 6:
test movement
positioning movement
Figure 6. In the second test scenario, the ODS is in static state and the test target in dynamic state. The test scenario isdivided in a lateral and longitudinal part: (a) In the lateral part, the test target is moved into the SDA from the left and rightin a “zig-zag” movement from the ODS’s point of view; (b) in the longitudinal part, the test target is moved from front toback in a “zig-zag” movement into the SDA of the ODS from the point of view of the ODS.
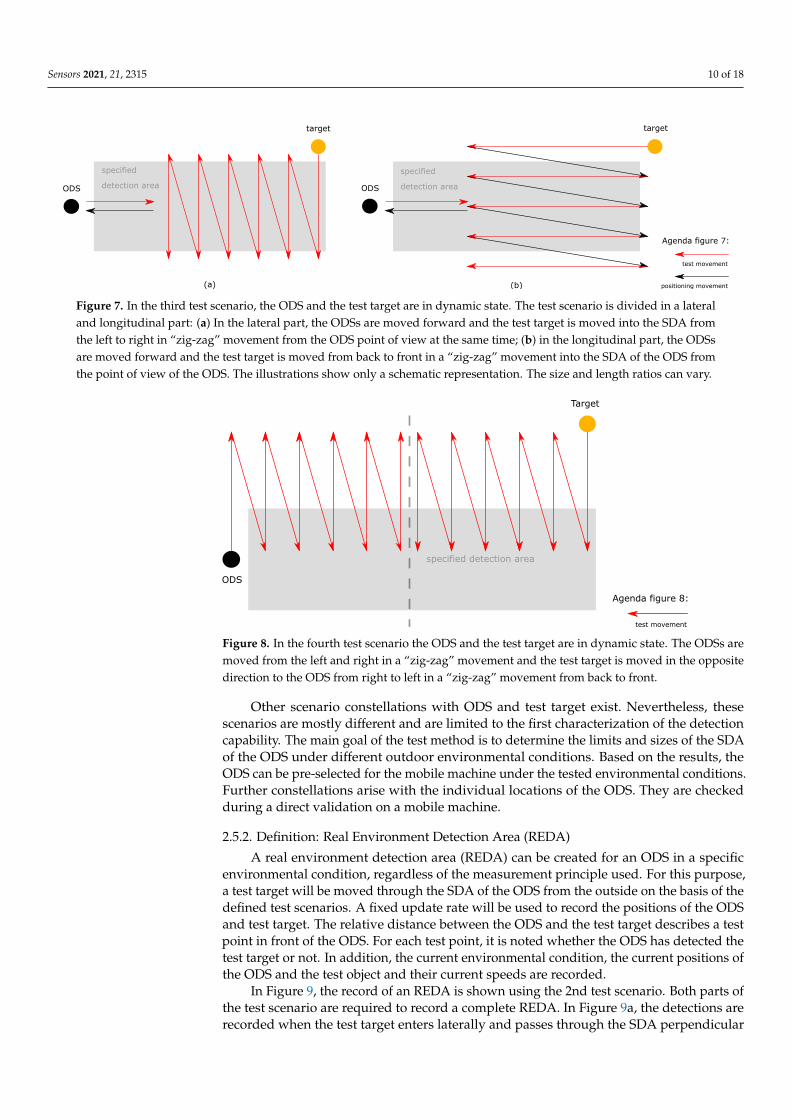
The REDA of the fourth test category can be realized by test scenario 3. The ODS andthe test target are in dynamic state. The ODSs are moved forward. At the same time, thetest target is moved into the SDA from the left to right in “zig-zag” movement from theODS’s point of view (Figure 7a). Then, similar to test scenario 2, the test target is movedfrom back to front in a “zig-zag” movement into the SDA of the ODS from the point ofview of the ODS (Figure 7b). This ensures that during the forward movement of the ODS,the SDA is passed through from left to right and from front to back.
For the fourth test category, in the fourth test scenario the ODS and the test target arein dynamic state. The ODS are moved from the left and right in a “zig-zag” movement andthe test target is moved in the opposite direction to the ODS from right to left in a “zig-zag”movement from back to front (Figure 8). With this test the “worst-case” scenario is tested,when persons are running sideways into the SDA. The ODSs are accelerated sidewaysduring cornering and a person runs into the SDA from the left or right.
Sensors 2021, 21, 2315 10 of 18
ODS
target
specified
detection area
(a)
ODS
(b)
target
specified
detection area
Agenda figure 7:
test movement
positioning movement
Figure 7. In the third test scenario, the ODS and the test target are in dynamic state. The test scenario is divided in a lateraland longitudinal part: (a) In the lateral part, the ODSs are moved forward and the test target is moved into the SDA fromthe left to right in “zig-zag” movement from the ODS point of view at the same time; (b) in the longitudinal part, the ODSsare moved forward and the test target is moved from back to front in a “zig-zag” movement into the SDA of the ODS fromthe point of view of the ODS. The illustrations show only a schematic representation. The size and length ratios can vary.
ODS
Target
specified detection area
Agenda figure 8:
test movement
Figure 8. In the fourth test scenario the ODS and the test target are in dynamic state. The ODSs aremoved from the left and right in a “zig-zag” movement and the test target is moved in the oppositedirection to the ODS from right to left in a “zig-zag” movement from back to front.
Other scenario constellations with ODS and test target exist. Nevertheless, thesescenarios are mostly different and are limited to the first characterization of the detectioncapability. The main goal of the test method is to determine the limits and sizes of the SDAof the ODS under different outdoor environmental conditions. Based on the results, theODS can be pre-selected for the mobile machine under the tested environmental conditions.Further constellations arise with the individual locations of the ODS. They are checkedduring a direct validation on a mobile machine.
2.5.2. Definition: Real Environment Detection Area (REDA)
A real environment detection area (REDA) can be created for an ODS in a specificenvironmental condition, regardless of the measurement principle used. For this purpose,a test target will be moved through the SDA of the ODS from the outside on the basis of thedefined test scenarios. A fixed update rate will be used to record the positions of the ODSand test target. The relative distance between the ODS and the test target describes a testpoint in front of the ODS. For each test point, it is noted whether the ODS has detected thetest target or not. In addition, the current environmental condition, the current positions ofthe ODS and the test object and their current speeds are recorded.
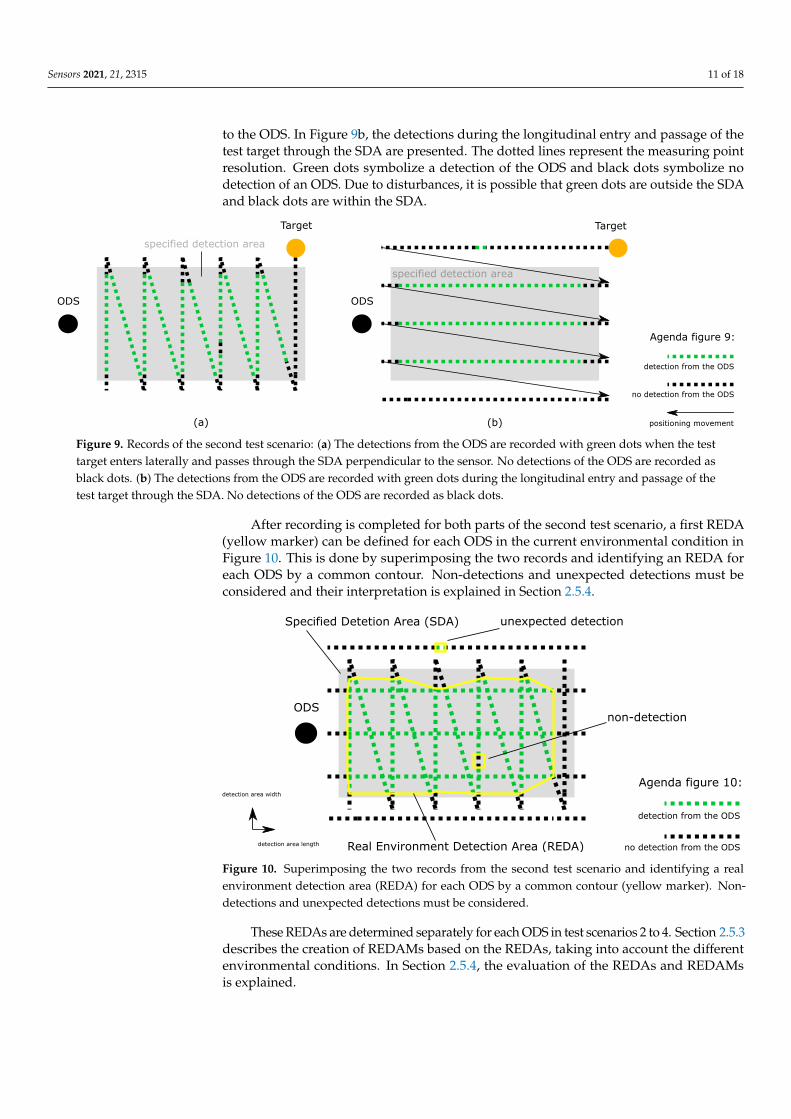
In Figure 9, the record of an REDA is shown using the 2nd test scenario. Both parts ofthe test scenario are required to record a complete REDA. In Figure 9a, the detections arerecorded when the test target enters laterally and passes through the SDA perpendicular
Sensors 2021, 21, 2315 11 of 18
to the ODS. In Figure 9b, the detections during the longitudinal entry and passage of thetest target through the SDA are presented. The dotted lines represent the measuring pointresolution. Green dots symbolize a detection of the ODS and black dots symbolize nodetection of an ODS. Due to disturbances, it is possible that green dots are outside the SDAand black dots are within the SDA.
ODS
Target
specified detection area
(a)
ODS
Target
specified detection area
(b)
Agenda figure 9:
detection from the ODS
no detection from the ODS
positioning movement
Figure 9. Records of the second test scenario: (a) The detections from the ODS are recorded with green dots when the testtarget enters laterally and passes through the SDA perpendicular to the sensor. No detections of the ODS are recorded asblack dots. (b) The detections from the ODS are recorded with green dots during the longitudinal entry and passage of thetest target through the SDA. No detections of the ODS are recorded as black dots.
After recording is completed for both parts of the second test scenario, a first REDA(yellow marker) can be defined for each ODS in the current environmental condition inFigure 10. This is done by superimposing the two records and identifying an REDA foreach ODS by a common contour. Non-detections and unexpected detections must beconsidered and their interpretation is explained in Section 2.5.4.
ODS
Specified Detetion Area (SDA)
Real Environment Detection Area (REDA)
non-detection
unexpected detection
detection area length
detection area width
Agenda figure 10:
detection from the ODS
no detection from the ODS
Figure 10. Superimposing the two records from the second test scenario and identifying a realenvironment detection area (REDA) for each ODS by a common contour (yellow marker). Non-detections and unexpected detections must be considered.
These REDAs are determined separately for each ODS in test scenarios 2 to 4. Section 2.5.3describes the creation of REDAMs based on the REDAs, taking into account the differentenvironmental conditions. In Section 2.5.4, the evaluation of the REDAs and REDAMsis explained.

Sensors 2021, 21, 2315 12 of 18
2.5.3. Definition: Real Environment Detection Area Matrix (REDAM)
A real environment detection area matrix (REDAM) describes the detection capabilityof an ODS over all tested environmental conditions. During the one-year long-term test,the REDAs of the ODS will be determined for all existing environmental conditions. Inan REDAM, all REDAs of the ODS of the year can be displayed in a Cartesian coordinatesystem. An REDA is displayed along the abscissa and ordinate axes. On the application,the environmental conditions are summarized and displayed in classes (E1–E4). In thisway all REDAs can be displayed comparably one above the other for evaluation along theapplicate axis (Figure 11).
real environment detection area length
real environment detection area width
environmental condition classes
E1
E2
E3
E4
real environment detection area for E4
real environment detection area for E3
real environment detection area for E2
real environment detection area for E1
Figure 11. A real environment detection area matrix (REDAM) describes the detection capability ofan ODS over all tested environmental conditions (E1–E4). All REDAs can be displayed comparablyone above the other for evaluation.
2.5.4. Evaluation Procedure
When evaluating the REDAs, the areas have to be eliminated from false detectionswhich are not directly visible in the fields. For this purpose, the positions of the detectedobject specified by the ODS will be recorded for each test point. This evaluation step isnot performed for systems that cannot specify the position of the detected object. If theposition of the detected object specified by the ODS does not match the actual position ofthe test target, a false detection is assumed. The next step is to investigate the positions ofdetections and non-detections in the REDA. In Figure 10, an REDA is shown which, fromthe ODS point of view, has an unexpected detection on the left outside the REDA. If the testtarget is not at the position of the unexpected detection, a false detection can be concluded.False detections are a safety risk, because a large number of false detections can lead to ahigher risk of manipulation and thus to no safe operation. This environmental conditionis therefore marked as safety-critical for the ODS and results in a gap in the availabilityunder all existing environmental conditions.
In addition, Figure 10 shows a non-detection within the REDA. Non-detection withina safety area represents a safety risk. A safe operation is therefore not possible in spite ofthe REDA in this environmental condition class, because false and non-detections cannotbe excluded. This environmental condition is also marked as safety-critical for the ODSand also results in a gap in the availability under all existing environmental conditions.
A REDAM is used to display all REDAs of one ODS. The matrix displaces the detectionproperties of an ODS in a common view under all non-safety-critical environmental condi-tions (see Figure 11). If the REDAs of the ODS are viewed from the perspective from thetop of the applicate axis, the REDA can be identified (yellow area) which results under all

Sensors 2021, 21, 2315 13 of 18
environmental conditions (Figure 12). Environmental conditions that have been assessedas uncertain based on existing non-detection and false detection in the REDAs must notbe taken into account. These uncertain environmental conditions must be excluded forthe ODS.
real environment detection area length
real environment detection area width
real environment detection area for E1 – E4
real enviromentdetection area for E1
real enviromentdetection area for E2
real enviromentdetection area for E3
real enviromentdetection area for E4
Figure 12. Evaluation of a real environment detection area matrix (REDAM): From the perspectivefrom the top of the applicate axis, the REDA can be identified (yellow area) which results under allenvironmental conditions.
Thus, an REDA can be defined for each ODS, which is valid for environmentalconditions where no false- and non-detection occurred. As described before, the false- andnon-detections result in gaps in the availability under all existing environmental conditions.An ODS fusion can be used to close this gaps. In an ODS fusion, the individual detectiondecisions of different ODSs are logically combined (decision methodology), resulting inone detection decision. Combining different REDAs of ODS in an REDAM, gaps can beclosed and create an REDA, which includes all environmental conditions. This allows theREDAM to identify an optimal ODS fusion for all measured environmental conditions.
In the research project, an REDA resulting from an REDAM will be developed, whichwill be considered the relevant vehicle data (e.g., dimensions and speed) in addition toall measured environmental conditions. For further mobile machines, individual REDAsresulting from an REDAM can be created based on the presented test method. Here, thespecific environmental conditions at the planned location as well as machine-specific data(e.g., dimensions and speed) can be taken into account. In this case, an OSD fusion maybe necessary.
3. Result: Realization of the Test Stand
A new type of test stand was installed on a farm in order to practice the new testmethod in a long-term test. This test stand offers many technical possibilities to test theODS and to determine their robustness and detection capability under different environ-mental conditions, thus enabling the individual selection of suitable technologies for theautonomous agricultural machines. As described above, the concept and this first test standis adapted to the requirements of our application example, the autonomous feeding mixer.For the realization of the new test methods for further application examples, a test standwith other dimensions or a different installation site can also be selected.
Sensors 2021, 21, 2315 14 of 18
The movement spaces are realized by means of two two-axis gantries of the companyBahr Modultechnik GmbH. Each two-axis gantry consists of three axes, which means thata total of six servo motors are used for the entire test stand. By the drive technology ofthe company Beckhoff Automation GmbH & Co. KG, the speeds specified in Section 2.3are achieved with an acceleration of 8 m
s2 and a positioning accuracy of ±1 mm. With theentire system technology from Beckhoff Automation GmbH & Co. KG, with the system amaximum update rate of 3 ms for the recording of the ODS data is achieved. Thus, at aspeed of 2 m
s , a distance of 6 mm between two test points described in Section 2.5.2 canbe realized.
Matching the drive technology, the test stand control is also equipped with com-ponents from Beckhoff Automation GmbH & Co. KG. In addition to the control of theservo motors, the test stand control communicates with all ODS and the weather station.Thus, the detection information of the ODS, the current positions and speed of the ODSand the test target, as well as the current environmental conditions can be bundled andstored in a database. Predefined test scenarios are performed by the test stand, which areautomatically triggered depending on a time and environmental condition trigger. Thismeans that if a change of the environmental conditions is measured via the weather stationor a preset time is reached, a measurement is automatically performed based on the definedtest scenarios. In addition, the test stand can be accessed remotely at any time and specialmeasurements can be performed.
As shown in Figure 4, an extension of the Davis Vantage Pro 2 6163 EU weatherstation from Davis Instruments and the VISIC620 visibility measuring device from SICKAG is used. With the extended weather station and the visibility measuring device, thefollowing environmental parameters are determined among others: Temperature, humidity,air pressure, precipitation (for rain, hail and snow), wind direction and speed, UV andsolar radiation and visibility (for dust, fog and dew). With an outdoor camera with nightvision function, an image of the test stand scenario can be recorded for the REDAs.
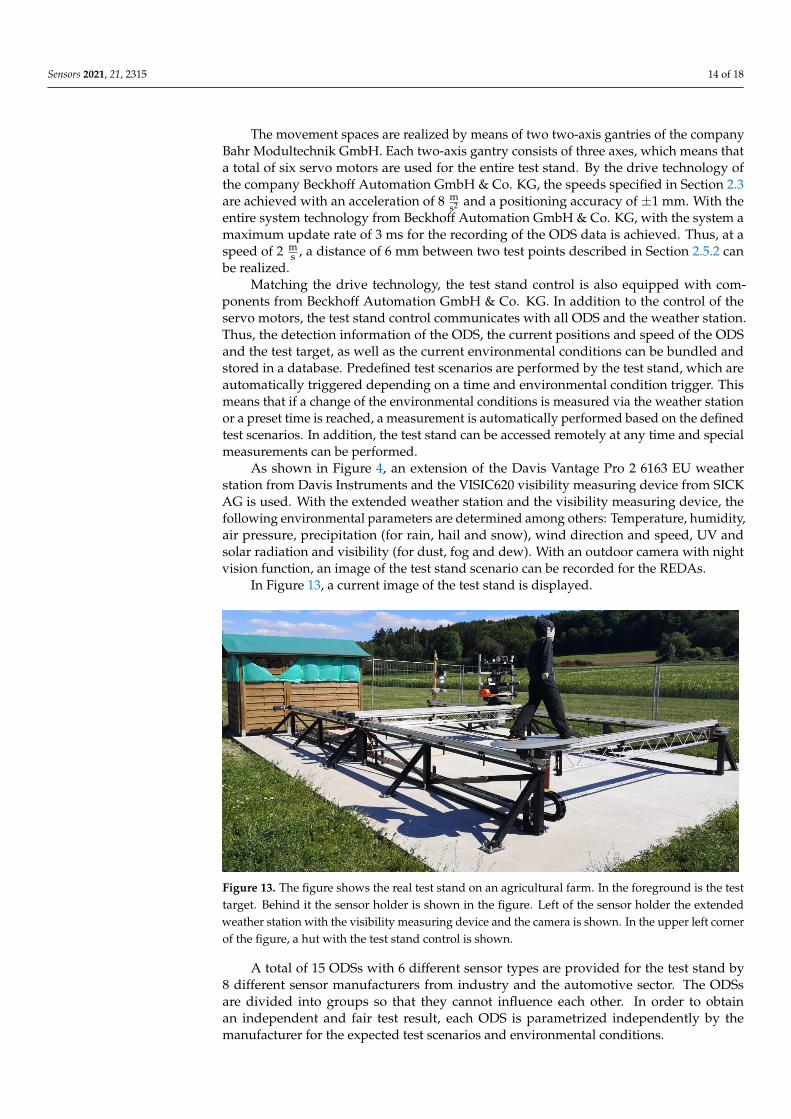
In Figure 13, a current image of the test stand is displayed.
Figure 13. The figure shows the real test stand on an agricultural farm. In the foreground is the testtarget. Behind it the sensor holder is shown in the figure. Left of the sensor holder the extendedweather station with the visibility measuring device and the camera is shown. In the upper left cornerof the figure, a hut with the test stand control is shown.
A total of 15 ODSs with 6 different sensor types are provided for the test stand by8 different sensor manufacturers from industry and the automotive sector. The ODSsare divided into groups so that they cannot influence each other. In order to obtainan independent and fair test result, each ODS is parametrized independently by themanufacturer for the expected test scenarios and environmental conditions.

Sensors 2021, 21, 2315 15 of 18
An existing test target from the automotive sector is used as test target. Comparedto industry standards, it has a higher reflectivity for the NIR-wavelength range and isused for testing driver assistance systems for example. For this reason, the test targethas been modified with a new material that its optical reflectivity properties also meetindustry standards for driverless industrial trucks. The aging of the materials duringoutdoor use is checked and taken into account by spectral measurements. In a furtherstudy the effects of the new material on the radar reflectivity properties could be measured,no significant changes could be detected and the realistic reflectivity of the test targetcompared to humans could be confirmed.
In Section 2.5.1, the following questions have been defined. They will now be answeredbased on the developed test methods:
1. Can the ODS detect the test target under the current environmental conditions? Withthe first test scenario, static tests are performed to verify a general detection of thetest target.
2. How large is the REDA of the ODS in static state under the current environmentalconditions? In the second test scenario, the REDA of a static ODS was systematicallytraversed using the test target and a constant rate was used to determine whether thetest target could be detected. Using the REDAs generated in this way, the size of theREDA of each ODS can be determined under the current environmental conditions inits static state.
3. Are there gaps and detection faults in the REDA of the ODS in the static state underthe current environmental conditions? Using the REDAs from the second test scenario,gaps and detection faults in the REDAs can be determined for a static ODS.
4. How large is the REDA of the ODS in dynamic state under the current environmentalconditions? With the third and fourth test scenario, the REDA of a dynamic ODSwas systematically traversed using the test target and a constant rate was used todetermine whether the test target could be detected. Using the REDAs generatedin this way, the size of the REDA of each ODS can be determined under the currentenvironmental conditions in the dynamic state.
5. Are there gaps and detection faults in the REDA of the ODS in the dynamic stateunder the current environmental conditions? Based on the REDAs from the third andfourth test scenario, gaps and detection faults in the REDA can be determined for adynamic ODS.
4. Conclusions and Outlook
This article presents an important milestone and the next step in the developmentprocess of autonomous agriculture machines. As an impact of research into industry, withinthe research project “Agro-Safety”, a novel test method realized by a dynamic test stand isdeveloped to test and compare the robustness and detection capability of commerciallyavailable ODS in a long-term test around the clock for 365 days a year and 24 h a day incontinuous outdoor use for the very first time. A test over a longer period of time is neededto test as much as possible all occurring environmental conditions. This leads to the factthat it is a test that is determined by the naturally occurring environmental conditions.This corresponds to the reality of unpredictable/determinable environmental conditions inthe field and makes the test method and test stand so unique. Thus, the new test methodallows the individual selection of ODS for different autonomous mobile machines. For thispurpose, the test stand can be adapted to the individual requirements of the applicationenvironment and the individual machine parameters. In this way, a test stand can also beadapted, for example, for plant production or other autonomous mobile working machines.
It has to be taken into account, during a given test period of one year, not all extremeweather conditions will occur. It must also be validated whether an ODS alone can guar-antee sufficient availability with an acceptable level of safety under all environmentalconditions, or whether a fusion of ODS is required for availability over all environmentalconditions. In an ODS fusion, the individual detection decisions of different ODS are

Sensors 2021, 21, 2315 16 of 18
logically combined (decision methodology), resulting in one detection decision. In thefuture, these findings can be derived from the REDAs created by the test stand and theresulting REDAMs. If no or insufficient information is available for certain environmentalconditions, this gap can be closed by continuously continuing outdoor tests or using thetest stand in environmental simulation chambers. By the specific simulation of environ-mental conditions in the environmental simulation chamber, REDAs can be determined forenvironmental conditions that rarely occur in outdoor environments. It is also possible torepeat measurements for statistical evaluation of the detection capability of ODS.
A possible different positioning of the ODS on an autonomous mobile work machinebut also possible worst-case scenarios in the working areas of the autonomous feedingmixer should be examined. For these reasons, a validation of the new human protectionsystem directly on the vehicle is absolutely necessary after the selection of the ODS. The dif-ferent application scenarios in the working areas of the autonomous feeding mixer mustbe validated. The test method and the test stand represent an abstract evaluation of thedetection capability, but require a detailed validation on the application machine with itsvarious environmental scenarios. In addition to the functional validation, a verification ofthe hardware structure and software implementation in the ODS must be conducted withthe safety requirements of the autonomous work machine.
For the determination of ODS for use for human protection on autonomous, mobilework machines, the realistic “worst-case” simulation of humans by the test target mustalso be validated. For this purpose, a new material was used which meets the opticalreflectivity properties of a standard for driverless industrial trucks. Nevertheless, the agingof the materials during outdoor use is checked and will taken into account by spectralmeasurements. These changes influence the test method and have to be considered. For thisreason, a statistical evaluation of the test target is also planned. Likewise, possible changedparameters on the test stand are checked in further investigations and the effects must beconsidered in the data evaluation.
In further work, in addition to the detection information of each ODS, the correspond-ing raw data can also be collected. As described before, in an ODS fusion, the individualdetection decisions of different ODS are logically combined (decision methodology), result-ing in one detection decision with a better availability of the ODS. Another way to increasethe availability of the ODS is a sensor fusion. In contrast to ODS fusion, sensor fusionfuses the recorded raw data of different ODS and resulting then in one detection decision.New and possibly better algorithms can be developed independently of the ODS using themeasured raw data. Here, algorithms can be developed for general object detection as wellas for special objects such as people, which are presented as humanoid test targets on thetest stand. For the development of this algorithms, the test stand automatically generatesexceptional information about the recorded raw data. On the one hand, the detectioninformation of the ODS is available, on the other hand, the real position of the objectis available. The detection decision of the ODS could be used as reference data for theverification of the newly developed algorithm, but could also be directly integrated into thedecision making process. The recorded information, where the object is real located, can beused as data for verification of the newly developed algorithm or as information to labelthe record row data automatically. This labeled raw data could then be used as trainingdata for neural networks or artificial intelligence in the newly developed algorithms.
Author Contributions: Conceptualization, C.M., B.W. and A.R.; methodology, C.M. and T.S.; soft-ware, C.M. and T.S.; validation, C.M. and T.S.; resources, B.W.; writing—original draft preparation,C.M.; writing—review and editing, T.S., B.W., C.W. and A.R. All authors have read and agreed to thepublished version of the manuscript.
Funding: This work was conducted in context of the research project “AGRO-SAFETY” funded byGerman Federal Ministry of Education and Research (BMBF) and B. Strautmann & Söhne GmbH u.Co. KG.

Sensors 2021, 21, 2315 17 of 18
Acknowledgments: Many thanks to Susanne Lenjer, University of Applied Sciences Osnabrück,Laboratory for physics, for her support and the measurements of the reflectivity of the materials.Many thanks also to Jakob Gerding, B. Strautmann & Söhne GmbH u. Co. KG, for the constructivedevelopment of the test stand as well as to TÜV NORD Mobilität for their support and feedbackthroughout the project. Many thanks to the farm Plogmann Große Börding for the support and spaceto build and work with the test stand.
Conflicts of Interest: The funders had no role in the design of the study; in the collection, analysesor interpretation of data; in the writing of the manuscript, or in the decision to publish the results.
AbbreviationsThe following abbreviations are used in this manuscript:
LiDAR Light Detection And RangingNIR Near-infraredODS Object Detection SystemREDA Real Environment Detection AreaREDAM Real Environment Detection Area MatrixSDA Specified Detection AreaToF Camera Time-of-Flight CameraTÜV German Technical Inspection Agency
References1. Meltebrink, C.; Malewski, B.; Trabhardt, A.; Igelbrink, T.; Hellermann, S.; Ruckelshausen, A. Vom manuellen Selbstfahrer zum
autonomen Futtermischwagen: Konzept, Technologie und Sicherheit. In Proceedings of the 38. GIL-Jahrestagung, Gesellschaftfür Informatik, Kiel, Germany, 26–27 February 2018; pp. 159–162.
2. Ruckelshausen, A.; Biber, P.; Dorna, M.; Gremmes, H.; Klose, R.; Linz, A.; Rahe, F.; Resch, R.; Thiel, M.; Trautz, D.; et al.BoniRob—An autonomous field robot platform for individual plant phenotyping. In Proceedings of the 7th European Conferenceon Precision Agriculture, Wageningen, The Netherlands, 7–8 June 2009; pp. 841–847.
3. Kise, M.; Noguchi, N.; Ishii, K.; Terao, H. Development of the Agricultural Autonomous Tractor with an RTK-GPS and a Fog.In Proceedings of the 4th IFAC Symposium on Intelligent Autonomous Vehicles (IAV 2001), Sapporo, Japan, 5–7 September 2001;Volume 34, pp. 99–104.
4. Meltebrink, C.; Linz, A.; Ruckelshausen, A. ROS-basiertes Validierungskonzept für Sicherheitskonzepte von autonomen Agrar-robotern. In Proceedings of the 36. GIL-Jahrestagung, Osnabrück, Germany, 22–23 February 2016; pp. 121–124.
5. Tiusanen, R.; Malm, T.; Ronkainen, A. An overview of current safety requirements for autonomous machines—Review ofstandards. Open Eng. 2020, 10, 665–673. [CrossRef]
6. Basu, S.; Omotubora, A.; Beeson, M.; Fox, C. Legal framework for small autonomous agricultural robots. AI Soc. 2020, 35, 113–134.[CrossRef]
7. Ingibergsson, J. Generative Architecture for Functional Safety in Computer Vision. Ph.D. Thesis, University of Southern Denmark,Odense, Denmark, 2019. [CrossRef]
8. IEC 62998-1:2019 Safety of Machinery—Safety-Related Sensors Used for the Protection of Persons; LEC: London, UK, 2019.9. Jakobs, S.; Weber, A.; Stapp, D. Zuverlässige Objekterkennung für autonome mobile Arbeitsmaschinen. ATZ Heavy Duty 2019,
12, 46–51. [CrossRef]10. 4activeSystems GmbH Home Page. Available online: https://www.4activesystems.at (accessed on 24 November 2020).11. Schram, R.; Williams, A.; van Rating, M.; Ryrberg, S.; Sferco, R. Euro NCAP’s First Step to Assess Autonomous Emergency
Braking (AEB) for Vulnerable Road Users. In Proceedings of the 24th International Technical Conference on the Enhanced Safetyof Vehicles (ESV), Gothenburg, Sweden, 8–11 June 2015; Volume 15-0277.
12. ISO 19206-2:2018-12 Road Vehicles—Test Devices for Target Vehicles, Vulnerable Road Users and other Objects, for Assessment of ActiveSafety Functions—Part 2: Requirements for Pedestrian Targets; ISO: London, UK, 2018.
13. Lemmen, P.; Stoll, J.; Bergelt, U.; Seiniger, P.; Wisch, M.; Bartels, O.; Schubert, E.; Kunert, M; Knight, I.; Brookes, D.; et al.Evaluation of Pedestrian Targets Used in AEB Testing: A Report from Harmonistion Platform 2 Dealing with Test Equipment.In Proceedings of the 23rd International Technical Conference on the Enhanced Safety of Vehicles (ESV), Seoul, Korea, 27–30 May2013; Volume 13-0124.
14. ISO 3691-4:2020-02 Industrial Trucks—Safety Requirements and Verification—Part 4: Driverless Industrial Trucks and Their Systems; ISO:London, UK, 2020.
15. Thomann, F.; Horstmeyer, S. Project Report: Inbetriebnahme des SICK RMS320 Radarsensors und Messung des Einflusses vonKleidung auf die Erkennungsfähigkeit eines Menschen. 2021; in press.
16. ISO 19237:2017-12 Intelligent Transport Systems—Pedestrian Detection and Collision Mitigation Systems (PDCMS)—PerformanceRequirements and Test Procedures; ISO: London, UK, 2017.

Sensors 2021, 21, 2315 18 of 18
17. Bartels, B.; Erbsmehl, C.T. Bewegungsverhalten von Fußgängern im Straßenverkehr, Teil 1; FAT-Schriftenreihe; FAT: Berlin, Germany,2014; Volume 267.
18. Kramer, F.; Raddatz, M. Das Bewegungsverhalten von Fußgängern im Straßenverkehr auf Basis einer experimentellen Reihenun-tersuchung. Verkehrsunfall Fahrzeugtechnik 2010, 48, 382–388.
19. Nagai, M. Present status of drive recorder database and its application potential. J. Soc. Automot. Eng. Jpn. 2013, 67, 47–53.(In Japanese)