Embed Size (px)
DESCRIPTION
comScore qSearch ™ The Search Landscape Industry Highlights & Trends For SES. James Lamberti Senior Vice President, comScore Networks August 2006. comScore Panelist. comScore Servers. World Wide Web. comScore Methodology – “Large, Representative, Panel”. - PowerPoint PPT Presentation
Citation preview
Measuring the Internet Age™
comScore qSearchcomScore qSearch™™The Search LandscapeThe Search Landscape
Industry Highlights & Trends For SESIndustry Highlights & Trends For SES
James Lamberti
Senior Vice President, comScore Networks
August 2006

proprietary and confidential 2
comScore Methodology – “Large, Representative, Panel”
2 million online consumers who have agreed to be continuously and passively observed
Proprietary technology collects all Internet activity including search, ecommerce, and more
Key advantages of our approach
Capture actual consumer searches
Totally passive methodology
Multiple search metrics for in-depth analysis• Searchers
• Distinct searches
• Keywords and Clicks
• Ad Impressions
comScore Panelist
comScore Servers
World Wide Web
Passive tracking of actual consumer search activity

proprietary and confidential 3
comScore qSearch™ Data SourcesHundreds of clients rely on our data including all major search engines
qSearch™ Audience Measurement: Market & Share Tracking• U.S., England, Germany, France, Canada, Italy, Spain, and Worldwide
• U.S. segment of Home, Work, and College/University
• Tracking since January 2003
qSearch™ Local Search Audience Measurement• IYP and Local Web Search since January 2004
qSearch™ Monetization and Click-Rate Reporting• Ad Coverage, Algorithmic and Sponsored Click-thru rates since January 2004
qSearch Customer Satisfaction Tracking• Surveyed attitudes linked to actual behavior since Q2 2004
qSearch™ Custom Analysis• Search link to eCommerce
• Heavy/Medium/Light Searcher Analysis
• Searcher Loyalty Analysis
proprietary and confidential 4
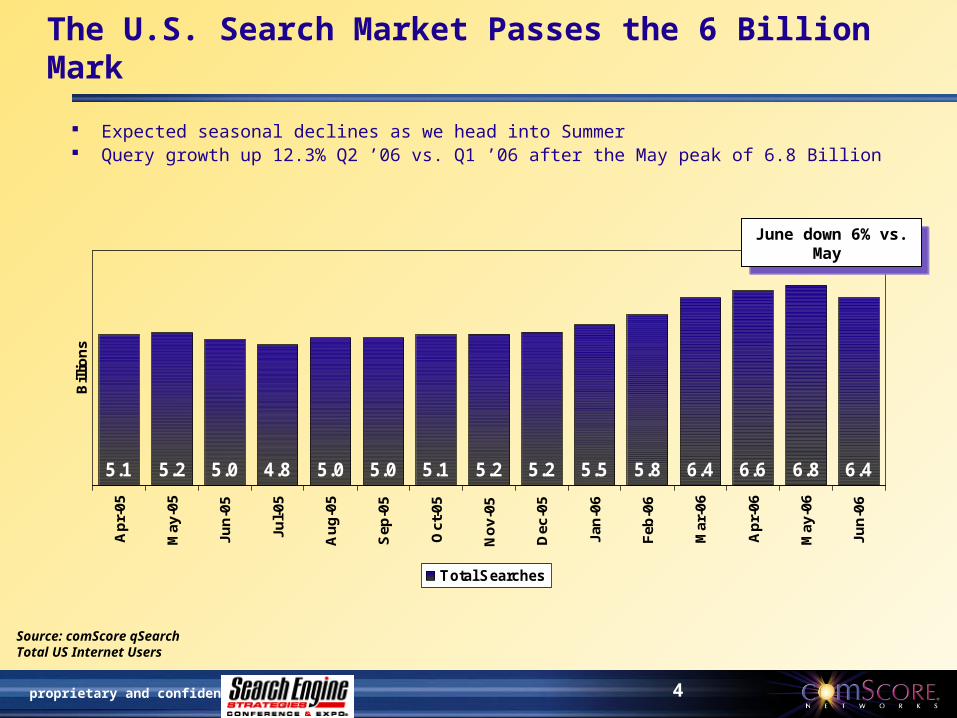
The U.S. Search Market Passes the 6 Billion Mark
Source: comScore qSearch Total US Internet Users
Expected seasonal declines as we head into Summer Query growth up 12.3% Q2 ’06 vs. Q1 ’06 after the May peak of 6.8 Billion
5.1 5.2 5.0 4.8 5.0 5.0 5.1 5.2 5.2 5.5 5.8 6.4 6.6 6.8 6.4
Ap
r-05
May
-05
Jun
-05
Jul-
05
Au
g-0
5
Sep
-05
Oct
-05
No
v-05
Dec
-05
Jan
-06
Feb
-06
Mar
-06
Ap
r-06
May
-06
Jun
-06
Bill
ion
s
Total Searches
June down 6% vs. May
June down 6% vs. May

proprietary and confidential 5
Q1 Surge in Intensity is Driving Recent Growth
80
100
120
140
160
Ap
r-05
May
-05
Jun
-05
Jul-
05
Au
g-0
5
Sep
-05
Oct
-05
No
v-05
Dec
-05
Jan
-06
Feb
-06
Mar
-06
Ap
r-06
May
-06
Jun
-06
Un
iqu
e S
ea
rch
ers
(M
illio
ns
)
30
35
40
45
50
55
60
Sea
rch
es p
er S
earc
her
Unique Searchers Searches per Searcher
Source: comScore qSearchTotal US Internet Users
2005 Broadband Adoption Drove Searcher Penetration Increases Through April 2006 This New Bandwidth is Now Driving Increases in Intensity
January 2006 intensity increases are fueling recent growth
January 2006 intensity increases are fueling recent growth
proprietary and confidential 6
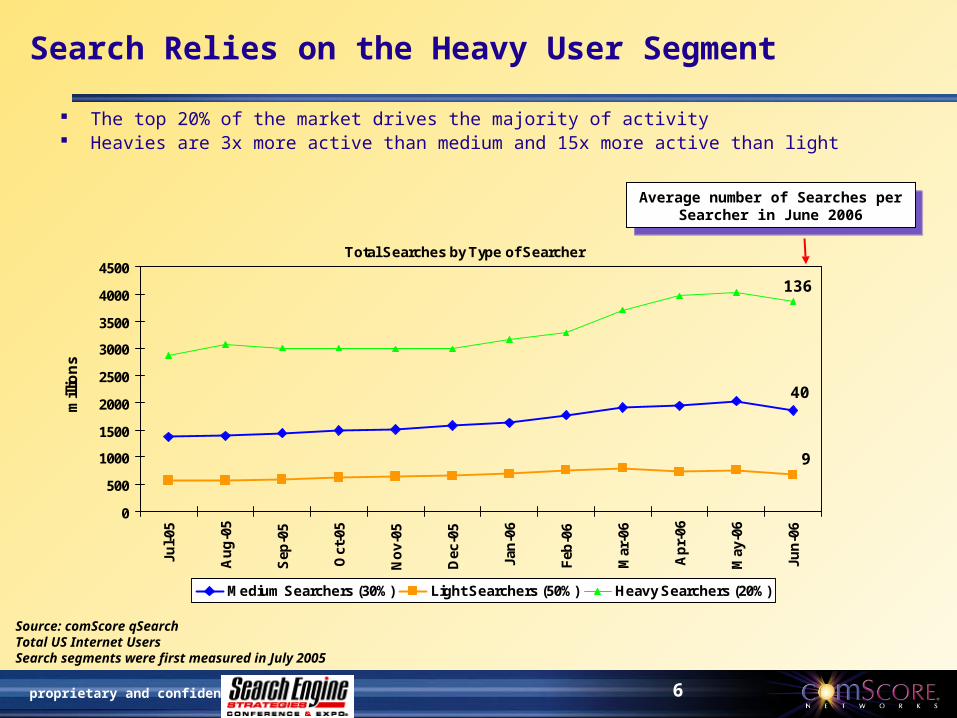
Search Relies on the Heavy User Segment
Source: comScore qSearchTotal US Internet UsersSearch segments were first measured in July 2005
Total Searches by Type of Searcher
0
500
1000
1500
2000
2500
3000
3500
4000
4500
Jul-
05
Au
g-0
5
Sep
-05
Oct
-05
No
v-05
Dec
-05
Jan
-06
Feb
-06
Mar
-06
Ap
r-06
May
-06
Jun
-06
mill
ion
s
Medium Searchers (30%) Light Searchers (50%) Heavy Searchers (20%)
136
40
9
The top 20% of the market drives the majority of activity Heavies are 3x more active than medium and 15x more active than light
Average number of Searches per Searcher in June 2006
Average number of Searches per Searcher in June 2006

proprietary and confidential 7
Year-over-Year Growth Rates Rebounding as a Result
Year-Over-Year % Change in Searches
-20%
-10%
0%
10%
20%
30%
40%
50%
60%
70%
Ap
r-05
May
-05
Jun
-05
Jul-
05
Au
g-0
5
Sep
-05
Oct
-05
No
v-05
Dec
-05
Jan
-06
Feb
-06
Mar
-06
Ap
r-06
May
-06
Jun
-06
Google Sites Yahoo! Sites MSN-Microsoft Sites
Source: comScore qSearchTotal US Internet Users
All major engines are growing Softness in Q4 an indication of emerging seasonality
* Due to a definitional change occurring in June 2006 which resulted in an NEDOM-DNS error, trended data for the Time-Warner Network are not available
*

proprietary and confidential 8
Share of Searches
0%
5%
10%
15%
20%
25%
30%
35%
40%
45%
50%
Ap
r-05
May
-05
Jun
-05
Jul-
05
Au
g-0
5
Sep
-05
Oct
-05
No
v-05
Dec
-05
Jan
-06
Feb
-06
Mar
-06
Ap
r-06
May
-06
Jun
-06
Google Sites Yahoo! Sites MSN-Microsoft Sites Time Warner Network Ask Network
Source: comScore qSearchTotal US Internet Searches
Google’s Share Trending Up for 11th Consecutive Month
All players lost ground to Google; Yahoo! is generally flat over recent 4 months Will Ask become the 4th largest engine in 2007?
44.7%
28.5%
5.6%
12.8%
5.1%
June 2006 Market SharesJune 2006 Market Shares
proprietary and confidential 9
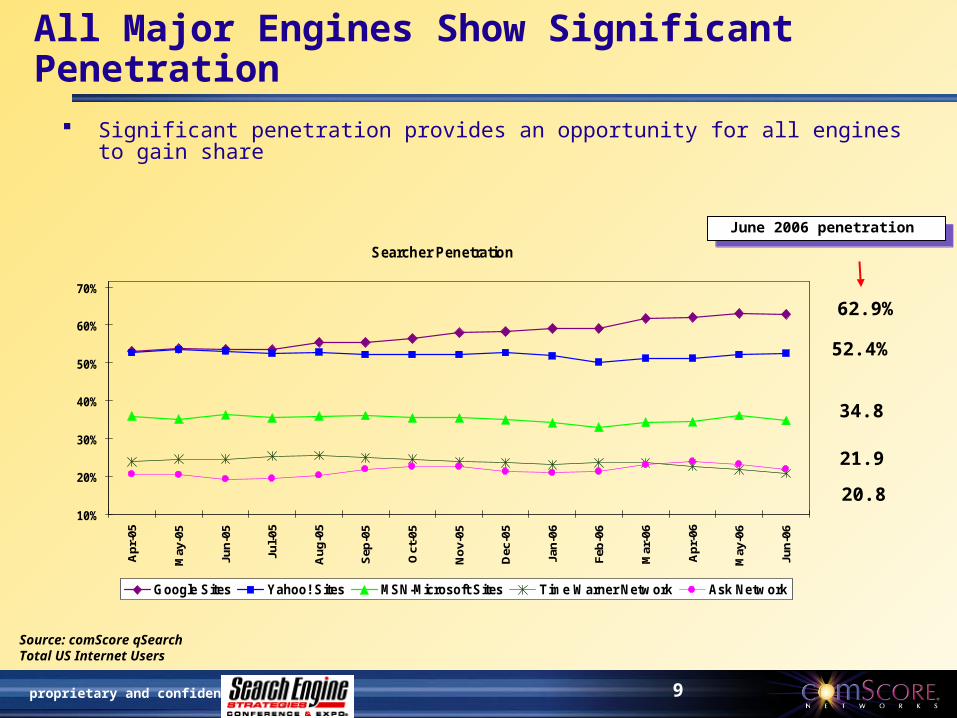
All Major Engines Show Significant Penetration
Searcher Penetration
10%
20%
30%
40%
50%
60%
70%
Ap
r-05
May
-05
Jun
-05
Jul-
05
Au
g-0
5
Sep
-05
Oct
-05
No
v-05
Dec
-05
Jan
-06
Feb
-06
Mar
-06
Ap
r-06
May
-06
Jun
-06
Google Sites Yahoo! Sites MSN-Microsoft Sites Time Warner Network Ask Network
Source: comScore qSearchTotal US Internet Users
62.9%
52.4%
21.9
34.8
20.8
June 2006 penetration June 2006 penetration
Significant penetration provides an opportunity for all engines to gain share

proprietary and confidential 10
Intensity Drives the Existing Share Gaps
Google is averaging 29.4 searches per searcher; Ask is 9.6 Searcher intensity ranking mirrors overall share positions closely
Searches per Searcher
0
5
10
15
20
25
30
35
Ap
r-05
May
-05
Jun
-05
Jul-
05
Au
g-0
5
Sep
-05
Oct
-05
No
v-05
Dec
-05
Jan
-06
Feb
-06
Mar
-06
Ap
r-06
May
-06
Jun
-06
Google Sites Yahoo! Sites MSN-Microsoft Sites Time Warner Network Ask Network
Source: comScore qSearchTotal US Internet Users
proprietary and confidential 11
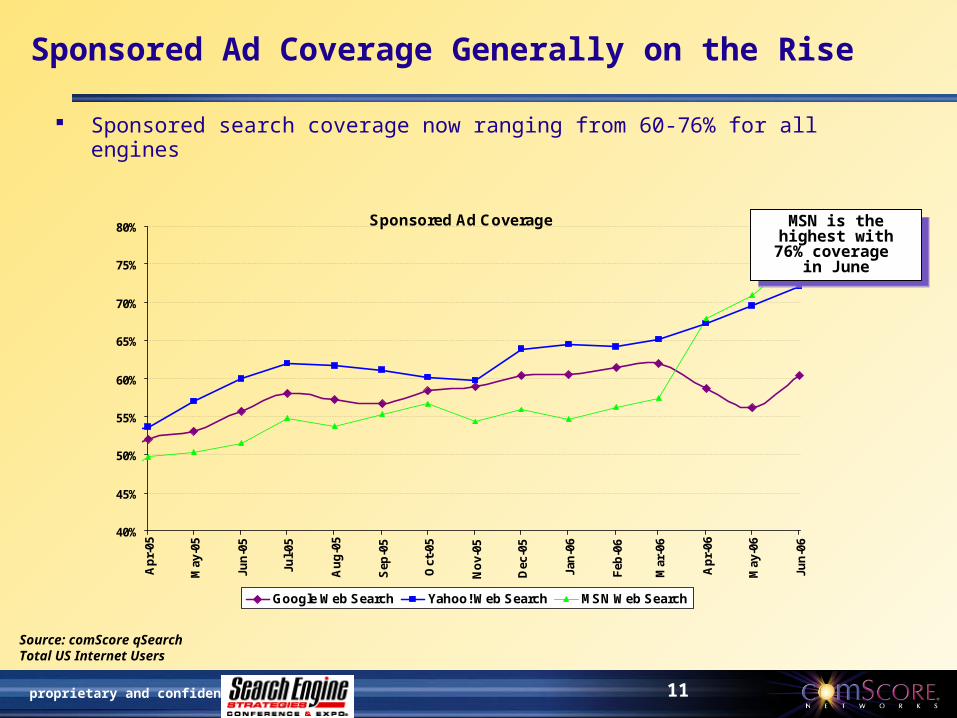
Sponsored Ad Coverage Generally on the Rise
Sponsored Ad Coverage
40%
45%
50%
55%
60%
65%
70%
75%
80%
Ap
r-05
May
-05
Jun
-05
Jul-
05
Au
g-0
5
Sep
-05
Oct
-05
No
v-05
Dec
-05
Jan
-06
Feb
-06
Mar
-06
Ap
r-06
May
-06
Jun
-06
Google Web Search Yahoo! Web Search MSN Web Search
Sponsored search coverage now ranging from 60-76% for all engines
Source: comScore qSearchTotal US Internet Users
MSN is the highest with 76% coverage
in June
MSN is the highest with 76% coverage
in June
proprietary and confidential 12
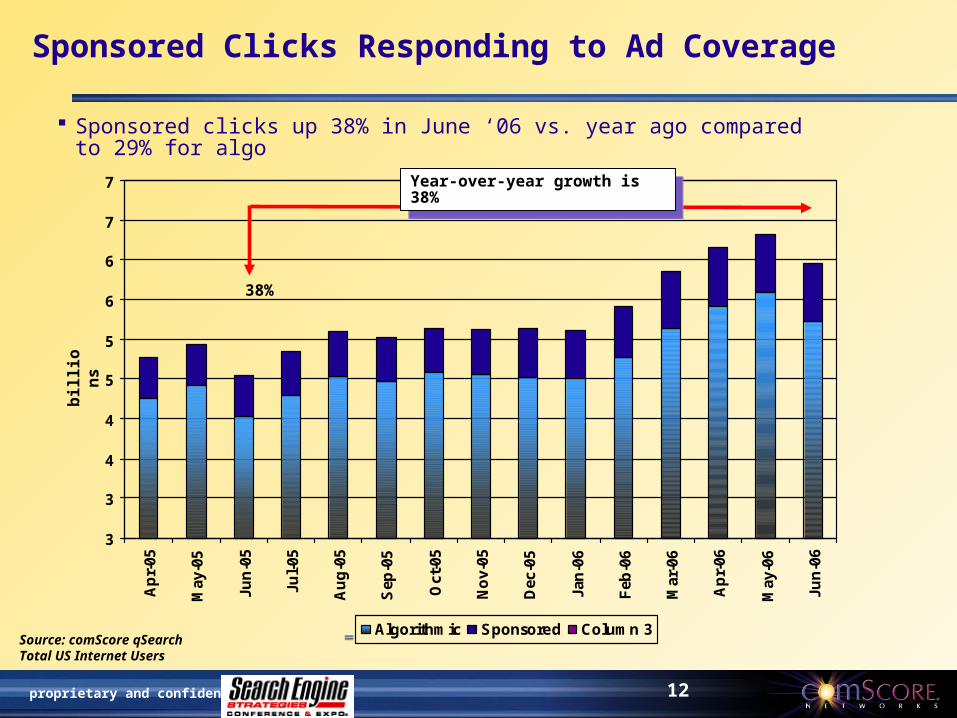
Sponsored Clicks Responding to Ad Coverage
Sponsored clicks up 38% in June ‘06 vs. year ago compared to 29% for algo
bil
lio
ns
Source: comScore qSearchTotal US Internet Users
38%
3
3
4
4
5
5
6
6
7
7
Ap
r-05
May
-05
Jun
-05
Jul-
05
Au
g-0
5
Sep
-05
Oct
-05
No
v-05
Dec
-05
Jan
-06
Feb
-06
Mar
-06
Ap
r-06
May
-06
Jun
-06
Algorithmic Sponsored Column 3
Year-over-year growth is 38%Year-over-year growth is 38%

proprietary and confidential 13
Total Sponsored Clicks by Engine
0
50
100
150
200
250
300
350
Ap
r-0
5
Ma
y-0
5
Ju
n-0
5
Ju
l-0
5
Au
g-0
5
Se
p-0
5
Oc
t-0
5
No
v-0
5
De
c-0
5
Ja
n-0
6
Fe
b-0
6
Ma
r-0
6
Ap
r-0
6
Ma
y-0
6
Ju
n-0
6
mil
lio
ns
Google.com/Google Yahoo! Search MSN Search AOL Ask.com
Sponsored Clicks Increasing For All Engines
These data are a much better indication of financial performance than queries
Source: comScore qSearchTotal US Internet Users
June 2006 Sponsored Clicks June 2006 Sponsored Clicks

proprietary and confidential 14
Web Search Remains the Dominant Consumer Activity
Source: comScore qSearch
News and Image growth is strongest, but it remains a small fraction of total activity Local/IYP Search growth lags the overall market despite product development efforts
mil
lio
ns
Percentages represent year-over-year growth
Percentages represent year-over-year growth
Vertical Searches and Total Searches Growth (May 2006 over May 2005*)
610285
811685
5,276
4,075
7,132
5,423
2005 2006
News & Image Search Local/IYP Search Web Searches Total Searches
MayMay
114%18%
29%
32%

proprietary and confidential 15
Total Toolbar Searches
Toolbar Searches
0
100
200
300
400
500
600
700
800
900
1,000
Ap
r-05
May
-05
Jun
-05
Jul-
05
Au
g-0
5
Sep
-05
Oct
-05
No
v-05
Dec
-05
Jan
-06
Feb
-06
Mar
-06
Ap
r-06
May
-06
Jun
-06
Mill
ion
s
Toolbar searches were at an all-time high in May on both an absolute and share-of-total basis
Source: comScore qSearchTotal US Internet Users
850 Million Searches in June
850 Million Searches in June

proprietary and confidential 16
Yahoo! and Google penetration gap continues to narrow
Toolbar Searcher Penetration
0%
10%
20%
30%
40%
50%
60%
70%
80%
Ap
r-05
May
-05
Jun
-05
Jul-
05
Au
g-0
5
Sep
-05
Oct
-05
No
v-05
Dec
-05
Jan
-06
Feb
-06
Mar
-06
Ap
r-06
May
-06
Jun
-06
Google Sites Yahoo! Sites MSN-Microsoft Sites
Yahoo! and Google Maintain Toolbar Leadership
Source: comScore qSearchTotal US Internet Users
56.8%
46.5%
Penetration in June 2006
Penetration in June 2006
5.9%

proprietary and confidential 17
Local Share of Searches
After several months of consistent shares, Google outpaces Yahoo! by about 25 million searches in May ‘06
Source: comScore qSearch, Local/IYP ReportTotal US Internet Users
31.2%
28.1%
12.1%
6.4%
2.4%
Local Search Shares
0%
5%
10%
15%
20%
25%
30%
35%
Mar
-05
Ap
r-05
May
-05
Jun
-05
Jul-
05
Au
g-0
5
Sep
-05
Oct
-05
No
v-05
Dec
-05
Jan
-06
Feb
-06
Mar
-06
Ap
r-06
May
-06
Google Sites Yahoo! Sites MSN-Microsoft Sites Time Warner Netw ork Ask Netw ork
Local Shares in May 2006
Local Shares in May 2006
*

proprietary and confidential 18
What Metric?• Distinct Searches
• Result Pages
• Clicks/Referrals
What Population?• U.S. only
• Worldwide at .com locations
• Local shares in Canada, UK, Germany, France, Italy, and Spain
What Location?• Search Ad networks
• Total portal activity
• Search property only activity
What is Engine X’s Market Share? It depends…

proprietary and confidential 19
Thank YouThank You


![[Conference];[Comscore statistic]](https://img.pdfslide.us/doc/110x75/554c187eb4c905e7568b4ea3/conferencecomscore-statistic.jpg)