Embed Size (px)
DESCRIPTION
Learning Globally-Consistent Local Distance Functions for Shape-Based Image Retrieval and Classification. Computer Vision, 2007. ICCV 2007. IEEE 11th International Conference on Andrea Frome , EECS, UC Berkeley Yoram Singer, Google, Inc Fei Sha , EECS, UC Berkeley - PowerPoint PPT Presentation
Citation preview
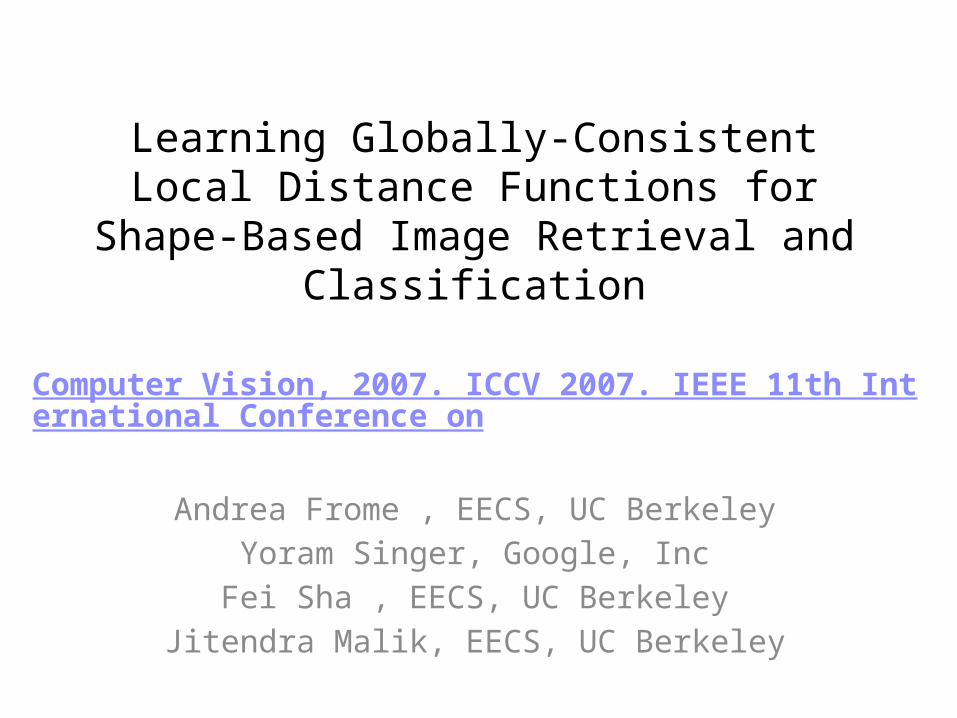
Learning Globally-Consistent Local Distance Functions for Shape-Based
Image Retrieval and Classification
Computer Vision, 2007. ICCV 2007. IEEE 11th International Conference on
Andrea Frome , EECS, UC BerkeleyYoram Singer, Google, Inc
Fei Sha , EECS, UC BerkeleyJitendra Malik, EECS, UC Berkeley
Outline
• Introduction• Training step• Testing step• Experiment & Result• Conclusion

Outline
• Introduction• Training step• Testing step• Experiment & Result• Conclusion
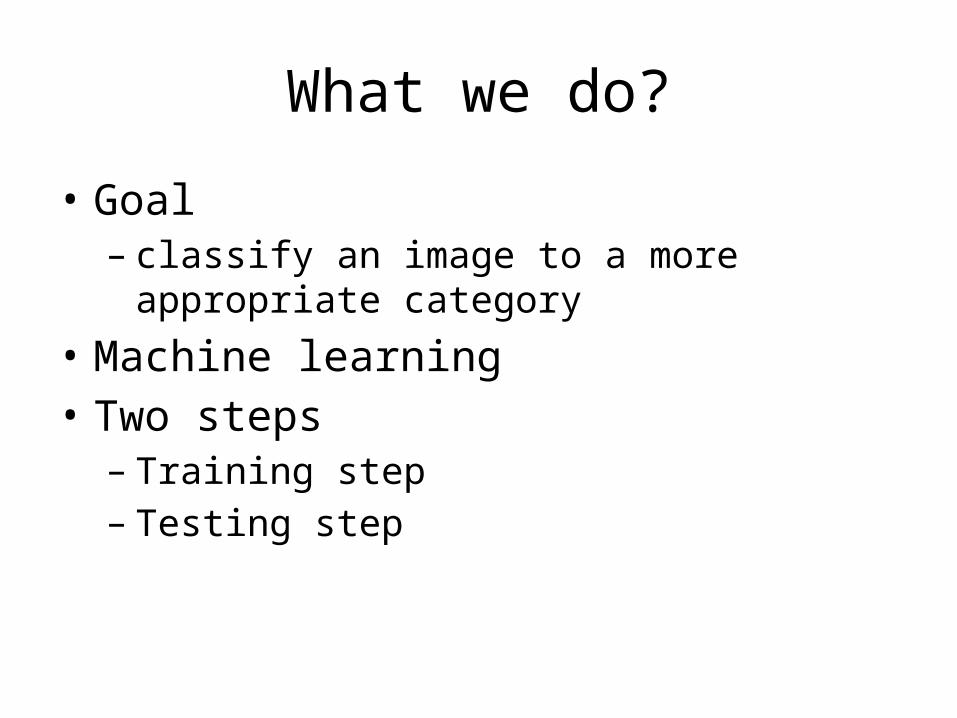
What we do?
• Goal– classify an image to a more appropriate category
• Machine learning• Two steps– Training step– Testing step
Outline
• Introduction
• Training step• Testing step• Experiment & Result• Conclusion

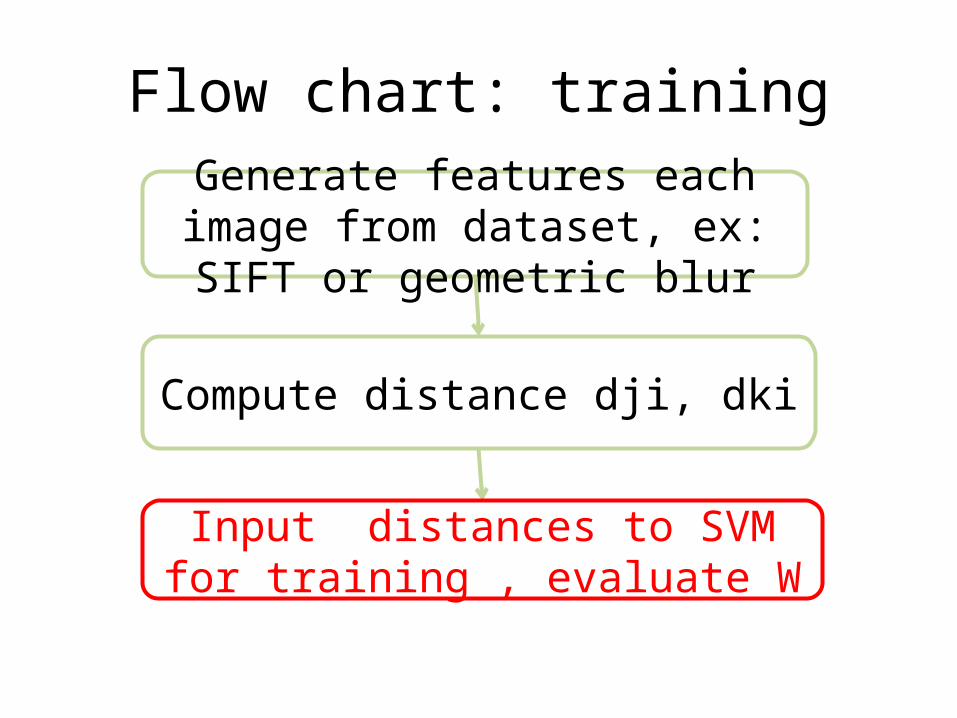
Flow chart: training
Generate features each image from dataset, ex: SIFT or geometric blur
Input distances to SVM for training , evaluate W
Compute distance dji, dki

Flow chart: training
Generate features each image from dataset, ex: SIFT or geometric blur
Input distances to SVM for training , evaluate W
Compute distance dji, dki

Choosing features
• Dataset: Caltech101• Patch-based Features– SIFT• Old school
– Geometric Blur• It’s a notion of blurring• The measure of similarity between image patches• The extension of Gaussian blur
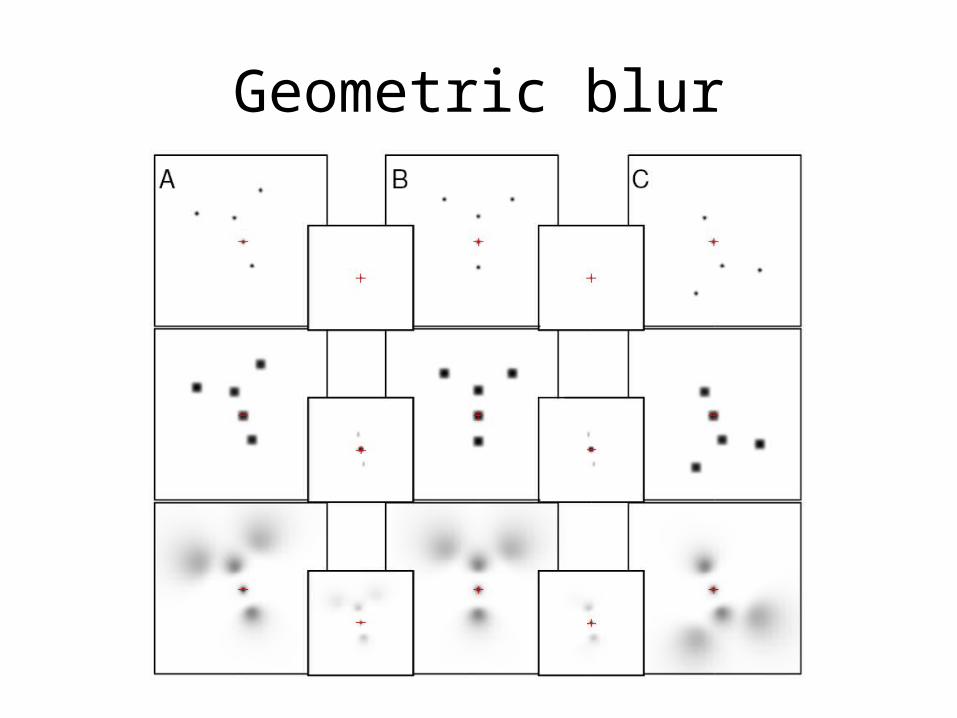
Geometric blur

Flow chart: training
Generate features each image from dataset, ex: SIFT or geometric blur
Input distances to SVM for training , evaluate W
Compute distance dji, dki
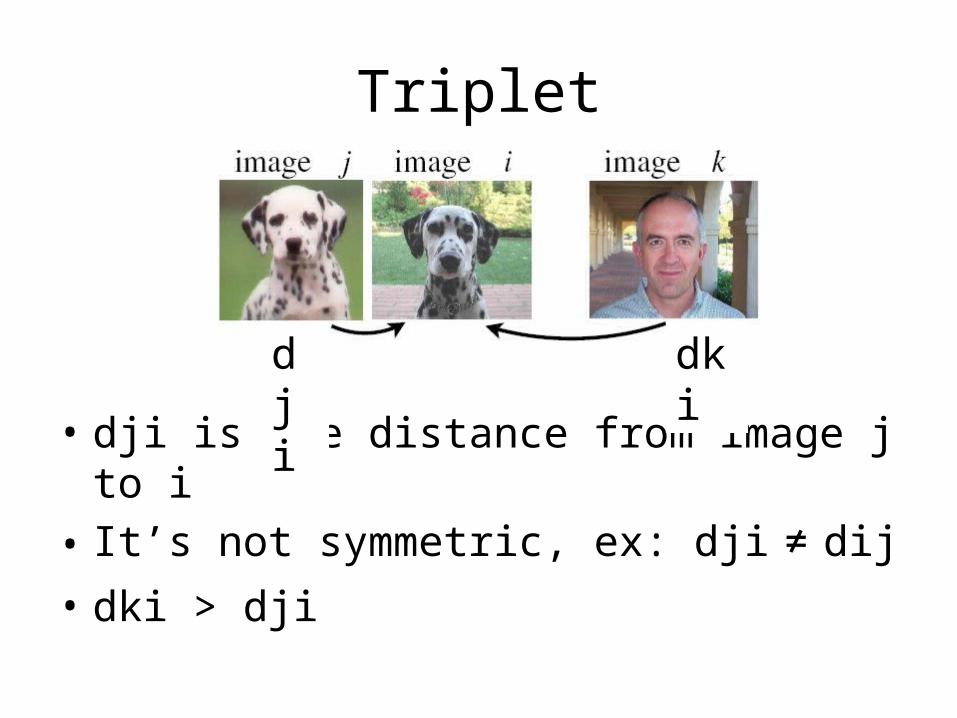
Triplet
• dji is the distance from image j to i• It’s not symmetric, ex: dji ≠ dij• dki > dji
dji dki

How to compute distance
• L2 norm
12
3
dji, 1
m features
dji, 1distance vector dji
Image j
Image i

Example
• Given 101 category, 15 images each category101*15
Feature j
101*15
distance vector
distance vector
Image j vs training data
Flow chart: training
Generate features each image from dataset, ex: SIFT or geometric blur
Input distances to SVM for training , evaluate W
Compute distance dji, dki
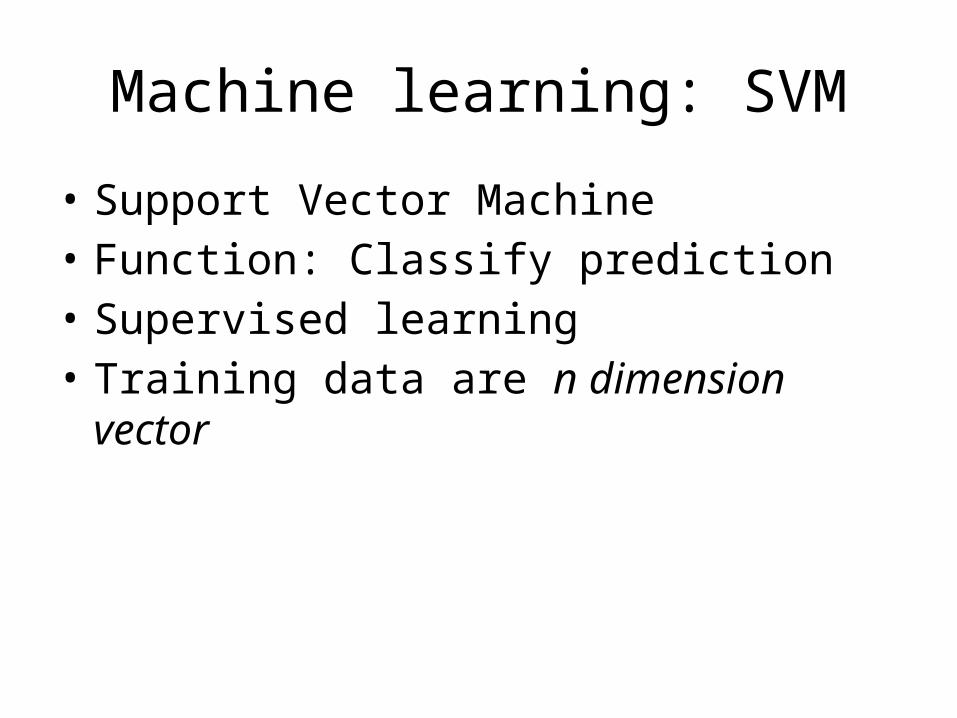
Machine learning: SVM
• Support Vector Machine• Function: Classify prediction• Supervised learning• Training data are n dimension vector

Example
• Male investigate– Annual income– Free time
• Have girlfriend?
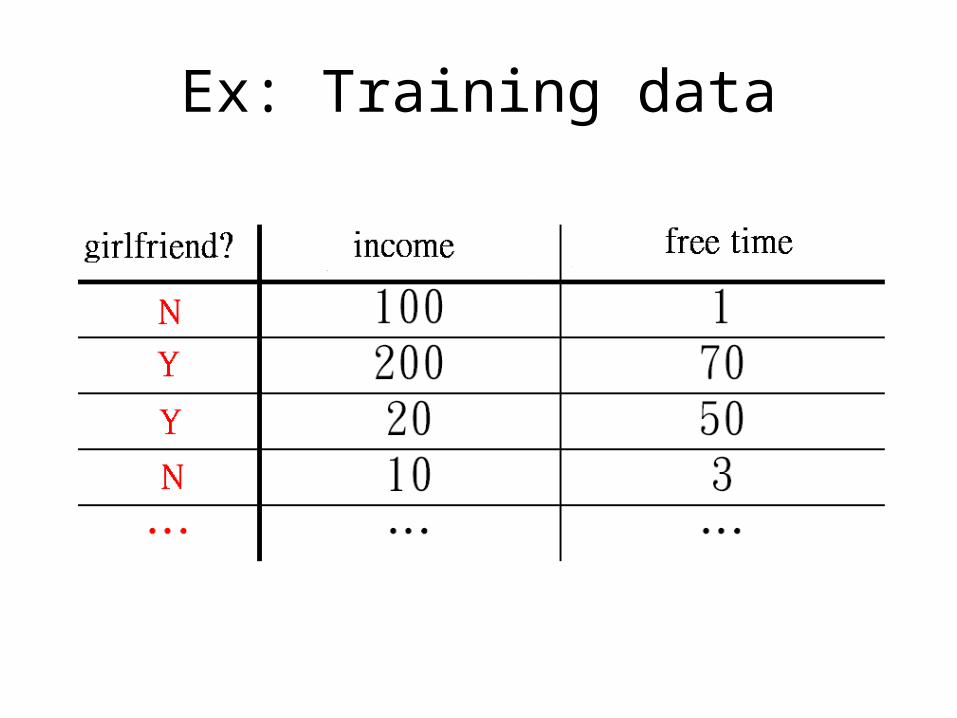
Ex: Training data

spacefree
income
vector
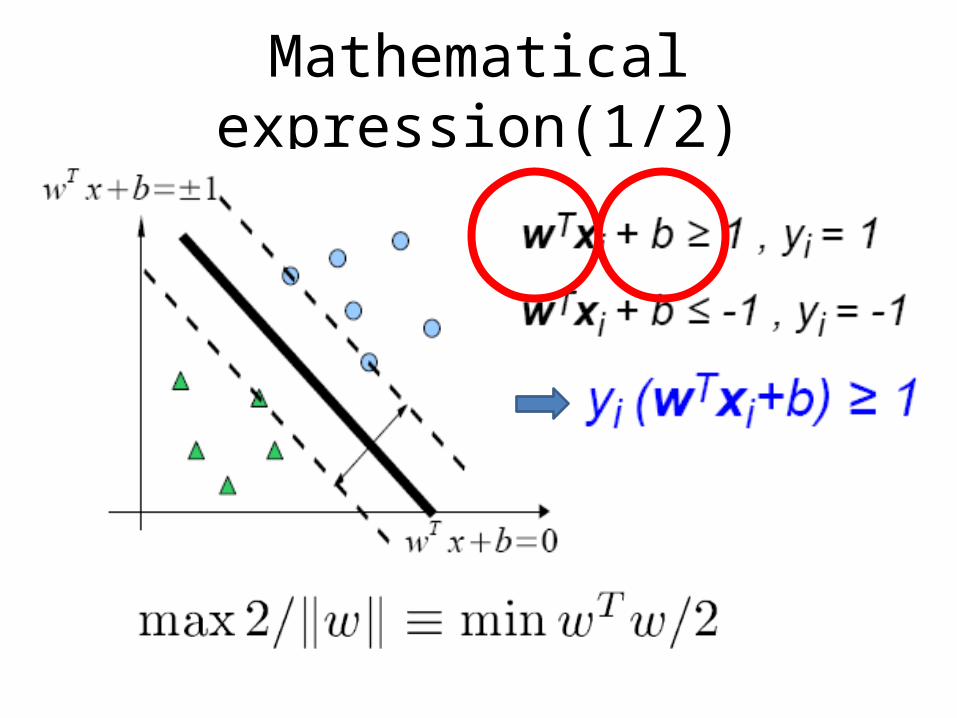
Mathematical expression(1/2)

Mathematical expression(2/2)
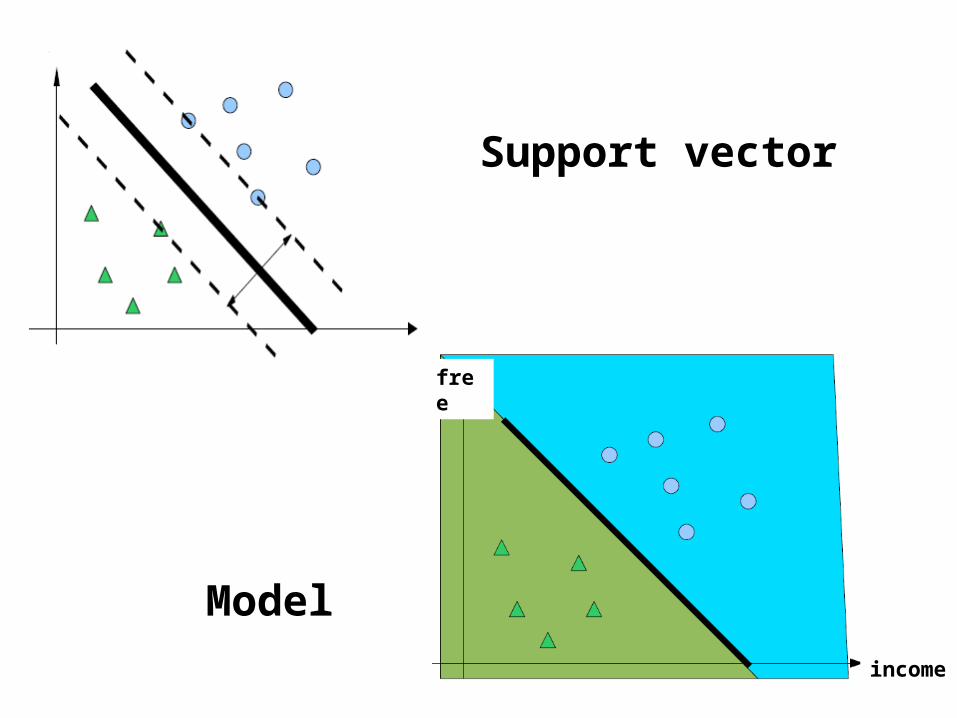
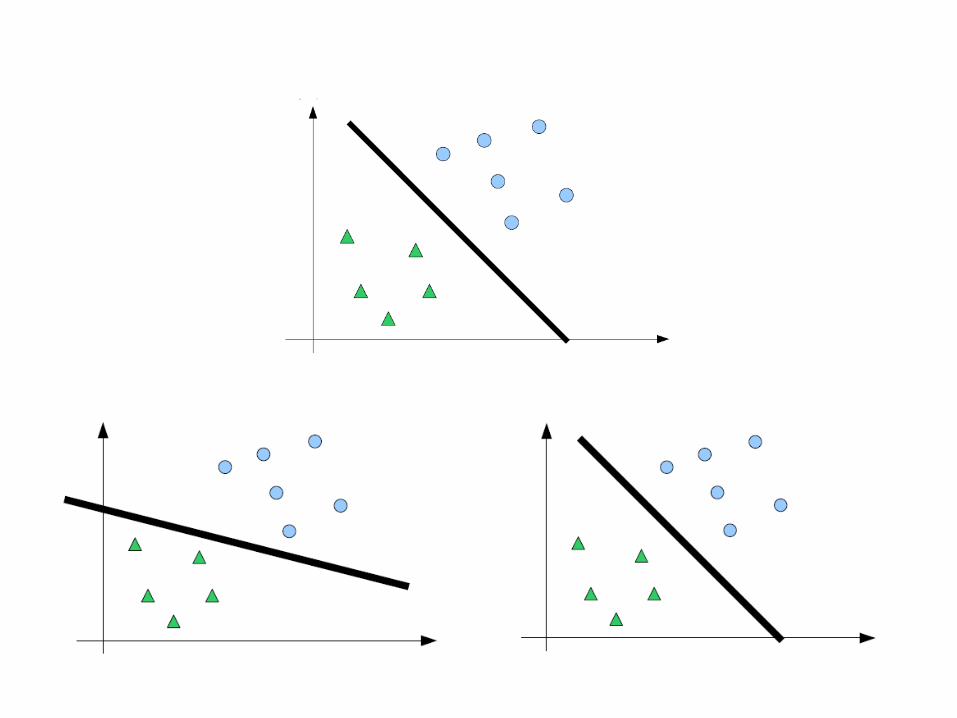
Support vector
Model
free
income

But the world is not so ideal.

Real world data

Hyper-dimension

Error cut

SVM standard mathematical expression
Trade-off

In this paper
• Goal: to get the weight vector W
101*15
feature
Image weight wj of W wj, 1
wj
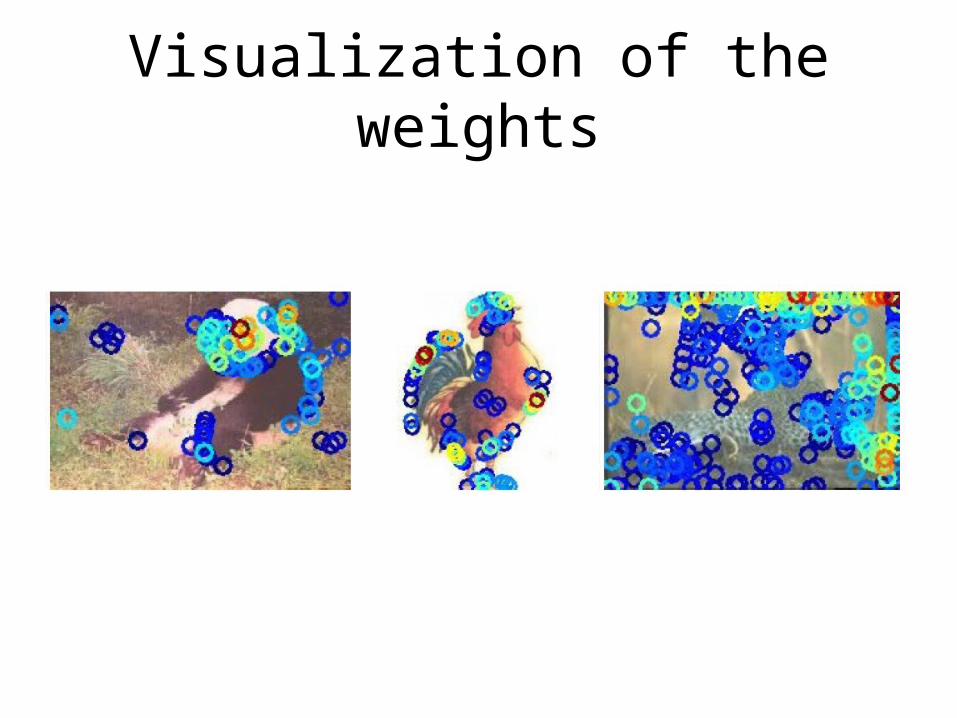
Visualization of the weights
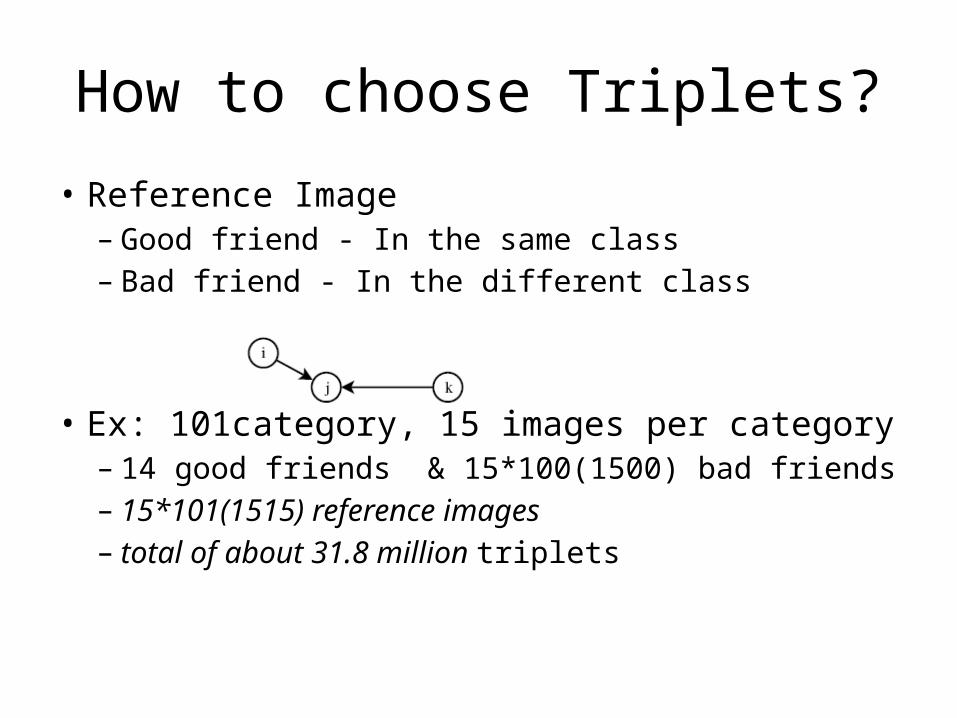
How to choose Triplets?
• Reference Image– Good friend - In the same class– Bad friend - In the different class
• Ex: 101category, 15 images per category– 14 good friends & 15*100(1500) bad friends– 15*101(1515) reference images– total of about 31.8 million triplets
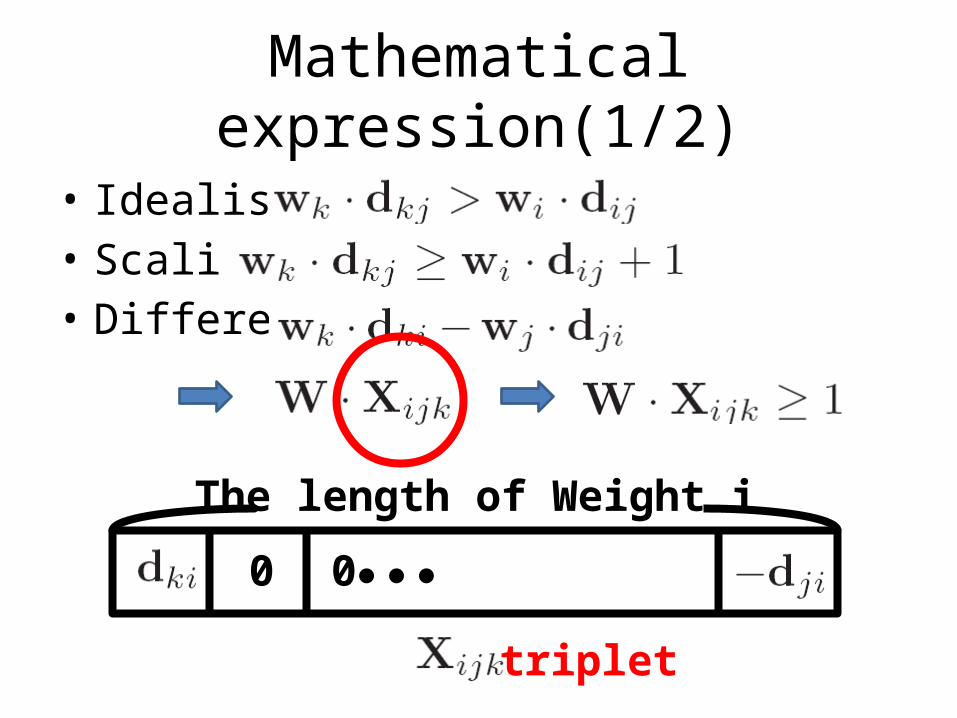
Mathematical expression(1/2)
• Idealistic: • Scaling:• Different:
The length of Weight i
0 0
triplet
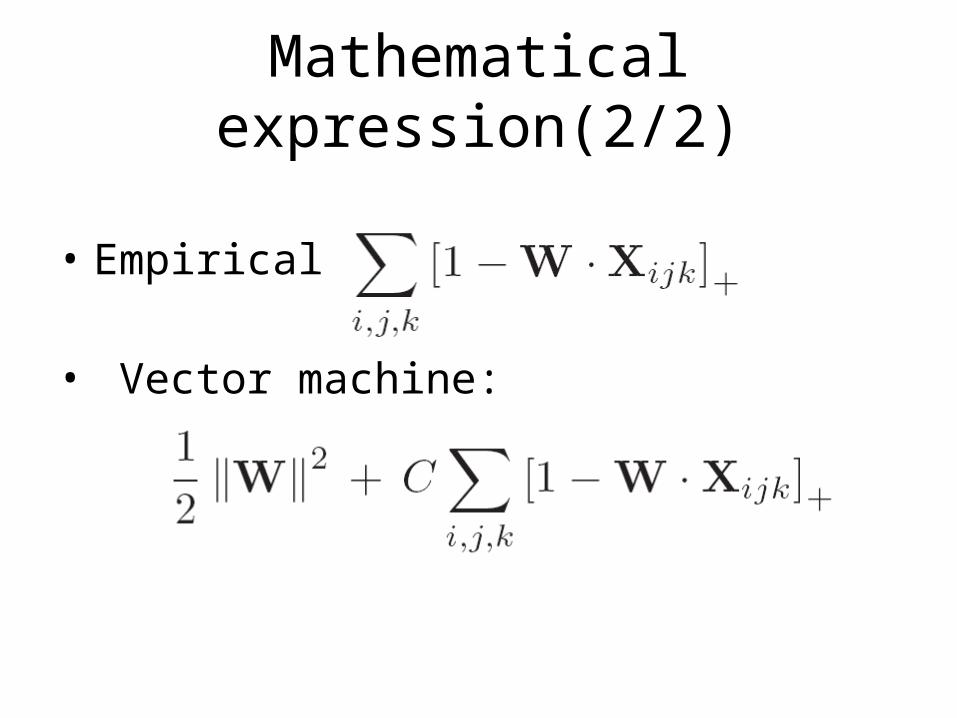
Mathematical expression(2/2)
• Empirical loss:
• Vector machine:

Dual problem
•
•
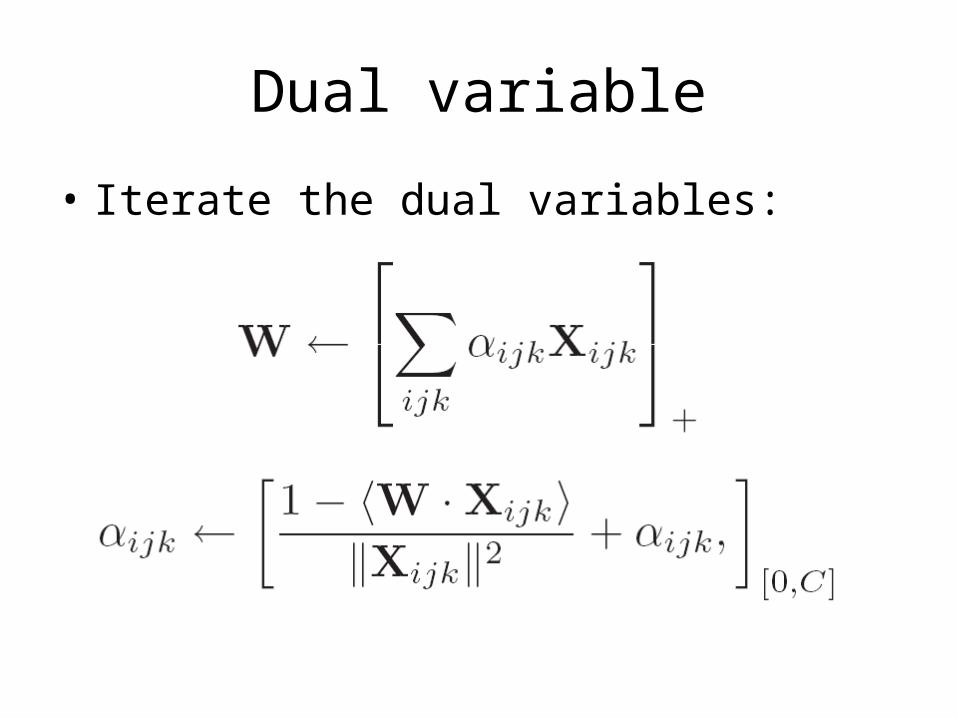
Dual variable
• Iterate the dual variables:

Early stopping
• Satisfy KTT condition– In mathematics, a solution in
nonlinear programming to be optimal.• Threshold– Dual variable update falls below a value

Outline
• Introduction• Training step
• Testing step• Experiment & Result• Conclusion

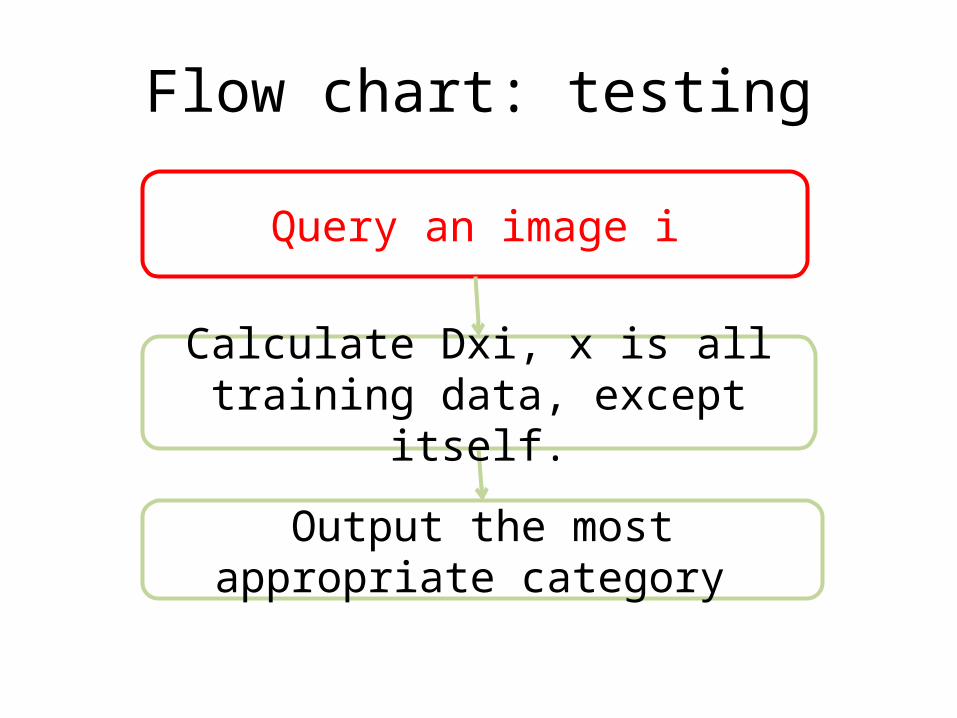
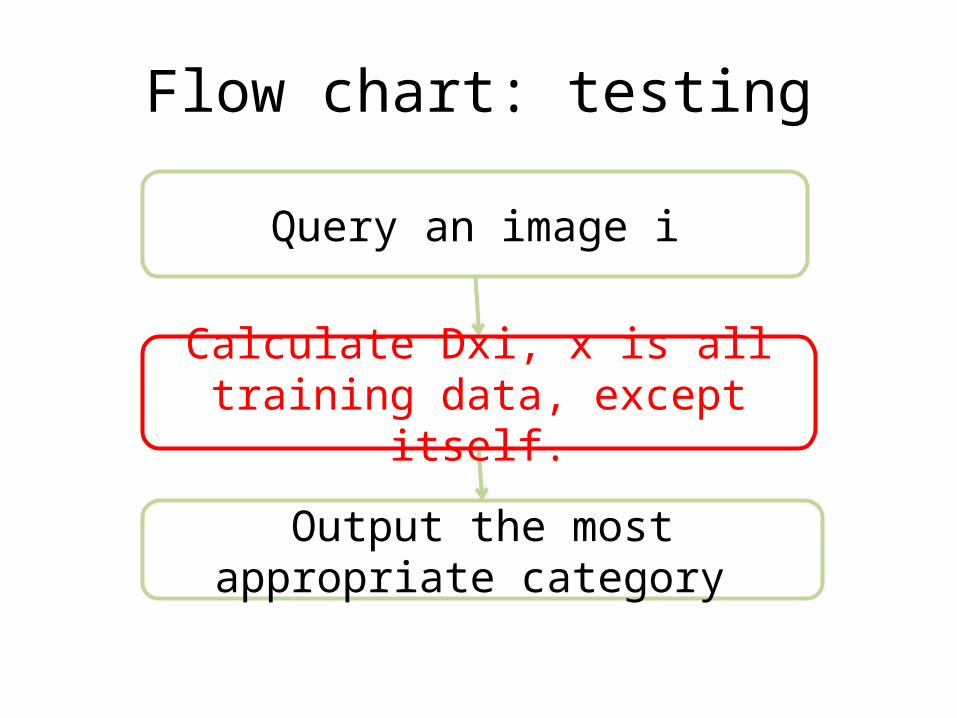
Flow chart: testing
Query an image i
Output the most appropriate category
Calculate Dxi, x is all training data, except itself.
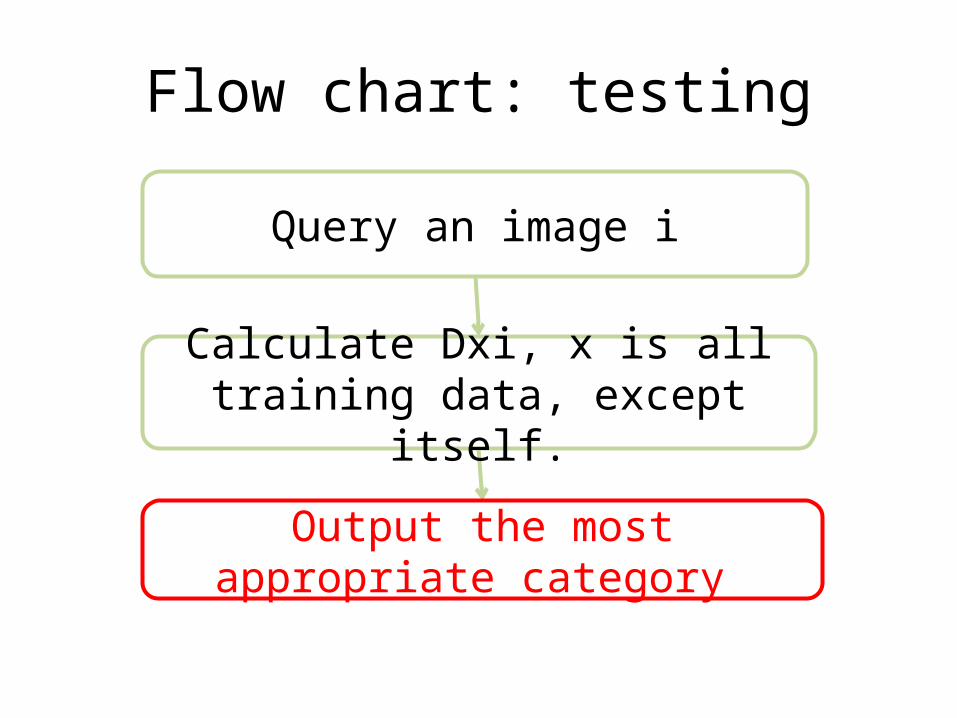
Flow chart: testing
Query an image i
Output the most appropriate category
Calculate Dxi, x is all training data, except itself.
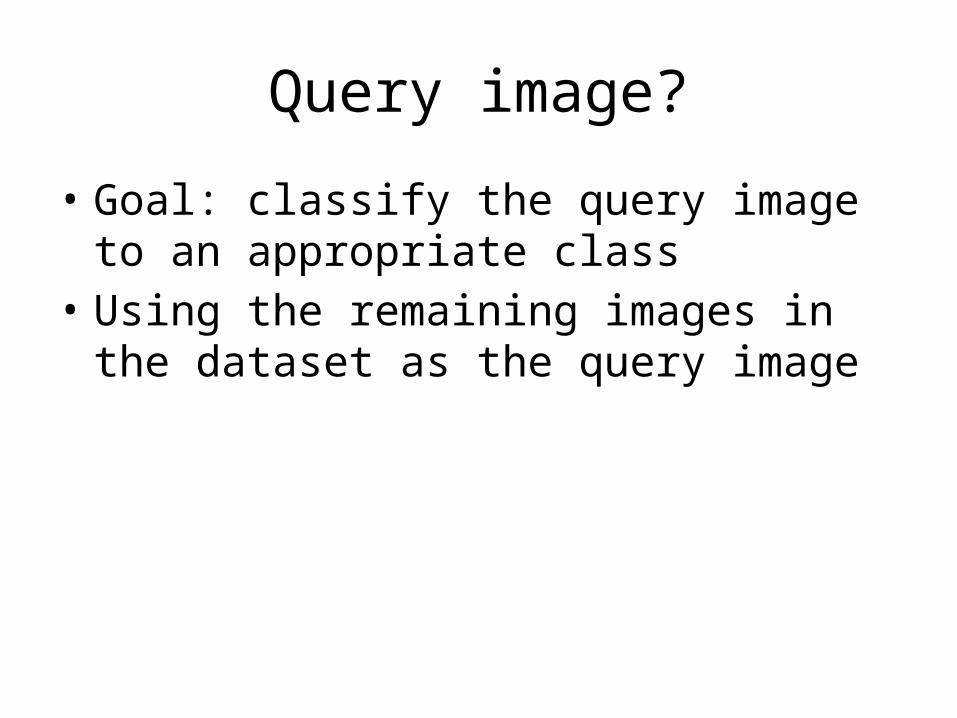
Query image?
• Goal: classify the query image to an appropriate class
• Using the remaining images in the dataset as the query image
Flow chart: testing
Query an image i
Output the most appropriate category
Calculate Dxi, x is all training data, except itself.

Distance function(1/2)
• Query image i
Image i feature
101*15
distance vector
distance vector
Image i vs all training data
dxi, 1

Distance function(2/2)
•
101*15
Image I vs all the training data
Dji
Flow chart: testing
Query an image i
Output the most appropriate category
Calculate Dxi, x is all training data, except itself.
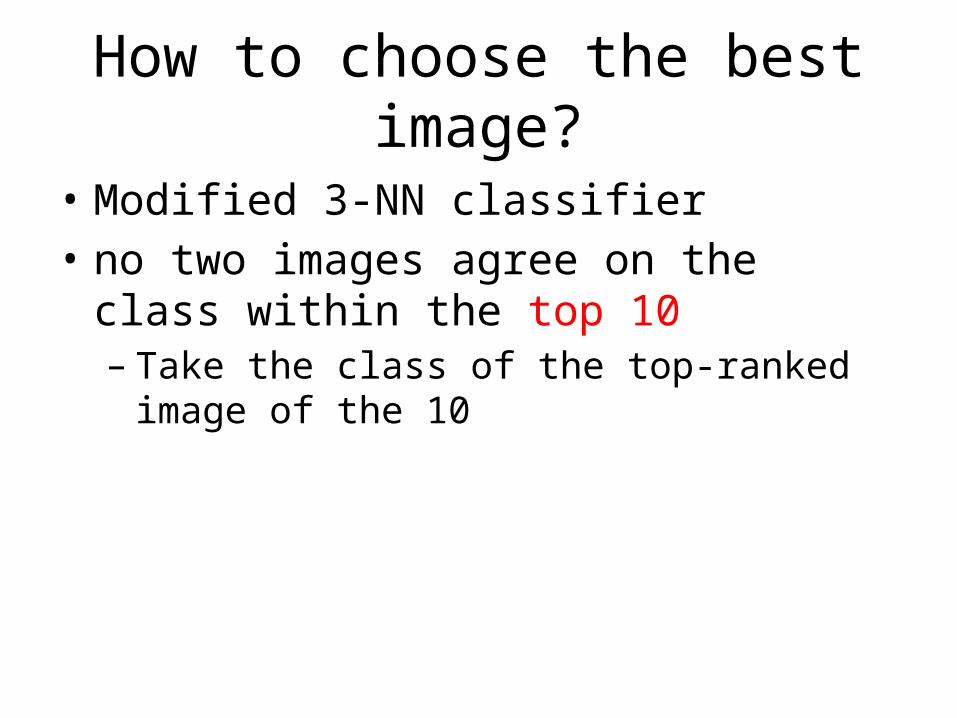
How to choose the best image?
• Modified 3-NN classifier• no two images agree on the class within the
top 10– Take the class of the top-ranked image of the 10
Outline
• Introduction• Training step• Testing step
• Experiment & Result• Conclusion
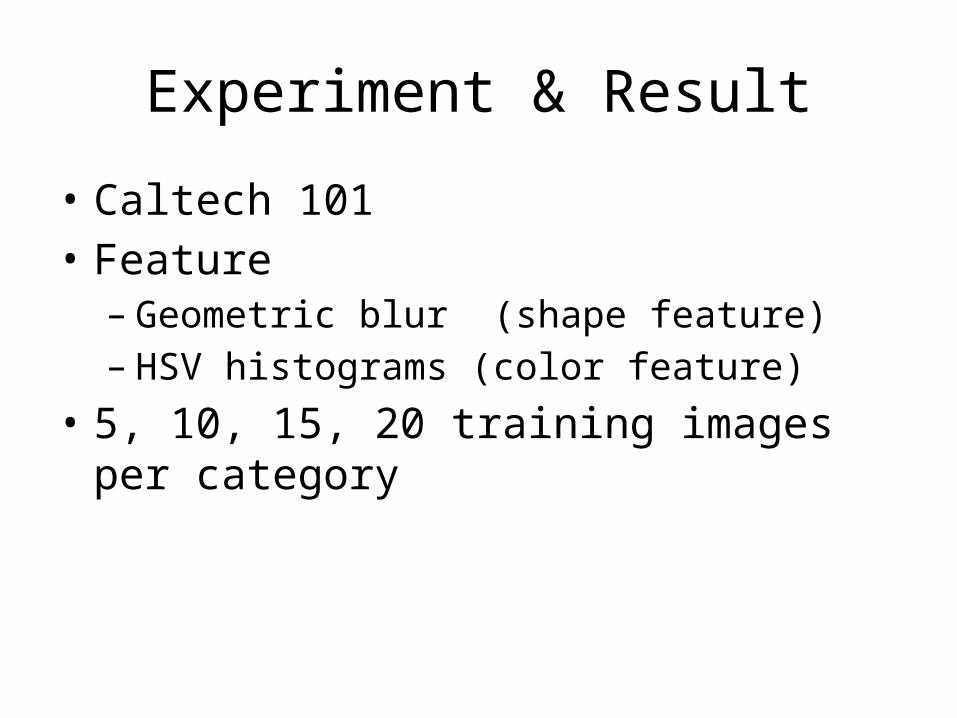
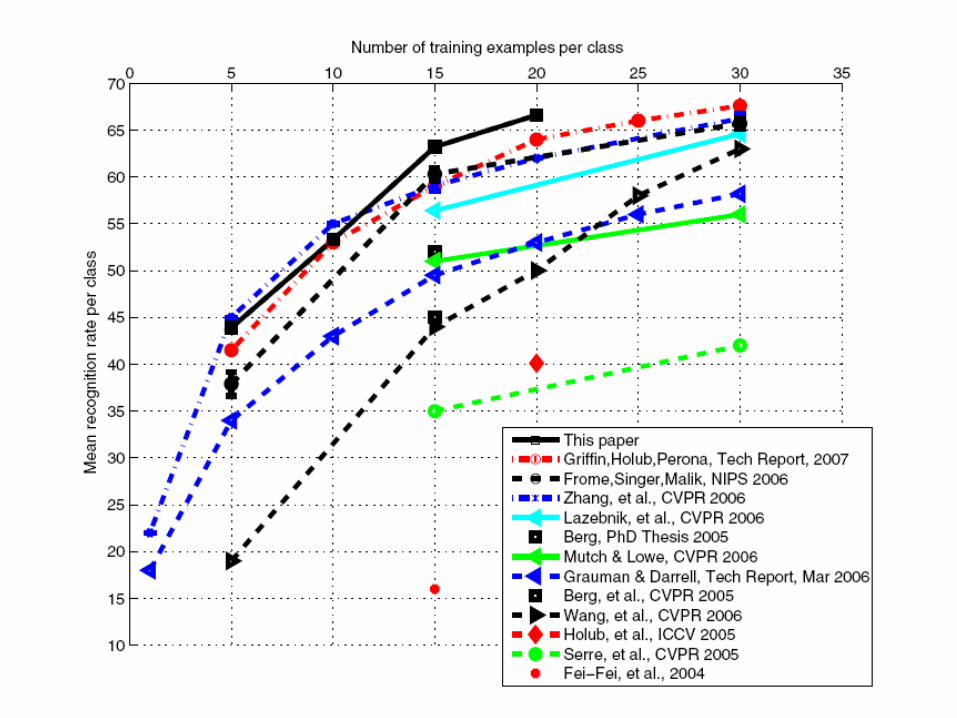
Experiment & Result
• Caltech 101• Feature– Geometric blur (shape feature)– HSV histograms (color feature)
• 5, 10, 15, 20 training images per category
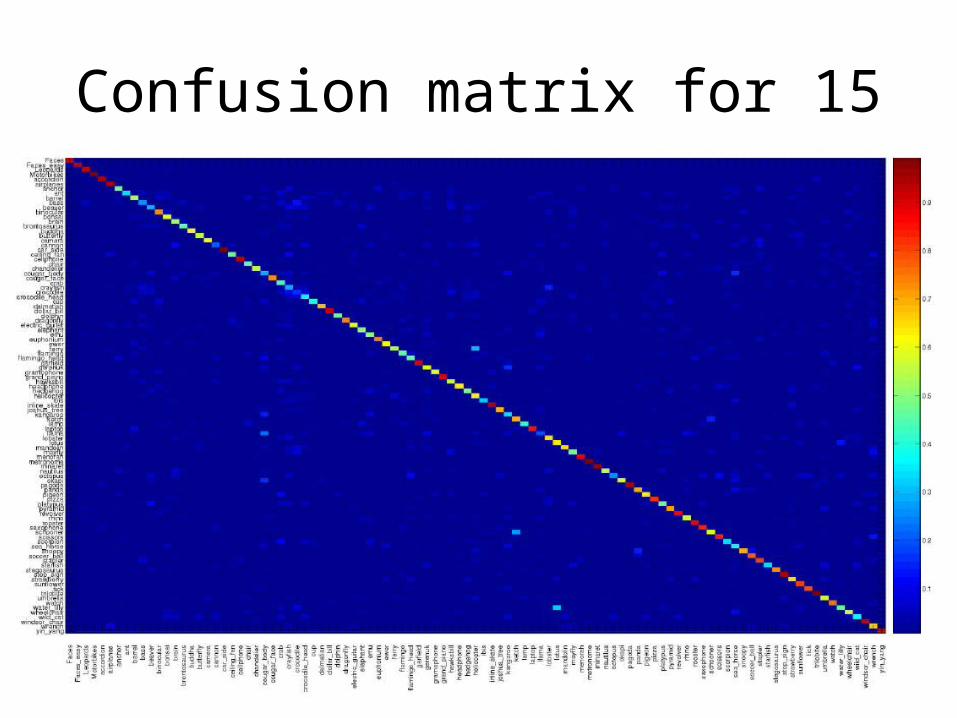
Confusion matrix for 15
Outline
• Introduction• Training step• Testing step• Experiment & Result
• Conclusion
Conclusion
• Learning Globally-Consistent Local Distance Functions for Shape-Based Image Retrieval and Classification