Embed Size (px)
Citation preview
Comprehensive Summaries of Uppsala Dissertationsfrom the Faculty of Pharmacy 311
Computational Modelling ofStructures and Ligands of
CYP2C9
BY
LOVISA AFZELIUS
ACTA UNIVERSITATIS UPSALIENSISUPPSALA 2004
List of Papers
This thesis is based on the following papers, which will be referred to by the Roman numerals assigned below.
I Afzelius L., Zamora I., Ridderström M., Andersson T.B., Karlén A. and Masimirembwa C.M. Competitive CYP2C9 Inhibitors: Enzyme Inhibition Studies, Protein Homology Modelling, and Three-Dimensional Quantitative Structure Activity Relationship Analysis. Molecular Pharmacology 59:909-919, 2001
II Afzelius L., Masimirembwa C.M., Karlén A., Andersson T.B. and Zamora I. Discriminant and quantitative PLS analysis of competitive CYP2C9 inhibitors versus non-inhibitors using alignment independent GRIND descriptors. Journal of Computer-Aided Molecular Design, 16:443-458, 2002
III Zamora I., Afzelius L. and Cruciani G. Predicting Drug Metabolism: A Site of Metabolism Prediction Tool Applied to the Cytochrome P450 2C9. Journal of Medicinal Chemistry, 46 :2313-24, 2003
IV Afzelius L., Zamora I., Masimirembwa C.M., Karlén A., Andersson T.B., Mecucci S., Baroni M. and Cruciani G. A conformer and alignment independent model to predict structurally diverse competitive CYP2C9 inhibitors. Journal of Medicinal Chemistry, Web Release Date:13-Jan-2004
V Afzelius L., Raubacher F., Karlén A., Jørgensen F.S., Andersson T.B., Masimirembwa C.M. and Zamora I. Structural analysis of CYP2C9 and CYP2C5 and evaluation of commonly used molecular modelling techniques. Manuscript in preparation
VI Afzelius L., Fontaine F., Raubacher F., Karlén A., Andersson T.B., Masimirembwa C.M., Pastor M. and Zamora I. Virtual receptor site (VRS) derivation for competitive CYP2C9 inhibitors – a novel approach for structurally diverse compounds. Manuscript in preparation
Reprints were made with the kind permission of the publishers, Kluwer Academic Publishers, American Society for Pharmacology and Experimental Therapeutics and American Chemical Society.
Abbreviations
3D QSAR three dimensional quantitative structure activity relationship ADME absorption, distribution, metabolism and excretion clogP calculated log P CoMFA comparative molecular field analysis CPCA consensus principal component analysis CPR NADPH-cytochrome P450 reductase CYP cytochrome P450 DMZ 4-methyl-N-methyl-N-(2-phenyl-2H-pyrazol-3-yl)
benzenesulfonamide EM extensive metaboliser FAD flavin adenine dinucleotide FMN flavin mononucleotide GOLPE generating optimal linear PLS estimations HLM human liver microsomes M.F.O mixed function oxidase MVA multivariate analysis MIF molecular interaction fields PC principal component PCA principal component analysis PCR principal component regression PLS projections to latent structures PM poor metaboliser QSAR quantitative structure activity relationship SAR structure activity relationship SRS substrate recognition site UDP uridine diphosphate UGT UDP-glucuronosyltransferases URM ultra rapid metaboliser VRS virtual receptor site
Contents
1 Introduction................................................................................................12 Metabolism .................................................................................................4
2.1 Overview of CYP450 enzymes ............................................................42.2 Evolutionary origin and nomenclature of CYPs...................................52.3 The CYP dependent M.F.O. reaction system .......................................62.4 General 3D structure.............................................................................7
2.4.1 Substrate recognition sites.............................................................82.5 Substrate binding ..................................................................................92.6 Catalytic mechanisms .........................................................................11
2.6.1 Spectral characteristics................................................................112.6.2 Catalytic cycle.............................................................................122.6.3 Catalytical mechanisms...............................................................13
2.7 Polymorphism.....................................................................................162.8 Enzyme kinetics..................................................................................16
2.8.1 Metabolic stability.......................................................................162.8.2 Enzyme inhibition .......................................................................172.8.3 Competitive inhibition ................................................................182.8.4 Uncompetitive inhibition.............................................................192.8.5 Mixed inhibition and non-competitive inhibition .......................212.8.6 Activation....................................................................................21
2.9 Experimental systems to study CYP450 ............................................212.9.1 Subcellular and heterologous systems – Human liver
microsomes and recombinant enzyme ........................................212.9.2 Cell-based systems – Hepatocytes and liver slices .....................22
2.10 In vitro – in vivo correlations............................................................222.11 Important families of the CYP family ..............................................23
2.11.1 Structure – activity relationships of CYPs ................................243 Computational chemistry and molecular modelling.............................26
3.1 Energy calculations.............................................................................263.2 Energy minimisation...........................................................................28
3.2.1 Conformation analysis.................................................................293.3 Ligand-based modelling .....................................................................30
3.3.1 Pharmacophore modelling...........................................................303.3.2 QSAR modelling .........................................................................313.3.3 3D – QSAR modelling ................................................................32
3.4 Structure-based modelling ..................................................................373.4.1 Homology modelling ..................................................................373.4.2 Docking .......................................................................................38
3.5 Statistical methods..............................................................................393.5.1 Statistical methods for multivariate analysis...............................39
4 Aim and Objectives..................................................................................444.1 Aim ..................................................................................................444.2 Objectives ...........................................................................................44
5 Summary and discussion.........................................................................455.1 Choice of CYP2C9 as a study model .................................................455.2 Selection of compounds and generation of CYP2C9 inhibition data .465.3 Calculation of Chemical Descriptors..................................................535.4 Selection of bioactive conformers ......................................................555.5 Discriminant model for CYP2C9 inhibitors. ......................................565.6 Classical 3D QSAR model in GRID/GOLPE ....................................565.7 3D QSAR models based on alignment independent descriptors ........575.8 Comparison of 3D QSAR models to current structural information ..575.9 Flex GRID-ALMOND QSAR model .................................................585.10 Comparison of the conformer dependent and the conformer
independent model based on ALMOND descriptors .......................595.11 Interpretation of Flex GRID – ALMOND model.............................595.12 Model to predict site of metabolism of CYP2C9 substrates.............605.13 CPCA analysis of CYP2C homology models and crystal structures615.14 Molecular dynamics simulations of CYP2C ....................................62
6 Conclusions...............................................................................................647 Acknowledgements ..................................................................................668 References.................................................................................................69
1
1 Introduction
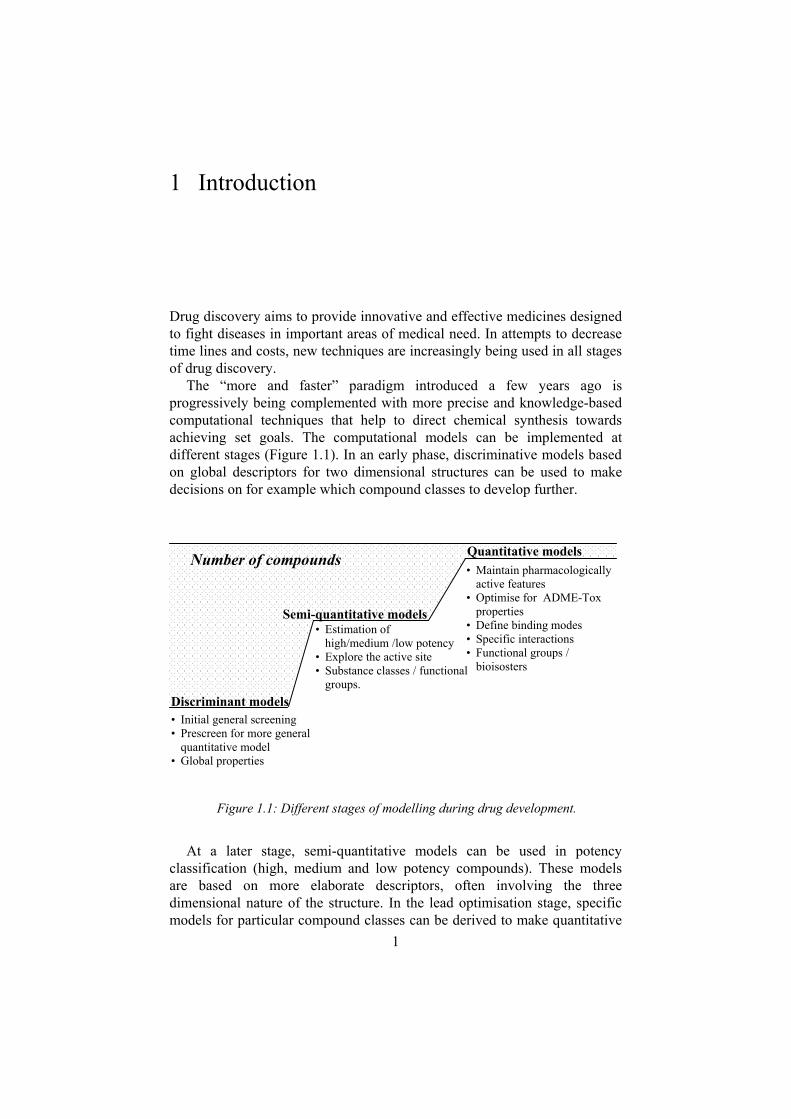
Drug discovery aims to provide innovative and effective medicines designed to fight diseases in important areas of medical need. In attempts to decrease time lines and costs, new techniques are increasingly being used in all stages of drug discovery.
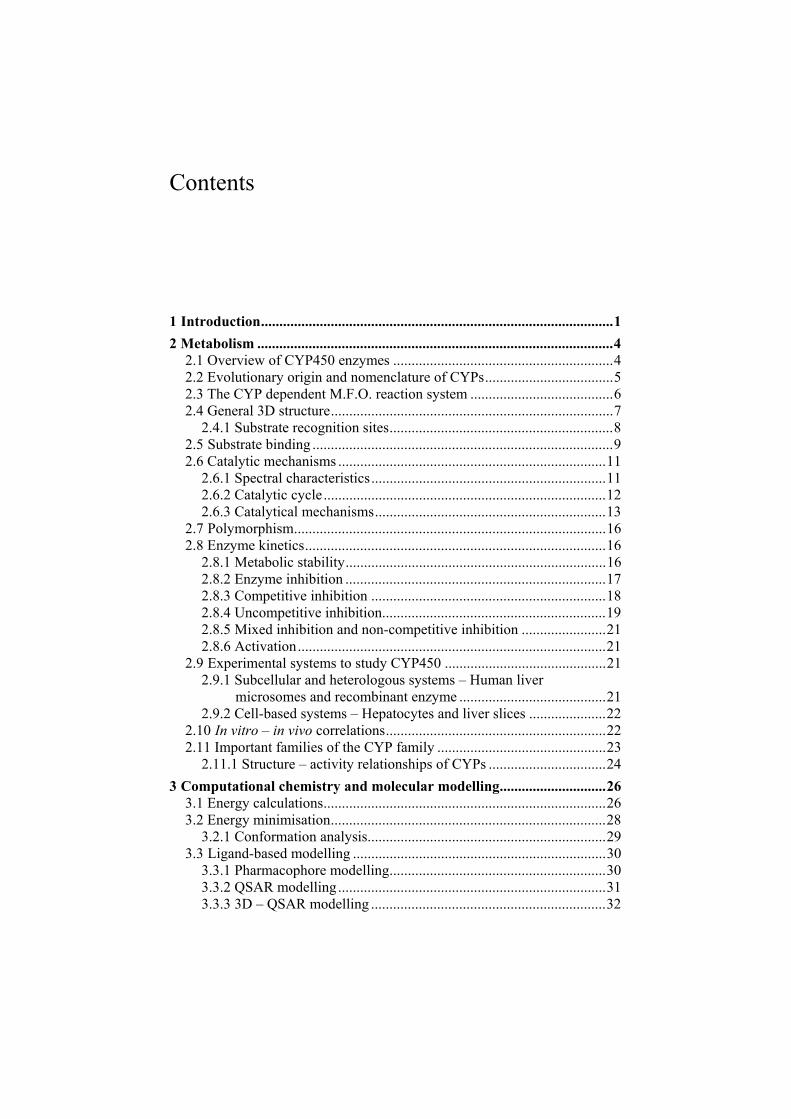
The “more and faster” paradigm introduced a few years ago is progressively being complemented with more precise and knowledge-based computational techniques that help to direct chemical synthesis towards achieving set goals. The computational models can be implemented at different stages (Figure 1.1). In an early phase, discriminative models based on global descriptors for two dimensional structures can be used to make decisions on for example which compound classes to develop further.
At a later stage, semi-quantitative models can be used in potency classification (high, medium and low potency compounds). These models are based on more elaborate descriptors, often involving the three dimensional nature of the structure. In the lead optimisation stage, specific models for particular compound classes can be derived to make quantitative
Quantitative models • Maintain pharmacologically
active features • Optimise for ADME-Tox
properties• Define binding modes • Specific interactions • Functional groups /
bioisosters
• Estimation of high/medium /low potency
• Explore the active site • Substance classes / functional
groups.Discriminant models
Number of compounds
Semi-quantitative models
• Initial general screening • Prescreen for more general
quantitative model • Global properties
Figure 1.1: Different stages of modelling during drug development.
2
DOSE
PHARMACOKINETIC PHASE
PHARMACODYNAMIC PHASE
EFFECT
Cplasma protein bound
Cplasma free fraction
<
ADME - Absorption Distribution Metabolism Excretion
RECEPTOR
C biophase free
predictions of the biological activity based on high precision biological data with defined mechanisms of binding. In these cases, three dimensional data on the ligands are often connected to protein structure data to give more information and make it possible to design more accurate models.
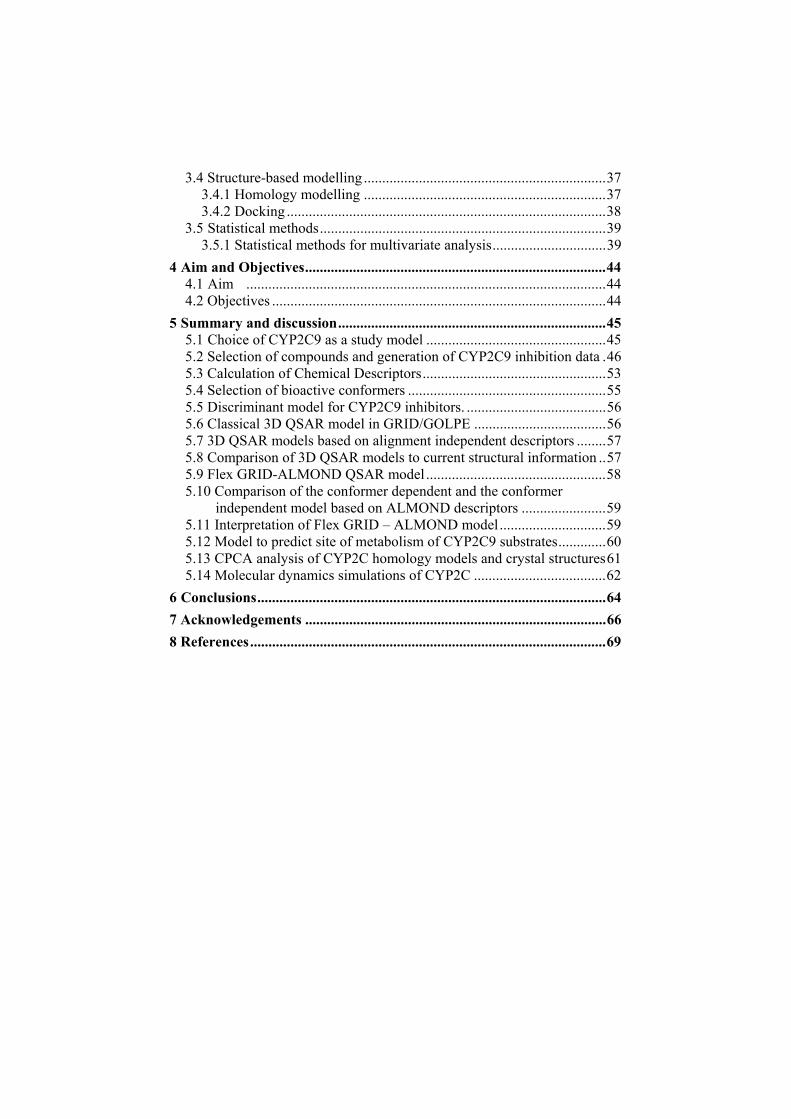
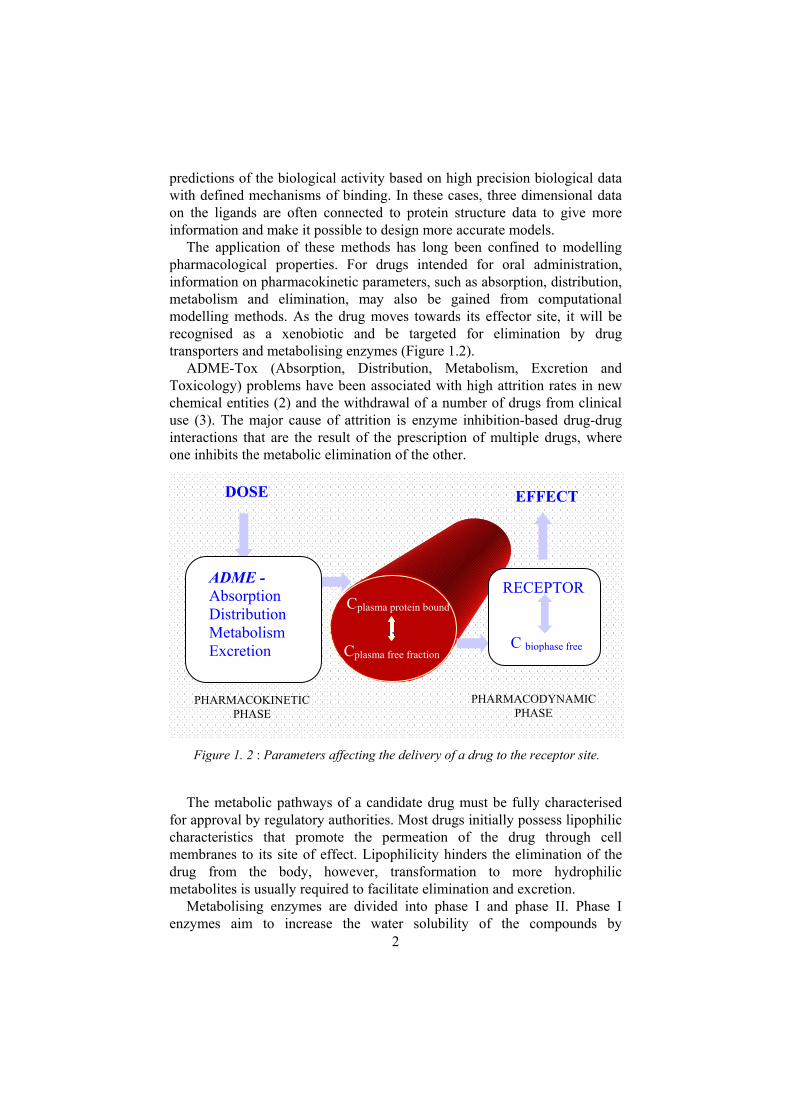
The application of these methods has long been confined to modelling pharmacological properties. For drugs intended for oral administration, information on pharmacokinetic parameters, such as absorption, distribution, metabolism and elimination, may also be gained from computational modelling methods. As the drug moves towards its effector site, it will be recognised as a xenobiotic and be targeted for elimination by drug transporters and metabolising enzymes (Figure 1.2).
ADME-Tox (Absorption, Distribution, Metabolism, Excretion and Toxicology) problems have been associated with high attrition rates in new chemical entities (2) and the withdrawal of a number of drugs from clinical use (3). The major cause of attrition is enzyme inhibition-based drug-drug interactions that are the result of the prescription of multiple drugs, where one inhibits the metabolic elimination of the other.
The metabolic pathways of a candidate drug must be fully characterised for approval by regulatory authorities. Most drugs initially possess lipophilic characteristics that promote the permeation of the drug through cell membranes to its site of effect. Lipophilicity hinders the elimination of the drug from the body, however, transformation to more hydrophilic metabolites is usually required to facilitate elimination and excretion.
Metabolising enzymes are divided into phase I and phase II. Phase I enzymes aim to increase the water solubility of the compounds by
Figure 1. 2 : Parameters affecting the delivery of a drug to the receptor site.

3
introducing functional groups such as hydroxyl groups. This is to enable direct excretion or further metabolism facilitated mainly by phase II conjugation reactions. The cytochrome P450 superfamily, which belongs to the phase I group, is responsible for metabolising an unusually wide range of endogenous and exogenous compounds. The ability to predict how a drug interacts with these enzymes prior to synthesis would be useful in modifying its metabolic characteristics. The present work was therefore initiated to derive models for substrates and inhibitors of one of the major cytochrome P450s, CYP2C9.
4
2 Metabolism
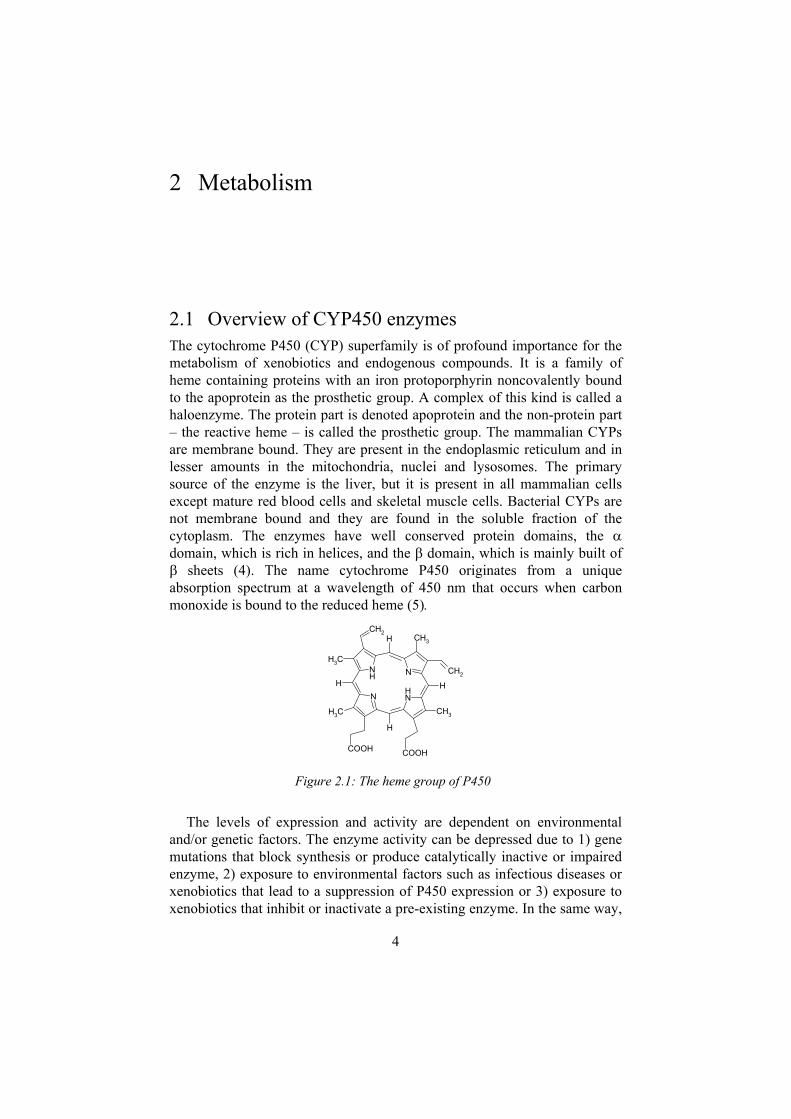
2.1 Overview of CYP450 enzymes The cytochrome P450 (CYP) superfamily is of profound importance for the metabolism of xenobiotics and endogenous compounds. It is a family of heme containing proteins with an iron protoporphyrin noncovalently bound to the apoprotein as the prosthetic group. A complex of this kind is called a haloenzyme. The protein part is denoted apoprotein and the non-protein part – the reactive heme – is called the prosthetic group. The mammalian CYPs are membrane bound. They are present in the endoplasmic reticulum and in lesser amounts in the mitochondria, nuclei and lysosomes. The primary source of the enzyme is the liver, but it is present in all mammalian cells except mature red blood cells and skeletal muscle cells. Bacterial CYPs are not membrane bound and they are found in the soluble fraction of the cytoplasm. The enzymes have well conserved protein domains, the domain, which is rich in helices, and the domain, which is mainly built of
sheets (4). The name cytochrome P450 originates from a unique absorption spectrum at a wavelength of 450 nm that occurs when carbon monoxide is bound to the reduced heme (5).
The levels of expression and activity are dependent on environmental and/or genetic factors. The enzyme activity can be depressed due to 1) gene mutations that block synthesis or produce catalytically inactive or impaired enzyme, 2) exposure to environmental factors such as infectious diseases or xenobiotics that lead to a suppression of P450 expression or 3) exposure to xenobiotics that inhibit or inactivate a pre-existing enzyme. In the same way,
NH
N
CH3
COOH
NH
N
CH3
H
H
CH3
CH2CH3
CH2
COOH
HH
Figure 2.1: The heme group of P450
5
the expression can be increased due to 1) gene duplication, giving an over-expression of P450 enzymes, 2) exposure to environmental factors that induce synthesis or 3) stimulation of a pre-existing enzyme by a xenobiotic.
Genetic regulation of CYP450 expression and/or activity is the basis of major inter-individual and interracial variability in the ability to metabolise drugs. Regulation by inhibitors is the basis of clinically important drug-drug interactions in combination therapy.
2.2 Evolutionary origin and nomenclature of CYPs It is believed that all CYPs descended from one ancestral P450 gene that existed more than 3.5 billion years ago. There are many indications that it has a prokaryotic origin and that the phylogenetic tree of the CYPs follows the presently accepted time scale for the emergence of eukaryotes and the subsequent divergence of animals and plants. It has therefore been suggested that they might have played an important role in evolution(6). The progression has been driven by gene duplications, conversions and point mutations.
The established technique for classification of evolutionary relationships is based on amino acid sequence alignment. A CYP gene has a particular CYP designation number denoting the family and an alphanumerical character defining the subfamily and the individual protein, e.g. CYP2C9. If the amino acid identity is <40%, the genes are denoted by different gene classes, such as CYP1, CYP2, CYP3 etc. Identity between 40 and 55% yields a common subfamily (CYP2A, CYP2B, CYP2C) and above that are the individual isoforms within a subfamily e.g. 2C8, 2C9 and 2C19.
In 2003 the number of CYP450 gene products identified surpassed 2000, thereby making this the largest family of proteins currently listed in gene data banks (7). These numbers are subject to constant changes. Information can be obtained at http://drnelson.utmem.edu/CytochromeP450.html (8). The human cytochromes fall into two distinct classes: one that has variable specificity (CYP1, CYP2 and CYP3) and comprises most of the drug- metabolising enzymes and a second class (CYP4 and higher) that has specific endogenous substrates. They take part in vitamin D and bile acid metabolism and in the biosynthesis of cholesterol, steroid and thromboxane A2.
6
2.3 The CYP dependent M.F.O. reaction systemA mammalian P450 reaction is dependent on several different components that make up the mixed-function oxidation system (M.F.O). This system consists of the cytochrome P450 enzyme, NADPH–cytochrome P450 reductase (CPR) and lipids. Apart from that, an equivalent amount of NADPH and molecular oxygen is required to oxidize a substrate once [Eq 2.1].
OHSubstrateOHNADPHSubstrateOHNADPH 22
Eq 2.1
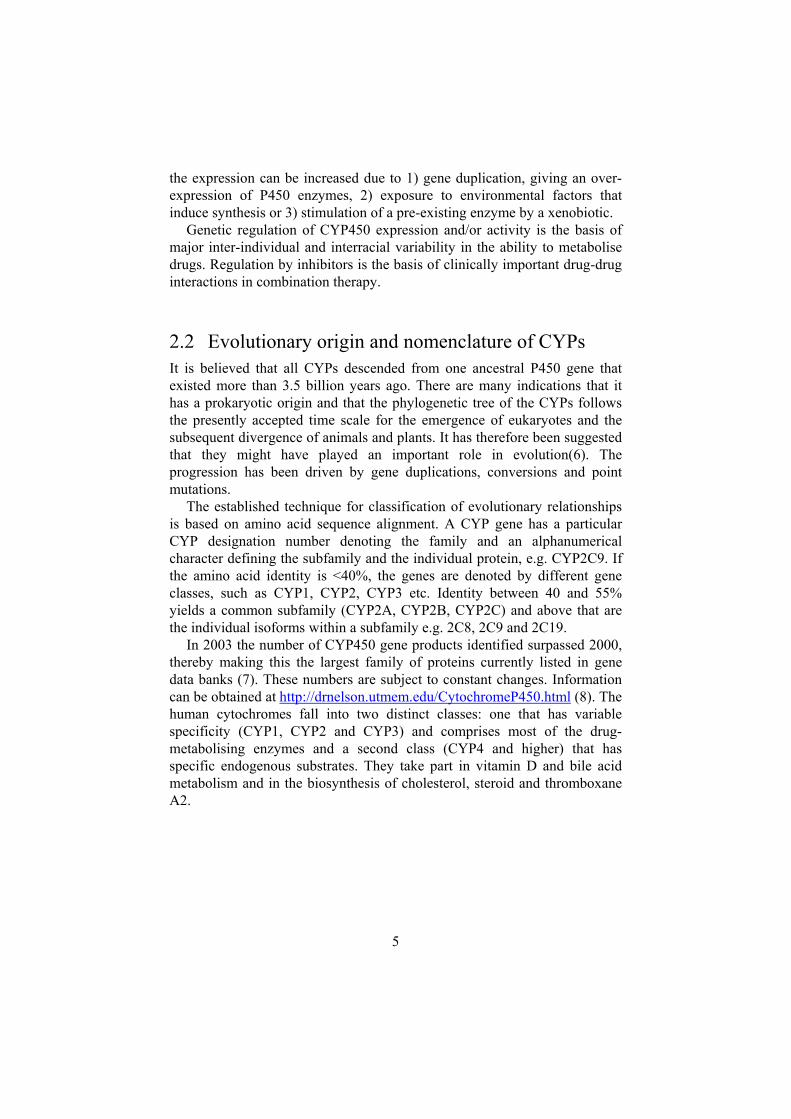
The eukaryotic CPR contains both FAD and FMN (Figure 2.2), which is the characteristic of a class II systems (all eukaryotic CYPs) (9). In this class both the CYP and the reductase are membrane bound. Most bacterial CYPs belong to class I, where both the protein and the redox partners, FAD and an iron sulphur cluster containing flavodoxin, are soluble.
One of the bacterial enzymes, the BM3, has a similar one component reductase system as exists in class II but the reductase is coupled directly to a soluble CYP. The crystal structures of BM-3 (10) were therefore proposed as the most suitable templates for homology modelling of the class II members before any mammalian cytochrome structures were resolved. BM3
N
NNH
O
NH
O
OH
OH
OH
O
PO O
N
N
O
OH OH
N
N
NH2
P
O
O
O
O
N
NNH
O
NH
O
O
P
OH
OH
OH
O
OO
Figure 2.2: FAD and FMN
7
reductase seems to be related to mammalian reductase, based on sequence alignment and recognition of a catalytic triad, represented by Ser457, Cys629 and Asp674 in human reductase (11,12).
Crystal data from CYP2C5 suggest a positive electrostatic potential area that could facilitate contact with the electronegative surface of the reductase and bring it towards the heme(13). The exact nature of this interaction is not known, since the corresponding adhesion patch defined in the co-crystallized BM3-CPR complex (10) is probably buried in the membrane in the CYP2C5 structure. Experimental estimates of the height between the membrane and the enzyme indicates that part of the enzyme should be buried in the membrane (14). The increased hydrophobicity in the helical segments between the F and the G helices together with the hydrophobicity in the region between the proline rich N-terminal and the A-helix make these regions probable candidates for membrane insertion.
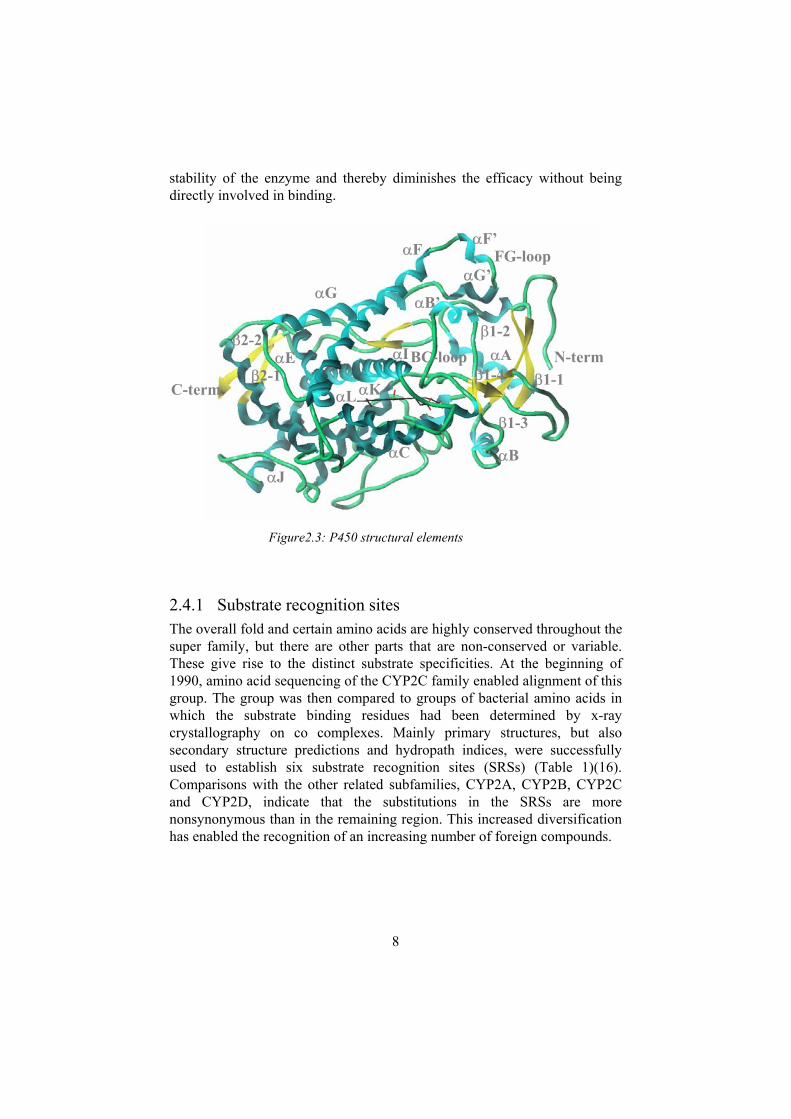
2.4 General 3D structureThe structural fold of CYPs is conserved throughout the super family despite a sequence identity that is often as low as 20 % (Figure 2.3). The core region enclosing the heme consists of helices J and K and a cluster of four helices (D, E, I and L). The proximal side of the heme in helix K has an absolutely conserved E-x-x-R motif which is suggested to play a part in core stabilisation. Another conserved region is a coil called the “meander”. The heme is sandwiched between the L helix towards the surface and the I helix towards the interior. The RMS C in this region between the BM3 and the CYP2C5/3LVdh is only 0.9 Å. The cystein penta-coordinated to the heme (Cys435 in CYP2C9) is also conserved throughout the entire super family, which shows the strong structural relationship in members of the family. Another highly conserved feature in the I helix is a threonine (Thr301). This threonine takes part in hydrogen bonds, which are a probable reason for the distinct bend in the I helix that leaves room for a water molecule inserted into the helical segment. These conserved structural features are most likely of importance in the proton-transfer step (13) prior to the water generation in the oxidative reaction (see step 5 Figure 2.6 .
In CYP2C9, the heme is held in position by hydrogen bonds between the propionic acid of the A ring and His368 and between the D ring propionate and Trp120, Arg124 and Arg433. Arg97 makes hydrogen bonds in both directions, as it is inserted between the two propionate side chains, as well as with Val113 and Pro367.
Before the crystal structure of 2C9 was solved it was shown that mutation of Arg97 produces a catalytically less active enzyme (15). Site - directed mutagenesis is often used to determine amino acids involved in binding, but this is an example in which the mutated amino acid distorts the
8
stability of the enzyme and thereby diminishes the efficacy without being directly involved in binding.
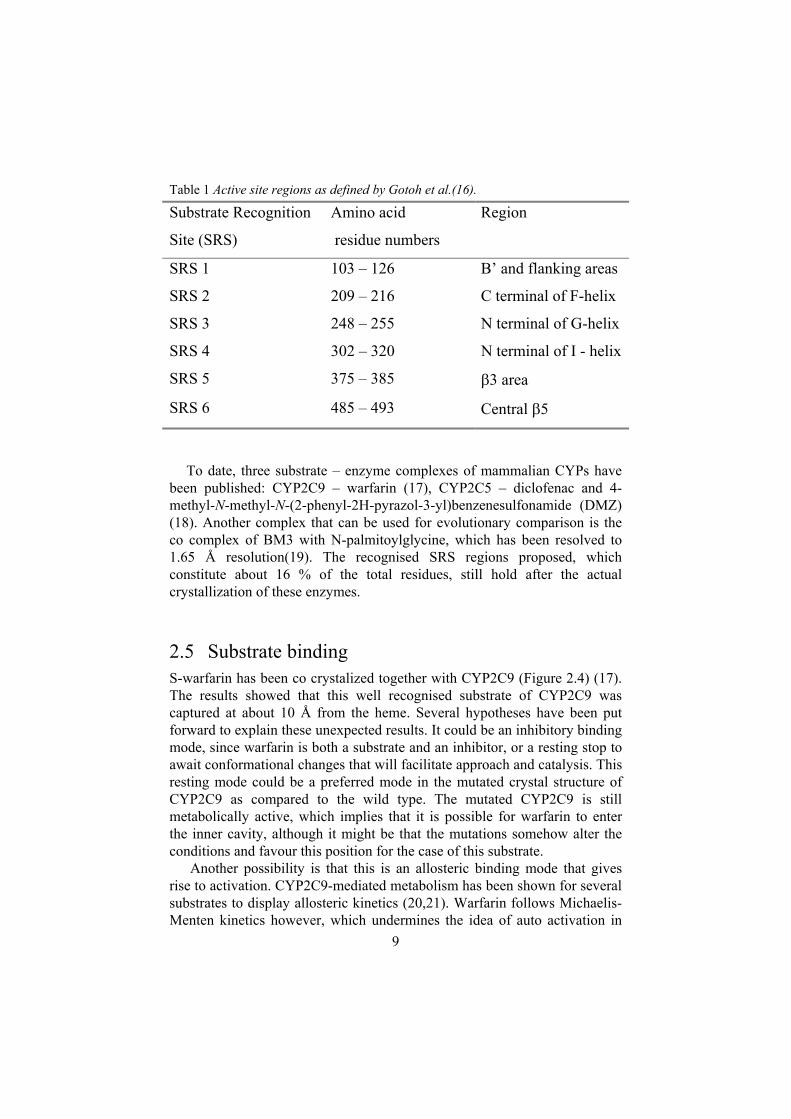
2.4.1 Substrate recognition sites The overall fold and certain amino acids are highly conserved throughout the super family, but there are other parts that are non-conserved or variable. These give rise to the distinct substrate specificities. At the beginning of 1990, amino acid sequencing of the CYP2C family enabled alignment of this group. The group was then compared to groups of bacterial amino acids in which the substrate binding residues had been determined by x-ray crystallography on co complexes. Mainly primary structures, but also secondary structure predictions and hydropath indices, were successfully used to establish six substrate recognition sites (SRSs) Table 1 (16).Comparisons with the other related subfamilies, CYP2A, CYP2B, CYP2C and CYP2D, indicate that the substitutions in the SRSs are more nonsynonymous than in the remaining region. This increased diversification has enabled the recognition of an increasing number of foreign compounds.
Figure2.3: P450 structural elements
F’
G’F
G
N-term
C-term
E I
FG-loop
BC-loop
B’
L K
JC B
1-3
1-2
1-4 1-1
2-2
2-1A
9
Table 1 Active site regions as defined by Gotoh et al.(16).
Substrate Recognition
Site (SRS)
Amino acid
residue numbers
Region
SRS 1 103 – 126 B’ and flanking areas
SRS 2 209 – 216 C terminal of F-helix
SRS 3 248 – 255 N terminal of G-helix
SRS 4 302 – 320 N terminal of I - helix
SRS 5 375 – 385 3 area
SRS 6 485 – 493 Central 5
To date, three substrate – enzyme complexes of mammalian CYPs have been published: CYP2C9 – warfarin (17), CYP2C5 – diclofenac and 4-methyl-N-methyl-N-(2-phenyl-2H-pyrazol-3-yl)benzenesulfonamide (DMZ) (18). Another complex that can be used for evolutionary comparison is the co complex of BM3 with N-palmitoylglycine, which has been resolved to 1.65 Å resolution(19). The recognised SRS regions proposed, which constitute about 16 % of the total residues, still hold after the actual crystallization of these enzymes.
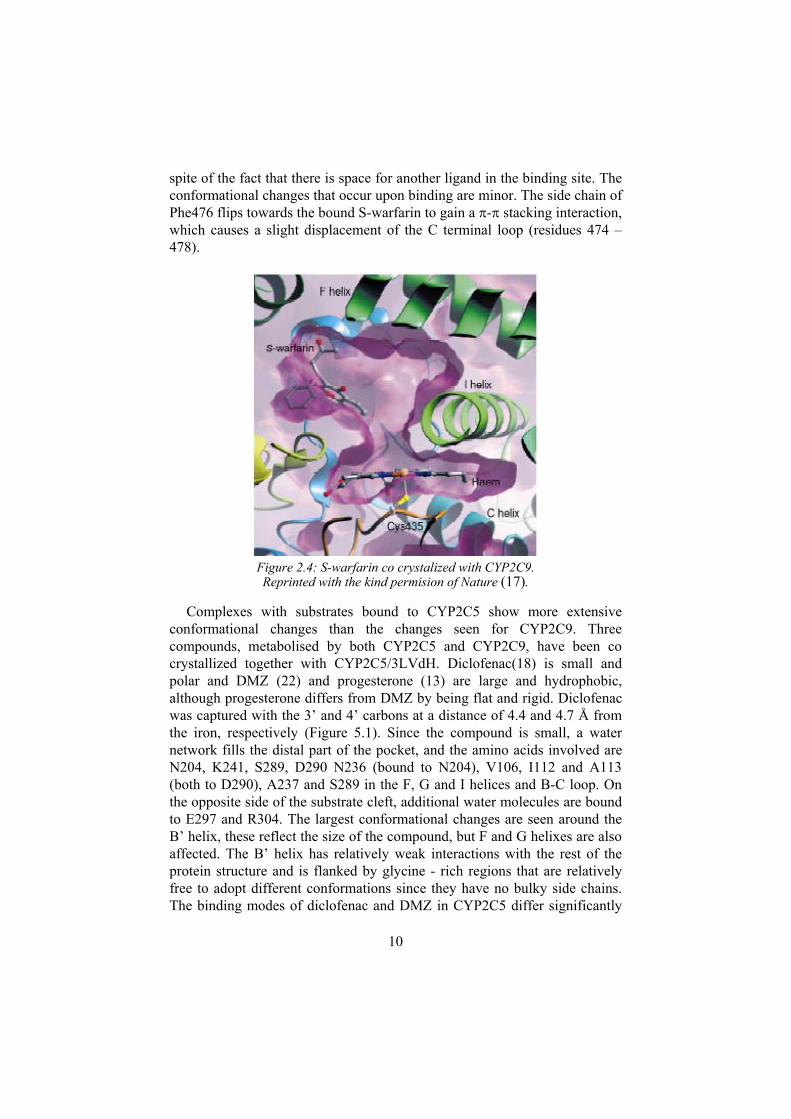
2.5 Substrate binding S-warfarin has been co crystalized together with CYP2C9 (Figure 2.4) (17). The results showed that this well recognised substrate of CYP2C9 was captured at about 10 Å from the heme. Several hypotheses have been put forward to explain these unexpected results. It could be an inhibitory binding mode, since warfarin is both a substrate and an inhibitor, or a resting stop to await conformational changes that will facilitate approach and catalysis. This resting mode could be a preferred mode in the mutated crystal structure of CYP2C9 as compared to the wild type. The mutated CYP2C9 is still metabolically active, which implies that it is possible for warfarin to enter the inner cavity, although it might be that the mutations somehow alter the conditions and favour this position for the case of this substrate.
Another possibility is that this is an allosteric binding mode that gives rise to activation. CYP2C9-mediated metabolism has been shown for several substrates to display allosteric kinetics (20,21). Warfarin follows Michaelis-Menten kinetics however, which undermines the idea of auto activation in
10
spite of the fact that there is space for another ligand in the binding site. The conformational changes that occur upon binding are minor. The side chain of Phe476 flips towards the bound S-warfarin to gain a - stacking interaction, which causes a slight displacement of the C terminal loop (residues 474 – 478).
Figure 2.4: S-warfarin co crystalized with CYP2C9. Reprinted with the kind permision of Nature (17).
Complexes with substrates bound to CYP2C5 show more extensive conformational changes than the changes seen for CYP2C9. Three compounds, metabolised by both CYP2C5 and CYP2C9, have been co crystallized together with CYP2C5/3LVdH. Diclofenac(18) is small and polar and DMZ (22) and progesterone (13) are large and hydrophobic, although progesterone differs from DMZ by being flat and rigid. Diclofenac was captured with the 3’ and 4’ carbons at a distance of 4.4 and 4.7 Å from the iron, respectively (Figure 5.1). Since the compound is small, a water network fills the distal part of the pocket, and the amino acids involved are N204, K241, S289, D290 N236 (bound to N204), V106, I112 and A113 (both to D290), A237 and S289 in the F, G and I helices and B-C loop. On the opposite side of the substrate cleft, additional water molecules are bound to E297 and R304. The largest conformational changes are seen around the B’ helix, these reflect the size of the compound, but F and G helixes are also affected. The B’ helix has relatively weak interactions with the rest of the protein structure and is flanked by glycine - rich regions that are relatively free to adopt different conformations since they have no bulky side chains. The binding modes of diclofenac and DMZ in CYP2C5 differ significantly
11
from warfarin’s position which, as discussed above, could be an inhibitory binding mode.
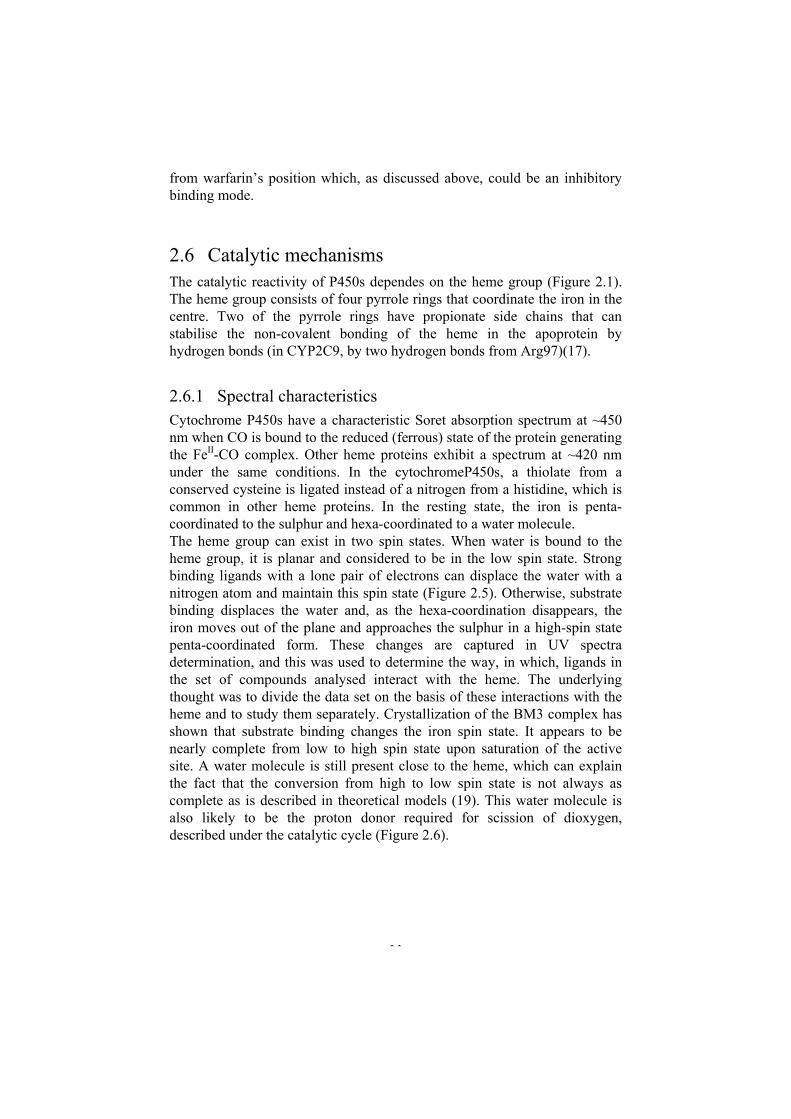
2.6 Catalytic mechanisms The catalytic reactivity of P450s dependes on the heme group (Figure 2.1). The heme group consists of four pyrrole rings that coordinate the iron in the centre. Two of the pyrrole rings have propionate side chains that can stabilise the non-covalent bonding of the heme in the apoprotein by hydrogen bonds (in CYP2C9, by two hydrogen bonds from Arg97)(17).
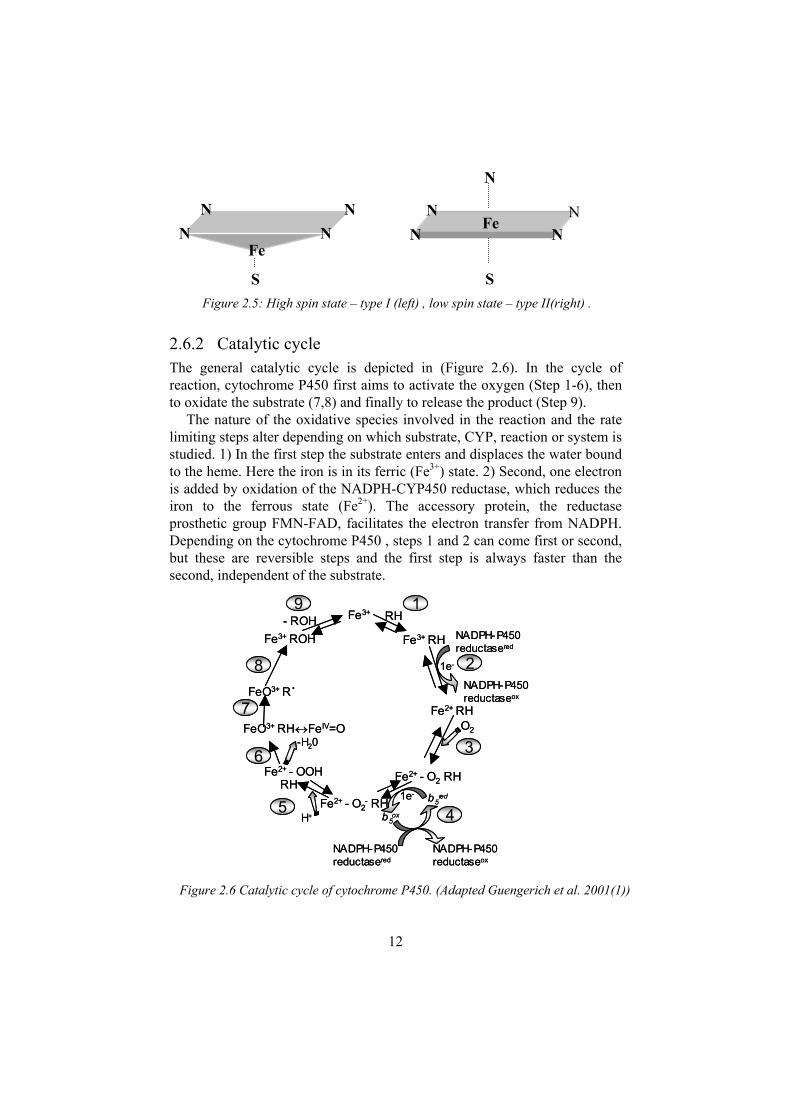
2.6.1 Spectral characteristics Cytochrome P450s have a characteristic Soret absorption spectrum at ~450 nm when CO is bound to the reduced (ferrous) state of the protein generating the FeII-CO complex. Other heme proteins exhibit a spectrum at ~420 nm under the same conditions. In the cytochromeP450s, a thiolate from a conserved cysteine is ligated instead of a nitrogen from a histidine, which is common in other heme proteins. In the resting state, the iron is penta-coordinated to the sulphur and hexa-coordinated to a water molecule. The heme group can exist in two spin states. When water is bound to the heme group, it is planar and considered to be in the low spin state. Strong binding ligands with a lone pair of electrons can displace the water with a nitrogen atom and maintain this spin state Figure 2.5 . Otherwise, substrate binding displaces the water and, as the hexa-coordination disappears, the iron moves out of the plane and approaches the sulphur in a high-spin state penta-coordinated form. These changes are captured in UV spectra determination, and this was used to determine the way, in which, ligands in the set of compounds analysed interact with the heme. The underlying thought was to divide the data set on the basis of these interactions with the heme and to study them separately. Crystallization of the BM3 complex has shown that substrate binding changes the iron spin state. It appears to be nearly complete from low to high spin state upon saturation of the active site. A water molecule is still present close to the heme, which can explain the fact that the conversion from high to low spin state is not always as complete as is described in theoretical models (19). This water molecule is also likely to be the proton donor required for scission of dioxygen, described under the catalytic cycle (Figure 2.6).
12
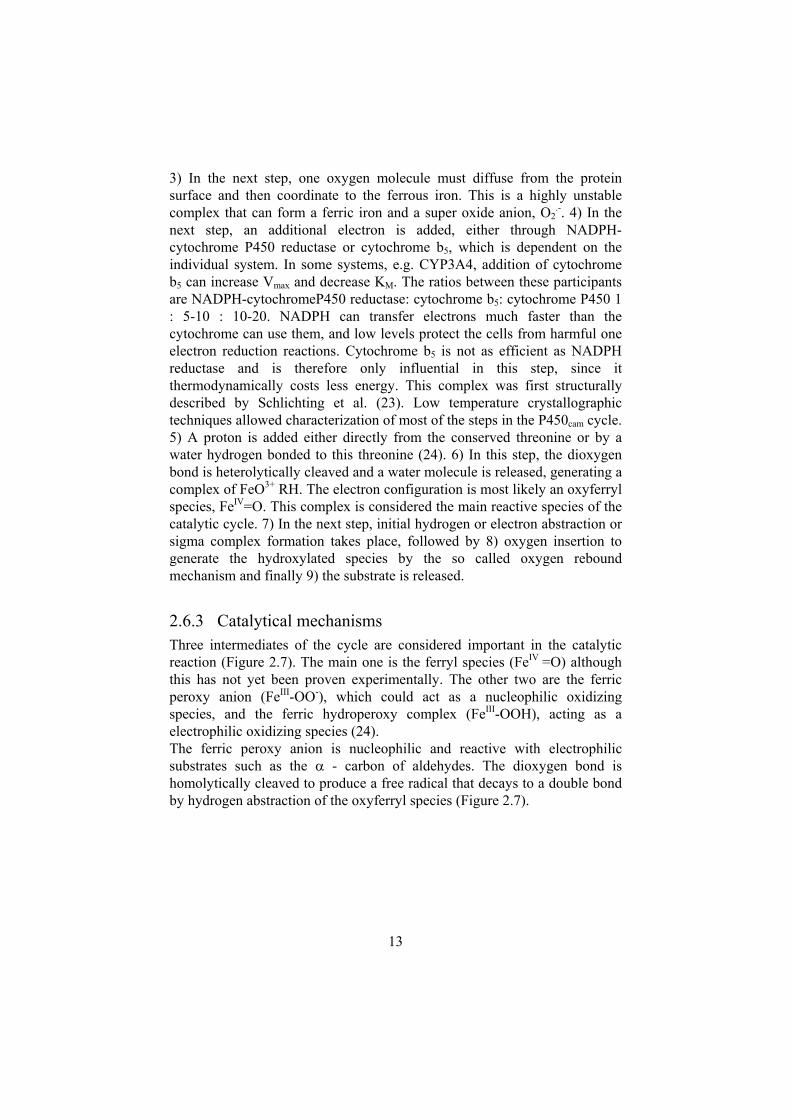
2.6.2 Catalytic cycleThe general catalytic cycle is depicted in (Figure 2.6). In the cycle of reaction, cytochrome P450 first aims to activate the oxygen (Step 1-6), then to oxidate the substrate (7,8) and finally to release the product (Step 9).
The nature of the oxidative species involved in the reaction and the rate limiting steps alter depending on which substrate, CYP, reaction or system is studied. 1) In the first step the substrate enters and displaces the water bound to the heme. Here the iron is in its ferric (Fe3+) state. 2) Second, one electron is added by oxidation of the NADPH-CYP450 reductase, which reduces the iron to the ferrous state (Fe2+). The accessory protein, the reductase prosthetic group FMN-FAD, facilitates the electron transfer from NADPH. Depending on the cytochrome P450 , steps 1 and 2 can come first or second, but these are reversible steps and the first step is always faster than the second, independent of the substrate.
NADPH-P450 reductaseox
RH1
Fe3+ RH NADPH-P450 reductasered
1e- 2
Fe2+ RHO2
3
Fe2+ - O2 RH
4
NADPH-P450 reductaseox
NADPH-P450 reductasered
Fe2+ - O2- RH5
6
7
8
9
Fe2+ - OOH RH
H+
FeO3+ RH FeIV=O
FeO3+ R.
Fe3+ ROH- ROH Fe3+
-H20
1e-
b5ox
b5red
NADPH-P450 reductaseox
RH1
Fe3+ RH NADPH-P450 reductasered
1e- 2
Fe2+ RHO2
3
Fe2+ - O2 RH
4
NADPH-P450 reductaseox
NADPH-P450 reductasered
Fe2+ - O2- RH5
6
7
8
9
Fe2+ - OOH RH
H+
FeO3+ RH FeIV=O
FeO3+ R.
Fe3+ ROH- ROH Fe3+
-H20
1e-
b5ox
b5red
Figure 2.6 Catalytic cycle of cytochrome P450. (Adapted Guengerich et al. 2001(1))
Figure 2.5: High spin state – type I (left) , low spin state – type II(right) .
NFe
S
N
N
NN
NNN
Fe
S
N
13
3) In the next step, one oxygen molecule must diffuse from the protein surface and then coordinate to the ferrous iron. This is a highly unstable complex that can form a ferric iron and a super oxide anion, O2
.-. 4) In the next step, an additional electron is added, either through NADPH-cytochrome P450 reductase or cytochrome b5, which is dependent on the individual system. In some systems, e.g. CYP3A4, addition of cytochrome b5 can increase Vmax and decrease KM. The ratios between these participants are NADPH-cytochromeP450 reductase: cytochrome b5: cytochrome P450 1 : 5-10 : 10-20. NADPH can transfer electrons much faster than the cytochrome can use them, and low levels protect the cells from harmful one electron reduction reactions. Cytochrome b5 is not as efficient as NADPH reductase and is therefore only influential in this step, since it thermodynamically costs less energy. This complex was first structurally described by Schlichting et al. (23). Low temperature crystallographic techniques allowed characterization of most of the steps in the P450cam cycle. 5) A proton is added either directly from the conserved threonine or by a water hydrogen bonded to this threonine (24). 6) In this step, the dioxygen bond is heterolytically cleaved and a water molecule is released, generating a complex of FeO3+ RH. The electron configuration is most likely an oxyferryl species, FeIV=O. This complex is considered the main reactive species of the catalytic cycle. 7) In the next step, initial hydrogen or electron abstraction or sigma complex formation takes place, followed by 8) oxygen insertion to generate the hydroxylated species by the so called oxygen rebound mechanism and finally 9) the substrate is released.
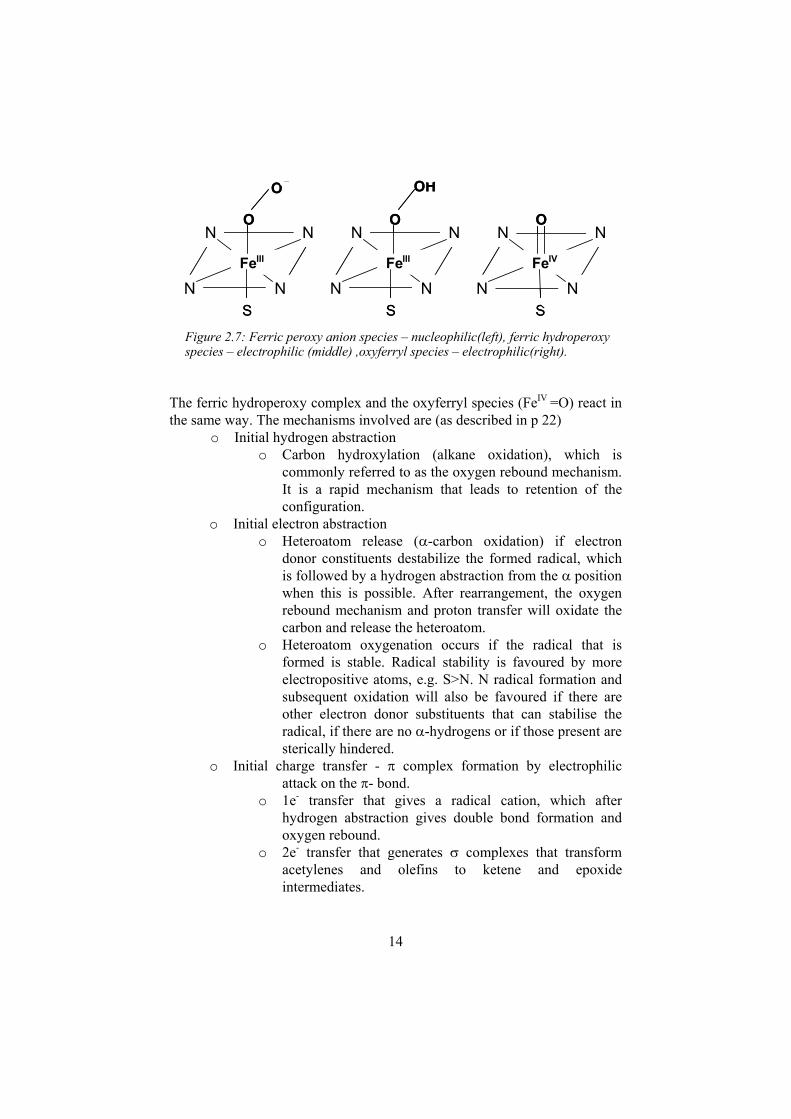
2.6.3 Catalytical mechanisms Three intermediates of the cycle are considered important in the catalytic reaction (Figure 2.7). The main one is the ferryl species (FeIV =O) although this has not yet been proven experimentally. The other two are the ferric peroxy anion (FeIII-OO-), which could act as a nucleophilic oxidizing species, and the ferric hydroperoxy complex (FeIII-OOH), acting as a electrophilic oxidizing species (24). The ferric peroxy anion is nucleophilic and reactive with electrophilic substrates such as the - carbon of aldehydes. The dioxygen bond is homolytically cleaved to produce a free radical that decays to a double bond by hydrogen abstraction of the oxyferryl species (Figure 2.7).
14
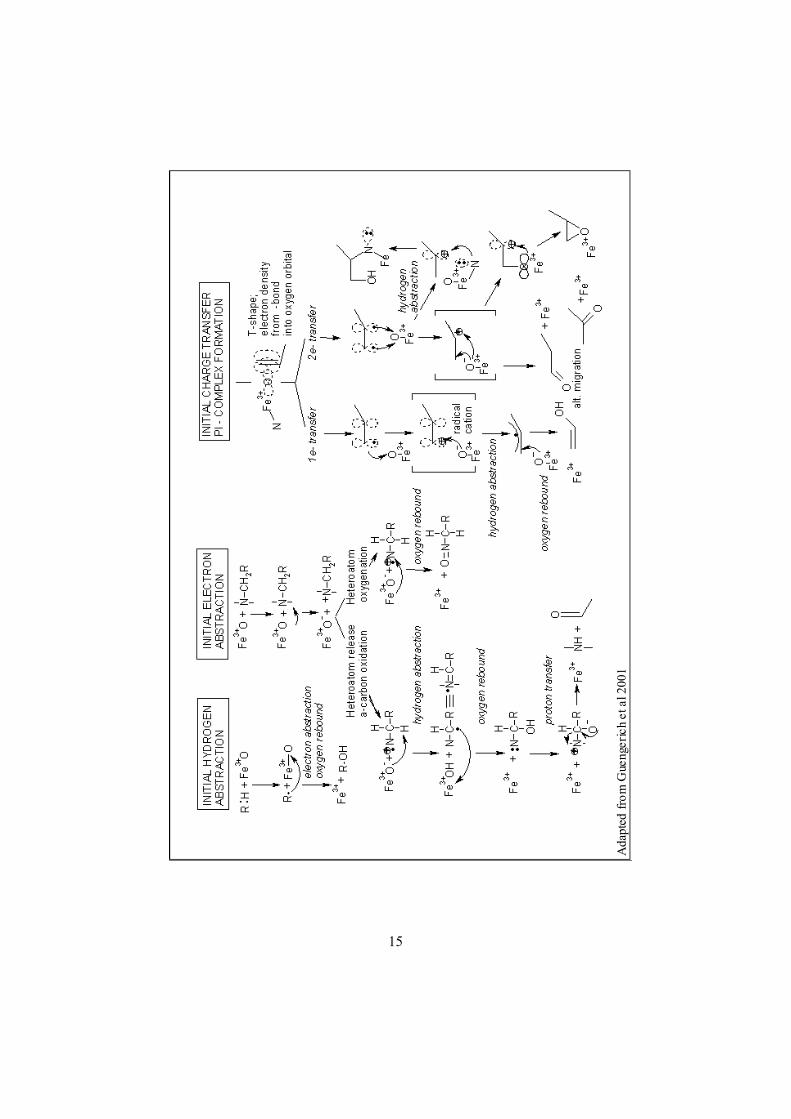
The ferric hydroperoxy complex and the oxyferryl species (FeIV =O) react in the same way. The mechanisms involved are (as described in p 22)
o Initial hydrogen abstraction o Carbon hydroxylation (alkane oxidation), which is
commonly referred to as the oxygen rebound mechanism. It is a rapid mechanism that leads to retention of the configuration.
o Initial electron abstractiono Heteroatom release ( -carbon oxidation) if electron
donor constituents destabilize the formed radical, which is followed by a hydrogen abstraction from the position when this is possible. After rearrangement, the oxygen rebound mechanism and proton transfer will oxidate the carbon and release the heteroatom.
o Heteroatom oxygenation occurs if the radical that is formed is stable. Radical stability is favoured by more electropositive atoms, e.g. S>N. N radical formation and subsequent oxidation will also be favoured if there are other electron donor substituents that can stabilise the radical, if there are no -hydrogens or if those present are sterically hindered.
o Initial charge transfer - complex formation by electrophilic attack on the - bond.
o 1e- transfer that gives a radical cation, which after hydrogen abstraction gives double bond formation and oxygen rebound.
o 2e- transfer that generates complexes that transform acetylenes and olefins to ketene and epoxide intermediates.
N
NN
N
FeIII
O
OH
S
N
NN
N
FeIII
O
OH
S
N
NN
N
FeIV
O_
_ _
S_
N
NN
N
FeIV
O
S
N
NN
N
FeIII
O
O_
S
N
NN
N
FeIII
O
O_
S
Figure 2.7: Ferric peroxy anion species – nucleophilic(left), ferric hydroperoxy species – electrophilic (middle) ,oxyferryl species – electrophilic(right).
15
Ada
pted
from
Gue
nger
ich
et a
l 200
1
16
2.7 Polymorphism Genetic variation is common in the human genome. Most of these variations are due to single point base pair mutations that give rise to altered amino acid coding. In most cases these mutations lead to a catalytically less active enzyme or an enzyme with a different substrate specificity. In other cases the mutation results in a premature stop codon or changes the initiation code, which will result in a null allele, that is, no enzyme is formed. Depending on whether this occurs in one or both of the alleles of the chromosome, heterozygous or homozygous polymorphism, the extent of the effect differs. The distribution in a population with regard to enzyme activity results in the poor metaboliser (PM), extensive metaboliser (EM) and ultra rapid metaboliser (URM) subclasses. Individuals in the different subgroups can have clinically important variations in drug response.
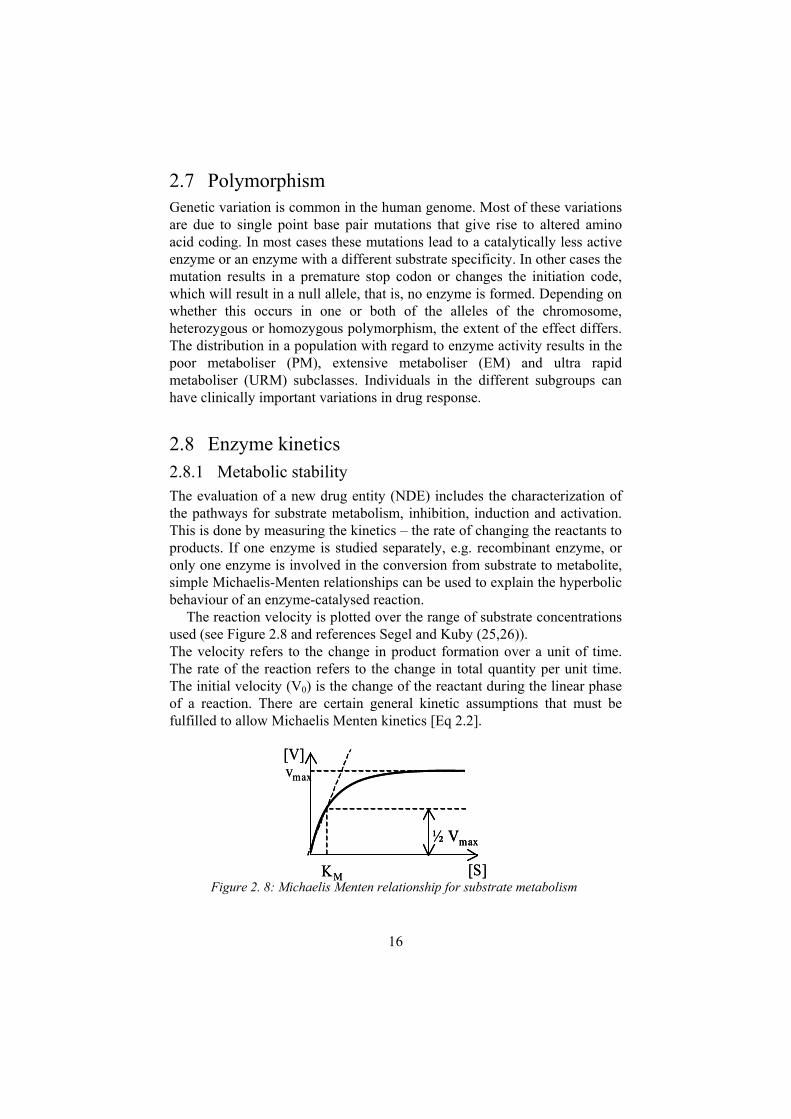
2.8 Enzyme kinetics 2.8.1 Metabolic stability The evaluation of a new drug entity (NDE) includes the characterization of the pathways for substrate metabolism, inhibition, induction and activation. This is done by measuring the kinetics – the rate of changing the reactants to products. If one enzyme is studied separately, e.g. recombinant enzyme, or only one enzyme is involved in the conversion from substrate to metabolite, simple Michaelis-Menten relationships can be used to explain the hyperbolic behaviour of an enzyme-catalysed reaction.
The reaction velocity is plotted over the range of substrate concentrations used (see Figure 2.8 and references Segel and Kuby (25,26)). The velocity refers to the change in product formation over a unit of time. The rate of the reaction refers to the change in total quantity per unit time. The initial velocity (V0) is the change of the reactant during the linear phase of a reaction. There are certain general kinetic assumptions that must be fulfilled to allow Michaelis Menten kinetics [Eq 2.2].
Figure 2. 8: Michaelis Menten relationship for substrate metabolism
½ Vmax
[V]
[S]KM
vmax
½ Vmax½ Vmax
[V]
[S]KM
vmax
17
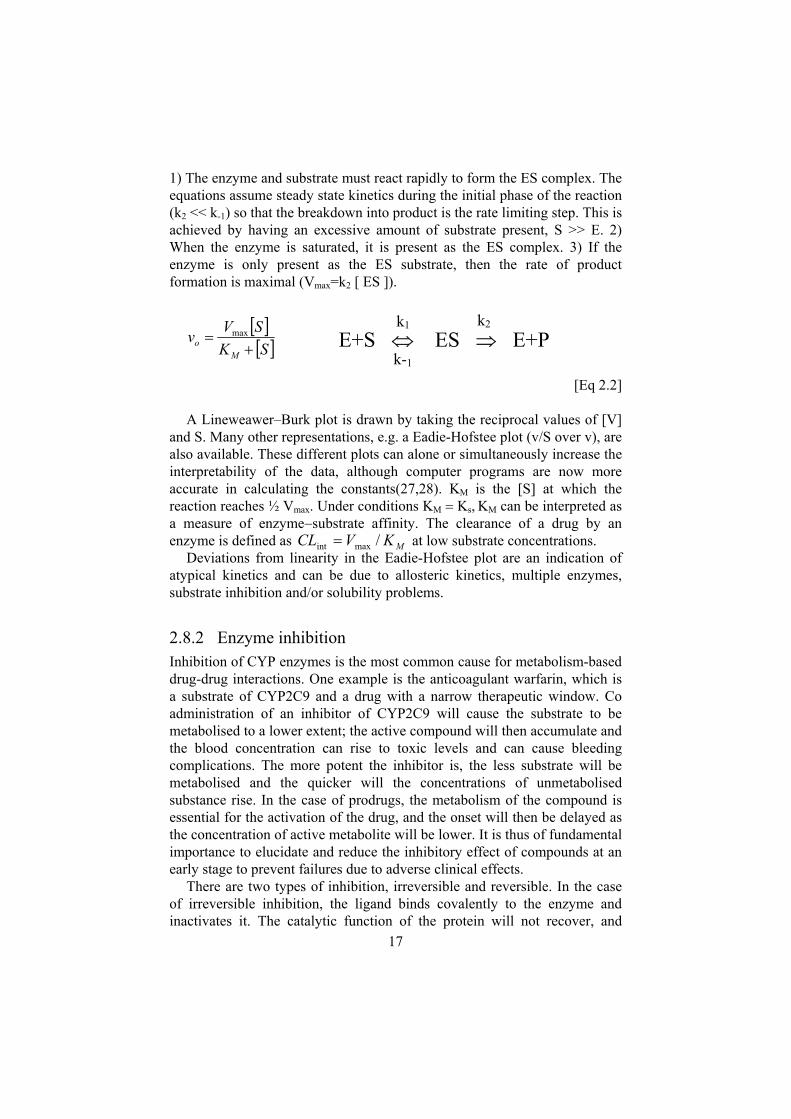
1) The enzyme and substrate must react rapidly to form the ES complex. The equations assume steady state kinetics during the initial phase of the reaction (k2 << k-1) so that the breakdown into product is the rate limiting step. This is achieved by having an excessive amount of substrate present, S >> E. 2) When the enzyme is saturated, it is present as the ES complex. 3) If the enzyme is only present as the ES substrate, then the rate of product formation is maximal (Vmax=k2 [ ES ]).
[Eq 2.2]
A Lineweawer–Burk plot is drawn by taking the reciprocal values of [V] and S. Many other representations, e.g. a Eadie-Hofstee plot (v/S over v), are also available. These different plots can alone or simultaneously increase the interpretability of the data, although computer programs are now more accurate in calculating the constants(27,28). KM is the S at which the reaction reaches ½ Vmax. Under conditions KM Ks, KM can be interpreted as a measure of enzyme substrate affinity. The clearance of a drug by an enzyme is defined as MKVCL /maxint at low substrate concentrations.
Deviations from linearity in the Eadie-Hofstee plot are an indication of atypical kinetics and can be due to allosteric kinetics, multiple enzymes, substrate inhibition and/or solubility problems.
2.8.2 Enzyme inhibitionInhibition of CYP enzymes is the most common cause for metabolism-based drug-drug interactions. One example is the anticoagulant warfarin, which is a substrate of CYP2C9 and a drug with a narrow therapeutic window. Co administration of an inhibitor of CYP2C9 will cause the substrate to be metabolised to a lower extent; the active compound will then accumulate and the blood concentration can rise to toxic levels and can cause bleeding complications. The more potent the inhibitor is, the less substrate will be metabolised and the quicker will the concentrations of unmetabolised substance rise. In the case of prodrugs, the metabolism of the compound is essential for the activation of the drug, and the onset will then be delayed as the concentration of active metabolite will be lower. It is thus of fundamental importance to elucidate and reduce the inhibitory effect of compounds at an early stage to prevent failures due to adverse clinical effects.
There are two types of inhibition, irreversible and reversible. In the case of irreversible inhibition, the ligand binds covalently to the enzyme and inactivates it. The catalytic function of the protein will not recover, and
SKSVv
Mo
max E+S ES E+P k1
k-1
k2
18
enzymatic activity will not return until new protein has been synthesized. Tienilic acid binds covalently to Ser365 in CYP2C9 and causes mechanism-based inhibition (29). It is common, as in the case of tienilic acid, that the mechanism-based inhibitor is also a substrate of the enzyme. In most cases, it is the reaction product (the metabolite) that reacts with the cytochrome and inactivates it.
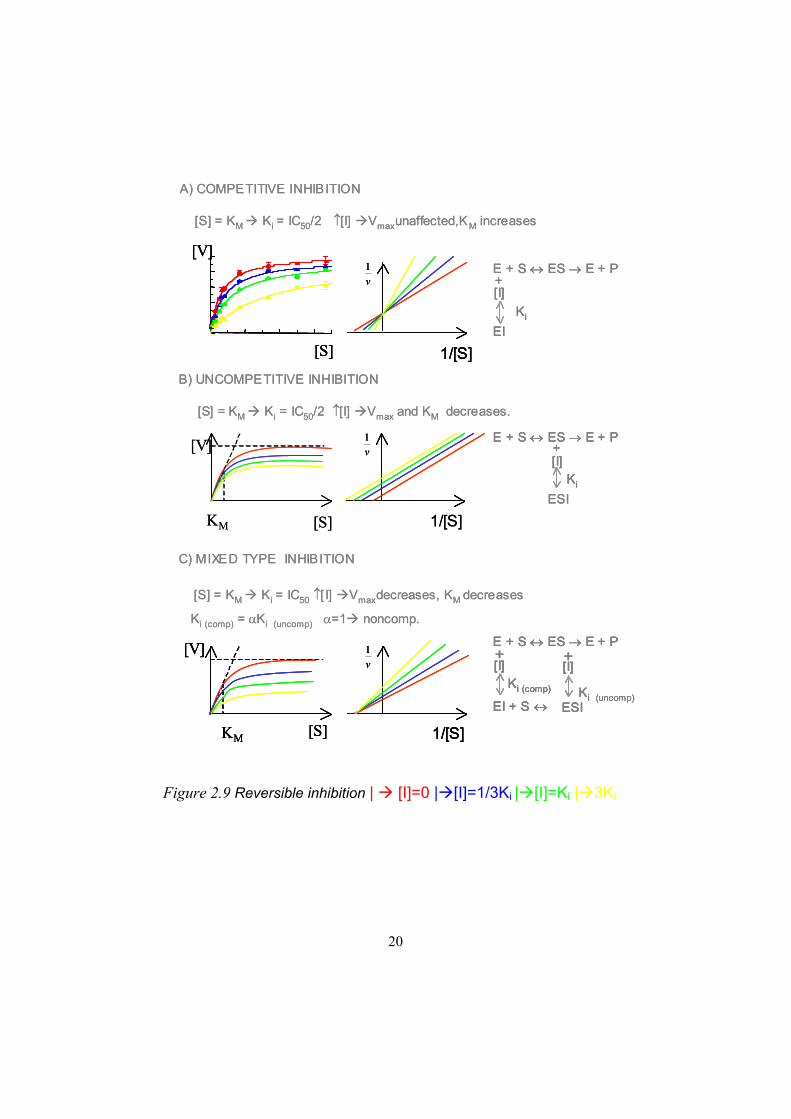
The reversible type of inhibition is more common (See Figure 2.9). When studying inhibition, the steady state approach was used, as described in the enzyme kinetics section. In the same way that the substrate concentration must be much higher than the enzyme concentration (so that enzyme-substrate binding does not become rate limiting), the inhibitor concentration should also be much higher to avoid that binding would appreciably alter the free inhibitor concentration. The inhibitory potential of a compound is measured by its effects on the metabolism of a marker substrate, e.g. the hydroxylation of diclofenac for CYP2C9. Since the substrate should by definition be present in excessive amounts during the experiment, the metabolite formation is measured. The IC50 value describes the concentration at which the inhibitor inhibits 50 % of the velocity at a certain substrate concentration. If the substrate concentration of the marker substrate is set to [S ] = KM (marker substrate) and competitive inhibition is assumed, the Ki value can be approximated from IC50/2. This type of initial screening was used to identify inhibitors and find an approximate Ki value. Deviations from the sigmoid curve give indications of atypical events.
To determine the type of inhibition, different inhibitor concentrations at changing substrate concentrations are compared to identify how they correlate to the inhibitor free control. The inhibitor concentrations used were chosen on the basis of the approximate Ki determined in the initial experiment, e.g. 1/3 Ki, Ki and 3Ki, to make a comparison with the control without inhibitor. The substrate concentrations were set on the basis of the KM of diclofenac (8 M).
2.8.3 Competitive inhibitionA competitive inhibitor (Figure 2.9a) competes with a substrate for the active site since the competitive inhibitor combines with the free enzyme so that the substrate is prevented from binding and reacting. A substrate can also be an inhibitor and vice versa. This is dependent on the affinity of the substrate in the marker reaction. If two substrates with different affinities are allowed to compete, the substrate with the highest affinity will inhibit the one with the lower affinity, as the equilibrium is shifted depending on the affinity. Recent crystallization results have shown that compounds that act as both competitive inhibitors and substrates can bind in alternative binding sites/modes in the active site distant from the heme where metabolism is not possible. This has led to the hypothesis of a possible inhibitory binding
19
mode. A competitive inhibitor should produce an increase in KM but no effect on Vmax..
2.8.4 Uncompetitive inhibitionAn uncompetitive inhibitor (Figure 2.9b) binds directly to the enzyme- substrate complex and yields an inactive enzyme-substrate-inhibitor complex. The inhibitor does not bind to the free enzyme. This is quite rare in unireactant reactions but more common in cases in which several substrates and inhibitors are present as in the case of product inhibition. In this case, the degree of inhibition depends on the substrate concentration and increases as the substrate concentration increases. This is because the uncompetitive inhibitors combine only with the ES complex, and this increases as the concentration of S increases. An uncompetitive inhibitor is recognised by a decrease in Vmax and KM as compared to the control.
20
Figure 2.9 Reversible inhibition | [I]=0 | [I]=1/3Ki | [I]=Ki | 3Ki
A) COMPETITIVE INHIBITION
[S] = KM Ki = IC50/2 [I] Vmaxunaffected,KM increases
[V]
[S] 1/[S]
v1 E + S ES E + P
+[I]
EIKi
C) MIXED TYPE INHIBITION
[S] = KM Ki = IC50 [ I] Vmaxdecreases, KM decreases
B) UNCOMPETITIVE INHIBITION
[S] = KM Ki = IC50/2 [I] Vmax and KM decreases.
[S]KM
[V]
1/[S]
v1
1/[S]
v1
[S]KM
[V]
ESI
E + S ES E + P+[I]
Ki
E + S ES E + P+[I]
EI + S
Ki (comp)
+[I]
ESIKi (uncomp)
Ki (comp) = Ki (uncomp) =1 noncomp.
A) COMPETITIVE INHIBITION
[S] = KM Ki = IC50/2 [I] Vmaxunaffected,KM increases
[V]
[S]
[V]
[S] 1/[S]
v1
1/[S]
v1 E + S ES E + P
+[I]
EIKi
E + S ES E + P+[I]
EIKi
C) MIXED TYPE INHIBITION
[S] = KM Ki = IC50 [ I] Vmaxdecreases, KM decreases
B) UNCOMPETITIVE INHIBITION
[S] = KM Ki = IC50/2 [I] Vmax and KM decreases.
[S]KM
[V]
1/[S]
v1v1
1/[S]
v1
1/[S]
v1
[S]KM
[V]
[S]KM
[V]
ESI
E + S ES E + P+[I]
Ki
ESI
E + S ES E + P+[I]
Ki
E + S ES E + P+[I]
EI + S
Ki (comp)
+[I]
ESIKi (uncomp)
E + S ES E + P+[I]
EI + S
Ki (comp)
+[I]
ESI
E + S ES E + P+[I]
EI + S
Ki (comp)
+[I]
ESIKi (uncomp)
Ki (comp) = Ki (uncomp) =1 noncomp.
21
2.8.5 Mixed inhibition and non-competitive inhibition Mixed inhibition (Figure 2.9c) is a mixture of competitive inhibition and uncompetitive inhibition. Non-competitive inhibition is a theoretical case in which the Ki (competitive) is equal to Ki (uncompetitive) , but this is not very likely to be found in vivo. This would give a decrease in Vmax but, in the equations, the KM values should be equal to each other and there should therefore be no change. In the real case, there will be a small difference, and this will cause both the Vmax and the KM to change. If the Ki (competitive) is very high, the case reduces to uncompetitive inhibition, if the Ki (uncompetitive) is very high, it will in the same way reduce to pure competitive inhibition.
2.8.6 ActivationIt is becoming clear that many CYP-catalyzed reactions do not follow typical Michaelis Menten kinetics. Instead, atypical kinetics owing to hetero activation and auto activation is increasingly common. CYP3A4 has been the model enzyme for such cooperativity (30-35), but CYP2C9 has also been shown to exhibit atypical kinetics (20,36). Dapsone, which is itself metabolised by CYP2C9, activates flurbiprofen, piroxicam and naproxen by increasing the Vmax and decreases the KM, which suggests a two site model describing activation. Recent crystallization studies of CYP2C9 indicate an active site that is large enough for such cooperativity(17).
2.9 Experimental systems to study CYP450 Metabolic stability, inhibition and induction can be studied in a number of different systems that can be classified according to whether or not the enzymes are still in their cellular environment. The enzyme-based systems include human liver microsomes (HLM) and recombinant enzymes (37) and the cell-based systems are hepatocytes(38) and liver slices (39).
2.9.1 Subcellular and heterologous systems – Human liver microsomes and recombinant enzyme
Human liver microsomes are prepared from human liver by separating the post mitochondrial supernatant through centrifugation, yielding fragments of the endoplasmic reticulum. The benefits of a system of this kind is that the same ratio of NADPH-cytochrome P450 reductase, cytochrome b5 and lipids is present in the microsomes as in the intact liver. It is a good system for the purpose of distinguishing the relative importance of different routes, but a drawback is that the in vitro conditions required to study different enzymes,
22
e.g. CYPs and UGTs, are different and hence not possible for evaluation of the additive results of a compounds sequential metabolism.
Recombinant enzymes are very useful for studying interactions with a specific enzyme, though they do not explain the relative isoform contribution. The recombinant DNA (cDNA) encoding either of the CYPs is transfected into host cells, such as bacteria, yeast, insect or mammalian cells, where each host has different benefits and drawbacks. Yeast was used throughout this work as an expression system with the human reductase gene co cloned and endoplasmic reticulum with which the expressed protein can associate. It is also easy to grow in large volumes. Recombinant enzymes are currently commercially available for all of the major CYPs.
2.9.2 Cell-based systems – Hepatocytes and liver slices The cell-based systems are the models that are closest to human liver, since the physiological conditions of enzymes and cofactors for both phase I and phase II reactions are present. At the same time, these are much more complex systems that often require fresh tissue or cryopreservation, and this can alter responses.
Cell-to-cell interactions are also maintained in the liver slices, although the activities in liver slices are generally lower. This may be because the drugs do not perfuse the liver slice completely and/or because of poor O2diffusion and necrotic cell death inside slices.
These cell-based systems enable studies of induction since the transcription mechanisms are maintained and protein expression continues and can be altered by adding an inducer.
2.10 In vitro – in vivo correlationsIn vitro experiments are done to make it possible to extrapolate the results for in vivo predictions. Michaelis-Menten enzyme kinetics give the relationship CLint= Vmax/KM, which is a measure of the intrinsic activity of the enzyme towards a drug. The clearance of the drug in the system is then dependent on the hepatic blood flow and the drug concentration at the site of metabolism. Several mathematical models have been developed to predict hepatic clearance in order to predict the metabolic clearance of a compound in vivo. One is the well-stirred model [Eq 2.3]. This assumes that there is an equal distribution of enzymes throughout the liver and that only the unbound fraction (fu) can cross through membranes and be metabolised.
23
)( int
int
ClfQClfQ
EQClu
uh
[Eq 2.3]
Q is the hepatic blood flow (20 mL/min/kg) and E is the hepatic extraction ratio and is used as a measure to describe the extent of metabolism. If E> 0.9, the drug is classified as a high clearance compound, where the clearance is limited by the blood flow. As the blood flow is the limiting factor, inhibition will have only a small influence of CLh while if E< 0.5, a low clearance compound, the metabolism is directly related to the unbound fraction and to the CLint. For low clearance compounds, altered metabolism therefore exerts a greater influence on clearance.
2.11 Important families of the CYP family The main cytochromes relevant for drug metabolism are CYP3A4, CYP2D6, CYP2C9, CYP2C19, CYP1A2, CYP2E1 and CYP2B6, which metabolise 34%, 19%, 16%, 8%, 8%, 4% and 3% of current therapeutics, respectively(40). The importance is not related to the abundance of the enzyme in the liver, as shown in the corresponding figures of 30%, 2% and 20 %, respectively, for CYP3A4, CYP2D6 and CYP2C9.
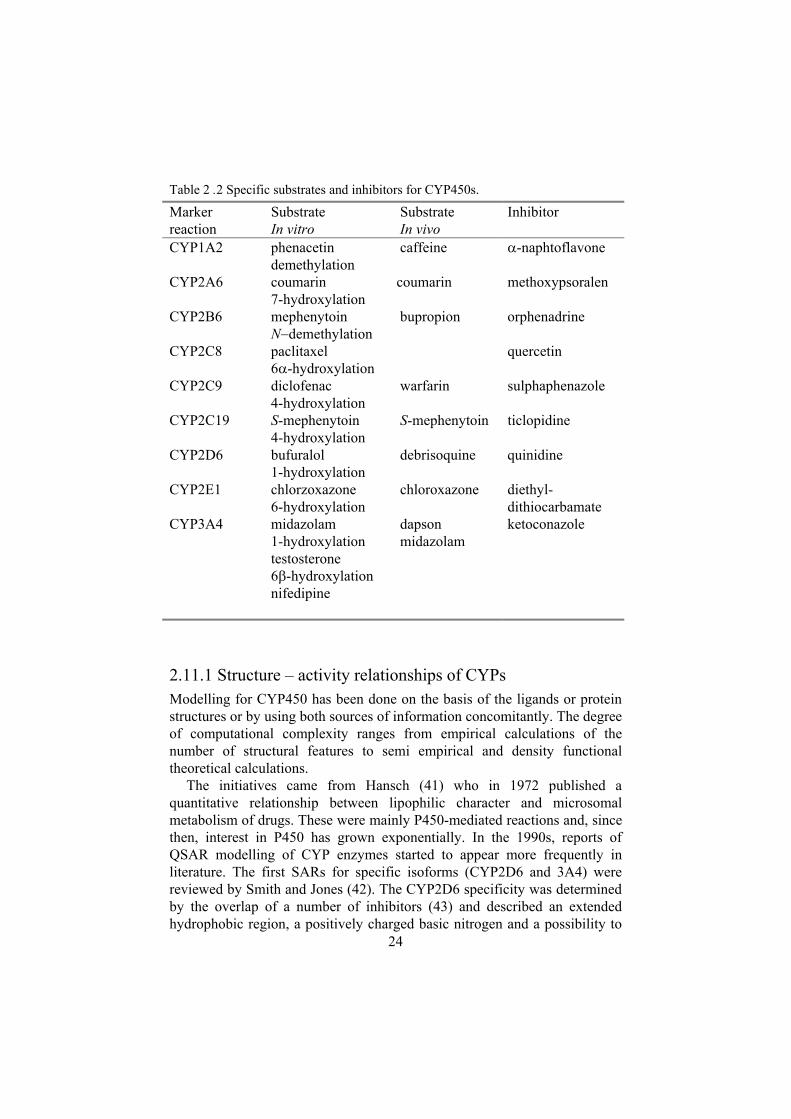
The major site for biotransformation is the liver, but the intestinal mucosa also contribute significantly, mainly via CYP3A metabolism. Other extra hepatic sites include the kidney, lungs, skin, brain and nasal epithelium. Though the different CYPs exhibit some preferences for certain chemical structures, these enzymes have broad and overlapping substrate specificity. See table 2.2 for marker reactions in vitro and in vivo.
24
Table 2 .2 Specific substrates and inhibitors for CYP450s.
Markerreaction
SubstrateIn vitro
SubstrateIn vivo
Inhibitor
CYP1A2 phenacetin demethylation
caffeine -naphtoflavone
CYP2A6 coumarin 7-hydroxylation
coumarin methoxypsoralen
CYP2B6 mephenytoin N demethylation
bupropion orphenadrine
CYP2C8 paclitaxel 6 -hydroxylation
quercetin
CYP2C9 diclofenac 4-hydroxylation
warfarin sulphaphenazole
CYP2C19 S-mephenytoin 4-hydroxylation
S-mephenytoin ticlopidine
CYP2D6 bufuralol 1-hydroxylation
debrisoquine quinidine
CYP2E1 chlorzoxazone 6-hydroxylation
chloroxazone diethyl-dithiocarbamate
CYP3A4 midazolam 1-hydroxylation testosterone6 -hydroxylation nifedipine
dapsonmidazolam
ketoconazole
2.11.1 Structure – activity relationships of CYPs Modelling for CYP450 has been done on the basis of the ligands or protein structures or by using both sources of information concomitantly. The degree of computational complexity ranges from empirical calculations of the number of structural features to semi empirical and density functional theoretical calculations.
The initiatives came from Hansch (41) who in 1972 published a quantitative relationship between lipophilic character and microsomal metabolism of drugs. These were mainly P450-mediated reactions and, since then, interest in P450 has grown exponentially. In the 1990s, reports of QSAR modelling of CYP enzymes started to appear more frequently in literature. The first SARs for specific isoforms (CYP2D6 and 3A4) were reviewed by Smith and Jones (42). The CYP2D6 specificity was determined by the overlap of a number of inhibitors (43) and described an extended hydrophobic region, a positively charged basic nitrogen and a possibility to
25
accept hydrogen bonds positioned 5 – 7 Å from the nitrogen atom. The same review describes the absence of a structural relationship for CYP3A4. Instead the correlation to lipophilicity is mentioned. The ideas that were put forth by Hansch, Smith and Jones are still valid, even though the amount and quality of information available has increased exponentially. Main efforts have involved homology modelling for the different isoforms and substrate and inhibitor QSAR and pharmacophore modelling. Lately, inducers (44)and activators (45,46) have been studied using molecular modelling techniques. Some of the main authors who have published extensively in all of these fields are D.F.V.Lewis(47-54), Sean Ekins, Marcel J de Groot and Jeffrey P Jones(55-60). In addition, there are a number of isoform-specific original modelling articles(46,60-85).
26
3 Computational chemistry and molecular modelling
A model is “a simplified or idealised description of a system or process, often in mathematical terms, devised to facilitate calculations and predictions” (Oxford English Dictionary). In theoretical chemistry, systems of chemical relevance are described in mathematical terms by fundamental laws of physics. The only systems that can be solved exactly are those composed of one or two particles; models must be developed for all other systems.
In computational chemistry, the computer is often used more as an experimental tool, where the focus is set on obtaining results relevant to chemical problems. The main issues include selection of a reasonable level of theory to establish the most appropriate model of a problem and to be able to evaluate the quality of the models. Molecular modelling comprises the application of computational chemistry methods to give insight into the behaviour of molecular systems. The molecular system is often described by a force field that can correlate the nuclear coordinates of the system to an energy profile that can be used for comparisons. The following chapter describes some fundamental concepts in computational chemistry. More extensive information can be obtained in the following references. (86-88)
3.1 Energy calculations One of the most important techniques in computational chemistry is the ability to make energy calculations. The intention is to quantify the intra- and intermolecular interactions of the molecules and to reflect that as the free energy, G. One should keep in mind that the algorithms are based on approximations that will affect their accuracy. Energies in systems are calculated mainly through quantum mechanics or molecular mechanics. In quantum mechanics, both the position of the nuclei and the electrons are taken into account, in contrast to molecular mechanics calculations, where the electrons are not explicitly considered and the energy of the system is a function only of the nuclear positions.
Molecular mechanics is conceptually easier to understand than quantum mechanics since it is based on classical mechanics. The energies are
27
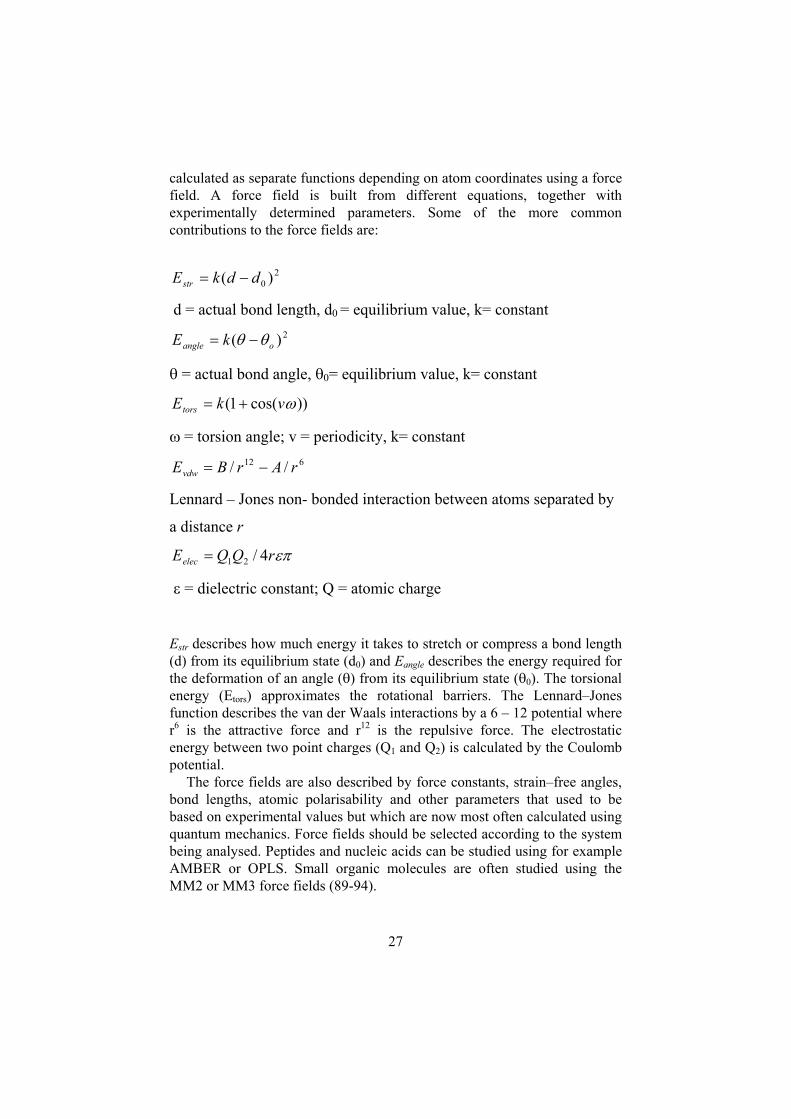
calculated as separate functions depending on atom coordinates using a force field. A force field is built from different equations, together with experimentally determined parameters. Some of the more common contributions to the force fields are:
20 )( ddkEstr
d = actual bond length, d0 = equilibrium value, k= constant2)( oangle kE
= actual bond angle, 0= equilibrium value, k= constant
))cos(1( vkEtors
= torsion angle; v = periodicity, k= constant 612 // rArBEvdw
Lennard – Jones non- bonded interaction between atoms separated by
a distance r
rQQEelec 4/21
= dielectric constant; Q = atomic charge
Estr describes how much energy it takes to stretch or compress a bond length (d) from its equilibrium state (d0) and Eangle describes the energy required for the deformation of an angle ( ) from its equilibrium state ( 0). The torsional energy (Etors) approximates the rotational barriers. The Lennard–Jones function describes the van der Waals interactions by a 6 – 12 potential where r6 is the attractive force and r12 is the repulsive force. The electrostatic energy between two point charges (Q1 and Q2) is calculated by the Coulomb potential.
The force fields are also described by force constants, strain–free angles, bond lengths, atomic polarisability and other parameters that used to be based on experimental values but which are now most often calculated using quantum mechanics. Force fields should be selected according to the system being analysed. Peptides and nucleic acids can be studied using for example AMBER or OPLS. Small organic molecules are often studied using the MM2 or MM3 force fields (89-94).
28
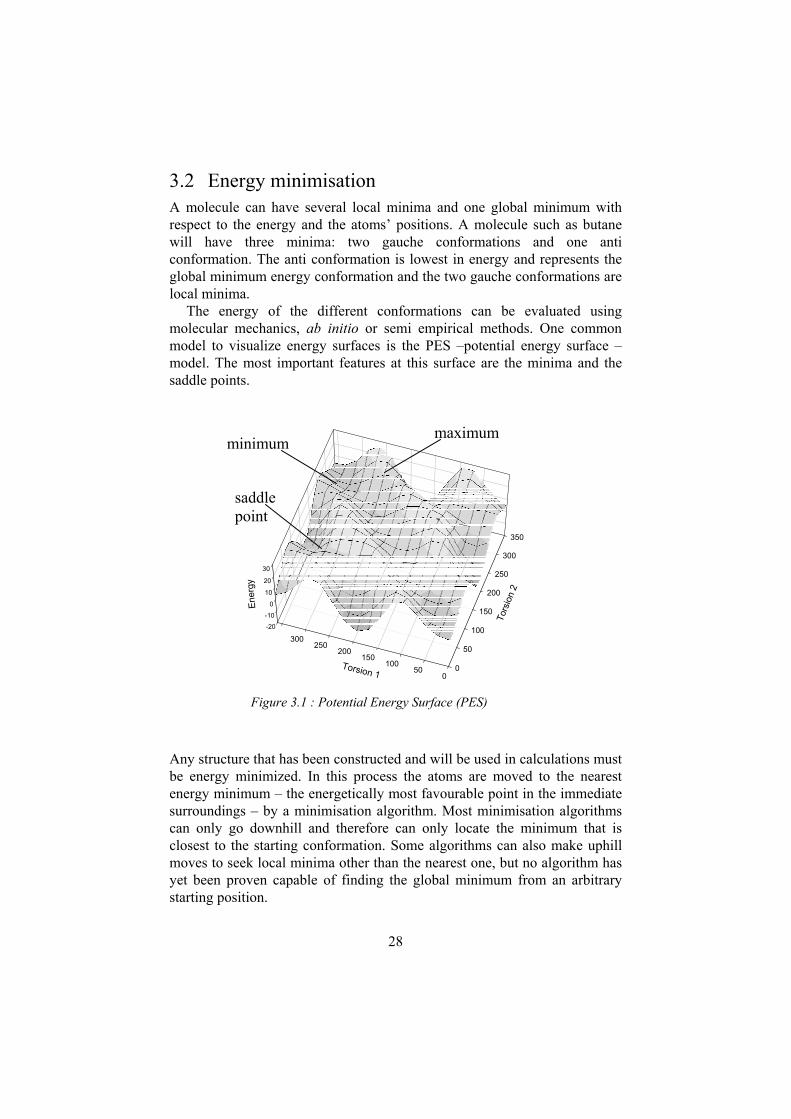
3.2 Energy minimisation A molecule can have several local minima and one global minimum with respect to the energy and the atoms’ positions. A molecule such as butane will have three minima: two gauche conformations and one anti conformation. The anti conformation is lowest in energy and represents the global minimum energy conformation and the two gauche conformations are local minima.
The energy of the different conformations can be evaluated using molecular mechanics, ab initio or semi empirical methods. One common model to visualize energy surfaces is the PES –potential energy surface –model. The most important features at this surface are the minima and the saddle points.
Any structure that has been constructed and will be used in calculations must be energy minimized. In this process the atoms are moved to the nearest energy minimum – the energetically most favourable point in the immediate surroundings – by a minimisation algorithm. Most minimisation algorithms can only go downhill and therefore can only locate the minimum that is closest to the starting conformation. Some algorithms can also make uphill moves to seek local minima other than the nearest one, but no algorithm has yet been proven capable of finding the global minimum from an arbitrary starting position.
-20
-10
0
10
20
30
0
50
100
150
200
250
300
350
050
100150
200250
300
Ener
gy
Tors
ion
2
Torsion 1
minimum maximum
saddlepoint
Figure 3.1 : Potential Energy Surface (PES)
29
3.2.1 Conformation analysis Conformational analysis aims at analysing the different conformational states available to a molecule and determining the most stable or the most populated conformation. Minima and saddle points can be defined from potential energy surface models. The saddle point is the conformation that gives the most favourable transfer between two minima (See Figure 3.1).Using different force fields to calculate the energy also gives rise to different potential surfaces with different minima. Several different conformational search techniques can be applied, which include systematic search methods, Monte Carlo approaches and molecular dynamics. Exhaustive quantum chemistry methods can be used for small systems but molecular mechanics are used for the energy calculations in the majority of cases. Another factor that affects conformational analysis is the environment in which the computation is made. Conformational analysis is often done in vacuum, but using explicit water or a water solvation model usually gives a better description of the true environment (95).
3.2.1.1 Systematic search Systematic search is an exhaustive conformational search method. Each rotatable bond is defined and systematically rotated through 360 using a fixed increment. If the increment is 10 , the number of conformers that will be generated is (360 /10 = 36) n where n is the number of rotatable bonds. Sulphaphenazole has three torsional bonds, which would theoretically give rise to 363 (= 46 656) different conformers. However, by eliminating structures that violate certain predefined criteria, a reduction in the computational complexity can be achieved.
3.2.1.2 Monte Carlo search Molecules that have many rotatable bonds can be examined using random search techniques. These techniques can never guarantee that the conformational space is sampled exhaustively, as it is in a systematic search. The typical scenario is that many conformers are found at the beginning of the search but, as the search proceeds, the number of new conformers per time unit decreases rapidly. This is not the case in the systematic search, which is equally efficient throughout. The Monte Carlo random search finishes its search for new conformers when the program no longer finds any new conformers or the same conformer has been identified a predefined number of times.
3.2.1.3 Molecular dynamicsIn molecular dynamics simulations, energy is added to a system as kinetic energy related to the temperature of the system. Under these conditions molecules can overcome conformational barriers. This method, based on
30
molecular mechanics, results in a trajectory that specifies how the positions and velocities of the particles in the system vary over time. Snapshots are taken at specified intervals and energy is minimised to sample the conformational space over time. The trajectory is obtained by solving differential equations embodied in Newton’s law of motion (F= ma). These calculations can be made in vacuum or in solution under periodic boundary conditions and they are suitable for exploring the dynamics of proteins and other large systems, as described in Paper V. It requires considerable computer time, however, and there is no statistical or geometrical means to determine completeness.
3.3 Ligand-based modellingLigand-based modelling refers to modelling the biological activity without considering the 3D structure of the receptor and possible sites of interaction. Instead the analysis is based on a set of compounds that are known to interact with a receptor by the same mechanism. Several techniques can be used to make this analysis.
3.3.1 Pharmacophore modelling A pharmacophore corresponds to those features common to a set of compounds, acting at the same receptor/enzyme, which are responsible for recognition and activation.
Common pharmacophoric features are hydrogen bonding sites and hydrophobic regions. Atoms that can behave as hydrogen bond acceptors are, for example, carbonyl oxygens. Donors could be hydroxyl or amide NH groups. One fundamental assumption in drug design is that similar molecules can be expected to exhibit similar biological activity. Substituents or groups that produce broadly similar biological properties and facilitate the same interactions are called bioisosteric groups. Such groups are therefore often interchangeable in drug design, and they are used to maintain receptor interactions but to change other properties thus enabling a more straightforward synthesis or avoiding toxic metabolites.
Pharmacophore modelling can be done using the active analog approach, which states that one specific conformer for each active compound can bind to the active site in a similar way and give rise to activity. Studies have shown that the active conformer is in most cases not the energy minimum conformer and thus most ligands are conformationally modified so that they will bind to the enzyme (96). The reason is purely energetic; the cost of conformational modification is often < 3 kcal and the gain in energy based on favourable hydrophobic interactions, steric receptor complementarities and hydrogen bonding will return more to the system. Different programs
31
can be used for pharmacophore derivation, including DISCO (97), GASP(98) and CATALYST(99).
3.3.2 QSAR modelling The basis for SARs (structure activity relationships) is to guide synthesis by analysis of the effect of different substituents to a common core structure. The SAR concept can be extended by correlating the structural changes to quantifiable properties – QSAR (quantitative structure activity relationship). The most widely used technique is linear regression, where the y variable is the dependent variable and the x variables are the independent variables. The general regression formula for a single independent variable (y = kx +m) is then used to derive values for the coefficient, k, and the constant, m. If there is more than one independent variable the method is referred to as multiple linear regression, which requires more complex equations.
Inevitably, many of the descriptors are correlated by nature, since groups of chemical variables influence the biological behaviour. Historically, Hansch introduced the first use of QSAR to explain the biological activity of a series of structurally related molecules (100). In his pioneer work he described the correlation of the molecule’s electronic characteristics and hydrophobic properties to the biological activity for phenoxyacetic acids via equations of the following form:
321 log)/1log( kkPkC
The correlation between metabolism and lipophilicity was demonstrated early by (41) Hansch. Recently, a baseline lipophilicity relationship was demonstrated for over 70 substrates of eight metabolising enzymes from families CYP1, CYP2 and CYP3 (48). The general form of the equation was:
bGaG partbind
The slope, a, can be considered the hydrophobicity factor of the active site and the intercept, b, the sum of non-hydrophobic interactions between enzyme and substrate. The free energy of binding can be derived from :
mbind KRTG ln
where KM is the Michaelis Menten constant for substrate binding. The Gpartis the partitioning between n-octanol and water based on
PRTGpart ln
32
These equations can be used to estimate the probable hydrophobic character of the individual human P450 active sites. It was suggested as well that these types of correlations could also explain outliers by additional binding interactions, usually hydrogen bonds.
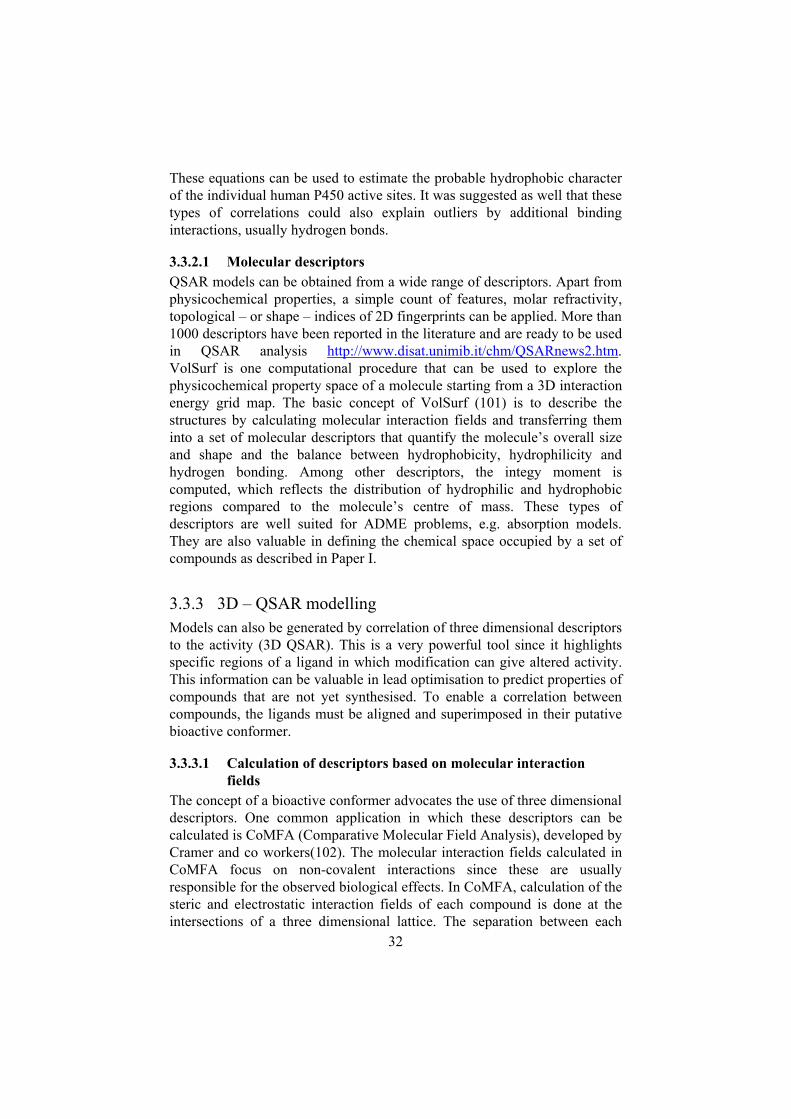
3.3.2.1 Molecular descriptors QSAR models can be obtained from a wide range of descriptors. Apart from physicochemical properties, a simple count of features, molar refractivity, topological – or shape – indices of 2D fingerprints can be applied. More than 1000 descriptors have been reported in the literature and are ready to be used in QSAR analysis http://www.disat.unimib.it/chm/QSARnews2.htm.VolSurf is one computational procedure that can be used to explore the physicochemical property space of a molecule starting from a 3D interaction energy grid map. The basic concept of VolSurf (101) is to describe the structures by calculating molecular interaction fields and transferring them into a set of molecular descriptors that quantify the molecule’s overall size and shape and the balance between hydrophobicity, hydrophilicity and hydrogen bonding. Among other descriptors, the integy moment is computed, which reflects the distribution of hydrophilic and hydrophobic regions compared to the molecule’s centre of mass. These types of descriptors are well suited for ADME problems, e.g. absorption models. They are also valuable in defining the chemical space occupied by a set of compounds as described in Paper I.
3.3.3 3D – QSAR modelling Models can also be generated by correlation of three dimensional descriptors to the activity (3D QSAR). This is a very powerful tool since it highlights specific regions of a ligand in which modification can give altered activity. This information can be valuable in lead optimisation to predict properties of compounds that are not yet synthesised. To enable a correlation between compounds, the ligands must be aligned and superimposed in their putative bioactive conformer.
3.3.3.1 Calculation of descriptors based on molecular interaction fields
The concept of a bioactive conformer advocates the use of three dimensional descriptors. One common application in which these descriptors can be calculated is CoMFA (Comparative Molecular Field Analysis), developed by Cramer and co workers(102). The molecular interaction fields calculated in CoMFA focus on non-covalent interactions since these are usually responsible for the observed biological effects. In CoMFA, calculation of the steric and electrostatic interaction fields of each compound is done at the intersections of a three dimensional lattice. The separation between each
33
point in the lattice is 2 Å. The default probe used in CoMFA has the van deer Waals properties of an sp3 carbon and a charge of +1.0. Since the data matrix consists of more descriptors per observation than the number of observations and since the variables are dependent on each other, the data are no longer suitable for linear regression models. This type of data matrix therefore requires multivariate statistical analysis, such as PCA and PLS (see 3.5).
The CoMFA method has been followed by the development of the multivariate analysis tool GOLPE (Generating Optimal Linear PLS Estimations) (103) (see 3.5.1.3 GOLPE) which employs the GRID force field to calculate the molecular interaction fields (104). In GRID the probe can be chosen from many different probe molecules, e.g. water, methyl, amine nitrogen, carboxylic oxygens and hydroxyl groups that are allowed to interact with the molecule, which is called the target. Compared to CoMFA, GRID offers a more dynamic approach toward calculating the molecular interaction fields. It supplies the user with many more choices than just the steric and electrostatic fields available in CoMFA. GRID was thus used throughout this work, and the statistical analysis was made in GOLPE.
3.3.3.1.1 GRIDIn GRID the molecule is positioned in a grid box. The probe interaction energies are calculated at all grid lattice intersections, the grid points, throughout the xyz space, starting with the first energy, Exyz, at the first point of the first XY plane of the grid. Positions far away from the molecule will generate small energies while positions intersecting the molecules will give large positive interactions because of strong repulsion forces. These positive energy levels normally define the surface of the target. Modest negative energies correspond to points in the interatomic space that give favourable interactions between the probe and the molecule. The energy values define the contours of the interaction fields and can be visualised for each probe alone.
The interaction energy is calculated as follows (105):
SEEEE hbelljxyz
ljE Energy of the Lennard -Jones function
elE Energy of the electrostatic interactions
hbE Energy of hydrogen bonding
S Entropic term (associated with the hydrophobic probe)
34
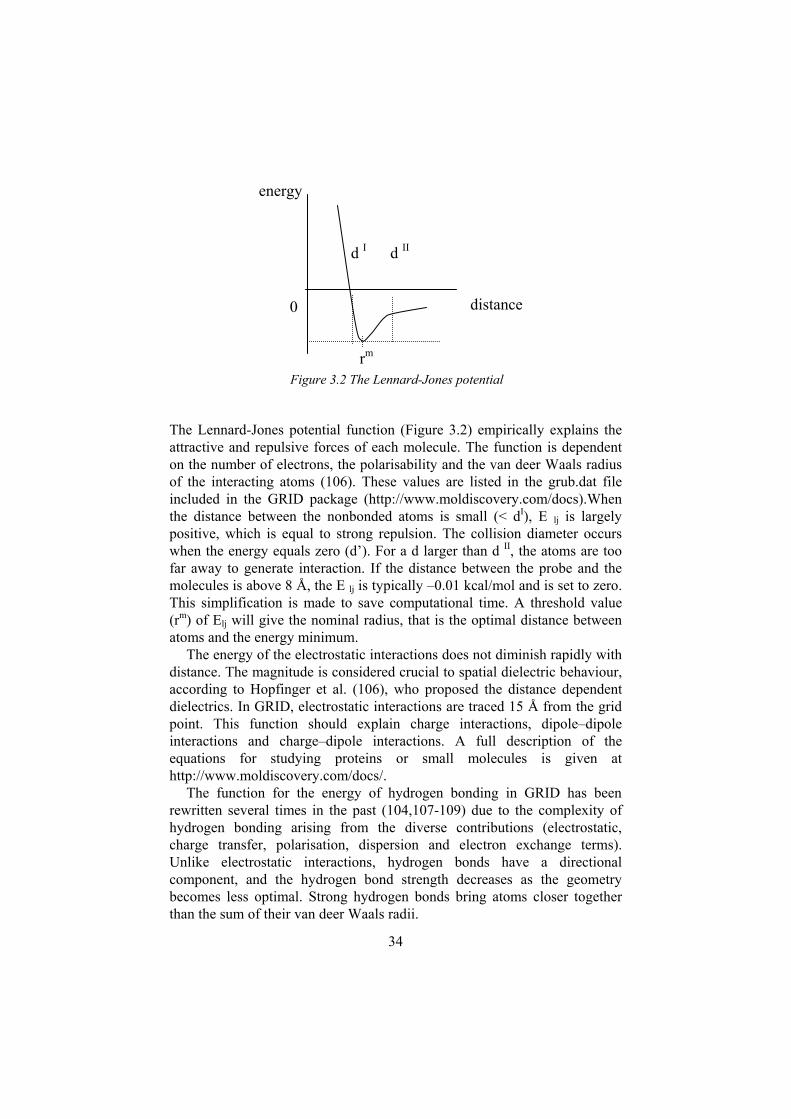
The Lennard-Jones potential function (Figure 3.2) empirically explains the attractive and repulsive forces of each molecule. The function is dependent on the number of electrons, the polarisability and the van deer Waals radius of the interacting atoms (106). These values are listed in the grub.dat file included in the GRID package (http://www.moldiscovery.com/docs).When the distance between the nonbonded atoms is small (< dI), E lj is largely positive, which is equal to strong repulsion. The collision diameter occurs when the energy equals zero (d’). For a d larger than d II, the atoms are too far away to generate interaction. If the distance between the probe and the molecules is above 8 Å, the E lj is typically –0.01 kcal/mol and is set to zero. This simplification is made to save computational time. A threshold value (rm) of Elj will give the nominal radius, that is the optimal distance between atoms and the energy minimum.
The energy of the electrostatic interactions does not diminish rapidly with distance. The magnitude is considered crucial to spatial dielectric behaviour, according to Hopfinger et al. (106), who proposed the distance dependent dielectrics. In GRID, electrostatic interactions are traced 15 Å from the grid point. This function should explain charge interactions, dipole–dipole interactions and charge–dipole interactions. A full description of the equations for studying proteins or small molecules is given at http://www.moldiscovery.com/docs/.
The function for the energy of hydrogen bonding in GRID has been rewritten several times in the past (104,107-109) due to the complexity of hydrogen bonding arising from the diverse contributions (electrostatic, charge transfer, polarisation, dispersion and electron exchange terms). Unlike electrostatic interactions, hydrogen bonds have a directional component, and the hydrogen bond strength decreases as the geometry becomes less optimal. Strong hydrogen bonds bring atoms closer together than the sum of their van deer Waals radii.
0 distance
energy
d I d II
Figure 3.2 The Lennard-Jones potentialrm
35
These non-bonded interaction forces, the Lennard-Jones interactions, the electrostatic interactions and the hydrogen bonding, are supplemented by an entropic term (S) when hydrophobic interactions or conformational flexible targets are studied.
The overall energy for the hydrophobic probe is computed at each grid point as:
Exyz= WENT + ELJ – EHB
WENT stands for WaterENTropy and describes the ideal entropic contribution from ordered water molecules. The computed energy reflects the disorder that occurs when hydrogen bonds disturb the arrangement of ordered water molecules (EHB) and the order when hydrogen bonds are broken as a consequence of hydrophobic areas (ELJ) coming together.
For conformationally flexible targets (see 3.4.3.1.2 Flexible grid), the entropy loss is compared to the gain for different geometrical arrangements between the probe and the target to find the most favourable position for interaction.
3.3.3.1.2 Flexible GRID Earlier versions of GRID took into account tautomeric hydrogens, such as those in the imidazole ring of histidine, and the torsional rotation of aliphatic or phenolic hydroxyl or amino hydrogens [10], but the heavy atoms of the target were kept rigid throughout the calculations. The possibility to study conformationally flexible targets was developed to explore the conformational freedom of the terminal groups of certain amino acids in proteins. The resolution of x-ray crystals cannot usually reveal the atomic positions, and arbitrary conformations are chosen. In Paper IV we applied the flexibility algorithm to small ligands.
By treating the ligands as flexible targets, it is not necessary to make assumptions or select a bioactive conformer. Instead, the conformational space available to the compound is explored. The flexible option allows both the probe and the target to respond to the environmental changes that occur upon moving the probe between the different grid points. For each grid point the energetically most optimal interaction of the flexible side chain is calculated on the basis of 1) the interactions with the probe and 2) the entropic contribution due to the geometrical rearrangement of the side chain. The strength of the interactions with the probe is evaluated for electrostatic, van der Waals and hydrogen bond interactions after taking into account entropic effects. The resulting map for each probe will describe the most energetically favourable possibilities that a certain ligand has when allowed
36
to adjust to the active site of a protein. The methodology aims to mimic the adjustments and binding to a receptor.
The molecules were automatically assigned flexibility using the GRIN directive MOVE=1 [11]. Three different possibilities are considered for each atom: 1) assignment to the rigid “core” of the ligand, 2) assignment to a “bead” (which is also rigid but is smaller in size than the core or 3) total flexibility. The core does not change its position in space during the calculations, and each target can only have one core. A bead is rigid relative to all heavy atoms within the same bead but is allowed to change its position and orientation towards the core in order to obtain the most optimal arrangement, subject to any constraints on its movements imposed by the length and flexibility of the flexible chains. There can be many beads in each target. The flexible atoms are allowed to move during the calculations and will be positioned in the most energetically favourable position of those being evaluated.
The procedure for the algorithm by which the program assigns flexibility starts with recognising the entire system as the core and can, very simply, be described as follows. (1) Certain atoms (mainly hydrogens) and water molecules are eliminated from the pdb file . (2) For each remaining atom, the number of neighbouring atoms within a sphere of 4Å is identified, and, if the number exceeds 12, the atom is assigned to the core structure. At this stage, flexible parts of very compact conformations could be wrongly assigned to the core and extended structures should therefore be used as starting conformations. (3) If more than one part of the molecule fulfils the requirements for being a core, then the largest of these parts is assigned as “The Core” and the other(s) are assigned as “Beads”. (4) An initial GRID run is automatically made on each bead before the main computation for the chosen probe begins, considering the bead as a separate target. The findings are used to establish the most favourable interactions between the probe and the bead, and that bead will then move throughout the main grid run so that it is always oriented in the most favourable way with regard to the probe. (5) Finally, atoms outside the core/bead or between the core and beads are assigned as flexible. When the GRID probe interacts with a flexible atom or bead, it starts by determining whether it will be repelled or attracted. If repelled, the atom or bead is moved away to the least unfavourable position, always taking into account the fact that it is bonded (directly or through a chain of flexible atoms and beads) to the rigid core. If it is attracted, the atom or bead will move as close as possible to the probe with regard to its bonding and the van der Waals radii.
3.3.3.2 ALMOND – 3D descriptors transformed to 2D correlograms As described previously, to obtain a successful 3D QSAR, the molecules must be 1) analysed in their bioactive conformer, 2) with the correct alignment in space. In the absence of co crystallized complexes, a user bias
37
will be introduced. To reduce the number of assumptions, alignment independence is desirable. There are several examples of alignment-free descriptors but they have never reached general applicability (110-112). This could be due to problems associated with transforming descriptors back to the 3D space to facilitate interpretation and aid in the design of novel compounds. A new methodology was therefore developed by Pastor et al. (113) that had the ability to transform GRID molecular interaction fields into correlograms that describe interactions available to these compounds as 2D graphs. Each of the descriptors can be transformed back to its 3D coordinates. These ALMOND descriptors are derived by calculating all distances between all grid points. The scaled energy products are calculated for each distance based on the interaction energy for each grid. The distances are sorted into bins based on their length, but only the distance corresponding to the lowest energy product for each bin is kept. The most favourable distance for each of the bins is plotted in a graph of energy over distance - a correlogram. These descriptors are then used to correlate the biological activity using different multivariate statistical methods such as PCA and PLS (see 3.6.1 Statistical methods for multivariate analysis) without any need of first performing an alignment (See paper IV).
3.4 Structure-based modellingThe aim of structure-based modelling is to understand the environment into which the ligand is presented and how the enzyme interacts with the ligand. If this relationship is understood, structure-based design can be applied to alter or disable the ligand–enzyme complementarities and to avoid recognition and thereby interference with e.g. the CYP. This example differs from the more common scenario when complementarity to the receptor is the aim in order to achieve a pharmacological effect. In order to approximate the possible interactions, different programs and techniques are applied.
3.4.1 Homology modelling The most favourable situation in structure-based design comprises the access to multiple crystal structures of the target being studied, with and without ligands being bound to it. In the case of CYPs, crystal structures are starting to emerge but the generation is still on an experimentally very demanding level.
To be able to describe systems in which no crystal information is available, homology models can be built. The general procedure for homology modelling is: 1) search for crystal templates of high similarity and high evolutionary relationship with regard to secondary structure and three dimensional correspondence; 2) align the sequence of the desired protein to
38
the crystal structure sequence; 3) build homology models using a comparative modelling software; 4) evaluate the models on the basis of stereochemistry parameters for backbone angles etc.
In general, the models should be based on templates with as high sequence similarity and conserved secondary structure as possible. Templates with 30 % sequence similarity have been named as a lower limit for reasonable accuracy in the final model. It is generally accepted that the higher the sequence identity between the template and the target, the better will the model turn out.
3.4.1.1 MODELLER The software that we have used to build the homology models in Paper V is MODELLER(114). This program does 3D comparative modelling based on sequence alignment of templates to target sequences. The alignment can be done outside MODELLER in programs such as ClustalX(115) which facilitates two dimensional alignment based on amino acid sequence similarity. A module called MALIGN in the MODELLER program generates an alignment based on 3D superimposition of multiple crystal templates. This alignment is then used as a profile in programs such as ClustalX, and the target sequence is aligned to it. The alignment must be checked carefully, especially in cases where much freedom is allowed during the alignment, to avoid gaps in secondary structure elements. When the alignment is satisfactory, it is used for modelling in MODELLER. The algorithm is based on extracting and retaining spatial restraints such as distances between atoms and dihedral angles. In addition to the information obtained from the template, more information is available from libraries so that regions with gaps can also be modelled and non amino acid residues such as the heme group can be recognised and considered during the modelling step.
3.4.2 Docking The general idea of a docking program is to position the ligand in possible binding modes in the protein active site and to calculate a score for the protein–ligand complex. In general the docking conditions must be optimised for each individual target to achieve as precise results as possible. Also, depending on the environment of the active sites, different programs will perform differently and generate different solutions binding modes.
In most cases, the program has a function that aims to relate the solutions to the binding affinity by making an estimate of the change in free energy upon binding.
39
3.4.2.1 GOLD The GOLD docking program (116) has been used in the docking studies for the conformer selection described in Paper I. This is a program based on a genetic algorithm that starts from a number of potential solutions called the population. These solutions are evaluated on the basis of a fitness function that returns a ranking. Each member of the population is encoded as a chromosome. The chromosomes are randomly mutated or crossed and then evaluated again. Crossover starts from two parent chromosomes. At a certain point the chromosomes are cut and exchanged for the corresponding part in the other chromosome. The mutated / crossed solutions are thereafter evaluated and, if the ranking is improved, the solution is kept and will be the starting point for the next mutation. Otherwise the previous chromosome is mutated again. The scoring function consists of a hydrophobic term and a hydrogen–bonding term for the protein-ligand interaction and an internal term that describes steric clashes and torsional energies. The ligand is considered to be flexible during the docking but the protein active site is kept rigid, except for hydrogen atoms of polar amino acids, which are flexible.
3.5 Statistical methods 3.5.1 Statistical methods for multivariate analysis Data matrices for QSAR analysis often consist of more descriptors per observation than the number of observations and the variables are dependent on each other. This type of data is no longer suitable for linear regression models, where dependent data must be as orthogonal as possible. Multivariate data analysis must instead be applied. Multivariate analysis can handle missing and erroneous data, it can take care of the dimensionality problem and multicollinearity, and it enables the separation of signal to noise by different methods of variable selection. Two of the most important MVA techniques include the PCA, Principal Component Analysis, and the PLS, Partial Least Square, analysis. The science of these techniques is called chemometrics and provides a number of methods for obtaining good insight into data sets and extracting the most relevant information.
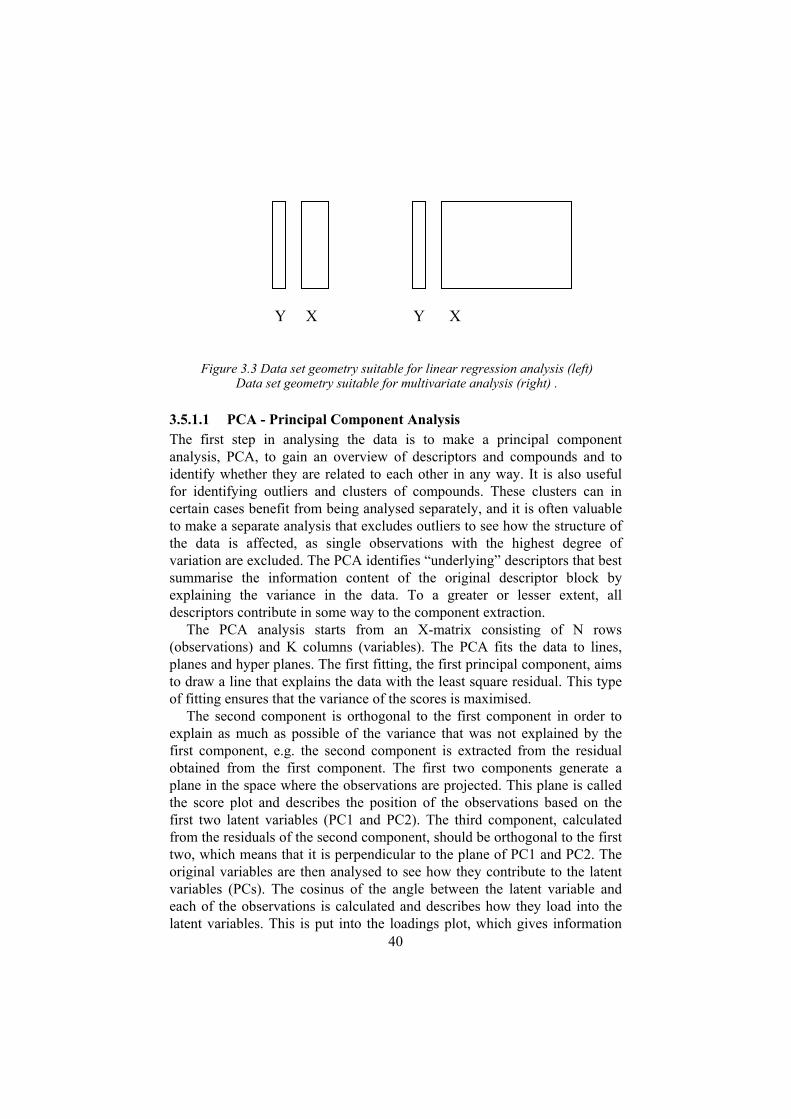
40
3.5.1.1 PCA - Principal Component Analysis The first step in analysing the data is to make a principal component analysis, PCA, to gain an overview of descriptors and compounds and to identify whether they are related to each other in any way. It is also useful for identifying outliers and clusters of compounds. These clusters can in certain cases benefit from being analysed separately, and it is often valuable to make a separate analysis that excludes outliers to see how the structure of the data is affected, as single observations with the highest degree of variation are excluded. The PCA identifies “underlying” descriptors that best summarise the information content of the original descriptor block by explaining the variance in the data. To a greater or lesser extent, all descriptors contribute in some way to the component extraction.
The PCA analysis starts from an X-matrix consisting of N rows (observations) and K columns (variables). The PCA fits the data to lines, planes and hyper planes. The first fitting, the first principal component, aims to draw a line that explains the data with the least square residual. This type of fitting ensures that the variance of the scores is maximised.
The second component is orthogonal to the first component in order to explain as much as possible of the variance that was not explained by the first component, e.g. the second component is extracted from the residual obtained from the first component. The first two components generate a plane in the space where the observations are projected. This plane is called the score plot and describes the position of the observations based on the first two latent variables (PC1 and PC2). The third component, calculated from the residuals of the second component, should be orthogonal to the first two, which means that it is perpendicular to the plane of PC1 and PC2. The original variables are then analysed to see how they contribute to the latent variables (PCs). The cosinus of the angle between the latent variable and each of the observations is calculated and describes how they load into the latent variables. This is put into the loadings plot, which gives information
Y YX X
Figure 3.3 Data set geometry suitable for linear regression analysis (left) Data set geometry suitable for multivariate analysis (right) .
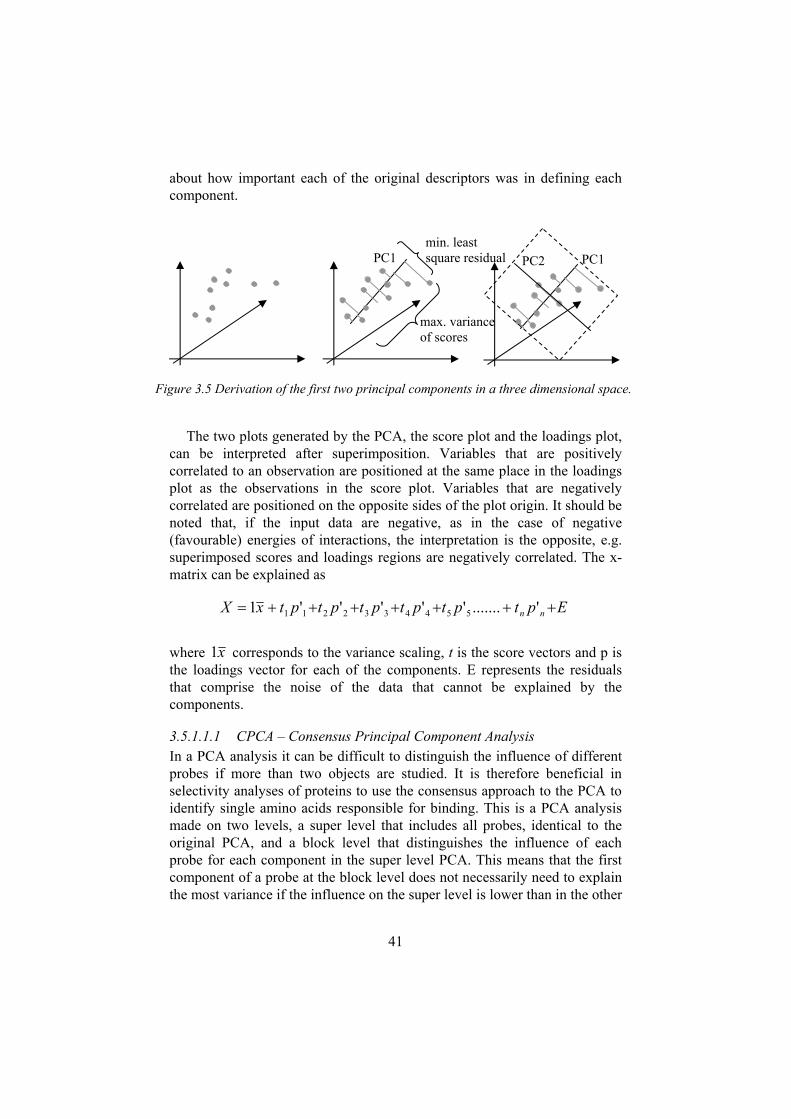
41
about how important each of the original descriptors was in defining each component.
The two plots generated by the PCA, the score plot and the loadings plot, can be interpreted after superimposition. Variables that are positively correlated to an observation are positioned at the same place in the loadings plot as the observations in the score plot. Variables that are negatively correlated are positioned on the opposite sides of the plot origin. It should be noted that, if the input data are negative, as in the case of negative (favourable) energies of interactions, the interpretation is the opposite, e.g. superimposed scores and loadings regions are negatively correlated. The x-matrix can be explained as
EptptptptptptxX nn '.......'''''1 5544332211
where x1 corresponds to the variance scaling, t is the score vectors and p is the loadings vector for each of the components. E represents the residuals that comprise the noise of the data that cannot be explained by the components.
3.5.1.1.1 CPCA – Consensus Principal Component Analysis In a PCA analysis it can be difficult to distinguish the influence of different probes if more than two objects are studied. It is therefore beneficial in selectivity analyses of proteins to use the consensus approach to the PCA to identify single amino acids responsible for binding. This is a PCA analysis made on two levels, a super level that includes all probes, identical to the original PCA, and a block level that distinguishes the influence of each probe for each component in the super level PCA. This means that the first component of a probe at the block level does not necessarily need to explain the most variance if the influence on the super level is lower than in the other
PC1
max. variance of scores
min. leastsquare residual PC1PC2
Figure 3.5 Derivation of the first two principal components in a three dimensional space.
42
probes. The probes with the greatest influence can then be selected for further analysis. This technique was used in Paper V.
3.5.1.2 PLS – Projection to Latent StructuresPLS stands for projection to latent structures by means of partial least squares analysis. The PCA components can be correlated directly to the y variables in a principal component regression (PCR) or by correlating the latent variables from the PCA to latent y variables in a PLS and deriving the new latent PLS component.
Instead of extracting underlying components that best describe the x blocks, as in PCA, PLS summarises x to be as highly correlated to y as possible. The technique is used for relating Y dependent variables, such as biological activity, to x variables. It can be conceptually described as the rotation of the structure of the x matrix so that it best explains the y variable or as two PCA-like models that are aligned to each other.
)'´1(''1''1
GTCyFUCyYETPxX
If a correlation is found, the remaining residuals for the y variables are diminished in the next dimension. Repeated fitting to new latent components will diminish the residing residuals and the correlation can approach 1, which means that all the residuals are explained. It is important to keep in mind that this is over-fitting of the data, since an experimental error is always present. Instead, the number of components included in the model should be driven by the predictive power of the model (q2). The predictive power of a model can be investigated using cross-validation. Cross validation gives an estimation of the predictivity without the help of external data. It makes an internal validation, and this is very valuable in QSAR studies since the number of objects studied is often very limited and therefore necessary for development of the model. In cross-validation, groups of observations are excluded from the matrix and the model is rebuilt. The model then predicts the excluded observations and the procedure is repeated until all observations have been excluded at least once. Another way of validating the model is to divide the original data set into a training and a testing set and then do all the modelling with the training set and use that model to predict the test set.
3.5.1.3 GOLPE GOLPE (103) is a multivariate statistical analysis program that was written to build, validate and interpret 3D QSAR models on the basis of molecular interaction fields calculated in GRID or CoMFA. Numerous statistical tools for selection of variables are included, such as factorial designs and smart

43
region definitions that make the program very suitable for this type of data. It is not a molecular modelling program, so all alignments, energy minimisations and interaction fields calculations have to be done before entering GOLPE. Beyond PCA and PLS, there is also the possibility to do consensus PCA (CPCA), which allows the analysis of molecular interaction fields from multiple probes on a super level or the consensus influence of each probe in the model. This was the chief statistical analysis program used in Papers I and V.
44
4 Aim and Objectives
4.1 AimTo derive computational models for the quantitative and qualitative prediction of inhibitors and substrates of the drug-metabolising enzyme, cytochrome P450 2C9.
4.2 Objectives To achieve this aim, a number of specific objectives were outlined as follows:
(1) Generate inhibition kinetics data for CYP2C9 from compounds that are already on the market. This work would involve the screening of a large number of compounds to identify inhibitors and non-inhibitors of CYP2C9. The inhibitors would then be further investigated to establish the mechanisms of inhibition in order to be able to select only competitive inhibitors for subsequent computational modelling work.
(2) Use as diverse compounds as possible to capture the chemical space available to these enzymes, which are characterized by low substrate specificity.
(3) Use GRID to calculate molecular interaction fields for targets studied and, on the basis of these fields, to explore methodologies that can handle the issues of alignment and bioactive conformer selection.
(4) Explore structural characteristics of CYP2C9, first by using homology models and then, as crystal data emerge, continuing with up-to-date x-ray crystal data.
45
5 Summary and discussion
In drug discovery and development, compounds are evaluated for their metabolic properties with respect to their routes of elimination, the enzymes that are involved and the potential for drug-drug interactions (117). Among the many drug metabolizing enzymes responsible for the biotransformation and disposition of therapeutics, cytochrome P450s play a major role. The most important CYPs in drug metabolism are CYP3A4, CYP2D6 and CYP2C9, which metabolise approximately 34, 19 and 16% of the drugs on the market, respectively (40). It is therefore not surprising that drug-drug interactions involving the induction and the inhibition of CYPs have been observed to chiefly involve these three CYPs. In recent years, a number of compounds including cerivastatin have been withdrawn from the market due to fatal interactions in which inhibition of CYPs was implicated (118). A survey of the literature also shows that there are many drug-drug interactions involving CYP inhibition that result in adverse effects, which are both hazardous to patients and expensive for the healthcare system(119-126). The pharmaceutical industry is therefore developing and employing computational, in vitro and in vivo approaches to be able to predict routes of drug metabolism, potentials for drug-drug interactions and effects of chemical modifications of candidate drugs such that they have favourable metabolic profiles.
5.1 Choice of CYP2C9 as a study model A number of factors made us choose CYP2C9 as a model for exploring the applicability of new computational tools to derive models for the prediction of CYP substrates and inhibitors. These include:
(a) CYP2C9 is one of the major three drug metabolizing enzymes and has been shown to be prone to inhibition leading to clinically significant drug-drug interactions (119,127) (b) There has been a large amount of basic research done on the enzyme including homology modelling and mutagenesis studies to understand structure-function properties of this enzyme(15,29,128-131). (c) At the initiation of this project in 2000, the first crystal structure of a mammalian CYP, rabbit CYP2C5, was published (132). This enzyme has a high sequence similarity (87%) and identity (77%) with CYP2C9. This
46
opened the possibility for a better understanding of the human CYP2C9 than of any other human CYP. (d) Efforts to derive predictive models of CYP2C9 inhibitors and substrates, using traditional approaches available previously, covered a narrow chemical space of applicability and were derived on the basis of initial assumptions regarding alignment and bioactive conformation. The initiation of the project was thus governed by needs for more general models.
These factors made CYP2C9 an attractive target for this research project. Finding solutions to some of the major challenges in modelling for substrates and inhibitors for CYP2C9 was anticipated to pave the way for the understanding of other drug metabolizing enzymes.
5.2 Selection of compounds and generation of CYP2C9 inhibition data
From the onset, we realised that one of the major limiting factors in modelling efforts was the data that computational chemists were using. Data on inhibition reported in the literature by different laboratories commonly vary more than 1 log unit for the same compound and enzyme(133). We therefore decided to generate our own data under uniform conditions. Some of the previous work used IC50s as measures of inhibition. There can be limitations to this, since this measure fails to say anything about the mechanism of inhibition. Models for competitive inhibition should be confined to the region of interaction specific to competitive inhibitors, as those regions by definition differ from other types of inhibitors that could use allosteric binding sites or depend on covalent bonding. We therefore also determined the mechanism of inhibition of the compounds and selected competitive inhibitors and non-inhibitors for the data sets to be used in upcoming modelling work. A third issue concerning inhibition data is that some of the substrates and inhibitors interact with the CYPs in a stereo-specific manner (e.g. CYP2C9 mainly metabolises S-warfarin and not R-warfarin(134)). Models have been built that both take (135)and do not take this into account (136). In this study we determined the inhibition constants of the individual stereoisomers to capture stereo specific behaviour, if present. In our data set it was shown not to be of importance, but this approach ruled out any uncertainty of its influence. Figure 5.1 shows the scheme for how the inhibition data were generated.
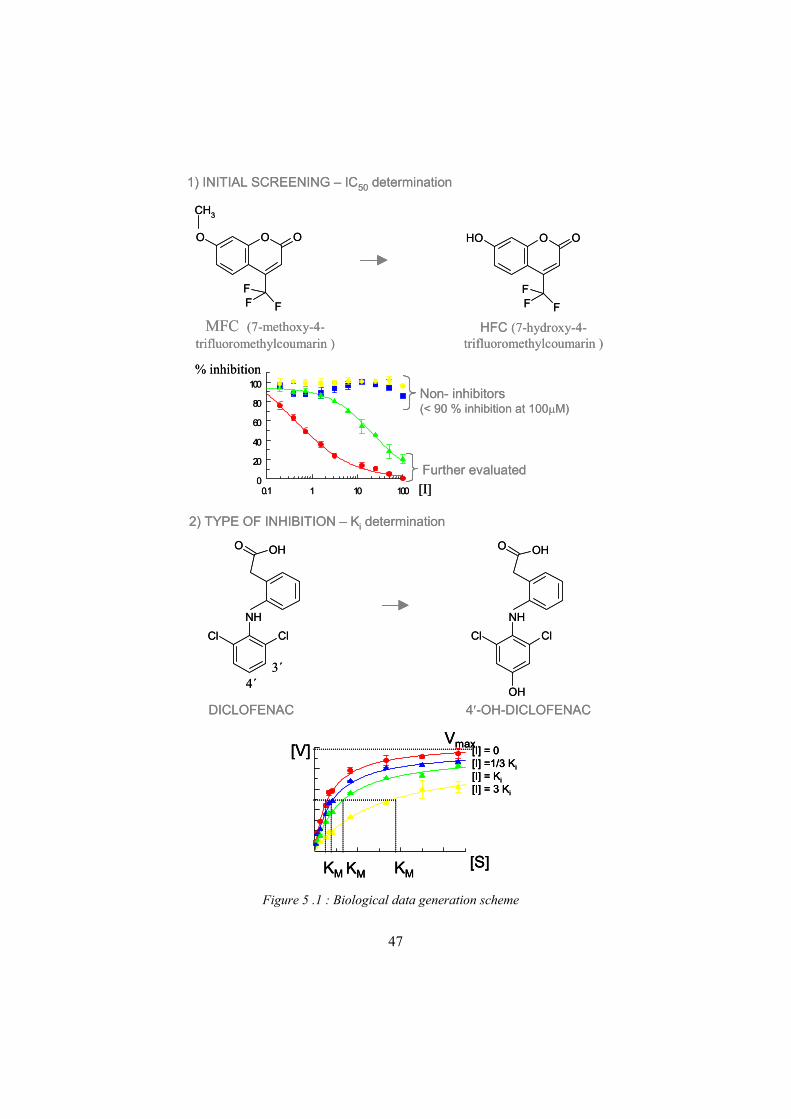
47
Figure 5 .1 : Biological data generation scheme
O
FFF
OH OO
FFF
O O
CH3
MFC (7-methoxy-4-trifluoromethylcoumarin )
HFC (7-hydroxy-4-trifluoromethylcoumarin )
1) INITIAL SCREENING – IC50 determination
ClClNH
OHO
ClClNH
OH
OHO
2) TYPE OF INHIBITION – Ki determination
DICLOFENAC 4 -OH-DICLOFENAC
Vmax
KM KMKM
[V]
[S]
[I] = 0[I] =1/3 Ki[I] = Ki[I] = 3 Ki
1001010.1
100
80
60
40
20
0Further evaluated
Non- inhibitors(< 90 % inhibition at 100 M)
% inhibition
[I]
3´4´
O
FFF
OH OO
FFF
O O
CH3
MFC (7-methoxy-4-trifluoromethylcoumarin )
HFC (7-hydroxy-4-trifluoromethylcoumarin )
1) INITIAL SCREENING – IC50 determination
ClClNH
OHO
ClClNH
OH
OHO
2) TYPE OF INHIBITION – Ki determination
DICLOFENAC 4 -OH-DICLOFENAC
Vmax
KM KMKM
[V]
[S]
[I] = 0[I] =1/3 Ki[I] = Ki[I] = 3 Ki
Vmax
KM KMKM
[V]
[S]
[I] = 0[I] =1/3 Ki[I] = Ki[I] = 3 Ki
1001010.1
100
80
60
40
20
0Further evaluated
Non- inhibitors(< 90 % inhibition at 100 M)
% inhibition
[I]
3´4´
48
Observations of clinically relevant drug-drug interactions involving competitive inhibitors have led to the general recommendations that compounds with Ki of over 10 µM are unlikely to result in in vivointeractions(137). This value is derived from FDA and Pharma guidelines, which propose the following inhibition indices (Css (or Cmax)/Ki): > 1.0 likely interaction, <0.3 unlikely interactions, and 0.3-1.0 probable interactions. In early discovery, the Css or Cmax is not known but, assuming that future potent drugs will have a Css or Cmax of about 1.0 µM, a rule of thumb for a general classification of inhibitors is: potent inhibitors Ki < 1.0 M, medium potent inhibitors, Ki = 1-10 M, and poor inhibitors, Ki > 10 M. One can however appreciate that these generalisations can change if the plasma concentrations exceed 1 µM. An unusual situation of a high Css or Cmax of 10 M would change the limit for compounds to be unlikely inhibitors at Ki > 30 µM. Our initial goal was to screen compounds and identify ten representatives of competitive inhibitors in each of the above categories and thus to cover three logarithmic units of activity.
However, after screening over 100 compounds according to the scheme depicted in Figure 5.1, we ended up with the inhibitors in the following categories: potent inhibitors (Ki < 1 M; n=2), medium potent inhibitors (Ki= 1-10 M; n=10), poor inhibitors (Ki = 10-20 M; n=7), very poor inhibitors (Ki = >20 M; n=15) and 46 non-inhibitors (inhibited less than 10% of the CYP2C9 catalysed reaction). We considered these data sufficient to pursue subsequent modelling work. The data were then randomly divided into the training sets (for the derivation of the models) and test sets (for the validation of the predictive power of the models), tables 5.1 – 5.4.
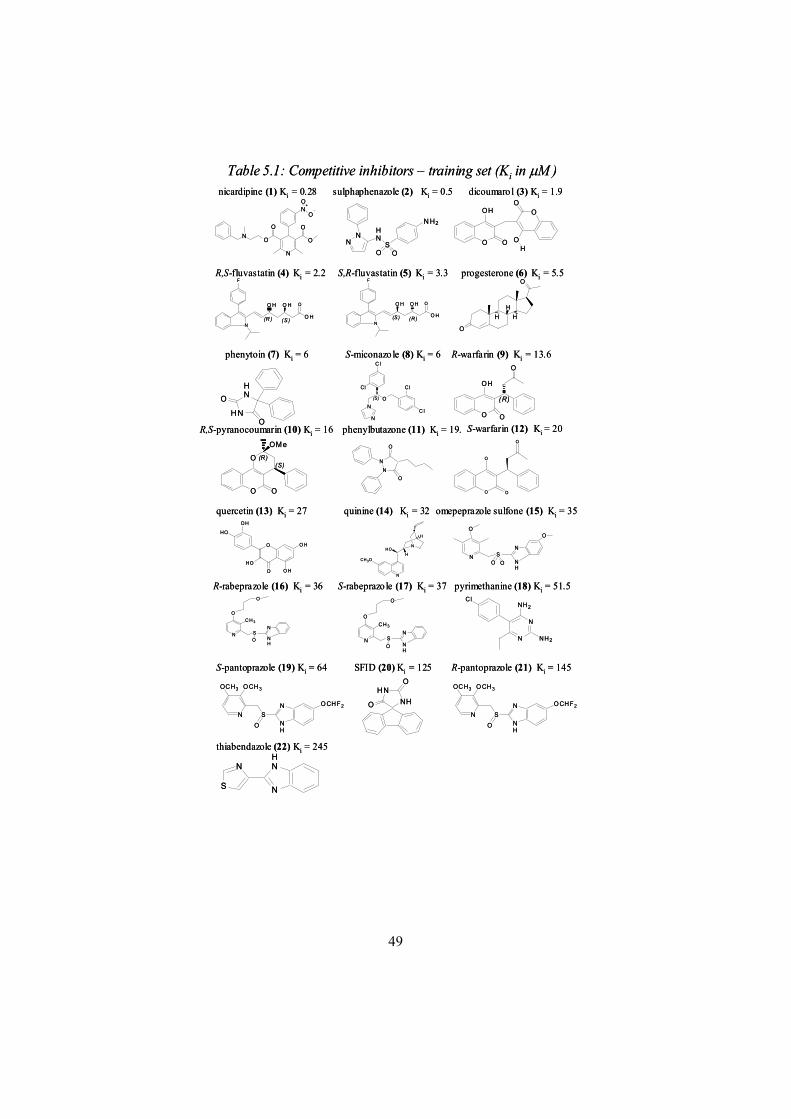
49
S-pantoprazole (19) Ki = 64
omepeprazole sulfone (15) Ki = 35
phenylbutazone (11) Ki = 19.
phenytoin (7) Ki = 6
dicoumaro l (3) Ki = 1.9
S-warfarin (12) Ki = 20R,S-pyranocoumarin (10) Ki = 16
R-warfarin (9) Ki = 13.6S-miconazo le (8) Ki = 6
progesterone (6) Ki = 5.5S,R-fluvastatin (5) Ki = 3.3R,S-fluvastatin (4) Ki = 2.2
sulphaphenazole (2) Ki = 0.5nicardipine (1) Ki = 0.28
thiabendazole (22) Ki = 245
R-pantoprazole (21) Ki = 145SFID (20) Ki = 125
pyrimethanine (18) Ki = 51.5S-rabeprazo le (17) Ki = 37R-rabeprazole (16) Ki = 36
quinine (14) Ki = 32quercetin (13) Ki = 27
Table 5.1: Competitive inhibitors – training set (Ki in M )
HN
H NO
O
NN
HN
SO O
N H2
O O
O
OH
OHO
N
F
O H O H
O H
O
(R ) (S ) N
F
O H O H
O H
O
(S) (R )
O
HH
H
O
(S) O
Cl
N
C l
N
Cl
C l
O
OO
OH
(R)
O
O O
OMe
(R)(S)
NN
O
O
O
O O
O
O
O O HHO
O H
O H
HO
N
HO
CH3O
N
H
H
N S
O
NH
N
O
O O
N SO
OC H 3
NH
N
O
N SO
OC H 3
NH
N
O
N
N
NH2
NH2
Cl
NHH N
O
O
HN
N
N
S
SO
N
O CH 3OCH3
NH
N O CHF2
SO
N
O CH 3OCH3
NH
N O CHF2
N
O
O
O
O
N+
O
O
N
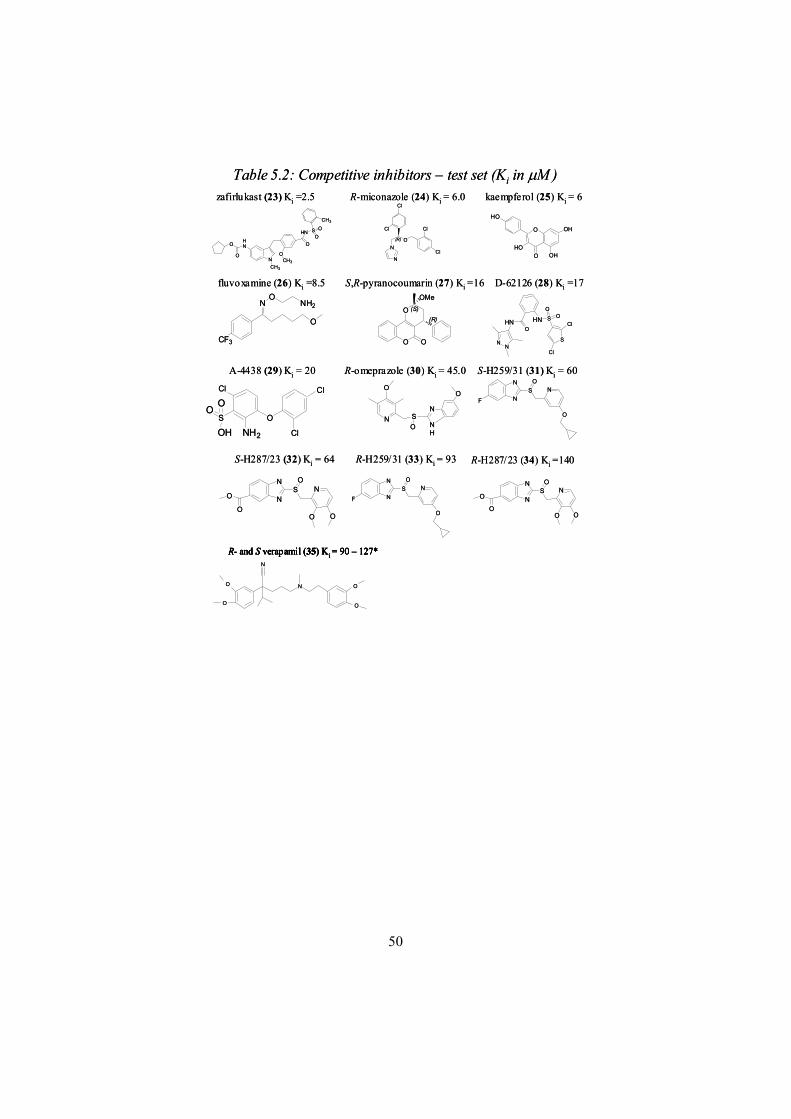
50
Table 5.2: Competitive inhibitors – test set (Ki in M )
R-H287/23 (34) Ki =140 R-H259/31 (33) Ki = 93 S-H287/23 (32) Ki = 64
S-H259/31 (31) Ki = 60 R-omeprazole (30) Ki = 45.0 A-4438 (29) Ki = 20
D-62126 (28) Ki =17S,R-pyranocoumarin (27) Ki =16 fluvoxamine (26) Ki =8.5
kaempferol (25) Ki = 6R-miconazole (24) Ki = 6.0zafirlukast (23) Ki =2.5
N
OHN
O OCH3
HN S
O
OO
CH3
CH3
(R) O
Cl
N
Cl
N
Cl
Cl
O
O OHHO
OH
HO
CF3
NO
O
NH2 O
O O
OMe(S)
(R) HNHNO
S
OO
NN S
Cl
Cl
S
Cl
O
Cl
Cl
NH2
O
OH
ON
O
SO N
H
N
O
N
NS
ON
O
F N
NS
ON
O OO
O
N
NS
ON
O
F
N
NS
ON
O OO
O
R- and S verapamil (35) Ki = 90 – 127*
O
O
N
N
O
O
Table 5.2: Competitive inhibitors – test set (Ki in M )
R-H287/23 (34) Ki =140 R-H259/31 (33) Ki = 93 S-H287/23 (32) Ki = 64
S-H259/31 (31) Ki = 60 R-omeprazole (30) Ki = 45.0 A-4438 (29) Ki = 20
D-62126 (28) Ki =17S,R-pyranocoumarin (27) Ki =16 fluvoxamine (26) Ki =8.5
kaempferol (25) Ki = 6R-miconazole (24) Ki = 6.0zafirlukast (23) Ki =2.5
N
OHN
O OCH3
HN S
O
OO
CH3
CH3
(R) O
Cl
N
Cl
N
Cl
Cl
O
O OHHO
OH
HO
CF3
NO
O
NH2 O
O O
OMe(S)
(R) HNHNO
S
OO
NN S
Cl
Cl
S
Cl
O
Cl
Cl
NH2
O
OH
ON
O
SO N
H
N
O
N
NS
ON
O
F N
NS
ON
O OO
O
N
NS
ON
O
F
N
NS
ON
O OO
O
R- and S verapamil (35) Ki = 90 – 127*R- and S verapamil (35) Ki = 90 – 127*R- and S verapamil (35) Ki = 90 – 127*R- and S verapamil (35) Ki = 90 – 127*
O
O
N
N
O
O
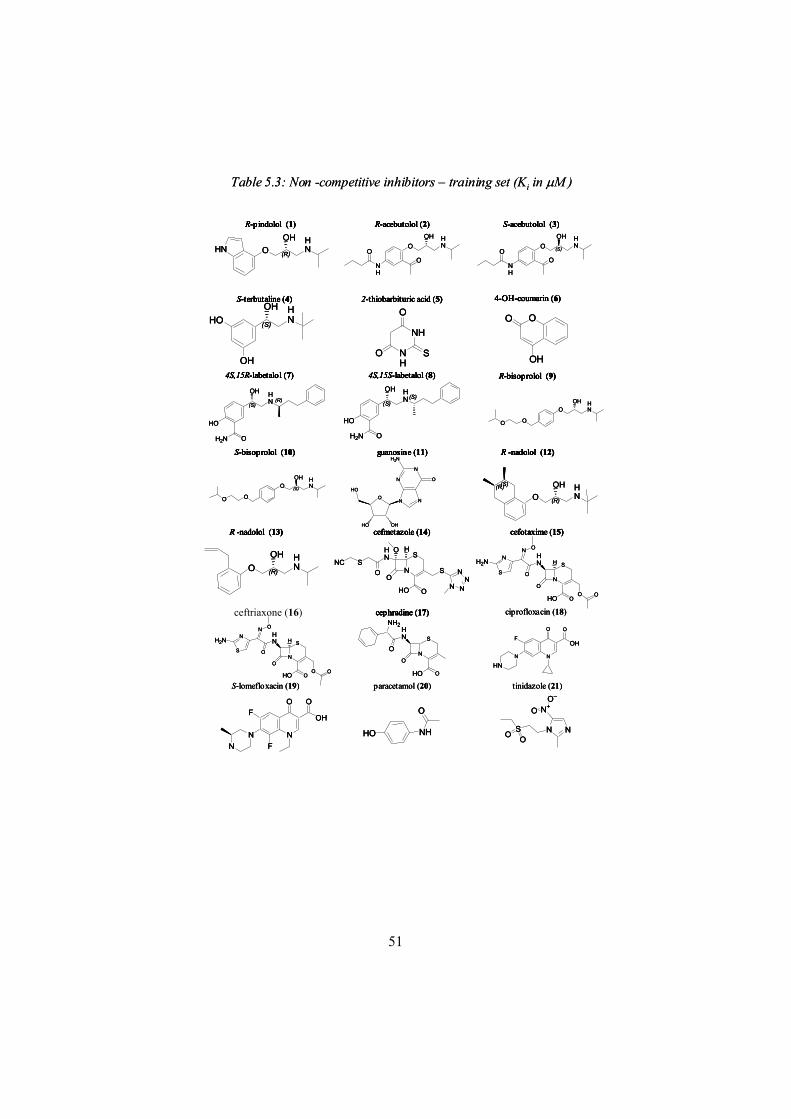
51
Table 5.3: Non -competitive inhibitors – training set (Ki in M )
O (R)
OH HNHN
R-pindolol (1)
OOH H
N
NH
OO
R-acebutolol (2)
O (S)
OH HN
NH
OO
S-acebutolol (3)
(S)
OH HNHO
OH
S-terbutaline (4)
NH
O
NH
O
S
2-thiobarbituric acid (5)
O
OH
O
4-OH-coumarin (6)
(S)
OH HN
HO
H2N O
(R) (S)
OH HN
HO
H2N O
(S)
OOH
O
HN
O
O (S)
OH
O
HN
O
4S,15R-labetalol (7)
N
N
NO
N
O
H2N
OHHO
HO
4S,15S-labetalol (8)
O (R)
OH HN
(S)(R)
R-bisoprolol (9)
O (R)
OH HN
S-bisoprolol (10)
HN
N
S
O
OHO
S
N
N
NN
H
SNCO
O
guanosine (11)
N
S
O
HN
OHOO
O
N
O
N
O
S
H2N H
R -nadolol (12)
N
S
O
HN
OHOO
O
N
O
N
O
S
H2N H
R -nadolol (13)
N
S
O
HN
HO O
O
NH2
cefmetazole (14)
N
O
N
FOH
O
HN
cefotaxime (15)
NF
O
N
FOH
O
N
NHHO
O
cephradine (17)
SOO N N
N+O–
O
S-lomefloxacin (19) paracetamol (20) tinidazole (21)
ciprofloxacin (18)
O (R)
OH HNHN
R-pindolol (1)R-pindolol (1)R-pindolol (1)R-pindolol (1)
OOH H
N
NH
OO
R-acebutolol (2)R-acebutolol (2)R-acebutolol (2)R-acebutolol (2)
O (S)
OH HN
NH
OO
S-acebutolol (3)S-acebutolol (3)S-acebutolol (3)S-acebutolol (3)
(S)
OH HNHO
OH
S-terbutaline (4)S-terbutaline (4)S-terbutaline (4)S-terbutaline (4)
NH
O
NH
O
S
2-thiobarbituric acid (5)2-thiobarbituric acid (5)2-thiobarbituric acid (5)2-thiobarbituric acid (5)
O
OH
O
4-OH-coumarin (6)4-OH-coumarin (6)4-OH-coumarin (6)4-OH-coumarin (6)
(S)
OH HN
HO
H2N O
(R) (S)
OH HN
HO
H2N O
(S)
OOH
O
HN
O
O (S)
OH
O
HN
O
4S,15R-labetalol (7)4S,15R-labetalol (7)4S,15R-labetalol (7)4S,15R-labetalol (7)
N
N
NO
N
O
H2N
OHHO
HO
4S,15S-labetalol (8)4S,15S-labetalol (8)4S,15S-labetalol (8)4S,15S-labetalol (8)
O (R)
OH HN
(S)(R)
R-bisoprolol (9)R-bisoprolol (9)R-bisoprolol (9)R-bisoprolol (9)
O (R)
OH HN
S-bisoprolol (10)S-bisoprolol (10)S-bisoprolol (10)S-bisoprolol (10)
HN
N
S
O
OHO
S
N
N
NN
H
SNCO
O
guanosine (11)guanosine (11)guanosine (11)guanosine (11)
N
S
O
HN
OHOO
O
N
O
N
O
S
H2N H
R -nadolol (12)R -nadolol (12)R -nadolol (12)R -nadolol (12)
N
S
O
HN
OHOO
O
N
O
N
O
S
H2N H
R -nadolol (13)R -nadolol (13)R -nadolol (13)R -nadolol (13)
N
S
O
HN
HO O
O
NH2
cefmetazole (14)cefmetazole (14)cefmetazole (14)cefmetazole (14)
N
O
N
FOH
O
HN
cefotaxime (15)cefotaxime (15)cefotaxime (15)cefotaxime (15)
NF
O
N
FOH
O
N
NHHO
O
cephradine (17)cephradine (17)cephradine (17)cephradine (17)
SOO N N
N+O–
O
S-lomefloxacin (19) paracetamol (20) tinidazole (21)
ciprofloxacin (18)ceftriaxone (16)
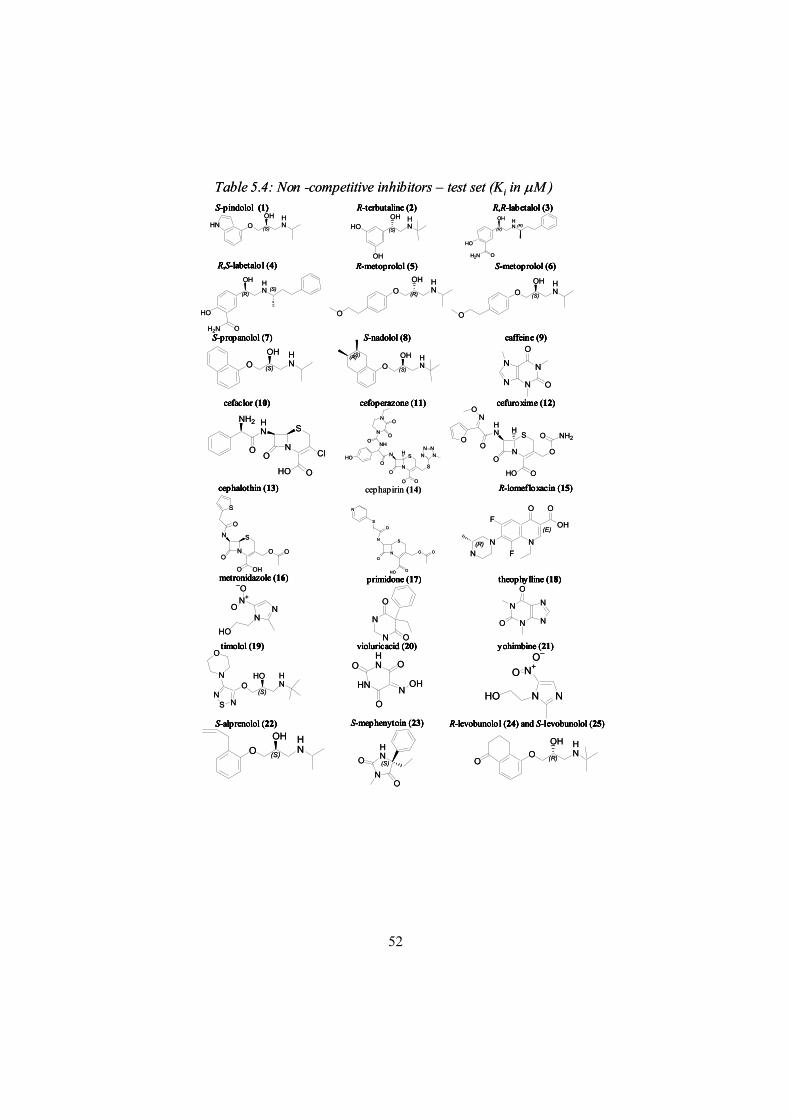
52
S-pindolol (1)
O (S)
OH HNHN
R-terbutaline (2)
(S)
OH HNHO
OH
(R)
OH HN
HO
H2N O
(R)
R,R-labetalol (3)
(R)
OH HN
HO
H2N O
(S)
R,S-labetalol (4)
O (R)
OH HN
O
R-metoprolol (5)
O (S)
OH HN
O
S-metoprolol (6)
O (S)
OH HN
S-propanolol (7)
O (S)
OH HN
(S)(R)
S-nadolol (8)
N
NN
N
O
O
caffeine (9)
HN
N
S
O
OHO
O Cl
NH2
cefaclor (10)
N
S
O
N
O O
SO
NH
NNNN
N
O
HO
O
NO
H
cefoperazone (11)
N
S
O
HN
OHO
OO
N
NH2OO
O
H
cefuroxime (12)
N
S
O
N
OHO
O
O
O
S
cephalothin (13)
NF
O
N
FOH
O
(R)N
(E)
R-lomefloxacin (15)
N
SO
N
NO
S
OOH
O O
cephapirin (14)
NN
HO
N+
–O
O
metronidazole (16)
N
O
N O
primidone (17)
N
N N
N
O
O
theophylline (18)
N
NO
NS
(S)
O
HO HN
timolol (19)
NHN
O
HN O
OH
O
violuricacid (20)
N NHO
N+O–
O
yohimbine (21)
O (S)
OH HN
S-alprenolol (22)
O (R)
OH HN
O
R-levobunolol (24) and S-levobunolol (25)
(S)
HN
NO
O
S-mephenytoin (23)
Table 5.4: Non -competitive inhibitors – test set (Ki in M )S-pindolol (1)S-pindolol (1)S-pindolol (1)S-pindolol (1)
O (S)
OH HNHN
R-terbutaline (2)R-terbutaline (2)R-terbutaline (2)R-terbutaline (2)
(S)
OH HNHO
OH
(R)
OH HN
HO
H2N O
(R)
R,R-labetalol (3)R,R-labetalol (3)R,R-labetalol (3)R,R-labetalol (3)
(R)
OH HN
HO
H2N O
(S)
R,S-labetalol (4)R,S-labetalol (4)R,S-labetalol (4)R,S-labetalol (4)
O (R)
OH HN
O
R-metoprolol (5)R-metoprolol (5)R-metoprolol (5)R-metoprolol (5)
O (S)
OH HN
O
S-metoprolol (6)S-metoprolol (6)S-metoprolol (6)S-metoprolol (6)
O (S)
OH HN
S-propanolol (7)S-propanolol (7)S-propanolol (7)S-propanolol (7)
O (S)
OH HN
(S)(R)
S-nadolol (8)S-nadolol (8)S-nadolol (8)S-nadolol (8)
N
NN
N
O
O
caffeine (9)caffeine (9)caffeine (9)caffeine (9)
HN
N
S
O
OHO
O Cl
NH2
cefaclor (10)cefaclor (10)cefaclor (10)cefaclor (10)
N
S
O
N
O O
SO
NH
NNNN
N
O
HO
O
NO
H
cefoperazone (11)cefoperazone (11)cefoperazone (11)cefoperazone (11)
N
S
O
HN
OHO
OO
N
NH2OO
O
H
cefuroxime (12)cefuroxime (12)cefuroxime (12)cefuroxime (12)
N
S
O
N
OHO
O
O
O
S
cephalothin (13)cephalothin (13)cephalothin (13)cephalothin (13)
NF
O
N
FOH
O
(R)N
(E)
R-lomefloxacin (15)R-lomefloxacin (15)R-lomefloxacin (15)R-lomefloxacin (15)
N
SO
N
NO
S
OOH
O O
cephapirin (14)
NN
HO
N+
–O
O
metronidazole (16)metronidazole (16)metronidazole (16)metronidazole (16)
N
O
N O
primidone (17)primidone (17)primidone (17)primidone (17)
N
N N
N
O
O
theophylline (18)theophylline (18)theophylline (18)theophylline (18)
N
NO
NS
(S)
O
HO HN
timolol (19)timolol (19)timolol (19)timolol (19)
NHN
O
HN O
OH
O
violuricacid (20)violuricacid (20)violuricacid (20)violuricacid (20)
N NHO
N+O–
O
yohimbine (21)yohimbine (21)yohimbine (21)yohimbine (21)
O (S)
OH HN
S-alprenolol (22)S-alprenolol (22)S-alprenolol (22)S-alprenolol (22)
O (R)
OH HN
O
R-levobunolol (24) and S-levobunolol (25)R-levobunolol (24) and S-levobunolol (25)R-levobunolol (24) and S-levobunolol (25)R-levobunolol (24) and S-levobunolol (25)
(S)
HN
NO
O
S-mephenytoin (23)S-mephenytoin (23)S-mephenytoin (23)S-mephenytoin (23)
Table 5.4: Non -competitive inhibitors – test set (Ki in M )
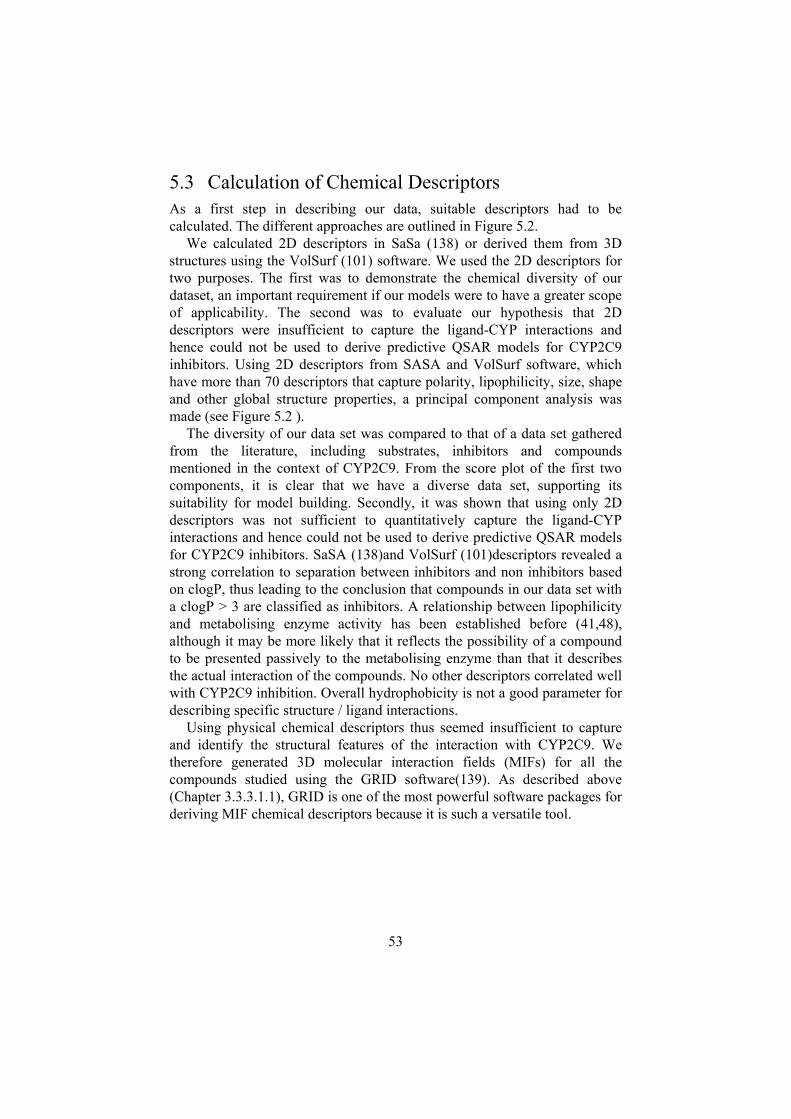
53
5.3 Calculation of Chemical Descriptors As a first step in describing our data, suitable descriptors had to be calculated. The different approaches are outlined in Figure 5.2.
We calculated 2D descriptors in SaSa (138) or derived them from 3D structures using the VolSurf (101) software. We used the 2D descriptors for two purposes. The first was to demonstrate the chemical diversity of our dataset, an important requirement if our models were to have a greater scope of applicability. The second was to evaluate our hypothesis that 2D descriptors were insufficient to capture the ligand-CYP interactions and hence could not be used to derive predictive QSAR models for CYP2C9 inhibitors. Using 2D descriptors from SASA and VolSurf software, which have more than 70 descriptors that capture polarity, lipophilicity, size, shape and other global structure properties, a principal component analysis was made (see Figure 5.2 ).
The diversity of our data set was compared to that of a data set gathered from the literature, including substrates, inhibitors and compounds mentioned in the context of CYP2C9. From the score plot of the first two components, it is clear that we have a diverse data set, supporting its suitability for model building. Secondly, it was shown that using only 2D descriptors was not sufficient to quantitatively capture the ligand-CYP interactions and hence could not be used to derive predictive QSAR models for CYP2C9 inhibitors. SaSA (138)and VolSurf (101)descriptors revealed a strong correlation to separation between inhibitors and non inhibitors based on clogP, thus leading to the conclusion that compounds in our data set with a clogP > 3 are classified as inhibitors. A relationship between lipophilicity and metabolising enzyme activity has been established before (41,48), although it may be more likely that it reflects the possibility of a compound to be presented passively to the metabolising enzyme than that it describes the actual interaction of the compounds. No other descriptors correlated well with CYP2C9 inhibition. Overall hydrophobicity is not a good parameter for describing specific structure / ligand interactions.
Using physical chemical descriptors thus seemed insufficient to capture and identify the structural features of the interaction with CYP2C9. We therefore generated 3D molecular interaction fields (MIFs) for all the compounds studied using the GRID software(139). As described above (Chapter 3.3.3.1.1), GRID is one of the most powerful software packages for deriving MIF chemical descriptors because it is such a versatile tool.
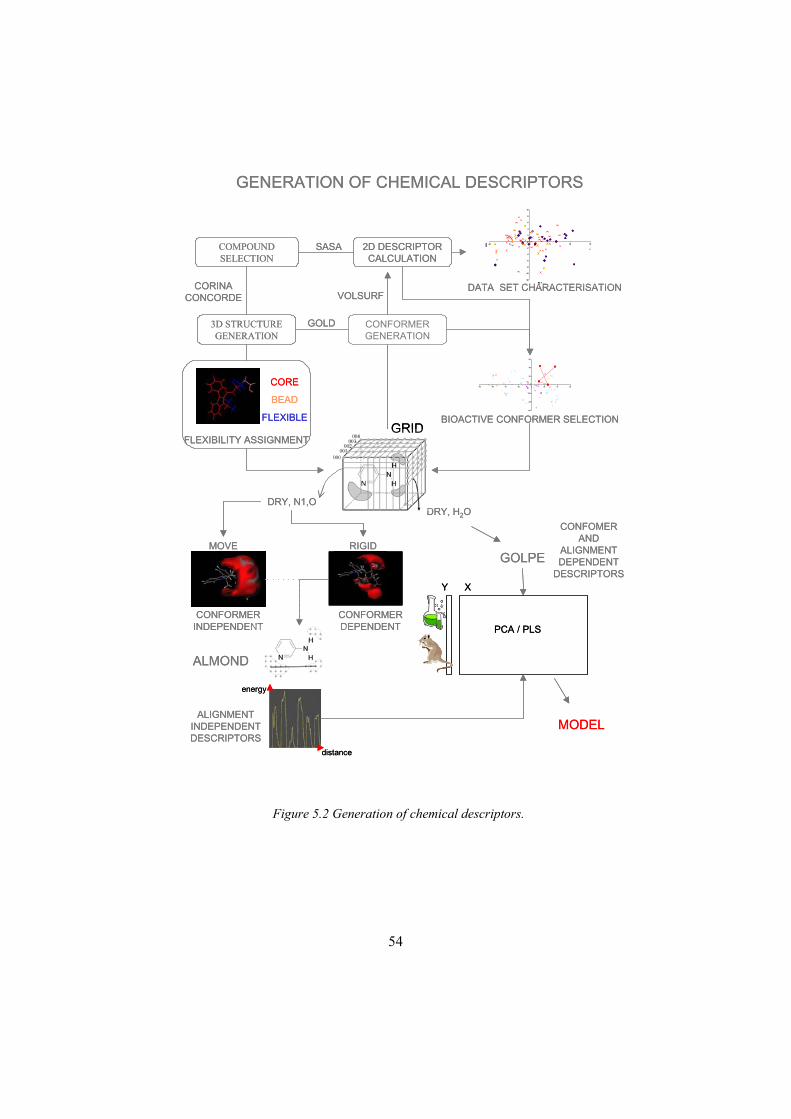
54
Figure 5.2 Generation of chemical descriptors.
GENERATION OF CHEMICAL DESCRIPTORS
COMPOUNDSELECTION
3D STRUCTUREGENERATION
CORINACONCORDE
2D DESCRIPTORCALCULATION
SASA
DATA SET CHARACTERISATION
CONFORMERGENERATION
GOLD
BIOACTIVE CONFORMER SELECTION
FLEXIBILITY ASSIGNMENT
CORE
BEAD
FLEXIBLE
-12
-10
-8
-6
-4
-2
0
2
4
6
8
10
-10 -5 0 5 10 15
PC 1
PC2
-60
-40
-20
0
20
40
60
-80 -60 -40 -20 0 20 40 60
DRY, N1,O
ALMOND
MOVE RIGID
DRY, H2O
GOLPE
Y X
ALIGNMENTINDEPENDENTDESCRIPTORS
CONFORMERINDEPENDENT
CONFORMERDEPENDENT
CONFOMER AND
ALIGNMENTDEPENDENT
DESCRIPTORS
MODEL
PCA / PLS
VOLSURF
GRID
distance
energy
55
5.4 Selection of bioactive conformersTwo criteria must be fulfilled to model an enzyme–ligand interaction successfully: the bioactive conformation must be used and the selected conformer of each compound must have a correct alignment. In this work we have used multiple techniques to handle these issues.
A homology model of CYP2C9 based solely on the crystal structure of CYP2C5 (132) was developed in our laboratory (140). The selection of a bioactive conformer was based on four template inhibitors, some of which are also substrates of CYP2C9 (S-warfarin, phenytoin and progesterone) or have a known mode of interaction (sulphaphenazole – hexacoordination of N towards the heme). These compounds were docked, using GOLD, into the active site and one solution for each compound was selected where the site of oxidation/direct ligation pointed towards the heme at a reasonable distance for interaction (~4 Å). All other compounds were docked applying the exact same settings as for the templates and the top 20 solutions were retrieved. These docked conformers (inhibitors and non-inhibitors) together with the template conformers were described using molecular interaction fields for the DRY and OH2 probe (Paper II and Figure 5.2). The results were analysed in a principal component analysis. The Euclidian distances in the score plot towards all template conformers for each of the 20 solutions for all compounds were calculated. Interestingly and encouragingly, the conformers were not clustered on the basis of compound identity; instead, many of the compounds had at least one representative conformation in a cluster including the template conformers. The solution of each compound that had the shortest average Euclidian distance in four dimensions towards the template compounds was chosen, which means that selected conformers were limited to a closer chemical space guided by similarity to template compounds. The same approach was used for the non–inhibitor data set to confine these conformers to the same chemical space. All non-inhibitors fitted into the active site and the solutions were projected into the PCA space to select docked solutions on the basis of the shortest Euclidian distances. This approach is applicable to any compound placed in the model, which is of the greatest importance for future use when there is no prior knowledge of whether or not it is an inhibitor of CYP2C9. Docking as a discriminative tool between inhibitors and non-inhibitors can therefore be ruled out at this stage since all non-inhibitors also fitted well into the active site.
56
5.5 Discriminant model for CYP2C9 inhibitors.The initial goal was to be able to discriminate between competitive inhibitors and non-inhibitors. Any model in which exclusion criteria are not defined will try to predict every compound placed into the model. This model should therefore function as a filter prior to the application of quantitative models for inhibition. The model was constructed on the basis of a training set of 21 competitive inhibitors and 21 non-inhibitors (Tables 5.1 and 5.3). An additional 14 competitive inhibitors and 39 non–inhibitors (Tables 5.2 and 5.4) were kept outside the model for external predictions. The test set was found to be well spread in the descriptor space in a comparison with the training set in a PCA analysis.
The discriminant model was built using the DRY, O and N1 probes in ALMOND (see 3.3.3.2). A clear discrimination between inhibitors and non-inhibitors was already seen in the PCA space. As much as 58 % of the variance in the x-matrix was explained in the first two components. The high variance explained together with the initial discrimination in the PCA space is of fundamental importance in a discriminative model where only a binary variable is defined in order to guide the model. In the proceeding PLS, the introduction of the y variables (0 and 1) rotated the projection of the principal components to latent variables that focus on class separation. The initial model was predictive in two components with an r2 of 0.65 and a q2 of 0.46. One iteration of FFD selection of variable increased the correlation to 0.74 and the internal cross–validation (q2) index to 0.64. The external test set of 39 compounds was predicted correctly to an extent of 74% and 13 % were predicted to be borderline cases. Only 13 % of the external test set of 39 compounds were false positives or false negatives.
This model may be used as a filter before attempting to predict CYP inhibitors quantitatively. In an initial stage it will give information on the affinity to the enzyme to guide the process of deciding upon which compound class should be chosen so that problems are avoided at a later stage.
5.6 Classical 3D QSAR model in GRID/GOLPE The next step was to correlate the competitive inhibitors to their quantitative biological Ki values. A probable bioactive conformer had already been proposed on the basis of docking and, along with that, an alignment in accordance with the relative coordinates from the docking into the active site could be used. This information was used in a traditional 3D QSAR approach in GRID/GOLPE (Paper I).
The resulting model had an r2 of 0.95 and a q2 of 0.73. These high numerical values in the correlation coefficient (r2) alert us to a risk that the
57
model is overfitted since the model has higher statistical parameters than is possible since an experimental error is always present in biological models. The model includes only one component, however, and the internal predictive power of the model is high, measured as crossvalidation (q2)coefficient. It was also predictive for an external set of compounds (Table 6.3 and Paper I), all of which were predicted within 0.36 log units. Since the model was constructed according to the alignment resulting from the docking, the model could be interpreted inside the active site of the homology model. The PLS coefficients correlated well with the environment in the active site, as discussed in Paper I.
5.7 3D QSAR models based on alignment independent descriptors
In order to avoid assumptions regarding alignment, a 3D QSAR model was built on the basis of classical GRID descriptors transformed into alignment independent descriptors (GRIND) in ALMOND. The initial model had a low internal predictive power (q2= 0.24), and the description of the compounds by the ALMOND descriptors was thus further explored. It turned out that large compounds were not completely explained using the default settings, but an increase in the number of nodes used in the model favoured both the predictivity and the completeness of the explanation for all compounds, including the larger ones.
A predictive alignment independent model was derived with an r2 of 0.77 and a q2 of 0.60. The model could predict 11 out of 12 compounds in an external data set within 0.5 log units.
5.8 Comparison of 3D QSAR models to current structural information
These two models, vide supra, one generated with traditional 3D GRID descriptors (Paper I) and one generated with alignment independent descriptors (Paper II), were compared to the active site of the homology model to see whether the two methodologies gave similar results. Since the ALMOND descriptors are alignment independent, the PLS coefficients had to be examined compound by compound. Sulphaphenazole and S-warfarin had previously been used as templates in the conformer selection and these were chosen for further analysis. Sulphaphenazole: DRY interactions of the GRID/GOLPE model are located mainly in the outer regions of the active site, corresponding to Phe476 and Ile205. In the ALMOND model regions close to the heme, corresponding to Leu366 and Ala297, contributed highly
58
to explaining the activity. The important hydrophobic region in close proximity to Ile205 was common to both models. The PLS coefficients from the OH2 probe in the GOLPE model were then compared to the results from both the N1 and O probes for the ALMOND model. This comparison is not straightforward since the GOLPE model included both positive and negative interaction energies in the model. The PLS pseudo - coefficients of the GOLPE model can therefore not be directly interpreted as regions with a positive or negative contribution to the activity since a positive energy point of a positive coefficient will have the same direction as a negative energy point with a negative coefficient. In the case of the ALMOND descriptors, only the negative energies of interactions are considered and there is therefore no mix of negative and positive contributions. Interaction with a region close to Asp293 was seen in both models but other regions did not quite correspond as compared to the homology model. It could not be determined whether this was because the information in the models differs. S-warfarin: The hydrophobic pattern of S-warfarin corresponded well in ALMOND and the GOLPE models, describing two distinct regions that corresponded to Ile205 and Ala297, as also described for sulphaphenazole. Other important regions shown by the models involved the hydrophobic pocket built from Leu361 and Leu362. The polar interactions are similar to the sulphaphenazole case, with a common interaction in the region of Asp293 in both the ALMOND and GOLPE models. In general, the models do not explain the exact same information, even though the key points are the same. This is possible since the descriptors are different in the two models and since the alignment by the homology model drives the GRID/GOLPE model. The 3D QSAR model, based on traditional descriptors, benefits from the inclusion of more information since both positive and negative information is introduced, which is reflected by the slightly higher predictivity (q2) value. The ALMOND model on the other hand is more easily interpretable for single compounds, since all information describes favourable interaction and the positive and negative interaction energies are not mixed as in the GOLPE model.
5.9 Flex GRID-ALMOND QSAR modelTo this point predictive models based on a putative bioactive conformation had been derived both with alignment dependent and alignment independent descriptors. The next step was to further eliminate the number of initial assumptions and derive models without having to choose a bioactive conformation. This was accomplished using the flexible GRID option in GRID. Flexible substituents and terminal groups connected by flexible atoms were allowed to move during the GRID calculations. (see 3.3.3). These calculated molecular fields were analysed in ALMOND and, after
59
fine tuning some of the parameters involved in describing the molecule, (see paper IV), a predictive model was achieved with a correlation coefficient r2
of 0.8 and q2 of 0.6. This model was able to predict 11 out of 12 test compounds within 0.5 log units, which is similar to the performance of the ALMOND model based on docked conformers.
5.10 Comparison of the conformer dependent and the conformer independent model based on ALMOND descriptors
A comparison of the PLS coefficients of the two models based on ALMOND descriptors showed that the distances selected as important in the conformer dependent ALMOND model were in general longer than the distances selected for the ALMOND model based on flexible GRID fields. This is mainly due to the fact that more points were selected in the first of the two models. In the conformer independent model, the selection of points was biased for energy and not distance (75% versus 25%), which also contributes to the selection of shorter distances. In ALMOND it is not possible to trace back the descriptors to the conformation on which they are based. In addition, since both models are alignment independent, the interactions available in the case of one compound cannot be directly compared with those of another compound in the model or between the two models. The only way of making such a comparison is to convert the alignment independent descriptors back to alignment dependence. A new program was therefore written that could transfer the alignment independent descriptors back to their three dimensional coordinates (Paper VI).
5.11 Interpretation of Flex GRID – ALMOND model The transformation of the ALMOND descriptors back to their three dimensional descriptors included two steps. The first part was programmed inside the original source code in the ALMOND. The second part is a script for similarity analysis of all possible interaction patterns generated in ALMOND. In the original version of ALMOND, only the maximum energy product for each distance range is selected and encoded in the correlograms. In the new module, all distances were kept in the computer memory together with their original 3D grid points’ coordinates. If they originated from the same pair of atoms, only the energetically most favourable distance was kept. From the PLS coefficients of the Flex GRID / ALMOND model (Paper IV), the most important distance bins were selected for further analysis. A template compound, nicardipine, was chosen, as it was the most potent
60
compound in the series. For the most important distance bins, all distances were compared in all possible combinations towards all distances in the same selected bins for a second compound (see Figure 2 paper VI ). A similarity index based on the distances, angles and dihedrals was used to find the combination of distances that showed the closest match between two compounds. The pattern of distances corresponds to virtual receptor sites (VRS). To find common VRSs, multiple compounds were compared towards the template compound. The VRS for all solutions for the template based on comparisons to the other compounds were superimposed on each other. Despite 2500 different possible combinations, almost all solutions were identical, or at least very similar, and after a cluster analysis a common VRS for nicardipine-like compounds was found. These were encouraging results and were followed by new experiments to derive pseudo receptors for more compounds. The hypothesis was that certain distances should be common to all compounds, describing the minimal requirements for a CYP2C9 interaction, but other VRSs should be template dependent. In conclusion, this would give a model generating a basic set of pseudo receptor points common to all compounds. Specific distances would then be dependent on the selected template. The hypothesis is in good agreement with recent crystallization data that propose multiple binding sites and possibilities for interaction with or without a water network. The hypothesis was tested analysing S-warfarin, sulphaphenazole, S-miconazole, progesterone and dicoumarol individually as templates; from this analysis, VRSs for each compound were defined. Further analysis of all model compounds must be done to explore whether alignment and binding modes can be suggested on the basis of these data.
5.12 Model to predict site of metabolism of CYP2C9 substrates
The alignment independent descriptors that were used in this work were also explored in the context of site of metabolism prediction (Paper III). This method was also developed as a program, MetaSite®. In MetaSite the active site is described by ALMOND descriptors for hydrophobicity (DRY), hydrogen bond donor (N1), hydrogen bond acceptor (O) and charged probes. In the protein, the first point for all distances is the oxygen bound to the heme iron, the reactive centre of the enzyme. The ALMOND program then selects the second point from possible sites of interactions throughout the active site. The distances between these points are then encoded by an auto correlation transformation and the maximum auto and cross-correlation for each distance range are saved as the correlogram for the protein. The ligands are treated in a similar distance dependent way. First the atom types are
61
classified into GRID categories depending on their hydrophobic (DRY), hydrogen bond donor (N1) and hydrogen bond acceptor (O) capabilities and molecular orbital calculations are made to be able to compare the electron density contribution to the charged interactions in the protein. Second, the distances between each hydrogen atom towards all GRID encoded atoms are calculated. The results are then plotted in a correlogram based on whether a distance in the substrate is present within a defined distance range in the protein. For each hydrogen abstraction position in the substrate, a correlogram is derived and the collection of correlograms for each molecule are compared to the protein correlogram to find which position has the strongest similarity. This position is suggested as the site of metabolism. The results are superior if done for a set of multiple conformers for each substrate. The average ranking is then the best measurement for distinguishing the most favourable sites of metabolism. In more than 90 % of the cases, the method was able to suggest the correct three hydrogen atoms most probable to be metabolised in the case of CYP2C9. Using this method, sites prone to metabolism can immediately be identified in an extremely fast way to suggest positions that should be protected in order to prevent metabolism.
5.13 CPCA analysis of CYP2C homology models and crystal structures
By 2003, crystal structures of isoforms CYP2C9(17) and CYP2C5(18,22) and a number of soluble bacterial P450 crystal structures (10,141-144) had been solved by x-ray crystallography. Despite the low sequence identity of the bacterial isoforms (~20 %), the three dimensional structure and the composition of the active site are well conserved over the super family (16). We have explored homology models based on single or multiple templates, including bacterial sources (Paper V). Homology models for both CYP2C5 and CYP2C9 based on different templates were built and then cross-examined. Additional isoforms will be solved in the near future, which will facilitate subfamily modelling similar to the CYP2C case. The question of the quality of models built from templates of high sequence similarity was therefore addressed. The models constructed proved to be good based on stereo chemical parameters. The active site features of each model (e.g. the CYP2C9 homolog) were compared to the active sites of the template crystal structure (e.g. the CYP2C5 crystal) and the target crystal structure (e.g. the CYP2C9 crystal structure) in a CPCA analysis that was based on the GRID molecular interaction fields (Paper V). Despite the results that showed that the homology models were good from a stereo chemical point of view, it was apparent that a homology model of, say, CYP2C9 derived from
62
CYP2C5 templates resembles its template more than the actual CYP2C9 crystal structure. Although this is not surprising, this information should be emphasised and kept in mind, considering the amount of work that has been done and all the postulations on active site structure and chemistry that have been made on the basis of homology models. The data from the crystallisation process are also model systems with an experimental error, reflected by the relatively low resolution, and should therefore also be evaluated with a degree of uncertainty. Homology models derived from multiple templates (i.e. including the crystal structure coordinates of bacterial CYPs) produced better models in some cases according to CPCA analyses. These models require a high degree of manual adjustments to the alignment to ensure that the evolutionary relationship in secondary structure arrangements is kept.
5.14 Molecular dynamics simulations of CYP2CAnother area of interest was the flexibility of the protein. Such data can help to explore possible substrate access channels and determine their influence on substrate recognition and selectivity. To obtain these data the dynamic movements available to the substrate free crystal structures of CYP2C9 and CYP2C5 were calculated in molecular dynamics simulations in AMBER. The structures were equilibrated in explicit waters and snapshots were taken over an extensive time (10 ns) trajectory. The results were examined in a CPCA under the exact same conditions as in the analysis of homology models (Paper V). To explore the consistency in molecular dynamics, the simulations were repeated. For each of the runs, 200 snapshots were captured and the molecular interaction fields were calculated in GRID (see Paper V). The snapshots for each run were first analysed separately to distinguish the most diverse snapshots based on the distribution over the first two components in a PCA. The selected snapshots from each run of e.g. CYP2C9 were then analysed together with the crystal structures. The two separate molecular dynamics simulations yielded different results and moved away in different directions with regard to the starting structures. Inclusion of the homology models showed that the first component discriminated between them and the selected molecular dynamics simulations in the CPCA space (Paper V, Figure 5).
Another approach used to evaluate the results of molecular dynamics was to measure distances between secondary structure elements to explore openings and closures that could correspond to access channels. These results show that there is a great conformational freedom in the protein. During the first run, the major conformational freedom was seen in the opening between the B-C loop and the 1-1 sheet. This entrance is guarded by a lysine, Lys 72, where the terminal nitrogen moves up to 8 Å during the
63
simulations. This region has previously been suggested as a possible discriminant channel for acidic versus basic ligands to explain the substrate selectivity between CYP2C9 and CYP2C19 that is dependent on these characteristics(17,136). Recent mutagenesis data show that Lys 72 has little or no effect on the interaction with the polar compounds ibuprofen and diclofenac. This argues against a critical role for this amino acid in determining substrate specificity (personal communication Dr. E. Gillam). In the second run, this region is quite rigid. In both runs, conformational flexibility is seen between the B-C loop and the F-G loop, which opens a channel towards the N terminal, which also moves out while the C terminal remains in place. In CYP2C5 an access channel is described between the B´ and the C helices and helices I and G. This channel is closed upon substrate binding by hydrogen bonding of Lys241 with the backbone carbonyl of Val106. This opening is larger in the CYP2C9 crystal structure and increases during the simulation. A second solvent channel was seen in the CYP2C5 structure between the F and I helices. The distance between the conserved amino acid Glu300 (Glu297 in CYP2C5) of the I helix and Glu206 of the F helix was therefore measured and the backbone was seen to move considerably during both runs. The influence of the mutations in the F-G loop must be taken into consideration when these results are interpreted, especially since the positively charged Lys206 was mutated to the negatively charged amino acid Glu206. The association to the membrane is also likely to affect the conformational freedom. The F-G loop may function as a lid to the active site and the hydrophobic outer part of the F’ helix is likely to be attached to the membrane. Recognition and access of substrates or solvent seem possible both in the region between the G’ and B’ helices, between the BC loop and the 1-1 and between the F and I helices. The CYP2C5 structure has a smaller active site, where the F-G loop is positioned closer to the heme and it seems reasonable to believe that this is also a possibility in CYP2C9. The wider active site described by the crystal structure could depend on the conformation in which this crystal is captured. A half-open structure could then also rationalise the position of warfarin as being on its way towards the heme.
64
6 Conclusions
This work has led to an in-depth exploration and understanding of the interaction of the CY2C9 enzyme with its substrates and inhibitors. The specific achievements in this project can be summarised as follows:
1. We have successfully addressed the issues of bioactive conformation and alignment using novel GRID-based computational techniques, to derive predictive models for CYP2C9 substrates and inhibitors.
2. We have derived models that aim to address different issues in the drug discovery and development process: (i) a general discriminant screening model to establish whether or not a compound will be a CYP2C9 inhibitor, (ii) quantitative models that enable classification of whether a compound will be a high, intermediate or low potency inhibitor of CYP2C9 and (iii) a model to predict the most likely sites of metabolism of compounds by CYP2C9.
3. We have explored the structural characteristics of the enzyme by (i) comparing crystal structures and their associated changes upon binding, (ii) defining the scope and limitations of homology models and (iii) exploring the dynamics of the crystal structures associated with substrate access and binding by simulations of molecular dynamics.
New hypotheses have been proposed:
1. Derivation of a common pharmacophore is probably not achievable for CYP2C9 and other low selectivity enzymes. Instead we propose how common virtual receptor sites from general models can be complemented by specific VRS points associated to a specific binding mode derived from the same model.
2. We suggest several possible substrate and solvent access channels that are concentrated to the flexible regions mainly provided by the F-G and B-C loops. Structural differences between crystal data for CYP2C5 and CYP2C9 can be highly dependent on the influence of mutations and the crystal conformation captured for this flexible protein. These factors could bias the analysis towards overestimated differences.
65
The approaches used in this work have also opened areas that are in need of further investigation.
1. Although we have been successful with the data set we have used, other data sets need to be tested to further challenge the models and to identify weak points.
2. The possibilities of water molecules playing roles in the binding of some substrates and/or inhibitors in the active sites of CYP2C enzymes raise serious challenges in QSAR modelling.
3. It has become apparent that most CYP inhibition involves a mixture of mechanisms. This is particularly important within the competitive inhibitor group, where some compounds are ligands that hexa coordinate to the heme (e.g. sulfaphenazole) and other compounds are not. In the future, separate models for these two types of inhibitors must be developed to account for the extra binding energy that the coordination to the heme brings.
4. The conformational changes upon reductase binding and the accessibility to water in the active site must also be further explored. This was highlighted by the recent solution of an open conformation of the 2B4 isoform.
We believe that our work has opened a window of opportunity to apply computational methods in order to gain a further understanding of properties related to CYP2C9-ligand interaction. It has also lain a foundation for further understanding and, hopefully, finding solutions to the challenges of deriving predictive models in drug metabolism research.

66
7 Acknowledgements
There are so many people that I have appreciated working with in the past three years and they all deserve thanks for their help in completing this thesis. I would like to express my sincere gratitude to each and every one of you.
Special thanks to my three supervisors, Dr Ismael Zamora, Dr Collen Masimirembwa and Dr Anders Karlén.
I would like to start with the one person who has made the greatest contribution, Dr Ismael Zamora. Thank you ! From a scientific point of view for sharing all your knowledge, but also for always being so extremely encouraging and being a good friend withwhom to share good and bad real life stories with.
Dr Collen Masimiremwa, you got me into all this trouble in the first place .No one has the drive that you do for something that they believe in. You convinced them to let me start this thesis and your have taught me so many things. You are so full of knowledge and have always been open to discussions from which I have learned an enormous amount. Your belief in hard work has been a guidance and I sincerely appreciate everything that you have done for me.
Dr. Anders Karlén. Even though we have not worked together on a day to day basis I have always felt that you have given me great support, especially when I have needed it the most. You have represented the highly appreciated Swedish common sense as a balance to the southern tempers of Zimbabwians and Spaniards !
During my thesis I have worked in many different places, which has given a great deal of spice to my life.
I started in Uppsala. My warmest thanks go to Jennie Georgsson for lots of support and great times. Many thanks to everyone at the Department of Organic Pharmaceutical Chemistry for taking such good care of me. You have always made me feel very welcome. Special thanks to Professor Anders Hallberg.

67
A true high point was my three month stay at the Laboratory of Chemometrics in Perugia, Italy. Gabri, Massimo, Sergio, Paolo, Gean Luca, Silvio, Emanuele and Aldo …..such a dynamic and inspiring environment where vivid ideas and knowledge are combined into excellent science. I have never felt such pleasure and peace in working,
Moving on to Spain and the IMIM laboratory. Fabien, you are unbelievable. Thanks so much for all your help with the programming and for our many good laughs….and thanks to all the people at the lab that made my stay so great .
Next stop Denmark. Rikke, … what would I have done without you … you know what I mean
Before, in between and after, I have spent my time at Astra and every time it has felt good to return, especially to come back to the in vitro group with all its old and new members. Thanks to all of you, Lotta, Camilla, Katarina, Marie, Marianne, Susanne, Britta, Hongwei, Mingyan, Annika, Gerd, Xueqing, Anna-Pia and Birgitta
Special thanks to Professor Tommy B. Andersson for sharing your vast knowledge in an enthusiastic and inspiring way and at the same time spreading such a positive environment with lots of good laughs. Many thoughts have crossed my mind about whether it was time for me to move on, but why leave a great atmosphere?
Special thanks also to Kajsa Persson. We started our diploma work on the same day, got jobs on the same days and lately we’ve been working on our PhDs together. Thanks for our many relieving discussions and for making HAP a little brighter !
I would also like to express my appreciation for the warm welcome I received in the CC group - Anna, Emma and all the guys… I have learned a lot from you and hope it will continue! Special thanks to Ingemar and Florian for their scientific contribution to my work.
Janet Vesterlund, for her excellent linguistic revision of my thesis. All the linguistic mistakes that may remain are certainly a result of my own last minute changes.
Sincere thanks to Dr Anders Tunek and Dr Ulf Bredberg for supporting this project.

68
Now to the most important part … the times away from work that bring spirit to life…
To my dearest friends, Jennie, Angelica, Lena and Hanna ..for all the good times we have had together. Always there in good times and bad … just one phone call away at any time.
To my parents, for their constant love and support. Always wanting the best for me, for encouraging me and caring. To Lina for being my beloved sister.
To Pal… for always turning bad to good, for always being there and for being you...…
Thank you!
69
8 References
1. Guengerich, F. P. Uncommon P450-catalyzed reactions. Current Drug Metabolism. 2001, 2, 93-115.
2. van de Waterbeemd, H. High-throughput and in silico techniques in drug metabolism and pharmacokinetics. Current Opinion in Drug Discovery & Development. 2002, 5, 33-43.
3. Goshman, L.; Fish, J.; Roller, K. Clinically Significant Cytochrome P450 Drug Interactions. Journal of Pharmacy Society of Wisconsin 1999, May/June.
4. Graham-Lorence, S.; Peterson, J. A. P450s: structural similarities and functional differences. FASEB Journal 1996, 10, 206-214.
5. Okita, R. T.; Masters, B. S. S. Biotransformations:The Cytochromes P450; pp 981 - 999.
6. Nelson, D. R.; Kamataki, T.; Waxman, D. J.; Guengerich, F. P.; Estabrook, R. W. et al. The P450 superfamily: update on new sequences, gene mapping, accession numbers, early trivial names of enzymes, and nomenclature. DNA & Cell Biology. 1993, 12, 1-51.
7. Estabrook, R. W. A passion for P450s ( Remembrances of the early history of research on cytochrome P450). Drug Metab Dispos 2003, 31, 1461-1473.
8. Nelson, D. R. Mining databases for cytochrome P450 genes. Methods in Enzymology. 2002, 357, 3-15.
9. Miles, C. S.; Ost, T. W.; Noble, M. A.; Munro, A. W.; Chapman, S. K. Protein engineering of cytochromes P-450. Biochimica et Biophysica Acta. 2000, 1543,383-407.
10. Sevrioukova, I. F.; Li, H.; Zhang, H.; Peterson, J. A.; Poulos, T. L. Structure of a cytochrome P450-redox partner electron-transfer complex. Proceedings of the National Academy of Sciences of the United States of America. 1999, 96, 1863-1868.
11. Roitel, O.; Scrutton, N. S.; Munro, A. W. Electron Transfer in Flavocytochrome P450 BM3: Kinetics of Flavin Reduction and Oxidation, the Role of Cysteine 999, and Realtionships with Mammalian Cytochrome P450 Reductase. Biochemistry 2003, 42, 10809 - 10821.
12. Porter, T. D.; Beck, T. W.; Kasper, C. B. NADPH-Cytochrome P-450 Oxidoreductase Gene Organization Correlates with Structural Domains of the Protein. Biochemistry 1990, 29, 9814 - 9818.
13. Johnson, E. F. Deciphering Substrate Recognition by Drug-Metabolizing Cytochromes P450. Drug Metab Dispos 2003, 31, 1532-1540.
14. Bayburt, T. H.; Sligar, S. G. Single-molecule height measurements on microsomal cytochrome P450 in nanometer-scale phospholipid bilayer disks. Proceedings of the National Academy of Sciences of the United States of America. 2002, 99, 6725-6730.
70
15. Ridderstrom, M.; Masimirembwa, C.; Trump-Kallmeyer, S.; Ahlefelt, M.; Otter, C. et al. Arginines 97 and 108 in CYP2C9 are important determinants of the catalytic function. Biochemical & Biophysical Research Communications. 2000, 270, 983-987.
16. Gotoh, O. Substrate recognition sites in cytochrome P450 family 2 (CYP2) proteins inferred from comparative analyses of amino acid and coding nucleotide sequences. Journal of Biological Chemistry 1992, 267, 83-90.
17. Williams, P. A.; Cosme, J.; Ward, A.; Angove, H. C.; Matak Vinkovic, D. et al. Crystal structure of human cytochrome P450 2C9 with bound warfarin. Nature. 2003, 424, 464-468.
18. Wester, M. R.; Johnson, E. F.; Marques-Soares, C.; Dijols, S.; Dansette, P. M. et al. Structure of Mammalian Cytochrome P450 2C5 Complexed with Diclofenac at 2.1 Å Resolution: Evidence for an Induced Fit Model of Substrate Binding. Biochemistry 2003, 42, 9335 - 9345.
19. Haines, D. C.; Tomchick, D. R.; Machius, M.; Peterson, J. A. Pivotal role of water in the mechanism of P450BM-3. Biochemistry. 2001, 40, 13456-13465.
20. Hutzler, J. M.; Hauer, M. J.; Tracy, T. S. Dapsone activation of CYP2C9-mediated metabolism: evidence for activation of multiple substrates and a two-site model.[erratum appears in Drug Metab Dispos 2001 Aug;29(8):1171]. Drug Metabolism & Disposition. 2001, 29, 1029-1034.
21. Stresser, D. M.; Ackermann, J. M.; Miller, V. P.; Crespi, C. L. Fluorometric cytochromes P450 2C8, 2C9 and 2C19 inhibition assays.
22. Wester, M. R.; Johnson, E. F.; Marques-Soares, C.; Dansette, P. M.; Mansuy, D. et al. Structure of a Substrate Complex of Mammalian Cytochrome P450 2C5 at 2.3 Å Resolution: Evidence for Multiple Substrate Binding Modes. Biochemistry 2003, 42, 6370 -6379.
23. Schlichting, I.; Berendzen, J.; Chu, K.; Stock, A. M.; Maves, S. A. et al. The catalytic pathway of cytochrome p450cam at atomic resolution. Science. 2000,287, 1615-1622.
24. Ortiz de Montellano, P. R.; De Voss, J. J. Oxidizing species in the mechanism of cytochrome P450. Natural Product Reports. 2002, 19, 477-493.
25. Kuby, S. A. A Study of Enzymes Volume 1 Enzyme, Catalysis, Kinetics, and Substrate Binding, 2000.
26. Segel, I. H. Enzyme Kinetics : Behavior and Analysis of Rapid Equilibrium and Steady-State Enzyme Systems, 1993.
27. Leatherbarrow, R. J. GraFit; Erithacus Software. 28. Bardsley, W. G.; Bukhari, N. A. J.; Ferguson, M. W. J.; Cachaza, J. A.;
Burguillo, F. J. Evaluation of model discrimination, parameter estimation and goodness of fit in nonlinear regression problems by test statistics distributions. Comput Chem 1995, 19, 75 - 84.
29. Melet, A.; Assrir, N.; Jean, P.; Pilar Lopez-Garcia, M.; Marques-Soares, C. et al. Substrate selectivity of human cytochrome P450 2C9: importance of residues 476, 365, and 114 in recognition of diclofenac and sulfaphenazole and in mechanism-based inactivation by tienilic acid. Archives of Biochemistry & Biophysics. 2003, 409, 80-91.
30. Egnell, A. C.; Houston, B.; Boyer, S. In vivo CYP3A4 heteroactivation is a possible mechanism for the drug interaction between felbamate and carbamazepine. Journal of Pharmacology & Experimental Therapeutics. 2003,305, 1251-1262.
71
31. Usmani, K. A.; Rose, R. L.; Hodgson, E. Inhibition and activation of the human liver microsomal and human cytochrome P450 3A4 metabolism of testosterone by deployment-related chemicals. Drug Metabolism & Disposition. 2003, 31,384-391.
32. Ngui, J. S.; Chen, Q.; Shou, M.; Wang, R. W.; Stearns, R. A. et al. In vitro stimulation of warfarin metabolism by quinidine: increases in the formation of 4'- and 10-hydroxywarfarin. Drug Metabolism & Disposition. 2001, 29, 877-886.
33. Shou, M.; Lin, Y.; Lu, P.; Tang, C.; Mei, Q. et al. Enzyme kinetics of cytochrome P450-mediated reactions. Current Drug Metabolism. 2001, 2, 17-36.
34. Houston, J. B.; Kenworthy, K. E. In vitro-in vivo scaling of CYP kinetic data not consistent with the classical Michaelis-Menten model. Drug Metabolism & Disposition. 2000, 28, 246-254.
35. Kenworthy, K. E.; Clarke, S. E.; Andrews, J.; Houston, J. B. Multisite kinetic models for CYP3A4: simultaneous activation and inhibition of diazepam and testosterone metabolism. Drug Metabolism & Disposition. 2001, 29, 1644-1651.
36. Hutzler, J. M.; Kolwankar, D.; Hummel, M. A.; Tracy, T. S. Activation of CYP2C9-mediated metabolism by a series of dapsone analogs: kinetics and structural requirements. Drug Metabolism & Disposition. 2002, 30, 1194-1200.
37. Friedberg, T.; Pritchard, M. P.; Bandera, M.; Hanlon, S. P.; Yao, D. et al. Merits and limitations of recombinant models for the study of human P450-mediated drug metabolism and toxicity: An interlaboratory comparison. Drug Metabolism 1999, 31, 523-544.
38. Li, A. P.; Lu, C.; Brent, J. A.; Pham, C.; Fackett, A. et al. Chemico-Biological Interactions. 121 1999, 17-35.
39. Wrighton, S. A.; Vandenbranden, M.; Stevens, J. C.; Shipley, L. A.; Ring, B. J. In Vitro methods for assessing human hepatic drug metabolism: Their use in drug development. Drug Metabolism Reviews 1993, 25, 453-484.
40. Rendic, S.; Di Carlo, F. J. Human cytochrome P450 enzymes: a status report summarizing their reactions, substrates, inducers, and inhibitors. Drug Metabolism Reviews 1997, 29, 413-580.
41. Hansch, C. Quantitative Relationships Between Lipophilic Character and Drug Metabolism. Drug Metabolism Reviews 1972, 1, 1-14.
42. Smith, D. A.; Jones, B. C. Speculations on the substrate structure-activity relationship (SSAR) of cytochrome P450 enzymes. Biochemical Pharmacology. 1992, 44, 2089-2098.
43. Strobl, G.; Wolff, T. A structural model for inhibtitors of debrisoquine hydroxylase. Naunyn-Schmiedebergs Archives of Pharmacology. 1991, 343.
44. Lewis, D. F.; Jacobs, M. N.; Dickins, M.; Lake, B. G. Quantitative structure--activity relationships for inducers of cytochromes P450 and nuclear receptor ligands involved in P450 regulation within the CYP1, CYP2, CYP3 and CYP4 families. Toxicology. 2002, 176, 51-57.
45. Egnell, A. C.; Eriksson, C.; Albertson, N.; Houston, B.; Boyer, S. Generation and Evaluation of a CYP2C9 Heteroactivation Pharmacophore. Journal of Pharmacology & Experimental Therapeutics. 2003, 307, 878-887.
46. Ekins, S.; Bravi, G.; Wikel, J. H.; Wrighton, S. A. Three-dimensional-quantitative structure activity relationship analysis of cytochrome P-450 3A4 substrates. Journal of Pharmacology & Experimental Therapeutics. 1999, 291,424-433.
72
47. Lewis, D. F.; Modi, S.; Dickins, M. Structure-activity relationship for human cytochrome P450 substrates and inhibitors. Drug Metabolism Reviews. 2002,34, 69-82.
48. Lewis, D. F.; Dickins, M. Baseline lipophilicity relationships in human cytochromes P450 associated with drug metabolism. Drug Metabolism Reviews. 2003, 35, 1-18.
49. Lewis, D. F.; Dickins, M. Factors influencing rates and clearance in P450-mediated reactions: QSARs for substrates of the xenobiotic-metabolizing hepatic microsomal P450s. Toxicology. 2002, 170, 45-53.
50. Lewis, D. F.; Dickins, M. Quantitative structure-activity relationships (QSARs) within series of inhibitors for mammalian cytochromes P450 (CYPs). Journal of Enzyme Inhibition. 2001, 16, 321-330.
51. Lewis, D. F. Molecular modeling of human cytochrome P450-substrate interactions. Drug Metabolism Reviews. 2002, 34, 55-67.
52. Lewis, D. F. Homology modelling of human CYP2 family enzymes based on the CYP2C5 crystal structure. Xenobiotica 2002, 32, 305-323.
53. Lewis; Goldfarb; TArbit; Dickins; Eddershaw Cytochrome P450 substrate specificities. Substrate structural templates and enzyme active site geometries. Drug metabolism and Drug interactions 1999, 15.
54. Lewis, D. F. Modelling human cytochromes P450 for evaluating drug metabolism: an update. Drug Metabolism & Drug Interactions. 2000, 16, 307-324.
55. de Groot, M. J.; Ekins, S. Pharmacophore modeling of cytochromes P450. Advanced Drug Delivery Reviews. 2002, 54, 367-383.
56. Ekins, S.; Ring, B. J.; Grace, J.; McRobie-Belle, D. J.; Wrighton, S. A. Present and future in vitro approaches for drug metabolism. Journal of Pharmacological & Toxicological Methods 2000, 44, 313-324.
57. Ekins, S.; Waller, C. L.; Swaan, P. W.; Cruciani, G.; Wrighton, S. A. et al. Progress in predicting human ADME parameters in silico. Journal of Pharmacological & Toxicological Methods 2000, 44, 251-272.
58. Ekins, S.; Wrighton, S. A. Application of in silico approaches to predicting drug-drug interactions. Journal of Pharmacological & Toxicological Methods 2001, 45, 65-69.
59. Ekins, S.; de Groot, M. J.; Jones, J. P. Pharmacophore and three-dimensional quantitative structure activity relationship methods for modeling cytochrome p450 active sites. Drug Metabolism & Disposition. 2001, 29, 936-944.
60. Ekins, S.; Obach, R. S. Three-dimensional quantitative structure activity relationship computational approaches for prediction of human in vitro intrinsic clearance. Journal of Pharmacology & Experimental Therapeutics 2000, 295,463-473.
61. Lozano, J. J.; Pastor, M.; Cruciani, G.; Gaedt, K.; Centeno, N. B. et al. 3D-QSAR methods on the basis of ligand-receptor complexes. Application of COMBINE and GRID/GOLPE methodologies to a series of CYP1A2 ligands. Journal of Computer-Aided Molecular Design 2000, 14, 341-353.
62. Poso, A.; Gynther, J.; Juvonen, R. A comparative molecular field analysis of cytochrome P450 2A5 and 2A6 inhibitors. Journal of Computer-Aided Molecular Design. 2001, 15, 195-202.
63. Wang, Q.; Halpert, J. R. Combined three-dimensional quantitative structure-activity relationship analysis of cytochrome P450 2B6 substrates and protein homology modeling. Drug Metabolism & Disposition. 2002, 30, 86-95.
73
64. Jones, B. C.; Hawksworth, G.; Horne, V. A.; Newlands, A.; Morsman, J. et al. Putative active site template model for cytochrome P4502C9 (tolbutamide hydroxylase). Drug Metabolism & Disposition 1996, 24, 260-266.
65. Afzelius, L.; Masimirembwa, C. M.; Karlen, A.; Andersson, T. B.; Zamora, I. Discriminant and quantitative PLS analysis of competitive CYP2C9 inhibitors versus non-inhibitors using alignment independent GRIND descriptors. Journal of Computer-Aided Molecular Design. 2002, 16, 443-458.
66. Afzelius, L.; Zamora, I.; Mercucci, S.; Baroni, M.; Masimirembwa, C. M. et al. An alignment and conformer independent method to predict CYP2C9 inhibition.Journal of Medicinal Chemistry,Web Release Date:13-Jan-2004.
67. Afzelius, L.; Fontaine, F.; Karlen, A.; Andersson, T. B.; Masimirembwa, C. et al. Virtual receptor site (VRS) derivation for competitive CYP2C9 inhibitors - a novel approach for structurally diverse compounds. manuscript in preparation 2003.
68. Mancy, A.; Broto, P.; Dijols, S.; Dansette, P. M.; Mansuy, D. The substrate binding site of human liver cytochrome P450 2C9: an approach using designed tienilic acid derivatives and molecular modeling. Biochemistry 1995, 34, 10365-10375.
69. de Groot, M. J.; Alex, A. A.; Jones, B. C. Development of a combined protein and pharmacophore model for cytochrome P450 2C9. Journal of Medicinal Chemistry. 2002, 45, 1983-1993.
70. Zamora, I.; Afzelius, L.; Cruciani, G. Predicting drug metabolism: a site of metabolism prediction tool applied to the cytochrome P450 2C9. Journal of Medicinal Chemistry. 2003, 46, 2313-2324.
71. Ridderstrom, M.; Zamora, I.; Fjellstrom, O.; Andersson, T. B. Analysis of selective regions in the active sites of human cytochromes P450, 2C8, 2C9, 2C18, and 2C19 homology models using GRID/CPCA. Journal of Medicinal Chemistry 2001, 44, 4072-4081.
72. Payne, V. A.; Chang, Y.-T.; Loew, G. H. Homology Modeling and Substrate Binding Study of Human CYP2C9 Enzyme. Proteins: Structure,Function and Genetics 1999, 37, 176 - 190.
73. Lewis; Lake Molecular modelling and quantitative structure-activity relationship studies on the interaction of omeprazole with cytochrome P450 isozymes. Toxicology 1998, 125, 31-44.
74. Wolff, T.; Distelrath, L. M.; Worthington, M. T.; Groopman, J. D.; Hammons, G. J. et al. Substrate specificity of human liver cytochrome P-450 debrisoquine 4-hydroxylase probed using immunochemical inhibition and chemical modeling. Cancer Research. 1985, 45, 2116-2122.
75. Ekins, S.; Bravi, G.; Binkley, S.; Gillespie, J. S.; Ring, B. J. et al. Three and four dimensional-quantitative structure activity relationship (3D/4D-QSAR) analyses of CYP2D6 inhibitors. Pharmacogenetics 1999, 9, 477-489.
76. Lewis, D. F. V. Molecular modelling of cytochrome P4502D6 (CYP2D6) based on an alignment with CYP102 : structural studies on specific CYP2D6 substrate metabolism. Xenobiotica 1997, 27, 319 -340.
77. de Groot, M. J.; Ackland, M. J.; Horne, V. A.; Alex, A. A.; Jones, B. C. Novel approach to predicting P450-mediated drug metabolism: development of a combined protein and pharmacophore model for CYP2D6. Journal of Medicinal Chemistry. 1999, 42, 1515-1524.
78. Strobl, G. R.; von Kruedener, S.; Stockigt, J.; Guengerich, F. P.; Wolff, T. Development of a pharmacophore for inhibition of human liver cytochrome P-450 CYP2D6: molecular modelling and inhibition studies. Journal of Medicinal Chemistry 1993, 36, 1136-1145.
74
79. Kirton, S. B.; Kemp, C. A.; Tomkinson, N. P.; St-Gallay, S.; Sutcliffe, M. J. Impact of incorporating the 2C5 crystal structure into comparative models of cytochrome P450 2D6. Proteins. 2002, 49, 216-231.
80. Venhorst, J.; ter Laak, A. M.; Commandeur, J. N.; Funae, Y.; Hiroi, T. et al. Homology modeling of rat and human cytochrome P450 2D (CYP2D) isoforms and computational rationalization of experimental ligand-binding specificities. Journal of Medicinal Chemistry. 2003, 46, 74-86.
81. Guengerich, F. P.; Miller, G. P.; Hanna, I. H.; Martin, M. V.; Leger, S. et al. Diversity in the oxidation of substrates by cytochrome P450 2D6: lack of an obligatory role of aspartate 301-substrate electrostatic bonding. Biochemistry. 2002, 41, 11025-11034.
82. Park, J. Y.; Harris, D. Construction and assessment of models of CYP2E1: predictions of metabolism from docking, molecular dynamics, and density functional theoretical calculations. Journal of Medicinal Chemistry. 2003, 46,1645-1660.
83. Szklarz, G. D.; Halpert, J. R. Molecular modeling of cytochrome P450 3A4. Journal of Computer-Aided Molecular Design 1997, 11, 265-272.
84. Riley, R. J.; Parker, A. J.; Trigg, S.; Manners, C. N. Development of a generalized, quantitative physicochemical model of CYP3A4 inhibition for use in early drug discovery. Pharmaceutical Research. 2001, 18, 652-655.
85. Chiba, M.; Jin, L.; Neway, W.; Vacca, J. P.; Tata, J. R. et al. P450 interaction with HIV protease inhibitors: relationship between metabolic stability, inhibitory potency, and P450 binding spectra. Drug Metabolism & Disposition. 2001, 29, 1-3.
86. Leach, A. R. Molecular Modelling - Principal and Applications; second edition ed.; Pearson Education Limited: Essex, 2001.
87. Jensen, F. Introduction to Computational Chemistry; Wiley, 2001. 88. Eriksson, L.; Johansson, E.; Kettaneh-Wold, N.; Wold, S. Multi- and
Megavariate Data Analysis - Principals and Applications, 2001. 89. Lii, J. H.; Allinger, N. L. Molecular mechanics. The MM3 force field for
hydrocarbons. 3. The van der Waals' potentials and crystal data for aliphatic and aromatic hydrocarbons. Journal of the American Chemical Society 1989, 111,8576-8582.
90. Lii, J. H.; Allinger, N. L. Molecular mechanics. The MM3 force field for hydrocarbons. 2. Vibrational frequencies and thermodynamics. Journal of the American Chemical Society 1989, 111, 8566-8575.
91. Allinger, N. L.; Yuh, Y. H.; Lii, J. H. Molecular mechanics. The MM3 force field for hydrocarbons. 1. Journal of the American Chemical Society 1989, 111,8551-8566.
92. Allinger, N. L. Conformational analysis 130. MM2. A Hydrocarbon Force Field Utilizing V1 and V2 Torsional Terms. Journal of the American Chemical Society 1977, 99, 8127-8134.
93. Cornell, W. D.; Cieplak, P.; Bayly, C. I.; Gould, I. R.; Merz Jr, K. M. et al. A second generation force field for the simulation of proteins, nucleic acids, and organic molecules. Journal of the American Chemical Society 1995, 117, 5179-5197.
94. Jorgensen, W. L.; Maxwell, D. S.; Tirado-Rives, J. Development and Testing of the OPLS All-Atom Force Field on Conformational Energetics and Properties of Organic Liquids. J. Am. Chem. Soc. 1996, 11225 - 11236.
95. Bostrom, J. Reproducing the conformations of protein-bound ligands: a critical evaluation of several popular conformational searching tools. Journal of Computer-Aided Molecular Design. 2001, 15, 1137-1152.
75
96. Boström, J.; Norrby, P.; Liljefors, T. Conformational energy penalties of protein-bound ligands. Journal of Computer-Aided Molecular Design 1998, 12,383 - 396.
97. Martin, Y. C.; Bures, E. A.; DeLazzer, J.; Lico, I.; Pavlik, A. P. A fast approach to pharmacophore mapping and its applications to dopaminergic and benzodiazepine agonists. Journal of Computer-Aided Molecular Design 1992,7, 83 - 102.
98. Jones, G.; Willett, P.; Glen, R. C. GASP: Genetic Algorithm Superposition Program.; International University Line: La Jolla, 2000; 85 - 106.
99. CATALYST Accelrys Inc; Molecular Simulations: San Diego, CA. 100. Hansch, C.; Maloney, P.; Fujita, T. Correlation of Biological Activity of
Phenoxyacetic Acids with Hammett Substituent Constants and Partition Coefficients. NAture 1962, 194, 178.
101. Cruciani, G.; Pastor, M.; Guba, W. VolSurf: a new tool for the pharmacokinetic optimization of lead compounds. European Journal of Pharmaceutical Sciences 2000, 11, S29-39.
102. Cramer, R. D. r.; Patterson, D. E.; Bunce, J. D. Comparative Molecular Field Analysis (CoMFA). 1. Effect of Shape on Binding of Steroids to Carrier Proteins. J. Am. Chem. Soc. 1988, 110, 5959 - 5967.
103. Baroni, M.; Cruciani, G.; Costantino, G.; Riganelli, D.; Valigi, R. et al. Generating Optimal Linear PLS Estimations (GOLPE): An Advanced Chemometric Tool for Handling 3D-QSAR Problems. Quantitative Structure - Activity Relationship 1993, 12, 9 -20.
104. Goodford, P. J. A Computational Procedure for Determining Energetically Favorable Binding Sites on Biologically Important Macromolecules. Journal of Medicinal Chemistry 1985, 28, 849 - 857.
105. GRID http://www.moldiscovery.com/docs/grid21/chap25.html.106. Hopfinger, A. J. Conformational Properties of Macromolecules. Academic
Press, New York 1973, Chapter 2.107. Boobbyer, D.; Goodford, P. J.; M, M. P.; Wade, R. C. New Hydrogen-Bond
Potentials for Use in Determining Energetically Favorable Binding SItes on Molecules of Known Structure. Journal of Medicinal Chemistry 1989, 32, 1083 - 1094.
108. Wade, R.; Clark , K. J.; Goodford, P. J. Further Development of Hydrogen Bond Functions for Use in Determining Energetically Favorable Binding Sites on Molecules of Known Structure. 1.Ligand Probe Groups with the Ability To Form Two Hydrogen Bonds. Journal of Medicinal Chemistry 1993, 36, 140 - 147.
109. Wade, R. C.; Goodford, P. Further development of Hydrogen Bond Function for Use in Determining Energetically Favorable Binding Sites on Molecules of Known Structure. 2. Ligand Probe Groups with the Ability To Form More Than Two Hydrogen Bonds. Journal of Medicinal Chemistry 1993, 36, 148 - 156.
110. Broto, P.; Moreau, G.; Vandycka, C. Molecular structures; perception, autocorrelation descriptor and sar studies. European Journal of Medicinal Chemistry 1984, 19, 66-70.
111. Anzali, S.; Barnickel, G.; Krug, M.; Sadowski, J.; Wagener, M. et al. The comparison of geometric and electronic properties of molecular surfaces by neural networks: application to the analysis of corticosteroid-binding globulin activity of steroids. Journal of Computer-Aided Molecular Design. 1996, 10,521-534.
76
112. Wagener, M.; Sadowski, J.; Gasteiger, J. Autocorrelation of Molecular Surface Properties for Modeling Corticosteroid Binding Globulin and Cytosolic Ah Receptor Activity by Neural Networks. J. Am. Chem. Soc. 1995, 117, 7768 - 7775.
113. Pastor, M.; Cruciani, G.; McLay, I.; Pickett, S.; Clementi, S. GRid-INdependent descriptors (GRIND): a novel class of alignment-independent three-dimensional molecular descriptors. Journal of Medicinal Chemistry 2000, 43, 3233-3243.
114. Sali, A. Comparative protein modeling by satisfaction of spatial restraints. Molecular Medicine Today 1995, 1, 270-277.
115. ClustalX http://www-igbmc.u-strasbg.fr/BioInfo/ClustalX/.116. Jones, G.; Willett, P.; Glen, R. C.; Leach, A. R.; Taylor, R. Development and
Validation of a Genetic Algorithm for Flexible Docking. Journal of Molecular Biology. 1997, 267, 727-748.
117. Bjornsson, T. D.; Callaghan, J. T.; Einolf, H. J.; Fischer, V.; Gan, L. et al. THE CONDUCT OF IN VITRO AND IN VIVO DRUG-DRUG INTERACTION STUDIES: A PHARMACEUTICAL RESEARCH AND MANUFACTURERS OF AMERICA (PhRMA) PERSPECTIVE. Drug Metab Dispos 2003, 31, 815-832.
118. Williams, D.; Feely, J. Pharmacokinetic-pharmacodynamic drug interactions with HMG-CoA reductase inhibitors. Clinical Pharmacokinetics. 2002, 41, 343-370.
119. Ogard, C. G.; Vestergaard, H. [Interaction between warfarin and oral miconazole gel]. Ugeskrift for Laeger. 2000, 162, 5511.
120. Furlan, V.; Taburet, A. M. [Drug interactions with antiretroviral agents]. Therapie. 2001, 56, 267-271.
121. Devaraj, A.; O'Beirne, J. P.; Veasey, R.; Dunk, A. A. Interaction between warfarin and topical miconazole cream. British Medical Journal. 2002, 325, 77.
122. Aithal, G. P.; Day, C. P.; Kesteven, P. J.; Daly, A. K. Association of polymorphisms in the cytochrome P450 CYP2C9 with warfarin dose requirement and risk of bleeding complications [see comments]. Lancet 1999,353, 717-719.
123. Black, D. J.; Kunze, K. L.; Wienkers, L. C.; Gidal, B. E.; Seaton, T. L. et al. Warfarin-fluconazole. II. A metabolically based drug interaction: in vivo studies. Drug Metabolism & Disposition 1996, 24, 422-428.
124. Bolego, C.; Baetta, R.; Bellosta, S.; Corsini, A.; Paoletti, R. Safety considerations for statins. Current Opinion on Lipidology 2002, 13, 637-644.
125. Kunze, K. L.; Trager, W. F. Warfarin-fluconazole. III. A rational approach to management of a metabolically based drug interaction. Drug Metabolism & Disposition 1996, 24, 429-435.
126. Thirion, D. J.; Zanetti, L. A. Potentiation of warfarin's hypoprothrombinemic effect with miconazole vaginal suppositories. Pharmacotherapy. 2000, 20, 98-99.
127. Dekhuijzen, P. N.; Koopmans, P. P. Pharmacokinetic profile of zafirlukast. Clinical Pharmacokinetics. 2002, 41, 105-114.
128. Flanagan, J. U.; McLaughlin, L. A.; Paine, M. J.; Sutcliffe, M. J.; Roberts, G. C. et al. Role of conserved Asp293 of cytochrome P450 2C9 in substrate recognition and catalytic activity. Biochemical Journal. 2003, 370, 921-926.
129. Haining, R. L.; Jones, J. P.; Henne, K. R.; Fisher, M. B.; Koop, D. R. et al. Enzymatic determinants of the substrate specificity of CYP2C9: role of B'-C loop residues in providing the pi-stacking anchor site for warfarin binding. Biochemistry 1999, 38, 3285-3292.
77
130. Klose, T. S.; Ibeanu, G. C.; Ghanayem, B. I.; Pedersen, L. G.; Li, L. et al. Identification of residues 286 and 289 as critical for conferring substrate specificity of human CYP2C9 for diclofenac and ibuprofen. Archives of Biochemistry & Biophysics 1998, 357, 240-248.
131. Jung, F.; Griffin, K. J.; Song, W.; Richardson, T. H.; Yang, M. et al. Identification of amino acid substitutions that confer a high affinity for sulfaphenazole binding and a high catalytic efficiency for warfarin metabolism to P450 2C19. Biochemistry 1998, 37, 16270-16279.
132. Williams, P. A.; Cosme, J.; Sridhar, V.; Johnson, E. F.; McRee, D. E. Mammalian microsomal cytochrome P450 monooxygenase: structural adaptations for membrane binding and functional diversity. Molecular Cell 2000, 5, 121-131.
133. Boobis, A. R.; McKillop, D.; Robinson, D. T.; Adams, D. A.; McCormick, D. J. Interlaboratory comparison of the assessment of P450 activities in human hepatic microsomal samples. Xenobiotica. 1998, 28, 493-506.
134. Rettie, A. E.; Korzekwa, K. R.; Kunze, K. L.; Lawrence, R. F.; Eddy, A. C. et al. Hydroxylation of warfarin by human cDNA-expressed cytochrome P-450: a role for P-4502C9 in the etiology of (S)-warfarin-drug interactions. Chemical Research in Toxicology 1992, 5, 54-59.
135. Jones, J. P.; He, M.; Trager, W. F.; Rettie, A. E. Three-dimensional quantitative structure-activity relationship for inhibitors of cytochrome P4502C9. Drug Metabolism & Disposition 1996, 24, 1-6.
136. Ekins, S.; Bravi, G.; Binkley, S.; Gillespie, J. S.; Ring, B. J. et al. Three- and four-dimensional-quantitative structure activity relationship (3D/4D-QSAR) analyses of CYP2C9 inhibitors. Drug Metabolism & Disposition 2000, 28, 994-1002.
137. Tucker, G. T.; Houston, B. J.; Huang, S. Optimizing drug development: strategies to assess drug metabolism/transporter interaction potential - towards a consensus. Journal of Clinical Pharmacology. 2001, 52, 107-117.
138. Olsson, T.; Shcherbukhin, V. Synthesis and Structure Administration (SaSA); AstraZeneca, http://www.astrazeneca.com, 1997 - 2000.
139. http://www.moldiscovery.com/docs/grid21/index.html GRID.140. Afzelius, L.; Zamora, I.; Ridderstrom, M.; Andersson, T. B.; Karlen, A. et al.
Competitive CYP2C9 inhibitors: enzyme inhibition studies, protein homology modeling, and three-dimensional quantitative structure-activity relationship analysis. Molecular Pharmacology 2001, 59, 909-919.
141. Govindaraj, S.; Poulos, T. L. The domain architecture of cytochrome P450BM-3. Journal of Biological Chemistry. 1997, 272, 7915-7921.
142. Hasemann, C. A.; Ravichandran, K. G.; Peterson, J. A.; Deisenhofer, J. Crystal structure and refinement of cytochrome P450terp at 2.3 A resolution. Journal of Molecular Biology. 1994, 236, 1169-1185.
143. Cupp-Vickery, J.; Anderson, R.; Hatziris, Z. Crystal structures of ligand complexes of P450eryF exhibiting homotropic cooperativity. Proceedings of the National Academy of Sciences of the United States of America. 2000, 97, 3050-3055.
144. Poulos, T. L.; Finzel, B. C.; Howard, A. J. Crystal structure of substrate-free Pseudomonas putida cytochrome P-450. Biochemistry. 1986, 25, 5314-5322.
Acta Universitatis UpsaliensisComprehensive Summaries of Uppsala Dissertations
from the Faculty of PharmacyEditor: The Dean of the Faculty of Pharmacy
Distribution:Uppsala University Library
Box 510, SE-751 20 Uppsala, Swedenwww.uu.se, [email protected]
ISSN 0282-7484ISBN 91-554-5891-2
A doctoral dissertation from the Faculty of Pharmacy, Uppsala University,is usually a summary of a number of papers. A few copies of the completedissertation are kept at major Swedish research libraries, while the sum-mary alone is distributed internationally through the series Comprehen-sive Summaries of Uppsala Dissertations from the Faculty of Pharmacy.(Prior to July, 1985, the series was published under the title “Abstracts ofUppsala Dissertations from the Faculty of Pharmacy”.)


![DiscrepancybetweenmRNAandProteinExpressionof ...downloads.hindawi.com/journals/bmri/2010/823131.pdfmolecular mass and a β-sheet [20]. Neutrophil gelatinase-associated lipocalin (NGAL)](https://img.pdfslide.us/doc/110x75/5ffb0a8d3bd88e11941e8f84/discrepancybetweenmrnaandproteinexpressionof-molecular-mass-and-a-sheet-20.jpg)


![medical plants - slam-livre.fr · 1. AFZELIUS, Adamus. De origine myrrhae controversa. Specimen primum [- quintum]. Uppsala, Zeipel and Palmblad (part 1–3); Regiae Academicae Typographi](https://img.pdfslide.us/doc/110x75/5f03f9387e708231d40bb04b/medical-plants-slam-livrefr-1-afzelius-adamus-de-origine-myrrhae-controversa.jpg)


![Molecular biology of bladder cancer: new insights into ...eprints.whiterose.ac.uk/86541/3/NRC_Knowles_PRR_GA_1415887581_6_MK[1].pdfMolecular biology of bladder cancer: new insights](https://img.pdfslide.us/doc/110x75/5f03c43b7e708231d40aaa8a/molecular-biology-of-bladder-cancer-new-insights-into-1pdf-molecular-biology.jpg)